Page 1
Int.J.Curr.Microbiol.App.Sci (2015) 4(4): 343-355
343
Original Research Article
Evaluation of molecular variations in Probiotic Bacillus coagulans and its
bacteriophage resistant mutants
Kavita R. Pandey*, Pramod S. Shinde and Babu V. Vakil
Guru Nanak Institute for Research and Development (GNIRD), Guru Nanak
Khalsa College, Matunga, Mumbai 400 019, India *Corresponding author
A B S T R A C T
Introduction
Probotics have been defined jointly by FAO
and WHO as “live microorganisms which
when consumed in adequate amounts, confer
various healath benefit(s) on the host”
(FAO/WHO Experts’ Report, 2001).
Probiotics find applications in
pharmaceutical, dairy and veterinary
productions.
Probiotic consumption claims several health
benefits to the hosts, some of which are as
follows: having positive influence on the
intestinal flora of the host, competitive
exclusion of pathogens, stimulating or
modulating mucosal immunity, reducing
blood cholesterol levels, anti-colon cancer
activity, reducing inflammatory or allergic
International Journal of Current Microbiology and Applied Sciences ISSN: 2319-7706 Volume 4 Number 4 (2015) pp. 343-355
http://www.ijcmas.com
Probiotics are live microorganisms which, when administered in adequate amounts
confer health benefit(s) on the host. They are produced by fermentation technology and find applications in production of functional foods and pharmaceutical
formulations. They play several roles in promoting & maintaining human health.
One of the most notorious contaminants in dairy and probiotic fermentation industries are bacteriophages. A leading Indian pharmaceutical industry was facing
the recurring problem of phage contamination of probiotic fermentation batches.
Adopting the approach of random mutagenesis, using UV light and MMS, several phage resistant strains were developed. The mutants were evaluated for retention
/enhancement of their probiotic attributes, like aggregation potentials, tolerance to
acids and bile salts, sporulation efficiencies etc. Genotypic and phenotypic
variations and protein characterization was carried out for two mutants labelled as PIII and MIII. The observed phenotypic differences among the strains and
variations in MALDI-TOF profiles encouraged us to use the tool of 16SrRNA
sequencing to derive the phylogenetic relationship between parental and the mutant strains. One striking observation deduced from the phylogenetic tree analysis is that
the parental strain B was an out group in the cluster while mutant PIII was more
closely related to other reference taxa and mutant MIII was divergent from the
other two sequences B and PIII.
K ey wo rd s
Phylogeny,
Bacillus coagulans,
probiotics,
random
mutagenesis and 16SrRNA
sequencing
Page 2
Int.J.Curr.Microbiol.App.Sci (2015) 4(4): 343-355
344
reactions, alleviating lactose intolerance,
reducing the clinical manifestations of
atopic dermatitis, Crohn’s disease, treatment
of diarrhoea, constipation, candidiasis, and
urinary tract infections (Harish
and Varghese, 2006). This exhaustive list of
health benefits exhibited by the probiotics is
reflected by the scientific data generated in
the field of probiotic research in the last two
decades (“Probiotic Lactobacillus” PubMed,
2014).
Combinations of Lactobacillus and
Streptococcus species have traditionally
been used as probiotics for dairy
fermentations. New genera and strains of
probiotics are continuously emerging with
more advanced and focused efforts. A
leading Indian pharmaceutical industry
producing B. coagulans as a bulk probiotic
for medical purpose, was facing the problem
of repeated bacteriophage contamination. B.
coagulans is an aerobic gram positive, spore
forming rod, which produce (+) lactic acid
homofermentatively (Jurenka, 2012). Phage
once attached to its host enter either lytic or
lysogenic cycle and eventually it leads to the
cell death by lysis.Therefore a phage
contamination generally causes huge
financial losses to the dairy and probiotic
industries.
One proven way to overcome the risk of
phage attack is introduction of mutations in
the host bacterium to make it genetically
resistant. Industrial strains have been
traditionally improved by combination of
random mutagenesis followed by rational
selection for mutants of interest (Parekh,
Vinci and Strobel, 2000). Short wave UV
radiation and methyl methane sulphonate
(MMS) were used to induce mutations. The
bacterial population surviving the
mutagenesis was screened to obtain phage
resistant mutants (Kavita and Babu, 2010).
Random mutagenesis implies possibilities of
several point mutations in the genome of the
bacterium and hence phage resistant mutants
may also carry other unwanted mutations
resulting in loss of several desirable
probiotic traits. Hence, the mutants were
evaluated for their functional attributes like
tolerance to acid and bile salts, sporulation
efficiency etc. Two of the seven phage
resistant mutants- GNKC/PBc/UV m3 [PIII]
and GNKC/PBc/MMSm3 [MIII] showed
improved probiotic profile and hence were
chosen for the further studies.
Proteomic studies help in relating the
changes in protein expression to the
mutations in genome. So we analyzed the
whole cell lysates of the two mutants using
MALDI-TOF/MS and compared with the
parental profile (Lay, 2001).
The current investigation was carried out
with the primary aim of comparing the
probiotic B. coagulans and its phage
resistant mutants for their phenotypic and
genotypic variations and16S rRNA gene
sequencing was used to study the bacterial
phylogeny (Jandaand Abbott, 2007).
Diversity within a given community is
usually characterized using the phylogenetic
distance scale. To study the evolution rate
UPGMA (Unweighted Pair Group Method
with Arithmetic Mean) tool was adopted
which is a simple bottom-up hierarchical
clustering method. The data was further
verified by bootstrapping to prevent the
random sampling errors. Molecular
Evolutionary Genetics Analysis (MEGA)
6.0.5 was the statistical tool used to trace the
molecular evolution and construction of a
phylogenetic tree (Kumar, 2013). Tajima
test was applied for studying the neutrality
in DNA evolutionary pattern (Aquadro,
1995).
Page 3
Int.J.Curr.Microbiol.App.Sci (2015) 4(4): 343-355
345
Materials and Methods
Bacterial strain and Culture conditions:
Bacillus coagulans the parental probiotic
organism under study, was procured from a
private probiotic industry. It was maintained
on Glucose yeast extract agar (GYEA) slants
[medium composition: glucose 5g, yeast
extract 5g, peptone 5g, K2HPO4 0.5g,
KH2PO4 0.5g, MgSO4 0.3g and mineral salt
solution- 1ml, in 1000 ml of distilled water.
Mineral Salt solution composition: FeSO4
1.8g, NaCl 1g, MnSO4 1g, ZnSO4 160mg,
CuSO4 160mg and CoSO4 160mg in 100ml
distilled water]. The bacterial strain and
mutants were was preserved in 15%
glycerol, at -20◦C.
Random Mutagenesis:
i. Ultraviolet light: short wave radiation-
260nm, from a 4 W germicidal lamp
fixed at a height of 18cm from
working surface area of the Laminar
Air Flow work station was employed
for inducing random mutations. The
host culture was exposed to UV-
radiations for time interval range from
30sec to 8min
ii. methyl methane sulphonate (MMS) :
–was used at concentrations range of
5-50 µl/ml of cell suspension for 2h
under static conditions to introduce
mutations in the host bacterial cells
The mutants obtained by several rounds of
MMS and UV mutagenesis were then
screened for bacteriophage resistance by
plaque assay.The genetic stability of the
mutants was assessed by reversion test
(Kavita and Babu, 2010). Out of about 1000
survivors obtained, 10 were phage resistant
of which 3 were genetically unstable
(revertants) hence were discarded. Out of
the 7, mutants MIII and PIII were phage
resistant and showed similar profile like
parental type, hence were selected for the
further characterization (Kavita and Babu,
2010).
Functional Characterization of the phage
resistant mutants of B. coagulans:
Acid and bile salt tolerance
Forty eight hours old bacillus culture having
108 to 10
9 spores/ml in seed medium
(composition g/l: Glucose: 5, peptone: 5,
yeast extract: 5, calcium chloride: 0.38g and
magnesium sulphate: 0.28g) were used for
the assays (Kavita and Babu, 2010).
Acid tolerance: Spores were inoculate in
seed medium of pH 2, containing 1 mg/ml
pepsinand incubated at 37°C, at 150 rpm for
3h. Appropriate 10-fold dilutions were made
for the samples withdrawn at regular
intervals and, suitable dilutions were plated
on GYEA medium and CFU were
determined after incubation at 37°C for 24-
48h.
Bile salt tolerance: Spores were inoculated
in seed medium containing 0.2% bile salts
(50% sodium-cholate and 50% sodium
deoxycholate) and incubated at 37°C, at 150
rpm for 3h. CFU were determined as
mentioned for acid tolerance assay.
Non treated spores were used as control. %
efficiency was carried out as shown below:
The flasks containing the mixture of spores
with acid or bile salts were incubated
Biomass analysis and lactic acid
estimation
Biomass was estimated on the basis of dry
Page 4
Int.J.Curr.Microbiol.App.Sci (2015) 4(4): 343-355
346
cell weight (Ref). Lactic acid was estimated
as per the method presented in table (Taylor,
K. A. C. C., 1996).
A) Dry cell weight
In a pre-weighed 1.5ml tube, one ml of
culture broth was added and centrifuged in a
microfuge at 10,000 rpm for 10min at 4˚C.
The supernatant was used for the pH and
lactic acid estimation. Excess supernatant
was blotted out using tissue paper and the
tube was incubated at 60°C for dying till
three consecutive readings showed constant
weight.
B) Lactic acid estimation:
The Lactic acid estimation was given in
table 1.
Sporulation Efficiency:
Bacillus spores from 48h old culture were
incubated in a water bath set at 75oC for 30
min to kill the vegetative cells followed by
pour plate method to enumerate the spore
count. The difference between CFU/ml of
the untreated and the heat treated cells gave
value of sporulating efficiency of the
culture. The sporulation efficiency was
calculated as follows:
Aggregation assays:
For the aggregation assay a loopful of
organism was inoculated in seed medium
and incubated at 37°C, 150 rpm for 18hr.
The cells (A600nm = 0.5) were pelleted down
in a microfuge at 10,000rpm for 10min at
4°C. The pellet was washed twice with
phosphate buffered saline (PBS) pH 7.3 and
re-centrifuged under the same conditions.
The pellet was suspended in PBS pH 7.3
(≈OD 0.5) and vortexed for 10sec (for the
Auto-aggregation assay: 4ml of the re-
suspended pellet was used and for Co-
aggregation assay a mixture of 2ml each of
pathogenic strain and the probiotic strain
was used) and this was incubated
undisturbed at 37°C for 3 hours. After every
hour, upper volume of the tube was carefully
pipetted and absorbance was recorded using
UV-Visible spectrophotometer (Shimadzu)
(Patel et.al, 2010).
The auto-aggregation and co-aggregation
potentials were calculated using the
formulae given below:
(Where A0 and Atare absorbance at 0hr and
time (1hr, 2hr and 3hr)
(Where: Axand Ay are absorbance of
probiotic control and pathogenic control,
Ax+ Ayis the absorbance of the mixture)
Proteomic fingerprinting of the phage
resistant strains:
The protein fingerprint of the bacterial
whole cell lysate was developed using
Matrix- Associated Laser-Desorption
/Ionization-Time Of Flight Mass
Spectrometry (MALDI-TOF/ MS)
instrument (BrukerDaltonics- Microflex,
Germany) (Li and Gross, 2004).
Proteins were extracted using combination
of lysozyme (10mg/ml) treatment (2h at
37°C) followed by ultra-sonication (40%
Amplitude, 10sec ON, 5sec OFF cycle for
Page 5
Int.J.Curr.Microbiol.App.Sci (2015) 4(4): 343-355
347
20minutes). The content was centrifuged at
10,000rpm for 5min at 4°C; supernatant
served as the protein sample. The sample
aliquots were stored at -20°C till further use.
The extracted proteins were dissolved in
10mM ammonium hydroxide / 10mM acetic
acid mixture. A mixture of 1ul each of the
dissolved protein and matrix i.e. α-Cyano-
4-Hydroxy-Cinnamic Acid (CHCA):
Sinapinic acid (SA) was mixed thoroughly
and sample was spotted onto MALDI
ground steel target plate, dried and analyzed
in MALDI-TOF/MS instrument (Li and
Gross, 2004).
The mass / charge region 1000 to 10000 was
selected to obtain protein fingerprint pattern.
Fingerprint patterns for the mutant strains
were compared with the parental type.
Genomic characterization of the phage
resistant strains
16SrRNA sequencing
A single isolated colony of each of the 3
strains-B (parental strain), and mutants MIII
and PIII were picked up from the plate.
Quiagen mini-prep kit was employed for the
DNA extraction. RNA was extracted by
Phenol-Chloroform method for PCR
Template preparation. Amplification was
achieved by using 16SrRNA primer regions:
16F27 and 16R907.
After confirming the amplification on
agarose gel, the amplified PCR product was
purified using the PEG-NaCl method
following the Turners protocol (Jandaand
Abbott, 2007).Cycle sequencing was
performed using the primers 8F and 907R,
the amplified samples were then loaded on
ABI 3730XL Sequencing machine.
Nucleotide sequence deposition
The 16SrRNA sequences of the mutants
GNKC/PBc/UV m3 and
GNKC/PBc/MMSm3 (abbreviated as PIII
and MIII respectively) were submitted to
GenBank using the BankIt tool.
Comparative sequence similarity
analysis:
The three partial 16SrRNA sequences of B,
PIII and MIII were the test sequences
chosen for phylogenetic analysis. The
Reference dataset was generated using the
testing data against BLAST utility available
at DDBJ (http://blast.ddbj.nig.ac.jp/) aligned
with annotated 16SrRNAdatabase. A
sequence identity threshold of 97% was
applied for the sequences and homologous
sequences were not selected for the further
analysis. These selected sequences
considered as the reference data in the
sequence driven analysis.
Sequence driven phylogenetic analysis
Sequences from testing dataset were
assembled and aligned with the reference
sequences. Multiple sequence alignment was
performed using MUSCLE algorithm with
default parameters from MEGA 6.0.5.
Phylogenetic tree was constructed by
UPGMA clustering analysis with Maximum
Composite likelihood method. This was
further verified by performing Bootstrap
analysis with 500 cycles and uniform rates
were given amongst sites Tajima relativity
test was then applied to check the neutrality
of the test sequences.
Result and Discussion
Functional Characterization of the phage
resistant mutants of B. coagulans:
Acid and Bile Salt Tolerance:
For the successful colonization of the
probiotic cells in the gastrointestinal tract, it
Page 6
Int.J.Curr.Microbiol.App.Sci (2015) 4(4): 343-355
348
is essential for probiotic bacteria to be
resistant to the gastric juices in order to
survive the passage through the harsh milieu
of the stomach and also to be resistant to the
strongly antibacterial properties of the bile.
Bacillus coagulans is resistant to gastric
conditions and the bile salts (Kavita and
Babu, 2010). As evident in figure I, no
significant changes were observed in the
acid tolerance and bile salt tolerance abilities
of mutant strains MIII and PIII when
compared to the parental culture. These
results are encouraging for mutants as their
tolerance towards acid and bile salt is not
altered due to mutagenic treatment.
Biomass analysis and lactic acid
estimation
B. coagulans produces only L-Lactic acid
hence easily used by the body unlike the
racemic mixture or Lactic acid that cause
acidosis. The lactic acid that is produced
lowers the pH in the GIT and vagina,
thereby inhibiting the growth of the
pathogens, hence an important probiotic
characteristic to be present in the phage
resistant strain (Teuber, 1993).
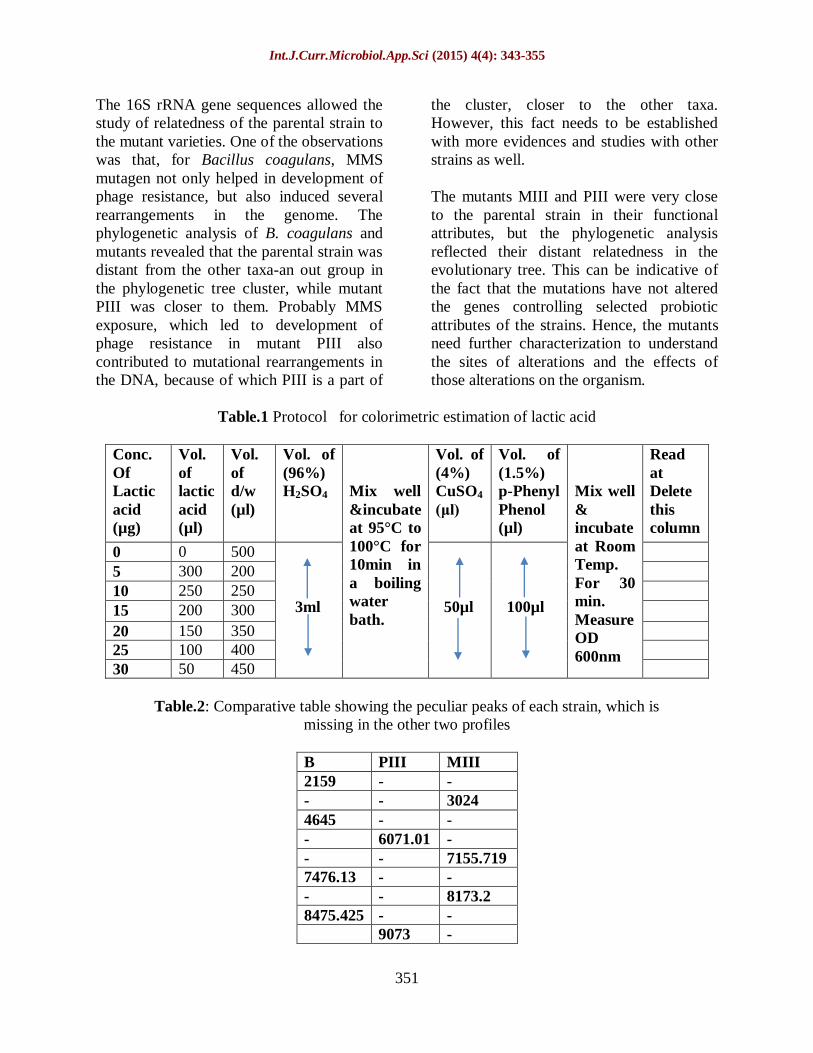
Figure II demonstrates that all the 3 strains
have almost similar lactic acid producing
capacity (1.2±0.2g/l). These results
demonstrate that the lactic acid producing
capacity of the mutants have not been
altered by random mutagenesis. Biomass or
yield of biomass/batch is the most important
criteria for any manufacturer. Interestingly,
the yield of biomass of the mutants
exhibited similar productivity of 11±1g/l as
that of the parental strain.
Sporulation efficiency
Sporulation efficiency is an important
attribute for the spore forming probiotics.
On oral administration, these spores help in
surviving the acidic gastric environment.
The spore coat imbibes water, swells and the
increased water content causes a rise in the
metabolic rate of the sporulated bacilli.
Outgrowths begin to protrude from the spore
coats. The spores pass on to the duodenum
where the outgrown cells germinate and
transform into viable vegetative cells. They
begin to proliferate in the small intestine,
multiplying rapidly, producing lactic acid
and bacteriocins etc. which render the
intestinal environment non-conducive for
the growth of harmful pathogenic bacteria
(Teuber, 1993).
A significant reduction is seen in the
sporulating efficiency of the mutants (Fig: I)
which can be correlated to the adverse
impact of random mutations.
Aggregation assays
Colonization in the intestinal wall is one of
the most desirable property of probiotic
bacteria in order to exert its beneficial
effects. Auto-aggregation is a property
where the probiotic cells aggregate together
to form a clump or mass. This when passes
through the harsh environment, only a small
number of cells die, hence the number of
cells surviving and the colonizing the gut
will be higher.
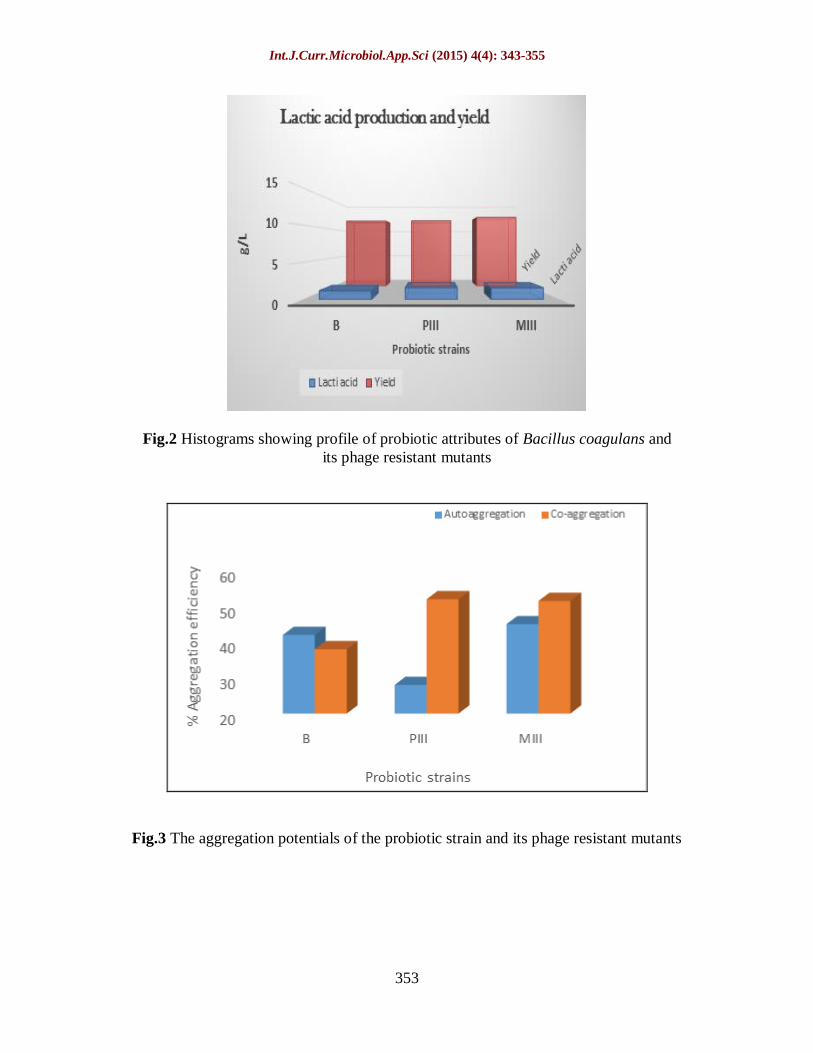
As depicted in figure III, mutant PIII shows
a drop in the auto-aggregation potentials
while MIII has aggregation potential similar
to B.
Co-aggregation efficiency of the probiotic
culture reflects the property of these cells to
hinder the adherence of harmful bacteria like
pathogenic strain of E coli, S. aureus etc., to
the epithelia. As seen in figure III, the
aggregation potential of the mutants show
significant differences compared to the
parental strain. The event of random
mutation seems to have enhanced the co-
aggregation capability of both the probiotic
Page 7
Int.J.Curr.Microbiol.App.Sci (2015) 4(4): 343-355
349
mutnts-52 and 51.5% as against the parental
type (38%).
Proteomic fingerprinting of the phage
resistant strains
There are several variations in the MALDI-
TOF/MS profiles of the parental and the 2
mutants. Table II enlists the significant
peaks showing alterations in each profile.
MALDI-TO F/MS assisted in easy
visualization of difference in protein make-
up of the mutants. When compared to the
protein pattern of parent strain, the mutant
cultures had few missing peaks indicating
possible deletion mutation.
Genomic Characterization of the phage
resistant strains:
16SrRNA sequencing
With the rapid accumulation of 16S rRNA
gene sequences in public databases, the
technique of 16S rRNA sequencing has been
widely used when designating the
phylogenetic position of prokaryotic
organisms and constitutes the basis of the
modern bacterial taxonomy (Janda and
Abbott, 2007). The sequencing details have
been tabulated in table III.
Nucleotide sequence deposition
The 16S rRNA sequences of the mutant
strains which had been submitted to
GenBank were accepted and provided with
unique accession numbers, as enlisted below
in table IV.
Comparative Sequence Similarity
Analysis
BLAST was performed for all the three test
sequences (B, PIII and MIII). The sequences
were aligned with annotated 16S rRNA
database to minimize the error. To describe
species in molecular surveys that sequence
the 16S rRNA gene a threshold value of
97% homology was chosen for the
phylogenetic analysis. Since, 16S rRNA
sequences are termed to be highly conserved
across species, constituting high similarity
would prescribe detailed information of
minute differences which are observed in
evolutionary spread which can be
understood using phylogenetic tree.
Sequence driven phylogenetic analysis:
Multiple alignment was performed using the
MUSCLE algorithm, which is a statistically
sound, easy to use algorithm for the non-
coding 16S rRNA sequences. The
evolutionary history was inferred using the
UPGMA method, which is a clustering
method of phylogenetic analysis performed
to study the divergence between species
(Huson and Bryant, 2006).
The tree is drawn to scale, with branch
lengths in the same units as those of the
evolutionary distances used to infer the
phylogenetic tree. The evolutionary
distances were computed using the
Maximum composite likelihood method
(Firth et.al., 2011), and are in the units of the
number of base substitutions per site. The
analysis involved 22 nucleotide sequences
including 19 reference and 3 test sequences.
All positions with less than 95% site
coverage were eliminated. That is, fewer
than 5% alignment gaps, missing data, and
ambiguous bases were allowed at any
position. Thus, the noise generated during
multiple sequence alignment was eluded.
There were a total of 805 positions in the
final dataset (Tamuraet.al., 2013). Bootstrap
analysis with 500 cycles ensured the
statistical connotation of the phylogenetic
data obtained.
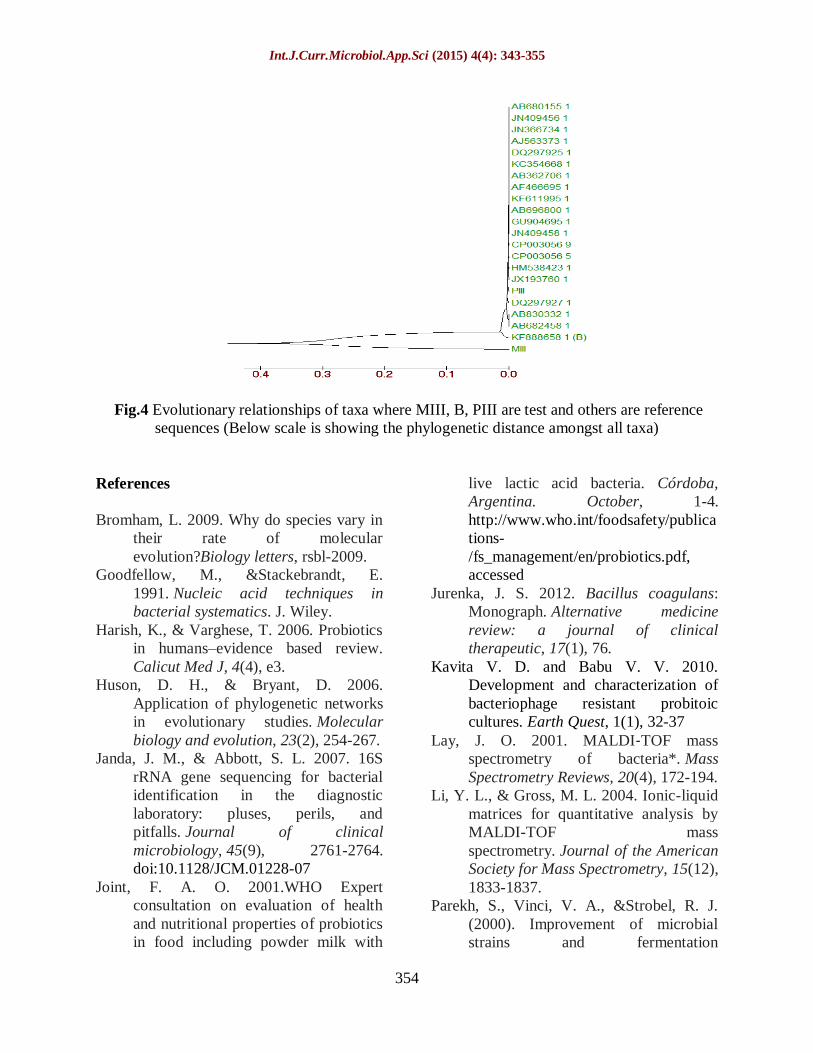
The optimal tree with the sum of branch
length = 0.88037341 showed a bidirectional
Page 8
Int.J.Curr.Microbiol.App.Sci (2015) 4(4): 343-355
350
separation in evolutionary distinction one
with 0.4261 for MIII and other with 0.4111
for remaining taxa, this reflected the
efficiency of mutagens to generate
variations. We observed that the parental
strain B is an out-group(figure IV), with
minimum phylogenetic distances from other
reference taxa and the two mutants.
A noteworthy observation made in the
phylogenetic tree is that mutant PIII is more
closely related to other taxa than the parental
strain B, while MIII is divergent from the
other two sequences- B and PIII. The
parental culture of Bacillus coagulans (B) is
an industrial strain used by a leading
probiotic industry. Under the improvement
program several mutations have been
incorporated in its genome and hence with
time it has evolved and showing divergence
from the other taxa in the cluster.
The event of mutation is affected by two
factors: the relative impact of mutagen; and
the efficiency of damage repair. Both of
these factors can vary between species
(Bromham, 2009). Mutant PIII, which was
obtained on UV exposure was found to be
closer to the reference taxa in the cluster and
was distant from the parental strain B. On
UV irradiation, many of the alterations in
strain B might have reverted to the wild type
or nullified and hence PIII has entered the
cluster and in fact closer to other taxa
compared to parental strain B. On the
contrary, mutant MIII obtained by MMS
exposure had new alterations in the DNA
leading to drifting away of the MIII
sequence in the phylogenetic tree compared
to PIII and B.
Tajima analysis involved only the 3
nucleotide sequences of B, PIII and MIII
and supported the above observations with
380 Identical, 7 Divergent sites detected in
all three sequences. A stretch was observed
in the global alignment of the three
sequences, which was higher in mutant MIII
with 278 indels and relatively very low
indels 04 in PIII and B sequences. Thus,
MIII showed much divergent evolutionary
pattern than PIII and B, which were
relatively closely related.
The equality of evolutionary rates between
sequences MIII and PIII, with sequence B
used as an out-group in Tajima's relative rate
test gave a P-value<0.05. Hence, the null
hypothesis of equal rates between lineages
was rejected. The composite likelihood
method was used to correct the probability
that multiple nucleotide changes occurred at
the same site and that divergence is thus not
linear with evolutionary time.
In conclusion, permanent phage resistant
strains were developed by introducing
suitable genetic changes in the host
organism. The mutants have been
characterized and possess the required
attributes to remain a probiotic culture. This
gives long term relief to the probiotic
industry at a nominal onetime cost as the
mutant is phage resistant unlike the parental
strain that was vulnerable to phage attack.
The probiotic attributes of the mutants like
yield, acid tolerance and lactic acid
productivity were not altered significantly.
The bile salt tolerance showed slight
alterations. Significant changes were
observed in the aggregation potentials of the
mutants. Aggregation capability of a strain
is attributed to the surface structures of the
cell. As observed in this study, random
mutagenesis might have led to alterations in
the membrane structures, which in turn led
to development of phage resistance. The
mutants showed phenotypic and genotypic
heterogeneity when compared to the
parental type. The mutants exhibited better
aggregation potentials and thus possibly
better colonization efficiencies in the gut
compared to the parental type.
Page 9
Int.J.Curr.Microbiol.App.Sci (2015) 4(4): 343-355
351
The 16S rRNA gene sequences allowed the
study of relatedness of the parental strain to
the mutant varieties. One of the observations
was that, for Bacillus coagulans, MMS
mutagen not only helped in development of
phage resistance, but also induced several
rearrangements in the genome. The
phylogenetic analysis of B. coagulans and
mutants revealed that the parental strain was
distant from the other taxa-an out group in
the phylogenetic tree cluster, while mutant
PIII was closer to them. Probably MMS
exposure, which led to development of
phage resistance in mutant PIII also
contributed to mutational rearrangements in
the DNA, because of which PIII is a part of
the cluster, closer to the other taxa.
However, this fact needs to be established
with more evidences and studies with other
strains as well.
The mutants MIII and PIII were very close
to the parental strain in their functional
attributes, but the phylogenetic analysis
reflected their distant relatedness in the
evolutionary tree. This can be indicative of
the fact that the mutations have not altered
the genes controlling selected probiotic
attributes of the strains. Hence, the mutants
need further characterization to understand
the sites of alterations and the effects of
those alterations on the organism.
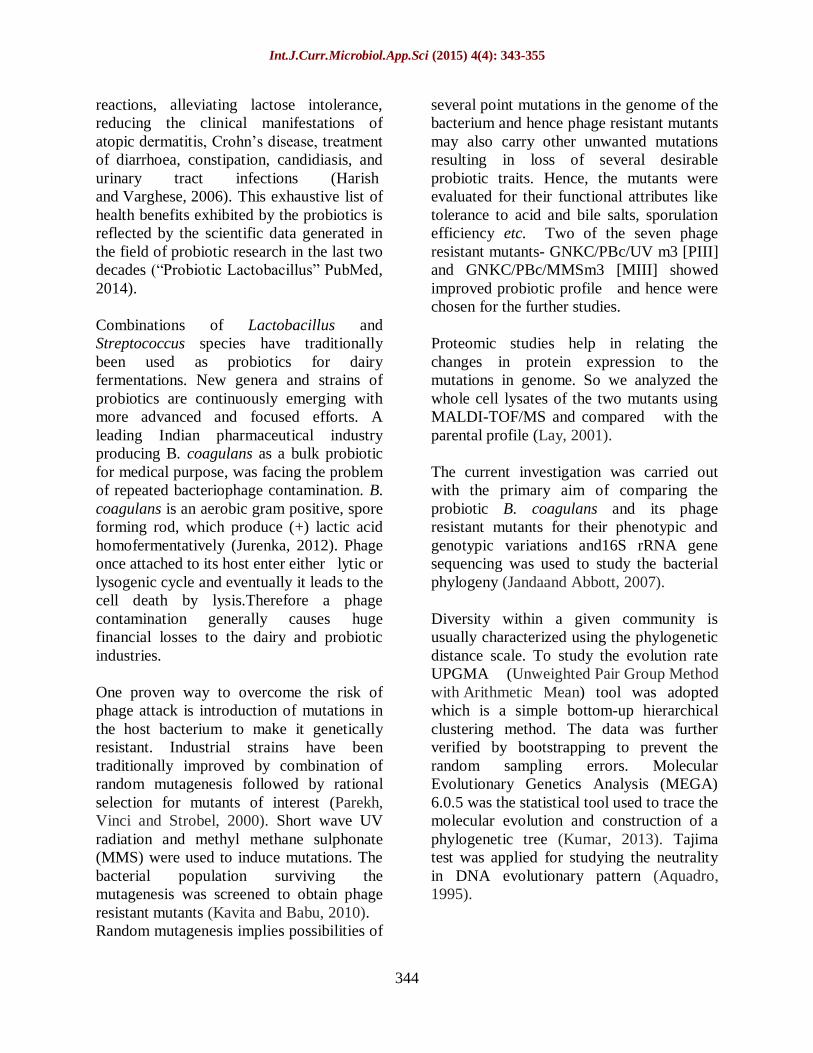
Table.1 Protocol for colorimetric estimation of lactic acid
Conc.
Of
Lactic
acid
(µg)
Vol.
of
lactic
acid
(µl)
Vol.
of
d/w
(µl)
Vol. of
(96%)
H2SO4
Mix well
&incubate
at 95°C to
100°C for
10min in
a boiling
water
bath.
Vol. of
(4%)
CuSO4
(μl)
Vol. of
(1.5%)
p-Phenyl
Phenol
(µl)
Mix well
&
incubate
at Room
Temp.
For 30
min.
Measure
OD
600nm
Read
at
Delete
this
column
0 0 500
3ml
50µl
100µl
5 300 200
10 250 250
15 200 300
20 150 350
25 100 400
30 50 450
Table.2: Comparative table showing the peculiar peaks of each strain, which is
missing in the other two profiles
B PIII MIII
2159 - -
- - 3024
4645 - -
- 6071.01 -
- - 7155.719
7476.13 - -
- - 8173.2
8475.425 - -
9073 -
Page 10
Int.J.Curr.Microbiol.App.Sci (2015) 4(4): 343-355
352
Table.3 Sequencing conditions for the partial 16SrRNA sequencing of B, PIII and MIII strains.
Universal Primers for 16SrRNA sequencing PCR program Reference
8F
5’AGAGTTTGATC-
CTGGCTCAG 3’
94°C for 3 min
94°C for 1 min
55°C for 1 min
72°C for 1 min
repeated for 35cycles
72°C for 10 min
4°C ∞.
(Vogel, E., and
Martin Sicken,
P. R. 2007)
907R
5’CCGTCAATTCM-
TTTRAGTTT 3’
(Goodfellow, M.
and
Stackebrandt,
E., 1991)
Table.4 Accession numbers obtained on GenBank submission of the partial 16SrRNA sequences
of B, PIII and MIII
Sr
No
Strain
Identity
Name code Abbrevia
tion
Accession number
1 B. coagulans
mutant
GNKC/PBc/UVm3 PIII BankIt1761411 Bacillus
KM652655
2 B. coagulans
mutant
GNKC/PBc/MMSm3 MIII BankIt1761402 Bacillus
KM652654
Fig.I Histograms showing profile of probiotic attributes of Bacillus coagulans and its phage
resistant mutants.
Page 11
Int.J.Curr.Microbiol.App.Sci (2015) 4(4): 343-355
353
Fig.2 Histograms showing profile of probiotic attributes of Bacillus coagulans and
its phage resistant mutants
Fig.3 The aggregation potentials of the probiotic strain and its phage resistant mutants
Page 12
Int.J.Curr.Microbiol.App.Sci (2015) 4(4): 343-355
354
Fig.4 Evolutionary relationships of taxa where MIII, B, PIII are test and others are reference
sequences (Below scale is showing the phylogenetic distance amongst all taxa)
References
Bromham, L. 2009. Why do species vary in
their rate of molecular
evolution?Biology letters, rsbl-2009.
Goodfellow, M., &Stackebrandt, E.
1991. Nucleic acid techniques in
bacterial systematics. J. Wiley.
Harish, K., & Varghese, T. 2006. Probiotics
in humans–evidence based review.
Calicut Med J, 4(4), e3.
Huson, D. H., & Bryant, D. 2006.
Application of phylogenetic networks
in evolutionary studies. Molecular
biology and evolution, 23(2), 254-267.
Janda, J. M., & Abbott, S. L. 2007. 16S
rRNA gene sequencing for bacterial
identification in the diagnostic
laboratory: pluses, perils, and
pitfalls. Journal of clinical
microbiology, 45(9), 2761-2764.
doi:10.1128/JCM.01228-07
Joint, F. A. O. 2001.WHO Expert
consultation on evaluation of health
and nutritional properties of probiotics
in food including powder milk with
live lactic acid bacteria. Córdoba,
Argentina. October, 1-4.
http://www.who.int/foodsafety/publica
tions-
/fs_management/en/probiotics.pdf,
accessed
Jurenka, J. S. 2012. Bacillus coagulans:
Monograph. Alternative medicine
review: a journal of clinical
therapeutic, 17(1), 76.
Kavita V. D. and Babu V. V. 2010.
Development and characterization of
bacteriophage resistant probitoic
cultures. Earth Quest, 1(1), 32-37
Lay, J. O. 2001. MALDI‐TOF mass
spectrometry of bacteria*. Mass
Spectrometry Reviews, 20(4), 172-194.
Li, Y. L., & Gross, M. L. 2004. Ionic-liquid
matrices for quantitative analysis by
MALDI-TOF mass
spectrometry. Journal of the American
Society for Mass Spectrometry, 15(12),
1833-1837.
Parekh, S., Vinci, V. A., &Strobel, R. J.
(2000). Improvement of microbial
strains and fermentation
Page 13
Int.J.Curr.Microbiol.App.Sci (2015) 4(4): 343-355
355
processes. Applied Microbiology and
Biotechnology, 54(3), 287-301.
Patel, A. K., Ahire, J. J., Pawar, S. P.,
Chaudhari, B. L., Shouche, Y. S.,
&Chincholkar, S. B. 2010. Evaluation
of probiotic characteristics of
siderophoregenic Bacillus spp. isolated
from dairy waste. Applied
biochemistry and
biotechnology, 160(1), 140-155.
Simonsen, K. L., Churchill, G. A.,
&Aquadro, C. F. 1995. Properties of
statistical tests of neutrality for DNA
polymorphism data. Genetics, 141(1),
413-429.
Tamura, K., Stecher, G., Peterson, D.,
Filipski, A., & Kumar, S. 2013.
MEGA6: molecular evolutionary
genetics analysis version
6.0. Molecular biology and
evolution, 30(12), 2725-2729.
Taylor, K. A. C. C. 1996. A simple
colorimetric assay for muramic acid,
lactic acid, glyceraldehyde,
acetaldehyde and formaldehyde. Appl.
Biochem. And Biotechnol, 56(1), 49-
58.
Teuber, M. 1993. Lactic acid
bacteria. Biotechnology Set, Second
Edition, 325-366.
Varin, C., Reid, N. M., & Firth, D. 2011. An
overview of composite likelihood
methods. StatisticaSinica, 21(1), 5-42.
Vogel, E., & Martin Sicken, P. R. 2007.
Investigating deep phylogenetic
relationships among cyanobacteria and
plastids by small subunit 16SrRNA
sequence analysis†. Journal of
Eukaryotic Microbiology.