i Evaluation of Nanoparticle (NP) Toxicity in Respect to NP Physicochemistry and Reactivity in the Aquatic Environment Danae Patsiou Submitted for the degree of Doctor of Philosophy Heriot-Watt University School of Energy, Geoscience, Infrastructure and Society Institute of Life and Earth Sciences May 2018
Transcript
i
Evaluation of Nanoparticle (NP) Toxicity in Respect to NP Physicochemistry
and Reactivity in the Aquatic Environment
Danae Patsiou
Submitted for the degree of Doctor of Philosophy
Heriot-Watt University
School of Energy, Geoscience, Infrastructure and Society
Institute of Life and Earth Sciences
May 2018
ii
The copyright in this thesis is owned by the author. Any quotation from the thesis or use of any
of the information contained in it must acknowledge this thesis as the source of the quotation
or information.
iii
ABSTRACT
The increasing application of nanoparticles (NPs) has led to increased occurrence of engineered
NPs in the aquatic environment. Understanding the toxicity of NPs in the aquatic environment
is dependent on linking NP physicochemistry with toxicological responses and while research
has been moving towards this direction, the link has not been fully understood yet. The present
study critically reviewed adsorption and desorption processes of organic environmental
contaminants on TiO2 NPs and evaluated interactions of NPs with compounds of different
physicochemistry already existing in the aquatic environment as contaminants. Aquatic
toxicity of the new generation lead-halide perovskite NPs was evaluated relative to lead ion
dissolution. Finally, the sedimentation of NP agglomerates during a traditional fish early-life
stage toxicity test, a major limitation of assessing NP toxicity in the aqueous phase, was
addressed by development of an exposure chamber designed to keep NP agglomerates in
homogeneous dispersion. The model organisms used in the present study to evaluate NP
toxicity were larvae and adult zebrafish Danio rerio and the unicellular green fresh water alga
Chlorella vulgaris. The main findings were: 1) sorption of environmental contaminants on NPs
can change the bioavailability of the contaminant in the aqueous phase. Specifically, sorption
of copper and benzo(a)pyrene (under fluorescent light) on NPs reduced the adsorbent
bioavailability. On the contrary, benzo(a)pyrene and anthracene, when adsorbed on TiO2 or Si
NPs, were photo-catalysed under UVA and in the case of benzo(a)pyrene, highly toxic photo-
by-products showed increased bioavailability in larval zebrafish; 2) lead-halide perovskite
acute toxicity was attributed to lead ion dissolution based on induction of metallothionein 2
gene expression through aqueous and dietary exposure, and 3) the perovskite-spiked diets did
not disrupt zebrafish gut microbiome after a 14-d exposure while disruption of gut microbiota
by equivalent Pb(NO3)2 diets was observed; finally, 4) higher toxicity was found when NPs
were tested using an exposure chamber that allowed continuous NP dispersion, indicating
toxicity is depended on the dispersion state of NPs. This study has expanded our knowledge
on NP surface physicochemistry and interactions with surrounding compounds in the aqueous
phase; has confirmed metal ion dissolution out of metallic NPs and linked perovskite NP
toxicity to lead ion dissolution as well as linked NP toxicity to NP dispersion in the aqueous
phase contributing to a better understanding of NP properties and reactivity relation to toxicity
in the aquatic environment.
iv
ACKNOWLEDGEMENTS
To begin with, I would like to acknowledge Dr Judit Kalman and Dr Ross Alexander for their
contribution to the algal experiments presented in Chapters 3 and 5, Fengjia Liu for some
molecular analysis presented in Chapter 2, Cristina del Rio Cubilledo for DNA and RNA
isolation of zebrafish tissues presented in Chapter 4, Dr Ana Catarino and Dr Stephen Summers
for advice and suggestions during the DNA analysis of zebrafish gut microbiota presented in
Chapter 4 and Dr David Boyle for his contribution on the chemical analysis of the pelleted fish
food in Chapter 4. I would like to thank Prof. Martin McCoustra for his advice in the chemistry
background in Chapters 1 and 2. Also, many thanks to the members of the EPAquatic research
group for maintenance of the zebrafish experimental population. This thesis was supported by
the European Project FP7: Future Nano Needs “Framework to respond to regulatory needs of
future nanomaterials and markets”.
I must express my gratitude to my supervisors: Prof. Ted Henry and Prof. Teresa Fernandes
who trusted me with this project guided me and encouraged me throughout my time as their
student. Special acknowledgment goes to Prof. Ted Henry who I have been lucky to have as
my primary supervisor; he was an inspiration all these years, he taught me good science, critical
thinking and scientific writing.
Completing this work would have been all the more difficult without my comrades in the lab
and PhD life here in Edinburgh, Ana Catarino, Chrysi Xintaropoulou and Valentina Ricottone,
we kept supporting and encouraging each other and grew stronger together. Finally, I must
express my gratitude to my partner Dionysis and my mother, father and brother, for their
patience and support through all the ups and downs of my research. I am indebted to them for
their help.
v
Please note this form should be bound into the submitted thesis. Academic Registry/Version (1) August 2016
ACADEMIC REGISTRY Research Thesis Submission
Name: Danai Patsiou
School: EGIS
Version: (i.e. First, Resubmission, Final)
Final Degree Sought: PhD
Declaration In accordance with the appropriate regulations I hereby submit my thesis and I declare that: 1) the thesis embodies the results of my own work and has been composed by myself 2) where appropriate, I have made acknowledgement of the work of others and have made reference to work carried
out in collaboration with other persons 3) the thesis is the correct version of the thesis for submission and is the same version as any electronic versions
submitted*. 4) my thesis for the award referred to, deposited in the Heriot-Watt University Library, should be made available for
loan or photocopying and be available via the Institutional Repository, subject to such conditions as the Librarian may require
5) I understand that as a student of the University I am required to abide by the Regulations of the University and to conform to its discipline.
6) I confirm that the thesis has been verified against plagiarism via an approved plagiarism detection application e.g. Turnitin.
* Please note that it is the responsibility of the candidate to ensure that the correct version of the thesis is submitted.
Signature of Candidate:
Date:
Submission Submitted By (name in capitals):
Signature of Individual Submitting:
Date Submitted:
For Completion in the Student Service Centre (SSC) Received in the SSC by (name in capitals):
Method of Submission (Handed in to SSC; posted through internal/external mail):
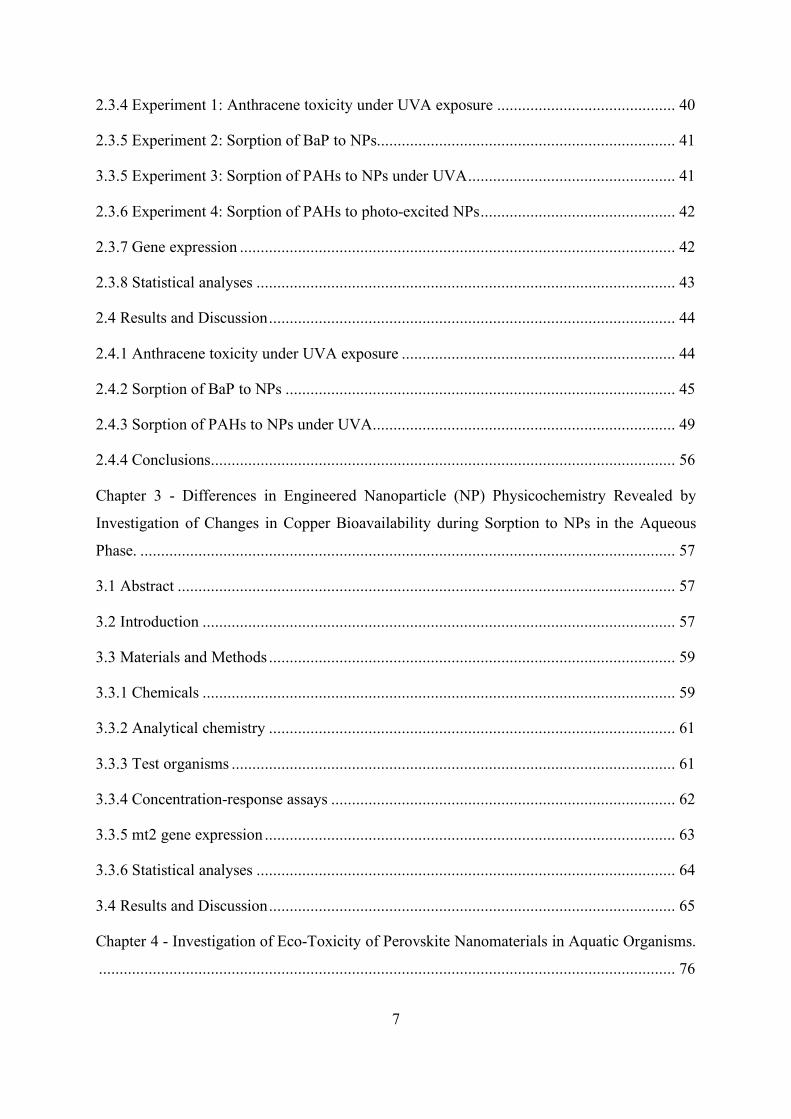
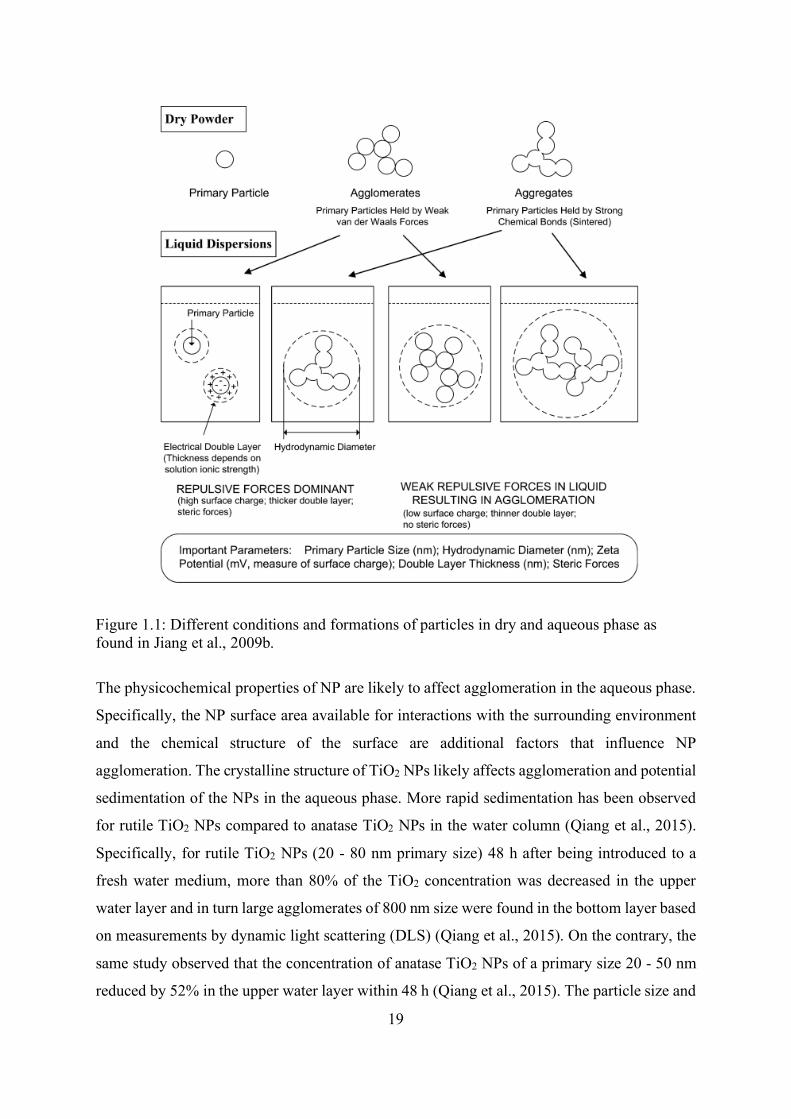
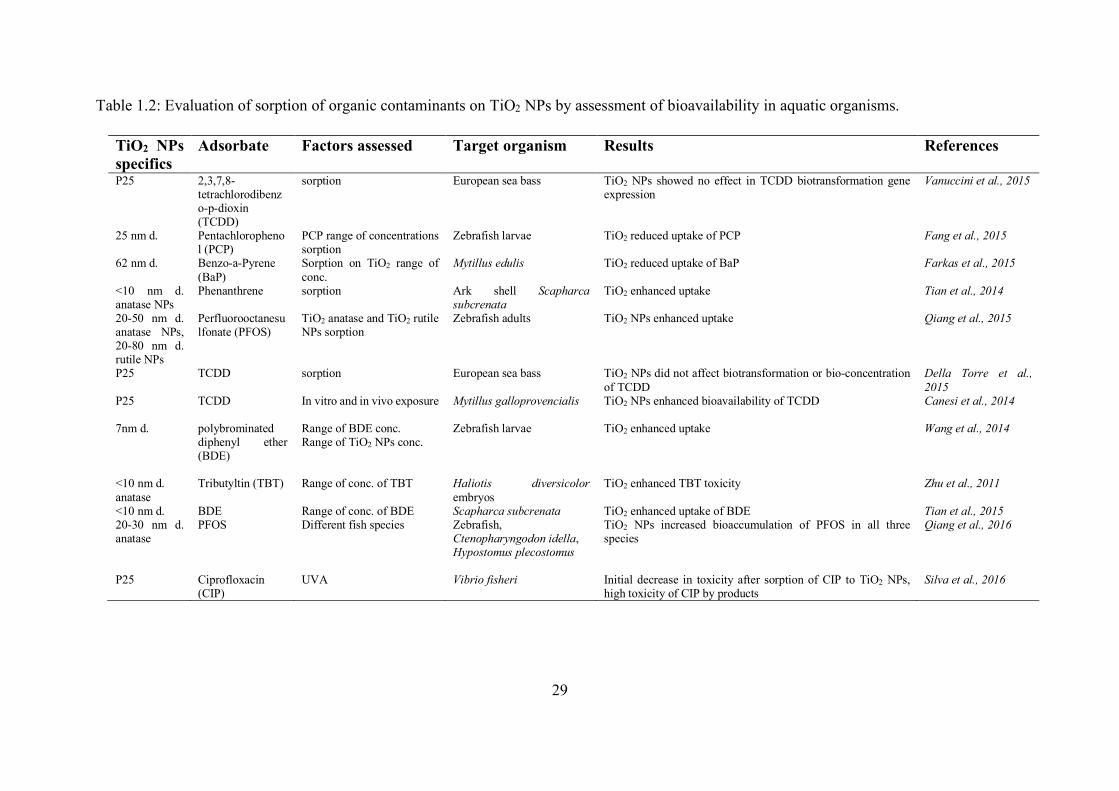
Zebrafish adults TiO2 NPs enhanced uptake Qiang et al., 2015
P25 TCDD sorption European sea bass TiO2 NPs did not affect biotransformation or bio-concentration of TCDD
Della Torre et al., 2015
P25 TCDD In vitro and in vivo exposure Mytillus galloprovencialis TiO2 NPs enhanced bioavailability of TCDD
Canesi et al., 2014
7nm d. polybrominated diphenyl ether (BDE)
Range of BDE conc. Range of TiO2 NPs conc.
Zebrafish larvae TiO2 enhanced uptake Wang et al., 2014
<10 nm d. anatase
Tributyltin (TBT) Range of conc. of TBT Haliotis diversicolor embryos
TiO2 enhanced TBT toxicity Zhu et al., 2011
<10 nm d. BDE Range of conc. of BDE Scapharca subcrenata TiO2 enhanced uptake of BDE Tian et al., 2015 20-30 nm d. anatase
PFOS Different fish species Zebrafish, Ctenopharyngodon idella, Hypostomus plecostomus
TiO2 NPs increased bioaccumulation of PFOS in all three species
Qiang et al., 2016
P25 Ciprofloxacin (CIP)
UVA Vibrio fisheri Initial decrease in toxicity after sorption of CIP to TiO2 NPs, high toxicity of CIP by products
Silva et al., 2016
30
1.5 Pilot study
The present experiment was a small preliminary study designed to investigate sorption of
anthracene onto TiO2 NPs under UVA radiation (the main study is presented in Chapter 2).
Other than this research, there A been no other studies that have used changes in substance
bioavailability to investigate sorption of photo-labile aromatic compound on potentially photo-
active NPs. Sorption of anthracene under UVA onto TiO2 NPs was investigated assessing the
bioavailability of photo-excited anthracene in zebrafish larvae (72-96 hpf). Zebrafish larvae
(20 larvae per beaker) were exposed to 15 µg/L anthracene (dissolved in dimethyl sulfoxide,
with final concentration of dimethyl sulfoxide <0.01% in the exposure preparations) and each
treatment was repeated thrice. The control exposure is synthesized fresh water medium and
DMSO (<0.01%) (79, 38, 12, 17 and 2 mg/L of Ca2+, Mg2+, Na+ and K+, respectively).
Zebrafish were exposed to anthracene for 24 h and at the end of the exposure a UVA exposure
followed (5 W/m2). Samples were collected 3 h after the end of UVA exposure for molecular
analysis. The bioavailability of the aromatic hydrocarbon was assessed through changes in
cytochrome P4501A (cyp1A) gene expression in zebrafish embryos conducted following the
procedure presented by Sleight et al. (2017) after 24-h exposure to anthracene and anthracene
and TiO2 NPs mixtures (see chapter 2 section 3 for extensive information on zebrafish
husbandry and breading and gene expression methodology).
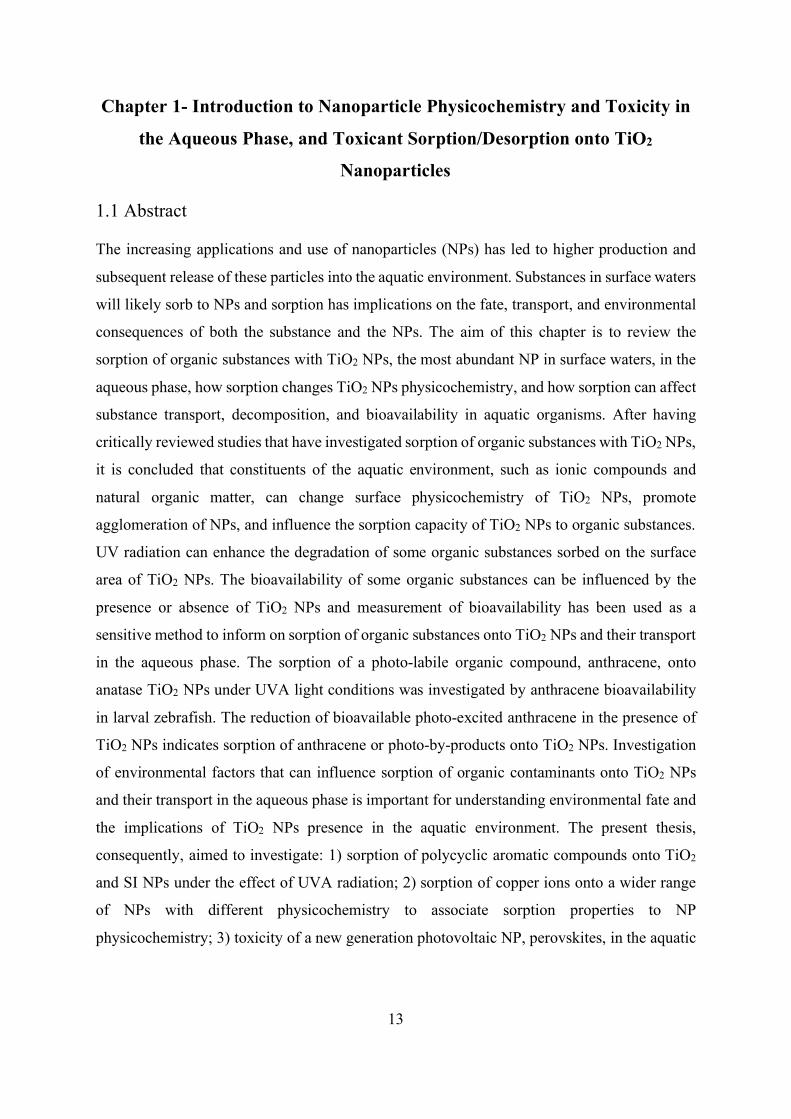
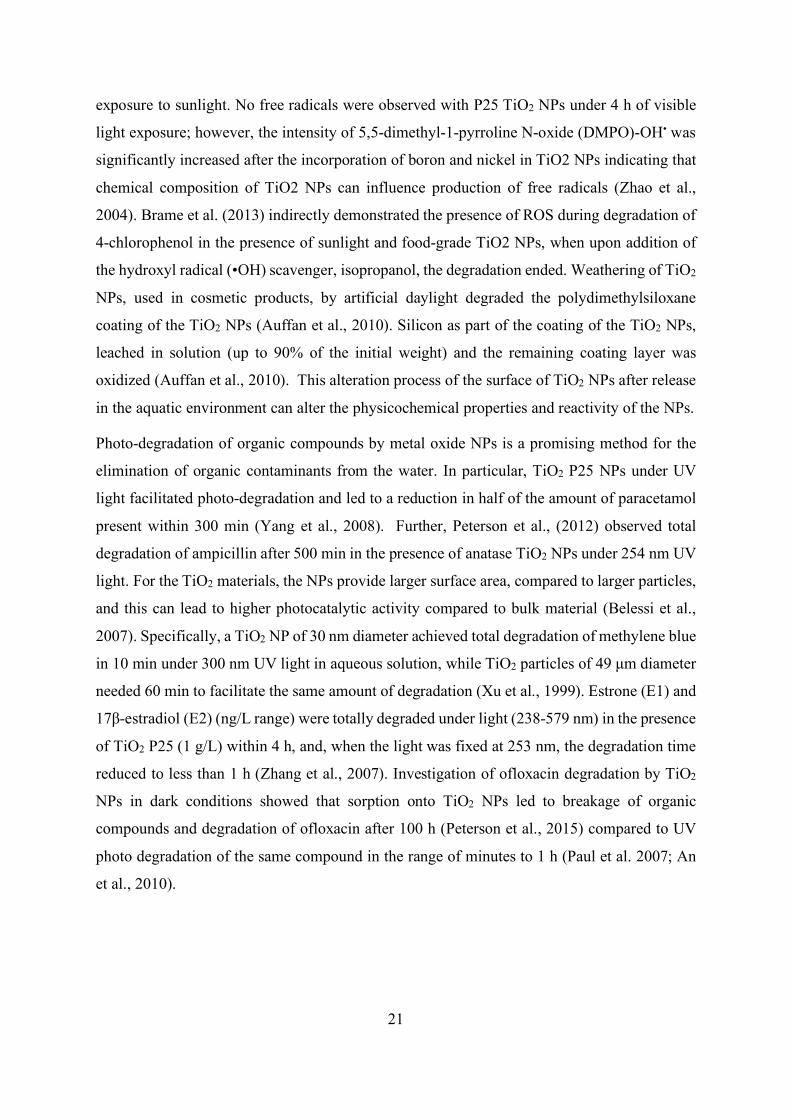
The results showed that anthracene exposure in zebrafish larvae did not induce cyp1A
expression, however, anthracene exposed under UVA can induce cyp1A (6-fold induction). In
the presence of TiO2 NPs cyp1A remained at low levels, reducing the effect of photo-excited
anthracene on cyp1A expression (Figure 1.2). The results indicate that anthracene under UVA
irradiation altered chemical structure and metabolism of photo-excited anthracene induced
cyp1A gene expression. The presence of TiO2 NPs reduced the bioavailable anthracene by
either providing enhanced surface area for anthracene to sorb leaving less/no amount of
anthracene available to larvae or by degrading anthracene into by products that do not involve
aryl hydrocarbon pathway biodegradation.
31
Figure 1.2: Relative expression of cyp1A in zebrafish larvae (72 hpf), after normalization to β-
actin. When larvae (20 per sample) were exposed to 15 µg/L of anthracene (anth) (n=3) no
induction of cyp1A was observed. On the contrary, larvae exposed to anthracene under UVA
illumination (5 W/m2) (n=6) led to a 6.3-fold induction of cyp1A, suggesting that anthracene
after UVA exposure creates photo-activated compound that is biodegraded by cyp1A enzyme.
Exposure of TiO2 NPs (2 mg/L) under UVA (n=3), do not induce cyp1A expression. The
mixture of anthracene and TiO2 NPs under UVA do not induce cyp1A expression, indicating
that photo-activated anthracene is not bioavailable to the larvae (main study presented in
Chapter 2). MEAN ± SE, ANOVA, p<0.05.
32
1.6 Thesis Objectives
To summarize, the present review indicates the urgent need to investigate NP environmental
fate and the several implications of the sorption of organic contaminants onto a most abundant
NP in the aquatic environment (i.e. TiO2 NPs and agglomerates). It has been evident that the
identification of the relationship of NP physicochemistry and NP toxicity in the aqueous phase
is a fundamental issue to allow proper risk assessment. The indirect toxicity of NPs in the
aquatic environment (e.g. ion release, sorption of existing environmental contaminants, etc) is
a TiO2 NPs are likely to interact with organic contaminants present in the aquatic environment
during and after NP release. After manufacturing and during use and release in the aquatic
environment, TiO2 NPs can go through changes in their physicochemistry. Interactions
between NPs or with ionic compounds, and solar irradiation can change the properties of the
NP surface, making laboratory-based experiments more complicated to assess and interpret.
Sorption of organic contaminants onto TiO2 NPs can occur and promote transport of sorbent
to aquatic organisms but can be influenced by changes in the physicochemistry of the surface
of NPs and sorbent in the aqueous phase. TiO2 NPs can facilitate photo-degradation of organic
compounds with potential for use in environmental remediation; however, there is also
potential that biologically active decomposition products are generated after interaction with
UV light and organic substances adsorbed onto TiO2 NPs. Evaluation of adsorbed substance
bioavailability to investigate the sorption/desorption processes onto NPs is an environmentally
relevant and sensitive approach that contributes important new information towards
understanding sorption phenomena.
The experiments conducted in the present thesis were designed to investigate the
aforementioned issues that occur with the presence of NP in the aquatic environment. All
starting materials had all three dimensions in the nanoscale and have been referred to as NPs
and NP agglomerates. While bioavailability measurements can change with changes of
environmental factors, the bioavailability assessment of a model organism with well
characterised and known responses (i.e. zebrafish) can be a very useful analytical tool.
Zebrafish, Danio rerio, and the green microalga, Chlorella vulgaris were used as model
organisms in the present study. Zebrafish is a fish with widely studied responses, standardised
guidelines for conducting toxicity tests and completely sequenced genome. It is also an
organism that develops fast and is easy to breed and keep in aquaria. Chlorella vulgaris has
been chosen as second model organism with different biology compared to zebrafish, affected
33
potentially differently after exposure to the same toxicants, thus informing on and completing
the knowledge acquired from zebrafish on NP behaviour and toxicity in the aqueous phase.
Specifically, the thesis objectives included the following:
1) Investigation of PAHs sorption on TiO2 and Si NPs under UVA radiation by examining the
PAH and by-products bioavailability in zebrafish larvae. The sorption of two representative,
with distinct differences, photo-labile PAH compounds [anthracene and benzo(a)pyrene] was
studied under laboratory and UVA light to identify effects of UVA radiation on sorption
processes. Sorption was indicated by assessing bioavailability of PAHs and photo-by-products
using expression of PAH metabolism genes. The study on sorption of PAHs onto NPs is
presented in Chapter 2.
2) Investigation of copper sorption onto a wide range of NPs with different physicochemical
properties in aqueous phase in the context of attributing co-contaminant sorption to NP
physicochemistry. The positively charged copper ion sorption onto negatively charged NPs
was studied by evaluation of copper bioavailability in C. vulgaris (growth inhibition) and
zebrafish larvae (mortality and biomarker gene expression) in the presence of NPs. The study
on copper sorption onto NPs is presented in Chapter 3.
4) Evaluation effects of lead-halide perovskites NPs (a new generation photovoltaic material)
in the aquatic environment and whether perovskite toxicity can be attributed to Pb release. The
perovskite toxicity was conducted by assessing perovskite NP toxicity in C. vulgaris and
zebrafish larvae in the aqueous phase and via dietary exposure on adult zebrafish evaluating
Pb bioavailability, tissue toxicity, and changes in zebrafish gut microbiota. The metal ion
dissolution is an indirect effect of metallic NPs and respiration and dietary exposure are the
major exposure routes of NPs in fish (Jang et al., 2014; Lu et al., 2017). Metal ion dissolution
from metallic NPs significantly increases with low pH values (Bian et al., 2011), therefore, a
dietary exposure can enhance metal dissolution after digestion of NP-spiked food and ion
release in the gastro-intestinal (GI) tract. The exposure of perovskite NPs in algae and zebrafish
is presented in Chapter 4.
5) Evaluation of relation between NP physicochemistry and acute toxicity of aqueous phase
NPs in C. vulgaris and early life stage zebrafish with development of enhanced exposure
methods. One major limitation of testing toxicity of aqueous-phase NM exposure is the lack of
homogeneity of NM suspensions and toxicity of NPs has been reported to be related to the
34
dispersion state of NPs in the aqueous phase (Boyle et al., 2015). In Chapter 5 The issue of
sedimentation of NP agglomerates has been addressed using an exposure chamber that allows
exposure of zebrafish larvae to continuously dispersed NPs without damaging the larvae.The
exposure chamber toxicity test has been compared to traditional static exposure methods and
NP toxicity was also assessed in C. vulgaris, a standardised toxicity test that offers limited
sedimentation of NPs.
35
Chapter 2 - Toxicity of PAHs in the Presence of NPs Depends on Sorption
Capacity and Potential Photocatalytic Properties of NPs.
2.1 Abstract
Engineered NPs have unique physicochemistry that includes high surface area, surface
reactivity, and photo-activity. In the aqueous phase, NPs can sorb substances and subsequently
undergo complex chemical reactions that alter the chemistry of adsorbed substances. The
present study evaluates sorption of two polycyclic aromatic hydrocarbons (PAHs) onto TiO2
and Si NPs which have photo-activity and have been shown to sorb various substances in the
aqueous phase. Sorption was evaluated by investigation of bioavailability of benzo(a)pyrene
(BaP) and anthracene (ANT) through cytochrome P4501A (cyp1A) gene expression in larval
zebrafish. The results support sorption of BaP under fluorescent light on both types of NPs
(TiO2 and Si NPs) as indicated by less bioavailability of BaP in the presence of NPs. Under
ultraviolet radiation ANT and BaP were photo-lysed to by-products that significantly changed
the gene expression of cyp1A, superoxide dismutase 1 and DNA damage protein 2. The
presence of NPs and UVA promoted catalysis of both PAHs and ANT sorption onto NPs under
UVA led to significantly reduced bioavailability of by-products compared to ANT alone under
UVA suggesting a protective role of NPs. On the contrary, BaP toxicity under UVA was
strongly related to sorption onto NPs and the surface are available. Specifically, at low
concentrations of BaP, sorption and photo-catalysis were efficient that led to higher relative
concentration and bioavailability of toxic photo-by-products. At high concentrations of BaP,
the limited surface area of NPs present in the suspensions led to partial photo-catalysis of BaP
therefore, showing relative lower toxicity when compared to BaP exposures under UVA alone.
The present study suggested that sorption of PAHs onto NPs is closely related to surface area
as well as the physicochemistry of the PAH. Finally, the photo-activity of the NPs can change
the reactivity of the surface area, changing in turn the sorption processes. Understanding NP-
substance sorption is an important consideration for managing the environmental risks of NPs.
36
2.2 Introduction
The unique physicochemical properties of NPs can have important implications on their
interactions with other substances including toxicants in the aqueous phase. Both small size
(high surface to volume ratio) and surface reactivity of NPs influence sorption capacity by
increasing sorption sites on the surface of the NPs. Although some NPs can be of low toxicity,
sorption/desorption of toxicants to NPs presents an important factor to consider for
environmental risk assessments of NPs. Numerous reports of toxic substance
sorption/desorption to NPs include nC60 (Baun et al., 2008a; Henry et al., 2013; Park et al.,
2011; Wang et al., 2009), carbon nanotubes (CNT) (Glomstad et al., 2016; Li et al., 2014; Pan
et al., 2008), TiO2 and SiO2 NPs (Boran et al., 2016; Fang et al., 2015; Tian et al., 2014). These
results suggest that NPs can act as a vehicle for the delivery of toxicants to organisms.
Polycyclic aromatic hydrocarbons (PAHs) are a group of organic contaminants reported to
associate with NPs in the aqueous phase (Baun et al., 2008b; Wang et al., 2009; Yang et al.,
2006). Among the issues of toxicological importance regarding sorption/desorption of
substances onto NPs are enhanced bioavailability of toxicants that are sorbed to NPs,
interactions between NPs and toxicants that enhance toxicity (e.g., photo-activation of
toxicants), and effects of toxicant sorption on NP physicochemistry.
Ultraviolet radiation of engineered NPs can cause photoexcitation and lead to photocatalytic
decomposition of environmental organic contaminants. Photo-activation of NPs (e.g., TiO2,
ZnO, NiO NPs) can generate reactive oxygen species (ROS) (i.e. O2, H2O2, OH) (Augugliaro
et al., 2012) that have potential to react with organic substances including PAHs in aerated
systems, with primary reaction initiated with the presence of the hydroxyl radical (˙OH)
(Brubaker and Hites, 1998). Due to the different crystalline structures, the two most common
in industry crystal types of TiO2, anatase and rutile, exhibit functional differences, being
commercially available in smaller size and having excitation range that corresponds to UVA
wavelengths (388 nm). Rutile is thermodynamically stable and found commercially in larger
sizes (200 nm particle diameter) and photo-excitation can occur in visible light wavelength
(410nm) (Hurum et al., 2003). The outermost conduction band electrons of photo-activated
TiO2, can get caught by O2 in aerated systems and create superoxide radical ions (O2-) (Chen
et al., 2004). Specifically, when TiO2 P25 NPs were exposed under UVA, high levels of
hydroxyl radicals (˙OH) were observed by electron pragmatic resonance spectroscopy (Pigeot-
Remy et al., 2017). Additionally, Brame et al. (Brame et al., 2013) showed degradation of 4-
37
chlorophenol by food-grade TiO2 NPs under sunlight, and degradation significantly decreased
in the presence of the hydroxyl radical scavenger, isopropanol. Yang et al. (Yang et al., 2008)
observed photo-degradation of half the amount of paracetamol within 300 min when TiO2 P25
NPs were added in the aqueous solution and preparations were exposed under UVA while
UVA or TiO2 NPs alone caused minimal degradation of paracetamol.
PAHs are a group of hydrophobic organic compounds that can absorb energy from UV
radiation and sorb to NPs in the aqueous phase. PAHs absorb light in the UVA region and
create activated oxygen species that can pass the energy through the cell membrane and
potentially lead to lipid peroxidation (Fu et al., 2012; Yu, 2002). Photo-toxicity of anthracene
under UV radiation in fish was attributed to production of ROS (Oris and Giesy, 1990).
Fluoranthene exposure under UVA led to developmental abnormalities, due to disorganised
cell proliferation at the blastula stage and embryonic axis was not clearly visible, in Japanese
medaka embryos (Diamond et al., 2006). PAHs have high molecular weight and low water
solubility and have been reported to accumulate in organic material (Oris et al., 1990) and NPs
in the aqueous phase (Baun et al., 2008). The sorption of phenanthrene to CNT was lower when
CNTs with smaller number of potential adsorption sites were present, indicating that sorption
is dependent on physicochemical properties of the NPs, such as surface area and functional
groups (i.e. hydroxyl or carboxyl) (Glomstad et al., 2016). More phenanthrene molecules
sorbed to multi-wall CNT compared to naphthalene molecules, a PAH with lower Kow value
and less hydrophobic than phenanthrene was observed (Wang et al., 2009), indicating the
importance of the physicochemical properties of the adsorbate in the sorption processes.
Bioavailability of PAHs to model organisms has been used in the investigation of PAHs
sorption to NPs. Bioavailability is defined as the amount of a compound that enters the target
tissue and can have an active effect on a model organism (Semple et al., 2004). The NPs can
act as a vehicle and transfer sorbed PAHs to exposed organisms, increasing the bioavailability
or bioaccumulation of the compound after adsorbate desorption as indicated by mortality in
Daphnia magna after ingestion of nC60 aggregates and adsorbed phenanthrene by the organism
(Baun et al., 2008), the adsorbate/NPs uptake by ark shell and amount of the desorbed
compound measured inside the organism’s tissues by analytical chemistry (Tian et al., 2014),
or activity of well-known biomarkers for bioavailability of the adsorbate (i.e. ROS generation
and GST activity for PAHs bioavailability) (Ferreira et al., 2014); no effects or direct toxicity
of the specific NPs when exposed alone were observed, suggesting no bioavailability of NPs
38
(Ferreira et al., 2014; Tian et al., 2014). Hence, bioavailability indicates sorption of adsorbate
onto NPs directly at the organism level and offers an environmentally relevant evaluation of
impact of NPs in the aquatic environment. The presence of NPs, such as nC60 agglomerates,
reduced fluoranthrene photo-toxicity to D. magna after a short-term exposure (Yang et al.,
2010). To our knowledge, although the photo-enhanced toxicity of PAHs is well reported, there
is no information about how UVA can affect the sorption processes of PAHs on NPs with
potential photo-activity and in turn the bioavailability of photo-excited PAHs in aquatic
organisms.
The objective of this study was to further investigate sorption of PAHs onto commercially
important engineered NPs adding the potential effect of UVA illumination in the aqueous
phase. The selected NPs included semi-conductor materials belong to the energy value chain
with potential photo-activity, specifically, two TiO2 NPs with different properties (anatase :
rutile ratios, and particle size) and Si NPs. Anthracene and BaP were selected as representative
PAHs, that possess different physicochemical properties mainly are attributed to the
differences in the molecular weight. Anthracene is a photo-labile and photo-toxic compound,
with higher water solubility while BaP is a genotoxic compound and less water-soluble. The
aim of the study was to investigate whether sorption of ANT and BaP can differ between NPs
not only due to different physicochemical properties of both PAHs and NPs but also light
excitation (after UVA illumination) of the tested compounds. The sorption of PAHs to NPs
was evaluated by studying bioavailability as biomarker activity and specifically, gene
expression, using well-documented and specific pathways (i.e. PAH metabolism) after PAHs
exposure in larval zebrafish.
2.3 Materials and Methods
2.3.1 Chemicals
The NPs used for the sorption studies were: TiO2 JRCNM01005a previously listed as NM105,
Aeroxide P25 (Evonik Degussa) with a 25-30 nm particle diameter, anatase:rutile ratio of 85:15
and -6.45 mV z-potential when 10 mg/L were suspended in Milli-Q water, anatase TiO2 NPs
with primary particle diameter of 4-8 nm and z-potential of 46.8 mV in Milli-Q water and a Si
NP provided by the Institute of Energy and Environmental Technology, Duisburg, Germany,
with 100 nm particle diameter and -17.3 mV z-potential when 100 mg/L were suspended in
39
Milli-Q water. The PAHs used for this study were: anthracene (ANT) (Sigma-Aldrich,
Lot#MKBN3282V) with 0.044 mg/L water solubility at 25 oC and benzo(a)pyrene (BaP)
(Sigma-Aldrich, Lot#SLBM2972V) with 0.00162 mg/L water solubility at 25 oC. Dimethyl
sulfoxide (DMSO) (Sigma Alrdich, Lot#: SHBF7881V) was used as solvent for ANT and BaP.
2.3.2 Experimental Organism
Zebrafish (Danio rerio) were obtained from the zebrafish research facility, Heriot Watt
University. Husbandry, spawning and experiments using zebrafish were conducted following
animal welfare regulations of the UK Home Office. Breeder fish were fed ad libitum, three
times per day, with newly hatched Artemia salina or dry pellet food (ZM systems, Winchester,
UK). Tap water was filtered through a reverse osmosis filter and fresh water was synthesised
for husbandry and experiments in agreement with the OECD guidelines for fish early life-stage
toxicity tests (OECD 210). The fresh water medium consisted of: 79, 38, 12, 17 and 2 mg/L of
Ca2+, Mg2+, Na+ and K+, respectively with pH of 7.7. The temperature was maintained between
28-30 oC, and a 12-h photoperiod was kept in the zebrafish facility. More than 30 one-year-old
zebrafish were used for each spawning event with a ratio of 3:2 females to males. Hatching
occurred between 48 and 72 hours post fertilization (hpf) and fish of age 72 hpf were used for
the experiments.
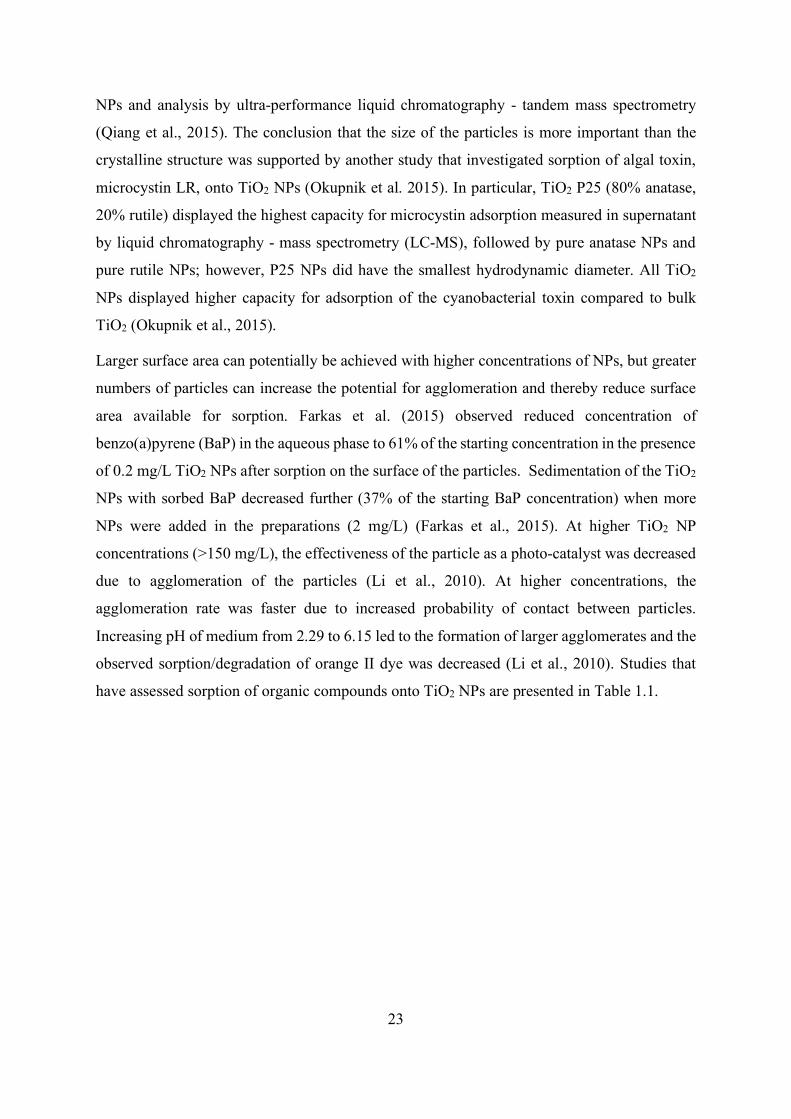
2.3.3 Experimental Design
Sorption of ANT and BaP on NPs was assessed by bioavailability assessments. The first
experiment (experiment 1) investigated the gene expression of three biomarkers (cytochrome
P450 1A (cyp1A), superoxide dismutase 1 (sod1), DNA damage protein 2 (ddb2)) for the
evaluation of ANT bioavailability in larval zebrafish with and without UVA exposure. The
following three experiments (numbers: 2, 3 and 4) were conducted for the investigation of
sorption of PAHs on NPs under UVA using bioavailability of PAHs in larval zebrafish as the
analytical tool (Figure 2.1).
40
2.3.4 Experiment 1: Anthracene toxicity under UVA exposure
Preliminary acute toxicity tests were conducted in zebrafish larvae (72-168 hpf) in a range of
concentrations of ANT, 0 to 100 µg/L, and up to 45 µg/L to BaP solved in DMSO, with final
concentrations of DMSO in test solutions being less than 0.01%. Acute toxicity tests were
conducted in 96-well plates in a total volume of 200 µl to assess mortality caused by exposure
to ANT after 96-h exposure period. Three genes were investigated as indicators of ANT
bioavailability in larval zebrafish. Zebrafish larvae 72 hpf were exposed to two parallel ANT
dilution series (0-30 µg/L). Cytochrome P4501A (cyp1A), superoxide dismutase 1 (sod1) and
DNA damage binding protein 2 (ddb2) were examined as potential biomarkers for studying
ANT bioavailability. One dilution series was sampled after 24 h and the second dilution series
was exposed to UVA (5 W/m2). Preliminary time-point experiment (larvae exposed to 6 µg/L
ANT and samples selected at 0, 2, 4 and 6 h after the end of UVA exposure) indicated that
cyp1A induced 3-fold 2 h after the end of the UVA exposure and the expression dropped at 4-
h time-point. The sod1 gene expression increased a 1.6-fold at 2 h after the end of the UVA
exposure and a 1.9-fold at the 4 h time-point. The 3-h time-point was selected for further
experimentation as both cyp1A and sod1 were induced 3 h after the end of UVA exposure
(Appendix A).
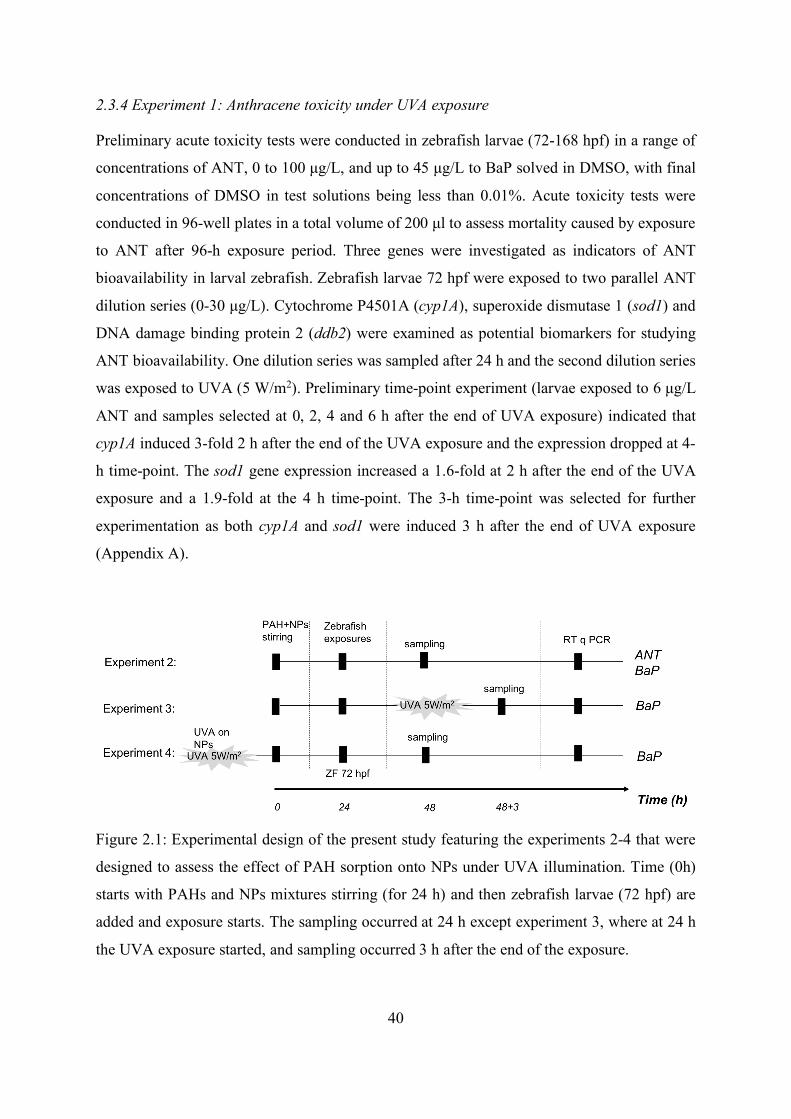
Figure 2.1: Experimental design of the present study featuring the experiments 2-4 that were
designed to assess the effect of PAH sorption onto NPs under UVA illumination. Time (0h)
starts with PAHs and NPs mixtures stirring (for 24 h) and then zebrafish larvae (72 hpf) are
added and exposure starts. The sampling occurred at 24 h except experiment 3, where at 24 h
the UVA exposure started, and sampling occurred 3 h after the end of the exposure.
41
2.3.5 Experiment 2: Sorption of BaP to NPs
Gene expression was used to assess bioavailability of BaP and indicate sorption of BaP onto
NPs. For the sorption studies, two parallel dilution series of BaP were set up (0-3 µg/L) and in
one dilution series 2 mg/L of each of NPs (NM105, TiO2 4-8 nm or Si NPs) were added. The
BaP and NPs mixtures were prepared in fresh water medium (total volume of 20 ml) and stirred
for 24 h prior to the start of the exposure. Zebrafish larvae at the developmental stage of 72 hpf
were added in the preparations and exposed for 24 h. The exposures were conducted in 100-ml
glass beakers and 15-20 larvae were exposed per beaker. After the end of exposure, the larvae
were collected and stored at -80 0C until further analyses. ANT was not used as a co-
contaminant in this set of experiments as no induction of any biomarker was observed in
zebrafish larvae after a 24-h aqueous exposure.
3.3.5 Experiment 3: Sorption of PAHs to NPs under UVA
Both BaP and ANT were used for the following set of experiments. The concentration range
used for BaP was 0-30 µg/L and for ANT, 0-27 µg/L. Two different experimental designs were
followed using BaP as co-contaminant. The first included two BaP serial dilutions up to 1 µg/L
and the second two serial dilutions up to 30 µg/L. The amount of NPs (NM105, TiO2 4-8 nm
or Si NPs) added in one dilution series was 2 mg/L. The preparations with both PAH and NPs
were stirred for 24 h prior the exposure. Zebrafish larvae 72 hpf were exposed to PAH and
PAH/NPs mixtures. At the end of the 24-h exposure period, the preparations were exposed
under UVA irradiation. The final volume of solutions was 20 ml and shallow enough for the
UVA irradiation to be able to penetrate throughout. In the experiments with low BaP
concentration range and ANT, larvae were collected 3 h after the end of UVA irradiation and
stored at -80 0C until further gene expression analysis. At the higher BaP concentration range
(0-30 µg/L), 3 h after the end of the UVA irradiation, the mortality of the larvae was recorded.
The larvae were collected 3 h after the UVA irradiation for gene expression analyses. During
the UVA treatment, preparations were placed in UV Crosslinker CL-1000, longwave emission
of 365 nm. The energy the preparations were exposed to was 5 W/m2. The light intensity inside
the oven was measured by LI-COR LI-250A light meter and found to be 52.64 ± 2.17 µmol
(mean ± SE, n=8) in different areas across the interior of the oven and 50.61 ± 1.18 µmol
underwater.
42
2.3.6 Experiment 4: Sorption of PAHs to photo-excited NPs
Preparations of 2 mg/L of NM105, TiO2 4-8 nm and Si NPs in fresh water medium were
exposed under UVA irradiation of 5 W/m2. At the end of exposure, BaP was added in the
preparations (0-3 µg/L) and which then were stirrer for 24 h. Larvae at 72hpf were exposed for
24 h, collected, sacrificed and stored at -80 0C for gene expression analyses. The larvae exposed
to BaP and NP mixtures were compared to the parallel exposure of larvae exposed to BaP
alone.
2.3.7 Gene expression
Extraction of RNA was conducted, using RNeasy MiniKit for animal tissue, Qiagen, West
Crawley, UK as described by (Boran et al., 2016). Zebrafish larvae 96 hpf (15-20 larvae per
replicate) were homogenized with a pestle, treated with DNase (Qiagen) to prevent sample
contamination from DNA, and eluted in 30 µL of sterile RNase/DNase free water. The
concentration of the total RNA was measured using NanoDrop Spectophotometer (ND-2000)
and all samples with good quality RNA (280/260 ratio between 2.0-2.2) were diluted to a final
concentration of 100 ng/µL. Reverse transcription was performed using Precision nanoScript2
Primer design kit with the following conditions: annealing at 65 oC for 5 minutes, extension at
42 oC for 20 minutes and inactivation of the reaction for 10 minutes at 75 oC. The cDNA was
stored at -20 oC until gene expression analysis.
Primers designed for zebrafish from Primer BLAST (NCBI) for the following genes:
cytochrome P4501A (cyp1A), β-actin, superoxide dismutase 1 (sod1) and DNA damage
binding protein 2 (ddb2) as shown in Table 2.1. Precision PLUS Mastermix with SYBRGreen,
Primer Design, was used for the quantitative PCR. Fluorescence was detected after 40 two-
step cycles (denaturing temperature at 95 oC, primer specific annealing temperature and
extension step 60 oC) by OneStep Real Time System (Applied Biosystems, Warrington, UK).
The efficiency of the qPCR was calculated (! = 10(&'
()*+,) − 1) based on a 4-point standard
curve. Efficiencies between 0.9 and 1.1 were accepted for further analyses. The relative
expression was calculated using the ΔΔCt method (Henry et al., 2013).
43
2.3.8 Statistical analyses
Data followed normal distribution (as tested by the Shapiro Wilks test of normality, p>0.05)
and homogeneity of variance was assessed by the Bartlett’s test (p>0.05). Analysis of variance
(ANOVA) was used to assess differences in gene expression with increasing concentration and
UVA or gene expression (dependent variable) was modelled by general linear model according
to the independent variables of PAH concentration, treatment (presence or absence of NPs),
and concentration and treatment interaction (significance was considered at p-value of <0.05).
Mortality (dependent variable) of zebrafish larvae was modelled by logistic regression
according to the independent variables PAH concentration, treatment (presence or absence of
NP), and concentration x treatment interaction. The models were generated by iterative
maximization of the likelihood function, and independent variables and their interactions were
included if they significantly improved the model (likelihood ratio test, based on Wald χ2
distribution). Differences in fish mortality among treatments (i.e., presence or absence of NPs)
were determined by pair-wise contrast statements with a p-value of <0.05. All statistical
analyses were conducted using R statistics (version 3.2.1, RStudio, Inc., 2015).
Table 2.1: Zebrafish gene specific primers for cytochrome P450 1A (cyp1A), superoxide
dismutase 1 (sod1), DNA damage binding protein 2 (ddb2) and housekeeping gene (β-actin).
Reference sequence numbers from NCBI, and product length in base pairs (bp).
Gene Reference
Sequence Number
Forward (5’-3’) Reverse (5’-3’) Product
Length (bp)
Annealing
Temperature
(oC)
cyp1A NM_131879.1 AGGACAACATCAGAG
ACATCACCG
GATAGACAACCGCCCA
GGACAGAG
174 60
Ddb2 NM_001083061.1 CATGCCGAATTCAAC
CCTCG
GCTGTCAGCATTGACT
GGTT
147 58
sod1 NM_131294.1 ACCGGCACCGTCTAT
TTCAA
AGCATGGACGTGGAAA
CCAT
105 55
β-actin NM_131031.1 ACACAGCCATGGATG
AGGAAATCG
TCACTCCCTGATGTCTG
GGTCGT
138 60
44
2.4 Results and Discussion
2.4.1 Anthracene toxicity under UVA exposure
Significant increase in sod1 and ddb2 expression were observed in zebrafish larvae after
exposure to ANT and UVA radiation. Specifically, after zebrafish larvae were exposed to 15
µg/L of ANT for 24 h, inductions of 0.8 and 1.2-fold were observed for sod1 and ddb2
respectively. On the contrary, when ANT exposure was followed by UVA radiation, 1.7 and
4.1-fold inductions were observed for sod1 and ddb2, respectively (Figure 2.2). Induction of
sod1 suggests presence of ROS and induction of ddb2 suggests DNA damage caused by
exposure to ANT photo-by-product. Under UVA, ANT becomes photo-excited and undergoes
photo-modification with possible main by-product 9,10 anthraquinone (Lee, 2003; Mallakin et
al., 2000; Perraudin et al., 2007). Specifically, Mallakin et al. (2000) observed anthraquinone
as the main photo-by-product 2 h after the light stimulation. PAHs quinones are electrophilic
and they tend to bind to cellular nucleophiles such as proteins and nucleic acids (Kim et al.,
2000). BaP quinones induced oxidative damage of lipid and protein in erythrocytes in rats (Kim
et al., 2000). The epoxide metabolites of BaP can form DNA adducts with N2 position of
guanine (Miller and Ramos, 2001) and have been reported to induce ddb2 gene expression
along with other DNA damage related genes such as xeroderma pigemntosum,
complementation groups C and F (xpc and xpf) in human cell lines (Christmann et al., 2016).
Significant changes in cyp1A expression were observed in zebrafish larvae after exposure to
ANT and UVA. No induction of cyp1A expression was observed in this study after exposure
to ANT without UVA radiation and a 45-fold induction was observed when preparations were
exposed under UVA. No significant induction of the genes investigated in the present study
was observed after exposure to UVA or NPs and UVA alone. The relationship between 3-ring
PAHs such as ANT and the aryl hydrocarbon receptor pathway is not clear, and ANT has been
characterised as non-reactive and not an aryl hydrocarbon agonist in fish (Barron et al., 2004).
No activity of 7-Ethoxyresorufin O-Dealkylase (EROD), the catalytic measurement of cyp1A
enzyme, was observed after exposure of ANT to rat hepatoma cell lines (Bosveld et al., 2002).
In the present study, photo-excited ANT induced cyp1A in a bell-shape manner, indicating that
the metabolism of ANT photo-by-product could involve the aryl hydrocarbon pathway. The
bell-shape expression with increasing concentration could be explained by increasing cyp1A
45
gene expression and then reduction in expression levels when sufficient levels of cyp1A protein
are present or the organism is not able to cope with the increasing concentrations of ANT
photo-by-product that would eventually lead to larvae mortality. Cyp1A was selected for
further experimentation of ANT exposures as it displayed high induction after the UVA
radiation. The present study supports the existing literature on the photo-toxicity of ANT and
provides an insight on gene expression profiles after exposure in vivo to ANT under UVA in
larval zebrafish.
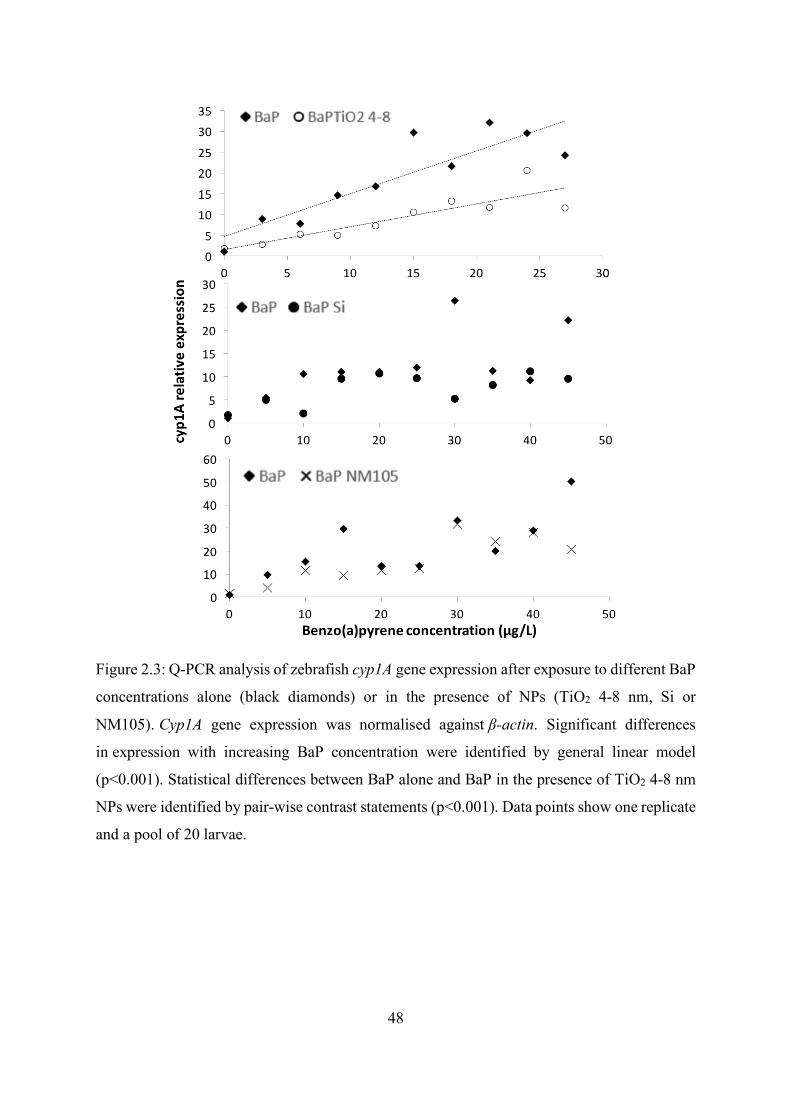
2.4.2 Sorption of BaP to NPs
Sorption of BaP onto all NPs tested in the present study, was indicated by reduced cyp1A gene
expression in zebrafish larvae in the presence of the NPs. Cyp1A was positively induced
following a linear pattern with increasing BaP concentration under laboratory light, and the
presence of each NP significantly decreased cyp1A expression. At high concentration range of
BaP (0-30 µg/L), reduction in gene expression was observed only in the presence of the
smallest TiO2 NPs (4-8 nm diameter) indicating sorption (Figure 2.3), while no changes in
cyp1A gene expression in the presence of NM105 or Si NPs suggesting minimal sorption on
the specific NPs. On the contrary, at low concentration range of BaP (0-2 µg/L), a significant
decrease in cyp1A expression was observed when each one of the NPs tested were present in
the exposure, suggesting that low concentration of BaP sorbed to surface area provided and
consequently became less bioavailable in the presence of all NPs, independently of diameter
size. Specifically, when zebrafish larvae were exposed to 1 µg/L BaP, cyp1A was induced 5.13-
fold (± 1.44 SE, n=3) and induction was observed up to 2.66, 1.32 and 2.69-fold when 2 mg/L
of NM105, TiO2 4-8 nm and Si NPs respectively, were present (Figure 2.4). The above support
that sorption depends on the physicochemical properties of the NPs (i.e. surface area) and on
the experimental conditions that the sorption processes are tested (i.e. concentration of
adsorbent and adsorbate). Recent research has confirmed the importance of surface area in
sorption of metals on the surface area of TiO2 NPs. Specifically, more Hg2+ was bioavailable
to zebrafish larvae (mt2 gene expression was used as a biomarker of bioavailability of
adsorbent) when bulk TiO2 where added in aqueous Hg2+ solution compared to TiO2 NM105
(Boran et al., 2016). Additionally, less copper was bioavailable to zebrafish larvae when TiO2
4-8 nm (that is the same NP used in the present study) was added in solution when compared
to larger TiO2 NPs (such as NM105) (see Chapter 3). Della Torre et al. (Della Torre et al.,
46
2017) investigated sorption of BaP to carbon nanotubes (CNT) and although fluorescence of
accumulated BaP in the zebrafish larvae increased with concentration, the presence of CNTs
kept BaP concentration in zebrafish larvae to a higher level than the lower BaP concentrations
tested but lower than the higher BaP concentration alone, indicating that CNTs acted as a
vehicle increasing the co-contaminant concentration up to the maximum sorption capacity
according to the surface area available. The present study suggests that sorption of BaP on NPs
occurs and depends on both physicochemistry of the adsorbent and sorption capacity of the
NPs.
47
Figure 2.2: Q-PCR analysis of zebrafish stress gene expression after exposure to different
anthracene concentrations and UVA radiation (5 W/m2). Cyp1A, sod1 and ddb2 gene
expression was normalised against β-actin. Significant differences in expression of all three
genes was only observed under combined UVA and anthracene treatment (ANOVA, p<0.001),
data points show the mean ± SE, n=3. Statistical differences were identified by two-way
ANOVA, TukeyHSD, ***=p<0.001, **=p<0.01
48
Figure 2.3: Q-PCR analysis of zebrafish cyp1A gene expression after exposure to different BaP
concentrations alone (black diamonds) or in the presence of NPs (TiO2 4-8 nm, Si or
NM105). Cyp1A gene expression was normalised against β-actin. Significant differences
in expression with increasing BaP concentration were identified by general linear model
(p<0.001). Statistical differences between BaP alone and BaP in the presence of TiO2 4-8 nm
NPs were identified by pair-wise contrast statements (p<0.001). Data points show one replicate
and a pool of 20 larvae.
49
Figure 2.4: Q-PCR analysis of zebrafish cyp1A gene expression after exposure to different BaP
concentrations alone (black diamonds) or in the presence of NPs (TiO2 4-8 nm, Si or
NM105). Cyp1A gene expression was normalised against β-actin. Significant differences
in expression with increasing BaP concentration were identified by general linear model
(p<0.001). Statistical differences between BaP alone and BaP in the presence of NPs were
identified by pair-wise contrast statements (p<0.001). BaP data points show MEAN ± SE, n=3,
the rest of data points show one replicate and a pool of 20 larvae.
2.4.3 Sorption of PAHs to NPs under UVA
The presence of 2 mg/L NM105, TiO2 4-8 nm and Si NPs led to no expression of cyp1A after
exposure to ANT, UVA and NPs (Figure 2.5). ANT and UVA induced cyp1A with increasing
concentration and no induction of cyp1A was observed after NPs alone or NPs and UVA
exposure. The reduction in cyp1A expression in the presence of NPs indicated sorption of ANT
photo-by-products on the NPs and potential photo-catalysis of ANT that was independent of
the surface area of the three NPs investigated. When lower concentration of NPs was added in
ANT dilution series (0.2 mg/L TiO2 4-8 nm or Si NPs that is 1/10 of the original concentration)
no induction of cyp1A was found suggesting that reducing the surface area available for
sorption ten times was still enough for the given concentration of ANT and/or photo-by-
products to sorb and be not bioavailable to zebrafish larvae (Appendix A). This outcome
emphasizes the importance of the physicochemistry of the adsorbate in the sorption processes,
50
the sorption capacity of NPs for low molecular weight ANT (with likely photo-by-product the
oxygenated PAH, 9,10 anthraquinone, although chemical analysis of the by-products did not
occur in the present study) when compared to a larger compound such as BaP (without UVA
exposure).
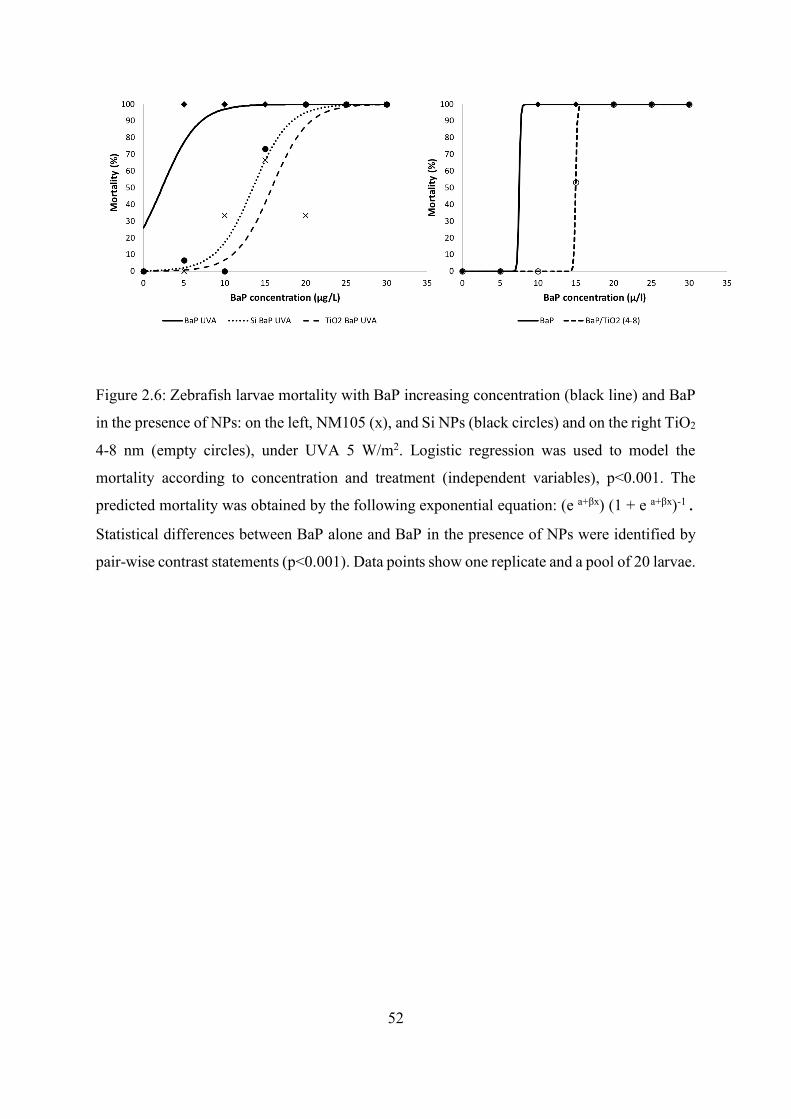
The presence of NPs significantly reduced toxicity of BaP under UVA in high concentrations
and induced bioavailability of BaP photo-by-product(s) in lower BaP concentration range.
Mortality of zebrafish larvae was observed in high range of BaP concentrations (5-30 µg/L), 3
h after the end of UVA irradiation in a concentration-response manner, and the presence of
each NP added in the BaP dilution series significantly lowered BaP photo-toxicity. All larvae
died when exposed to 5 µg/L BaP or higher under UVA (Figure 2.6) but in the presence of all
NPs the mortality was reduced significantly (logistic regression, p<0.001) as the concentration-
response curve was shifted to the right. In lower BaP concentration range (0-2 µg/L), no
mortality was observed, and the larvae were analyzed for cyp1A expression levels. BaP after
UVA induced cyp1A 3.8-fold at 0.1 µg/L and lower expression was observed at higher
concentrations (0.5-1 µg/L) following a bell-shape pattern. The presence TiO2 NPs, NM105
and TiO2 4-8 nm, in the 0.1 µg/L BaP solution, led to a higher expression of cyp1A (8.8-fold
and 7.6-fold, respectively) than BaP alone, however, high variation was observed. The
presence of Si NPs in BaP preparations kept the cyp1A expression at the same levels as the
photo-activated BaP alone at 0.1 µg/L, however, at 0.5 µg/L of BaP, the cyp1A expression was
induced significantly higher when Si NPs were present in preparations (ANOVA, TukeyHSD,
p<0.05) (Figure 2.7). In the specific experiment, cyp1A induction can be explained as a
combination effect of surface area and a critical amount of BaP/BaP photo-by-products
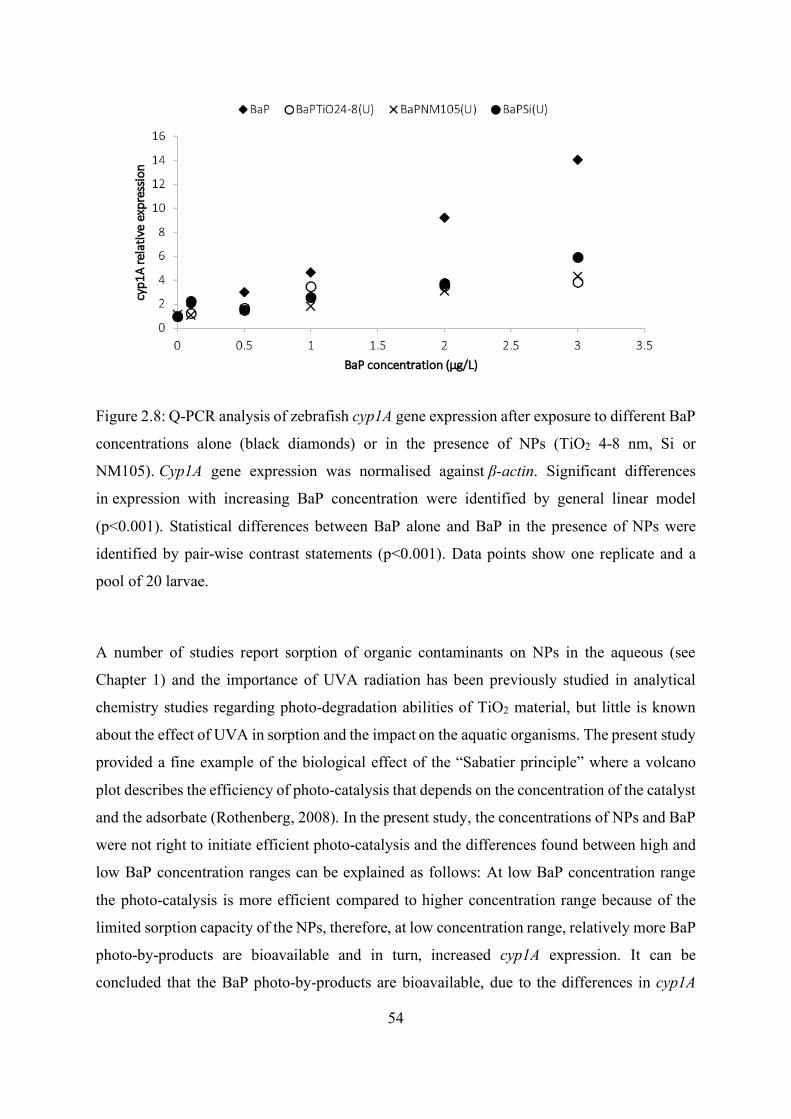
adsorbed that led to higher bioavailability of the adsorbate. When NPs were exposed alone to
UVA just before sorption to BaP was initiated, sorption of BaP was observed on the surface
area of TiO2 and Si NPs previously exposed to UVA as was suggested by the reduction in
cyp1A expression in the presence of NPs (Figure 2.8).
51
Figure 2.5: Q-PCR analysis of zebrafish cyp1A gene expression after exposure to different
ANT concentrations alone (black triangles) or in the presence of NPs (TiO2 4-8 nm, Si or
NM105). Cyp1A gene expression was normalised against β-actin. Significant differences
in expression with increasing ANT concentration were identified by general linear model
(p<0.001). Statistical differences between ANT alone and ANT in the presence of NPs were
identified by pair-wise contrast statements (p<0.001). Data points show one replicate and a
pool of 20 larvae.
52
Figure 2.6: Zebrafish larvae mortality with BaP increasing concentration (black line) and BaP
in the presence of NPs: on the left, NM105 (x), and Si NPs (black circles) and on the right TiO2
4-8 nm (empty circles), under UVA 5 W/m2. Logistic regression was used to model the
mortality according to concentration and treatment (independent variables), p<0.001. The
predicted mortality was obtained by the following exponential equation: (e a+βx) (1 + e a+βx)-1. Statistical differences between BaP alone and BaP in the presence of NPs were identified by
pair-wise contrast statements (p<0.001). Data points show one replicate and a pool of 20 larvae.
53
Figure 2.7: Q-PCR analysis of zebrafish stress gene expression after exposure to different BaP
concentrations and UVA radiation (5 W/m2). Cyp1A gene expression was normalised
against β-actin. Significant differences in expression of all three genes was only observed
under combined UVA and anthracene treatment (ANOVA, p<0.001), data points show the
mean ± SE, n=3 (n=4 for BaP data points). Statistical differences were identified by two-way
ANOVA, TukeyHSD, *=p<0.05.
*
54
Figure 2.8: Q-PCR analysis of zebrafish cyp1A gene expression after exposure to different BaP
concentrations alone (black diamonds) or in the presence of NPs (TiO2 4-8 nm, Si or
NM105). Cyp1A gene expression was normalised against β-actin. Significant differences
in expression with increasing BaP concentration were identified by general linear model
(p<0.001). Statistical differences between BaP alone and BaP in the presence of NPs were
identified by pair-wise contrast statements (p<0.001). Data points show one replicate and a
pool of 20 larvae.
A number of studies report sorption of organic contaminants on NPs in the aqueous (see
Chapter 1) and the importance of UVA radiation has been previously studied in analytical
chemistry studies regarding photo-degradation abilities of TiO2 material, but little is known
about the effect of UVA in sorption and the impact on the aquatic organisms. The present study
provided a fine example of the biological effect of the “Sabatier principle” where a volcano
plot describes the efficiency of photo-catalysis that depends on the concentration of the catalyst
and the adsorbate (Rothenberg, 2008). In the present study, the concentrations of NPs and BaP
were not right to initiate efficient photo-catalysis and the differences found between high and
low BaP concentration ranges can be explained as follows: At low BaP concentration range
the photo-catalysis is more efficient compared to higher concentration range because of the
limited sorption capacity of the NPs, therefore, at low concentration range, relatively more BaP
photo-by-products are bioavailable and in turn, increased cyp1A expression. It can be
concluded that the BaP photo-by-products are bioavailable, due to the differences in cyp1A
55
expression after zebrafish exposure to BaP or BaP and UVA. On the contrary, at higher BaP
concentration range, NP sorption sites are all engaged, photo-degradation occurs at the
adsorbed BaP, the NP concentration is limited and so are the sorption sites, therefore, less BaP
photo-by-products are bioavailable, and the presence of NPs is reducing photo-toxicity of BaP.
In the case of ANT, it can be concluded that under UVA irradiation the TiO2 NPs catalyzed
ANT degradation, however the photo-degraded substances either were sorbed on the surface
area of the NPs, thus less bioavailable to the larvae, or they did not induce mortality or
expression of the biomarkers used in the present study.
According to existing literature, the sorption on TiO2 NPs accelerates photo-degradation of
BaP under UVA but no investigation of the toxicity of photo-by-products was conducted in the
study (Zhang et al., 2008). Toxicity of ciprofloxacin (CIP) has been reported to decrease in the
presence of catalyst NPs (ZnO or TiO2) under UVA, but with the increasing concentration of
CIP photo-by-products, toxicity was increased again in Vibrio fisheri (Silva et al., 2016). The
same study found toxicity of the NPs alone in V. fisheri under UVA radiation. On the contrary,
TiO2 catalyzed photolysis of ibuprofen with ibuprofen photo-by-products showing less toxicity
in Artemia salina (Silva et al., 2014). UV radiation changes the surface chemistry of NPs such
as TiO2 with resulting ability for photo-catalysis of adsorbed organic substances. Organic
environmental contaminants such as methylene blue (Xu et al., 1999), estrone and 17β-
estradiol (Zhang et al., 2007), ofloxacin (Paul et al., 2007) have been reported to degrade in the
presence of TiO2 NPs under UVA or visible light condition, however, degradation is still
happening at a very slower rate just in the presence of TiO2 NPs in the dark (Peterson et al.,
2015). This study is the first to investigate the complications of sorption of two different PAHs
on TiO2 NPs under UVA radiation and analyze sorption by bioavailability of adsorbates in
zebrafish. Si NPs are semiconductors of lower band gap (1.12 eV) than TiO2 NPs (3.1-3.3 eV)
(Strümpel et al., 2007), but the relationship between band gap energy and degradation of
organic compounds is not clear. In the present study, all three NPs tested reduced ANT photo-
by-product bioavailability and high concentrations of BaP photo-by-product mortality in larval
zebrafish. However, at low BaP concentrations the amount of NP present photo-catalyzed BaP
inducing bioavailability of photo-by-products and increasing indirectly BaP toxicity to
zebrafish larvae under UVA.
56
2.4.4 Conclusions
In conclusion, the present study suggests that sorption of PAHs on NPs occurs and toxicity of
PAHs and/or photo-by-products depends on the sorption capacity of NPs. Results here obtained
indicate that sorption capacity depends on the quantity and physicochemistry of both adsorbent
and adsorbate. The sorption of PAHs under UVA promoted photo-catalysis of PAHs to photo-
by-products and the presence of the semiconductor NPs (TiO2 and Si NPs) play key role as in
low concentration of BaP, the photo-catalysis is efficient leading to higher bioavailability of
toxic photo-by-products, while in higher BaP concentrations, photo-catalysis is less efficient
due to limited sorption sites on the surface of NPs leading to less amount of photo-by-products,
thus lower photo-toxicity of BaP. The current research used bioavailability to investigate the
sorption processes of photo-labile compounds on photo-sensitive NPs with high potential of
occurrence in the aquatic environment and under UVA exposure. As a result, the data presented
here provide an insight on the broad interactions that can take place in the aquatic environment,
the complicated sorption processes and the indirect effects of the presence of engineered NPs
in the aquatic environment.
57
Chapter 3 - Differences in Engineered Nanoparticle (NP) Physicochemistry
Revealed by Investigation of Changes in Copper Bioavailability during
Sorption to NPs in the Aqueous Phase.
3.1 Abstract
The physicochemistry of engineered nanoparticles (NPs) in the aqueous phase influences their
fate, behaviour, and environmental implications. Investigations of sorption of chemical
substances to NPs in the aqueous phase can inform on these complex interactions and provide
insight on environmental fate of NPs. The objective of this study was to use differences in
sorption of copper (Cu) to investigate aqueous-phase physicochemistry of NPs (Si, perovskite
and TiO2 NPs). Along with analytical chemistry, sorption of Cu to NPs was evaluated by
assessment of changes in copper bioavailability in the alga Chlorella vulgaris, and larval
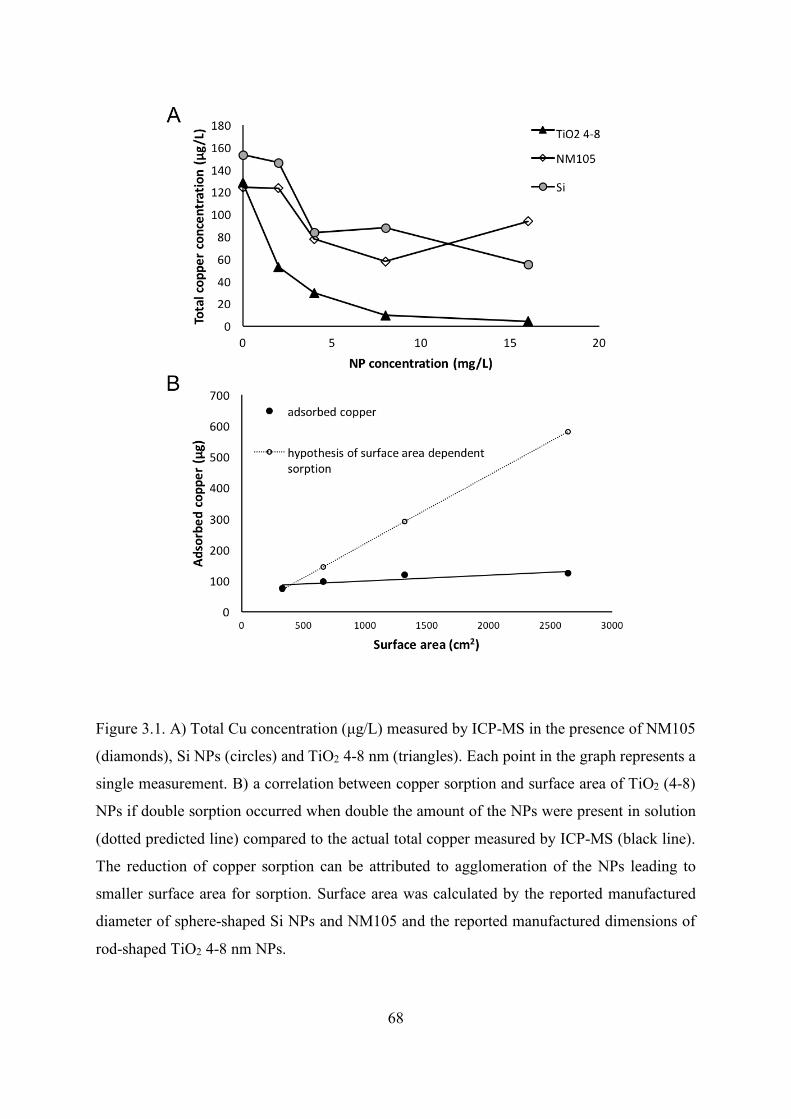
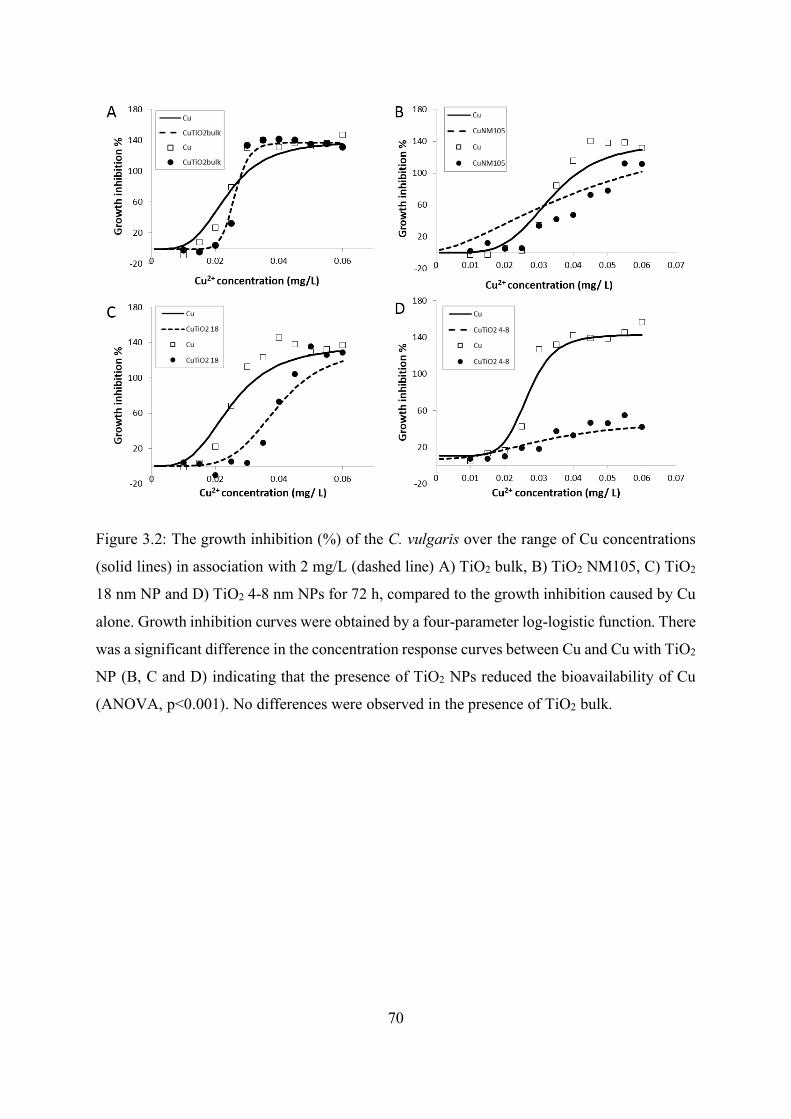
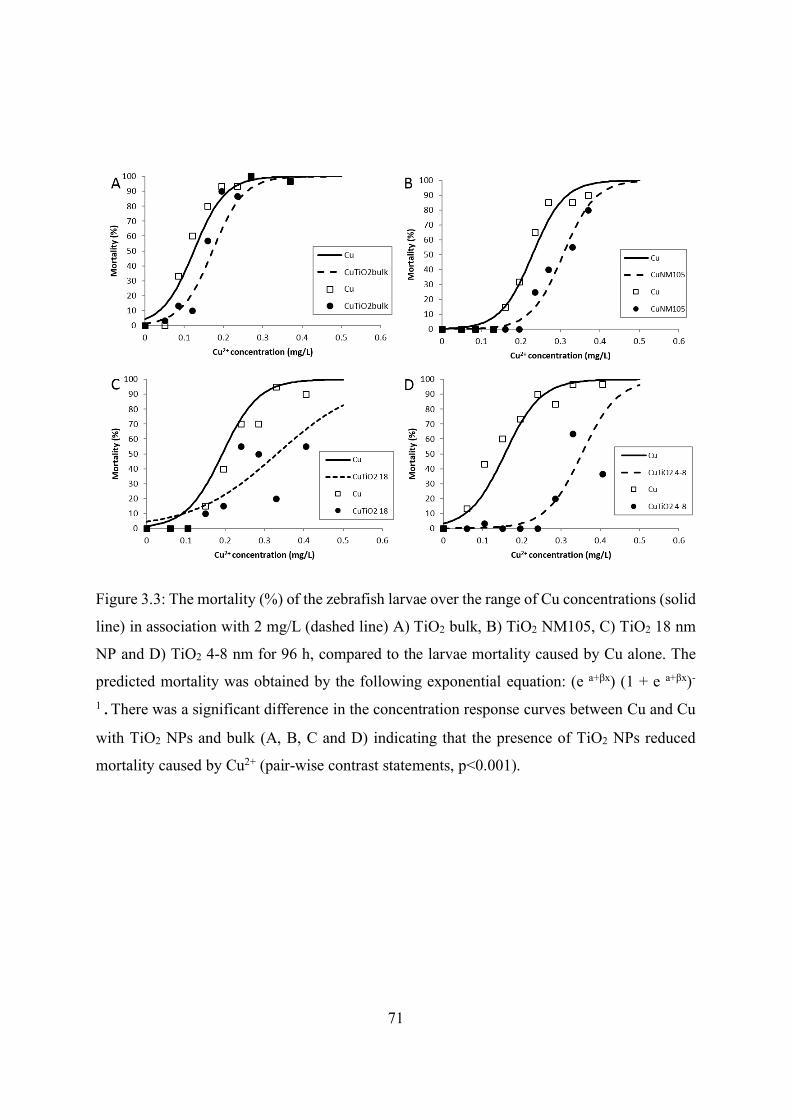
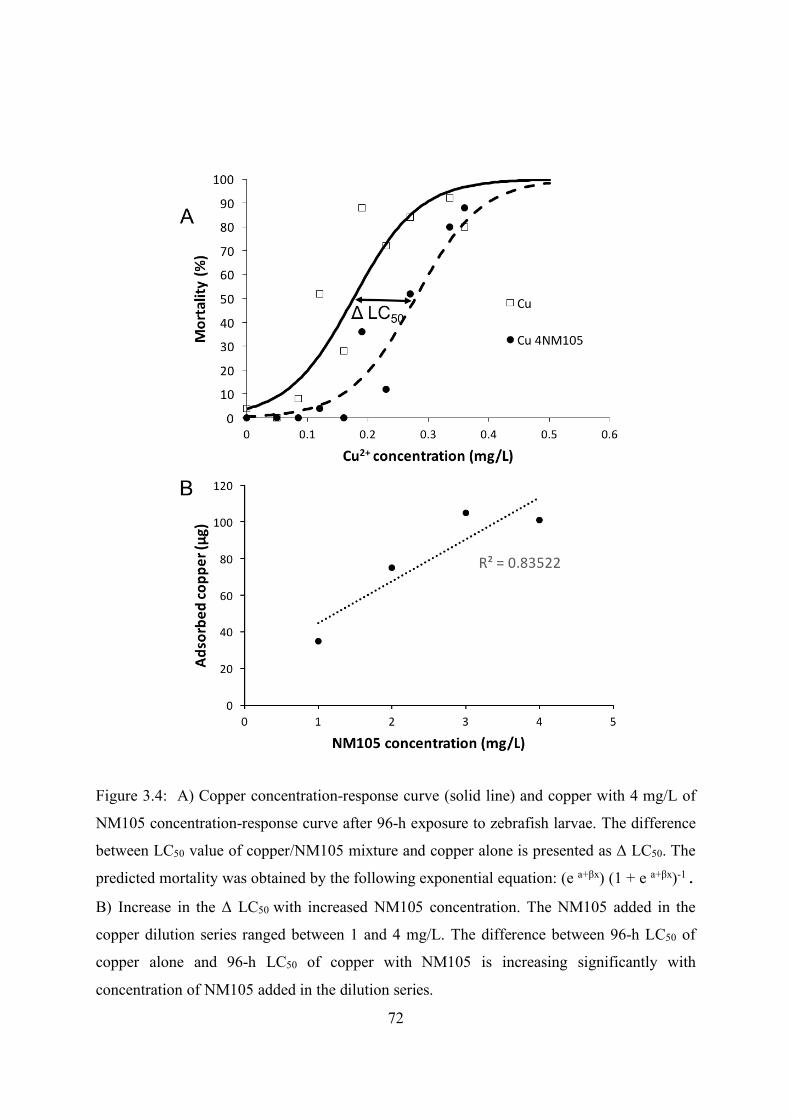
zebrafish. The presence of TiO2 NPs reduced total Cu in the water column and Cu
bioavailability (measured by growth inhibition, mortality, and metallothionein 2 (mt2) gene
expression) suggesting Cu sorption to TiO2 NPs. Less Cu was bioavailable when smaller TiO2
NPs were present, indicating higher sorption capacity with increasing surface area. This is
supported by a lower total Cu in the water column, less inhibition of C. vulgaris growth, less
mortality and lower levels of mt2 gene expression in zebrafish larvae making the surface area
the most important factor affecting sorption demonstrated in the present study. Copper
concentration in medium significantly decreased with increased Si NPs concentration
measured by analytical chemistry, but no significant sorption was indicated on perovskite NPs.
The results of this study strengthen the relevance of bioavailability as an analytical tool to
assess the sorption of chemical substances on NPs in the aquatic environment.
3.2 Introduction
The low cost and increasing applications of nanotechnology leads to greater production and
release of engineered nanoparticles (NPs) into the aquatic environment. The term engineered
NPs is used to identify materials that have all three dimensions in the nanoscale (ISO, 2008),
which frequently confers unique physicochemical properties that are attributed to their
nanoscale size. A consequence of the increased use of NPs has been increased release of NPs
into the environment, and estimated concentrations of NPs (e.g., Ag-NPs) are at part per billion
58
range in some surface waters (Gottschalk et al., 2013; Sun et al., 2014). Within the aqueous
phase, some of the unique properties of NPs persist and these properties influence NP
environmental fate, interactions with other substances, and potential toxicity. Changes in NP
physicochemistry can occur in the aqueous phase, including release of ions, sorption of
chemical substances to NPs, agglomeration of NPs with other substances and/or particles,
and/or changes in NP surface chemistry (e.g., oxidation or changes of coating) (Petersen et al.,
2014).
Chemical substances can adsorb to the surface of NPs or absorb within the NP matrix and
sorption is dependent on the physicochemistry of both substance and NP. In the aqueous phase,
sorption [defined as the taking up and holding of one substance by another (Dabrowski, 2001)]
can be related to NP surface charge, surface area, the NP matrix, and characteristics of NP
agglomerates, among other factors. Based on chemical analyses of NPs, copper, lead and zinc
were found to have high affinity for SiO2 NPs, and sorption was strongly affected by the ionic
strength of the solution (Liang et al., 2011). In the aqueous phase, sorption of copper to TiO2
NPs reduced the total copper concentration in the water column after centrifugation of mixtures
(Fan et al., 2016) and the amount of copper adsorbed increased with percentage of anatase
within TiO2 NPs (Kim et al., 2003). Both anatase and rutile crystalline NP structures adsorbed
copper, but the sorption of copper to rutile TiO2 was four times lower than to anatase TiO2 NPs
(Rosenfeldt et al., 2015).
A challenge for research on NP sorption is that analytical methods applied can disturb the
processes under investigation and innovative techniques are required to obtain results that are
useful for interpretation. Upon sorption of toxicants (termed here “co-contaminants”) to NPs,
bioavailability of the co-contaminants can be enhanced (Henry et al., 2013; Schwab et al.,
2013) or reduced (Li et al., 2016b; Park et al., 2010), and changes in bioavailability can inform
on NP physicochemistry in the aqueous phase. One definition of bioavailability is the
proportion of a substance that enters an organism to react with biological molecules (Semple
et al., 2004), and the molecular response of the organism can indicate changes in substance
bioavailability that occur upon sorption with NPs. Aqueous-phase sorption to (C60)n
agglomerates decreased 17 α-ethinyl estradiol (EE2) bioavailability in zebrafish larvae, which
was detected by reduction in vitellogenin gene (an EE2 responsive gene) expression (Park et
al., 2010). On the contrary, sorption of Hg2+ to (C60)n agglomerates led to increased
bioavailability of Hg2+ in zebrafish larvae (Henry et al., 2013). The EE2 was presumed to be
59
absorbed within the (C60)n agglomerate matrix, whereas more labile sorption of Hg2+ to (C60)n
agglomerate surfaces was postulated based on the different co-contaminant
physicochemistries. The presence of TiO2 NPs and sorbed As (V) enhanced the As (V) uptake
in Daphnia magna compared to exposure to As (V) alone. Specifically, double the amount of
As (V) was measured by mass spectrometry mainly in D. magna gut in the presence of 2 mg
Ti /L (equivalent to 3.35 mg/L TiO2 NPs) and five-times the amount of As was measured in
the presence of increased TiO2 NPs concentration (20 mg Ti /L or 33.5 mg/L TiO2) (Li et al.,
2016a). Rosenfeldt et al., (Rosenfeldt et al., 2014) observed a 2-fold increase in Ag body
burden and 6-fold increase in As body burden in D. magna in the presence of 2 mg/L TiO2
NPs, when compared to exposures to each heavy metal alone. These results with Daphnia
suggest that TiO2 NPs acted as a vehicle and increased bioavailability of Ag and As; however,
in the same study, the presence of TiO2 NPs reduced Cu body burden in Daphnia, indicating
differences in sorption among adsorbates.
The potential of organism-based bioavailability tests to contribute to understanding of NP
sorption processes in the aqueous phase should be applied to comparative studies with different
NPs to clarify differences in NP physicochemistry. The objective of the present study was to
use differences in copper sorption, detected by changes in copper bioavailability, to inform on
differences in NP physicochemistry in the aqueous phase. Nanoparticles selected were TiO2
NPs (4-30 nm diameter), spherical silicon (Si) NPs, and organo-metal perovskite cell NPs. Two
organisms with different exposure conditions, (i.e. direct exposure of green alga Chlorella
vulgaris to constantly agitated NP solution compared to indirect static exposure of larval
zebrafish to NPs) were used to identify changes in copper bioavailability. Copper
bioavailability was based on examination of the effect of copper on C. vulgaris growth and on
survival and metallothionein 2 (mt2) gene expression in larval zebrafish.
3.3 Materials and Methods
3.3.1 Chemicals
The TiO2 particles were used for the following experiments: TiO2 bulk (NM100) of a primary
size 200-220 nm and anatase crystal structure, TiO2 NM105 (JRCNM01005a) with a
manufactured size of 30 nm diameter and an anatase : rutile ratio of 85:15; TiO2 NPs with
manufactured size of 18 nm anatase and TiO2 NPs with manufactured size of 4-8 nm anatase
60
provided by PlasmaChem, Germany (Table 3.1). The silicon (Si) NPs were synthesised
composed of monosilane (SiH4) with different percentages of diborane (1, 1.5, 2 or 2.5 %) and
a primary size of 100 nm; they were provided by the Institute of Energy and Environmental
Technology, Duisburg, Germany. Lead iodide perovskite NPs (CH3NH3PbI3) were provided
by the École Polytechnique Federal de Lausanne, Switzerland. Aqueous stock suspensions of
powdered NPs were prepared in Milli-Q water (grade 18.2 MΩ cm; Millipore, Livingstone,
UK) at concentrations of 1-5 g/L. Stock preparations of TiO2 NPs were sonicated twice for 8
minutes (Jacobsen et al., 2010) and the Si and perovskite NPs were sonicated for 1 min
according to recommendations provided by the manufacturers. Determination of average size
(hydrodynamic diameter) and surface-related charge (ζ-potential) of NPs in suspension (milli-
Q water) was conducted by Dynamic Light Scattering (DLS) at a concentration of 100 mg/L.
The co-contaminant used was CuSO4·5H2O and purchased from Sigma-Aldrich (lot#:
SLB4752V) with purity >98.0%.
Table 3.1: The list of nanoparticles (silicon, boron doped silicon, Perovskites, TiO2) that have
been employed for Cu sorption to NPs experiments. The average size and charge (ζ-potential)
of the NPs suspended in Milli-Q H2O, measured by Dynamic Light Scattering (DLS).
Sample Label
Material Shape Size (d. nm) ± SD
ζ -potential (mV)
SiB2.5% B (2.5%) doped Si
Nano-sphere 303±125.8 -28.8
SiB2% B (2%) doped Si
Nano-sphere 337.9±141 -28.7
SiB1.5% B (1.5%) doped Si
Nano-sphere 384±197.4 -30.3
SiB1% B (1%) doped Si
Nano-sphere 388±174.1 -27.3
Si Si Nano-sphere 447±155.6 -17.3 Perovskite CH3NH3PbI3 Nano-cube 141.6±30.85 -13.1 TiO2 bulk anatase 404.2 ± 11.9 -51 TiO2 JRCNM01005a
identified a positive relationship between copper sorption and surface area of NPs, using a wide
range of NPs of different physicochemical properties. The close similarity of the slopes of the
sorption (%), as identified by each methodology, in relationship to NP surface area (Figure 3.6)
suggest increasing sorption with surface area (calculated after the reported manufactured
particle diameter), that can establish the surface area as the strongest factor affecting sorption
in the present study. Accepting a linear relationship of sorption with surface area, the highest
intercept potentially indicates highest copper sorption capacity of the NPs that is identified by
each methodology or organism used. Therefore, the data provided by Cu bioavailability in the
presence of NPs using two model organisms with different exposure approaches, the zebrafish
75
larvae mortality and growth inhibition of C. vulgaris, can inform effectively on sorption
capacity of the NPs compared to sensitive gene expression and ICP-MS analyses after a 24-h
exposure. Without having investigated the underlying mechanisms of metal ion sorption on
NPs, taken together the findings of the present study indicate that sorption of copper can differ
between different materials with the same surface charge (i.e. Si, perovskite and TiO2 NPs) or
between different physicochemical properties of the same material (e.g. TiO2 NPs of different
size). This study finally demonstrates the importance of bioavailability as a unique evaluation
tool of the direct effect of sorption of copper on NPs contributing to an environmentally
relevant assessment of the impact of NPs in the aquatic environment.
Figure 3.6: Representation of Cu sorption (%) as indicated by four independent analyses,
conducted in the present study, show a positive correlation with the surface area (calculated by
the reported manufactured particle diameter) of the NPs used in the present study (cm2). The
differences in the 72-h EC50 (Δ 72-h EC50) of Cu exposure with and without NP using C.
vulgaris tests, the Δ 96-h LC50 of the zebrafish larvae Cu exposure with and without NPs, the
differences in mt2 gene expression and the analytical chemistry (ICP-MS) generated curves
with R2: 0.90, 0.88, 0.81 and 0.99, respectively.
-20
0
20
40
60
80
100
120
140
160
0 50 100 150 200 250 300 350
copp
er s
orpt
ion
(%)
Surface area (cm2)
zebrafish 96-h LC50
algae growth inhibition 72-h EC50
ICP-MS
mt2 gene expression
76
Chapter 4 - Investigation of Eco-Toxicity of Perovskite Nanomaterials in
Aquatic Organisms.
4.1 Abstract
Lead-halide perovskite nanoparticles (NPs) is a new technology with high potential in
photovoltaic industry. The investigation of ecotoxicity of lead-halide perovskite NPs is of great
importance due to the potential of lead (Pb) dissolution in the aquatic environment. Parallel
exposures of perovskite NPs and Pb ions to Chlorella vulgaris and zebrafish investigated the
relationship of perovskite NP toxicity and Pb ion dissolution. Specifically, the aqueous
perovskite NPs concentration – response curves of growth inhibition of C. vulgaris, mortality
and metallothionein 2 (mt2) gene expression in zebrafish larvae did not differ from Pb ions
concentration – response curves. Adult zebrafish were fed diets containing perovskite NPs or
lead nitrate (500 µg Pb ions per gram of food) for 14 days. Induction of mt2 expression in liver
tissues showed Pb bioavailability after exposure to perovskite-spiked feeds. Changes in
zebrafish gut microbiome were revealed by terminal restriction fragment length polymorphism
(tRFLP) and sequencing of 16S rRNA of the gut bacteria after Pb exposure that can have an
indirect effect in the organism health. The aqueous and dietary exposures demonstrated Pb
toxicity in C. vulgaris and zebrafish after perovskite NP exposures and induction of mt2
expression in zebrafish larvae and liver tissue but perovskite NP-spiked feeds did not affect the
gut microbial community.
4.2 Introduction
Alkali metal halides (perovskites) technology is growing in the energy industry with promising
potential and opportunities. Perovskites are coloured and three-dimensional materials, with a
crystal structure ABX3 whose optical and electronic properties have been discovered for thirty
years (Grätzel, 2014; Hoefler et al., 2017). Perovskite technology is expected to exceed the
currently well-established silicon-based one and perovskites are characterised as next
generation solar cell materials due to their low cost and high-power conversion efficiency (Lee
et al., 2012). Most suitable metal cation used for perovskites nanoparticles (NPs) that leads to
the highest efficiency of the material, is lead (Pb), however, few studies have been investigating
77
the stability of the perovskite cell and its suitability for outdoor applications and their
environmental risks have not yet been evaluated.
The release of metal ions from metal NPs is an issue that has been concerning the scientific
community for the last decade. Nanoparticles possess a number of unique properties such as a
high surface to volume ratio, that increases the surface interaction with the surrounding
environment and, in turn, increases the potential of metal ion release (Petersen et al., 2014).
For instance, in the case of silver (Ag) NPs, it is still unclear whether the toxicity of the particles
can be attributed to the Ag+ release, the Ag NPs or a combination of both. In fish, evidence
supports that the toxicity of Ag NPs is mainly caused by the silver ions (Griffitt et al., 2009;
Jang et al., 2014) although this is not the case for all aquatic species and exposure conditions
(Griffitt et al., 2009; Jang et al., 2014; Kalman et al., 2015).
The chemical reactions of perovskite materials in the aqueous phase can lead to release of the
metals and cause subsequent toxicity in aquatic organisms. Stress factors such as UV radiation,
oxygen or high temperatures, can initiate degradation processes of the metal halide perovskite
materials (Aristidou et al., 2015; Han et al., 2015) and the use of lead as the metal component
of the perovskite cells increases the awareness and risk from the toxicological and
environmental point of view. An X-ray electron spectroscopy scan showed that PbI2 and SnI2
were the main by-products of full degradation of pristine perovskite particles containing Pb or
tin (Sn) that were heated at 200 oC in air for 30 min, respectively (Babayigit et al., 2016). The
same study investigated the acute toxicity of PbI2 and SnI2 in zebrafish embryos in a low
hardness fresh water medium (E3 medium) and after dissolving the metal halides in dimethyl
sulfoxide (DMSO). PbI2 was found less toxic in zebrafish embryos (4 days post fertilization,
dpf) with a median lethal concentration (LC50) of 0.382 g / L) compared to SnI2 which toxicity
was mainly attributed to reduction in media pH (Babayigit et al., 2016). No studies have been
conducted up to date using Perovskite nanomaterials in zebrafish larvae.
The dietary exposure to metals is an important route of exposure and accumulation and toxicity
of metals in fish (Meyer, 2005). Lead, a well-known environmental contaminant and
neurotoxin, has been shown to be available to fish for uptake through dietary exposures.
Specifically, physiological and morphological changes that have been noticed after Pb-spiked
dietary exposure were damages in enterocytes (Crespo et al., 1986) and accumulation in body
and intestinal tissues (Alves and Wood, 2006; Mount et al., 1994) with no effects on survival
or growth. Heavy metals, and specifically Pb, can inhibit the activity of ALA-D (δ-
78
aminolevulinic acid dehydratase) or induce the activity of metallothionein (MT) proteins and
both ALA-D and MT have been commonly used as biomarkers after Pb exposure (Johnson,
1998; Wang and Fowler, 2008).
The expected increasing application of the perovskite technology and the potential of ion
leaching out of metal NPs leads to an urgent need to investigate perovskite NPs toxicity in the
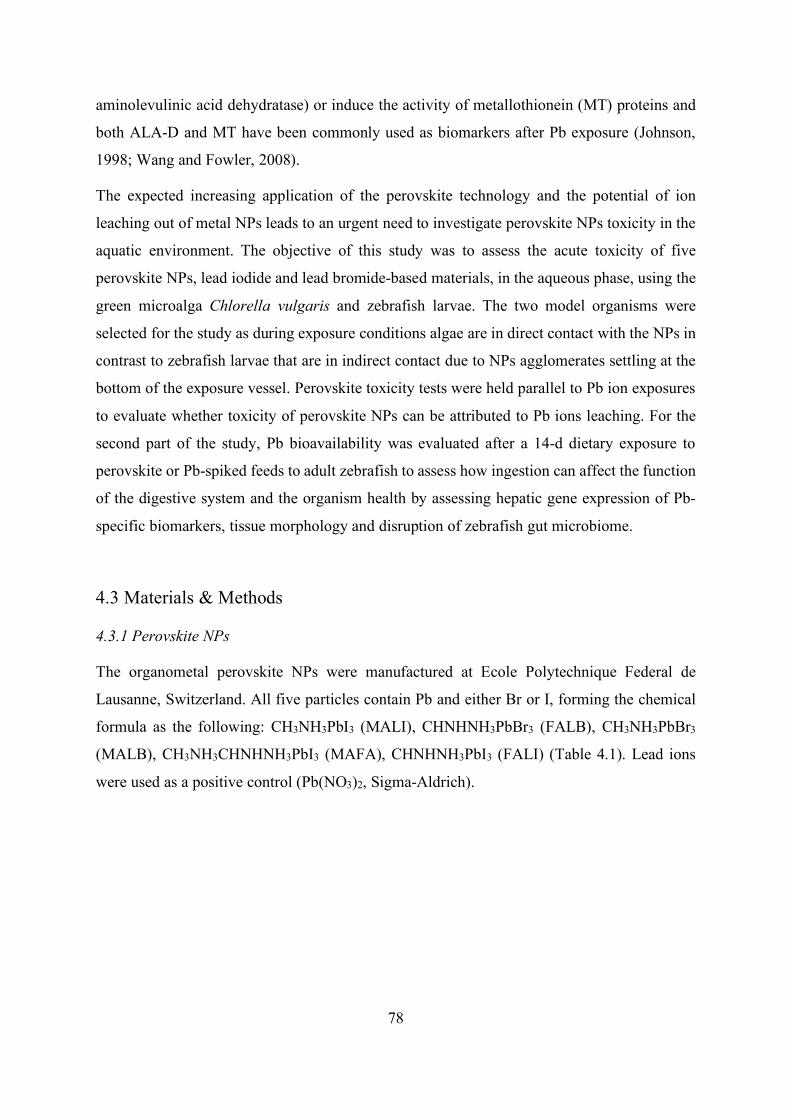
aquatic environment. The objective of this study was to assess the acute toxicity of five
perovskite NPs, lead iodide and lead bromide-based materials, in the aqueous phase, using the
green microalga Chlorella vulgaris and zebrafish larvae. The two model organisms were
selected for the study as during exposure conditions algae are in direct contact with the NPs in
contrast to zebrafish larvae that are in indirect contact due to NPs agglomerates settling at the
bottom of the exposure vessel. Perovskite toxicity tests were held parallel to Pb ion exposures
to evaluate whether toxicity of perovskite NPs can be attributed to Pb ions leaching. For the
second part of the study, Pb bioavailability was evaluated after a 14-d dietary exposure to
perovskite or Pb-spiked feeds to adult zebrafish to assess how ingestion can affect the function
of the digestive system and the organism health by assessing hepatic gene expression of Pb-
specific biomarkers, tissue morphology and disruption of zebrafish gut microbiome.
4.3 Materials & Methods
4.3.1 Perovskite NPs
The organometal perovskite NPs were manufactured at Ecole Polytechnique Federal de
Lausanne, Switzerland. All five particles contain Pb and either Br or I, forming the chemical
formula as the following: CH3NH3PbI3 (MALI), CHNHNH3PbBr3 (FALB), CH3NH3PbBr3
(MALB), CH3NH3CHNHNH3PbI3 (MAFA), CHNHNH3PbI3 (FALI) (Table 4.1). Lead ions
were used as a positive control (Pb(NO3)2, Sigma-Aldrich).
79
Table 4.1: The perovskite NPs used for the present study, the chemical type and molecular
weight of each particle, along with the percentage of Pb that each NP contains.
Name Chemical type Molecular
weight (g/mol)
Pb2+ (%) Experiments conducted
MALI CH3NH3PbI3 619.9785 33.42 C. vulgaris and zebrafish acute
toxicity tests, dietary exposure
FALI CHNHNH3PbI3 632.9772 32.73 C. vulgaris and zebrafish acute
toxicity tests
MALB CH3NH3PbBr3 478.9770 43.26 C. vulgaris and zebrafish acute
toxicity tests, dietary exposure
FALB CH3NHNH3PbBr3 491.9758 42.12 C. vulgaris and zebrafish acute
toxicity tests, dietary exposure
MAFA CH3NH3CHNHNH3PbI3 665.0422 31.16 C. vulgaris and zebrafish acute
toxicity tests
4.3.2 Aqueous acute toxicity tests
Algal growth inhibition assays were performed in glass 250-ml Erlenmeyer flasks according
to the OECD test guideline (OECD 201) in the exponential growth phase. Temperature and
light conditions for toxicity tests were identical to those used for culture growth. Experiments
were carried out in triplicate. The initial concentration of the inoculum was 104 cells per ml,
which was required to ensure exponential growth. Cell density was determined at 0, 24, 48 and
72 h of exposure by measuring in vitro fluorescence of acetone-extracted chlorophyll a
(Kalman et al., 2015). The exposure concentrations ranged between 5 and 200 mg/L for
perovskites NPs. The detection of reactive oxygen species is based on the fluorescence of the
probe 2, 7 dichlorofluorescein diacetate (H2-DCF-DA) and conducted by fluorescent plate
reader (Molecular Devices SpectraMax M5) using excitation wavelength at 488 nm and
emission wavelength at 525 nm at the same time points. For the reading, black 96-well plates
were used, 250 µl of each flask were added per well in triplicates at 72 h after the start of the
80
exposure. DCF (10 µl) diluted in ethanol (180 mg/L) was added per sample in the dark and the
plate was kept in dark conditions for 1 h till the fluorescence measurement.
For the zebrafish acute toxicity tests, 72 hpf larvae were used. The duration of the exposure
was 96 h and it was conducted in 96-well plates. One larva was placed per well and the well
final volume was 200 µl. Ten wells were used per treatment and six treatments per plate. The
electrolyte composition of system water was: 79.38, 12, 17 and 2 mg/L of [Ca2+], [Mg2+], [Na+]
and [K+], respectively. The larvae were observed under the dissection microscope daily and
mortality was recorded. The plates were kept at 28±1 oC throughout the exposure duration.
For the mt2 gene expression study 15-20 larvae were exposed for a 24-h period in static
solutions in glass beakers of total volume of 20 ml. The concentrations of particles ranged
between 0 and 80 mg/L of the Pb the perovskite particles contain according to molecular weight
(Table 4.1). Samples of the aqueous solutions at the end of the exposure were collected for Pb
detection.
4.3.3 Dietary exposure
Wild type zebrafish were obtained from the zebrafish facility, Charles River laboratories
(Tranent, UK), and fish were treated humanely in accordance with the regulations on animal
use in UK. Adult fish (6-month old) were used for the dietary exposure experiment, of an
average wet weight of 606 mg and fork length of 37.9 mm, were kept in recirculating biological
systems with a 12:12 light:dark photoperiod. The electrolyte composition of system water was:
79.38, 12, 17 and 2 mg/L of [Ca2+], [Mg2+], [Na+] and [K+], respectively.
The zebrafish fish food was purchased from ZM systems, Winchester, UK, and it consists of
52% protein, 12% oil, 10.3% ash, 1% fibre, vit A: 25,000 I.U./Kg, vit D3: 2,500 I.U./Kg, vit
E: 300 mg/Kg, vit C: 300 mg/Kg. For the preparation of experimental feeds, Milli-Q water was
added on dry food pellets, enough to create a thick mixture with pellets be no longer
distinguishable. For the food with Pb, the water used to prepare the mixture contained the
appropriate amount of Pb dissolved from Pb(NO3)2. The pellets were formed using a steel mesh
with a hole size of 0.915 mm and were put to dry at room temperature for 24 h and finally
stored at -20 oC.
81
Treatment food was prepared as follows: control, and 500 µg/g of Pb2+ that lead nitrate and the
three perovskite particles contain according to molecular weight (0.8 mg Pb(NO3)2 per g of
food; 1.496 mg perovskite MALI per g of food; 1.1872 mg perovskite FALB per g of food;
1.155 mg perovskite MALB per g of food). During the two days of acclimation period, all fish
were fed control food. Measurements of pH and total ammonia were conducted daily (pH:
7.41-7.88 and unionised ammonia levels were at all times below 0.08 mg/L). The exposures
were static with air supply, 50% of water was replaced twice daily and the average dissolved
oxygen concentration was 8.24 mg/L. Fish were observed during feeding and all food was
consumed. The exposure of experimental diets continued for 14 days. Before sampling the
weight and fork length (from the tip of the snout to the middle of the caudal fin) of each fish
were measured and the sex and condition of the gut (empty, half full or full) were recorded
(Appendix C). Zebrafish were sacrificed with an overdose of tricaine methanesulfonate (MS-
222) (Sigma Aldrich).
Liver samples were extracted at 0, 48 and 96 h of exposure from 2 fish per tank and stored at -
80oC for RNA extraction. At 14 d after the start of the exposure the zebrafish liver and digestive
tract was removed aseptically, placed immediately in liquid nitrogen and stored at -80 oC for
further analyses. A whole fish per tank was fixed in 10% neutral buffered formalin solution for
histological analyses. Sampling occurred at all times before first feeding. Water samples were
collected during the 14-d exposure period for Pb detection by ICP-MS/OES.
4.3.4 Measurements of Pb by analytical chemistry
Aqueous phase Pb concentrations were determined by inductively coupled plasma mass
spectrometry (ICP-MS, Agilent 7500ce, School of Chemistry, University of Edinburgh) to
investigate leaching of Pb from perovskite NPs and lead nitrate in the aqueous exposures of
zebrafish larvae and leaching of Pb from perovskite and lead nitrate-spiked food pellets in the
aquaria during the 14-d dietary exposure. Samples (10 ml) from the water column were
collected during the zebrafish acute toxicity tests, without disturbing the bottom of the beakers
and the settled NP agglomerates. Samples were then acidified with 15% nitric acid (trace metal
grade) for measurement of total Pb in the water column.
Sub-samples (n = 5 of approximately 0.5 g) of each diet were accurately weighed into acid-
washed glass beakers and 5 mL trace-analysis grade HNO3 (Primar Plus™, for Trace Metal
82
Analysis, Fisher, UK) added. The beakers were then covered with a watch glass and after
incubation for 1 h to digest easily oxidised material, the acid was then heated to boiling and
simmered for a further 1 h on a hot plate. Once cooled, digests were decanted through filter
paper (Whatman, UK) into acid-washed volumetric flasks and made up to volume with 2%
HNO3 prepared in ultrapure water (ELGA). Samples (n = 3) of similar mass of a fish protein
certified reference material (DORM-3, National Research Council of Canada) and procedural
blanks (digests performed as described above but without solid material added to beakers) were
also prepared as described above. Concentrations of total Pb in diets were then measured in
digests using ICP-MS (low expected Pb concentrations, control, DORM-3 and procedural
blanks; Thermo Electron Corporation X-Series II quadruple ICP-MS) and ICP-OES (Pb-spiked
diets; Varian 725-ES, Agilent Technologies Inc.) and compared to matrix-matched elemental
standards. The mean measured concentrations of Pb in the procedural blanks were < 1 µg/L.
Measured Pb concentrations in DORM-3 were 0.33 ± 0.04 µg/g compared to certified values
of 0.40 ± 0.05 µg/g.
4.3.5 Gene expression analysis
Total RNA was extracted from larvae 96 hpf (15-20 larvae per replicate) or liver samples using
RNeasy MiniKit for animal tissue, Qiagen, West Crawley, UK as previously described (Boran
et al., 2016). Briefly, zebrafish larvae were homogenized with a pestle, a DNase treatment
(Qiagen) was included as a step during the extraction process remove DNA to prevent sample
contamination from DNA, and the RNA was eluted in 30 µL of RNase/DNase free water. The
concentration of the total RNA was measured using NanoDrop Spectophotometer (ND-2000)
and all samples were diluted to a final concentration of 100 ng/µL. cDNA was synthesised
using Precision nanoScript2 Primer design kit with the following conditions: annealing at 65 oC for 5 minutes, extension at 42 oC for 20 minutes and inactivation of the reaction for 10
minutes at 75 oC. The cDNA was stored at -20 oC until the gene expression analysis.
Primers designed for zebrafish from Primer BLAST (NCBI) for the following genes: mt2
TCACTCCCTGATGTCTGGGTCGT). Precision PLUS Mastermix with SYBRGreen, Primer
Design, was used for the quantitative Polymerase Chain Reaction (q PCR). Fluorescence was
detected after 40 two-step cycles of 95oC denaturing temperature, primer specific annealing
temperature and extension step 60 oC by OneStep Real Time System (Applied Biosystems,
Warrington, UK). The efficiency of the qPCR was calculated (! = 10(&'
()*+,) − 1) based on a
4-point standard curve. Efficiencies between 0.9 and 1.1 were accepted for further analyses.
4.3.6 Assessment of gut microbiota
The bacterial communities of the gut were identified by using a sequencing-based technique
for rapid profiling, the terminal restriction fragment length polymorphism (tRFLP) analysis of
16S rRNA genes. The DNA of 64 samples was extracted from the whole GI tract using DNeasy
blood and tissue kit (Qiagen), including treatment with proteinase K. Following that, the 16S
rRNA gene was amplified using PCR with the primer pair: labelled (6FAM) 63f (Marchesiet
al., 1998) and 530r (Lane, 1991). Amplification was conducted using 2 µl of template DNA
and 0.5 µl bovine serum albumin (BSA; Ambion) in a 50 µl reaction mixture of Taq PCR
mastermix kit (QIAGEN). The DNA used for PCR was 100-fold dilution of initial DNA to
minimise effect of PCR inhibitors. The PCR conditions were as follows: initial denaturation
for 90 s at 94 °C followed by 30 cycles of 15 s at 94 °C; annealing for 30 s at 56 °C; elongation
for 30 s at 72 °C; and a final elongation step for 10 min at 72 °C. The PCR products were
verified on a 1 % (w / v) agarose gel by electrophoresis. Purified PCR products were quantified
using a Nanodrop spectrophotometer (NanoDrop 2000). ExoSAP-IT (Thermo Scientific) was
used to purify the amplified samples, 5 µl of PCR samples were mixed with 2 µl of reagent,
incubated for 15 min at 37 °C to activate the exonuclease and then 15 min at 80 °C to de-
activate the enzyme. The digested product was analysed by GeneWiz, ML, USA, using Liz
500 size standard. The electropherograms were then analysed by the GENEMARKER software
(SoftGenetics, PA, USA), using manually created bins. Peaks of less than 50 nucleotides length
or having intensity of less than 50 units were not included in the analysis.
Nested PCR of DNA samples were prepared for MiSeq (Illumina) analysis. Amplification of
8F to 1492R region of 16S rDNA using HotStart PCR mastermix kit (ThermoFisher), were
84
carried out under the following PCR conditons: 96 oC for 1 min, 30 cycles of 96 oC for 30 sec,
50 oC for 30 sec, 72 oC for 30 sec, and 1 cycle of 72 oC for 3 min, prior to a secondary
amplification of the V4 region with Golay barcoded 515F and 806R primers according to the
Earth Microbiome protocol (Earth Microbiome Project, 2016). The PCR products were
purified using GFX PCR DNA and Gel Band Purification kit (GE Healthcare). Concentration
and quality of barcoded amplicons were evaluated using NanoDrop and 240 ng of each sample
were pooled together and sent to Edinburgh Genomics (Edinburgh, UK) for next generation
Illumina MiSeq sequencing. The operational taxonomic unit (OTU) identification was
conducted using the Mothur pipeline (Schloss et al., 2011) and Silva ribosomal RNA database.
4.3.7 Histological analysis
One fish per aquarium was fixed in 10 % formalin and further dehydrated through ethanol,
Histo-Clear II (National Diagnostics Inc., UK), and paraffin. The tissues were embedded in
paraffin wax and then mounted on slides (8 mm sections). The transverse section selected were
between the level of the heart and the end of the gastro-intestinal (GI) tract. The sections were
stained with haematoxylin for 5 min and eosin for 5 min followed by thorough water washes.
4.3.8 Statistical analyses
The algal growth inhibition (dependent variable) and Pb concentration (independent variable)
relationship, were modelled using a concentration-response model for algae, by ‘drc’ package
in R. Mortality (dependent variable) of zebrafish larvae was modelled by logistic regression
according to the independent variable of Pb concentration. The logistic regression models were
generated by iterative maximization of the likelihood function. The median lethal concentration
(LC50) and effective concentration (EC50) were calculated by the logistic regression model and
the 95% confidence interval (CI) was calculated using the logit model in R statistics. For the
gene expression analyses, the relative fold change (dependent variable) was modelled by
general linear model according to the independent variable of Pb concentration (p-value of
<0.05). Concentration-response statistical analyses were conducted using R statistics (version
3.2.1, RStudio, Inc., 2015).
85
The gut microbiota community composition within the 5 different treatments was analysed by
non-metric multidimensional scaling (NMDS), based on Bray-Curtis similarities after square
root transformation. Bacterial diversity was assessed using Shannon-Wiener’s diversity Index
(H-index) on the 13 tRFLP peaks and 396 bacterial phylla identified by illumine MiSeq
analysis. Bray-Curtis similarities were plotted against food treatments to examine community
treatment - response relationships. Permutational multivariate analysis of variance of sums of
squares (PERMANOVA) was used to test for statistically significant differences between the
bacterial communities of the control diets and Pb and NPs spiked diets. The numerical analyses
for the gut microbiota data were conducted using PRIMER-E (v.7 PRIMER-E Ltd, Plymouth
Marine Laboratory, Plymouth, UK).
4.4 Results and Discussion
A positive concentration – response relationship was observed after Pb or perovskite NPs
exposure to C. vulgaris. Specifically, a 72-h EC40 of 99 mg/L was observed after Pb ions
exposure to C. vulgaris, MALB showed similar toxicity with Pb with a predicted 72-h EC40 of
194 mg/L (equivalent to 84 mg/L Pb ions as seen in Figure 4.1). The rest of perovskite NPs,
FALI, FALB, MAFA and MALI once converted to Pb ion concentration according to
molecular weight, caused similar and less growth inhibition to C. vulgaris after 72-h exposure
when compared to MALB NPs or lead nitrate (Figure 4.1), suggesting that the observed acute
toxicity can be caused by Pb ion release. The MALI, FALB and MAFA NPs were found to
cause less growth inhibition and the predicted 72-h EC20 for FALI was found at 199 mg/L of
FALI NPs that is equivalent to 65 mg/L of Pb ions. The outcome of the Pb toxicity in C.
vulgaris is in agreement with previous research where significant reduction (66 %) in
chlorophyll α (Chl α) levels was observed in C. vulgaris after 72-h exposure to 80 mg/L of Pb
(Zhang et al., 2013) and in the present study a reduction of 45 and 82 % at Chl α levels was
observed at 62 and 125 mg/L of Pb, respectively. The differences in perovskite NPs toxicity
can be attributed to to different chemical type of perovskite NPs and different dissolution rates
in the aqueous phase.
86
Figure 4.1: Growth inhibition of C. vulgaris with Pb2+ concentration after 72-h exposure (black
circles). Plotted in the graph is the growth inhibition observed after MALI (diamonds), FALB
(squares), MALB (*), MAFA (triangles) and FALI (empty circles) perovskite NPs transformed
to Pb2+, according to molecular weight.
The intracellular ROS activity increased significantly with increased concentration of all
perovskite NPs. FALI and MAFA NPs reaching 2,300 and 1,652 relative fluorescence units at
the higher concentration tested that was similar to the levels of fluorescence after lead nitrate
exposure (1,685) while exposure to 200 mg/L of FALB perovskite NPs produced more than
four-times higher fluorescence (19,896 fluorescent units, as shown in Figure 4.2). The high
concentration of perovskite NPs (200 mg/L), up to which C. vulgaris was tested, is
considerably lower than environmentally relevant concentrations for perovskite NPs. No
environmental concentrations of perovskite NPs are reported in the literature, however, TiO2
NPs that are the most commercially used NPs (as reported in Chapter 1) has been estimated at
µg level in surface waters (Sun et al., 2014). This is the first study to conduct risk assessment
of lead-halide perovskite particles and inform on acute toxicity in green micro-algae.
-20
-10
0
10
20
30
40
50
60
0 0.02 0.04 0.06 0.08 0.1
Gro
wth
inhi
bitio
n (%
)
Pb2+ concentration (g/L)
LEAD FALI FALB MAFA MALB MALI
87
Figure 4.2: Relative fluorescence units of DCF after 72-h C. vulgaris exposure in perovskite
NPs (MALI, MALB, FALB, MAFA and FALI) in parallel to lead nitrate exposure up to 200
mg / L. Data have been normalised to cell number of each sample, mean ± SE, n=3, control
n=6.
Zebrafish larvae mortality and mt2 gene expression were significantly increased with Pb ions
increasing concentration, while Pb concentration showed an inverse relationship to ala-d
expression. The median lethal concentration (LC50) for Pb was 67 mg/L (CI 95%= 23 – 209)
for 96-h exposure of zebrafish larvae and when zebrafish larvae were exposed to a range of Pb
for 24 h, mt2 induced up to 50-fold after normalization to control exposure (R2= 0.91, Figure
4.4A) and ala-d decreased down to 0.65 (R2= 0.92, Figure 4.4C). Previous studies have
evaluated Pb toxicity in zebrafish embryos and have reported 95 % mortality after 96-h
exposure to 100 mg/L Pb ions (Peterson et al., 2011) and a 4-d LC50 of 382 mg/L for PbI2 in
zebrafish embryos (Babayigit et al., 2016). Lead ions water solubility and therefore Pb aqueous
toxicity are strongly dependent on the ionic strength of the exposure medium (Alsop and Wood,
2011). Specifically, in soft water medium 71 % of total Pb was found in dissolved ionic form,
while only 6.25 % of dissolved Pb ions were found in hard water medium (33 mg/L of Pb ions
-10000
-5000
0
5000
10000
15000
20000
25000
0 50 100 150 200 250Rela
tive
fluor
esce
nce
units
Concentration (mg / L)
LEAD
MAFA
FALI
MALI
FALB
MALB
88
nominal concentration). Peterson et al. (2011) also reported a 1.1-fold induction of mt2 after
72-h exposure to 0.1 mg/L of Pb, while western blotting revealed a 600% induction of mt2
protein levels. In the present study, the levels of mt2 gene were assessed after a 24-h exposure
and a 21-fold induction was observed after 24-h exposure of 10 mg/L Pb ion in 96-hpf larvae.
The differences between the two studies can be attributed to the differences in concentration
range, exposure period and developmental stage of zebrafish, however, these findings suggest
that mt2 is a relevant biomarker for Pb bioavailability in zebrafish. The loss of Pb ions in the
water column can explain the high LC50 values for zebrafish larvae and the variation in lead
toxicity among studies can be attributed to differences in hardness of the water medium.
Perovskite NPs toxicity followed similar patterns of zebrafish mortality and mt2 gene
expression as Pb ions. The LC50 for MALI and FALB NPs were estimated at 220 and 206 mg/L
in zebrafish larvae after a 96-h exposure, respectively, and when the MALI and FALB NPs
were converted to the equivalent amount of Pb (66.84 and 83.888 mg/L, respectively), a similar
pattern to Pb concentration - response was observed (Figure 4.3) that can be attributed to lead
dissolution of the perovskite NPs. Specifically, no differences were found between Pb(NO3)2
and MALI concentration-response curves, while FALB concentration did not cause higher
mortality than Pb. No mortality was recorded when larvae were exposed to MALB, FALI or
MAFA NPs up to 200 mg/L concentration which contain 86.5, 65.46 and 62.32 mg/L Pb,
respectively. When zebrafish larvae were exposed to MALI, MALB and FALB NPs for 24 h,
in parallel with Pb ions, mt2 expression was positively induced with increasing concentration
and no differences were observed among NPs or between NPs and Pb ions (GLM, p>0.05,
Figure 4.4B). The parallel exposures and the lack of significant differences between the
perovskite particles and the lead (II) nitrate mt2 expression suggests that the toxicity of
perovskite particles can be attributed to the presence of Pb in the perovskite particles. The ala-
d expression after a 24-h Pb or perovskite NPs exposure to zebrafish larvae showed inhibition
with increasing concentration and no significant differences were found among perovskite NPs
or between NPs and lead nitrate, however, high variation in expression was observed (Figure
4.4D). This is the first study to investigate mt2 and ala-d expression after lead-halide perovskite
particles after aqueous exposure.
89
Figure 4.3: Mortality of zebrafish larvae with Pb2+ concentration after 96-h exposure (black
circles and curve). Plotted in the graph is the mortality recorded after MALI (white diamonds)
and FALB (black squares) perovskite NPs transformed to Pb2+, according to molecular weight.
The predicted mortality was obtained by the following exponential equation: (e a+βx) (1 + e a+βx)-1. No mortality was observed after exposure to MALB, MAFA or FALI perovskite NPs
up to 200 mg / L of NPs. Statistical differences between curves were obtained by pair-wise
contrasts statements.
Hepatic mt2 expression was induced and hepatic ala-d was inhibited after dietary exposure to
both Pb and perovskite NP-spiked feeds. Both mt2 and ala-d expression differed significantly
between male and female fish (ANOVA, Tukey HSD, p<0.05), therefore the data are presented
in separated graphs. Both female and male liver mt2 levels exhibited significant differences
between 48-h exposure and 96-h or 14-d exposure, specifically, mt2 levels after lead nitrate-
spiked diet, induced an 8-fold in female liver at 48 h after the start of exposure (highest
induction observed in the present study), while down-regulation was observed at 96 h and 14
d of 0.4 and 0.38-fold, respectively (Figure 4.5). The FALB-spiked diet led to significant
induction of mt2 in female liver after 48-h exposure compared to fish fed with non-spiked diet,
while MALB and LEAD-spiked diets led to increased mt2 expression with high variation
between samples. No significant differences were observed in the male liver mt2 levels,
0
10
20
30
40
50
60
70
80
90
100
0 0.05 0.1 0.15 0.2 0.25
Mor
talit
y (%
)
Pb2+ concentration (g/L)
Pb(NO3)2
FALB
MALI
90
however, the LEAD, MALI and FALB treatments resemble similar pattern to the female liver
mt2 (Figure 4.5). Additionally, low dissolution of Pb was observed in the water of the aquaria
out of the Pb or perovskite-spiked feeds excluding the possibility of aqueous exposure to Pb
ions during the 14-d period and a Pb recovery of higher than 81 % was revealed by ICP in the
perovskite NP-spiked food pellets (Table 4.2). No differences were observed in hepatic ala-d
expression after 48-h dietary exposure across treatments, however, all perovskite NPs and lead
treatments showed inhibition of ala-d expression at the 96-h exposure period (Figure 4.5). At
the end of the dietary exposure (14 d), ala-d expression increased. Restoration of normal ala-d
values has been previously reported, specifically, in blood samples of Nile tilapia after a 9-d
exposure of lead (Dos Santos et al., 2016). Dietary exposure is a relevant scenario of NP
exposure to fish and other aquatic organisms and the present study is the first study to report
on dietary exposure to perovskite NPs in fish as well as Pb bioavailability after dietary exposure
in zebrafish. Lead has been reported to accumulate in liver tissue after one-day exposure (sub-
lethal injection) (Vinodhini and Narayanan, 2008), high variation was observed in the present
study after lead dietary exposure and gender-dependent mt2 and ala-d expression, that can be
attributed to the experimental design of the present study. Although all food was consumed,
not all individuals consumed identical amount of food per aquarium, and the dominant
behaviour of larger individuals may explain the high variation. The large size of zebrafish has
been reported to lead to dominant behaviour independently of fish sex (Hamilton and Dill,
2002). The first sampling for mt2 expression occurred 48 h after the start of exposure and it is
possible that expression occurred swiftly and would have been more obvious after 24-h
exposure. The down-regulation observed at 96-h and 14-d sampling support the hypothesis that
mt2 protein is in high levels in the exposed fish.
91
Figure 4.4: Relative expression of A) mt2 and C) ala-d with Pb concentration after 24-h
exposure in zebrafish larvae (R2 = 0.91 and 0.92, respectively). B) The mt2 relative fold
induction and D) the ala-d inhibition with Pb concentration after 24-h exposure to Pb(NO3)2
(black circles). Plotted in the graph is the mt2 induction with the Pb concentration the particles
MALI (diamonds), FALB (squares) and MALB (*) contain, according to molecular weight.
92
Figure 4.5: Response of mt2 gene expression after dietary exposure to perovskite NMs or lead
nitrate contaminated food with concentration of 500 µg/g of Pb2+. The mt2 levels were assessed
in liver tissues after normalization to β actin. The graph A presents the results from female
zebrafish liver tissue and the graph B from male tissue. Data are MEAN ± SEM, n=3, ANOVA,
p < 0.05
The tRFLP analysis identified 15 different taxonomical units (OTUs) of zebrafish gut
microbiome whose distribution were influenced by the treatment. Zebrafish fed with Pb-spiked
food displayed significant changes in the gut microbiome community compared to fish fed
control food (PERMANOVA, p<0.05) while MALI-fed fish gut microbiome differed compare
to Pb-fed fish with a p=0.06 (PERMANOVA), showing no differences compared to control-
fed fish. Non-metric MDS analysis of tRFLP data of different diet types is shown in Figure
4.7. Results from this analysis revealed multivariate patterns among observations, and
specifically, a strong distinction between Pb and control treatments was observed, while the
perovskite NPs treatments were placed between the range set by control and Pb treatments
along the y axis. The Shannon-Wiener Index, a measure of species diversity in bacterial
communities (Marrugan, 2004), was significantly reduced in the MALB treatment when
compared to FALB or LEAD treatments, while none of the spiked-fed fish microbiomes
differed significantly compared to control treatment (Figure 4.6). Lead-spiked food, which was
93
used as a positive control in the present study, led to significant changes in the zebrafish gut
microbiome communities, while the perovskite-spiked feeds did not change significantly the
structure of the zebrafish gut microbiome after a 14-d dietary exposure. The Illumina MiSeq
analysis of the control, lead nitrate and perovskite FALB samples identified 396 16S rRNA
sequences and bacterial phylla of control and lead nitrate samples were grouped separately as
shown in Figure 4.8. The analysis of presence or absence of the identified phylla (Figure 4.9)
led to no differentiation among treatments, that is in contrast with the Shannon-Weiner Index
out of tRFLP analysis. The high bacterial phylla richness identified by miseq Illumina
compared to the relatively few alleles identified by tRFLP suggests loss of information using
the tRFLP analysis, however, both analyses led to the same result regarding abundance of gut
microbiota; the lead-spiked feeds led to differences in bacterial distribution that, in the case of
tRFLP obtained data, was found statistically important.
Table 4.2: Total lead concentration measured by ICP-MS and ICP-OES in the water column
of aqueous exposures to perovskite NPs (MALI, MALB, FALB) and Pb(NO3)2 with nominal
concentration of 60 mg / L; measurements of water of the aquaria after 14 d dietary exposure
to NP or lead contaminated food; and measurements of total lead found in acid digested food
pellets, mean ± SE, n=5.
Samples
from:
Water column of exposure vial
(nominal concentration 60 mg
/ L, in mg / L)
Aquarium water following
dietary exposure (in µg/L)
Contaminated food
pellets (nominal
concentration 500
µg/g, in µg/g)
MALI 0.212 <0.001 467.163 ± 15.6
MALB 0.152 0.2973 406.917 ± 5.5
FALB 0.223 0.31484 484.814 ± 11.5
Pb(NO3)2 0.189 <0.001 286.753 ± 5
94
Figure 4.6: Shannon-Weiner Index that informs on species richness and proportion within the
zebrafish gut community using data collected from tRFLP analysis of the gut microbiota. The
microflora richness of fish fed with MALB-contaminated food was found significantly
different from FALB-fed and LEAD-fed fish gut microflora. Data represent mean ± SE,
conductor NPs which under UVA promoted photo-catalysis of the organic compounds. This
project is the first to comprehensively investigate the sorption of PAHs onto semiconductor
NPs under UVA using bioavailability of adsorbed compound and photo-by-products to study
sorption processes at the organism level. Toxicity of adsorbed contaminants in aquatic
organisms strongly related to sorption capacity and photo-catalysis efficiency as the NPs under
UVA can catalyse organic compounds to potentially toxic photo-by-products. While sorption
of both PAHs was suggested in the present study, the presence of NPs reduced anthracene
bioavailability while low concentrations of benzo(a)pyrene in the presence of NPs increased
the photo-by-product bioavailability in zebrafish. Additional research is needed to fully
understand the implications of sorption under UVA radiation in environmentally relevant
conditions (e.g. lower concentrations and solar irradiation), environmentally relevant
interactions (e.g. presence of bacteria or organic matter) and screening of more biomarkers to
identify toxicity at the organism level.
Sorption of copper was confirmed on negatively charged NPs with sorption being closely
related to surface area as presented in Chapter 3. While adsorbent surface area has been
previously shown to play important role in sorption, this research provided a comprehensive
assessment of co-contaminant sorption onto NPs, employing nine NPs with different
physicochemical properties and assessing sorption using four different methodologies
including analytical chemistry, algae growth inhibition, zebrafish mortality and zebrafish gene
116
expression. While the chemistry of the surface of NPs during sorption was not investigated,
the presence of all NPs suggested no additional effect or a protective role against copper in C.
vulgaris and larval zebrafish, and sorption capacity increased with higher surface area (i.e.
smaller diameter NPs).
An indirect effect of metallic NPs was indicated in chapter 4 investigating the aquatic toxicity
of perovskite, a new generation, photovoltaic NP. The lead dissolution out of lead-halide
perovskite NPs was identified responsible for perovskite NP toxicity in zebrafish and C.
vulgaris. Many studies have described perovskite chemistry in the aqueous phase, however,
this is the first study to investigate perovskite NP toxicity in the aqueous phase. The perovskite
NPs dissolved lead in aqueous and dietary exposure in zebrafish inducing metal bioavailability
specific biomarkers without significantly changing distribution of zebrafish gut microbiota
after a 14-d dietary exposure in contrast to lead ions that were used as a positive control. This
study provided an example of indirect effects of NPs in the aquatic environment as well as
possible routes of exposure to perovskite NPs. A further step would be the replacement of lead
as the metal cation in the perovskite solar cells with a cation of lower toxicity and production
of environmentally safe solar cell materials.
A particular concern in nanotoxicology is the lack of aqueous dispersion of most NPs during
many in vivo toxicity assays. Chapter 5 presented an exposure chamber designed to assess
toxicity of NPs in the aqueous phase and enhance exposure conditions as NPs are continuously
in dispersion throughout the exposure duration. It was shown that controlled conditions of NP
exposure in the aqueous phase leads to consistent results and higher toxicity of NP in zebrafish
larvae. Results indicated that NP toxicity depends on NP aqueous dispersion. The designed
exposure chamber can provide the start for a standardised methodology that would limit
variation in results among laboratories and will enable to critically compare data and conduct
correct risk assessment. It would be interesting to further investigate the physicochemistry of
NP during the controlled conditions provided by the present exposure chamber using other
aquatic model organisms that previously were assessed in static exposure conditions, thus a
better understanding of the link between toxicity and NP physicochemistry can be developed.
Finally, the results of the present thesis support the bioavailability and gene expression as
sensitive and environmentally relevant tools for investigation of NPs toxicity in the aqueous
phase. Bioavailability of adsorbent successfully identified sorption of co-contaminants onto
NPs and metal and lead-specific biomarkers attributed lead-halide perovskite NPs toxicity to
117
lead ion dissolution. Specific biomarkers can provide information on knowledge gaps and in
combination with careful characterization of the physicochemical properties of NPs can
provide insights on the relationship between NP physicochemistry and environmentally
relevant toxicity. A long-term observation of NP behaviour in the aquatic environment and
investigation of NP toxicity in association with other environmental components in the aquatic
environment can provide information with respect to environmental management and
sustainable nanotechnology.
118
Appendix A
Figure A.1: Preliminary study on the sod1 and cyp1A expression after 6 µg/L of anthracene
under 5 W/m2 UVA radiation. Sod1 expression increases with time reaching highest expression
(2-fold induction) at 4 h after the end of UVA exposure. Cyp1A increases with maximum 3-
fold induction at 2 h after the end of UVA. The sampling of the following experiments was
conducted 3 h after UVA radiation so induced expression of both biomarkers could be
observed.
119
Figure A.2: Cyp1A gene expression of zebrafish larvae exposed to anthracene (black triangles)
and anthracene and 0.2 mg/L of NM105 mixture (x). No induction of cyp1A was observed in
the presence of 0.2 mg/L of NPs. Concentration-response curves were analysed by glm
(p<0.001) and treatments were compared with pair-wise contrast statemens (p<0.001). Data
represent one replicate and a pool of 20 larvae.
Figure A.3: Cyp1A gene expression of zebrafish larvae exposed to anthracene (black triangles)
and anthracene and 0.2 mg/L of Si NPs mixture (black cirlces). No induction of cyp1A was
observed in the presence of 0.2 mg/L of NPs. Concentration-response curves were analysed by
glm (p<0.001) and treatments were compared with pair-wise contrast statements (p<0.001).
Data represent one replicate and a pool of 20 larvae.
120
Appendix B
Figure B.1: The photoelectron peaks of 933 eV corresponds to Cu 2p detected by XPS. (A)
comparison of Cu measurements with 0 mg/L of NPs (B) Cu and 2mg/L Si NPs (grey line), Cu
and 16 mg/L Si NPs (black line), (C) Cu and 2 mg/L TiO2 18 nm NPs (grey line), Cu and 16
mg/L TiO2 18 nm NPs (black line), (D) Cu and 2 mg/L TiO2 4-8 nm NPs (grey line), Cu and
16 mg/L TiO2 4-8 nm NPs (black line), (E) comparison of Cu and 16 mg/L of NPs.
121
Figure B.2: zebrafish larvae mortality curves of Cu and Cu + NPs (CuSi, CuPerovskite). The
solid lines and white squares represent the dose response curves when larvae exposed to Cu
and the dashed line and black circles represent the response when exposed to Cu and Si (A)
and Perovskite (B). There were no significant differences in the dose response curves between
Cu and Cu with NPs indicating no sorption of Cu on the NPs on Cu bioavailability (likelihood
ratio test, p>0.05).
122
Figure B.3: Growth inhibition curves of Cu and Cu + NPs (CuSi, CuPerovskite). The solid
lines and white squares represent the concentration response curves when algae were exposed
to Cu and the dashed line and black circles represent the response when exposed to Cu and Si
(A) and Perovskite (B). There were no significant differences in the concentration-response
curves between Cu and Cu with NPs indicating no sorption of Cu on the NP on Cu
bioavailability (likelihood ratio test, p>0.05).
123
Appendix C
Figure C.1: The structure of a metal halide perovskite solar cell follows the generic formula
ABX3. Organic or inorganic cations occupy position A (green), metal cations and halides
occupy positions B (grey) and X (purple), respectively. Picture taken from (Grätzel, 2014)
124
Figure C.2: A cross section of a corresponding device showing the TiO2 and perovskite layer
in entirely inert atmosphere. Picture taken from (Aruoja et al., 2009; Hoefler et al., 2017).
125
Table C.1: Wet weight (mg), peduncle length (mm) and sex (female or male) of dietary
exposure experiment presented in Chapter 4. Fish in the following table were exposed to
perovskite nanoparticles (MALI, MALB or FALB) or lead nitrate. Samples were collected at
0, 48 and 96 h after the start of dietary exposure.
Sample name Concentration/ Treatment
Exposure time (h)
Wet weight (mg)
Peduncle length (mm)
Sex
16.0.1 0 µg/g 0 404 28 M 16.0.2 0 µg/g 0 530 27 F 16.0.3 0 µg/g 0 710 31 F 16.0.4 0 µg/g 0 660 33 M 16.0.5 0 µg/g 0 610 34 F 16.0.6 0 µg/g 0 500 29 M 16.0.7 0 µg/g 0 380 30 M 16.0.8 0 µg/g 0 520 31 M 1.48.1 ctrl 48 610 30 M 1.48.2 ctrl 48 810 33 F 2.48.1 MALI 48 620 32 F 2.48.2 MALI 48 480 25 M 3.48.1 MALB 48 570 31 M 3.48.2 MALB 48 420 26 F 4.48.1 FALB 48 830 36 F 4.48.2 FALB 48 410 29 M 5.48.1 LEAD NIT 48 420 28 M 5.48.2 LEAD NIT 48 440 28 F 6.48.1 MALB 48 1000 32 F 6.48.2 MALB 48 410 29 M 7.48.1 FALB 48 420 28 M 7.48.2 FALB 48 630 27 F 8.48.1 LEAD NIT 48 670 32 F 8.48.2 LEAD NIT 48 530 30 M 9.48.1 ctrl 48 460 29 M 9.48.2 ctrl 48 550 31 F 10.48.1 MALI 48 510 27 F 10.48.2 MALI 48 590 30 M 11.48.1 LEAD NIT 48 470 28 M 11.48.2 LEAD NIT 48 460 26 F 12.48.1 ctrl 48 610 34 F 12.48.2 ctrl 48 540 30 M 13.48.1 MALI 48 580 29 M 13.48.2 MALI 48 750 31 F 14.48.1 MALB 48 580 30 M
126
14.48.2 MALB 48 540 28 F 15.48.1 FALB 48 530 29 M 15.48.2 FALB 48 810 30 F 1.96.1 ctrl 96 600 30 F 1.96.2 ctrl 96 610 31 M 2.96.1 MALI 96 580 30 M 2.96.2 MALI 96 780 31 F 3.96.2 MALB 96 530 31 M 3.96.1 MALB 96 460 27 F 4.96.2 FALB 96 670 31 F 4.96.1 FALB 96 550 29 M 5.96.1 LEAD NIT 96 680 29 F 5.96.2 LEAD NIT 96 530 29 M 6.96.1 MALB 96 650 30 M 6.96.2 MALB 96 820 30 F 7.96.1 FALB 96 700 30 F 7.96.2 FALB 96 650 32 M 8.96.1 LEAD NIT 96 560 30 M 8.96.2 LEAD NIT 96 910 30 F 9.96.1 ctrl 96 510 27 F 9.96.2 ctrl 96 460 29 M 10.96.1 MALI 96 450 27 M 10.96.2 MALI 96 630 29 F 11.96.1 LEAD NIT 96 660 27 F 11.96.2 LEAD NIT 96 680 30 M 12.96.1 ctrl 96 650 31 M 12.96.2 ctrl 96 550 28 F 13.96.1 MALI 96 700 32 F 13.96.2 MALI 96 490 29 M 14.96.1 MALB 96 770 30 F 14.96.2 MALB 96 1200 32 F 15.96.1 FALB 96 730 30 F 15.96.2 FALB 96 490 29 M AVERAGE 600.206 29.720588
127
Table C.2: Wet weight (mg), peduncle length (mm), gut condition (empty, full or half full) and
sex (female or male) of dietary exposure experiment presented in Chapter 4. Fish in the
following table were exposed to perovskite nanoparticles (MALI, MALB or FALB) or lead
nitrate. Samples were collected at 14 d after the start of dietary exposure.
Sample name Treatment
Exposure time (d)
Wet weight (mg)
Peduncle length (mm) Gut Sex
1.14.1 ctrl 14 890 35 full F 2.14.1 MALI 14 560 33 full M
3.14.1 MALB 14 730 31 1/2 full F
4.14.1 FALB 14 590 29 1/2 full F
5.14.1 LEAD NIT 14 410 28 1/2 full M
6.14.1 MALB 14 730 31 1/2 full M
7.14.1 FALB 14 59 31 full M
8.14.1 LEAD NIT 14 880 32 1/2 full F
9.14.1 ctrl 14 710 31 full F 10.14.1 MALI 14 590 29 full F 11.14.1 LEAD NIT 14 500 26 full M 12.14.1 ctrl 14 970 32 full F
13.14.1 MALI 14 500 26 1/2 full M
14.14.1 MALB 14 720 29 1/2 full F
15.14.1 FALB 14 700 30 full F
1.14.2 ctrl 14 1270 35 1/2 full M
2.14.2 MALI 14 630 29 1/2 full M
3.14.2 MALB 14 670 29 full M 4.14.2 FALB 14 790 31 full F 5.14.2 LEAD NIT 14 780 35 empty F 6.14.2 MALB 14 920 32 full M 7.14.2 FALB 14 620 29 full M
8.14.2 LEAD NIT 14 670 30 1/2 full M
9.14.2 ctrl 14 720 31 full M 10.14.2 MALI 14 680 29 full M 11.14.2 LEAD NIT 14 770 30 full F 12.14.2 ctrl 14 1230 34 full F
128
13.14.2 MALI 14 900 31 full F 14.14.2 MALB 14 490 25 full F 15.14.2 FALB 14 710 30 full M 1.14.3 ctrl 14 480 30 full M 2.14.3 MALI 14 450 28 full M
3.14.3 MALB 14 600 32 1/2 full M
4.14.3 FALB 14 490 26 1/2 full M
5.14.3 LEAD NIT 14 970 29 full F 6.14.3 MALB 14 110 33 full F 7.14.3 FALB 14 610 30 full M 8.14.3 LEAD NIT 14 710 30 full F 9.14.3 ctrl 14 810 35 full M
10.14.3 MALI 14 450 29 1/2 full M
11.14.3 LEAD NIT 14 620 28 1/2 full M
12.14.3 ctrl 14 590 29 full M 13.14.3 MALI 14 610 29 full F
14.14.3 MALB 14 750 31 1/2 full M
15.14.3 FALB 14 560 28 1/2 full M
1.14.4 ctrl 14 1020 33 1/2 full F
2.14.4 MALI 14 680 29 1/2 full M
3.14.4 MALB 14 690 26 1/2 full M
4.14.4 FALB 14 500 27 1/2 full M
5.14.4 LEAD NIT 14 640 30 full M 6.14.4 MALB 14 680 31 full M 7.14.4 FALB 14 600 32 full M
8.14.4 LEAD NIT 14 750 34 1/2 full M
9.14.4 ctrl 14 530 29 full M 10.14.4 MALI 14 630 31 full F 11.14.4 LEAD NIT 14 460 25 empty M 12.14.4 ctrl 14 500 28 empty M 13.14.4 MALI 14 650 31 empty M
14.14.4 MALB 14 500 27 1/2 full M
15.14.4 FALB 14 770 31 1/2 full M
129
4.14.5 FALB 14 640 32 full M
6.14.5 MALB 14 410 25 1/2 full M
12.14.5 ctrl 14 700 29 1/2 full M
13.14.5 MALI 14 680 31 full F
130
131
Figure C.3: Liver tissue sections (8 mm) after H&E staining, viewed in x40 (i) and x100 (ii)
from fish fed with control food (A), Pb-spiked food (B), MALI NP (C), MALB NP (D) and
FALB NP-spiked food(E).
132
133
Figure C.4: Gut lumen tissue sections (8 mm) after H&E staining, viewed in x40 (i) and x100
(ii) from fish fed with control food (A), Pb-spiked food (B), MALI NP (C), MALB NP (D) and
FALB NP-spiked food(E).
134
Appendix D
Table D.1: The list of nanoparticles used in the present PhD study, but not necessarily all
reported in this thesis, included NPs used for the Round Robin exercise (gold nano-spheres and
nano-rods), and NPs that belong to the FNN energy value chain (silicon, boron doped silicon
and perovskites NPs) and which have demonstrated great potential for application on
photovoltaic panels because of their low cost and their high theoretical energy efficiency, as
well as titanium dioxide, PVP coated silver, and cerium dioxide NPs.
135
Sample Label Material Dispersion(solvent) Test conducted
FNN_RR_GNP1 Au H2O Round Robin
FNN_RR_GNP2 Au H2O Round Robin
FNN_RR_GNR1 Au H2O Round Robin
FNN_IUTA_SiO2@Si_01 Si H2O Acute toxicity
FNN_IUTA_Si@B_2.5%_01 B doped Si H2O Acute toxicity, Copper sorption study
FNN_IUTA_Si@B_2%_01 B doped Si H2O Acute toxicity, Copper sorption study
FNN_IUTA_Si@B_1.5%_01 B doped Si H2O Acute toxicity, Copper sorption study
FNN_IUTA_Si@B_1%_01 B doped Si H2O Acute toxicity, Copper sorption study
FNN_IUTA_ Si_01 Si H2O Acute toxicity, Copper sorption study, PAHs sorption study