. 30 00 CD 3 MISCELLANEOUS PAPER 5-69-15 EVALUATION OF NUCLEAR METHODS OF DETERMINING SURFACE IN SITU SOIL WATER CONTENT AND DENSITY T. B. RosMr III S. L W*bster April 1969 Sponsored by Office, Chief of Engineers U. S. Army D D C JUN 31S69 B 0 & ! ilBJWifcWtv- .x'.wsuft" ConducUd by U. S. Army Engineer Waterways Experiment Station CORPS OF ENGINEERS Vicktburg, Miuinippi THIS DOCUMENT HAS BEEN APPROVED FOR PUBLIC RELEASE AND SALE; ITS DISTRIBUTION IS UNLIMITED Ropioduced by the CLEARINGHOUSE for Fedeia' Scientific S Technical Infoimiition Springfield Va 22151 HO
Transcript
.
30 00 CD
3
MISCELLANEOUS PAPER 5-69-15
EVALUATION OF NUCLEAR METHODS OF DETERMINING SURFACE IN SITU SOIL
WATER CONTENT AND DENSITY
T. B. RosMr III
S. L W*bster
April 1969
Sponsored by
Office, Chief of Engineers
U. S. Army
D D C
JUN 31S69
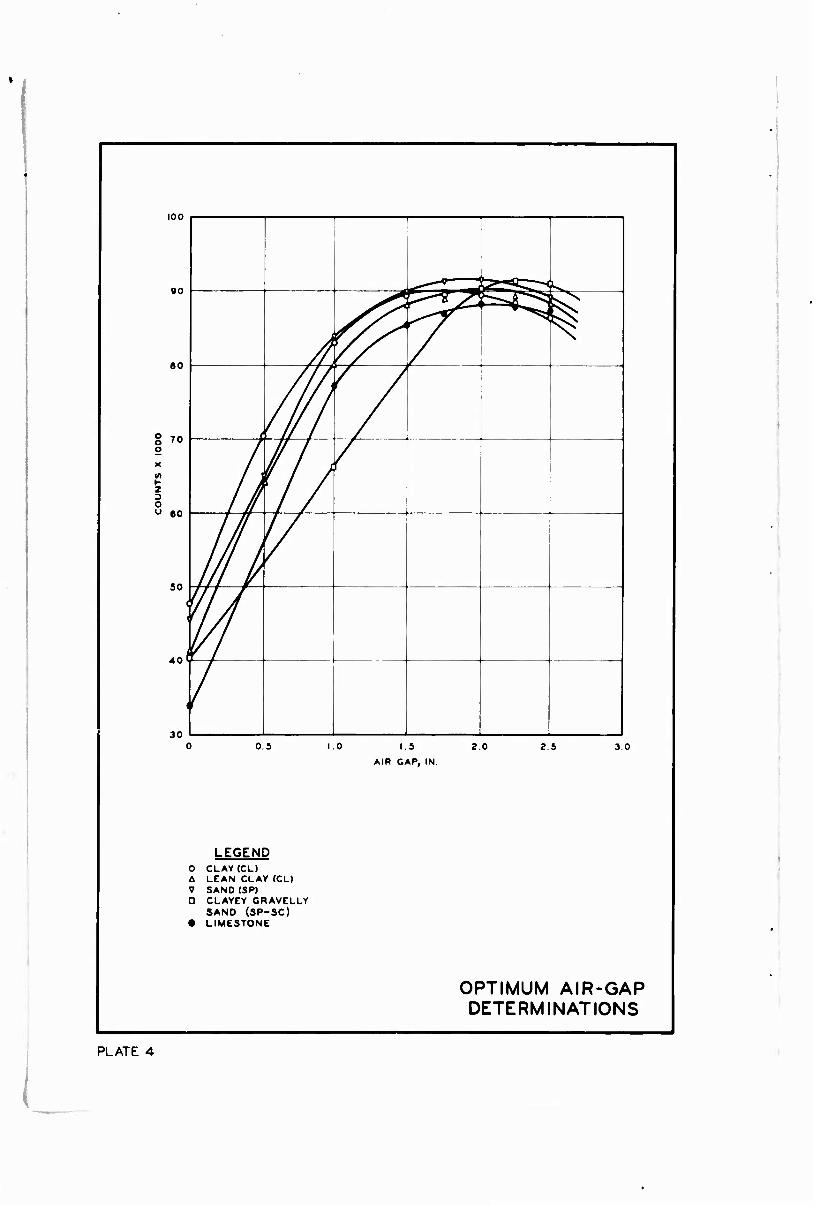
B
0 &
!
ilBJWifcWtv- ■.x'.wsuft"
ConducUd by
U. S. Army Engineer Waterways Experiment Station
CORPS OF ENGINEERS Vicktburg, Miuinippi
THIS DOCUMENT HAS BEEN APPROVED FOR PUBLIC RELEASE AND SALE; ITS DISTRIBUTION IS UNLIMITED
Ropioduced by the CLEARINGHOUSE
for Fedeia' Scientific S Technical Infoimiition Springfield Va 22151 HO
Destroy this report when no longer needed. Do not return it to the originator.
/icccssim (ir
crm wttOE «BUM
nc MT MHM c UM*WIUIt«l C
JUSililCAIlM
J/
w ^ ,..
mh. AVAIL niww
The findings in this report are not to be construed as an official Department of the Army position unless so designated
by other authorized documents.
.
»
a* O X 00
9
MISCELLANEOUS PAPER S-69-15
EVALUATION OF NUCLEAR METHODS OF DETERMINING SURFACE IN SITU SOIL
WATER CONTENT AND DENSITY by
T. B. RotMr III
S. L Webster
} April 1969
Spontorad by
Office, Chief of Engineers
U. S. Army
Project No. 4A02440IA89I
Conducted by
U. S. Army Engineer Waterways Experiment Station
CORPS OF ENGINEERS Vicktburg, Mississippi
ABMTMBC VICKCBURO. Ml««.
THIS DOCUMENT HAS BEEN APPROVED FOR PUBLIC RELEASE AND SALE; ITS DISTRIBUTION IS UNLIMITED
THE CONTENTS OF THIS REPORT ARE NOT TO BE USED FOR ADVERTISING, PUBLICATION, OR PROMOTIONAL PURPOSES. CITATION OF TRADE NAMES DOES NOT CONSTITUTE AN OFFICIAL ENDORSEMENT OR APPROVAL OF THE USE OF
SUCH COMMERCIAL PRODUCTS.
iü
,
1
FOREWORD
The investigation reported herein was conducted by the Flexible Pavement Branch, Soils Division,
U. S. Army Engineer Waterways Experiment Station (WES), under the sponsorship of the Advanced Tech-
nology Branch, Engineering Division, Military Construction, Office, Chief of Engineers. The work de-
scribed was accomplished in accordance with "Permanent Construction Materials Research, FY 1967-68,"
under DA Project No. 4A024401A891. This report presents the results of an investigation conducted dur-
ing the period November 1967-April 1968 to evaluate nuclear methods for determining surface in situ
•oil water contents and densities.
Engineers of the Soils Division, WES, who were actively engaged in the planning, testing, analyzing,
and reporting phases of the investigation were Messrs. R. G. Ahlvin, A. H. Joseph, P. J. Vedros, Jr.,
S. L. Webster, and T. B. Rosser III. The work was conducted under the general supervision of Messrs. W. J.
Turnbull and A. A. Maxwell, Chief and Assistant Chief, respectively, of the Soils Division. This report was
prepared by Messrs. Rosser and Webster.
COL John R. Oswalt, Jr., CE, and COL Levi A. Brown, CE, were Directors of the WES during the
conduct of the investigation and the preparation of this report. Messrs. J. B. Tiffany and F. R. Brown wer i Technical Directors.
CONTENTS
FOREWORD v
CONVERSION FACTORS, BRITISH TO METRIC UNITS OF MEASUREMENT ix
SUMMARY xi
INTRODUCTION, PURPOSE, AND SCOPE I
Introduction 1 Purpose 1 Scope 1
THEORY OF USE OF NUCLEAR METHODS TO MEASURE SOIL DENSITY AND WATER CONTENT I
Definitions of Pertinent Terms I Density Determination 2 Soil Water Content Measurements 2
DESCRIPTION OF EQUIPMENT AND TEST PROCEDURES 3
Equipment 3 General Laboratory Procedure 3
TEST DATA ANALYSIS 6
Density Determinations 6 Water Content Determinations 7 Radiation Dosage 7
DISCUSSION OF RESULTS 7
LITERATURE CITED 9
TABLES 1 and 2
PLATES 1-16
APPENDIX A: TEST PROCEDURE FOR DETERMINING SURFACE LAYER DENSITY AND WATER CONTENT OF SOIL BY NUCLEAR METHODS Al
vu
I
I
'
CONVERSION FACTORS, BRITISH TO METRIC UNITS OF MEASUREMENT
British units of measurement used in this report can be converted to metric units as follows:
Multiply By To Obtain
inches feet
cubic feet pounds per cubic foot
2.54
0.3048
0.0283168
16.0185
centimeters
meters
cubic meters
kilograms per cubic meter
•
SUMMARY
A laboratory investigation was conducted to evaluate the accuracy and reliability of measuring surface
in situ soil water content and density by the backscatter and direct transmission nuclear methods. A single
nuclear device and sealer were used in the laboratory tests. The nuclear device functioned as either a sur- face backscatter moisture and density meter or as a direct transmission density probe.
In order to determine the accuracy of the nuclear measurements, it was necessary to know the actual density and water content of the test soil. Boxes were fabricated to exact dimensions (2 ft by 2 ft by
9 in.), filled with uniformly compacted soil, and weighed, and the actual average soil density values were
calculated. Five soil types were selected for testing in order to approximate a full range of possible construction
materials: : eavy clay (CH), lean clay (CL), sand (SP), clayey gravelly sand (SP-SC), and a well-graded crushed limestone. Each of these soils was tested at eight different densities and water contents, resulting in a total of 40 samples. In order to obtain comparative results, soil densities of each sample were deter- mined by two accepted conventional methods for determining density in the field, i.e. the sand-cone and
water-balloon methods. Test results indicated that in situ densities determined by the direct transmission nuclear method
using the factory calibration curve furnished with the device were as accurate as the densities obtained by
the sand-cone and water-balloon methods. The direct transmission nuclear method using a WES-developed calibration curve provided slightly more accurate density measurements than either the sand-cone or water-
balloon method. Densities determined by the surface backscatter nuclear method using both the factory calibration curve and a WES-developed curve were not so accurate as densities obtained by the conventional methods.
Water contents were obtained by nuclear means and compared with actual water contents as deter- mined from ovendried samples from each box. Using a WES-developed calibration curve, water contents obtained by the nuclear method were sufficiently accurate for most quality control fieldwork (68 percent of the nuclear water contents were within ±1.23 percent of the actual water contents, and 95 percent were within ±2.46 percent). However, water contents obtained using the factory calibration curve could not be considered accurate enough for field use (68 percent of the nuclear water contents were within
±3.81 percent of the actual water contents, and 95 percent were within ±7.62 percent). A test procedure for determining surface layer density and water content of soil by nuclear methods
is presented in Appendix A.
XI
i
—-«f^*—■
•
PAGE
■
•-mm-*-
EVALUATION OF NUCLEAR METHODS OF DETERMINING SURFACE
IN SITU SOIL WATER CONTENT AND DENSITY
INTRODUCTION. PURPOSE, AND SCOPE
Introduction
1. Considerable time is needed to determine in situ soil water content and density by present con- ventional methods. Therefore, in an attempt to expedite field tests and improve the methods of perform-
ing tho tests, considerable research has been conducted since the early 1950's to develop methods and equip- ment for rapidly obtaining reliable moisture and density values.
Purpose
2. The purpose of the investigation reported herein was to evaluate the applicability of the nuclear moisture-density methods for field use by (a) determining the accuracy of the surface soil water contents and densities obtained through use of nuclear methods, and (b) comparing the results obtained by nuclear methods with those obtained by conventional methods.
Scope
3. This investigation was limited to a laboratory study using soil samples of known volume and weight, and, therefore, known average density. The laboratory study was necessary in order that nuclear method test densities could be compared with actual average densities rather than with conventional densi-
ties as would occur in a field study. Densities were obtained by conventional field methods for compari- son with the nuclear densities.
4. Five types of locally available soil, selected to represent a wide range of construction material, were tested. These were heavy clay (OH), lean clay (CL), clayey gravelly sand (SP-SC), clean sand (SP), and well-graded crushed limestone. Classification data for each material are shown in plate 1. Each soil was tested at eight different density-moisture conditions.
THEORY OF USE OF NUCLEAR METHODS TO MEASURE SOIL DENSITY AND WATER CONTENT
Definitions of Pertinent Terms
5. For information and clarity, definitions of certain terms used in this report are given below: Standard deviation. The square root of the mean of the squares of the individual deviations of the
nuclear and/or conventional measurements from the actual measurements. Average deviation. The average of the deviations of the nuclear and/or conventional measurements
from the actual measurements. Curie. Unit of quantity of radioactive material in which the number of disintegrations per second
is 3.70 X 10¹⁰. Gamma radiation. Pure energy released in the natural decay of an unstable nucleus. mev (miiiion electron volts). Energy of radiation is expressed in units of electron volts (ev), which
are small units of energy commonly used in nuclear physics. The ev is the energy (speed) that a unit- charged particle acquires when it falls through a potential of one volt; it is equivalent to
;
,
1.602 X 10'12 ergs, and 1 erg = 2.78 X 10'14 kwhr. Nuclide. A species of atom characterized by the constitution of its nucleus, i.e., the number of pro-
tons and neutrons and energy content. Optimum air gap. The air gap at which a maximum gauge reading is obtained. Photon. A quantum of energy. rod. A unit of absorbed dose of any type of radiation. One rad is the absorption of 100 ergs of en-
ergy per gram of absorber. Radioactive nuclide. A nuclide whose atoms have unstable nuclei that attempt to reach a more stable
(less energetic) state by releasing excess energy in the form of nuclear radiation. rem (roentgen equivalent man). One rem is an absorbed dose of any ionizing radiation that will pro-
duce the same biological effect in man as the absorbed dose from exposure to one roentgen of X or gamma
radiation. rhm. Rads per hour at one meter. Roentgen. Unit of exposure dote of X or gamma radiation.
Density Determination
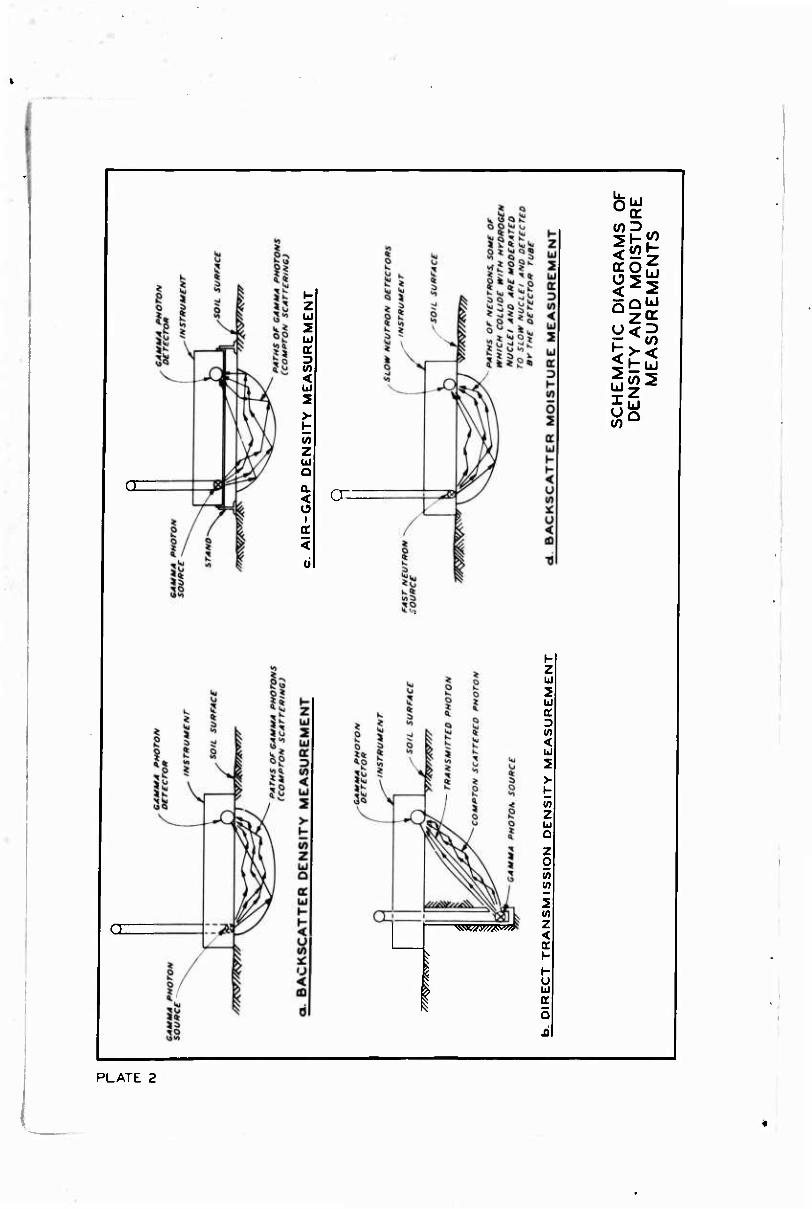
6. The ability of a soil to absorb gamma radiation is directly proportional to the density of the soil. Gamma radiation is absorbed by three means, depending on the energy of the source: (a) photo electric effect (low gamma energies), (b) Compton effect (medium gamma energies), and (c) ionpair produc- tion (high gamma energies).
7. Instruments for measuring soil density are of two types: (a) the backscatter gauge, which meas- ures gamma photons that have been scattered by Compton effect, and (b) the direct transmission gauge, which measures both gamma photons that are transmitted directly from the source without energy loss and
those that have been scattered by Compton effect. With both types of gauges, the gamma counts are in- versely proportional to density. Schematic diagrams of the backscatter and direct transmission gauges are
illustrated in plate 2. 8. Backscatter-type nuclear density gauges are predicated on the use of the Compton effect absorp-
tion principle of medium-energy gamma photons. A definite relation exists between the number of gamma photons that are scattered back from a material and the density of the material. A special case of the backscatter nuclear density method is the air-gap backscatter method. Kühn1 proposed that the introduc- tion of a deliberate air gap between the nuclear instrument and the soil might reduce calibration errors caused by chemically different soils. The air gap at which a maximum reading divided by the reading at the surface of the material occurs is then computed for different densities to establish calibration curves. A schematic diagram of the air-gap method is presented in plate 2.
9. Previous studies^ have indicated that the volume of soil for which the density is determined by both the backscatter and direct transmission nuclear methods varies from approximately 0.05 to 0.1 cu ft,* depending on the density and water content of the material. The depth of density measurement
varies from approximately 2 to 8 in. for the backscatter method, and extends to the depth of the source for the direct transmission method.
Soil Water Content Measurements
10. The nuclear measurement of soil water content is predicated on the principle that when a
* A table of factor» for converting Britith units of measurement to metric unit» i« presented on page ix.
high-energy neutron collides with a nucleus of an atom very much heavier than the neutron, little energy is lost by the neutron. However, when the neutron collides with a nucleus of similar mass, the neutron loses considerable energy and becomes a slow or low-energy neutron. The hydrogen nucleus, which has approxi- mately the same mass as the neutron, is the most effective element in slowing fast neutrons. Therefore, the number of neutrons slowed down by transmission through soil is a function of the water content, since most hydrogen found in soil is in the form of soil moisture. The amount of water in a given soil mass can be determined by emitting fast neutrons into the soil and counting the number of slow neutrons that are
scattered back. A schematic diagram of the backscatter moisture measurement technique is given in plate 2. Results of the studies referenced in paragraph 9 indicated that the volume of the soil in which the water content is measured varies from approximately 0.05 to 0.1 cu ft, depending on the density and water con- tent of the soil. The depth measured varies from approximately 2 to 8 in.
DESCRIPTION OF EQUIPMENT AND TEST PROCEDURES
Equipment
11. Nuclear instruments. Many nuclear instruments for measuring soil water content and density are available from various manufacturers. These instruments consist of both separate and combined water content and density gauges. A proprietary instrument designated as Product A was selected for testing in this investigation. This instrument was chosen because it is a combination water content and density
gauge utilizing both the direct transmission and backscatter techniques for density measurements, and there- fore expedites test procedures by eliminating the need for multiple instruments. This instrument contains a double-encapsulated 3-millicurie source of radium-beryllium that emits both gamma photons and fast neutrons. The source is sealed in the density probe rod. Neutron and gamma shielding is provided inside the gauge so that the radiation level at the surface of the gauge at no point exceeds 50 millirads
per hr. No license is required by the Atomic Energy Commission (AEG) for the possession of this source, as it is a naturally occurring radionuclide. However, the AEC has established standards for protection against radiation in Title 10, Part 20, Code of Federal Regulations,' which provides, among other things, that (a) the maximum radiation dose per person be 3 rems per quarter, (b) the source be shielded as much as possible, (c) a maximum distance be maintained between a source and an operator at all times, (d) radiation film badges (dosimeters) be used by all personnel concerned to monitor accumulated dose, and (e) the sources be wipe-tested every six months.
12. Conventional density equipment. Conventional density equipment and test methods used are as described in ASTM D 2167-66 and D 1556-64, Density of Soil in Place by the Rubber-Balloon6 and
13. The laboratory testing procedure was planned to obtain uniformly compacted soil samples of known volume with various densities and water contents for testing. This was accomplished by construct- ing 2-ft by 2-ft by 9-in. boxes with a volume of exactly 3 cu ft. These dimensions were selected, based on the results of previous studies, ^'^ to provide the minimum volume of soil necessary to represent an
infinite mass to the nuclear gauges. Densities and water contents were varied to obtain a range from the approximate minimum practical density obtainable using a heavy clay with a small compaction effort to the approximate maximum obtainable density using a very well-graded crushed limestone placed at about optimum water content with a great compaction effort. Test soil was placed in the boxes and compacted
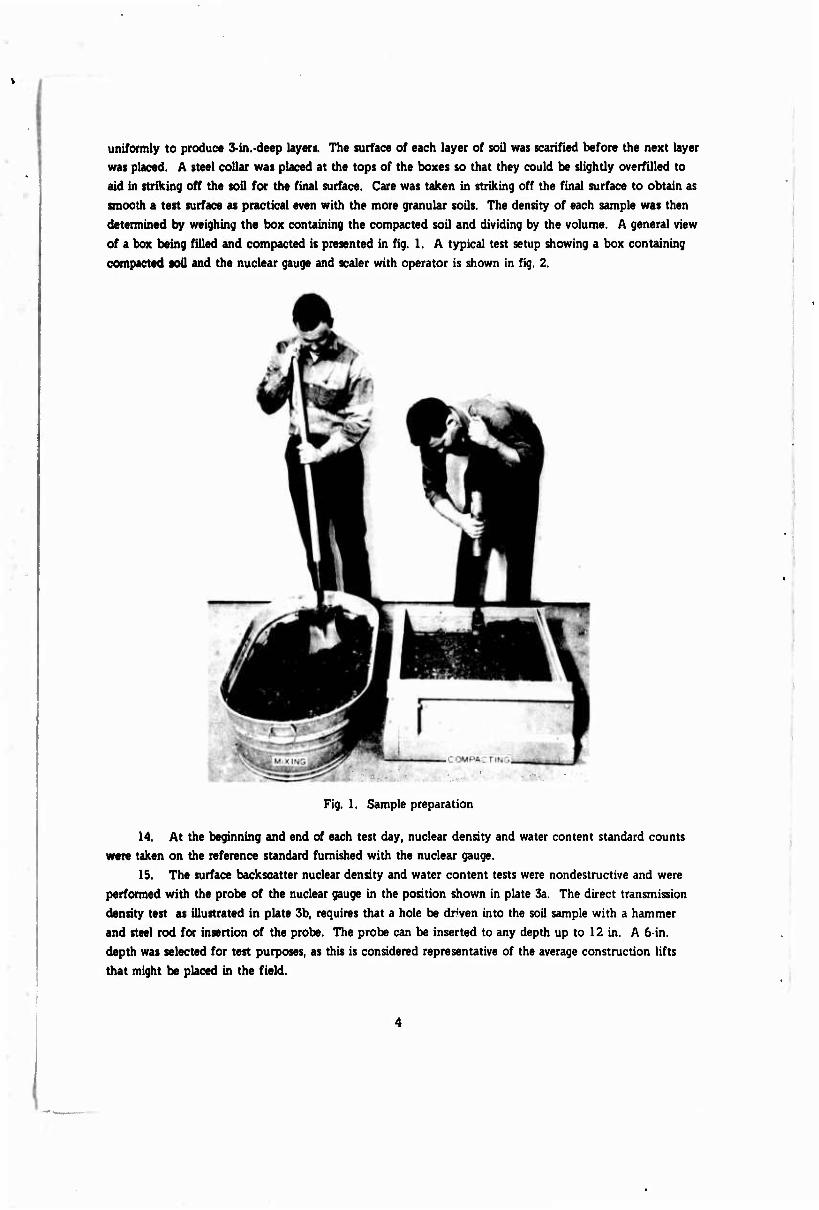
uniformly to produce 3-in.-deep layers. The surface of each layer of soil was scarified before the next layer was placed. A steel collar was placed at the tops of the boxes so that they could be slightly overfilled to aid in striking off the soil for the final surface. Care was taken in striking off the final surface to obtain as smooth a test surface as practical even with the more granular soils. The density of each sample was then determined by weighing the box containing the compacted soil and dividing by the volume. A general view
of a box being filled and compacted is presented in fig. 1. A typical test setup showing a box containing compacted toil and the nuclear gauge and sealer with operator is shown in fig. 2.
Fig. 1. Sample preparation
14. At the beginning and end of each test day, nuclear density and water content standard counts were taken on the reference standard furnished with the nuclear gauge.
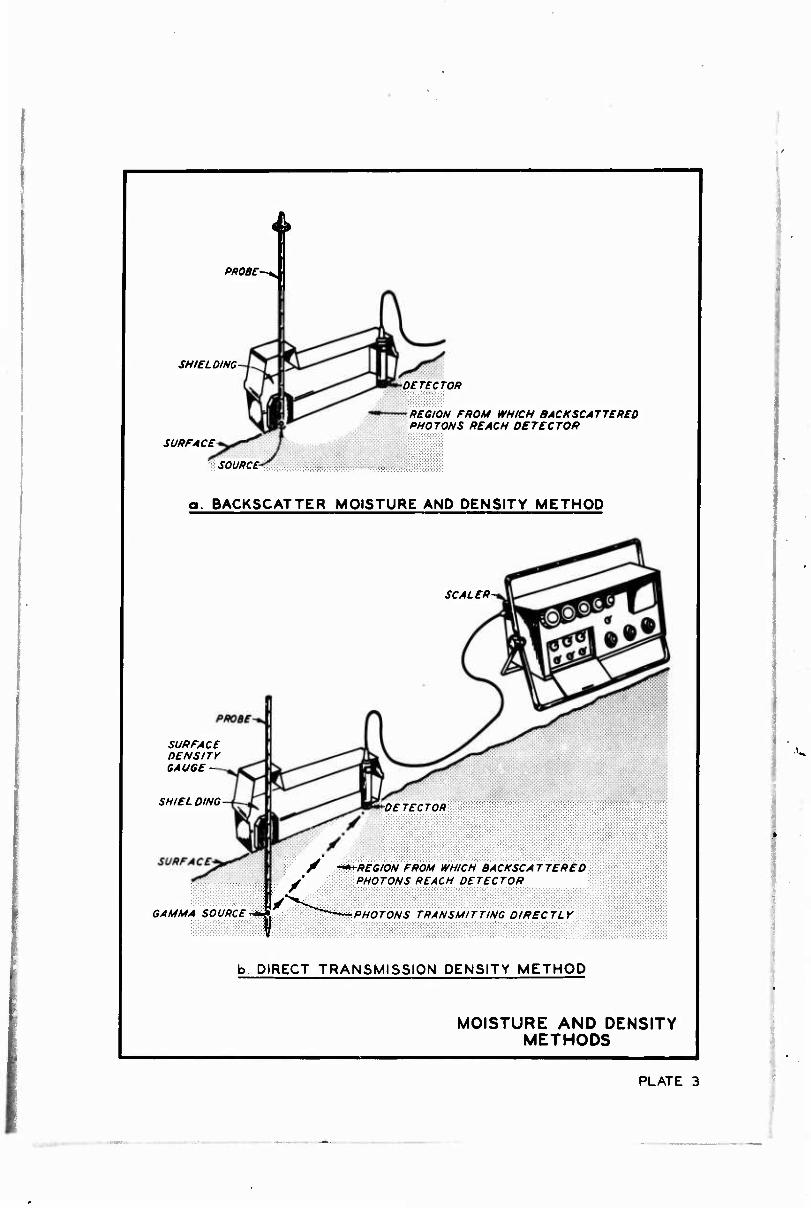
15. The surface backsoatter nuclear density and water content tests were nondestructive and were
performed with the probe of the nuclear gauge in the position shown in plate 3a. The direct transmission density test as illustrated in plate 3b, requires that a hole be driven into the soil sample with a hammer and steel rod for insertion of the probe. The probe can be inserted to any depth up to 12 in. A 6-in. depth was selected for test purposes, as this is considered representative of the average construction lifts
that might be placed in the field.
Fig. 2. Test setup with a nuclear gauge
16. An air-gap cradle with adjustable legs was constructed to hold the nuclear gauge for the air-gap backscatter readings. The optimum air gap was determined by taking a series of counts on each soil type in 1/4- to 1/2-in. increments from the surface count through a 2-1/2-in. air-gap count. The maximum point for each soil type curve varied slightly, but the approximate average of the five soils fell at 2 in. (plate 4).
17. The following nuclear tests were performed on each soil sample: surface water content, surface backscatter density, air-gap backscatter density, and direct transmission density (6-in. depth). Calibration curves furnished by the manufacturer were used to convert instrument readings to density or water content. Generally, these calibration curves were developed by the manufacturer from a few readings taken on cast
materials of various densities and water contents. The calibration curves developed by the U. S. Army Engineer Waterways Experiment Station (WES) and presented herein were obtained using the line-of-best- visual-fit method on the plotted data obtained from nuclear readings on the 40 samples tested. Therefore, the WES curves were developed from more data and are probably more accurate. A simple linear regression was not used to develop the WES curves because the data indicated a curve was applicable rather than a straight line.
18. In order to obtain water contents in the usual form, i.e., weight of water divided by dry weight, it was necessary to know the wet density from which to subtract the weight of water to obtain the dry den- sity. The nuclear water contents were calculated using wet densities as obtained from the dLect transmis- sion nuclear density test as would be the case in an actual field nuclear moisture content test.
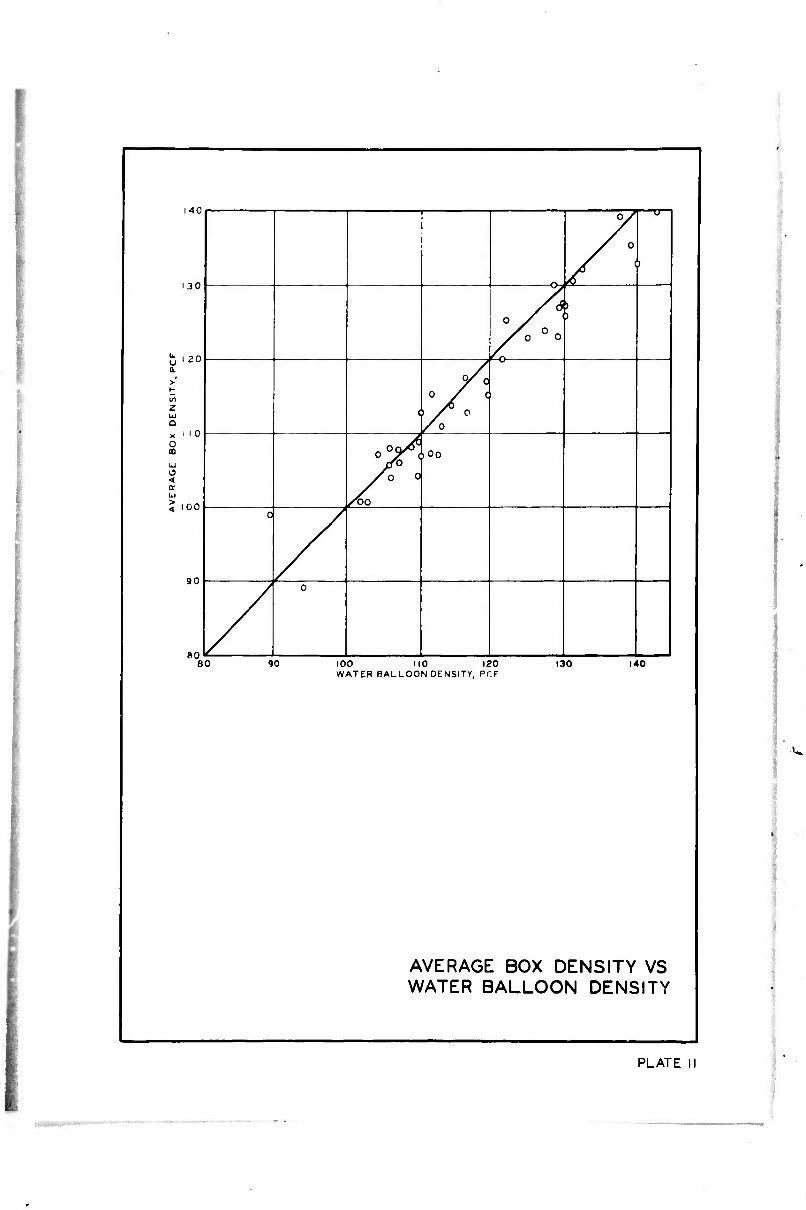
19. In addition to the nuclear tests, two sand-cone and two water-balloon density tests were per-
formed on each sample. The results of the sand-cone and the water-balloon tests were averaged, and the
>»
average values were used as the conventional densities. Water contents of four soil samples were determined using conventional ovendried procedures.
TEST DM A ANALYSIS
20. A summary of the test data is presented in table 1. In order to obtain meaningful coefficients for statistical comparison of test results, the standard deviation and the average deviation of each nuclear or conventional density determination from the actual box density were determined. The results of the statistical analysis are shown in table 2. Also, a plot of the density and water content test results versus actual is presented for each test method in plates 5-12 in order to show the range of variation from the actual for each method.
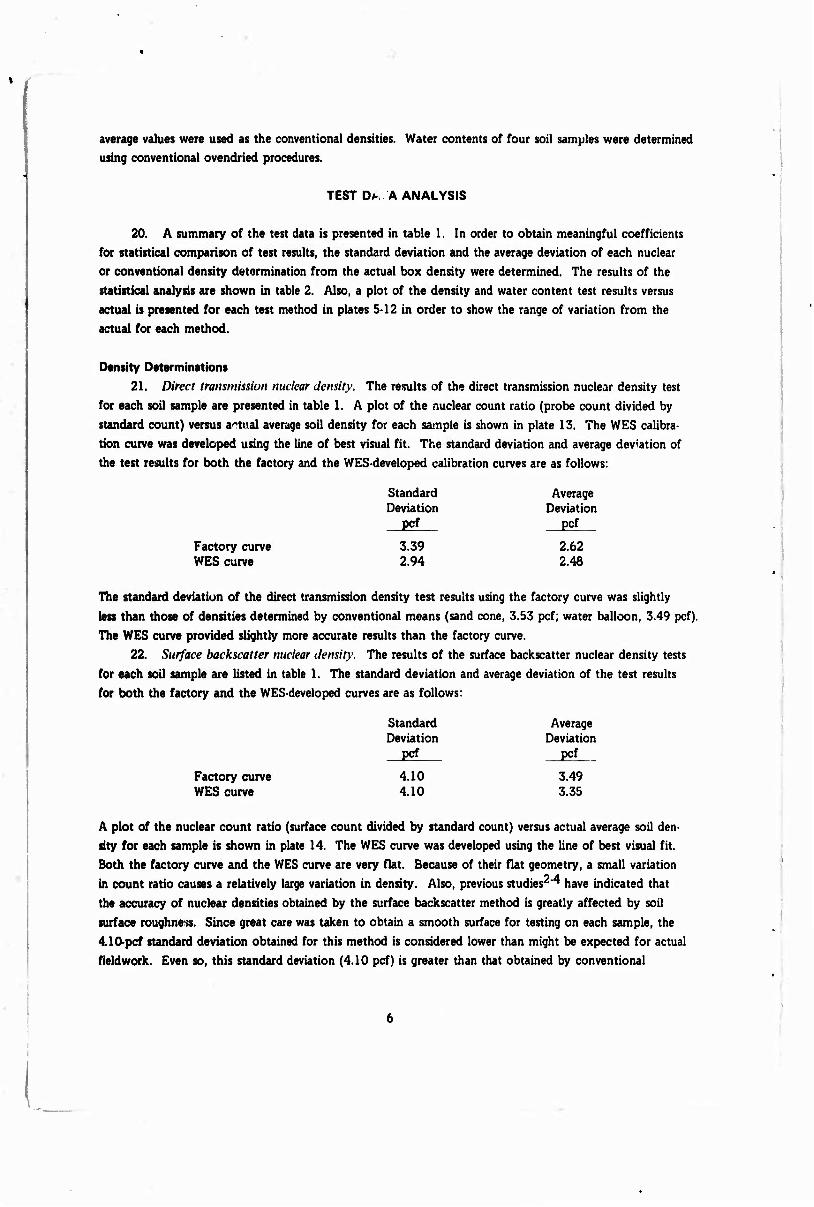
Density Determinations 21. Direct transmission nuclear density. The results of the direct transmission nuclear density test
for each soil sample are presented in table 1. A plot of the nuclear count ratio (probe count divided by standard count) versus actual average soil density for each sample is shown in plate 13. The WES calibra- tion curve was developed using the line of best visual fit. The standard deviation and average deviation of the test results for both the factory and the WES-developed calibration curves are as follows:
Standard Average Deviation Deviation
pcf pcf
Factory curve 3.39 2.62 WES curve 2.94 2.48
The standard deviation of the direct transmission density test results using the factory curve was slightly
less than those of densities determined by conventional means (sand cone, 3.53 pcf; water balloon, 3.49 pcf). The WES curve provided slightly more accurate results than the factory curve.
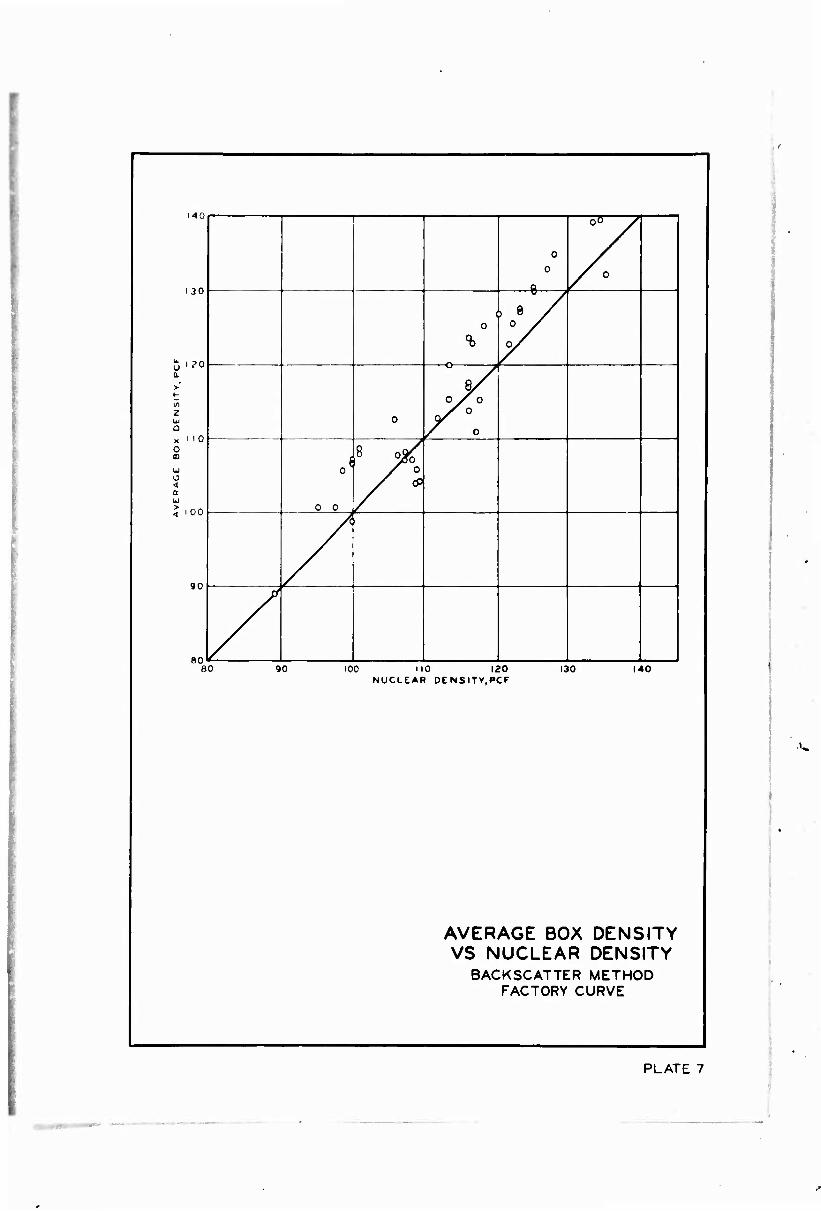
22. Surface backscatter nuclear density. The results of the surface backscatter nuclear density tests
for each soil sample are listed in table 1. The standard deviation and average deviation of the test results for both the factory and the WES-developed curves are as follows:
Standard Average Deviation Deviation
pcf pcf
Factory curve 4.10 3.49 WES curve 4.10 3.35
A plot of the nuclear count ratio (surface count divided by standard count) versus actual average soil den- sity for each sample is shown in plate 14. The WES curve was developed using the line of best visual fit. Both the factory curve and the WES curve are very flat. Because of their flat geometry, a small variation in count ratio causes a relatively large variation in density. Also, previous studies^ have indicated that the accuracy of nuclear densities obtained by the surface backscatter method is greatly affected by soil
surface roughness. Since great care was taken to obtain a smooth surface for testing on each sample, the 4.10-pcf standard deviation obtained for this method is considered lower than might be expected for actual fieldwork. Even so, this standard deviation (4.10 pcf) is greater than that obtained by conventional
methods. Therefore, it is felt that the surface backscatter density method should be used only when a rela- tively smooth soil surface can be obtained, and then only when approximate results are acceptable.
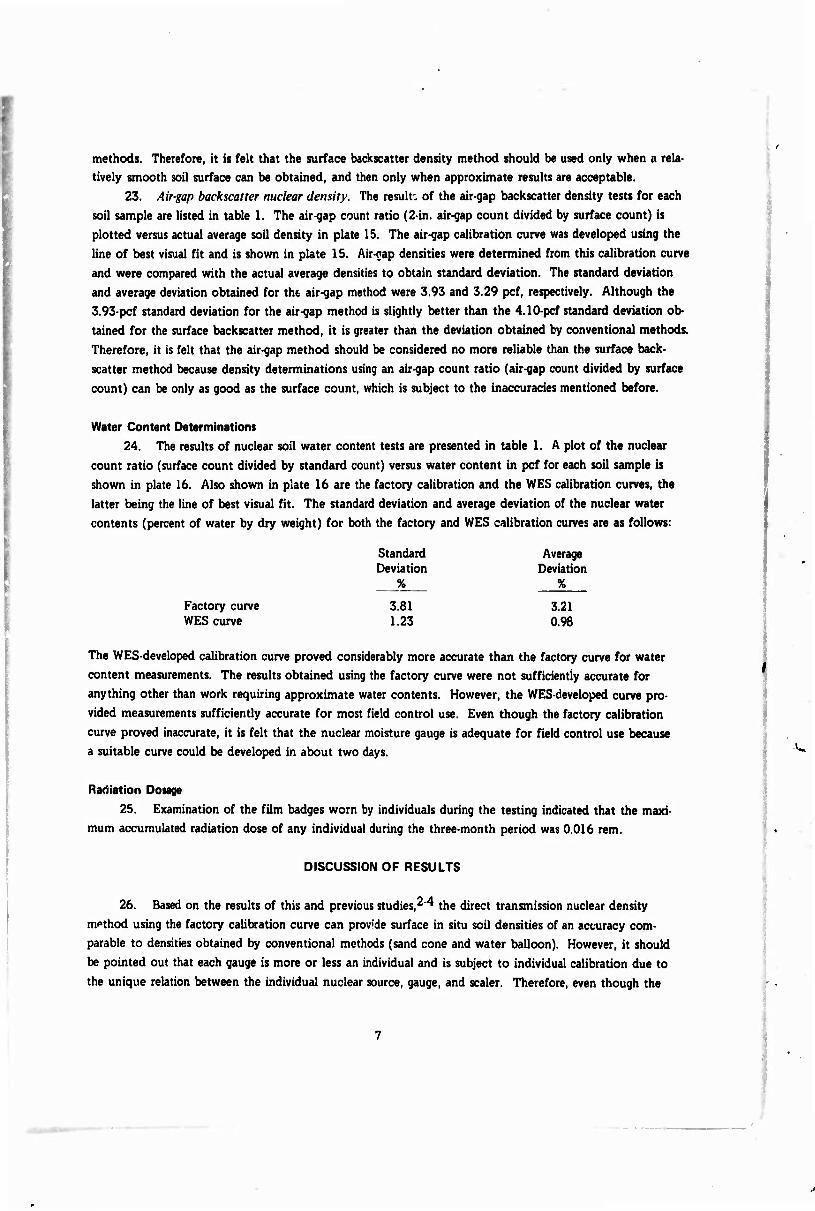
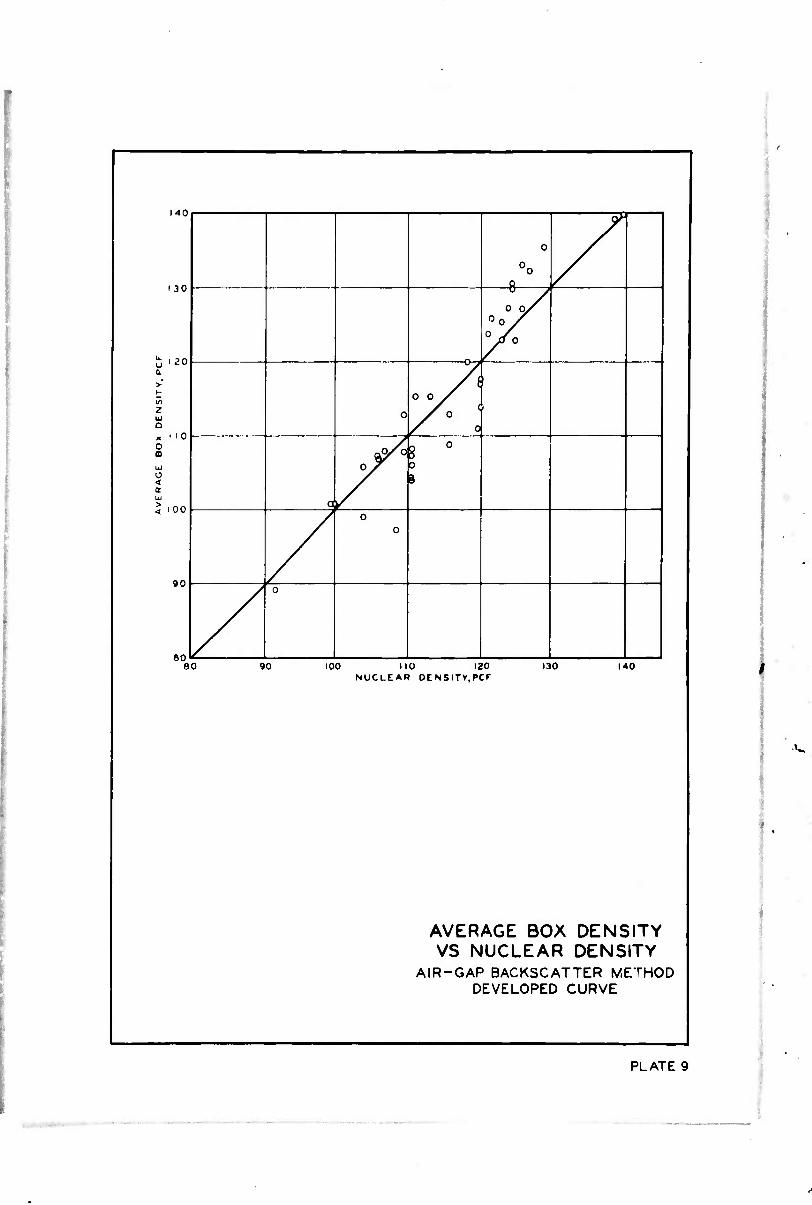
23. Air-gap backscatter nuclear density. The result: of the air-gap backscatter density tests for each
soil sample are listed in table 1. The air-gap count ratio (2-in. air-gap count divided by surface count) is plotted versus actual average soil density in plate 15. The air-gap calibration curve was developed using the line of best visual fit and is shown in plate 15. Air-gap densities were determined from this calibration curve and were compared with the actual average densities to obtain standard deviation. The standard deviation and average deviation obtained for the air-gap method were 3.93 and 3.29 pcf, respectively. Although the 3.93-pcf standard deviation for the air-gap method is slightly better than the 4.10-pcf standard deviation ob-
tained for the surface backscatter method, it is greater than the deviation obtained by conventional methods. Therefore, it is felt that the air-gap method should be considered no more reliable than the surface back- scatter method because density determinations using an air-gap count ratio (air-gap count divided by surface
count) can be only as good as the surface count, which is subject to the inaccuracies mentioned before.
Water Content Determinations
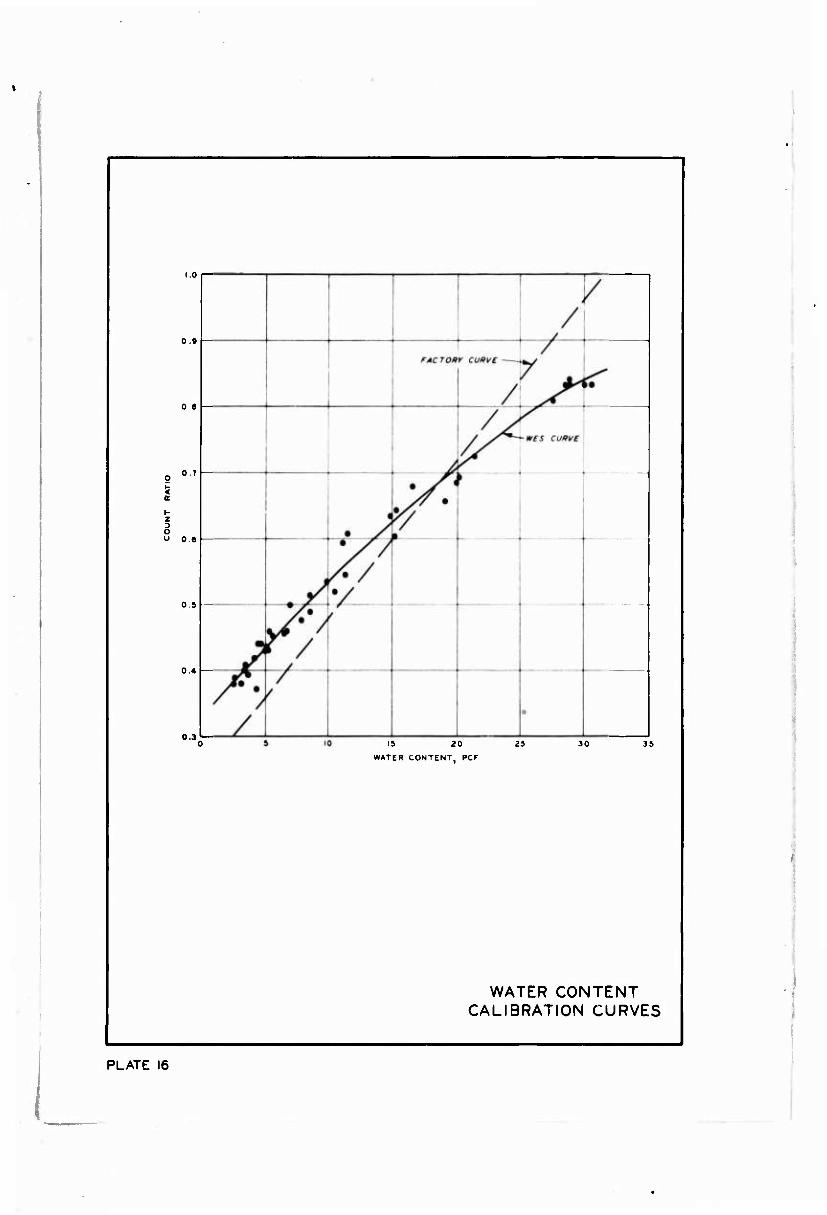
24. The results of nuclear soil water content tests are presented in table 1. A plot of the nuclear count ratio (surface count divided by standard count) versus water content in pcf for each soil sample is
shown in plate 16. Also shown in plate 16 are the factory calibration and the WES calibration curves, the latter being the line of best visual fit. The standard deviation and average deviation of the nuclear water contents (percent of water by dry weight) for both the factory and WES calibration curves are as follows:
Factory curve WES curve
Standard Deviation ___%
3.81 1.23
Average Deviation
%
3.21 0.98
The WES-developed calibration curve proved considerably more accurate than the factory curve for water content measurements. The results obtained using the factory curve were not sufficiently accurate for anything other than work requiring approximate water contents. However, the WES-developed curve pro- vided measurements sufficiently accurate for most field control use. Even though the factory calibration curve proved inaccurate, it is felt that the nuclear moisture gauge is adequate for field control use because a suitable curve could be developed in about two days.
Radiation Dosage
25. Examination of the film badges worn by individuals during the testing indicated that the maxi- mum accumulated radiation dose of any individual during the three-month period was 0.016 rem.
DISCUSSION OF RESULTS
26. Based on the results of this and previous studies,^ the direct transmission nuclear density method using the factory calibration curve can provide surface in situ soil densities of an accuracy com- parable to densities obtained by conventional methods (sand cone and water balloon). However, it should
be pointed out that each gauge is more or less an individual and is subject to individual calibration due to the unique relation between the individual nuclear source, gauge, and sealer. Therefore, even though the
theory of direct transmission density determinations has been proven sound and the results accurate, den- sity checks should be made on each new gauge with its factory calibration curve before complete accept- ance of the gauge for quality control use. General procedures recommended for the optimum operation of nuclear moisture and density gauges are presented in Appendix A.
27. Densities obtained using the surface backscatter nuclear density method were not so accurate as those obtained by conventional methods. However, the surface backscatter nuclear density method
could be useful in cases in which only approximate results from an expedient nondestructive test are required.
28. The surface backscatter nuclear water content method, using a locally developed calibration curve, can provide water content determinations within ±1.5 percent of actual moisture content as deter-
mined from ovendried samples, which should be sufficiently accurate for most field control work. The nuclear method of determining water content using the factory calibration curve proved considerably less accurate and indicated that th; surface backscatter nuclear method using the factory calibration curve should be used only when approximate results are acceptable.
29. The degree of accuracy of the various nuclear methods presented herein was determined under closely controlled laboratory conditions. However, it is felt that comparable accuracies can be obtained in the field if the nuclear gauges are operated on a relatively smooth surface by experienced technicians.
30. The primary advantage of the nuclear methods is the speed with which density and water con- tent determinations can be obtained as compared with conventional methods. An in situ density and water content determination can be made in approximately 15 min as compared with 24 hr required for conventional methods. In addition, the possibility of human error is minimized because the number of operations and calculations required to obtain field results by nuclear means is considerably less than with conventional methods.
31. The primary disadvantage of nuclear methods of determining field densities and water con- tents is the general lack of understanding of the methods, and, consequently, lack of confidence in the results. Another disadvantage is that individual calibration curves must be developed and evaluated for each instrument. Also, safety regulations and requirements are stringently enforced, especially in the Federal service, and for this reason field parties are sometime'; reluctant to use nuclear equipment. Safety regulations are necessary and important, but common sense should be used in their enforcement to make them flexible enough to safeguard personnel while accomplishing the job efficiently.
32. The maximum radiation dosage per person allowed by the AEC is 3 rems per quarter. The maximum accumulated radiation dose obtained by any individual for the 3-month testing period during this study was 0.016 rem. Therefore, it is felt that the use of nuclear gauges will present no detrimental health effects provided normal safe operating procedures are followed.
LITERATURE CITED
1. Kuhn, S. H,, "Effects of Type of Material on Nuclear Density Measurements," Nuclear Measurements, 1963. Highway Research Record No. 66, pp 1-14, 1965, National Academy of Sciences - National Research Council, Washington, D. C.
2. Womack, L. M., "A Study of Surface-Type Nuclear Instruments for Determining Soil Moisture and Density," Miscellaneous Paper No. 4-495, May 1962, U. S. Army Engineer Waterways Experiment Station, CE, Vicksburg, Miss.
3. California Division of Highways, "A Basic Study of the Nuclear Determinatio.' of Moisture and Den- sity," Research Report No. 225928, Nov 1965, Materials and Research Department, Sacramento, Calif.
4. Weber, W. G., Jr., "Laboratory and Field Evaluation of Nuclear Surface Gages for Determining Soil Moisture and Density," Nuclear Measurements, 1963, Highway Research Record No. 66, pp 51-72, 1965, National Academy of Sciences - National Research Council, Washington, D. C.
5. Atomic Energy Commission, "Standards for Protection Against Radiation," Code of Federal Regu- lations, Title 10, Part 20, 9 Aug 1966, Government Printing Office, Washington, D. C.
6. American Society for Testing and Materials, "Standard Method of Test for Density of Soil in Place by the Rubber-Balloon Method," Designation: D 2167-66, 1968 Book of ASTM Standards, Part 11, Mar 1968, Philadelphia, Pa., pp 634-637.
7. , "Standard Method of Test for Density of Soil in Place by the Sand-Cone Method," Designation: D 1556-64, 1968 Book of ASTM Standards, Part 11, Mar 1968, Philadelphia, Pa., pp 463-467.
* Determined from volume of box and weight of compacted sample, ** Each value is an average of two determinations.
Table 2
Statistical Anal> sis of Test Results
Conventional Density Methods
Water balloon Sand cone
Deviation, pcf Standard* Average**
3.49 3.53
2.85 2.76
Nuclear Density Methods
Direct transmission
Factory calibration curve WES calibration curve
Backscatter
Factory calibration curve WES calibration curve Air gap (WES curve)
3.39 2.94
4.10 4.10 3.93
2.62 2.48
3.49 3.35 3.29
Water Content as Determined by Nuclear Methodt
Factory calibration curve WES calibration curve
3.81 1.23
3.21 0.98
* The square root of the means of the squares of the individual deviations of the nuclear and/or conventional measurements from the actual measurements.
** The average of the deviations from the actual measurements, t Water content deviations are given in percent, not pcf.
1HOI3M AS »OSJJVOD MIO 436
< < G Z g i- < u IL <0
< J u
Q UJ I- V) UJ H V) J
C O IL
-I
z u K o z in
O
m >- < j u > > < Ui z
1HOI3M Al »NU 1N3D »id
PLATE I
ex
a. tf) < U
>
w z
Cr
feu
sis <^
I**
cr VV<«{(W/M^
K
H Z UJ
hi a.
<
> h w Z ki Q
Z o w w
w z < tr i-
i-
a a
PLATE 2
PPOB€-^
SHI ELDING-
SURFACE
DETECTOR
REGION FROM WHICH BACKSCATTERED PHOTONS REACH DETECTOR
SOURCE
a. BACKSCATTER MOISTURE AND DENSITY METHOD
SURFACE DENSITr GAUGE
SHI EL DING-
GAMMA SOURCE
SCAL ER-
DE TECT OR
/ ~**REGION FROM WHICH BACKSCATTERED y PHOTONS REACH DETECTOR
'PHOTONS TRANSMITTING DIRECTLY
b, DIRECT TRANSMISSION DENSITY METHOD
MOISTURE AND DENSITY METHODS
PLATE 3
100
90
SO
m
70
z O u eo
so
40
30 0.5 1.0 1.5
AIR GAP, IN.
2.0 2 5 3 0
LEGEND 0 CLAY (CD A LEAN CLAY (CD V SAND (SP) 0 CLAYEY GRAVELLY
SAND (SP-SC) • LIMESTONE
OPTIMUM AIR-GAP DETERMINATIONS
PLATE 4
'
140
130
I 20
O ID
10
100
90
80 80
0
yo
4
1
<
0o o /"
<9 0
9^o
0
o yo Y 0
/
o
/
o
90 100 110 120 NUCLEAR DENSITV.PCr
130 140
AVERAGE BOX DENSITY VS NUCLEAR DENSITY
DIRECT TRANSMISSION METHOD FACTORY CURVE
PLATE 5
1 «tu
a / /
5 1
130 &
0 0 / o
D
% /"
O 120 £_ v
AV
ER
AG
E
BO
X
DE
NS
ITY
.
3
O
O
O
o )0
/ 4>
0
tf ( >
O
o~S o s 0 1°
/
0
80 90 too no 120 NUCLEAR DENSITY.PCF
130 140
AVERAGE BOX DENSITY VS NUCLEAR DENSITY
DIRECT TRANSMISSION METHOD WES CURVE
PLATE 6
140
130
I 20
O m
100
90
BO 80
0 0
ft J
oö S
s 0
0 0 /
0s
0
V nS 0
f 0
o(
0 0
8 oß/ s 0
Ä
//
90 100 MO 120 NUCLEAR DENSITV.PCF
130 140
AVERAGE BOX DENSITY VS NUCLEAR DENSITY
BACKSCATTER METHOD FACTORY CURVE
PLATE 7
140
130
I 20
10 o ID
O < IT
< 100
90
/ T—
/ o/o
9
#/ o
cP 0
o 0 /
/o 0
0 ,°y 0 0
0 O /_
/
0
[/ 5^
80 80 90 100 HO 120
NUCLEAR DENSITy.PCF 130 140
AVERAGE BOX DENSITY VS NUCLEAR DENSITY
BACKSCATTER METHOD WES CURVE
PLATE 8
0
0o Q /
f- , Dn
y o o/
°/o
AV
ER
AG
E B
OX
D
EN
SIT
Y.
PC
3
O
O
O
c
o
a o / S o / 0
1
a
0S
8 0
0 i
0 0
/
0
80 90 100 HO 120 130 140 NUCLEAR DENSITV.PCF
AVERAGE BOX DENSITY VS NUCLEAR DENSITY
AIR-GAP BACKSCATTER METHOD DEVELOPED CURVE
'
PLATE 9
140
IJO
I 20
i 10 o o
o 4 It y
< 100
90
80 80
'
/ 0
JJ 0
'o0
—o—
o 0
0
c O/o
X o /o
0 ß / *
0 (J)0
c X
o
90 100 M0 120 SAND CONE DENSITY, PCF
130 140
AVERAGE BOX DENSITY VS SAND CONE DENSITY
PLATE 10
140
130
o ID
20
10
o < or UJ
< 100
90
BO 80
0/ u
y^ 0
>o T
/6
Vo 0o !
( 0 / <
1 f 0
So o ,00
0
/
0
90 lOO 110 120 WATER BALLOON DENSITY, PCF
130 140
AVERAGE BOX DENSITY VS WATER BALLOON DENSITY
PLATE II
50
l- I i2 40 hl
>■
ce Q
*
* 30 Z u t- z o o E III U 20
o ID
ui O < a UJ
10
/
oX Ä
/ 0
0 yP
c
o X
a/
/
)0
10 20 30 40
NUCLEAR WATER CONTENT, •/« DRY WEIGHT
50
AVERAGE BOX WATER CONTENT VS NUCLEAR
WATER CONTENT WES CURVE
PLATE 12
o 0 I
ON
ME
T
WE
S
UR
VE
S
o ^9W
/
/
/
«1
o
TR
AN
SM
IS;
AC
TO
RY
AN
L
IBR
AT
ION
y. / 1-^ <
& Ü O / Ul
'/' o 5
ä * > ff* *
(0
1 '// •
13 // o
* // .V u a.
« A' // '
t z u
o O • •
7 Uj A • S tj <k [/ i • ^ o (J /. o
X / <k / O y (j / 5 / s V /
/'
/ o c > m O u ̂ c >®
fl (\J ouvd iNnoo
PLATE 13
PLATE 14
o
GA
P
CU
RV
E
\
•o
\
\ o
2-I
N.
AIR
- C
AL
IBR
AT
ION
\ •
•
\ « o «2 \ '
/
\» 1
/
rv
• k •
110
1
20
DE
NS
ITY
, P
CF
• \ • \ •
• \. •• \
i
| •
\
\
S \
S t u ■> o <0 O tf
n m <M «VJ -
OI1VM INOOD
^
PLATE 15
0 »
t- z D O <J o.e
OS
0 4
0.3 IS 20
WATER CONTENT. PCF
WATER CONTENT CALIBRATION CURVES
PLATE 16
APPENDIX A: TEST PROCEDURE FOR DETERMINING SURFACE LAYER DENSITY AND WATER CONTENT OF SOIL BY NUCLEAR METHODS
EQUIPMENT OPERATION
1. Refer to the instruction manuals supplied by the factory for proper operation of the nuclear equipment.
SAFETY REGULATIONS
2. Conform with the following safety regulations regarding raciioactive sources while working with the nuclear equipment.
a. Wear film badges at all times. b. Make sure the equipment is leak-tested regularly by qualified personnel.
c. Never touch or handle an exposed nuclear source. J. Never remain near the nuclear source longer than necessary while performing soil tests.
e. Be sure that the nuclear source is properly shielded when not in use. / Store the equipment in a proper storage area.
STANDARDIZATION OF EQUIPMENT
3. Take standard counts as follows on the reference standard for wafer content and for density: a. Set the gauge on the reference standard and position the source in the appropriate water
content or density standard count position.
b. Set the sealer unit controls in the proper water content or density test positions. c. Allow the equipment to warm up in accordance with the manufacturer's recommendation. (/. Take five I-min readings on the reference standard for density and five I-min readings
for water content at the beginning and at the end of each test day. e. If one reading of a set of five 1-min readings falls outside the limits set by equation Al be-
low, repeat the five readings. If the second attempt does not satisfy equation Al, the equipment should be checked for possible malfunctions or improper settings and the proc- ess repeated.
Ns = No±2v/No (Al)
where Ns = range of acceptable readings, counts per min.
No = average of a set of five 1-min readings, counts per min.
/ The average value of the first set of density readings, taken at the beginning of the test day and satisfying equation Al, is the density standard count for the day.
g. The average value of the first set of water content reading, taken at the beginning of the test day and satisfying equation Al, is the water content standard count for the day.
//. The set of density and set of water content readings taken at the end of the test day serve as a check on the equipment operation. The averages of these sets of readings should agree with the standard counts obtained at the beginning of the test day if the equipment is operating properly.
Al
TEST SURFACE
4. Prepare the soil surface for testing as follows: a. Level a sufficient area to accommodate the gauge.
b. Remove all loose material. c Fill in any voids with native fines. d. The maximum depressions should not exceed 1/8 in.
METHOD A. SURFACE BACKSCATTER
5. The following test procedure is applicable to waler content and wet-density determinations:
a. Seat the gauge firmly on the soil surface.
b. Place the gauge source in the backscatter position. c. Adjust the sealer unit controls for the appropriate water content or density test. d. Remove all vertical projections within 6 in. of the gauge. e. Check to ensure that no other radioactive sources that will affect the readings are near the
gauge. /.' Allow the equipment to warm up as in standardization. g. Take three 1-min readings. h. Rotate the gauge either 90 or 180 deg, and take three more 1-min readings.* i. Divide the average of the six (or three) readings by the proper standard count to obtain a
count ratio. Determine the wet density or water content by use of the applicable calibra- tion curve.
METHOD B, DIRECT TRANSMISSION
The following test procedure is applicable to wet-density determinations: a. Make a hole perpendicular to the prepared soil surface by using a guide provided by the
manufacturer. b. Seat the gauge firmly on the soil surface and insert the probe so that the side of the probe
facing the center of the gauge is in intimate contact with the side of the hole. c. Adjust the sealer unit controls for density testing.
d. Check to ensure that no other radioactive sources that will affect the readings are near the gauge.
e. Allow the equipment to warm up as in standardization. / Take three 1-min readings.
g. Rotate the gauge 15 to 20 deg and take three more 1-min readings.* h. Divide the average of the six (or three) readings by the density standard count to obtain
a count ratio. Determine the wet density by use of the applicable calibration curye.
Obtaining additional readings in the rotated position is optional. However, it increases the volume of soil sampled and gives a check on the uniformity of soil water content and density. Therefore, it is recommended if sufficient time is available.
A2
fe
METHOD C, AIR GAP
7. This method of testing is applicable to wet-density determinations. a. Complete steps 5a-5i of Method A for density. b. Place the air-gap cradle over the test surface. c. Gently position the gauge in the cradle and set the source in the backscatter position. d Repeat steps 5c'-5/ with the gauge in the cradle. e. Determine the air-gap ratio by dividing the average counts per min obtained in 7d by the
average counts per min obtained in 7a.
f. Determine the wet density by use of the applicable calibration curve.
RESULTS
8. The wet density as determined by the methods above is expressed in pounds per cubic foot and the water content as pounds of water per cubic foot of soil. Equations A2 and A3 below are used to obtain the dry density in pounds per cubic foot and moisture content in percent dry weight.
7 dry = T wet - W
w% = 7w_ X 100%
(A2)
(A3)
where 7dry = dry density, pcf
7wet = wet density, pcf W = water content, pcf
W% = water content, percent dry weight
1
•
A3
AI)688079 Unclassified
Srunly Classification
DOCUMENT CONTROL DATA R&D S^. uri(> rlmiallictition of tllU-. budy ■■( ttbstrnd a.id intltKltlg i iifrfi when th» HU repurf In clntallltJ
I OFiiGiNATiNC ACTIVITY (Cotpormlm mttlhor)
U. S. Army Engineer Waterways Experiment Station Vicksburg, Mississippi
\iU. Mtt'CHT St CUHiTt CLAbSI^ICATION
Unclassified
J REPORT TITLE
EVALUATION OF NUCLEAR METHODS OF DETERMINING SURFACE IN SITU SOIL WATER CONTENT AND DENSITY
« DESCRIPTIVE NOTE» (Typ* of rmporl mnd Inclunlv» dmfM)
Final report B *u THOROl fffif nam«, middtm Initlml, Imil nmmm)
This document has been approved for public release and sale; its distribution is unlimited.
II. SURPU LWCNTARV NOTE» 12. SPONSORING MILITARY ACTIVITY
Office. Chief of Engineers, U. S. Army Washington, D. C.
Laboratory tests were conducted to evaluate the accuracy and reliability of measuring surface in situ soil water content and density by the backscatter and direct transmission nuclear methods using a single nuclear device and sealer. The nuclear device functioned as a surface backscatter moisture and density meter or as a direct transmission density probe. To determine the accuracy of the nuclear measurements, it was neces- sary to know the actual density and water content of the test soil. Boxes were fabricated to exact dimen sions, filled with uniformly compacted soil, and weighed, and actual average soil density values were calcu- lated. Five soil types were tested to approximate a full range of possible construction materials. Each soil type was tested at eight different densities and water contents To obtain comparative results, soil densi- ties of each sample were determined by two accepted conventional methods (sand cone and water balloon) for determining density in the field. Test results indicated that in situ densities determined by the direct transmission nuclear method using the factory calibration curve furnished with the device were as accurate as densities obtained by the sand-cone and water-balloon methods. The direct transmission nuclear method using a WES-developed calibration curve provided slightly more accurate density measurements than either conventional method. Densities determined by the surface backscatter nuclear method using both the fac- tory calibration curve and a WES-developed curve were not so accurate as those obtained by the conven- tional methods. Water contents were obtained by nuclear means and compared with actual water contents determined from ovendried samples. Using a WES-developed calibration curve, water contents obtained by the nuclear method were sufficiently accurate for most quality control fieldwork. Water contents obtained using the factory calibration curve were not accurate enough for field use. A test procedure for detennin ing surface layer density and water content of soil by nuclear methods is presented in Appendix A
AM FMM t Mmlf% •«•i.»c«» oo »OHM i«f». i J AH M, WMICM II