Page 1
EVALUATION OF PARAMETERS AFFECTING STEADY-STATE FLOC
BLANKET PERFORMANCE
A Thesis
Presented to the Faculty of the Graduate School
of Cornell University
In Partial Fulfillment of the Requirements for the Degree of
Master of Science
by
Matthew William Hurst
February 2010
Page 2
© 2010 Matthew William Hurst
Page 3
ABSTRACT
A laboratory-scale reactor was used to simulate a water treatment process sequence of
rapid mix, hydraulic flocculation, upflow clarification with a floc blanket, and lamellar
sedimentation to accomplish removal of colloidal particles. This process sequence,
followed by chlorination, has been employed to create affordable designs for water
treatment in the Global South. This study focused on variables affecting performance
of the floc blanket including: condition of hydraulic flocculation, raw water turbidity,
coagulant dose, upflow velocity through the floc blanket, floc blanket height, and bulk
density and solids concentration of the floc blanket. An upflow clarifier velocity
between 90-110 m/day produced the best floc blanket performance for most influent
turbidities studied. The results show that particle removal efficiency in lamellar
sedimentation improved linearly with respect to floc blanket heights up to 45 cm.
Improved performance is also correlated with increased hydraulic flocculator
residence time and energy dissipation rate. At floc blanket heights above 45 cm, there
is still improvement in performance for most cases, but improved performance and
blanket height no longer follow a linear relationship. Lamellar sedimentation with a
capture velocity of 10 m/day is a key component in improving clarifier performance
when utilizing a floc blanket. Future studies are needed to determine mechanisms of
particle removal in a floc blanket.
Page 4
iii
BIOGRAPHICAL SKETCH
Matt Hurst was born in Tucson, Arizona in 1984. He became really interested in the
environmental field after taking an environmental science class his senior year of high
school. He graduated magna cum laude with a degree in Civil Engineering and a
minor in Environmental Engineering and a degree in Chemistry with a minor in
Spanish from Rose-Hulman Institute of Technology in 2007. In college, he was the
president of the student group UNITY and worked with the Human Rights Council of
Terre Haute. His work experiences in the environmental field include three years of
undergraduate research with Dr. Penny Miller as part of WATERCAMPWS and a
summer as a student organizer for GreenPeace. In September, 2007, he entered
Cornell University and initiated his studies towards the M.S. Degree in Environmental
Processes.
Page 5
iv
Dedicated to
My parents, Bob and Peg
Page 6
v
ACKNOWLEDGMENTS
I am very grateful to two advisors, Dr. Weber-Shirk and Professor Lion for their
guidance and encouragement in this research. Dr. Weber-Shirk has spent countless
hours teaching and guiding me along this process. Professor Lion has really helped
shape and guide this research with his practical advice and experience. I would also
like to thank Professor Bisogni who served as the minor advisor on the committee.
I am also grateful to Ian Tse and Po-Hsun Lin, two graduate students whose
collaborative efforts enhanced this study. I would also like to thank the other members
of the AguaClara team for their help and encouragement in this project.
I also thank the Sanjuan Foundation and the U.S. National Science Foundation under
Grant CBET-0604566 for their support of the research described in this thesis.
Page 7
vi
TABLE OF CONTENTS
BIOGRAPHICAL SKETCH ......................................................................................... iii
DEDICATION PAGE ................................................................................................... iv
ACKNOWLEDGMENTS .............................................................................................. v
LIST OF FIGURES ....................................................................................................... ix
LIST OF TABLES ....................................................................................................... xii
LIST OF ABBREVIATIONS ..................................................................................... xiii
LIST OF SYMBOLS ................................................................................................... xiv
CHAPTER 1: INTRODUCTION ................................................................................... 1
1.1. Background Information ..................................................................................... 1
1.2. Overview of Research ......................................................................................... 2
1.2.1 Research objectives ....................................................................................... 4
CHAPTER 2: LITERATURE REVIEW ........................................................................ 6
2.1. A Review of Sedimentation Technology ............................................................ 6
2.2. Floc blanket technology .................................................................................... 10
2.3. Flocculation ....................................................................................................... 21
2.4. Coagulation ........................................................................................................ 23
2.5. Lamellar Sedimentation ..................................................................................... 31
CHAPTER 3: PARAMETERS AFFECTING STEADY-STATE FLOC BLANKET
PERFOMANCE ........................................................................................................... 35
3.1. Parameters affecting steady-state floc blanket performance ............................. 35
Page 8
vii
3.1.1 Abstract ....................................................................................................... 35
3.1.2 Nomenclature .............................................................................................. 36
3.1.3 Introduction ................................................................................................. 37
3.1.4 Materials and Methods ................................................................................ 41
3.1.5 Results and Discussion ................................................................................ 50
3.1.6 Characterizing floc blanket effluent performance at steady-state ............... 56
3.1.7 Conclusions ................................................................................................. 67
3.2. Acknowledgements ........................................................................................... 68
CHAPTER 4: FUTURE STUDIES .............................................................................. 73
4.1. Mechanisms of particle removal in a floc blanket ............................................. 73
4.2. Effect of NOM and particle type on floc blanket effluent performance ........... 74
APPENDIX A. AGUACLARA AND THE GLOBAL WATER CRISIS ................... 75
APPENDIX B. MEASUREMENT OF FLOC BLANKET POROSITY ..................... 77
APPENDIX C. MEASUREMENT OF FLOC BLANKET SOLIDS
CONCENTRATION .................................................................................................... 79
APPENDIX D. CALIBRATION OF A PYCNOMETER ........................................... 81
APPENDIX E. BULK DENSITY ANALYSIS FOR A FLOC BLANKET ................ 82
REFERENCES ............................................................................................................. 84
Page 9
viii
LIST OF FIGURES
Figure 1-1. Diagram of fully formed floc blanket in experimental reactor. ................. 10
Figure 2-1. Diagram of potential aqueous aluminum species formed from the
hydrolysis of alum (Reckhow, 1999). .............................................................. 24
Figure 2-2. Effect of alum dosage on residual turbidity and on solution pOH after 1
min of alum addition (Initial pOH = 6.1, Initial turbidity = 3.3 NTU) (Xiao et
al., 2008a). ........................................................................................................ 27
Figure 2-3. Aluminum solubility diagram in equilibrium with amorphous Al(OH)3(s)
based on thermodynamic data, and floc formation region based on
experimental observations. Lines 1, 2, 3, 4, 5, 6, 7, 8 represent the
concentrations of [Al3(OH)4]5+ , [Al2(OH)2]4+ ,[Al13O4(OH)24]7+ , Al3+,
Al(OH)2+, Al(OH)2+ , Al(OH)4
− , Al(OH)3(s), respectively (Xiao et al., 2008b). 31
Figure 3-2. Schematic of flow through laboratory scale plant. .................................... 44
Figure 3-3. Continuously sampled turbidity readings for raw water influent, clarified
water above the floc blanket and the tube settler effluent. The upflow velocity
in the floc blanket was 100 m/day and the capture velocity in the tube settler
was 10 m/day. ................................................................................................... 48
Figure 3-4. Relationship between floc blanket density and solids concentration (r2 =
0.98). ................................................................................................................. 50
Figure 3-5. A. Solids concentration sampled at a height of 51 cm from the bottom,
respectively starting at time zero when the floc blanket reached a target height
of 75 cm, with an upflow velocity of 120 m/day. ............................................ 51
Figure 3-6. A. G as a function of upflow velocity (right). B. floc fluidGθ as a function
of upflow velocity for a floc blanket height of 75 cm (left). ............................ 54
Page 10
ix
Figure 3-7. Measured head loss (boxes) across the tube flocculator compared to
theoretical predictions (curve) of Lui & Masliyah for laminar flow through
coiled tubes. ...................................................................................................... 55
Figure 3-8. A. Measured G (crosses) compared to theoretical predictions (line) based
upon Lui & Masliyah for laminar flow through coiled tubes (right). B.
Theoretical Gθ versus flow rate (left). ............................................................ 56
Figure 3-9. A. Effluent turbidity of tube settlers and floc blanket at 100 NTU and 55
mg/L alum dosage. B. Effluent turbidity of tube settlers and floc blanket at 500
NTU and 95 mg/L alum dosage. ...................................................................... 57
Figure 3-10. A. Effect of alum dosage on 100 NTU water. B. Effect of alum dosage on
200 NTU water. ................................................................................................ 58
Figure 3-11. A. Effect of alum dosage on 10 NTU water. B. Effect of alum dosage on
500 NTU water. ................................................................................................ 59
Figure 3-12. Empirical dosing model for the system studied. ...................................... 60
Figure 3-13. A. Effect of floc blanket height on floc blanket effluent performance. B.
Effect of floc blanket height on tube settler effluent performance. .................. 61
Figure 3-14. Effect of floc blanket height and flocculation in the flocculator on tube
settler effluent turbidity. ................................................................................... 62
Figure 3-15. Effect of floc blanket height on particle removal efficiency from both
tube settler and floc blanket effluent for the case where floc blanket influent
was not passed through a flocculator ................................................................ 64
Figure 3-16. Effect of floc blanket height on removal efficiency from both tube settler
and floc blanket effluents for flocculation conditions in the flocculator of G =
50 s-1 and θG = 11500. ................................................................................... 66
Page 11
x
LIST OF TABLES
Table 2-1. Summary of floc blanket research. ............................................................. 14
Table 2-2. Empirical models of hindered settling velocities ........................................ 19
Table 2-3. Mass flux models for floc Blankets ............................................................ 20
Table 3-1. Raw water characteristics ............................................................................ 43
Page 12
xi
LIST OF ABBREVIATIONS
AFR – Arbitrary Flow Reactor
ASCE – American Society of Civil Engineers
AWWA – American Water Works Association
CMFR – Constantly Mixed Flow Reactor
NOM – Natural Organic Matter
NTU – Nephelometric Turbidity Unit
PF – Plug flow
WTP- Water Treatment Plant
Page 13
xii
LIST OF SYMBOLS
clarifierA cross-sectional area of the clarifier (L2)
sA normal area of the tube settler (L2)
inC influent concentration (M/L3)
outC effluent concentration (M/L3)
d inner diameter of tubing (L)
D tubular floculator coil diameter (L)
ratiof ratio of the friction factor for curved tubing versus that for straight
G velocity gradient in viscous subrange (1/t)
Gθ dimensionless flocculation parameter, product of G and θ
floch height of floc blanket (L)
lh head loss (L)
waterh height of water that would produce the same pressure as floch (L)
L length of tubing (L)
DeN Dean number
*pC removal efficiency log out
in
CC
−
Q flow rate (L3/t)
V is the average axial velocity of flow (L/t)
upV upflow velocity in the clarifier (L/t)
growthV growth rate of floc blanket (L/t)
ratioV ratio of the upflow velocity to the capture velocity
Page 14
xiii
α angle of tube settler with respect to the horizontal
ε energy dissipation rate (L2/t3)
flocculatorθ hydraulic residence time of fluid in the hydraulic flocculator
clarifierθ hydraulic residence time of fluid in upflow clarifier (t)
floc fluidθ hydraulic residence time of fluid in floc blanket (t)
solidsθ residence time for solids in floc blanket (t)
ν kinematic viscosity (L2/t)
cv capture velocity of the tube settler (L/t)
waterρ density of water (M/L3)
bulk flocρ bulk density of floc blanket (M/L3)
Φ porosity of the floc blanket
Page 15
1
CHAPTER 1: INTRODUCTION
1.1. Background Information
Access to clean and affordable water is important for human health, economic
productivity, and environmental sustainability. Watershed management is paramount
for all communities, especially those utilizing a surface water source for consumption.
However, most surface water quality is well below minimum standards for human
consumption especially during rainy seasons which increase surface erosion and
runoff.
It is estimated that one billion people lack access to improved water sources as defined
by the UN (WHO, 2000). This figure does not include another estimated 1 billion
people with access to improved water sources (water transported in a pipe network)
that are not directly treated. By these estimates, there are two billion people without
access to safe drinking water. Thus, there is a need for a cost-effective solution to
provide safe drinking water for a large proportion of the world’s population currently
lacking safe drinking water. AguaClara is a unique project in the School of Civil and
Environmental Engineering at Cornell University that utilizes design, laboratory and
field research, as well as extensive community outreach and working partnerships to
provide cost-effective community-scale water treatment plants for the Global South.
Of the 2 billion people without access to clean drinking water, a quarter could utilize
turbid surface waters. A quarter of those utilizing untreated surface waters are
estimated to live in communities between 1000 and 50,000 people. Thus, an estimated
125 million people could be potentially served by AguaClara technology. AguaClara
water treatment plants utilize a gravity-driven treatment process train of rapid mix,
flocculation, sedimentation, and disinfection.
Page 16
2
This thesis presents the evaluation and optimization of effluent performance in an
upflow sedimentation tank with floc blanket and lamellar sedimentation. Optimization
of effluent performance in this system is crucial for achieving low turbidity water for
disinfection to be effective.
1.2. Overview of Research
Turbidity is a water quality parameter correlated with the concentration of suspended
colloidal particles. Turbidity measurement is based on light scattering caused by
suspended or colloidal material present in that liquid. The amount of light scattered by
a known standard (typically Formazin) provides the scale for measurement of turbidity
in Nephelometric Turbidity Units (NTUs).
Colloidal particles are of particular interest in water treatment because they correlate
with the presence of pathogenic organisms, interfere with disinfection, and negatively
impact drinking water quality. Colloidal particles (0.001-1.0 μm) are difficult to
remove by gravity sedimentation because of their low settling velocities.
Naturally occurring colloids typically have a negative surface charge and electrostatic
repulsion acts to hinder particle aggregation. Use of a coagulant such as alum
(Al2(SO4)3*14(H20)) is commonly employed in water treatment to neutralize the
negative colloid surface charge. Alum dissolves and forms positively charged species
such as Al+3, Al(OH)+2 and Al(OH)2+ that could adsorb to the surface of colloids.
Precipitation of Al(OH)3(s) also occurs on colloid surfaces. The solid surface charge
of Al(OH)3(s) is positively charged at circumneutral pH .
Aluminum can also form polymer species in water. In solution, Al2 to Al6 polymers
can form fairly rapidly, however longer polymers that aid bridging between floc
particles can take days to form utilizing alum. Different forms of polyaluminum
Page 17
3
chloride (PACl) can assist the formation of longer chain polymers facilitating bridging
between particles in much shorter time.
A rapid mix reactor is used to blend raw water and coagulant. There are two goals in
rapid mix. The first is large scale turbulent mixing that can be accomplished by a flow
expansion. The second goal in a rapid mix reactor is to achieve a high energy
dissipation rate (~ 0.5 to 1 W/kg) to provide small scale turbulent mixing so that
molecular diffusion can finish the mixing process in a few seconds.
Charge neutralization of the colloidal suspension allows particle aggregation and floc
formation. A flocculator with controlled energy dissipation rate and residence time is
used to promote floc particle growth. Particle size is correlated with the terminal
settling velocity of a particle. After flocculation the resulting larger, flocculated,
particles can be separated by gravity sedimentation (discussed in greater detail below).
After sedimentation, the clarified low-turbidity effluent is disinfected with an oxidant
such as calcium hypochlorite. The goal of disinfection is to kill or inactivate pathogens
present in the water. Chlorine disinfection is non-site specific and will act to oxidize
any organic with which it comes into contact. Therefore chlorine disinfection is less
effective at higher turbidities. Because there is no filtration in the AguaClara water
treatment process sequence, sedimentation is a key unit process for removal of
suspended and colloidal particles to minimize their interference with disinfection.
This thesis focuses on use of upflow floc blanket clarification technology as a tool for
producing high quality, low turbidity water. Performance is measured as the removal
of turbidity (correlating to concentration of colloidal particles). The operational
parameters that control floc blanket performance will be characterized and optimized
from the point of view of the operator. Optimization of parameters such as coagulant
dosing, and energy dissipation rate in the flocculator, and upflow velocity and floc
Page 18
4
blanket height in the clarifier, can provide better design guidelines to be utilized in the
creation of AguaClara sedimentation tanks.
1.2.1 Research objectives
Operational parameters that influence floc blanket performance include: raw water
turbidity, coagulant dose, upflow velocity in the floc blanket, height of the floc
blanket, and extent of flocculation of the suspension entering the floc blanket. Bulk
properties of the floc blanket, including solids concentration and bulk density, are
parameters that could be related to performance. Understanding how operational
parameters affect floc blanket performance is critical for application at a full-scale
clarifier. Without floc blanket observation and operational control of dosing, complete
loss of the floc blanket has been observed (AWWA/ASCE, 1990).
The focus of this research was to investigate parameters affecting floc blanket
performance given constant raw water turbidity and alum dose. Although conditions
of constant dose have been used by other investigators on a pilot and laboratory-scale
(Miller & West, 1968; Zhang et al. 2006), this research was unique with respect to the
wide range over which parameters were varied and the inclusion of both flocculation
and tube settlers in the experimental apparatus. Continuous monitoring of effluent
turbidity from both tube settlers (used to mimic lamellar plate settlers) as well as from
the floc blanket clarifier, and quantification of the energy dissipation rate and
residence time in the flocculator and floc blanket clarifier were also distinguishing
features of this research.
The research objectives were to characterize floc blanket performance with respect to
each of the variables listed above and to develop an understanding of the underlying
mechanisms that affect floc blanket performance. The experiments that were
conducted benefited from use of process control software developed by Weber-Shirk
Page 19
5
(2008) to automate operation of the laboratory-scale plant as well as to monitor and
record influent and effluent turbidity readings.
Page 20
6
CHAPTER 2: LITERATURE REVIEW
The following sections present a review of conventional sedimentation and floc
blanket technology as well as a discussion and review of coagulation, flocculation, and
lamellar sedimentation processes.
2.1. A Review of Sedimentation Technology
Horizontal flow sedimentation has been utilized in many water treatment applications
including the first AguaClara sedimentation tank design employed in La 34, a rural
community in northern Honduras. The tank was designed with a surface loading rate,
i.e., the total flow rate ( Q ) divided by the plan surface area ( sA ), equal to the terminal
settling velocity of the smallest diameter particle size ( cV ) to be completely removed
as shown in equation (2-1)
s
c AQV = ( 2-1)
A simplistic model of sedimentation is to consider that flocs in the sedimentation
undergo discrete settling. Discrete settling assumes that the settling particles will have
no interaction with other particles in the system and that the terminal settling velocity
of the particle ( tV ) can be calculated based upon the particle diameter. The capture
velocity of the sedimentation tank ( CV ) can be used to estimate sedimentation tank
performance based upon the terminal settling velocity of the particle and the height of
the particle in the sedimentation tank.
An estimate of floc terminal velocities, tV , of a particle of diameter ( d ) can be
calculated based upon Stoke’s law for spherical particles shown in (2-2). In reality a
floc particle is not spherical and this is corrected by a shape factor term,Θ given a
value of 2445 by Tambo & Wantanabe (1979). A drag coefficient, dC , can be
calculated in equation (2-3) by the Reynolds number (Re) and shape factor. The
Page 21
7
Reynolds number as shown in equation (2-2), Re, is calculated based upon the
diameter of the floc particle, d , and the kinematic viscosity of the fluid, ν .
water
waterfloc
dt C
gdVρ
ρρ )(34 −
= ( 2-2)
Θ
=
Re24
dC ( 2-3)
ν
dVt=Re ( 2-4)
Where: g is acceleration due to gravity, flocρ is the density of a floc particle, and
waterρ is the density of the water.
Tambo & Wantanabe’s model (1979) for predicting terminal velocity assumes that a
floc is a solid object. Wu and Lee (1998) argued that, for a highly porous structure like
that present in a floc, water would not just pass around, but through the floc. Because
of the highly porous nature of the flocs, Stokes model which is applicable up to a
Reynolds number of 40 should account for flocs up to sizes on the order of 1 mm.
There are several additional considerations in horizontal flow sedimentation tank
design:
• The horizontal flow velocity of water in the tank should be low enough that
settled particles are not re-suspended. Scouring can occur from the turbulent
motion of eddies as well as potentially high energy dissipation rate from jets at
the inlet.
• The particle collection system should minimize re-suspension of settled
particles.
Page 22
8
• The inlet should be designed so that floc breakup is minimized. If significant
floc breakup occurs at the inlet, then particle capture efficiency of the tank will
be reduced.
These considerations and the design recommendations of Schulz and Okun (1984)
guided the design at La 34. Schulz and Okun (1984) specified a capture velocity to be
between 20 to 60 m/day and a particle residence time of 1.5 to 2 hours. In reality, the
tank at La 34 had a particle capture velocity between 20-30 m/day and a residence
time closer to 3 hours. The tank was 3 m deep allowing flocs a greater opportunity to
collide via differential sedimentation and Brownian motion compared to shallower
tank designs.
A drawback to the horizontal flow design at La 34 was the cost of construction of a
sedimentation tank with a volume sufficient to allow a hydraulic residence time of
three hours. The 3 m height and the target capture velocity of 20-30 m/day were the
critical design constraints. While the 3 m height would act to maintain relatively
quiescent flow in the tank, the height of the tank complicated its construction because
of the structural stress associated with pressures of 3 m of water height.
Subsequent AguaClara designs beginning with the Ojojona plant utilized vertical flow
sedimentation. Compared to horizontal flow sedimentation, vertical flow
sedimentation can reduce the required reactor volume while maintaining similar levels
of treatment (Tchobanoglous & Schroeder, 1987). In vertical sedimentation, each
particle in the reactor has an upflow velocity ( upV ) counteracting the particle’s
terminal settling velocity. The upflow velocity is the flow rate divided by the plan area
of the tank ( sA ) as shown in equation (2-5).
s
up AQV = ( 2-5)
Page 23
9
Both horizontal flow and vertical flow sedimentation tanks can utilize plate settler
technology. Saleh and Hamoda (1999) showed that plate settler technology could
increase removal efficiency in a sedimentation tank while decreasing the required plan
area of the sedimentation tank. Plate settler systems are a series of inclined plates
situated slightly below the surface of a sedimentation tank. The plates are designed to
allow particles to settle on their surface and then slide back down into the
sedimentation tank.
Plate settlers decrease the capture velocity in the clarifier. The capture velocity is
based upon the size of the particle to be captured and this is, in turn, based upon
consideration of the desired effluent turbidity. Schulz and Okun (1984) recommend
capture velocities between 10 and 30 m/day. AguaClara facilities are currently
designed with a capture velocity of 10 m/day.
At appropriate upflow velocities in a vertical flow sedimentation tank, a fluidized bed
of particles called a floc blanket will form. For the fluidized bed of flocs, it is
important to consider the extent of fluidization. A fluidized bed expands as upflow
velocity increases. The maximum fluidization velocity is the highest upflow velocity
possible before the fluidized bed is washed out. Above the maximum fluidization
velocity, all floc particles that enter should theoretically be lost to the effluent. A floc
blanket is unique as a fluidized bed because the particles can change composition over
time and the size distribution of particles in the floc blanket is variable and depends
upon previous flocculation and coagulation processes.
In most sedimentation basins with a floc blanket, a relatively clear effluent layer lies
just above the floc-water interface. Floc blankets are thought to facilitate particle
removal because of increased particle-particle interactions that lead to flocculation
(Tchobanoglous et al, 2003) and filtration (Miller & West, 1968) occurring in the floc
Page 24
10
blanket. Figure 2-1 illustrates the layers in a floc blanket clarifier including the
clarified portion above the floc blanket, the floc-water interface, and the fluidized bed
of flocs forming the floc blanket. Particle concentration in a floc blanket is relatively
constant throughout except at the bottom of the reactor (Gould, 1969) where
concentration dramatically increases and compression settling may occur.
Figure 2-1. Diagram of fully formed floc blanket in experimental reactor.
2.2. Floc blanket technology
While floc blanket technology has been documented since the 1930s, there has been
very little published research related to this topic in the past eight decades. Existing
literature includes reports of experimental observation of floc blankets, investigations
of floc blanket stability, and empirical models that consider mass flux. However, there
is still a lack of a fundamental understanding of how floc blankets work.
A central goal of this research was to optimize particle removal in a process train of
rapid mix, flocculation, floc blanket clarification, and lamellar sedimentation. Prior
Page 25
11
research has not studied or optimized the performance of a floc blanket in this
complete process train. There is also a lack of understanding of particle removal
mechanisms in a floc blanket and no mechanistic models exist that can predict floc
blanket performance. A new focus on colloid removal mechanisms is necessary in
understanding the role of floc blankets in particle removal.
Much of the current literature pertains to observational and mass flux studies of floc
blankets. In much of the literature, flocculation and coagulation processes used prior
to vertical flow sedimentation are poorly characterized. Unlike previous studies, this
study utilized laboratory-scale laminar flow flocculation that permitted conditions in
the flocculator to be characterized and controlled. Residence time and energy
dissipation rate can be varied by changing the length of tubing, flow rate, coil radius or
inner tube diameter (see Chapter 3 for more details).
The current study also included continuous monitoring of influent and effluent
turbidity from both the clarifier and a subsequent tube settler at a set capture velocity
of 10 m/day. Previous studies with floc blankets have not included lamellar
sedimentation subsequent to the floc blanket except for those of Galvin (1992). In
other laboratory studies by Su et al. (2004), Sung et al. (2005a), Sung et al. (2005b),
and Zhang et al. (2006), effluent turbidity was reported for a 30 minute or 2 hour
settled grab sample from the top of the clarifier. These studies did not specify the
sedimentation column height and thus it is not possible to compare their results with
full scale performance or to the results obtained in this study.
It is also reasonable to expect that floc blanket performance and stability are
dependent on the preceding coagulation and flocculation processes. However,
flocculation was not optimized in prior studies nor was it a variable of consideration,
and no prior investigators made an attempt to compare flocculation conditions or make
Page 26
12
a strong connection between flocculation and floc blanket performance. Instead floc
blanket performance comparisons have been made for results that may have been
obtained under different coagulation and flocculation conditions. Most of the available
studies involving floc blankets are scant on details surrounding flocculation and
coagulation making it impossible to replicate such research.
Frequently, literature studies have studied mass flux and correlated mass flux with floc
blanket stability and in many cases performance. Although mass flux is dependent on
floc sedimentation velocity, it is not the dependent parameter that matters in assessing
effluent performance in a water treatment plant. The dependent parameter for effluent
performance emphasized in this study is residual turbidity after sedimentation.
Much of floc blanket research has focused on mass flux in a floc blanket. This focus
may result from the notion that floc blankets are unstable and particle carryover can
easily occur with changes in coagulant dosing, upflow velocity, or influent turbidity
(AWWA/ASCE, 1990, Chen et al., 2004, and Chen et al., 2006). Gregory (1979)
reported that floc blanket operation was optimal (operation was not defined and it was
not necessarily based on particle capture efficiency) when the mass flux (kg/m2-day)
through a floc blanket was maximum. Letterman et al. (1999) found that a floc blanket
gave best clarifier effluent at solid fluxes 60-75% of the maximum solid flux.
However, this research offered no mechanistic understanding of why 60-75% of the
maximum flux would give optimal clarifier performance.
Page 27
13
In addition, in a process train that includes plate settlers, optimal turbidity removal
measured at the effluent of the floc blanket is not necessarily correlated with turbidity
removal measured at the effluent of the plate settlers. Table 2-1 summarizes reported
observations of floc blanket performance and studies of mass flux in floc blankets.
The table lists the type of study conducted, the scale of the study, the conditions under
which particles were flocculated and the nature of results that were obtained.
Page 28
14
Table 2-1. Summary of floc blanket research Author Type of study Rapid mix/
flocculator conditions
Parameters investigated
Sampling and results
Chen (2003)
Continuous observation at full scale
Combined rapid mix/ flocculation tank: Q = 380,000 m3/day ; ∀= 1600 m3
Influent turbidity and PACl dosage
Grab samples. Measured settleability of sludge, zeta potential, particle size
Chen et al. (2006)
Continuous observation at full scale. Investigation of the role of charge reversal
Combined rapid mix/ flocculation tank: Q = 380,000 m3/day ; ∀= 1600 m3
Influent turbidity, effluent turbidity from clarifier, effluent turbidity from sand filter, pH and PACl dosage
Hourly grab samples. measured influent and effluent turbidity, pH, zeta potential in samples 4 m from top of clarifier, at top of clarifier and subsequent to a sand filter
Galvin (1992)
Continuous observation of lamellar sedimentation with a floc blanket clarifier at full scale
Unclear Influent turbidity, effluent turbidity from lamella alum dosage, upflow velocity, natural organic matter (NOM)
Grab samples. Measured turbidity and NOM concentration from effluent of lamella
Page 29
15
Table 2-1. (continued)
Author Type of study
Rapid mix/ flocculator conditions
Parameters investigated
Sampling and results
Head et al. (1996)
Continuous observation at full scale. Performance modeling based upon CMFR model by Gregory (1979)
Unclear Influent turbidity, effluent turbidity from clarifier alum dosage, and temperature
Hourly grab samples. Measured turbidity from clarifier and solids concentration and compared to model predictions.
Lin et al. (2004)
Semi-continuous observation of full scale and pilot plant. Study of two-stage and one-stage clarification
Pilot Plant: Jar test conditions simulating rapid mix and flocculation for pilot plant: 90 rpm for 1.5 min; 50 rpm for 8.5 min
Full Scale: Combined rapid mix/flocculation tank: Q = 380,000 m3/day ; ∀= 1600 m3
Influent turbidity, effluent turbidity from clarifier, effluent turbidity after rapid mix, and PACl dosage
Grab samples. Measured from residual turbidity at top of clarifier and after rapid mix. Measured solids concentration and particle size at different reactor heights
Miller & West (1968)
Continuous observation of pilot plant
Flocculation occurred in clarifier:
clarifierd = 12” ; upV = 4-
20 ft/hr
Influent turbidity, effluent turbidity from sand filter, pH, alum dosage, and upflow velocity
Grab samples. Measured residual turbidity from sand filter. Measured pH, and solids concentration over height in the floc blanket
Page 30
16
Table 2-1. (continued)
Author Type of study
Rapid mix/ flocculator conditions
Parameters investigated
Sampling and results
Purushothaman & Damodara (1986)
Continuous performance study
Flocculator: 600 mm height 12-40 mm pebbles. Coagulation provided by 6-90 degree bends
Alum dosage and fluoride concentration
Fluoride concentration measured in grab samples from floc blanket effluent
Su et al. (2004)
Batch laboratory-scale and full scale study
Pilot Plant: Flocculation/ coagulation: Jar Test: 90 rpm for 1.5 min 50 rpm for 8.5 min Full Scale: Combined rapid mix/flocculation tank: Q = 380,000 m3/day; ∀= 1600 m3
Upflow velocity, influent turbidity, PACl dosage, 2 hour settled turbidity and floc blanket height
Measured batch flux, floc blanket height, solids concentration, and 2 hour settling time residual turbidity in samples from the clarifier
Sung (2003)
Laboratory-scale and full scale solid flux study
Flocculation/ coagulation: Jar Test: 90 rpm for 1.5 min 50 rpm for 8.5 min
Upflow velocity, PACl dosage, influent turbidity, floc blanket height, natural organic matter (NOM)
Measured solid flux, floc blanket height, solids concentration, particle size
Page 31
17
Table 2-1. (continued)
Author Type of study Rapid mix/ flocculator conditions
Parameters investigated
Sampling and results
Sung et al. (2005a)
Batch laboratory-scale solid flux and performance study
Flocculation/ coagulation: Jar Test: 90 rpm for 1.5 min 50 rpm for 8.5 min
Upflow velocity, PACl dosage, influent turbidity, 2 hour settled turbidity from clarifier, floc blanket height, natural organic matter (NOM)
Measured solid flux, floc blanket height , solids concentration, and 2 hour settling time for residual turbidity from clarifier
Sung et al. (2005b)
Batch laboratory-scale solid flux and performance study
Flocculation/ coagulation: Jar Test 90 rpm for 1.5 min 50 rpm for 8.5 min
Upflow velocity, PACl dosage, influent turbidity, 2 hour settled turbidity from clarifier, floc blanket height, natural organic matter (NOM)
Measured floc blanket height, solids concentration, and 2 hour settling time for residual turbidity from clarifier Report 2-D and 3-D solid flux curves (upflow velocity and solids concentration (2-D) and dosage (3-D) )
Zhang et al. (2006)
Semi-continuous laboratory-scale study comparing one-stage and two stage clarification
Flocculation/ coagulation:
G = 350 s-1 for 2 min G = 27.5 s-1 for 10 min
Influent turbidity, 30 minute settled turbidity from clarifier, upflow velocity, PACl dosage
Grab samples from clarifier. Measured residual turbidity after 30 minute settling
Page 32
18
Based on Gregory’s and Letterman’s early work that considered mass flux in floc
blankets, more recent mass flux studies were conducted (Chen et al., 2004, Lin et al.,
2004, Su et al., 2004, and Sung et al. 2005a) which related solids concentration and
upflow velocity and empirical models were developed. Empirical mass flux models in
turn relied upon empirical models of hindered settling velocity of floc particles in the
floc blanket. Theoretically, if wasting of flocs is neglected, the hindered velocity of
flocs ( HV ) will be counterbalanced by the fluid upflow velocity ( upV ). A
simplistic relationship given by Gould (1974) for the change in floc blanket height
over time ( dHdt
) that neglects floc wasting and floc input is shown in equation ( 2-6).
Hup VV
dtdH
−= ( 2-6)
Gregory (1979) and later Letterman (1999), Chen (2003), Su et al. (2004) expanded
upon Gould’s work. Later empirical models of hindered settling velocity are shown in
Table 2-2.
Page 33
19
Table 2-2. Empirical models of hindered settling velocities Author Model
Barnea & Mizrahi (1973) nTH qCVV *)1( −=
Where:
*C is the measured floc blanket concentration based upon a 30 minute settling test, q is a shape factor, TV is the terminal settling velocity based upon Stoke’s Law and n is an empirical exponential constant
Gregory (1979)
Letterman (1999)
*)1( 2Φ−= kVV TH
Where:
*Φ is the porosity of the floc blanket and 2k is estimated from the ratio of the concentration at the compression point in a batch flux curve to the half-hour settled concentration (typically around 2.5)
Chen et al. (2003) )0.5exp( STH CVV −=
Where:
SC is the solids concentration in the floc blanket
Semi-empirical models of mass flux through a floc blanket (some of which employ
hindered settling velocity) are listed in Table 2-3.
Page 34
20
Table 2-3. Mass flux models for floc blankets Author Type Model
Sung and Lee (2005)
Plug flow reactor for solid flux
( )( )0up HC V V CC
t z∂ −∂
+ =∂ ∂
Where:
C is the average concentration of the floc blanket
upV is the upflow velocity of the floc blanket
Chen et al. (2003)
Arbitrary flow reactor for solid flux
( )z
VVCzCD
tC Tup
∂−∂
−∂∂
=∂∂
2
2
Where:
D is the dispersion coefficient
Gregory (1979)
Constantly mixed flow reactor for solid flux
exitssfl
exito CAVL
HCkCCQ
dtdC
∀
+−−∀
=*
)(
Where:
sV is settling velocity of primary particles entering the tank
flk is the flocculation factor reflecting the collision
efficiency of floc particles
H is the height of the floc blanket above the bottom of the tank
∀ is the volume of the clarifier
oC and exitC are the concentration of floc particles coming into and exiting the floc blanket
L is the height of the tank
sA is plan area of the clarifier.
Page 35
21
Head et al. (1997) utilized Gregory’s CMFR model (1979) to predict the effluent
turbidity of a floc blanket clarifier. Although, Head et al. (1997)’s model showed a
good correlation between Head’s experimental data and Gregory’s model, this doesn’t
mean that the model can be generalized. Head et al. (1997) utilized a flocculation
factor in fitting Gregory’s CMFR model, so the researchers showed a model with
performance correlated with bed height that could fit the data for the conditions at
their WTP.
A CMFR model is a simplistic way to describe how large solid particles behave in the
floc blanket portion of the clarifier. However, colloidal and smaller floc particles that
have low settling velocities relative to the upflow velocity are expected to behave
more like the fluid moving through the floc blanket. Simply investigating fluid
dynamics in a floc blanket does not elucidate mechanisms of particle removal or
reveal how floc particles are interacting in the floc blanket. Models incorporating
CMFR, AFR or PRF do not capture the complexities of either filtration or flocculation
mechanisms that could be occurring in the floc blanket, but could if these mechanisms
were incorporated.
2.3. Flocculation
A problem with current design guidelines for floc blanket reactors is that flocculation
prior to floc blanket formation has not been well characterized. No study has shown a
correlation of particle removal efficiency obtained using floc blanket clarification and
flocculation in the process train preceding a floc blanket. It seems reasonable to expect
that the size of flocs and the efficiency by which colloid (primary) particles have been
removed in flocculation will affect the effluent turbidity of a floc blanket clarifier. Su,
et al. (2003) have reported that the changes in floc properties can affect floc blanket
stability and performance.
Page 36
22
Flocculation parameters including residence time and energy dissipation rate will
affect the properties of individual floc particles. While colloidal particles such as clay
are crystalline in structure, flocculated particles are porous and have an irregular
geometry. As flocs grow, they become more porous and less dense and the geometry
of floc aggregates can be approximated by the floc fractal dimension. The fractal
dimension accounts for the floc particle porosity and higher fractal dimensions have a
more compact floc structure (Jarvis et al. 2005). Flocculated particles created by
aluminum hydroxide precipitation are reported to have fractal dimensions between 2.1
to 2.3 (Lambert et al. 2003; Li and Ganczarczyk 1989).
The history of how a floc was formed including energy dissipation rate and flocculator
residence time could affect floc strength. Yeung and Pelton (1996) indicated that
energy dissipation rates are related to floc breakup which, in turn, is related to strength
of a floc particle. Francois (1987) found an increase in floc strength for flocs formed
with higher energy dissipation rates as well as stronger flocs for increased residence
time in the flocculator. Floc strength also increases as floc compaction increases
because the number of bonds holding the floc together increases. Meakin (1988) found
that a floc with three contact points (bonding points) had a higher fractal dimension
than a floc with two contact points. Higher energy dissipation rates in a flocculator as
well as higher residence time are correlated with a higher fractal dimension and
stronger floc. Cailleaux et al. (1992) correlated higher performance with longer
residence time in a mechanically mixed turbulent flocculator. At a constant energy
dissipation rate removal efficiency (determined as the difference between effluent
values after a thirty minute settling test from the flocculator and influent values)
increased from 67% after a residence time of 6 minutes to 86% after a residence time
of 17 minutes.
Page 37
23
While more collisions and longer residence time for collisions intuitively produce
larger floc particles, there are not consistent design guidelines in place for
flocculation. For mechanical flocculation, recommendations of applicable values of
“velocity gradient” (G) as well as residence time (θ) vary depending on the literature
source. Use of G is fundamentally appropriate only for laminar flow reactors, but
continues to be used in literature for turbulent flow reactors. A G of 75 s-1 in turbulent
flow conditions and residence time of 12.5 minutes are often recommended for 80%
removal of turbidity (Cailleaux et al., 1992) (Gθ = 56,000). For hydraulic flocculation,
as is used in AguaClara facilities, Schulz and Okun (1984) recommend a G between
20-100 s-1 and residence time between 17 to 25 minutes (Gθ = 20,000-150,000).
Thus, the recommendations for hydraulic and mechanical flocculation are of the same
order of magnitude for G and Gθ.
The goal of this research is to produce water with very low residual turbidity. An
understanding of conditions in a flocculator by which floc particles will effectively
flocculate will enhance performance in subsequent floc blanket and plate settler
processes. Effective flocculation will produce flocs that settle fast enough to be
removed by the plate settlers or by the floc blanket. The research described in this
thesis includes a comparison of floc blanket performance with and without particle
passage through a flocculator.
2.4. Coagulation
Coagulation destabilizes the negative charge of colloids allowing subsequent
flocculation. However, charge neutralization cannot be thought of as the singular
method involved in forming flocs. Floc formation requires the interaction of both
contact with raw water colloidal particles and formation of amorphous aluminum
hydroxide precipitate from the coagulant (Letterman et al., 1999). Alum
Page 38
24
(Al2(SO4)3*14H20) was the coagulant used in this research because that is the
coagulant utilized in AguaClara plants, but other aluminum based coagulants would
also work. Precipitation of alum is most effective in the pH range 6-7.5 as shown by
the pC-pH diagram (Figure 2-2).
Figure 2-2. Diagram of potential aqueous aluminum species formed from the
hydrolysis of alum (Reckhow, 1999).
At high alum dosages, pH can dramatically decrease if the treated water does not have
sufficient alkalinity. If the pH drops below the effective range (i.e., below pH ≈ 6),
Page 39
25
then aluminum hydroxide precipitation and the production of flocculated particles will
be inhibited.
In coagulation, alum will consume an amount of alkalinity based upon stoichiometric
considerations. Each aluminum ion produced by hydrolysis of alum should consume
three hydroxides in water to produce aluminum hydroxide as shown in equation ( 2-7).
[ ] [ ] OHOHAlOHOHAl saqaq 2)(3)()(3
62 6)(3)( +→+ −+ ( 2-7)
Insufficiently buffered systems would experience a decrease in pH after addition of
alum and aluminum speciation would be shifted to favor Al+3 and AlOH+2. At low
pH, aluminum species will not precipitate, so coagulation will be less efficient and
flocculation of particles will be suboptimal. Under conditions of low alkalinity, lime
(Ca(OH)2) or an alternative base can be used to replace the hydroxide consumed by
aluminum hydroxide precipitation to maintain optimal pH conditions for flocculation.
A wide range of applicable alum dosages may be employed to give similar
performance as long as the solution is sufficiently buffered (Xiao et al. 2008a) (Figure
2-3).
In decreasing solution temperature to 2 °C, Xiao et al. (2008a) postulated that there are
two stages to coagulation: the first stage was characterized by the growth of very small
floc particles which is akin to rapid mix of a WTP. The low temperature purportedly
slowed the reaction kinetics enough to reveal the first stage is a diffusion driven
process. Alternatively, one could think of molecular diffusion as the rate limiting step
in rapid mix because sufficient mixing of the raw water and coagulant is required
before precipitation and growth of small floc particles. Although not explicitly
studied, at higher temperatures, molecular diffusion could still be a rate limiting step
depending on the residence time in rapid mix.
Page 40
26
Small particles that were observed in the first stage, rapid mix, only had adsorbed
aluminum, and thus were very compact with a high fractal dimension. The second
phase, rapid floc growth, occurred as very small floc particles begin to collide to form
more porous flocs characterized with a smaller fractal dimension. Alternatively, the
second phase could be thought of as the flocculation phase of a WTP. Xiao et al.
(2008b) speculated that residual turbidity will be higher and alum dose will be
ineffective except over narrow ranges unless diffusion occurs in rapid mix allowing
rapid floc particle growth.
In Figure 2-3, at 2ºC, the sample was more sensitive to alum dose and performed
worse at each alum dose compared to the 22ºC. The sample at 2ºC purportedly slowed
the reaction kinetics sufficiently to prevent some molecular diffusion from occurring
so that first and second stage rapid floc growth was limited. Limiting floc growth in
Xiao et al.’s (2008b) study was correlated with increased residual turbidity in solution.
Page 41
27
Figure 2-3. Effect of alum dosage on residual turbidity and on solution pOH after 1
min of alum addition (Initial pOH = 6.1, Initial turbidity = 3.3 NTU) (Xiao et al.,
2008a).
Van der Waals attractive particle forces between particles can overcome repulsive
forces if the particle surface charge is not completely neutral. Slight overdosing or
underdosing of alum will produce similar performance. Although a wide range of
applicable alum doses exist for waters with sufficient alkalinity, two different dose-
based mechanisms for coagulation are commonly described: charge neutralization and
sweep floc.
Page 42
28
Charge neutralization is reported as a predominant mechanism utilized when the goal
of the treatment plant is to form large, settleable floc particles (Letterman et al., 1999).
The idea of charge neutralization is that the coagulant will destabilize the negative
surface charge of the colloid sufficiently to allow particle collisions between
destabilized colloids to occur. Charge neutralization can be expected to be
stoichiometric, if one knows the surface charge of the colloid, then one can add a
sufficient amount of coagulant to neutralize that charge. However, there is no evidence
from laboratory testing (Figure 3-12) that there is a simple stoichiometric relationship
between alum dose and clay concentration, and the lack of a simple stoichiometric
relationship suggests something more complicated than charge neutralization is
occurring.
AguaClara utilizes alum as a coagulant. Alum will dissolve in water forming
positively charged aluminum species and sulfate shown in equation ( 2-8).
−+ +↔ 24
3342 32)( SOAlSOAl ( 2-8)
While pH certainly has an enormous effect on solution chemistry as well as surface
charge, cations and anions can also bind to the surface of particles competing with
aluminum hydrolysis products for these surface sites. Sulfate is a predominant anion in
solution when alum is used as the coagulant.
Letterman (1983) utilized a jar test to test the variables of pH and sulfate concentration
on flocculation efficiency. Letterman (1983) tested the extent of particle removal
when sulfate was present and not present in the system. When the sulfate ion was not
present, charge neutralization and charge reversal was only possible in a narrow span
of aluminum coagulant dosing and pH. There only existed a narrow window where
Page 43
29
turbidity removal could be achieved by charge neutralization before particle repulsion
from charge reversal by positive charge dominated the solution.
However, in the presence of sulfate, the electrostatic charge of particles in the solution
remained near neutral over more than 4 orders of magnitude change in alum dose. The
charge neutralization in this case was explained by the adsorption of sulfate ions on
positive surface sites acting to neutralize surface charge over a wider range of
coagulant doses. Another interesting note is that turbidity removal improved with
coagulant dose and this improvement may have been due to the increased floc volume.
Sulfate and other anions have a high affinity for the aluminum hydroxide surface
present on a flocculated particle (Letterman, 1983), thus sulfate adsorption reactions
on the aluminum hydroxide surface affect the stoichiometry of charge neutralization.
These adsorption reactions suggest that there is not a simple relationship between
alum dose and turbidity in the raw water. Hohl et al. (1980) was first to describe the
surface reactions between sulfate and aluminum hydroxide described below in
equations ( 2-9) and ( 2-10) where AlOH denotes the aluminum hydroxide surface site.
−+−+ +↔++ 242
24 SOHAlOSOHHAlO ( 2-9)
432
42 SOHAlOHSOHAlO ↔++ +−+ ( 2-10)
Letterman and Iyer (1985) utilized a model to predict the effects of solution and
suspension variables of flocculation efficiency when aluminum salt coagulants were
utilized. The studies of Letterman (1983) and Letterman and Iyer (1985) determined
that pH as well as sulfate concentration had a direct effect on charge neutralization and
ultimately flocculation processes.
There also is competitive interaction of additional adsorbing anions such as
bicarbonate and fluoride in charge neutralization processes. Additionally, positively
Page 44
30
charged species present in the water can interact with the surface. While the chemistry
of the actual system can be quite complex, charge neutralization appears to be an
important mechanism of coagulation when utilizing an aluminum salt as a coagulant.
Under most conditions, alum dose will be high enough so that precipitation reactions
dominate. It is expected sulfate and other anions will adsorb on the surfaces of
)()( 3 sOHAl particles, in effect, aiding in further charge neutralization that is
relatively insensitive to changes in alum dose at circumneutral pH. The efficiency of
flocculation is expected to increase proportionally the amount of metal hydroxide
precipitate in solution that acts to enmesh particles in sweep flocculation. Sulfate
adsorption keeps the surface charge of all species near neutral and so sulfate
adsorption is probably important in forming sweep floc. It appears from available
information that precipitation reactions are more likely than charge neutralization to be
a determinate factor in determining coagulation and flocculation efficiency.
Xiao et al. (2008b) found that coagulation of particles by charge neutralization to be a
slow process unless voluminous hydroxide precipitates are formed in the solution.
Counter to previous results, Xiao et al. (2008b) reported that flocs could grow in
environments of positive (charge restabilization) and negative (charge neutralization)
electrophoretic mobility, while flocs did not always grow in environments where there
was neutral electrophoretic mobility. Further testing is needed to confirm these
findings.
Xiao et al.’s (2008b) study reported that enmeshment by floc particles could occur in
spite of repulsive surface charges and a predominant factor of floc formation was the
pH of the solution. Floc formation is believed to occur between pH ranges of 6.5-7.5
as illustrated in Figure 2-4.
Page 45
31
Figure 2-4. Aluminum solubility diagram in equilibrium with amorphous Al(OH)3(s)
based on thermodynamic data, and floc formation region based on experimental
observations. Lines 1, 2, 3, 4, 5, 6, 7, 8 represent the concentrations of [Al3(OH)4]5+ ,
[Al2(OH)2]4+ ,[Al13O4(OH)24]7+ , Al3+, Al(OH)2+, Al(OH)2+ , Al(OH)4
− , Al(OH)3(s),
respectively (Xiao et al., 2008b).
2.5. Lamellar Sedimentation
Plate settlers allow for the operator to significantly decrease the capture velocity,
while maintaining the same upflow velocity in the clarifier. At an angle of 40º or
greater, particles in tube settlers tend to slide down because of gravity (Degremont,
1985). Galvin (1992) found that sludge that slipped down tube settlers back into the
clarifier had good settling properties. The observation seems to indicate that some of
the particles captured by tube settlers could grow in size as the flocs slide down the
plate settler in an avalanche. The larger particles would then fall into the floc blanket
below. Lamellar sedimentation could be important for low turbidity water, because it
Page 46
32
would return solids that escape the floc blanket back to the floc blanket. Thus plate or
tube settlers could make it possible for floc blankets to be stable with lower turbidity
waters. Returning solids could increase particle concentration in the floc blanket and
could enhance floc blanket performance by increasing particle-particle interactions.
If designed correctly, lamellar sedimentation could significantly improve performance.
The current AguaClara design for plate settlers provides a capture velocity of 10
m/day. While the plate settlers can capture all particle sizes, with proper flocculation
and subsequent removal of particles through a floc blanket, a very small proportion of
particles would end up in the effluent because a large proportion of particles’ terminal
settling velocity would exceed the capture velocity of the plate settlers.
Counterintuitive to the idea that lamellar sedimentation would improve performance,
some reviews from literature indicate that lamellar sedimentation does not enhance
floc blanket performance. The 5th edition (1999) Water Quality and Treatment: A
Handbook of Community Water Supplies states:
"Inclined Settling with Floc Blankets. Tube modules with the typical spacing
of 50 mm between inclined surfaces are not cost-effective in floc-blanket tanks
(Gregory, 1979). With the blanket surface below the tube modules, the settled-
water quality is no better than from a stable and efficient tank without
modules. With the blanket surface within the modules, the floc concentration
in the blanket increases by about 50 percent, but no commensurate
improvement in settled-water quality occurs. The failure of closely spaced
inclined surfaces to increase hindered settling rates relates to the proximity of
the surfaces and a circulatory motion at the blanket surface that counteracts the
entrapment mechanism of the blanket (Gregory, 1979). The problem with
closely spaced surfaces diminishes with more widely spaced inclined surfaces.
Page 47
33
An effective spacing is about 0.3 m, but no optimization studies are known to
have been published. Large (2.9 m) plates, however, have been shown to be
preferable to shorter (1.5 m) plates (Casey, O'Donnel, and Purcell, 1984). The
combined action of suppressing currents and inclined settling with widely
spaced surfaces can result in about a 50% greater throughput than with a good
floc blanket without inclined surfaces. The proprietary Superpulsator tank is
the Pulsator design with widely spaced inclined surfaces."
Galvin (1992) conducted a study that compared floc blanket performance with and
without lamella. The study found similar removal efficiency when upflow velocity
increased from 75 m/day without lamella to 120 m/day with the addition of lamella.
The study treated water with both NOM (25-50 on the color scale) and turbidity (6-30
NTU). Average effluent readings for both cases ranged from 1.6 to 4.0 NTU. After
sedimentation, the effluent water was passed through a filter so there was no need for
floc blanket performance to be optimized and instead this research focused upon
gaining more throughput through the clarifier.
Contrary to the findings of other authors, Saleh and Hamoda (1999) observed that
plate settler technology could increase removal efficiency in a sedimentation tank
without a floc blanket while decreasing the overall volume of the sedimentation tank.
Sarkar, et al. (2006) developed a model to predict plate settler efficiency based upon
plant flow rate and plate settler geometry. In their model, efficiency is dependent on
particle size as well as the initial concentration of solids.
It seems that performance of the plate settlers would be dependent on floc blanket
characteristics such as the size of particles in the effluent from the floc blanket. Plate
settler performance could enhance clarification performance, but is also dependent
upon properties of the floc blanket. A more robust model will need to be developed to
Page 48
34
correlate floc blanket properties and particle size distribution with plate settler
performance.
Page 49
35
CHAPTER 3: PARAMETERS AFFECTING STEADY-STATE FLOC BLANKET
PERFOMANCE1
3.1. Parameters affecting steady-state floc blanket performance
3.1.1 Abstract
A laboratory-scale reactor was used to simulate a water treatment process sequence of
rapid mix, hydraulic flocculation, upflow clarification with a floc blanket, and lamellar
sedimentation to accomplish removal of colloidal particles. This process sequence,
followed by chlorination, has been employed to create affordable designs for water
treatment in the Global South. This study focused on variables affecting performance
of the floc blanket including: condition of hydraulic flocculation, raw water turbidity,
coagulant dose, upflow velocity through the floc blanket, floc blanket height, and bulk
density and solids concentration of the floc blanket. An upflow clarifier velocity
between 90-110 m/day produced the best floc blanket performance for most influent
turbidities studied. The results show that particle removal efficiency in lamellar
sedimentation improved linearly with respect to floc blanket heights up to 45 cm.
Improved performance is also correlated with increased hydraulic flocculator
residence time and energy dissipation rate. At floc blanket heights above 45 cm, there
is still improvement in performance for most cases, but improved performance and
blanket height no longer follow a linear relationship. Lamellar sedimentation with a
capture velocity of 10 m/day is a key component in improving clarifier performance
1 The contents of this chapter have been submitted to Aqua for publication with co-
authors: Dr. M. Weber-shirk and Prof. L. Lion
Page 50
36
when utilizing a floc blanket. Future studies are needed to determine mechanisms of
particle removal in a floc blanket.
Keywords: AguaClara, floc blanket, flocculation, upflow sedimentation
3.1.2 Nomenclature
clarifierA cross-sectional area of the clarifier (L2)
sA normal area of the tube settler (L2)
inC influent concentration (M/L3)
outC effluent concentration (M/L3)
sC concentration of solids (M/L3)
d inner diameter of tubing (L)
D tubular floculator coil diameter (L)
ratiof ratio of the friction factor for curved tubing versus that for straight
g acceleration due to gravity (L/t2)
G velocity gradient in viscous subrange (1/t)
Gθ dimensionless flocculation parameter, product of G and θ
floch height of floc blanket (L)
lh head loss (L)
waterh height of water that would produce the same pressure as floch (L)
L length of tubing (L)
DeN Dean number
*pC removal efficiency log out
in
CC
−
Page 51
37
Q flow rate (L3/t)
V is the average axial velocity of flow in the tube flocculator
upV upflow velocity in the clarifier (L/t)
growthV growth rate of floc blanket (L/t)
ratioV ratio of the upflow velocity to the capture velocity
α angle of tube settler with respect to the horizontal
ε energy dissipation rate (L2/t3)
flocculatorθ hydraulic residence time of fluid in the hydraulic flocculator
clarifierθ hydraulic residence time of fluid in upflow clarifier (t)
floc fluidθ hydraulic residence time of fluid in floc blanket (t)
solidsθ residence time for solids in floc blanket (t)
ν kinematic viscosity (L2/t)
cv capture velocity of the tube settler (L/t)
waterρ density of water (M/L3)
bulk flocρ bulk density of floc blanket (M/L3)
Φ porosity of the floc blanket
3.1.3 Introduction
Cornell University’s AguaClara Project is actively working to improve drinking water
quality in the Global South through an automated online design service for gravity-
driven municipal water treatment plants. These plants are designed to remove colloidal
particles that correlate with the prevalence of pathogenic organisms, interfere with
disinfection, and negatively impact drinking water quality. An AguaClara goal is to
Page 52
38
provide an average effluent turbidity of less than 1 NTU (Nephelometric Turbidity
Unit) after sedimentation without subsequent filtration. Thus, a crucial component of
design is optimization of the sedimentation tank.
Economic constraints in the Global South mandate cost-effective and efficient designs
and a high cost is associated with the construction of large (and deep) horizontal flow
sedimentation tanks. Compared to horizontal flow sedimentation, vertical flow
sedimentation can reduce reactor volume while maintaining similar levels of treatment
(Tchobanoglous & Schroeder, 1987). The use of lamellar (or plate) settlers can
potentially allow a reduction in the size of vertical flow sedimentation tanks while
maintaining a similar standard of treatment (Saleh & Hamoda, 1999). Plate settlers
are designed for capture of particles with a specific terminal settling velocity or their
design can be based on a desired effluent turbidity. Schulz and Okun (1984)
recommend capture of particles with terminal settling velocities between 10 and 30
m/day with AguaClara facilities currently designed for a capture velocity of 10 m/day.
Flocculation employed in a treatment process train before sedimentation affects
sedimentation efficacy. In an upflow sedimentation tank, particles whose settling
velocity is greater than the upflow velocity will settle out, while particles with lower
settling velocities are either captured by plate settlers or are lost to the effluent.
Effective flocculation before sedimentation will produce larger particles with higher
sedimentation velocities.
At appropriate upflow velocities, a fluidized bed of concentrated flocs forms in upflow
sedimentation basins. A floc blanket is a stable fluidized bed of flocculated particles
with a visible floc-water interface between the concentrated flocs and relatively clear
effluent layer above. Upflow clarification with a floc blanket is thought to enhance
particle removal compared to conventional upflow clarification by providing an
Page 53
39
increased likelihood of particle-particle interactions that can result in further
flocculation of particles and filtration-like removal of small particles (Miller & West,
1968; Reynolds & Richards, 1996; Tchobanoglous, Burton, & Stensel, 2003).
The objective of this research was to characterize and optimize floc blanket
performance at steady-state with respect to the following parameters: alum dose at
different influent turbidities, upflow velocity in the clarifier, floc blanket height, and
the stipulation of hydraulic flocculation proceeding upflow sedimentation. Although
constant dosing on a pilot and laboratory-scale has been documented in the literature
(Miller & West, 1968; Zhang et. al. 2006), this study is unique with respect to: the
range over which each parameter was evaluated, the continuous monitoring of effluent
turbidity from both the floc blanket clarifier as well as subsequent tube settlers, and
stringent control of the energy dissipation rate and residence time in the flocculator
and floc blanket clarifier.
Performance was measured based upon continuous sampling of turbidity above the
floc blanket and tube settler effluent and is reported here as the negative log of the
ratio of the treated and influent turbidities (pC*) in equation ( 3-1).
−=
in
out
CC
pC log* ( 3-1)
Sung, Lee, and Wu (2005) and Gould (1974) identified upflow velocity as critical in
determining floc blanket stability and performance utilizing mass flux theory. If
upflow velocity is too high, a large proportion of particles will be washed out making
it difficult to establish a floc blanket. If the upflow velocity is too low, sedimentation
can irreversibly change the nature of the flocculated particles and the effectiveness of
treatement (Arai, Yazaki, & Otsub, 2007). The average upflow velocity ( upV ) is
Page 54
40
defined as the flow rate ( Q ) divided by the cross-sectional area ( clarifierA ) of the
clarifier shown in equation ( 3-2).
clarifer
up AQV = ( 3-2)
Floc blankets are reported to be effective at removing colloidal particles and organic
matter for a wide range of influent qualities (Lin, et al., 2004). For high turbidity
water, some investigators have recommended that the majority of the turbidity should
be removed in a pre-sedimentation tank with a suggested residence time of 90 minutes
(Chen et al. 2002). For high turbidity source waters (>200 NTU), Sung et. al. (2003)
reported that treatment was feasible with the addition of a pre-sedimentation tank. In
contrast, Sung et al. (2005) reported a stable floc blanket could be formed from 450
NTU source water without the need for a pre-sedimentation tank or two-stage clarifier.
At very low turbidities (<5 NTU) floc blankets have been reported to be easily washed
out (Chen et al., 2006). Chen et. al. (2002) observed stable floc blanket formation from
raw waters with turbidity between 4-10 NTU in full-scale clarifiers, but during a low
turbidity period (2-3 NTU), floc blankets gradually lost solids until no floc blanket
remained. Thus, it appears that floc blanket formation may not be feasible in very low
turbidity water.
At conditions of low turbidity, flocculation processes are less efficient in creating
large flocs and solids loading to a floc blanket clarifier are significantly reduced.
Utilizing plate settlers above the floc blanket could extend the range of floc blanket
utility because particles that are captured by the plate settler will fall back into the
underlying floc blanket, thereby increasing solids concentration and solids residence
time in the floc blanket.
Page 55
41
Flocculation prior to the upflow clarifier is expected to affect the density and size of
entering particles, ultimately affecting floc size distribution and concentration in the
floc blanket. The ability of particles to remain suspended in a floc blanket depends
upon the settling velocity of the flocculated particles counterbalanced against the
upflow velocity in the clarifier (Gregory, Head, & Graham, 1996; Head, Hart, &
Graham, 1997). The density and size of a flocculated particle are functions of how the
floc was formed, thus energy dissipation rate and residence time in a flocculator prior
to the upflow floc blanket clarifier could be important parameters that influence
particle removal.
3.1.4 Materials and Methods
3.1.4.1 Setup and Control of Parameters
Conditions of constant input turbidity were created using a concentrated kaolin clay
suspension diluted with temperature controlled, aerated tap water (Figure 3-1) to
produce a raw water source for treatment.
Figure 3-1. Schematic showing how influent turbidity is controlled using process
control software written by Weber-Shirk (2008).
Page 56
42
Raw water source turbidity was continuously sampled using a turbidimeter, and
computer controlled to maintain a target turbidity. When the turbidity reading
dropped below the target level, process control software sent a signal to an output
control box to open a solenoid valve allowing release of a small amount of
concentrated clay stock solution into the raw water source. The result was relatively
constant input turbidity with a coefficient of variation of ± 3%.
Other controlled influent parameters included: water temperature and water level in
the raw water source tank. Temperature and water level in the raw water source tank
were controlled using process control software that monitored pressure and
temperature sensors, and controlled solenoid valves connecting cold and hot tap water
to the system. The pH of the source water did not vary significantly and was not
controlled. A summary of raw water characteristics is provided in Table 3-1.
Page 57
43
Table 3-1. Raw water characteristics
Parameter Average Value
Temperature 22.5 ± 0.5 ºC
pH 7.5 ± 0.3
Aluminum
concentration prior to
addition of alum 90 ± 70 μg/L
Turbidity
Experimentally varied
between 10-500 NTU
Total Hardness* 150 mg/L as CaCO3(s)
Total Alkalinity* 111 mg/L as CaCO3(s)
Total Organic Carbon* 2.0 mg/L
*Denotes value obtained from 2008 consumer water quality report for Cornell
University Water System
Raw water was combined with a desired amount of alum, and rapid mix was achieved
by directing the flow through a tube 0.48 cm-I.D (inner diameter) and 1 m in length
resulting in turbulent flow for all flow rates tested with varying energy dissipation
rates (0.05 W/kg - 1.10 W/kg) (Figure 3-2). The alum coagulant was prepared daily to
avoid ageing (Rossini, Garcia, & Galluzo, 1999) and to improve reproducibility.
Page 58
44
Figure 3-2. Schematic of flow through laboratory scale plant.
In this research one to four coiled tube flocculators in parallel were used to vary the
energy dissipation rates without changing the overall plant flow. Laminar flow in a
straight tube provides a predictable velocity gradient as shown in equation(3-3) (Ito,
1969).
3)(364
dQG
π= ( 3-3)
Where: G (s-1) is the velocity gradient for laminar tube flow, Q is flow rate, and d is
the tubing diameter.
Coiled tubes develop secondary flow circulation (Zhou & Shah, 2006) that causes
additional mechanical energy loss and increased velocity gradients. Liu and
Page 59
45
Masliyah’s model (1993) for Dean numbers less than 5000 compared the ratio of the
friction factor of curved versus straight tubing ( )ratiof based upon the calculated Dean
number (NDe) equations (3-4) and(3-5).
21
2
=
DdVdN De ν
( 3-4)
De
De
ratio
N
Dd
DdN
Dd
f 491
2.037.0132.00233.00908.0121
212
1
+
−
+
−
++
= ( 3-5)
where: D is the coil diameter, V is the average axial velocity of flow in pipe, and ν is
kinematic viscosity. Friction factors determined by the major head loss equation for
straight tubing and equation (3-5) for coiled tubing to predict head loss (and the
related energy dissipation rates) for the flocculation process used in this research.
Flow from the rapid mix entered coiled tube flocculators (inner diameter, d = 0.95
cm). For constant volumetric flow rate (Q) the residence time (θ ) in the flocculator
was controlled by the length of the tube flocculator (L) equation ( 3-6). The energy
dissipation rate (ε ) is the energy loss per unit time and can be calculated from the
product of head loss through the flocculator ( lh ) and acceleration due to gravity ( g )
per unit residence time in equation ( 3-7). The velocity gradient in the viscous
subrange ( G (s-1)) is related to the energy dissipation rate and fluid viscosity (ν )
(Tambo & Hozumi, 1979) in equation ( 3-8). The average energy dissipation rate in
flocculation was controlled by the number of tube flocculators utilized (between 1 and
4) and the flow rate through each tube flocculator.
2L d
Q 4πθ = ( 3-6)
Page 60
46
θ
ε lgh= ( 3-7)
νε
=G ( 3-8)
After tube flocculation, the flow was released 8 cm from the bottom of the floc blanket
reactor. The upflow floc blanket reactor was 11.4 cm- I.D. and 90 cm high. A cone 15
cm high inclined at 67 degrees was placed in the bottom to reduce the volume of the
reactor where flocs could settle out. The floc blanket elevation was controlled by
continuously removing fluid at a desired height in the upflow column using a flow
equal to one sixth the total flow rate in the reactor. Other effluent was removed from
the reactor using a combination of controlled flow through a tube settler consisting of
a cluster of 6 tubes (used to mimic lamellar sedimentation) and an overflow weir 2 cm
from the top of the reactor. The tube settler was located 5 cm from the top of the
reactor and was utilized to create particle capture velocities that would be comparable
to the plate settler capture velocities in full-scale water treatment plants.
A peristaltic pump pulled water from the top of the tube settlers at a flow rate set to
control the capture velocity ( cV ) of the tube settler at 10 m/day through the
relationships shown in equations ( 3-9), and ( 3-10) (Schulz & Okun, 1984).
( 3-9)
cVndd
dLQ
+
=2
2)sin()cos( παα ( 3-10)
Where: Q is the pump flow rate, d is the inner diameter of the tube ( d = 0.95 cm), n
is the number of tubes utilized ( n = 6), L is the length of the tube ( L = 19 cm), α is
cos( ) sin( )
c
Vd
L dVα α α+=
Page 61
47
the angle of orientation (α = 60°), sA is the normal area of the tube settler, and αV is
the average fluid velocity in the tube settler.
3.1.4.2 Data Acquisition and Sampling
Turbidity readings were obtained for continuous sampling of both the clarified fluid
above the floc blanket and for the effluent from the tube settler using Micro TOL
Turbidimeters (HF Scientific Model 20053, Ft Myers, Fl). The clarified water above
the floc blanket was continuously sampled 5 cm below the overflow weir. Raw water
turbidity was also logged and compared to the effluent data to determine particle
removal efficiencies. Exemplary results for steady-state performance are presented in
Figure 3-3. These results indicate that an effluent turbidity below 1 NTU is quite
feasible for the process sequence of flocculation, floc blanket clarification and
lamellar sedimentation.
Page 62
48
Figure 3-3. Continuously sampled turbidity readings for raw water influent, clarified
water above the floc blanket and the tube settler effluent. The upflow velocity in the
floc blanket was 100 m/day and the capture velocity in the tube settler was 10 m/day.
Data presented in this paper are for conditions of floc blanket steady-state. Steady-
state was assumed to be reached when the floc blanket obtained its full height and
performance of the floc blanket did not change as measured over three theoretical
maximum fluid residence times where residence time (θ fluid) is defined as the total
volume of the clarifier ( clarifier∀ ) divided by the total flow rate ( totalQ ). For an upflow
velocity of 100 m/day, the theoretical maximum hydraulic residence time was 13.3
minutes. A distinction was made between theoretical maximum hydraulic residence
0.1
1
10
100
1000
0 10 20 30 40 50 60 70 80
Turb
idity
(NTU
)
Time (minutes)
Raw Water
Floc Blanket
Tube Settler
Page 63
49
time and that of the hydraulic residence time in the floc blanket ( floc fluidθ ) that was
based upon floc blanket height and floc blanket porosity in equation ( 3-14).
Data collected at steady-state were the average over three maximum theoretical
hydraulic residence times where measured performance remained relatively consistent
for the tube settler and floc blanket effluent as shown in Figure 3-3. Bulk density of
the floc blanket was measured using a pycnometer and solids concentrations were
obtained as described in Standard Methods (Clesceri, Greenberg, & Eaton, 1998). A
linear relationship between solids concentration ( sC ), and bulk density ( bulk flocρ ) in
the floc blanket was observed in equation ( 3-11) over a wide range of floc formation
conditions (Figure 3-4).
= +bulk floc water0.687 Csρ ρ ( 3-11)
Where: waterρ is the density of water.
Page 64
50
Figure 3-4. Relationship between floc blanket density and solids concentration (r2 =
0.98).
3.1.5 Results and Discussion
3.1.5.1 Change in solids concentration in floc blanket with upflow velocity
Solids concentration in the floc blanket were measured at heights of 72, 51, 40, 33, 26,
and 15 cm for a fully built floc blanket of 75 cm. Results are shown in Figure 3-5.
0.995
1
1.005
1.01
1.015
1.02
1.025
1.03
0 0.005 0.01 0.015 0.02 0.025 0.03 0.035 0.04 0.045 0.05
Den
sity
(g/m
L)
Concentration of solids (kg/L)
Page 65
51
Figure 3-5. A. Solids concentration sampled at a height of 51 cm from the bottom,
starting at time zero when the floc blanket reached a target height of 75 cm, with an
upflow velocity of 120 m/day.
B. The change in the solids concentration with respect to height of the floc blanket in
the reactor for several upflow velocities. Influent turbidity was 100 NTU and the alum
dose was 55 mg/L for both A and B.
Solids concentration tended to increase as upflow velocity decreased. The floc blanket
solids concentration measured at a height of 51 cm that did not change significantly
over a large time period 6 hours after the floc blanket formed. Small changes could be
attributed to statistical differences in samples as well as small changes in mass flux at
different periods of time in a floc blanket. Once a floc blanket reached the target
height there was little evidence of additional changes in solids concentration over a
very long time period (Figure 3-5A). Consistent with the observations of Gould
(1969), the solids concentration throughout the floc blanket was fairly uniform.
0.0037
0.0038
0.0039
0.004
0.0041
0.0042
0.0043
0.0044
0.0045
0.0046
0 20 40 60
Con
cent
ratio
n (k
g/L)
Time (hours)
A0
0.001
0.002
0.003
0.004
0.005
0.006
0.007
0.008
0.009
0.01
0 20 40 60 80
Con
cent
ratio
n (k
g/L)
Height of Floc Blanket (cm)
30 m/day
60 m/day
105 m/day
180 m/day
240 m/day
B
Page 66
52
3.1.5.2 Energy dissipation in the floc blanket
A force balance requires the head loss through a fluidized bed to be proportional to the
difference between the bulk density of the fluidized bed ( bulk flocρ ) and the density of
water ( waterρ ). Head loss, lh , through the floc blanket with height ( floch ) is given by
−
= bulk floc waterl floc
waterh h
ρ ρρ
( 3-12)
Combining equations ( 3-12) and ( 3-11) gives:
water
floclCshh
ρ687.0
= ( 3-13)
The hydraulic residence time in the floc blanket ( floc fluidθ ) can be defined in terms of
the height of the floc blanket ( floch ), the upflow velocity of the fluid ( upV ) and the
porosity of the floc blanket (Φ ).
= flocfloc fluid
up
h( )
Vθ Φ ( 3-14)
The porosity of the floc blanket was determined to be approximately 85% based upon
a 30 minute settling test. Substituting head loss, lh , and hydraulic residence time,
floc fluidθ , into the energy dissipation rate relationship in equation ( 3-7) allows floc
blanket energy dissipation rate to be expressed in terms of upflow velocity and solids
concentration in equation ( 3-15).
water
up CsgVρ
ε 687.0)(Φ
= ( 3-15)
From equation ( 3-15) the energy dissipation rate in a floc blanket can be compared at
different upflow velocities based upon the average solids concentrations found in
Page 67
53
Figure 3-5. The values of G and floc fluidGθ for the floc blanket could then be
estimated for a floc blanket based upon the hydraulic residence time in the floc blanket
and the value of G in equation ( 3-8) calculated based upon the energy dissipation rate
in equation ( 3-15).
One can estimate the minimum size of a floc particle that will experience turbulent
flow in the flow blanket ( Kolmogorovη ) utilizing equation ( 3-16) and estimating energy
dissipation rate using equation ( 3-15).
13 4
Kolmogorovνηε
=
( 3-16)
For a floc blanket formed with an upflow velocity of 100 m/day with a solids
concentation of 0.004 kg/L, the Kolmogorov scale is 0.4 mm. This result suggests that
the flow in the pores of the floc blanket is turbulent since most flocs in the floc blanket
have been visually observed to be at least one millimeter in size. Although collisions
between colloidal sized particles can still be considered as occuring in a laminar fluid,
collisions between larger flocs separated by distances exceeding 0.4 mm will be
influenced by turbulence. A flocculation analysis in a floc blanket utilizing Gθ for
colloids is appropriate.
Predicted variation of G and Gθ with upV in the floc blanket is shown in Figure 3-6A
and B.
Page 68
54
0 50 100 150 200 250 3001000
2000
3000
4000
5000
6000
Vup (m/day)
GT
Figure 3-6. A. G as a function of upflow velocity (right). B. floc fluidGθ as a function
of upflow velocity for a floc blanket height of 75 cm (left).
3.1.5.3 Energy dissipation in tube flocculators
Head loss across the tube flocculators was measured for flows ranging from 100
mL/min to 900 mL/min (Figure 3-7) with a diameter of coil ( D ) of 12.5 cm, and an
inner tube diameter ( d ) of 0.95 cm. The total length of tubing was 16 m of which 12.5
m was coiled. All flow was laminar with a maximum Reynolds number of 2200.
0 100 200 3002
4
6
8
10
Vup (m/day)
G (1
/s)
Gθ
B
A
Page 69
55
Figure 3-7. Measured head loss (boxes) across the tube flocculator compared to
theoretical predictions (curve) of Lui & Masliyah for laminar flow through coiled
tubes.
The measured head loss data fit very well to the Liu & Masliyah correlation in
equation (3-5). Energy dissipation (ε ) in equation ( 3-7) and the velocity gradients for
the viscous subrange ( G ) in equation ( 3-8) were calculated and compared to the
measured G values based upon measured head loss (Figure 3-8A). The resulting value
of Gθ was calculated multiplying G by the hydraulic residence time in the
flocculator (θ) (Figure 3-8B). The values of Gθ and G presented in Figure 3-8 are
representative for the range of flow rates through one tube flocculator utilized this in
this experiment. G would be independent of flow rate for laminar flow through a
0 200 400 600 800 10000
10
20
30
40
Flowrate (mL/min)
Hea
d lo
ss (c
m)
Page 70
56
straight tube flocculator, but the nonlinear effect of tube curvature on energy
dissipation causes G to increase with flow rate.
Figure 3-8. A. Measured G (crosses) compared to theoretical predictions (line) based
upon Lui & Masliyah for laminar flow through coiled tubes (right). B. Theoretical
Gθ versus flow rate (left).
Energy dissipation rates in the flocculator were orders of magnitude higher than
energy dissipation rate in the floc blanket (Figure 3-8A and Figure 3-8B). Removal of
colloid particles inside the floc blanket could still potentially occur even with lower
energy dissipation rates because of relatively long floc blanket hydraulic residence
times (Figure 3-6B) and the much higher floc volume fraction that reduces the time
required for particle-particle collisions.
3.1.6 Characterizing floc blanket effluent performance at steady-state
3.1.6.1 Effect of upflow velocity on floc blanket effluent performance
The upflow velocity in the sedimentation column was varied while alum dosage,
turbidity, and floc blanket height (75 cm) were held constant. Figure 3-9A and B
0 200 400 600 800 10000
50
100
150
200
Flowrate (mL/min)
G (1
/s)
0 200 400 600 800 100010000
11000
12000
13000
14000
15000
16000
Flow rate (mL/min)
G θ
A
B
Page 71
57
shows the steady-state turbidity in the fluid above the floc blanket and in the effluent
from the tube settler for influent turbidities of 100 and 500 NTU.
Figure 3-9. A. Effluent turbidity of tube settlers and floc blanket at 100 NTU and 55
mg/L alum dosage. B. Effluent turbidity of tube settlers and floc blanket at 500 NTU
and 95 mg/L alum dosage.
As seen in Figure 3-9 for 100 and 500 NTU water, an optimal range of upflow
velocities produced a floc blanket with a relatively clear effluent above. The optimum
upflow velocities were approximately 100 m/day and 70 m/day for influent turbidities
of 100 NTU and 500 NTU, respectively. Upflow velocities outside the optimal range
increased turbidity and performance variability.
In extreme cases of low upflow velocity, the flow was not sufficient to counteract the
terminal settling velocity of the flocculated particles. The bottom 25 cm of the upflow
clarifier was no longer fluidized and instead small flow channels formed in the settled
sludge. The small flow channels with their associated high velocities likely caused floc
breakup and the production of small floc particles that could not be captured by the
tube settlers. Increased variability in the effluent turbidity could be attributed to
variability in channeling through the settled sludge over time. For very high upflow
0.1
1
10
100
0 50 100 150 200 250 300
Turb
idity
(NTU
)
Upflow Velocity (m/day)
Floc Blanket
Tube SettlerA1
10
100
20 40 60 80 100 120
Turb
idity
(NTU
)
Upflow Velocity (m/day)
Floc Blanket
Tube Settler
B
Page 72
58
velocities, the upflow velocity was greater than the settling velocities of most of the
flocculated particles so that the floc-water interface became blurred and the suspension
more dilute.
The effects of variable alum dose were tested at 100 NTU and 200 NTU influent
turbidities (Figure 3-10). Upflow velocity and floc blanket height (75 cm) were held
constant while alum dose was varied. Each floc blanket was reformed to a height of
75 cm.
Figure 3-10. A. Effect of alum dosage on 100 NTU water. B. Effect of alum dosage on
200 NTU water.
The optimum alum doses for 100 NTU and 200 NTU water were approximately 45
mg/L and 65 mg/L, respectively (Figure 3-10). However, performance did not
significantly deteriorate at higher dosages of alum in either case. Optimization of alum
dose was also tested for a higher influent turbidity (500 NTU) and a lower influent
turbidity (10 NTU). For optimal alum dosage at 500 NTU, the optimal upflow
velocity occurred at approximately at 70 m/day (Figure 3-11) and it was 100 m/day for
10 NTU water (data not shown). At the influent turbidity of 500 NTU, the tube settler
0.1
1
10
100
20 30 40 50 60
Turb
idity
(NTU
)
Alum Dosage (mg/L)
Floc Blanket
Tube Settler
A
0.1
1
10
100
50 60 70 80 90
Turb
idity
(NTU
)
Alum Dosage (mg/L)
Floc Blanket
Tube Settler
B
Page 73
59
effluent did not fall below 1 NTU, however, a *pC removal efficiency of 2.5 was
achieved.
Figure 3-11. A. Effect of alum dosage on 10 NTU water. B. Effect of alum dosage on
500 NTU water.
Underdosing of alum could decrease the size and the amount of flocculated particles
entering the floc blanket. Thus, a higher proportion of particles would not be captured
by tube settlers or the clarifier. Overdosing showed little effect on floc blanket
performance for the range of dosages tested. Based upon optimal performance of the
entire treatment train, a dosing model for the specific conditions of the raw water was
developed (Figure 3-12).
0.1
1
10
100
0 10 20 30 40
Turb
idity
(NTU
)
Alum Dosage (mg/L)
Floc Blanket
Tube Settler
A1
10
100
60 80 100 120
Turb
idity
(NTU
)Alum Dosage (mg/L)
Floc Blanket
Tube Settler
B
Page 74
60
Figure 3-12. Empirical dosing model for the system studied.
While the model is empirical, the data fits well to a power law function in equation
(( 3-17).
4.0)(8.7)/( TurbidityLmgDosageAlum = ( 3-17)
3.1.6.2 Effect of floc blanket height on floc blanket effluent performance
Effluent turbidity was monitored over a range of floc blanket heights. Conditions for
these experiments were: alum dosage 45 mg/L, influent turbidity 100 NTU, and an
upflow velocity of 100 m/day. Miller and West (1968) observed increased removal
10
100
10 100 1000
Alum
Dos
age
(mg/
L)
Influent Turbidity (NTU)
Page 75
61
efficiency with increasing blanket height. These observations were confirmed in this
study (Figure 3-13).
Figure 3-13. A. Effect of floc blanket height on floc blanket effluent performance. B.
Effect of floc blanket height on tube settler effluent performance.
Contrary to the findings of Casey et al. (1984) and Gregory (1979), the laboratory
scale data obtained in this study suggest effective implementation of lamellar settlers
above a floc blanket can significantly improve effluent performance. The tube settlers
were vital in achieving effluent turbidities below 1 NTU (Figure 3-13B) at floc blanket
heights above 65 cm. Based upon these results, a small water treatment plant (6.3 L/s)
equipped to produce a floc blanket beneath plate settlers has been built by Agua Para
el Pueblo for a rural community in Honduras, and will be tested soon.
3.1.6.3 Effect of flocculator and floc blanket energy dissipation rate on floc blanket
effluent performance (turbidity removal)
The effect of varying energy dissipation rates in the flocculator on floc blanket
effluent performance was evaluated while maintaining a relatively constant parameter
Gθ in each flocculator. For example, splitting the flow from one tube to two in
1
10
100
0 10 20 30 40
Turb
idity
(NTU
)
Time (minutes)
25 cm35 cm45 cm65 cm
A0.1
1
10
0 10 20 30 40
Turb
idity
(NTU
)Time (minutes)
25 cm
35 cm
45 cm
65 cmB
Page 76
62
parallel that were the same length would double the hydraulic residence time (θ ), but
would decrease the velocity gradient ( G ) by a factor of approximately two (Figure
3-8B).
The experimental conditions included an alum dosage of 45 mg/L, influent turbidity of
100 NTU, and upflow velocity of 100 m/day while varying the number of tube
flocculators (Figure 3-14). A control (no tube flocculation) experiment was also
performed in which coagulated particles were introduced directly into the upflow
reactor without flocculation.
Figure 3-14. Effect of floc blanket height and flocculation in the flocculator on tube
settler effluent turbidity.
0.1
1
10
100
0 20 40 60 80
Turb
idity
(NTU
)
Height of Floc Blanket (cm)
G = 0 1/s [no prior flocculation]G =120 1/s, GT = 13000
70 1/s, GT = 12000
50 1/s, GT = 11500
♦ G = 0 s-1 (no prior flocculation)
■ G = 120 s-1, Gθ = 13000
▲G = 70 s-1, Gθ = 12000
× G = 50 s-1, Gθ = 11500
Page 77
63
Floc blanket performance increased with increasing energy dissipation in the
flocculator especially between a floc blanket height of 20 and 60 cm (Figure 3-14).
Floc blanket performance did not improve appreciably for heights above 45 cm for the
cases where there was a tube flocculator present and the rate of improvement
decreased above 55 cm for the case with no prior flocculation.
Energy dissipation rate in the flocculator influences floc strength. Francois (1987)
found an increase in floc strength for flocs formed with higher energy dissipation rates
as well as stronger flocs for increased residence time in the flocculator. If the particles
formed in the flocculator at higher energy dissipation rates were stronger they would
be less prone to breakup in the floc blanket and they would have a higher density.
Given the long solids residence times in the floc blanket, floc breakup could be an
important contributor to effluent turbidity at blanket heights greater than 45 cm. The
higher density of the flocs also could increase the solids concentration in the floc bed.
The velocity gradients in the floc blanket (predicted from equations ( 3-15) and ( 3-8)
shown in Figure 3-8A) were less than 10/s. Thus, floc breakup due to fluid-particle
interactions would not be expected to be significant in the floc blanket. However, it is
possible that particle-particle interactions are a significant source of high local stresses
that result in floc breakup.
The removal efficiency of particles, as expressed by *pC for floc blanket effluent
and for tube settler effluent for the control (no hydraulic flocculation) case are shown
in Figure 3-15.
Page 78
64
Figure 3-15. Effect of floc blanket height on particle removal efficiency from both
tube settler and floc blanket effluent for the case where floc blanket influent was not
passed through a flocculator
Without the benefit of a tube flocculator, particles entering the floc blanket were
coagulated with alum but not flocculated. Nevertheless, the floc blanket formed in the
upflow clarifier and effluent turbidity decreased as the floc blanket increased in height.
Particle removal expressed as *pC was linear with blanket height up to a height of 55
cm. A linear association of *pC with increasing height is consistent with the
expectation of first order removal of particles with height in porous media filtration
(Iwasaki, T. 1937).
0
0.2
0.4
0.6
0.8
1
1.2
1.4
0 10 20 30 40 50 60 70 80 90
pC*
Height of Floc Blanket (cm)
Tube Settler
Floc Blanket
Page 79
65
In the absence of flocculation, the tube settler did not improve particle removal until
the floc blanket height exceeded 55 cm (Figure 3-15). Since the energy dissipation
rates in the floc blanket were sufficient to flocculate particles, the extent of
flocculation would increase with residence time in the floc blanket, which increased as
a function of blanket height. The data in Figure 3-15 indicate a floc blanket height
greater than 55 cm was required to create flocs large enough to have a terminal
velocity that allowed them to be removed by the tube settler.
In pre-flocculated water increasing particle removal in tube settler effluent was
observed with increasing floc blanket height up to a height of 45 cm. However,
particle removal within the floc blanket clarifier was relatively constant (Figure 3-16).
Page 80
66
Figure 3-16. Effect of floc blanket height on removal efficiency from both tube settler
and floc blanket effluents for flocculation conditions in the flocculator of G = 50 s-1
and θG = 11500.
Letterman (1999) stated that tube settlers do not improve performance in a floc blanket
clarifier. Contrary to that finding, the results shown in Figure 3-16 indicate that tube
settlers have the ability to provide removal efficiencies far beyond that of a typical
upflow clarifier when coupled with a floc blanket.
The high efficiency flocculation utilized in this study produced a pC* removal of
approximately 0.7 or 80% (at 0 cm height) in the absence of a floc blanket. At 0 cm
height, the tube settler had a pC* of 1.3, indicating that the tube settler was essential in
improving performance. As floc blanket height increased, it appears that particle
removal mechanisms in the floc blanket were aiding in removing small particles (less
0
0.5
1
1.5
2
2.5
0 10 20 30 40 50 60 70 80
pC*
Height of Floc Blanket (cm)
Floc blanket
Tube Settler
Page 81
67
than 10 m/day terminal settling velocity) because tube settler performance continued
to improve linearly with floc blanket height up to a height of 45 cm while floc blanket
performance (i.e. particle removal by the floc blanket) remained relatively constant.
3.1.7 Conclusions
Optimal particle removal was obtained at an upflow velocity of 100 m/day for all
turbidities tested except for the case of very high influent turbidity (500 NTU) that had
an optimal upflow velocity of approximately 70 m/day (Figure 3-9). Control of upflow
velocity was important to keep the bed of particles suspended in a floc blanket. At
higher than optimal upflow velocities particle removal declined consistent with
expectations that the decreased hydraulic residence time in the floc blanket would
result in poorer filtration and flocculation. At lower than optimal upflow velocities,
some particles settled and created channeling of the influent flow through the settled
sludge. This channeling acted to decrease particle removal. At a very low upflow
velocity (30 m/day) there was no fluidized bed.
Flocculation before floc blanket formation significantly enhanced performance of the
floc blanket in removing particles. Increasing Gθ in the flocculator also improved floc
blanket performance (Figure 3-14). Increasing alum dose improved performance up to
a point and then had no additional beneficial effect (Figure 3-10). Performance
improved markedly in all cases with increasing floc blanket height up to 45 cm
(Figure 3-14). At floc blanket heights greater than 45 cm, it is hypothesized that floc
breakup contributed significantly to effluent turbidity. In the absence of flocculation
prior to the upflow column (Figure 3-15), the tube settlers did not improve particle
removal until the floc blanket was sufficiently deep that raw water colloids grew to
have a terminal velocity that exceeded the tube settler capture velocity.
Page 82
68
The results obtained in this research show that effluent turbidities less than 1 NTU can
be obtained at lab-scale (Figure 3-3), in the absence of sand filtration, using a process
sequence of coagulation, upflow floc blanket filtration, and lamellar sedimentation.
The results also show that lamellar settlers installed above a floc blanket can
significantly improve particle removal efficiency (Figure 3-16).
3.2. Acknowledgements
The research described in this paper was supported by the Sanjuan Foundation and by
the U.S. National Science Foundation under Grant CBET-0604566.
Page 83
69
REFERENCES
Adachi, Y., & Tanaka, Y. (1997). Settling velocity of an aluminium-kaolinite floc.
Water Res. 31(3), 449-454.
Arai, T., Yazaki, T., & Otsub, Y. (2007). Control of Rheology and Sedimentation
Behavior of Colloidal Suspensions. J. Rheology Japan. 35(2), 61-67.
Casey, J. J., K. O'Donnel, and P.J. Purcell. (1984) Uprating sludge blanket clarifiers
using inclined plates. Aqua, 2, 91-97
Chen, L., Lee, D.-J., & Chou, S.-S. (2006). Charge reversal effect on blanket in full-
scale floc blanket clarifier. J. Env. Eng. ASCE. 132(11), 1523-1526.
Chen, L., Sung, S., Lin, W., Lee, D., Huang, C., Juang, R., & Chang, H.-L.(2002).
Observations of blanket characteristics in full-scale floc blanket clarifiers. Water
Sci. and Tech. 47(1), 197-204.
Clesceri, L, Greenberg, A.E., & Eaton, A.D. (1998). Standard Methods for the
Examination of Water and Wastewater. American Public Health Association,
Baltimore.
Droppo, I.G., Exall, K., Stafford, K. (2008). Effects of chemical amendments on
aquatic floc structure, settling, and strength. Water Res. 42(1-2), 169-179.
Francois, R.J. (1987). Strength of aluminum hydroxide floc. Water Res. 21(99), 1023-
1030.
Gould, B. (1969). Sediment Distribution in Upflow. Australian Civ. Eng. 10(9), 27-29.
Gregory, R., Head, R., & Graham, N. (1996). Blanket solids concentration in floc
blanket clarifiers. Proc. Gothemburg Symp., Edinburg, Scotland.
Page 84
70
Gregory, R. (1979). Floc Blanket Clarification. Water Research Centre TR 111,
Swindon, U.K.
Head, R., Hart, J., & Graham, N. (1997). Simulating the effect of blanket
characteristics on the floc blanket clarification process. Water Sci. and Tech.
36(4), 77-82.
Iwasaki, T. (1937). “Some notes on sand filtration.” Am. Water Works Assn.-J. 10,
1591-1597.
Ito, H. (1969). Laminar Flow in Curved Pipes. Z. Angew. Math. Mech. 49(11), 653-
663.
Letterman, R. (1999). Water quality and treatment: a handbook of community water
supplies. McGraw-Hill, New York.
Lin, W., Sung, S., Chen, L., Chung, H., Wang, C., Wu, R., Lee, D.J., Huang, C. Juang,
R.S., Peng, X.F. & Chang, H.-L. (2004). Treating high-turbidity water using full-
scale floc blanket clarifiers. J. Env. Eng. ASCE. 130(12), 1481-1487.
Liu, S. & Masliyah, J.H. (1993). Axially Invariant Laminar Flow in Helical Pipes with
a Finite Pitch. J. Fluid Mech. 251, 315-353.
Miller, D.G., & West, J.T. Pilot Plant Studies of Floc Blanket Clarification. (1968).
AWWA J. 60(2), 154-164.
Reynolds, T. D., & Richards, P. A. (1996). Unit Operations and Processes in
Environmental Engineering. PWS Publishing Company, Boston.
Richardson, J.F., & Zaki, W.N. (1954). Sedimentation and Fluidisation: Part 1. Trans.
Inst. Chem. Engs. 35, 35-53.
Page 85
71
Rossini, M., Garcia, J., & Galluzo, M. (1999). Optimization of the coagulation-
flocculation treatment: influence of rapid mix parameters. Water Res. 33(18),
1817-1826.
Saleh, A., & Hamoda, M. (1999). Upgrading of secondary clarifiers by inclined plate
settlers. Water Sci. and Tech. 40(7), 141-149.
Schulz, C.R., & Okun, D.A. (1984). Surface Water Treatment for Communities in
Developing Countries. John Wiley & Sons, New York.
Su, S., Wu, R., & Lee, D. (2004). Blanket dynamics in upflow suspended bed. Water
Res. 38(1), 89-96.
Sung, S., Lee, J., & Wu, R. (2005). Steady-state Solid Flux Plot of Blanket in Upflow
Suspended Bed. J Chinese Inst. Chem. Eng. 36(4), 385-391.
Tambo, N., & Hozumi, H. (1979). Physical Characteristics of Flocs-II. Strength of
Floc. Water Res. 13, 424.
Tchobanoglous, G., & Schroeder, E. (1987). Water Quality. Addison-Wesley
Publishing Company, Inc., Boston.
Tchobanoglous, G., Burton, F. L., & Stensel, D. H. (2003). Wastewater Engineering
Treatment and Reuse. McGraw-Hill, New York.
Weber-Shirk, M. (2008). An Automated Method for Testing Process Parameters.
From AguaClara Wiki:
http://confluence.cornell.edu/display/AGUACLARA/Process+Controller+Backgr
ound, April 5, 2009.
Zhang, Z., Chen, Z., Li, Y., Fan, J., Fan, B., Luan, Z., and Lu, D. (2006). Performance
of a novel vertical-flow settler: a comparative study. J. Env. Sci. 18(5), 858-863.
Page 86
72
Zhou, Y., & Shah, S. (2006). New Friction-Factor Corrections for Non-Newtonian
Fluid Flow in Coiled Tubing. SPE Drilling and Completion, 68-76.
Page 87
73
CHAPTER 4: FUTURE STUDIES
4.1. Mechanisms of particle removal in a floc blanket
Most recent literature on floc blanket clarification has focused upon modeling solids
flux in the floc blanket to predict floc blanket performance (Chen et al., 2003; Sung &
Lee, 2005; Zhang et al., 2006). Such an empirical approach cannot generally predict
steady-state floc blanket response with respect to changes in coagulant dosing and
turbidity just as mass flux cannot be utilized to predict residual turbidity in the effluent
from a floc blanket clarifier. In order to predict performance, we need a greater
understanding of the mechanisms of particle removal in a floc blanket. Understanding
mechanisms of particle removal in a floc blanket may allow for the optimization of
design and operation of a floc blanket clarifier with lamellar sedimentation. To
achieve a fundamental understanding of particle removal in upflow sedimentation with
a floc blanket, future research is needed to evaluate different mechanisms of particle
removal.
The mechanisms of particle removal to be investigated should include flocculation,
filtration and sedimentation. It is likely that if a particle has a terminal settling velocity
close to the upflow velocity, that the solids residence time of that particle in the floc
blanket will be controlled through physical wasting. However, for smaller sized
particles that disproportionally impact effluent quality it appears that flocculation and
filtration are both mechanisms that could potentially affect particle removal in the floc
blanket. An experimental study is needed to explore both of these removal
mechanisms and the resulting information is expected to serve as a basis for modeling
of floc blanket performance.
Page 88
74
4.2. Effect of NOM and particle type on floc blanket effluent performance
An alum dosing relationship for a floc blanket was derived in this thesis for ranges of
kaolin turbidity between 10-500 NTU (Figure 3-12). The generality of this dosing
relationship to other raw water compositions and other types of colloidal particles is
uncertain. It is established that natural organic matter will adsorb to the surface of
colloidal particles effectively increasing the negative surface charge of these particles.
If charge neutralization were the predominant mechanism by which flocs formed in
floc blanket clarification, then the surface charge of NOM would be an important
consideration as higher NOM content would require more coagulant dose.
However, it seems that the predominant mechanism of floc formation in a floc blanket
is sweep floc, so understanding how NOM changes the nature of floc particles in
sweep flocculation will be critical in designing effective strategies for dealing with
surface waters with high NOM content.
Bacteria and algae have a negative surface charge but a much lower density than clay
particles. It is unclear whether the upflow velocities applicable to flocs containing
clay will be applicable to other particle types. Research appears warranted on the
effect natural organic matter and suspended microorganisms on removal of turbidity
and NOM.
Page 89
75
APPENDIX A. AGUACLARA AND THE GLOBAL WATER CRISIS
Access to clean and affordable water is important for human health, economic
productivity, and environmental sustainability. Watershed management is paramount
for all communities, especially those utilizing a surface water source for consumption.
However, most surface water quality is well below minimum standards for human
consumption especially during rainy seasons which increase surface erosion and
runoff.
The Global North possesses the technological capability to treat surface waters in the
Global North and South, but, in general, utilizes technology that requires complex
infrastructure for unit processes that can be cost prohibitive and unsustainable for
smaller-scale systems and countries lacking such infrastructure. Thus, there is a need
for low cost, sustainable surface water treatment technologies. Design of a surface
water treatment plant or point of use system for the Global South could consider the
following constraints:
• Power outages are the norm in developing countries; thus sustainable unit
processes for reliable production of safe drinking water must be designed to
operate without external sources of energy input.
• The capital and operational and maintenance costs should be as low as possible
so that it is affordable to the population utilizing the water source.
• The plant and every unit process in that plant should be understandable and
easy to operate from the point of view of the plant operator. Each unit process
should be designed so that problems that arise can be easily fixed with the
materials and knowledge available in the community. Maintenance that
requires specialized components that are not available within the country may
not be sustainable.
Page 90
76
• The plant should be robust enough to produce drinking water that is safe for
consumption over the range of influent conditions that occur during the rainy
and dry periods of the year.
• Both the size of the community population and the availability of a piped
distribution system will influence whether point of use or municipal scale
water treatment will be utilized.
As discussed in the introduction to this thesis an estimated 125 million people reside
in communities between 1000 to 50000 people that do not have access to treated
drinking water. AguaClara treatment plants provide an affordable and sustainable
solution for this sector of the world’s population.
The AguaClara project is at the forefront in the exploration, design, and dissemination
of low cost, high performing municipal water treatment plants. AguaClara utilizes
design, laboratory and field research, as well as extensive community outreach and
working partnerships to provide cost-effective community-scale water treatment plants
for the Global South. AguaClara water treatment plants utilize a gravity-driven
treatment process train of rapid mix, flocculation, sedimentation, and disinfection. To
date, AguaClara has designed five water treatment plants that have been constructed in
Honduras. AguaClara’s water treatment goal is to deliver water below 1
Nephelometric Turbidity Unit (NTU) without the use of a filtration unit process.
AguaClara has created a web-based automated design tool with the expressed goal of
helping AguaClara designed technology spread from country to country. Access to
the design tool allows interested communities to eliminate the reactor design costs
from the expense associated with providing safe drinking water.
Page 91
77
APPENDIX B. MEASUREMENT OF FLOC BLANKET POROSITY
Background
The floc blanket is a highly porous media, but there are no standardized tests for
determining the porosity of the floc blanket. Gregory (1979) proposed measuring the
solids concentration after 30 minutes of quiescent settling as an important parameter in
determining floc blanket flux. The height of the settling column is an important
parameter in this test because it can correlate with the velocity of the settling particles
and the final height of the floc bed that will be slowly releasing water.
The thirty minute settling test is a way to estimate hindered settling in a floc blanket.
At the end of the 30 minute settling test, the height of the suspension in a settling
column should roughly approximate the settled volume of flocs in the floc blanket. In
the 30 minute settling test, it is assumed that all particles have settled out, but that the
particles have not fully undergone compression settling, so that the settled floc can be
used to gather a rough estimate of floc blanket porosity.
The porosity test described below was adapted from the settled sludge volume test
from Standard Methods (1998). In Standard Methods, a 30 minute settling test is used
to determine the sludge volume index for both dilute and concentrated suspended
solids.
Apparatus
a. Settling column: 5-100 mL cylinders filled with floc blanket samples taken from a
floc generated in an upflow clarifier
b. Stopwatch
c. Thermometer
Procedure
Page 92
78
Samples are taken 45 cm from the bottom of a fully built 75 cm floc blanket through
the use of a peristaltic pump to fill a 100 mL volumetric cylinder. When the
volumetric cylinder is full, cover the top of the cylinder and invert and mix the
suspension three times. Record the height of the suspension in the cylinder at an
elapsed time of 30 minutes. Utilizing equation (5-1) will yield an estimated porosity of
the floc blanket.
cylinder
settledcylinder
∀
∀−∀=ε (5-1)
Where: ε is the porosity of the floc blanket, cylinder∀ is the volume of the cylinder
(measured in mLs) at the 100 mL mark, and settled∀ is the volume of the settled
suspension in the cylinder (measured in mLs) after 30 minutes have passed.
Page 93
79
APPENDIX C. MEASUREMENT OF FLOC BLANKET SOLIDS
CONCENTRATION
Background
The solids concentrations analysis is adapted from Standard Methods’ (1998) total
solids dried at 103-105 ºC test. The results are representative of the mass of solids in
the sample per total mass.
Apparatus
a. Drying Oven set at 105 ºC
b. Dessicator
c. Gooch crucible: 25 mL capacity
Procedure
A Gooch crucible that has been oven dried at 105 ºC is desiccated for at least 30
minutes. The dry mass is taken and then a sample of at least 25 mL taken from the floc
blanket with a peristaltic pump at a specified floc blanket height is carefully poured
into the Gooch crucible and the mass is taken again. The Gooch crucible is carefully
loaded into a drying oven at 105 ºC. After the sample is evaporated and dried, the
sample is put into a dessicator to cool and then weighed. The sample is then put back
into the oven and dried. The procedure is repeated until the dried sample is a constant
mass. The solids concentrations can then be ascertained from this procedure utilizing
equations (5-2) and (5-3)
cruciblecrucibleliquidcruciblesample mmm −= += (5-2)
liquidmass
drymasss m
mC = (5-3)
Page 94
80
Where: cruciblem is the dry mass of the crucible, crucibleliquidm + is the total mass of the
crucible and liquid, cruciblesamplem = is the mass of the sample in the crucible, drymassm is
the dry mass of the crucible, and sC is solids concentration of the sample taken.
Page 95
81
APPENDIX D. CALIBRATION OF A PYCNOMETER
Background
A calibrated pycnometer is required for the analysis of floc blanket bulk density
(described below).
Apparatus
a. Pycnometer
b. Thermometer
Procedure
A dried pycnometer is placed in a desiccator for at least thirty minutes. The
pycnometer is then weighed utilizing an electronic balance and the dry weight of the
pycnometer is recorded. The temperature of a sample of distilled water is taken and
then put into the pycnometer at a marked height and weighed. The volume of the
pycnometer can then be calculated utilizing equations (5-4) and (5-5). The
measurements should be repeated at least three times for reproducibility and accuracy
and the average of these measurements should be used as the calibrated value.
drysamplewater mmm −= (5-4)
calibrated
watermeasured
mρ
=∀ (5-5)
Where: samplem is the average mass of the pycnometer filled with water, drym is the
average mass of the dried pycnometer, waterm is the calculated mass of water in the
pycnometer, measured∀ is the measured volume of the pycnometer, and calibratedρ is the
density of the water at the temperature of the distilled water in the test.
Page 96
82
APPENDIX E. BULK DENSITY ANALYSIS FOR A FLOC BLANKET
Background
The bulk density is an aggregate measure of the concentration of flocculated particles
in the floc blanket. The bulk density of the floc blanket is slightly higher than that of
water. The highly porosity of a floc blanket makes it difficult to measure head loss in
the floc blanket with sensitive pressure probes even at heights of 75 cm. Bulk density
is a useful alternative tool for estimating the head loss and ultimately the energy
dissipation rate through a floc blanket. Bulk density also can provide insight into the
changing properties of floc particles in a floc blanket based upon changes in upflow
velocity, influent turbidity, extent of flocculation in a flocculator, and alum dose. The
test for bulk density has been adapted from the specific gravity test listed in Standard
Methods (1998).
Apparatus
a. Calibrated pycnometer
b. Thermometer
Procedure
A 1000 mL sample is taken 45 cm from the bottom of a fully built 75 cm floc blanket
through the use of a peristaltic pump. The temperature of the sample is measured as a
reference for future temperature correction in density calculations. A calibrated
pycnometer taken from a desiccator is weighed utilizing an electronic balance to
confirm no significant mass changes have taken place.
A known amount of liquid is transferred to a calibrated pycnometer and the
pycnometer is carefully dried and weighed on the electronic balance again. The test is
Page 97
83
repeated taking different samples from the 1000 mL sample a minimum of three times.
The bulk density is then calculated in equations (5-6) and (5-7).
drymeasuredliquid mmm −= (5-6)
measured
calibrated
measured
liqiuidbulk
mρρ
ρ∀
= (5-7)
Where: liquidm is the mass of the liquid in the calibrated pycnometer, measuredm the total
average mass of replicate pycnometer tests, bulkρ is the bulk measured density of the
floc blanket, and measuredρ is the density of the water at the temperature of the liquid in
the test.
Page 98
84
REFERENCES
Adachi, Y., & Tanaka, Y. (1997). Settling velocity of an aluminium-kaolinite floc.
Water Res. 31(3), 449-454.
Arai, T., Yazaki, T., & Otsub, Y. (2007). Control of Rheology and Sedimentation
Behavior of Colloidal Suspensions. J. Rheology Japan. 35(2), 61-67.
AWWA/ASCE (1990). Water Treatment Plant Design. McGraw-Hill, New York.
Cailleaux, C., Pujol, E., de Dianous, F., and Druoton, J.C. Study of weighted
flocculation in view of a new type of clarifier. (1992). Aqua, 41(1), 18-27.
Casey, J. J., K. O'Donnel, and P.J. Purcell. (1984) "Uprating sludge blanket clarifiers
using inclined plates." Aqua, 2 (1), 91.
Chen, L., Lee, D.-J., & Chou, S.-S. (2006). Charge reversal effect on blanket in full-
scale floc blanket clarifier. J. Env. Eng. ASCE. 132(11), 1523-1526.
Chen, L., Sung, S., Lin, W., Lee, D., Huang, C., Juang, R., & Chang, H.-L. (2002).
Observations of blanket characteristics in full-scale floc blanket clarifiers. Water
Sci. and Tech. 47(1), 197-204.
Clesceri, L, Greenberg, A.E., & Eaton, A.D. (1998). Standard Methods for the
Examination of Water and Wastewater. American Public Health Association,
Baltimore.
Degremont, S.A.E. La Pulsator Lamellar. (1985). Atelier Offset Dregemont 6, 2M, nº
143.
Droppo, I.G., Exall, K., Stafford, K. (2008). Effects of chemical amendments on
aquatic floc structure, settling, and strength. Water Res. 42(1-2), 169-179.
Page 99
85
Francois, R.J. (1987). Strength of aluminum hydroxide floc. Water Res. 21(99), 1023-
1030.
Gould, B.W. Hindered Settling and Sludge Blanket Clarifiers. (1974). Effluent and
Water Treatment Journal 14(3), 131-135.
Gould, B. (1969). Sediment Distribution in Upflow. Australian Civ. Eng. 10(9), 27-29.
Gregory, R., Head, R., & Graham, N. (1996). Blanket solids concentration in floc
blanket clarifiers. Proc. Gothemburg Symp., Edinburg, Scotland.
Gregory, R. (1979). Floc Blanket Clarification. Water Research Centre TR 111,
Swindon, U.K.
Head, R., Hart, J., & Graham, N. (1997). Simulating the effect of blanket
characteristics on the floc blanket clarification process. Water Sci. and Tech.
36(4), 77-82.
Holh, H., Sigg, L., Stumm, W. In “Particulates in Water”; Kavanaugh, M.C., Lecki,
J.O., Eds. (1980). Publication 189, 1. American Chemical Society, Washington
DC.
Iwasaki, T. (1937). “Some notes on sand filtration.” Am. Water Works Assn.-J. 10,
1591-1597.
Ito, H. (1969). Laminar Flow in Curved Pipes. Z. Angew. Math. Mech. 49(11), 653-
663.
Jarvis, P., Jefferson, B., Gregory, J., and Parsons, S. A. (2005). A review of floc
strength and breakage. Water Res. 39(14), 3121-3137.
Jarvis, P., Jefferson, B, and Parsons, S. A. (2005). Breakage, Regrowth, and Fractal
Nature of Natural Organic Matter Flocs. Env. Sci. Technol. 39,2307-2314.
Page 100
86
Le Corre, K.S., Valsami-Jones, E., Hobbs, P., Jefferson, B., Parsons, S.A. (2007).
Agglomeration of struvite crystals. Water Res. 41(2) 419-425.
Lambert, S., Moustier, S., Dussouillez, P., Barakat, M., Bottero, J. Y., Le Petit, J., and
Ginestet, P. (2003). Analysis of the structure of very large bacterial aggregates by
small-angle multiple light scattering and confocal image analysis. J. Colloid
Interface Sci. 262(2), 384-390.
Letterman, R.D. (1983). Effect of solution chemistry on coagulation with hydrolyzed
Al(III). Significance of sulfate ion and pH. Water Res. 17(2), 195.
Letterman, R.D., and Iyer, D.R. (1985). Modeling the effects of Hydrolyzed
Aluminum and Solution Chemistry on Flocculation Kinetics. Env. Sci. & Tech. 19
(8), 673-681.
Letterman, R.D., Amirtharajah, A., and O’Melia, C.R. In “Chapter 6: Coagulation and
Flocculation”;Letterman, R. ed. (1999). Water quality and treatment: a handbook
of community water supplies. McGraw-Hill, New York.
Li, D. and Ganczarczyk, J. (1989). Fractal geometry of particle aggregates generated
in water and wastewater processes. Environmental Science and Technology.
23(11), 1385-1389.
Lin, W., Sung, S., Chen, L., Chung, H., Wang, C., Wu, R., et al. (2004). Treating
high-turbidity water using full-scale floc blanket clarifiers. J. Env. Eng. ASCE.
130(12), 1481-1487.
Liu, S. & Masliyah, J.H. (1993). Axially Invariant Laminar Flow in Helical Pipes with
a Finite Pitch. J. Fluid Mech. 251, 315-353.
Meakin, P. (1988). FRACTAL AGGREGATES. Adv. Colloid Interface Sci. 28(4),
249-331.
Page 101
87
Miller, D.G., & West, J.T. Pilot Plant Studies of Floc Blanket Clarification. (1968).
AWWA J. 60(2), 154-164.
Purushothaman, M. and Damodara, T. (1986). Defluoridation for rural areas-alum floc
sludge blanket technique. J. of Indian Water Works Assoc. 18(1), 91-97.
Reckhow, D.A. (1999, November 16). Exam 2: CEE 680. Retrieved April 5, 2009,
from
CEEserver:http://www.ecs.umass.edu/cee/reckhow/courses/680/99e2/99e2s.html
Reynolds, T. D., & Richards, P. A. (1996). Unit Operations and Processes in
Environmental Engineering. PWS Publishing Company, Boston.
Richardson, J.F., & Zaki, W.N. (1954). Sedimentation and Fluidisation: Part 1. Trans.
Inst. Chem. Engs. 35, 35-53.
Rossini, M., Garcia, J., & Galluzo, M. (1999). Optimization of the coagulation-
flocculation treatment: influence of rapid mix parameters. Water Res. 33(18),
1817-1826.
Saleh, A., & Hamoda, M. (1999). Upgrading of secondary clarifiers by inclined plate
settlers. Water Sci. and Tech. 40(7), 141-149.
Schulz, C.R., & Okun, D.A. (1984). Surface Water Treatment for Communities in
Developing Countries. John Wiley & Sons, New York.
Shen, Y.H. (2005). Treatment of low turbidity water by sweep coagulation using
bentonite. J. Chem Technol Biotechnol. 80, 581-586.
Su, S., Wu, R., & Lee, D. (2004). Blanket dynamics in upflow suspended bed. Water
Res. 38(1), 89-96.
Page 102
88
Sung, S., Lee, J., & Wu, R. (2005). Steady-state Solid Flux Plot of Blanket in Upflow
Suspended Bed. J. Chinese Inst. Chem. Eng. 36(4), 385-391.
Tambo, N., & Hozumi, H. (1979). Physical Characteristics of Flocs-II. Strength of
Floc. Water Res. 13, 424.
Tchobanoglous, G., & Schroeder, E. (1987). Water Quality. Addison-Wesley
Publishing Company, Inc., Boston.
Tchobanoglous, G., Burton, F. L., & Stensel, D. H. (2003). Wastewater Engineering
Treatment and Reuse. McGraw-Hill, New York.
Tesarik, I., Vostrcil, J., & Latal, M. (1986). Mathematical modeling of the flow in the
sludge blanket. 4(4), 47-54.
Weber-Shirk, M. (2008, May 21). An Automated Method for Testing Process
Parameters. From AguaClara Wiki:
http://confluence.cornell.edu/display/AGUACLARA/Process+Controller+Backgr
ound, April 5, 2009.
WHO (2005). Global Water Supply and Sanitation Assessment 2000 Report. From
WHO website:
.http://www.who.int/docstore/water_sanitation_health/Globassessment/Global5-
2.htm, April 5, 2009
Xiao, F., Ma, J., Yi, P., Huang, J.C. H. (2008). Effects of low temperature on
coagulation of kaolinite suspensions. Water Res. 43, 2983-2992.
Xiao, F., Xiangru, Z., Lee, C. (2008). Is electrophoretic mobility determination
meaningful for aluminum (III) coagulation of kaolinite suspension? J. Colloid
Interface Sci. (Article in press).
Page 103
89
Yeung, A., & Pelton, R. (1996). Micromechanics: A New Approach to Studying the
Strength and Breakup of Flocs. J.Colloid Interface Sci , 579-585.
Zhang, Z., Chen, Z., Li, Y., Fan, J., Fan, B., Luan, Z., and Lu, D. (2006). Performance
of a novel vertical-flow settler: a comparative study. J. Env. Sci. 18(5), 858-863.
Zhou, Y., & Shah, S. (2006). New Friction-Factor Corrections for Non-Newtonian
Fluid Flow in Coiled Tubing. SPE Drilling and Completion, 68-76.


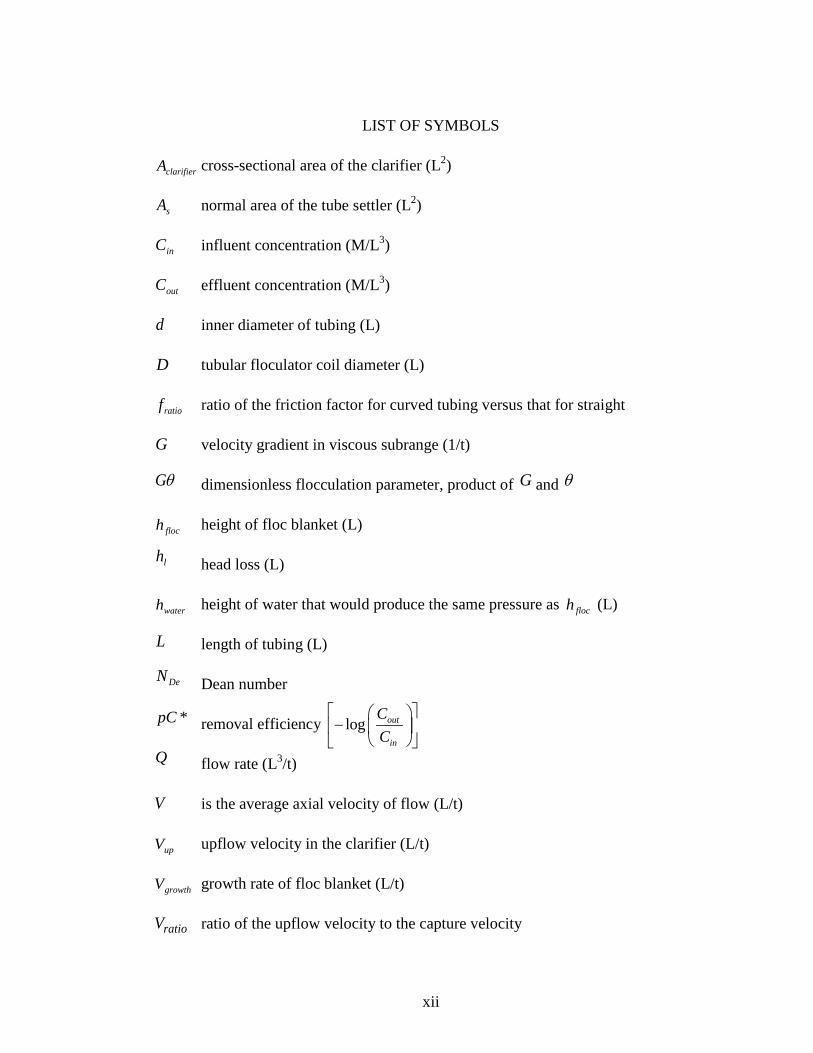


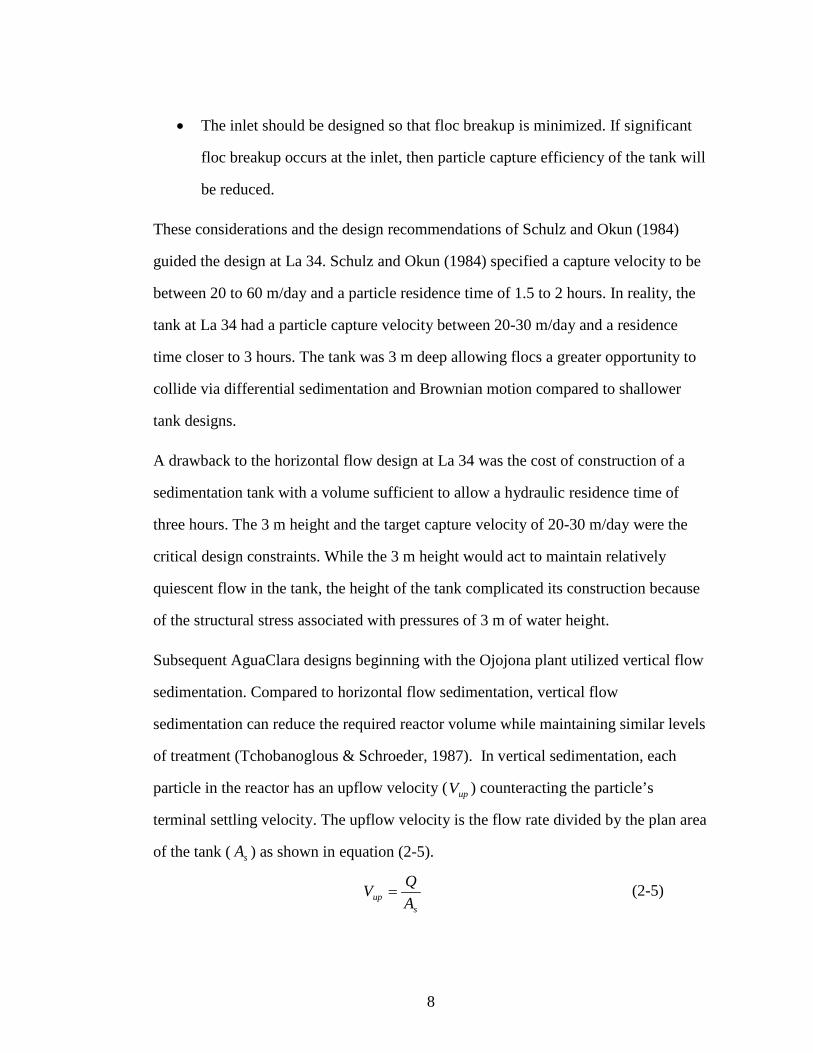


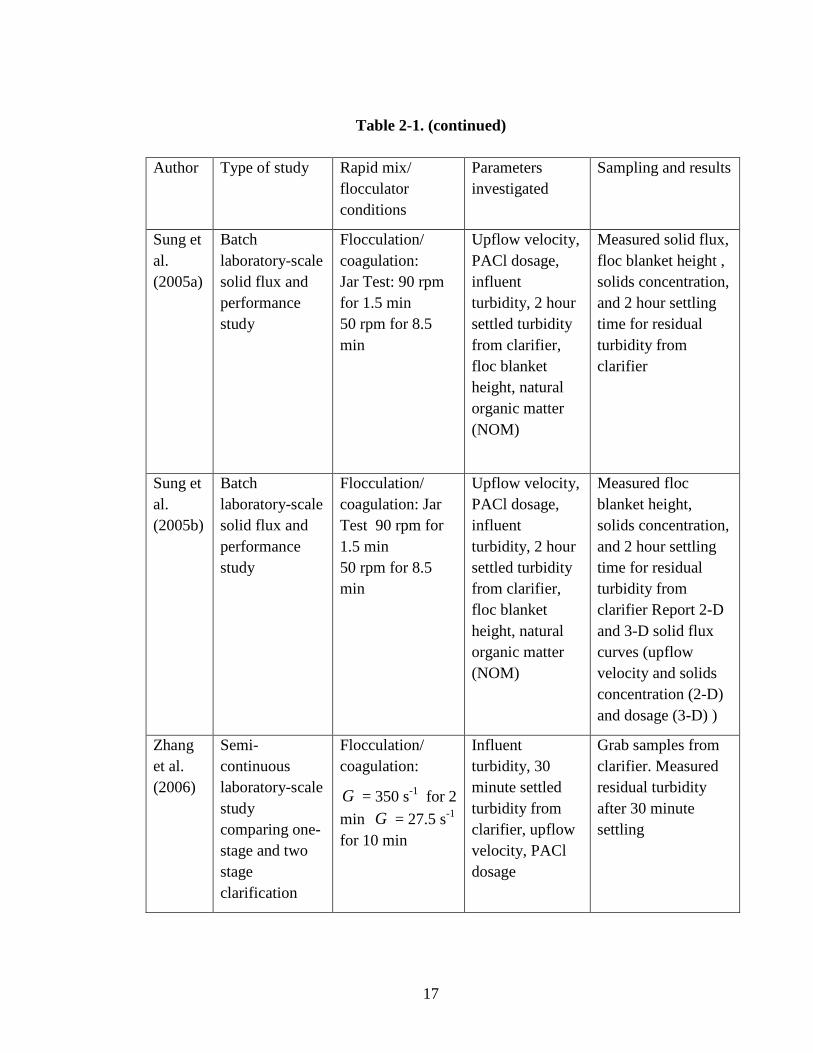
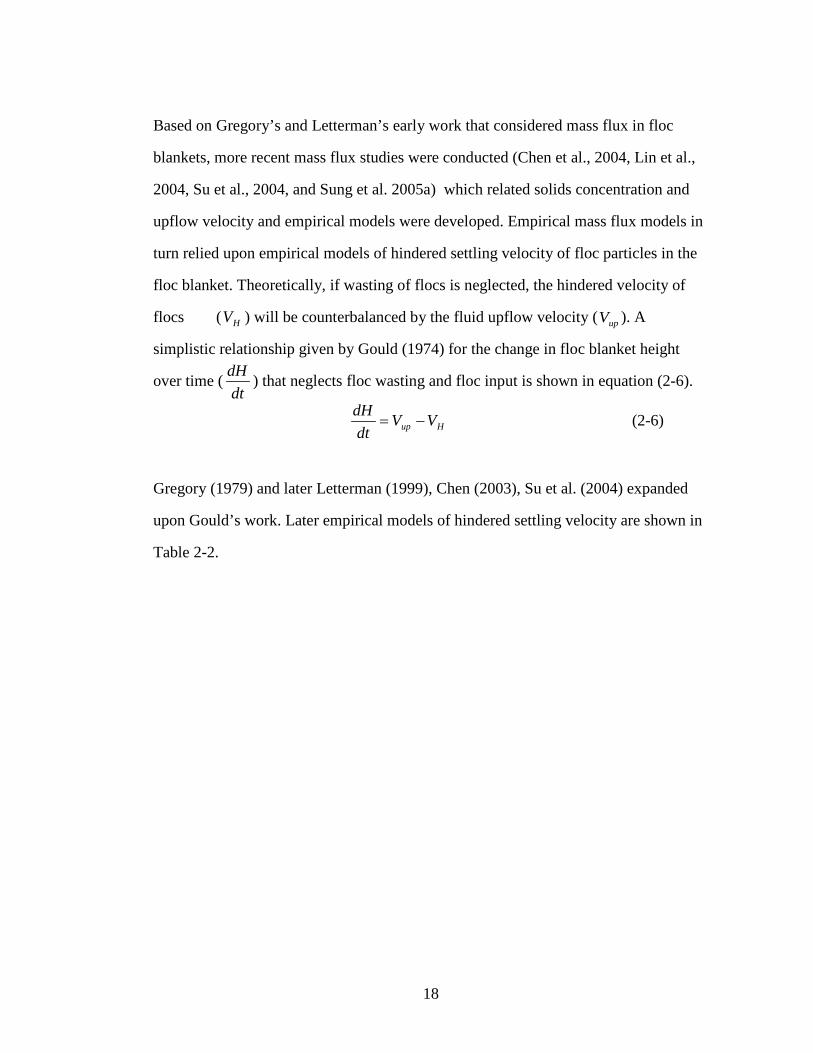
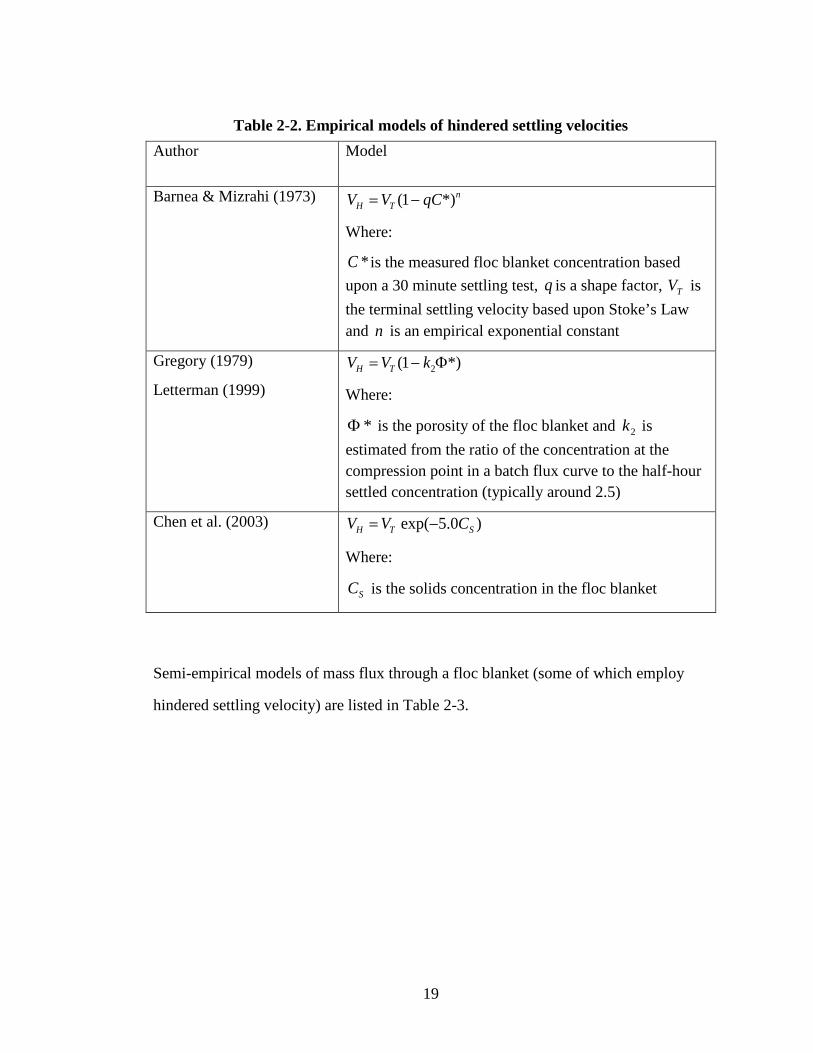


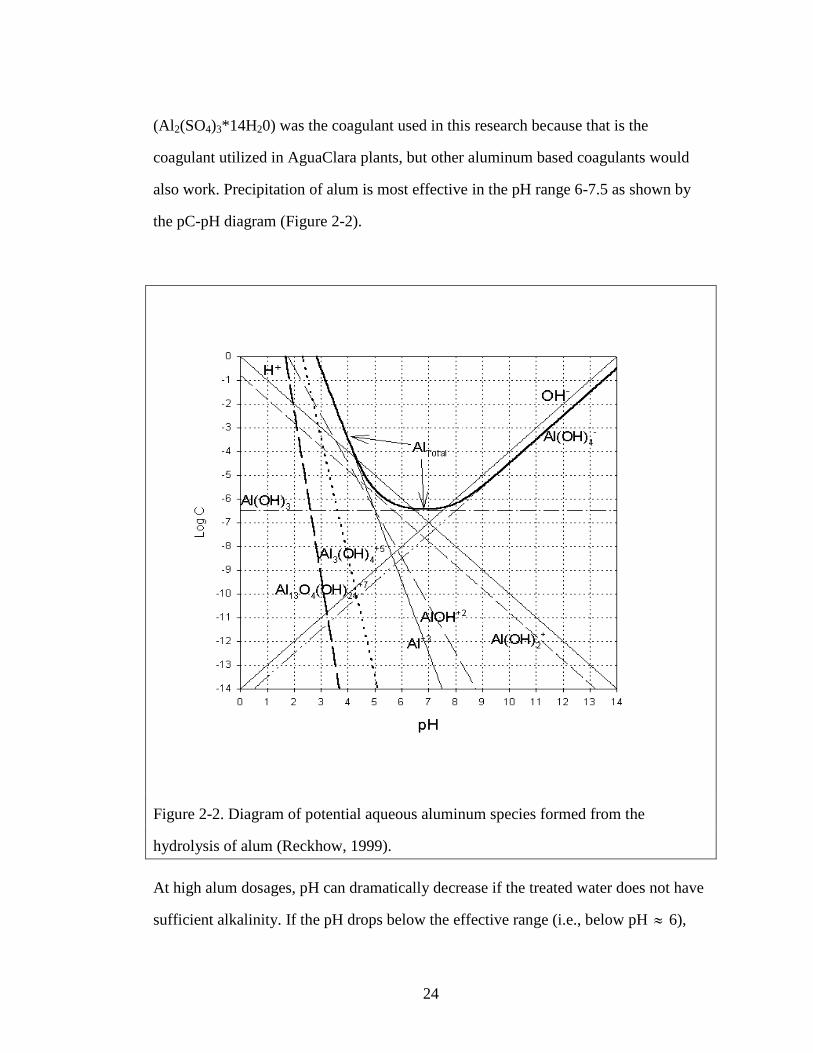


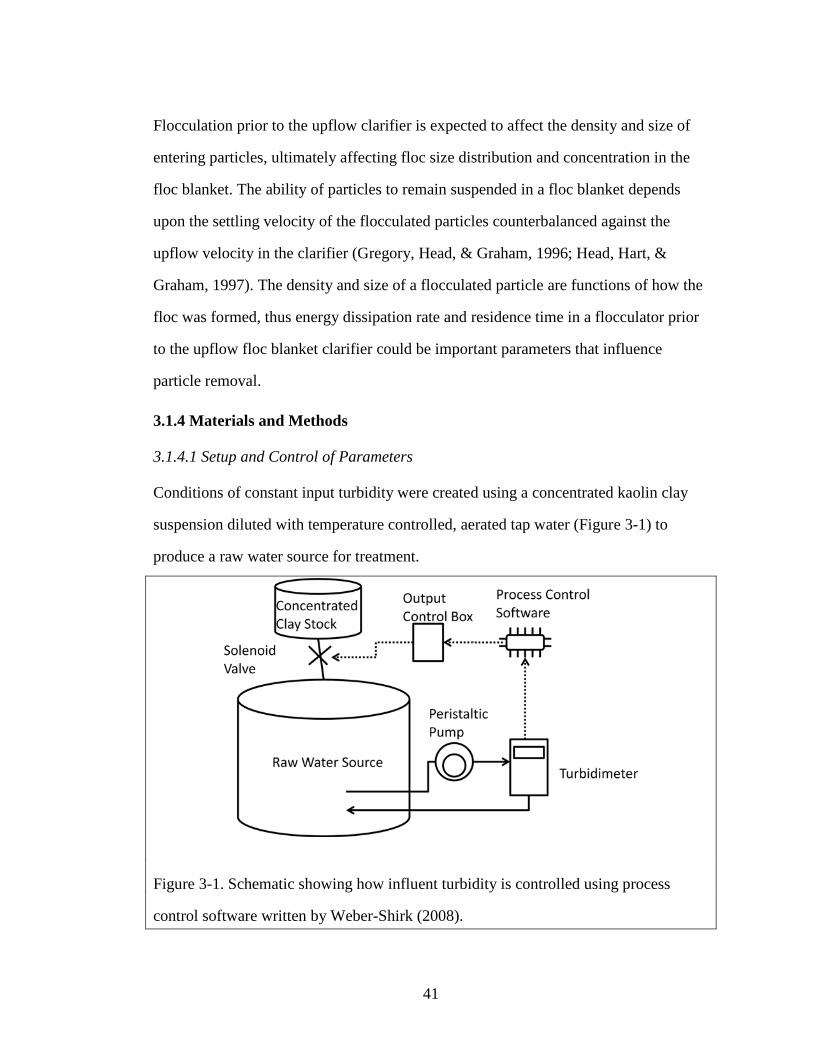


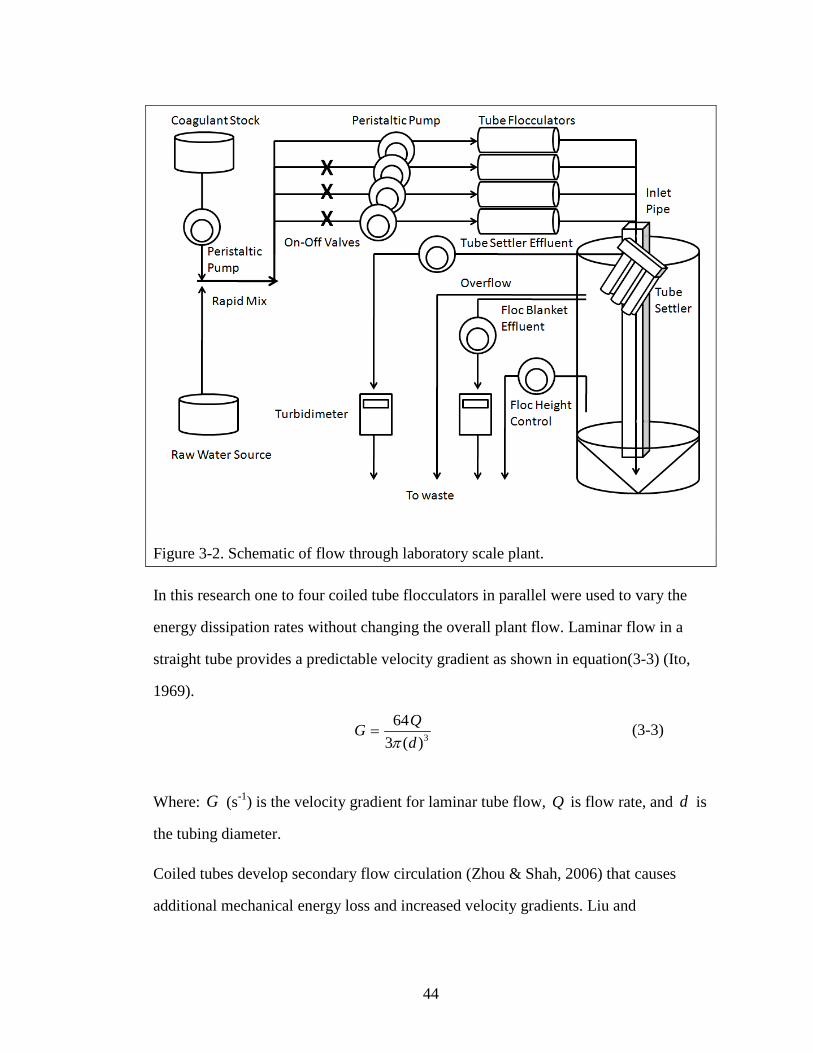

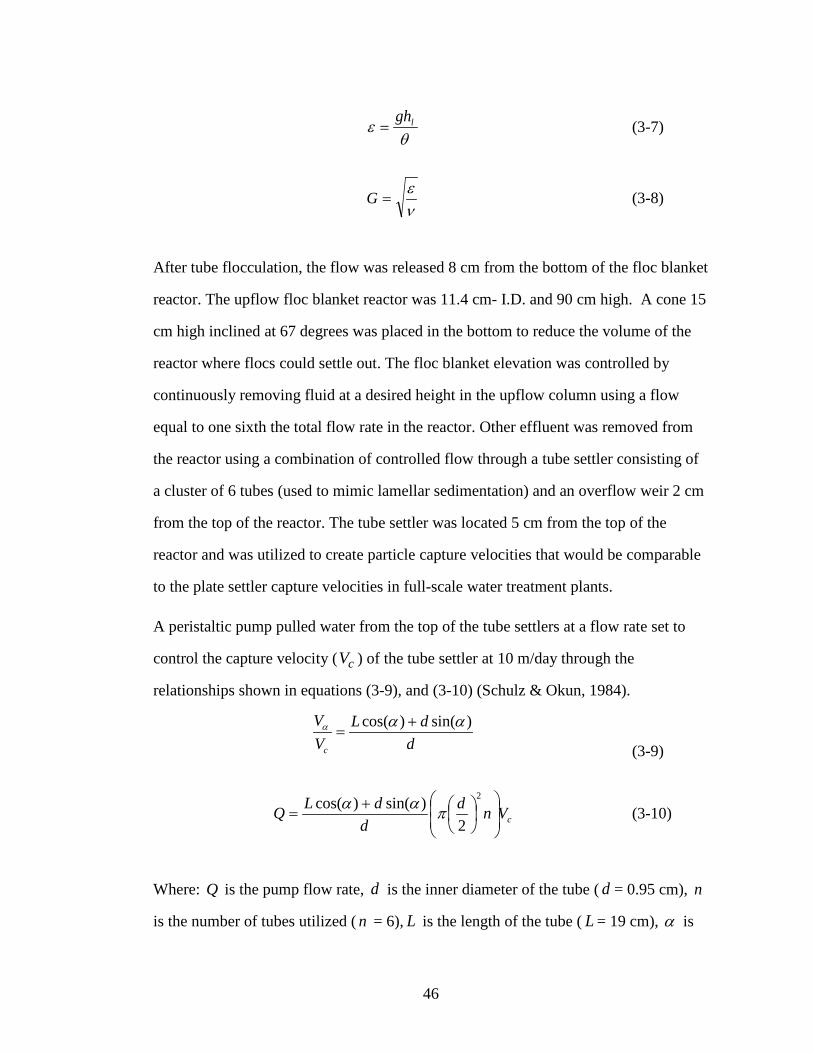


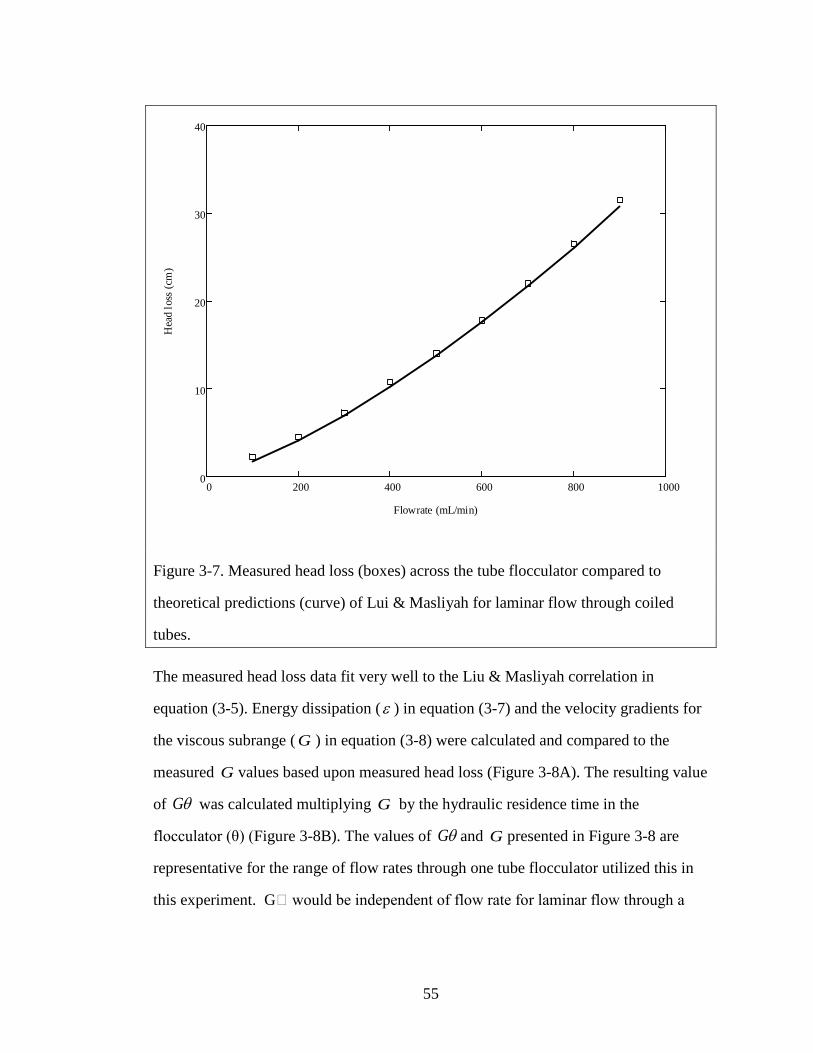

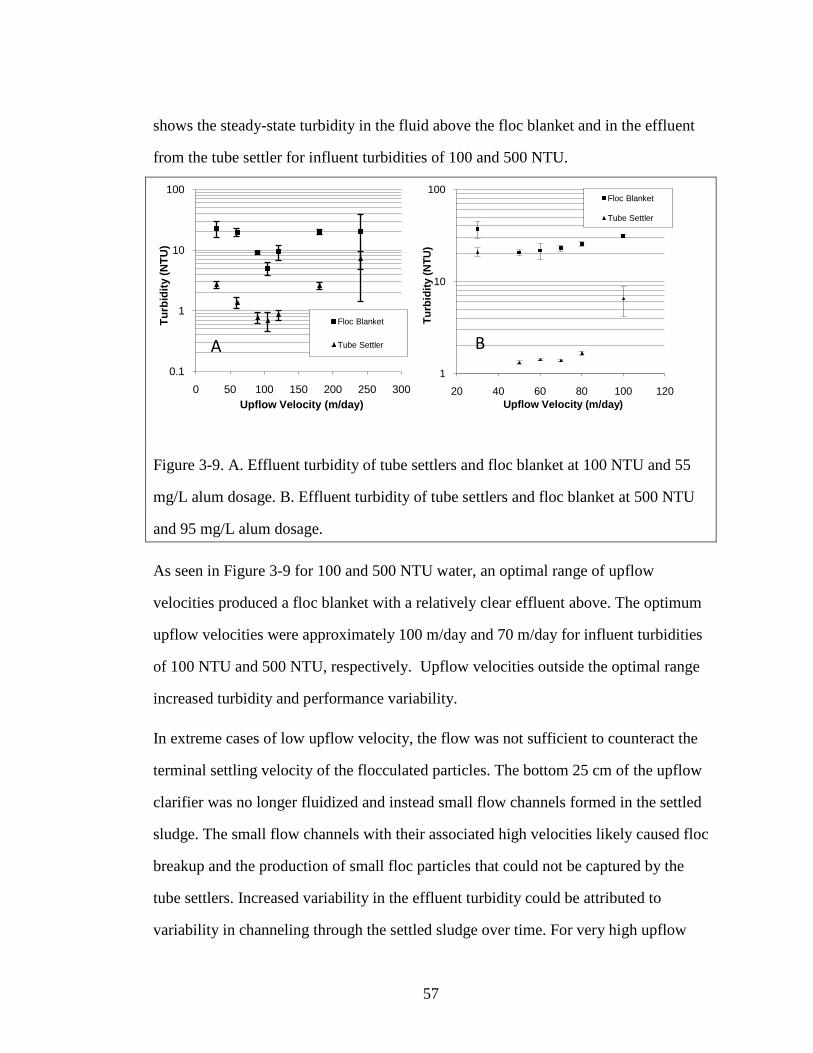
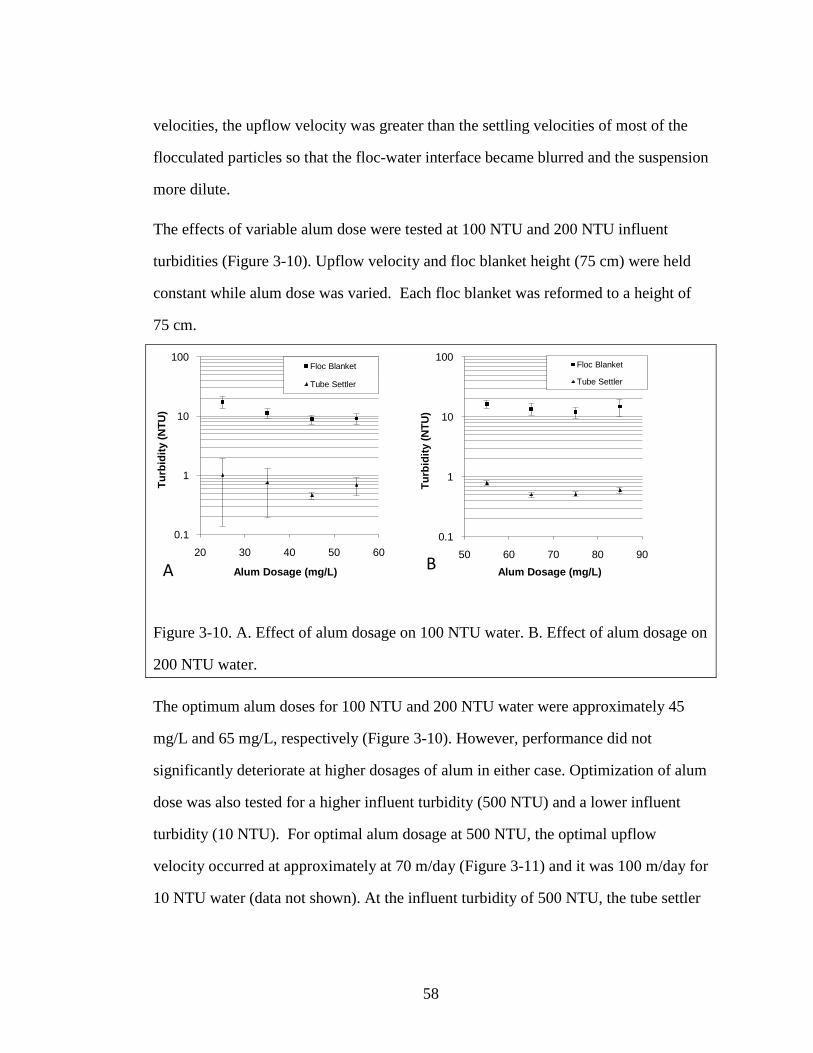


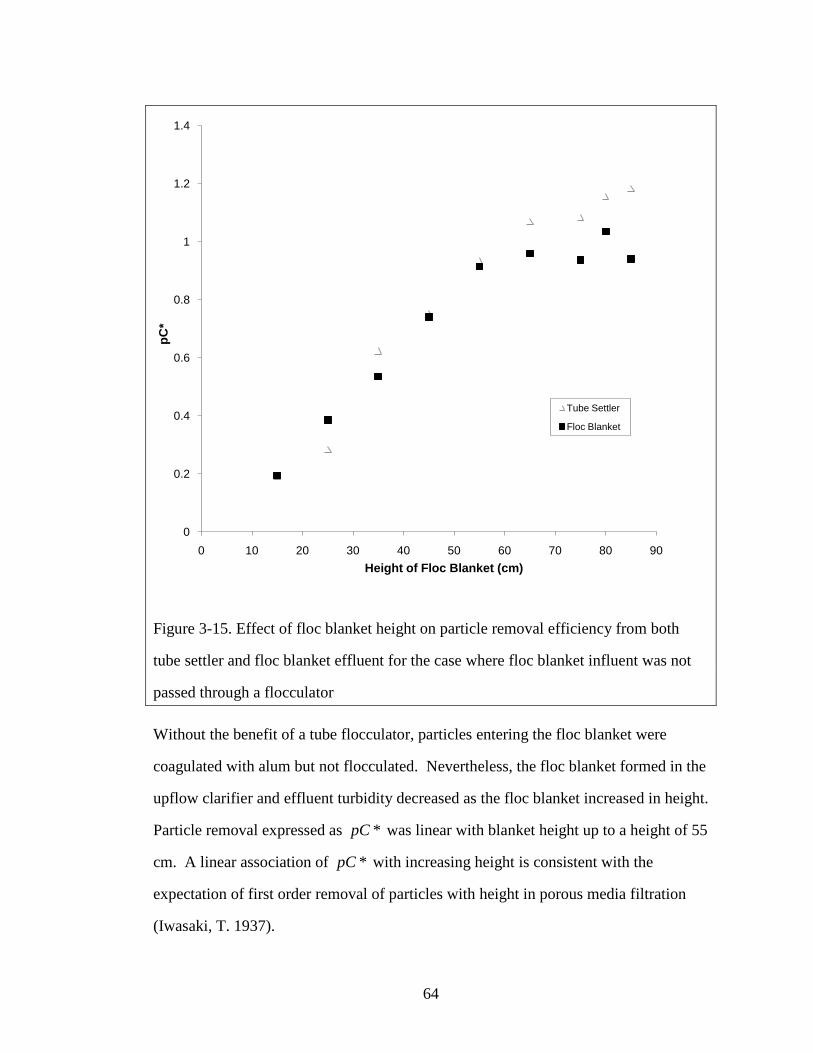


![Author's personal copy - Cornell University · 2012. 12. 21. · manifolds(ILDM)[1],thequasi-steady-stateassump-tion (QSSA)[10 13], computational singular pertur-bation (CSP)[21 23],](https://static.documents.pub/doc/80x56/611a32fe41ae2e4006351367/authors-personal-copy-cornell-university-2012-12-21-manifoldsildm1thequasi-steady-stateassump-tion.jpg)


