95 6 EVALUATION OF PHYSICO-CHEMICAL CHANGES IN WHOLE FRUITS BY ACTIVE PACKAGING 6.1 INTRODUCTION Fruits and vegetables are perishable and very liable to transport damage that consequently leads to deterioration in quality and wastage. Deterioration of fresh fruits and vegetables can result from physiological breakdown owing to natural ripening processes, water loss, temperature injury, physical damage, or microbial spoilage. All of these factors can interact, and all are influenced by temperature. Suitable technologies are available to maximize the shelf-life of perishables. The storage of fresh produce can be considerably extended if respiration can be slowed down using low temperature storage. For maximum shelf-life, fresh fruits must be in good or sound health. In the present study active packaging (AP) technology applied to fresh fruits can provide an alternative way to control and extend quality and shelf-life during storage. It can modify the internal gaseous environment to give the same effect as modified atmosphere storage. This chapter discusses the effect of AP treatments on the quality of fruits (apple, banana and orange) stored at 5±1°C refrigeration and 30±2°C ambient temperature. 6.2 RESULTS AND DISCUSSION 6.2.1 Effect of Active Packaging on the physico-chemical parameters of Fruits 6.2.1.1 Physiological loss in weight (PLW) Observations regarding the physiological loss in weight (PLW %) of fresh fruits at refrigeration temperature (RT) and ambient temperature (AT) and are presented in Figs. 6.1 (a and b) for apple, 6.1(c and d) for banana and 6.1(e and f) for orange at RT and AT respectively. Data presented in Table 6.1, 6.2 and 6.3 showed PLW at RT and AT for apple, banana and orange as given in appendices. During storage PLW increases and the maximum was recorded in all the fruits treated with moisture and ethylene scavengers followed by O 2 and CO 2 scavengers. Figs. 6.1(a,b) and Table 6.1 represent the observations regarding the changes in PLW in apple at refrigeration and ambient temperature. Initial PLW value was noted to be zero (0) which increases with storage period and recorded maximum in samples treated with moisture scavenger (2.90 and 3.46%) followed by samples treated with ethylene scavenger (2.86 and
Transcript
95
6 EVALUATION OF
PHYSICO-CHEMICAL CHANGES IN WHOLE FRUITS BY ACTIVE PACKAGING
6.1 INTRODUCTION
Fruits and vegetables are perishable and very liable to transport damage that consequently leads to deterioration in quality and wastage. Deterioration of fresh fruits and vegetables can result from physiological breakdown owing to natural ripening processes, water loss, temperature injury, physical damage, or microbial spoilage. All of these factors can interact, and all are influenced by temperature. Suitable technologies are available to maximize the shelf-life of perishables. The storage of fresh produce can be considerably extended if respiration can be slowed down using low temperature storage. For maximum shelf-life, fresh fruits must be in good or sound health. In the present study active packaging (AP) technology applied to fresh fruits can provide an alternative way to control and extend quality and shelf-life during storage. It can modify the internal gaseous environment to give the same effect as modified atmosphere storage. This chapter discusses the effect of AP treatments on the quality of fruits (apple, banana and orange) stored at 5±1°C refrigeration and 30±2°C ambient temperature.
6.2 RESULTS AND DISCUSSION
6.2.1 Effect of Active Packaging on the physico-chemical parameters of Fruits
6.2.1.1 Physiological loss in weight (PLW)
Observations regarding the physiological loss in weight (PLW %) of fresh fruits at refrigeration temperature (RT) and ambient temperature (AT) and are presented in Figs. 6.1 (a and b) for apple, 6.1(c and d) for banana and 6.1(e and f) for orange at RT and AT respectively. Data presented in Table 6.1, 6.2 and 6.3 showed PLW at RT and AT for apple, banana and orange as given in appendices. During storage PLW increases and the maximum was recorded in all the fruits treated with moisture and ethylene scavengers followed by O2 and CO2 scavengers.
Figs. 6.1(a,b) and Table 6.1 represent the observations regarding the changes in PLW in apple at refrigeration and ambient temperature. Initial PLW value was noted to be zero (0) which increases with storage period and recorded maximum in samples treated with moisture scavenger (2.90 and 3.46%) followed by samples treated with ethylene scavenger (2.86 and
96
3.44%), O2 scavenger (2.76 and 3.23%), CO2 scavenger (2.69 and 3.22%), and minimum (1.70 and 1.44%) was observed in chitosan coated samples whereas, control samples possessed lower PLW (2.60 and 3.33%) than scavenging treatments at RT and AT on 50th and 21st day of storage respectively.
Fig. 6.1(a): Effect of active packaging on PLW (%) of apple at RT
Fig. 6.1(b): Effect of active packaging on PLW (%) of apple at AT
Figs. 6.1(c,d) and Table 6.2 express the observations regarding the changes in PLW in banana at refrigeration and ambient temperature, recorded lower PLW (0.69 and 0.83%) for control samples than all the scavengers. Highest PLW value was observed for banana samples treated with moisture scavenger (2.03 and 1.30%) followed by ethylene scavenger (1.94 and 1.30%) and minimum PLW (0.33 and 0.61%) was found in chitosan coated samples at RT and AT on 15th and 9th day of storage respectively.
Fig. 6.1(c): Effect of active packaging on PLW (%) of banana at RT
Fig. 6.1(d): Effect of active packaging on PLW (%) of banana at AT
97
Figs. 6.1(e,f) and Table 6.3 present the observations regarding the changes in PLW in orange at refrigeration and ambient temperature. For PLW in orange trend of losses were almost identical to that of apple and banana. In orange samples maximum PLW (2.78 and 2.54%) was estimated in case of moisture scavenging treatment and minimum (0.30 and 0.96%) was observed in chitosan coated samples at RT and AT on 25th and 15th day of storage respectively.
Fig. 6.1(e): Effect of active packaging on PLW (%) of orange at RT
Fig. 6.1(f): Effect of active packaging on PLW (%) of orange at AT
Highest PLW was observed in intact fruits may be due to high transpirational and respiratory substrate losses at ambient temperature. However the magnitude of losses was lower at low temperature and it may be due to reduced metabolic activities and evapo-transpirational losses. Perez et al. (2004) also observed that weight loss in Avocado fruit was linear at both the storage temperatures, at 20ºC the loss was 4.3% for 8 days and 3% at 10ºC for 22 days and they also stated that fruits under low temperature storage had higher storage life upto 32 days as compared to high temperature storage with 8 or 6 days of storage life. Among the treatments of AP, chitosan coated fruits showed minimum weight loss throughout storage period, whereas, fruit samples showed maximum PLW when treated with ethylene scavenger followed by moisture scavenger followed by O2 and CO2 scavenger as these scavengers possess the tendency to absorb moisture from the fruit surface and utilized in the chemical reactions, so all the scavengers happened to absorb water during storage. Chitosan coating reduced the PLW significantly (p<0.05) in all the intact commodities studied. At ambient temperature, among all the treatments minimum reduction in PLW was observed in coated fruits and vegetables. The results obtained in the present investigation are in accordance with previously reported results by increase in PLW with increasing duration of storage but the PLW was lower in coated samples than the control in mango fruit stored at
98
ambient conditions (20-30°C and 70-90% RH) (Giri et al., 2003). Slower rates of weight loss of coated fruits can be attributed to the barrier properties for gas diffusion of stomata the organelles that regulate the transpiration process and gas exchange between the fruit and the environment (Kester, 1989). AP technology creates a modified atmosphere for fruits and the results demonstrate that AP treatments slow down the metabolism to give prolonged shelf-life. This is in agreement with Kader and Watkins (2000), modified atmosphere (MA) not only helps in retarding browning but also helps in the maintenance of high relative humidity and, therefore, reduction of water loss and, consequently, weight loss.
These results are also in agreement with those of Carrillo et al. (2000) who observed that coated or uncoated Haden mango in Mexico had an increasing trend of weight loss with the passage of storage time, the weight loss was lower in coated fruit (4.0-6.5%) as compared to control (0.0-9.0%). Lin and Zhao (2007) observed that edible coatings provide an effective barrier to oxygen, carbon dioxide and water vapour transmission thus helping to alleviate the problem of moisture loss.
6.2.1.2 Moisture content
Observations regarding the effect of AP on moisture content (%) of whole fruits during storage at refrigeration and ambient temperature are presented in Figs. 6.2 (a and b) for apple, 6.2(c and d) for banana and 6.2 (e and f) for orange at RT and AT, respectively and the data regarding these observations are presented in Table 6.4, 6.5 and 6.6 given in appendices. Initial moisture content for apple (83.51%), banana (73.29%) and orange (86.32%).
Figs. 6.2(a,b) and Table 6.4 depict the observations regarding the changes in moisture content in apple at refrigeration and ambient temperature. Both at RT and AT moisture content of all samples was found decreasing. Application of chitosan coating proved its efficacy in retention of moisture content of apple samples as it was 81.34% and 81.74% in case of chitosan coated samples stored at RT and AT on 50th and 21st day, respectively. Maximum moisture loss was observed in control samples of both storage conditions. Expected results for some treatments were not observed whereas, ethylene and CO2 scavenger have proven their ability in retention of freshness.
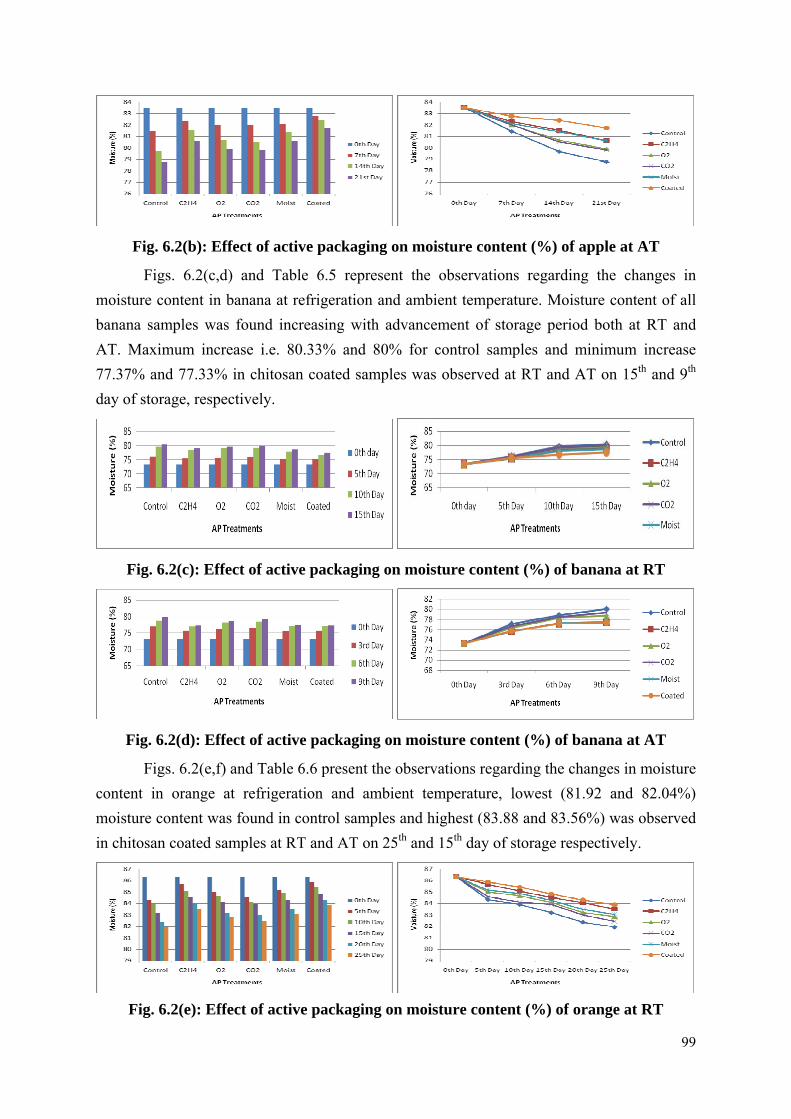
Fig. 6.2(a): Effect of active packaging on moisture content (%) of apple at RT
99
Fig. 6.2(b): Effect of active packaging on moisture content (%) of apple at AT
Figs. 6.2(c,d) and Table 6.5 represent the observations regarding the changes in moisture content in banana at refrigeration and ambient temperature. Moisture content of all banana samples was found increasing with advancement of storage period both at RT and AT. Maximum increase i.e. 80.33% and 80% for control samples and minimum increase 77.37% and 77.33% in chitosan coated samples was observed at RT and AT on 15th and 9th day of storage, respectively.
Fig. 6.2(c): Effect of active packaging on moisture content (%) of banana at RT
Fig. 6.2(d): Effect of active packaging on moisture content (%) of banana at AT
Figs. 6.2(e,f) and Table 6.6 present the observations regarding the changes in moisture content in orange at refrigeration and ambient temperature, lowest (81.92 and 82.04%) moisture content was found in control samples and highest (83.88 and 83.56%) was observed in chitosan coated samples at RT and AT on 25th and 15th day of storage respectively.
Fig. 6.2(e): Effect of active packaging on moisture content (%) of orange at RT
100
Fig. 6.2(f): Effect of active packaging on moisture content (%) of orange at AT
Moisture content decreased with advancement of storage period in apple and orange this was due to transpiration rate and the decrease was higher at AT than RT it may be attributed to the higher metabolic activity. An increase in temperature affected fruit respiration and possibly the permeance of the cuticle. Magurie et al. (2001) found that increased storage temperatures increased the moisture permeability of the cuticle of apples. Similarly, Henze (1995) observed that fresh weight loss and thus moisture loss, of ‘Conference’ pears at 1C, 4C and 16C respectively, increased when storage temperature increased.
But increase in moisture content was observed in banana. Total transfer of moisture from peel to pulp and enzymatic degradation of starch and other molecules might be the possible reason of increase in moisture content in banana fruit. The higher moisture percentage in banana was recorded at refrigerated temperature (RT) as compared with ambient temperature (AT) because low temperature storage is responsible for chilling injury in banana and thereby deterioration of banana fruitt and among the AP treatments, chitosan coated fruits showed the best results with respect to chilling injury. It reduced the increase in moisture content in banana and recorded to be 77.4% at RT and 77.3% at AT on the final day of storage and remain acceptable. The highest moisture content in banana fruit was observed in the control samples followed by the samples treated with CO2 scavenger �O2 scavenger �moisture scavenger �ethylene scavenger �chitosan coating. AP treatements significantly (p<0.05) reduced the movement of moisture from peel to pulp with the advancement of storage. The increase in moisture content with increase in storage duration was reported by Lizada et al. (1990) who found that water is withdrawn from peel to pulp, consequently, water content decreases in the peel but not in the pulp during ripening. Our results are also in agreement with the findings of Sarode and Tayade, (2009) who also reported the similar behaviour of moisture content i.e. movement of moisture from peel to pulp in banana fruit when stored at 32°C. Whereas, decreasing trend of moisture content with the advancement of storage duration was observed in case of apple and orange samples but the higher retention of moisture content was observed in the fruit samples treated with chitosan coating on RT than AT. Our results are in accordance with Jahromi et al. (2008) who investigated that moisture content of date fruit was decreased during ripening.
101
6.2.1.3 Total soluble solids (TSS)
Observations regarding the effect of Active Packaging on TSS (°Brix) of whole fruits during storage at ambient and refrigeration temperature storage conditions are presented in Figs. 6.3(a and b) for apple, 6.3(c and d) for banana and 6.3(e and f) for orange at RT and AT respectively. A gradual increase in TSS was observed under various treatments of AP with advancement of storage and data regarding these observations are given in Table 6.7, 6.8 and 6.9 given in appendices, showed initial TSS value for apple 12.17°Brix, banana 20.0°Brix and orange 8.77°Brix respectively.
Figs. 6.3(a,b) and Table 6.7 present the observations regarding the changes in TSS in apple at refrigeration and ambient temperature, showed maximum TSS (14.73 and 14.43°Brix) was observed in control samples followed by samples treated with CO2 scavenger (14.5 and 14.03°Brix), O2 scavenger (14.17 and 13.9°Brix), moisture scavenger (14.17 and 13.87°Brix), ethylene scavenger (14.1 and 13.77°Brix) and chitosan coated samples exhibited minimum value (13.83 and 13.67°Brix) of TSS at RT and AT on 50th and 21st day of storage, respectively.
Fig. 6.3(a): Effect of active packaging on TSS (°Brix) of whole apple at RT
Fig. 6.3(b): Effect of active packaging on TSS (°Brix) of apple at AT
Figs. 6.3(c,d) and Table 6.8 depict the observations regarding the changes in TSS in banana at refrigeration and ambient temperature, exhibited highest TSS value (26.0 and 26.0°Brix) in control samples followed by samples treated with CO2 scavenger (24.73 and 26.07°Brix), O2 scavenger (24.43 and 25.93°Brix), moisture scavenger (24.13 and 24.93°Brix) ethylene scavenger (23.87 and 24.87°Brix) and minimum increase (23.0 and 24.67°Brix) was observed in chitosan coated fruit samples at RT and AT on 15th and 9th day of storage respectively.
102
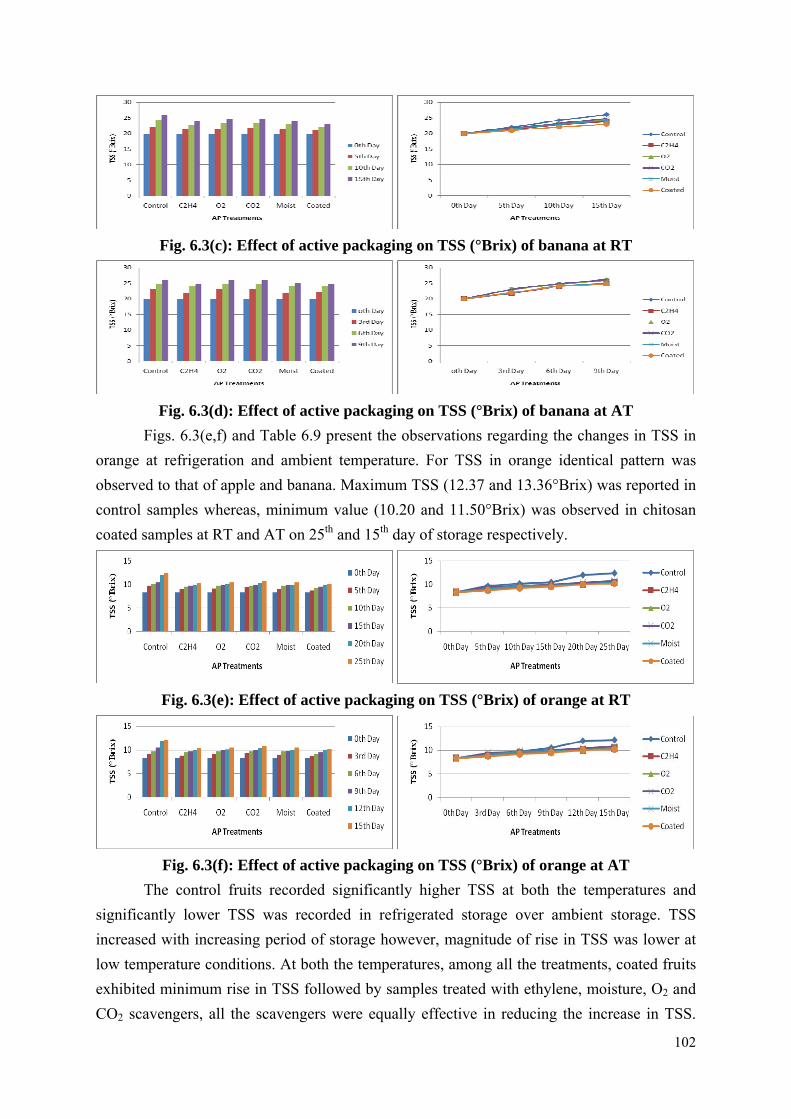
Fig. 6.3(c): Effect of active packaging on TSS (°Brix) of banana at RT
Fig. 6.3(d): Effect of active packaging on TSS (°Brix) of banana at AT
Figs. 6.3(e,f) and Table 6.9 present the observations regarding the changes in TSS in orange at refrigeration and ambient temperature. For TSS in orange identical pattern was observed to that of apple and banana. Maximum TSS (12.37 and 13.36°Brix) was reported in control samples whereas, minimum value (10.20 and 11.50°Brix) was observed in chitosan coated samples at RT and AT on 25th and 15th day of storage respectively.
Fig. 6.3(e): Effect of active packaging on TSS (°Brix) of orange at RT
Fig. 6.3(f): Effect of active packaging on TSS (°Brix) of orange at AT
The control fruits recorded significantly higher TSS at both the temperatures and significantly lower TSS was recorded in refrigerated storage over ambient storage. TSS increased with increasing period of storage however, magnitude of rise in TSS was lower at low temperature conditions. At both the temperatures, among all the treatments, coated fruits exhibited minimum rise in TSS followed by samples treated with ethylene, moisture, O2 and CO2 scavengers, all the scavengers were equally effective in reducing the increase in TSS.
103
AP treatements significantly (p<0.05) reduced the increase in TSS content with the advancement of storage. The general rise in TSS of fruits may be due to hydrolysis of polysaccharides i.e. conversion of starch into sugars by metabolic activities and loss of water from fruit surface. Slow rise in TSS at low temperature could be attributed to reduced metabolic activities and reduced transpirational losses. The results of the present investigation are in accordance with the previously reported results, Doreyappa-Godwa and Huddar (2001), who found similar behaviour of TSS in green Alphanso and other 7 hybrids or varities of mango fruit that undergone a series of physico-chemical changes and major changes were increased in TSS content from 8.55 to 19.0º Brix during ripening when fruits were stored at 18-34°C.
Similar views were expressed by Rathore et al. (2007) who studied the effect of storage on physico-chemical changes in packaged mango in cardboard carton of export quality having one hole in each side wall on four sides at 32-35ºC with 53.6-78.8% RH and observed that TSS contents were increased from 10-16.23% upto 6th day and then decreased upto 15th day of storage, the increase in TSS might be due to the alteration in cell wall structure and breakdown of complex carbohydrates into simple sugar during storage and further hydrolysis decreased the TSS during prolonged storage.
Hussain et al. (2005) and Policegourda and Aradhya (2007) also observed that TSS was significantly increased by increasing storage period at room temperature. Further, Abbasi et al. (2009) studied the effect of chitosan coating on postharvest quality of mango fruit at 15°C and 85% relative humidity and observed the same pattern of TSS. 6.2.1.4 Titratable acidity
Observations regarding the effect of AP on titratable acidity (%) of whole fruits at refrigeration and ambient temperature storage conditions are presented in Figs. 6.4 (a and b) for apple, 6.4(c and d) for banana and 6.3(e and f) for orange at RT and AT respectively. Data presented in Table 6.10, 6.11 and 6.12 given in appendices, showed initial titratable acidity for apple (0.24%), banana (0.23%) and orange (1.26%). A gradual decline in titratable acidity was observed with the advancement of storage period in all the treatments of AP at refrigeration as well as ambient temperature.
Figs. 6.4(a,b) and Table 6.10 present the observations regarding the changes in titratable acidity in apple at refrigeration and ambient temperature, maximum retention (0.094 and 0.103%) was observed in apple fruits coated with chitosan followed by ethylene scavenger (0.088 and 0.095%), moisture scavenger (0.088 and 0.092%), O2 scavenger (0.087 and 0.089%), CO2 scavenger (0.084 and 0.085%) and the minimum (0.082 and 0.071%) was recorded in control samples at RT and AT on 50th and 21st day of storage respectively. Among AP treatments, chitosan coated samples significantly (p<0.05) retained the titratable acidity in apple at RT whereas, at AT AP treatments significantly retained acidity.
104
Fig. 6.4(a): Effect of active packaging on titratable acidity (%) of apple at RT
Fig. 6.4(b): Effect of active packaging on titratable acidity (%) of apple at AT
Figs. 6.4(c,d) and Table 6.11 depict the observations regarding the changes in titratable acidity in banana at refrigeration and ambient temperature and maximum retention (0.163 and 0.161%) was observed in chitosan coated samples followed by samples treated with ethylene scavenger (0.162 and 1.161%), moisture scavenger (0.159 and 0.161%), O2
scavenger (0.157 and 0.154%), CO2 scavenger (0.153 and 0.147%) and minimum (0.150 and 0.122%) was observed in control samples at RT and AT on 15th and 9th day of storage respectively. AP treatments except CO2 significantly retained acidity at RT whereas, at AT all AP treatments significantly retained the acidity (p<0.05).
Fig. 6.4(c): Effect of active packaging on titratable acidity (%) of banana at RT
Fig. 6.4(d): Effect of active packaging on titratable acidity (%) of banana at AT
Figs. 6.4(e,f) and Table 6.12 express the observations regarding the changes in titratable acidity in orange at refrigeration and ambient temperature and maximum retention
105
(0.79 and 0.61%) was observed in chitosan coated samples followed by the samples treated with ethylene, moisture scavenger and O2 scavengers exhibited similar (0.68 and 0.54%) values, CO2 scavenger (0.58 and 0.51%) and minimum (0.47 and 0.51%) was recorded in control samples at RT and AT on 25th and 15th day of storage respectively. AP treatments except CO2 scavenger significantly retained the acidity at RT whereas, at AT chitosan significantly retained the acidity followed by ethylene which was on par with moisture and O2 scavengers.
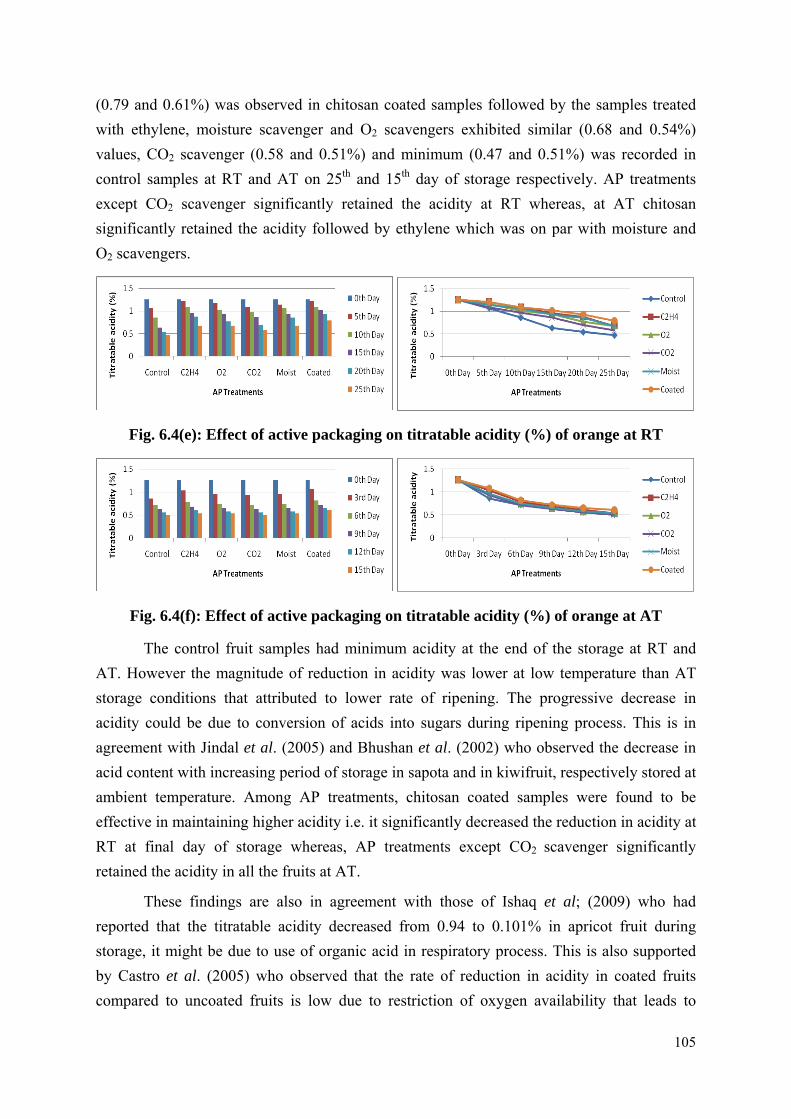
Fig. 6.4(e): Effect of active packaging on titratable acidity (%) of orange at RT
Fig. 6.4(f): Effect of active packaging on titratable acidity (%) of orange at AT
The control fruit samples had minimum acidity at the end of the storage at RT and AT. However the magnitude of reduction in acidity was lower at low temperature than AT storage conditions that attributed to lower rate of ripening. The progressive decrease in acidity could be due to conversion of acids into sugars during ripening process. This is in agreement with Jindal et al. (2005) and Bhushan et al. (2002) who observed the decrease in acid content with increasing period of storage in sapota and in kiwifruit, respectively stored at ambient temperature. Among AP treatments, chitosan coated samples were found to be effective in maintaining higher acidity i.e. it significantly decreased the reduction in acidity at RT at final day of storage whereas, AP treatments except CO2 scavenger significantly retained the acidity in all the fruits at AT.
These findings are also in agreement with those of Ishaq et al; (2009) who had reported that the titratable acidity decreased from 0.94 to 0.101% in apricot fruit during storage, it might be due to use of organic acid in respiratory process. This is also supported by Castro et al. (2005) who observed that the rate of reduction in acidity in coated fruits compared to uncoated fruits is low due to restriction of oxygen availability that leads to
106
reduced respiration rate. Further, Jiang et al. (2004) also reported the effect of chitosan coatings on litchi fruit and found that titratable acidity decreased during storage.
6.2.1.5 Ascorbic acid
The observations regarding the effect of active packaging on ascorbic acid content (mg/100g) of whole fruits during storage at refrigerated and ambient temperature are presented in Figs. 6.5 (a and b) for apple, 6.5 (c and d) for banana and 6.5 (e and f) for orange at RT and AT respectively. Data presented in Table 6.13, 6.14 and 6.15 as given in appendices and the initial ascorbic acid content was noted to be (7.36 mg/100g), (10.0 mg/100g) and (30.0 mg/100g) in apple, banana and orange, respectively.
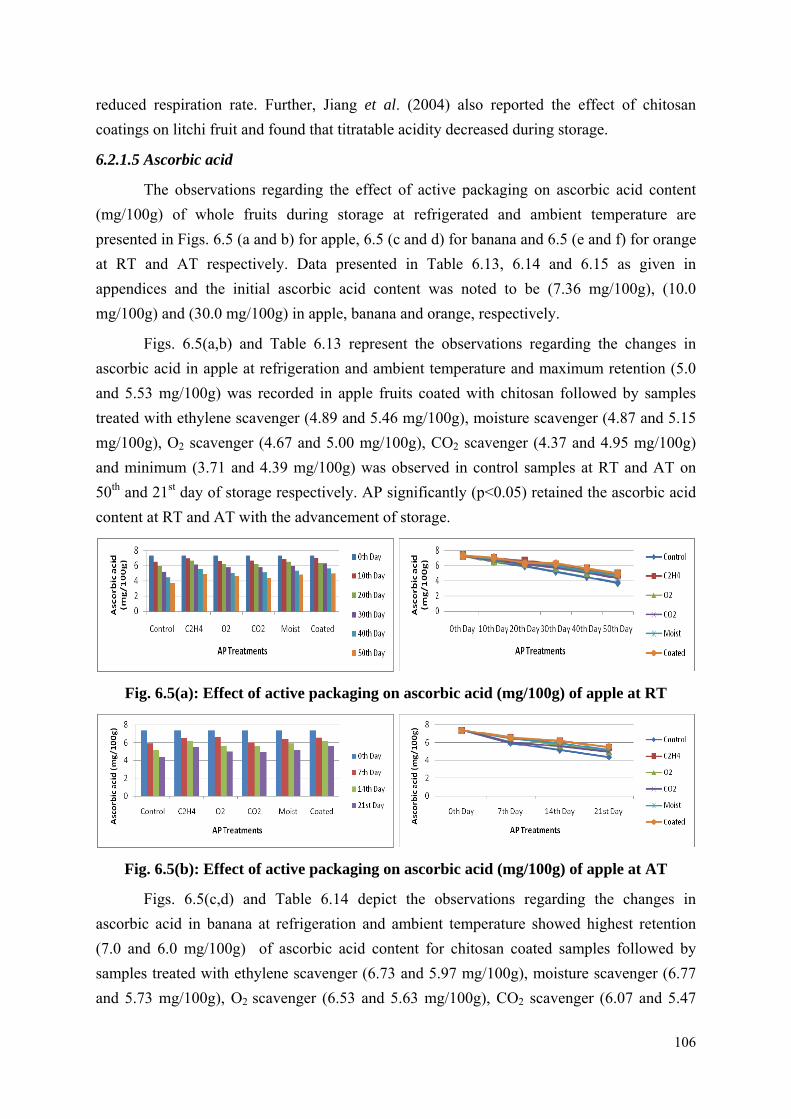
Figs. 6.5(a,b) and Table 6.13 represent the observations regarding the changes in ascorbic acid in apple at refrigeration and ambient temperature and maximum retention (5.0 and 5.53 mg/100g) was recorded in apple fruits coated with chitosan followed by samples treated with ethylene scavenger (4.89 and 5.46 mg/100g), moisture scavenger (4.87 and 5.15 mg/100g), O2 scavenger (4.67 and 5.00 mg/100g), CO2 scavenger (4.37 and 4.95 mg/100g) and minimum (3.71 and 4.39 mg/100g) was observed in control samples at RT and AT on 50th and 21st day of storage respectively. AP significantly (p<0.05) retained the ascorbic acid content at RT and AT with the advancement of storage.
Fig. 6.5(a): Effect of active packaging on ascorbic acid (mg/100g) of apple at RT
Fig. 6.5(b): Effect of active packaging on ascorbic acid (mg/100g) of apple at AT
Figs. 6.5(c,d) and Table 6.14 depict the observations regarding the changes in ascorbic acid in banana at refrigeration and ambient temperature showed highest retention (7.0 and 6.0 mg/100g) of ascorbic acid content for chitosan coated samples followed by samples treated with ethylene scavenger (6.73 and 5.97 mg/100g), moisture scavenger (6.77 and 5.73 mg/100g), O2 scavenger (6.53 and 5.63 mg/100g), CO2 scavenger (6.07 and 5.47
107
mg/100g) and minimum (5.83 and 4.17 mg/100g) was observed in control samples at RT and AT on 15th and 9th day of storage respectively. AP significantly (p<0.05) reduce the decrease in ascorbic acid at RT and AT with the advancement of storage.
Fig. 6.5(c): Effect of active packaging on ascorbic acid (mg/100g) of banana at RT
Fig. 6.5(d): Effect of active packaging on ascorbic acid (mg/100g) of banana at AT
Figs. 6.5(e,f) and Table 6.15 express the observations regarding the changes in ascorbic acid in orange at refrigeration and ambient temperature showed maximum retention (23.28 and 21.69 mg/100g) of ascorbic acid content in the samples coated with chitosan followed by samples treated with ethylene scavenger (23.14 and 20.79 mg/100g), moisture scavenger (21.65 and 20.65 mg/100g), O2 scavenger (21.53 and 19.88 mg/100g), CO2 scavenger (21.14 and 19.31 mg/100g), and minimum (19.89 and 19.55 mg/100g) was observed in control samples at RT and AT on 25th and 15th day of storage respectively. AP significantly (p<0.05) maintained the ascorbic acid content during storage.
Fig. 6.5(e): Effect of active packaging on ascorbic acid (mg/100g) of orange at RT
Fig. 6.5(f): Effect of active packaging on ascorbic acid (mg/100g) of orange at AT
108
A gradual reduction in ascorbic acid was observed in all treatments under active packaging for the entire fruit samples and minimum was observed in control fruit samples at RT and AT, however the magnitude was low at RT. The results obtained in the present investigation are in accordance with the previously reported results of Ishaq et al. (2009) who investigated the physico-chemical characteristics of apricot fruit at 28 to 30ºC and 60-63% RH and observed the decreasing trend of ascorbic acid with passage of time, might be due to the conversion of dehydroascorbic acid to diketogluconic acid by oxidation. These results are in close conformity with the findings of Mahajan et al. (2011) who also observed the identical decreasing trend in ascorbic acid content wth the advancement of storage of guava fruits treated with calcium chloride and gibbrellic acid.
However, among AP treatments maximum retention of ascorbic acid was observed in fruits coated with chitosan and treated with ethylene scavenger followed by moisture, O2 and CO2 scavengers on the final day of storage under both the storage temperatures. The reason for high ascorbic acid content in chitosan coated fruits can be attributed to slow ripening rate of treated fruits. Coatings prevent transfer of gases between the fruit and atmosphere and served as a protective layer that control the permeability of O2 and CO2 (Srinivasa et al., 2002) and therefore, prevent the oxidation of vitamin C by hindering the fruit’s exposure to oxygen, altering enzymatic activity and slowing the respiration process. The results congregates with the findings of Jiang et al. (2004) who narrated that ascorbic acid content decreased when litchi fruit was coated with chitosan at low temperature 2°C.
6.2.1.6 Pectin
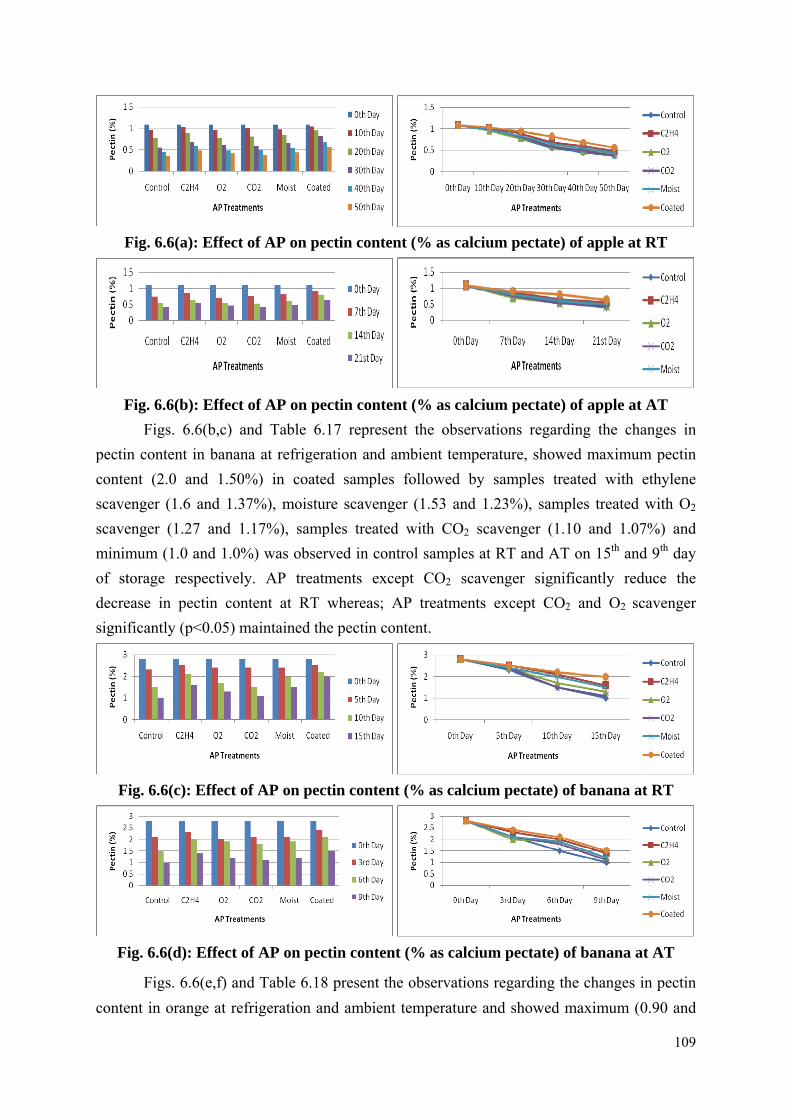
Pectin content (calcium pectate %) was determined in fruits. Apple, banana and orange are good source of pectin and the observations regarding the changes in pectin content of different fruits are presented in Figs. 6.6 (a and b) for apple, 6.6 (c and d) for banana and 6.6 (e and f) for orange at RT and AT respectively. Data presented in Table 6.16, 6.17 and 6.18 given in appendices, indicate that the initial pectin content was found to be (1.09%), (2.80%) and (2.12%) in apple, banana and orange, respectively.
Figs. 6.6(a,b) and Table 6.16 present the observations regarding the changes in pectin content in apple at refrigeration and ambient temperature and highest (0.56 and 0.64%) pectin content was recorded in coated apple fruit followed by samples treated with ethylene scavenger (0.48 and 0.55%), moisture scavenger (0.45 and 0.50%), O2 scavenger (0.42 and 0.45%), samples treated with CO2 scavenger (0.38 and 0.42%) and lowest (0.37 and 0.41%) was observed in control samples at RT and AT on 50th and 21st day of storage respectively. AP treatments except O2 and CO2 scavengers significantly (p<0.05) maintained the pectin content at RT and AT during storage.
109
Fig. 6.6(a): Effect of AP on pectin content (% as calcium pectate) of apple at RT
Fig. 6.6(b): Effect of AP on pectin content (% as calcium pectate) of apple at AT
Figs. 6.6(b,c) and Table 6.17 represent the observations regarding the changes in pectin content in banana at refrigeration and ambient temperature, showed maximum pectin content (2.0 and 1.50%) in coated samples followed by samples treated with ethylene scavenger (1.6 and 1.37%), moisture scavenger (1.53 and 1.23%), samples treated with O2
scavenger (1.27 and 1.17%), samples treated with CO2 scavenger (1.10 and 1.07%) and minimum (1.0 and 1.0%) was observed in control samples at RT and AT on 15th and 9th day of storage respectively. AP treatments except CO2 scavenger significantly reduce the decrease in pectin content at RT whereas; AP treatments except CO2 and O2 scavenger significantly (p<0.05) maintained the pectin content.
Fig. 6.6(c): Effect of AP on pectin content (% as calcium pectate) of banana at RT
Fig. 6.6(d): Effect of AP on pectin content (% as calcium pectate) of banana at AT
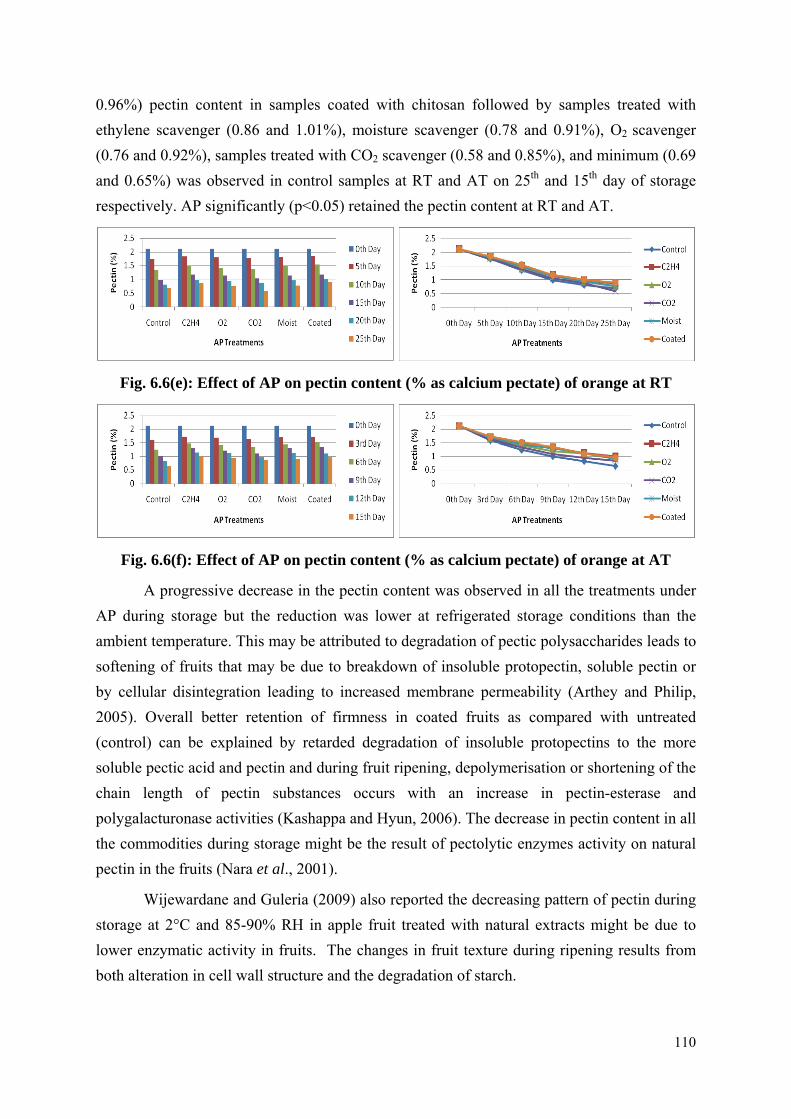
Figs. 6.6(e,f) and Table 6.18 present the observations regarding the changes in pectin content in orange at refrigeration and ambient temperature and showed maximum (0.90 and
110
0.96%) pectin content in samples coated with chitosan followed by samples treated with ethylene scavenger (0.86 and 1.01%), moisture scavenger (0.78 and 0.91%), O2 scavenger (0.76 and 0.92%), samples treated with CO2 scavenger (0.58 and 0.85%), and minimum (0.69 and 0.65%) was observed in control samples at RT and AT on 25th and 15th day of storage respectively. AP significantly (p<0.05) retained the pectin content at RT and AT.
Fig. 6.6(e): Effect of AP on pectin content (% as calcium pectate) of orange at RT
Fig. 6.6(f): Effect of AP on pectin content (% as calcium pectate) of orange at AT
A progressive decrease in the pectin content was observed in all the treatments under AP during storage but the reduction was lower at refrigerated storage conditions than the ambient temperature. This may be attributed to degradation of pectic polysaccharides leads to softening of fruits that may be due to breakdown of insoluble protopectin, soluble pectin or by cellular disintegration leading to increased membrane permeability (Arthey and Philip, 2005). Overall better retention of firmness in coated fruits as compared with untreated (control) can be explained by retarded degradation of insoluble protopectins to the more soluble pectic acid and pectin and during fruit ripening, depolymerisation or shortening of the chain length of pectin substances occurs with an increase in pectin-esterase and polygalacturonase activities (Kashappa and Hyun, 2006). The decrease in pectin content in all the commodities during storage might be the result of pectolytic enzymes activity on natural pectin in the fruits (Nara et al., 2001).
Wijewardane and Guleria (2009) also reported the decreasing pattern of pectin during storage at 2°C and 85-90% RH in apple fruit treated with natural extracts might be due to lower enzymatic activity in fruits. The changes in fruit texture during ripening results from both alteration in cell wall structure and the degradation of starch.
111
6.2.1.7 Total sugars
The observations regarding the effect of active packaging on total sugar content (%) for the fruits (apple, banana and orange) at RT and AT under AP technology during storage and are presented in Figs. 6.7 (a and b) for apple, 6.7 (c and d) for banana and 6.7 (e and f) for orange at RT and AT respectively. Data presented in Table 6.19, 6.20 and 6.21 as given in appendices, showed initial total sugar content of 9.97% for apple, 20.00% for banana and 8.22% for orange.
Figs. 6.7(a,b) and Table 6.19 present the observations regarding the changes in total sugar content in apple at refrigeration and ambient temperature and it was found maximum (15.13 and 14.0%) in control samples followed by samples treated with CO2 scavenger (13.82 and 13.90%), O2 scavenger (13.75 and 13.84%), moisture scavenger (13.54 and 13.66%), ethylene scavenger (13.44 and 13.30%) and minimum (13.08 and 13.14%) was observed in chitosan coated samples at RT and AT on 50th and 21st day of storage respectively. AP treatments significantly (p<0.05) reduce the increase in total sugar content at RT and AT.
Fig. 6.7(a): Effect of active packaging on total sugars (%) of apple at RT
Fig. 6.7(b): Effect of active packaging on total sugars (%) of apple at AT
Figs. 6.7(c,d) and Table 6.20 present the observations regarding the changes in total sugar content in banana at refrigeration and ambient temperature, highest (21.50 and 22.0%) total sugar content was observed in control samples followed by samples treated with CO2 scavenger (21.43 and 21.17%), O2 scavenger (21.37 and 21.20%), moisture scavenger (21.03 and 21.03%), ethylene scavenger (20.83 and 20.80%) and lowest (20.50 and 20.27%) was observed in chitosan coated samples at RT and AT on 15th and 9th day of storage respectively. AP treatments significantly (p<0.05) reduce the increase in total sugar content at RT whereas; AP treatments except CO2 and O2 significantly reduce the increase in total sugar content at AT.
112
Fig. 6.7(c): Effect of active packaging on total sugars (%) of banana at RT
Fig. 6.7(d): Effect of active packaging on total sugars (%) of banana at AT
Figs. 6.7(e,f) and Table 6.21 present the observations regarding the changes in total sugar content in orange at refrigeration and ambient temperature exhibited maximum (11 and 11.23%) in control samples followed by samples treated with CO2 scavenger (10.27 and 10.67%), O2 scavenger (10.15 and 10.57%), moisture scavenger (10.10 and 10.47%), ethylene scavenger (10.01 and 10.40%) and minimum (9.75 and 10.33%) was observed in chitosan coated samples at RT and AT on 25th and 15th day of storage respectively. AP treatments significantly (p<0.05) reduce the increase in total sugar content at RT and AT.
Fig.6.7 (e) Effect of active packaging on total sugars (%) of orange at RT
Fig. 6.7(f): Effect of active packaging on total sugars (%) of orange at AT
The data revealed that the storage had significant effect on total sugar content of the whole fruit commodities and the breakdown of polysaccharides into water soluble sugar may
113
be the reason for an increase in the total sugar content. Significant difference was observed among the treatments with respect to the total sugars content of whole fruits, the maximum total sugar content was observed in control samples of fruits followed by commodities treated with CO2, O2, moisture and ethylene scavenger. Minimum increase in total sugar content was observed in fruits and vegetables treated with chitosan based coating on the final day of storage at both the storage temperatures. So, the AP treatments were found to cause lowering of total sugar content than control samples.
Our findings are in accordance with Kittur et al. (2001) who investigated the reducing sugar content of banana and mango fruit coated with polysaccharides (including chitosan) and stored at 27°C and observed a lower concentration of reducing sugars in coated fruit than in control samples after 15 days of storage may be due to inhibited activity of enzymes which leads to decomposition of starch. Srinivasa et al. (2002) studied the effect of chitosan coated mango fruit and stated that chitosan coating delays the increase in reducing sugar.
Tanda-Palmu and Grosso (2005) investigated the bio-chemical changes during storage of strawberry fruit coated with gluten film and found that fruit coating slows down the over ripening process which is responsible for increasing the level of reducing sugars in fruit. Mustaffa et al. (2005) tried the preparation of KMnO4 based ethylene absorbent with different carrier materials, observed their effects on quality parameters of ‘Rasthali’ banana packed in 400 gauge polybag along with ethylene absorbent, stored under zero energy cool chamber (24±2°C and 90-95% RH) and they concluded that fruits stored with coir pith as ethylene absorbent recorded a slow increase in total sugar content thus extended the shelf-life of ‘Rasthali’ banana upto 22 days by absorbing the ethylene gas released during the ripening and storage period.
6.2.1.8 Tannins and Total phenols
The observations regarding the effect of active packaging on tannin content (mg/100g) was observed in apple and banana whereas; the total phenolic content (mg/100g) was observed in orange fruit as citrus are good source of phenols and not containing tannin content and their observations are presented in Fig.6.8 (a and b) for apple, 6.8 (c and d) for banana and Figs. 6.8 (e and f) for orange at RT and AT respectively. Data regarding tannins for apple and banana, present in Table 6.22 and 6.23 whereas, Table 6.24 represents the results of phenols in orange fruit as given in appendices. It was observed that the initial tannin content for apple (7.12 mg/100g), banana (2.93 mg/100g) and (118.83 mg/100g) total phenolic content for orange. A gradual decrease in these parameters was observed with increasing period of storage at both storage conditions at RT and AT however, the magnitude was low at RT.
114
Figs. 6.8(a,b) and Table 6.22 present the observations regarding the changes in tannins in apple at AT and RT and maximum (5.53 and 5.52 mg/100g) tannin content was recorded in response to chitosan coated samples followed by samples treated with ethylene scavenger (5.66 and 5.21 mg/100g), moisture scavenger (5.57 and 5.10 mg/100g), O2 scavenger (5.33 and 5.07 mg/100g), samples treated with CO2 scavenger (5.30 and 4.88 mg/100g) and minimum (4.0 and 5.12 mg/100g) was observed in control samples at RT and AT on 50th and 21st day of storage respectively. AP treatments significantly (p<0.05) reduce the increase in tannin content at RT and AT.
Fig. 6.8(a): Effect of active packaging on tannins (mg/100g) of apple at RT
Fig. 6.8(b): Effect of active packaging on tannins (mg/100g) of apple at AT
Figs. 6.8(c,d) and Table 6.23 present the observations regarding the changes in tannin content in banana at RT and AT. Chitosan coated samples exhibited maximum (1.55 and 1.46 mg/100g) tannin content followed by samples treated with ethylene scavenger (1.49 and 1.39 mg/100g), moisture scavenger (1.37 and 1.29 mg/100g), O2 scavenger (1.30 and 1.29 mg/100g), samples treated with CO2 scavenger (1.23 and 1.23 mg/100g) and control samples retained minimum (1.15 and 1.12 mg/100g) at RT and AT on 15th and 9th day of storage respectively. AP treatments except CO2 scavenger at RT and CO2 scavenger and O2 scavenger at AT significantly reduce the decrease in tannin content.
Fig. 6.8(c): Effect of active packaging on tannins of banana at RT
115
Fig. 6.8(d): Effect of active packaging on tannins (mg/100g) of banana at AT
Figs. 6.8(e,f) and Table 6.24 represent the observations regarding the changes in total phenolic content in orange at refrigeration and ambient temperature and possessed highest (77.42 and 78.45 mg/100g) phenolic content in chitosan coated samples followed by samples treated with ethylene scavenger (76.5 and 77.25 mg/100g), moisture scavenger (76.11 and 76.04 mg/100g), O2 scavenger (75.21 and 74.97 mg/100g), samples treated with CO2 scavenger (74.02 and 73.86 mg/100g) and lowest (72.54 and 67.43 mg/100g) was observed in control samples at RT and AT on 25th and 15th day of storage respectively. AP treatments significantly (p<0.05) reduce the decrease in total phenolic content at RT and AT.
Fig. 6.8(e): Effect of active packaging on total phenols (mg/100g) of orange at RT
Fig. 6.8(f): Effect of active packaging on total phenols (mg/100g) of orange at AT
Among the AP treatments, chitosan coated samples retained the maximum tannin/phenolic content followed by the samples treated with ethylene, moisture, O2 and CO2 scavengers whereas, the control commodities showed minimum amount on the final day of storage at RT and AT. However, the magnitude of decrease in tannin/phenols was slower at low temperature. Slower decrease in tannins at low temperature might be due to low rate of physiological processes. Application of active packaging techniques on fruits and vegetables reduced the decrease in tannin/phenolic content during storage. All the treatments and their
116
interactions were observed to produce a significant effect on the phenolic content of the samples. Decrease in this polyphenolic content could be related to ripening during storage. During ripening, there was increased activity of PPO, the enzyme responsible for oxidation of tannins and phenols and this increased activity may be responsible for the decreased tannin and phenolic content during storage. Our results are in close conformity with Ghasemnezhad et al. (2010) who studied the effectiveness of chitosan coatings on the quality changes of apricot, at 0ºC temperature and 80±2% relative humidity for 25 days and found that chitosan coated fruits contained significantly higher total phenolics content than control samples, they observed that the content first increased and then decreased at the end of storage, the decreasing of phenolic compounds at the end of storage might be due to breakdown of cell structure in order to senescence phenomena during storage.
Similar, lower decrease in tannin content as compared to control fruits in 150 gauge LDPE film shrink wrapped bell pepper and mangoes in stored at 27°C and 65% RH has been reported by Sahoo and Matche (2006). The decrease of total phenolic concentration and the increase of PPO activity during cold storage of whole banana were correlated with the development of chilling injury (CI) and with the temperature of storage (Nguyen et al., 2003). Qudsieh et al. (2002) studied the effect of sugarcane maturation and significant decrease in tannin content was observed during maturity.
6.2.1.9 Texture and Firmness
Texture and firmness for fruits were analyzed with texture analyzer using cutting blade probe and needle probe, respectively. The observations regarding the effect of AP on texture (Shear force) of fruits are shown in Figs.6.9 (a and b) for apple, 6.9 (c and d) for banana and 6.9 (e and f) for orange whereas; the observations regarding firmness are shown in Fig.6.9 (g and h) for apple, 6.9 (i and j) for banana and 6.9 (k and l) for orange at RT and AT respectively. The perusal of data regarding changes in texture and firmness for whole fruits are presented in Tables 6.25, 6.26 and 6.27 as given in appendices. The initial texture and firmness value was observed to be highest (1980.80 and 146.7 g) for apple, (520.27 and 35.93 g) for banana and (1946.33 and 54.70 g) for orange respectively.
Figs. 6.9(a,b) and Table 6.25 present the observations regarding the changes in texture in apple at refrigeration and ambient temperature and highest (4983.16 and 4884.16 g) texture value was recorded in chitosan coated samples followed by samples treated with ethylene scavenger (4086.40 and 4250.50 g), moisture scavenger (4283.86 and 4245.63 g), O2 scavenger (3897.13 and 3914.33 g), CO2 scavenger (3742.43 and 3395.23 g) and lowest (3126.56 and 2796.06 g) was observed in control samples at RT and AT on 50th and 21st day of storage respectively. AP significantly (p<0.05) maintained the texture at RT and AT.
117
Fig. 6.9(a): Effect of active packaging on texture (shear force) of apple at RT
Fig. 6.9(b): Effect of active packaging on texture (shear force) of apple at AT
Figs. 6.9(c,d) and Table 6.26 represent the observations regarding the changes in texture in banana at refrigeration and ambient temperature. Highest texture value (1433.80 and 1237.76 g) was found in chitosan coated fruit samples followed by samples treated with ethylene scavenger (1217.46 and 1192.63 g), moisture scavenger (1139.50 and 1133.30 g), O2 scavenger (1023.70 and 1130.60), samples treated with CO2 scavenger (920.86 and 1029.80 g) and the lowest value (678.96 and 902.60 g) was recorded in control samples at RT and AT on 15th and 9th day of storage respectively. AP treatments at RT whereas; AP treatments except CO2 scavenger significantly (p<0.05) maintained the texture and firmness at AT.
Fig. 6.9(c): Effect of active packaging on texture (shear force) of banana at RT
Fig. 6.9(d): Effect of active packaging on texture (Shear force) of banana at AT
118
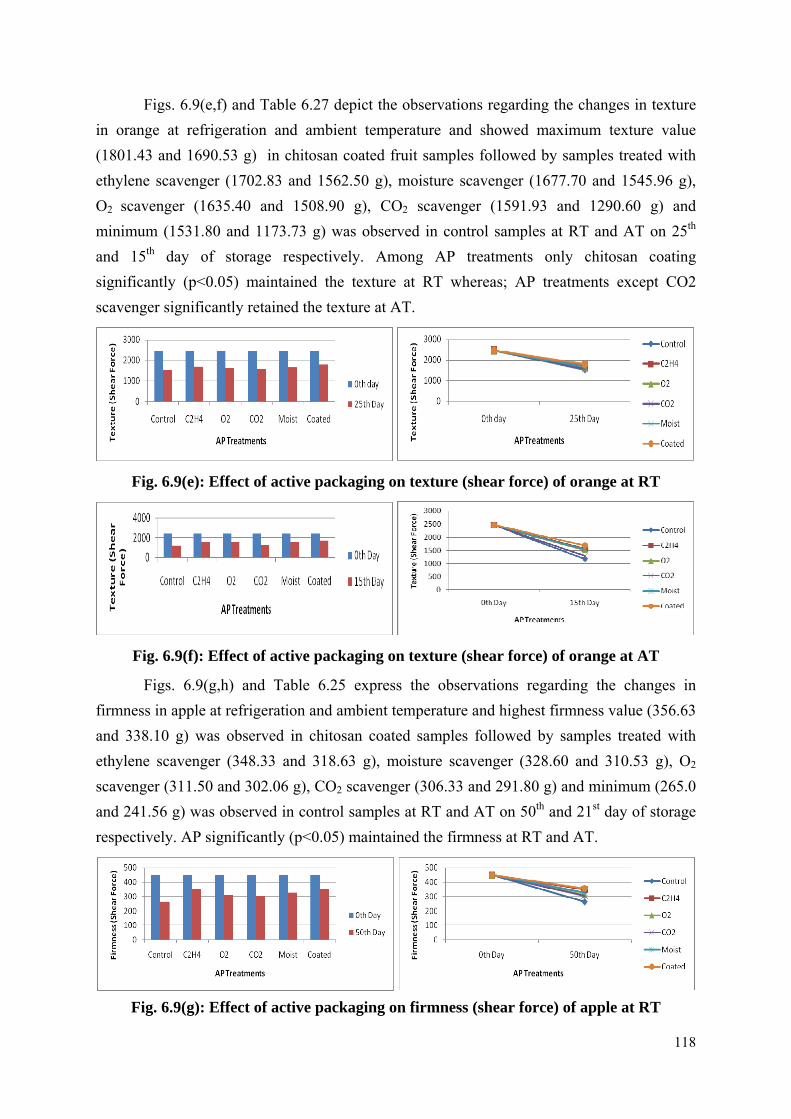
Figs. 6.9(e,f) and Table 6.27 depict the observations regarding the changes in texture in orange at refrigeration and ambient temperature and showed maximum texture value (1801.43 and 1690.53 g) in chitosan coated fruit samples followed by samples treated with ethylene scavenger (1702.83 and 1562.50 g), moisture scavenger (1677.70 and 1545.96 g), O2 scavenger (1635.40 and 1508.90 g), CO2 scavenger (1591.93 and 1290.60 g) and minimum (1531.80 and 1173.73 g) was observed in control samples at RT and AT on 25th and 15th day of storage respectively. Among AP treatments only chitosan coating significantly (p<0.05) maintained the texture at RT whereas; AP treatments except CO2 scavenger significantly retained the texture at AT.
Fig. 6.9(e): Effect of active packaging on texture (shear force) of orange at RT
Fig. 6.9(f): Effect of active packaging on texture (shear force) of orange at AT
Figs. 6.9(g,h) and Table 6.25 express the observations regarding the changes in firmness in apple at refrigeration and ambient temperature and highest firmness value (356.63 and 338.10 g) was observed in chitosan coated samples followed by samples treated with ethylene scavenger (348.33 and 318.63 g), moisture scavenger (328.60 and 310.53 g), O2 scavenger (311.50 and 302.06 g), CO2 scavenger (306.33 and 291.80 g) and minimum (265.0 and 241.56 g) was observed in control samples at RT and AT on 50th and 21st day of storage respectively. AP significantly (p<0.05) maintained the firmness at RT and AT.
Fig. 6.9(g): Effect of active packaging on firmness (shear force) of apple at RT
119
Fig. 6.9(h): Effect of active packaging on firmness (shear force) of apple at AT
Figs. 6.9(i,j) and Table 6.26 present the observations regarding the changes in firmness in apple at refrigeration and ambient temperature and showed maximum firmness value (253.43 and 244.13 g) in chitosan coated samples followed by samples treated with ethylene scavenger (215.83 and 211.16 g), moisture scavenger (204.73 and 196.33 g), O2
scavenger (206.66 and 186.83 g), CO2 scavenger (176.00 and 152.70 g) and minimum (124.60 and 108.36 g) was reported in control samples at RT and AT on 15th and 9th day of storage respectively. AP significantly (p<0.05) maintained the firmness at RT and AT.
Fig. 6.9(i): Effect of active packaging on firmness (shear force) of banana at RT
Fig. 6.9(j): Effect of active packaging on firmness (Shear force) of banana at AT
Figs. 6.9(k,l) and Table 6.27 represent the observations regarding the changes in firmness in orange at refrigeration and ambient temperature and possessed highest firmness value (271.66 and 254.30 g) in chitosan coated samples followed by samples treated with ethylene scavenger (262.93 and 248.80 g), moisture scavenger (258.86 and 246.70 g), O2
scavenger (256.26 and 243.33 g), samples treated with CO2 scavenger (250.76 and 230.96 g) and lowest (217.43 and 214.83 g) was observed in control samples at RT and AT on 25th and 15th day of storage respectively. AP significantly (p<0.05) maintained the firmness at RT whereas AP treatments except CO2 scavenger significantly maintained firmness at AT.
120
Fig. 6.9(k): Effect of active packaging on firmness (shear force) of orange at RT
Fig. 6.9(l): Effect of active packaging on firmness (shear force) of orange at AT
A gradual decline in texture and firmness was observed with advancement of storage and minimum retention was observed in control samples at both the storage temperatures. In the present investigation all the treatments significantly reduced the decrease in texture and firmness at RT and AT. At RT, reduced metabolic activities and reduced evapo-transpiration loss of water could be the reason of slower decrease in texture and firmness and the maximum retention of texture and firmness was maintained in all the chitosan coated fruits � ethylene scavenger � moisture scavenger � O2 scavenger � CO2 scavenger � control. The rate of decrease in texture and firmness of commodities during storage was primarily due to the loss of moisture from the surface causing the cells to lose turgidity and breakdown of pectin leading to the degradative changes in cell wall structure and composition. Similar decrease in flesh firmness has also been reported in banana stored under ambient, zero energy cool chamber and 13.1°C (in BOD) (Narayan et al., 2002). Rivera-Lopez et al. (2005) observed the higher the storage temperature, the higher the firmness loss in papaya. It is well known that texture loss is influenced by temperature and storage when enzymatic hydrolysis of cell wall components takes place (Beaulieu and Grony, 2002).
Furthermore, Mostofi and Toivonen (2006) reported that firmness significantly decreased by increasing storage period. These results are in accordance with Imsabai et al. (2002) who observed the similar decreasing trend in whole durian fruit firmness when riped at 27 and 34°C. Mahajan et al. (2011) observed the declining trend of fruit firmness during storage in guava fruits on application with calcium chloride and gibbrellic acid and demonstrated that calcium chloride treated fruits exhibited the higher firmness as compared to control, the maintainence of higher firmness as a consequence of calcium chloride may be due to the ability to prevent the physiological weight loss during storage and delay ethylene
121
production. Similar decreasing pattern in firmness was also noticed by Kingsly et al. (2004) and Kudachikar et al. (2007) in ber and banana fruits respectively.
6.2.1.10 Oxygen and Carbon dioxide
The headspace O2 and CO2 (%) levels in all the fruit packages were analyzed using gas analyzer and the observations regarding O2 concentration are presented in Figs.6.10 (a and b) for apple, 6.10 (c and d) for banana and 6.10 (e and f) for orange whereas; the observations regarding CO2 concentration are presented in Fig. 6.10 (g and h) for apple, 6.10 (i and j) for banana and 6.10 (k and l) for orange at RT and AT respectively. The initial concentration of O2 was 21% and CO2 was 0.03%. The data related to O2 concentration for apple, banana and orange are presented in Table 6.28, 6.29, 6.30 whereas, results regarding to CO2 concentration are presented in Table 6.31, 6.32 and 6.33 as given in appendices.
Figs. 6.10(a,b) and Table 6.28 show highest concentration of O2 (19.53 and 18.93%) in apple samples coated with chitosan followed by samples treated with ethylene scavenger (18.33 and 17.63%), moisture scavenger (16.67 and 16.07%), samples treated with O2 scavenger (16.87 and 15.93%), samples treated with CO2 scavenger (16.60 and 16.0%) and lowest (16.57 and 15.43%) was observed in control samples at RT and AT on 50th and 21st day of storage respectively. AP significantly (p<0.05) maintained the O2 concentration at RT and AT.
Fig. 6.10(a): Effect of active packaging on O2 (%) of apple at RT
Fig. 6.10(b): Effect of active packaging on O2 (%) of apple at AT
Figs. 6.10(c,d) and Table 6.29 exhibit maximum O2 concentration (12.20 and 7.37%) in chitosan coated banana samples followed by samples treated with ethylene scavenger (10.57 and 6.93%), moisture scavenger (9.23 and 4.60%), O2 scavenger (9.13 and 4.50%), CO2 scavenger (9.13 and 4.17%) and lowest (8.47 and 4.03%) was observed in control
122
samples at RT and AT on 15th and 9th day of storage respectively. AP treatments significantly (p<0.05) maintained the O2 concentration at RT whereas; AP treatments except CO2 and O2 scavengers significantly maintained the O2 concentration at AT.
Fig. 6.10(c): Effect of active packaging on O2 (%) of banana at RT
Fig. 6.10(d): Effect of active packaging on O2 (%) of banana at AT
Figs. 6.10(e,f) and Table 6.30 depict highest O2 concentration (18.8 and 18.07%) in response to chitosan coated orange samples followed by samples treated with ethylene scavenger (17.2 and 17.63%), moisture scavenger (16.57 and 15.7%), O2 scavenger (16.53 and 15.63%), CO2 scavenger (16.4 and 15.63%) and lowest (16.27 and 15.43%) was reported in control samples at RT and AT on 25th and 15th day of storage respectively.
Fig. 6.10(e): Effect of active packaging on O2 (%) of orange at RT
Fig. 6.10(f): Effect of active packaging on O2 (%) of orange at AT
123
Figs. 6.10(g,h) and Table 6.31, express lowest CO2 concentration (2.33 and 2.03%)
was recorded in apple samples treated with CO2 scavenger followed by chitosan coated
samples (2.60 and 2.13%), ethylene scavenger (2.70 and 2.27%), moisture scavenger (2.87
and 2.37%), O2 scavenger (2.97 and 2.47%) and highest (3.17 and 2.90%) was observed in
control samples at RT and AT on 50th and 21st day of storage respectively. AP except O2 and
moisture scavengers significantly (p<0.05) reduced the increase in CO2 concentration at RT
whereas; AP significantly reduce the increase in CO2 concentration at AT.
Fig. 6.10(g): Effect of active packaging on CO2 (%) of apple at RT
Fig. 6.10(h): Effect of active packaging on CO2 (%) of apple at AT
Figs. 6.10(i,j) and Table 6.32 show lowest CO2 concentration (2.43 and 3.07%) in
banana samples treated with CO2 scavenger followed by chitosan coated samples (2.90 and
3.87%), ethylene scavenger (5.40 and 5.80%), moisture scavenger (5.77 and 6.05%), O2
scavenger (6.07 and 6.78%) and highest (9.7 and 12.97%) was observed in control samples at
RT and AT on 15th and 9th day of storage respectively. AP significantly (p<0.05) reduce the
increase in CO2 concentration at RT and AT.
Fig. 6.10(i): Effect of active packaging on CO2 (%) of banana at RT
124
Fig. 6.10(j): Effect of active packaging on CO2 (%) of banana at AT
Figs. 6.10(k,l) and Table 6.33 exhibit minimum CO2 concentration (1.00 and 1.27%)
in orange samples treated with CO2 scavenger followed by samples coated with chitosan
(1.23 and 1.33%), ethylene scavenger (1.30 and 1.53%), moisture scavenger (1.57 and
1.67%), O2 scavenger (1.77 and 1.77%) and highest (2.13 and 2.33%) was observed in
control samples at RT and AT on 25th and 15th day of storage respectively. AP significantly
(p<0.05) reduce the increase in CO2 concentration at RT and AT.
Fig. 6.10(k): Effect of active packaging on CO2 (%) of orange at RT
Fig. 6.10(l): Effect of active packaging on CO2 (%) of orange at AT
In general, level of O2 and CO2 showed a gradual decrease and increase respectively.
Control samples produced maximum CO2 concentration when measured as CO2 (%) in the
headspace during storage. From the results it can be concluded that control samples had
highest CO2 concentration than the samples treated with AP treatments. All the AP treatments
especially chitosan coated samples followed by ethylene and moisture scavengers delay
ripening by the modification of gases and thereby significantly reduce (p < 0.05) the rate of
respiration at both the storage temperatures. However, the magnitude was low at RT (low
temperature).
125
Our results are in accordance with Jiang and Li (2001) who studied the effect of chitosan coating on fruits and concluded that chitosan coating may form a protective barrier on the fruit surface which reduces the availability of O2, and delays ripening in fruits. Furthermore, chitosan coating can also reduce the internal O2 concentration in treated fruits and so produce low CO2 and ethylene concentration. Further, Baez-Sanudo et al. (2008) evaluated the effects of 1-methyl cyclopropene and chitosan based edible coating on banana fruits during storage of 8 days at 22°C, 85% RH and found that treated fruits showed a lower rate of respiration than control fruits.
6.2.1.11 Ethylene
The observations regarding the effect of AP treatments on ethylene concentration of climacteric fruits (apple and banana) are presented in Figs. 6.11 (a and b) for apple and 6.11 (c and d) for banana at RT and AT and the related results are summarized in Table 6.34 and 6.35 as given in appendices.
Figs. 6.11(a,b) and Table 6.34 exhibit the observations regarding changes in ethylene concentration. At 0 day initial ethylene concentration (63.23 µl C2H4/kg/h) was recorded for apple. Among AP treatments chitosan coated samples possess minimum concentration (30.11 and 50.19 µl C2H4/kg/h) followed by samples treated with ethylene scavenger (31.02 and 51.15 µl C2H4/kg/h), moisture scavenger (43.17 and 58.19 µl C2H4/kg/h), O2 scavenger (43.80 and 58.93 µl C2H4/kg/h), CO2 scavenger (46.57 and 58.78 µl C2H4/kg/h) and maximum (43.22 and 62.49 µl C2H4/kg/h) was observed in control samples at RT and AT on 50th and 21st day of storage, respectively. AP significantly (p<0.05) reduce the increase in ethylene concentration at RT and AT.
Fig. 6.11(a): Effect of active packaging on ethylene (µl C2H4/kg/h) of apple at RT
Fig. 6.11(b): Effect of active packaging on ethylene (µl C2H4/kg/h) of apple at AT
126
Figs. 6.11(c,d) and Table 6.35 present the observations regarding changes in ethylene
concentration in banana fruit. At 0 day initial ethylene concentration (57.5 µl C2H4/kg/h) was
reported. Chitosan coated samples exhibited minimum ethylene concentration (22.91 and
36.77 µl C2H4/kg/h) followed by samples treated with ethylene scavenger (25.53 and 37.85 µl
C2H4/kg/h), moisture scavenger (31.17 and 46.71 µl C2H4/kg/h), O2 scavenger (34.15 and
48.09 µl C2H4/kg/h), CO2 scavenger (35.91 and 46.25 µl C2H4/kg/h) and maximum
concentration (43.67 and 51.56 µl C2H4/kg/h) was observed in control samples at RT and AT
on 15th and 9th day of storage respectively. AP significantly (p<0.05) reduce the increase in
ethylene concentration at RT and AT.
Fig. 6.11(c): Effect of active packaging on ethylene (µl C2H4/kg/h) of banana at RT
Fig. 6.11(d): Effect of active packaging on ethylene (µl C2H4/kg/h) of banana at AT
The highest ethylene concentration was observed in control of all fruit samples and
the lowest was recorded in chitosan coated fruits followed by ethylene and moisture
scavenger. AP treatments can delay the ripening process in fruits by slowing down or
trapping the ethylene production. AP treatments had significantly (p<0.05) lower rates of
ethylene production than control samples during storage. Further, their interaction also
showed significant effect on ethylene production. Hu and Zou (1998) also reported the
similar observations in apple fruit coated with chitosan.
Ethylene advances the onset of an irreversible rise in respiration rate in climacteric
fruit and increases the ripening process. The effect of O2 and high CO2 levels on the
production of ethylene adds to the nature of the ethylene production or inhibition process.
Ethylene plays a significant role in the physiological and biochemical changes that occur with
127
the climacteric onset. Maximum delay in respiration rate as well as ethylene evolution was
found in all the commodities under AP treatments at both the storage conditions so, there was
delay in the climacteric rise of CO2 production in AP treated fruits. The ethylene production
rate was also lowered by the application of ethylene scavenger to fruits. Though the ethylene
evolution rate was lower in fruits and vegetables treated with ethylene scavenger at AT as
well as RT storage conditions yet under (RT) refrigerated storage the magnitude was low.
Wiley, (1994) also stated that low temperature also reduces induction of ethylene in fruits
during storage whereas, higher temperatures increase ethylene production and result in
advanced physiological and biochemical changes in fruit.
Jayaraman and Raju (1992) prepared three matrices (based on silica gel, alumina and
limestone and cement) impregnated with KMnO4, studied their effects on fresh fruits and
vegetables at 10°C and ambient storage and concluded that alumina-limestone based
formulation increased the overall extension of shelf-life from 3-8 days. Kudachikar et al.
(2007) found that banana packed with LDPE film in combination of ethylene adsorbent
stored under 13°C extended the shelf-life upto 42 days.
6.3 CONCLUSION
The results reveal that among AP treatments applied on whole fruits (apple, banana
and orange), chitosan based coating was most effective for all whole fruits in providing
improved storage life and quality of the fruits, followed by ethylene, moisture, O2 and CO2
scavenging treatments at refrigeration (5±1°C) and ambient temperature (30±2°C). At
refrigeration temperature chitosan coated banana samples showed best results and proved
better in reducing the softness and chilling injury whereas, other treatments were not found so
effective it possibly may be due to chitosan coating is acting as a barrier between the fruit
peel and the refrigerated condition due to which the chilling injury may be reduced in the
treated samples as compared to control. Chitosan coated fruits followed by samples treated
with ethylene, moisture, O2 and CO2 scavengers showed lower weight loss (%), retained
higher moisture content, TSS, total sugar contents and CO2 concentration and higher
retention of titratable acidity, ascorbic acid, pectin, tannins, total phenols, texture, firmness,