Page 1
EVALUATION OF PROBABILISTIC EARLY RESPONSE TCP (PERT) FOR
VIDEO DELIVERY AND EXTENSION WITH ACK COALESCING
A Thesis
by
BIN QIAN
Submitted to the Office of Graduate Studies ofTexas A&M University
in partial fulfillment of the requirements for the degree of
MASTER OF SCIENCE
August 2011
Major Subject: Computer Engineering
Page 2
EVALUATION OF PROBABILISTIC EARLY RESPONSE TCP (PERT) FOR
VIDEO DELIVERY AND EXTENSION WITH ACK COALESCING
A Thesis
by
BIN QIAN
Submitted to the Office of Graduate Studies ofTexas A&M University
in partial fulfillment of the requirements for the degree of
MASTER OF SCIENCE
Approved by:
Chair of Committee, A.L. Narasimha ReddyCommittee Members, Srinivas Shakkottai
Riccardo BettatiHead of Department, Costas N. Georghiades
August 2011
Major Subject: Computer Engineering
Page 3
iii
ABSTRACT
Evaluation of Probabilistic Early Response TCP (PERT) for Video Delivery and
Extension with ACK Coalescing. (August 2011)
Bin Qian, B.E., Zhejiang University, Hangzhou, China
Chair of Advisory Committee: Dr. A. L. Narasimha Reddy
This thesis demonstrates the performance of Probabilistic Early Response TCP (PERT),
a new TCP congestion control, for video streaming. As a delay based protocol, it
measures the delay at the end host and adjusts the congestion window accordingly.
Our experiments show that PERT improves video delivery performance by decreasing
the fraction of packets delivered late. Furthermore, our Linux live streaming test in-
dicates that PERT is able to reduce the playback glitches, when high resolution video
is delivered over a link with non-zero packet loss. In order to operate PERT at higher
thoughputs, we design PERT to work with Acknowledgement (ACK) coalescing at the
receiver. ACK coalescing makes data transfers burstier and makes it hard to estimate
delays accurately. We apply TCP pacing to fix this issue, and validate its effectiveness
in the aspects of throughput, packet loss and fairness. Our experiment results also
show that PERT with Delayed ACK and Pacing is more friendly, and therefore more
suitable when multiple traffic flows are competing for limited bottleneck bandwidth
or sharing the same router buffer.
Page 5
v
ACKNOWLEDGMENTS
I thank my research advisor, Dr. A. L. Narasimha Reddy, for giving me continuous
guidance, feedback and support. As my advisor and mentor, he not only helped me
with picking my research topic and ideas, but also made sure that I kept making
progress towards the goal. I especially thank him for all these; thank you very much,
Dr. Reddy. I thank Prajjawl, an earlier student of Dr. Reddy, for his initial assistance
in getting through the learning curve of NS2 simulation and providing many resources
that I can resort to when I had difficulties with experiments. I thank Zhiyuan Yin
for his timely help with building an experiment test bed and discussing experiments
results and potential reasons. The other students, Kiran Kotla, Kapil Garg, as well
as Ankit Singh, in my research group have been very helpful to me at times, and I
would like to express my gratitude to them. Finally, I thank my parents who have
unconditionally supported me during tough time and encouraged my enthusiasm for
learning and encouraged me to pursue a master of science degree. Last but not the
least, I thank Almighty God for giving me wisdom and strength to overcome my
limitations.
Page 6
vi
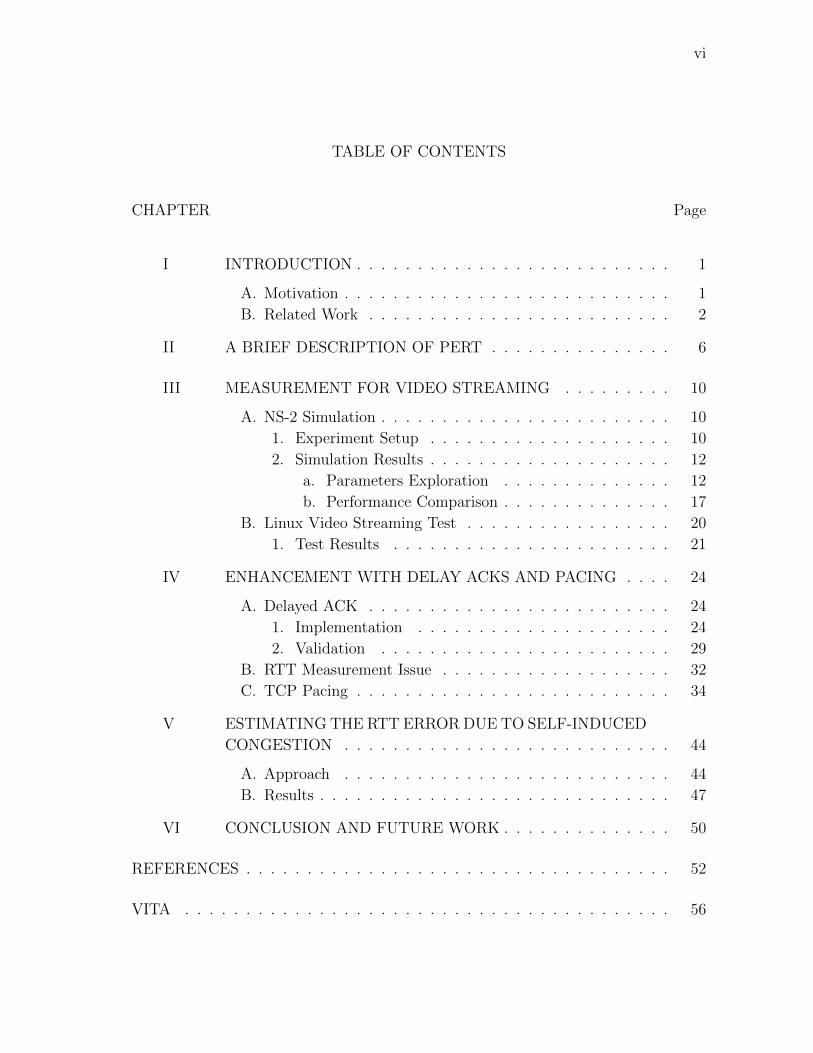
TABLE OF CONTENTS
CHAPTER Page
I INTRODUCTION . . . . . . . . . . . . . . . . . . . . . . . . . . 1
A. Motivation . . . . . . . . . . . . . . . . . . . . . . . . . . . 1
B. Related Work . . . . . . . . . . . . . . . . . . . . . . . . . 2
II A BRIEF DESCRIPTION OF PERT . . . . . . . . . . . . . . . 6
III MEASUREMENT FOR VIDEO STREAMING . . . . . . . . . 10
A. NS-2 Simulation . . . . . . . . . . . . . . . . . . . . . . . . 10
1. Experiment Setup . . . . . . . . . . . . . . . . . . . . 10
2. Simulation Results . . . . . . . . . . . . . . . . . . . . 12
a. Parameters Exploration . . . . . . . . . . . . . . 12
b. Performance Comparison . . . . . . . . . . . . . . 17
B. Linux Video Streaming Test . . . . . . . . . . . . . . . . . 20
1. Test Results . . . . . . . . . . . . . . . . . . . . . . . 21
IV ENHANCEMENT WITH DELAY ACKS AND PACING . . . . 24
A. Delayed ACK . . . . . . . . . . . . . . . . . . . . . . . . . 24
1. Implementation . . . . . . . . . . . . . . . . . . . . . 24
2. Validation . . . . . . . . . . . . . . . . . . . . . . . . 29
B. RTT Measurement Issue . . . . . . . . . . . . . . . . . . . 32
C. TCP Pacing . . . . . . . . . . . . . . . . . . . . . . . . . . 34
V ESTIMATING THE RTT ERROR DUE TO SELF-INDUCED
CONGESTION . . . . . . . . . . . . . . . . . . . . . . . . . . . 44
A. Approach . . . . . . . . . . . . . . . . . . . . . . . . . . . 44
B. Results . . . . . . . . . . . . . . . . . . . . . . . . . . . . . 47
VI CONCLUSION AND FUTURE WORK . . . . . . . . . . . . . . 50
REFERENCES . . . . . . . . . . . . . . . . . . . . . . . . . . . . . . . . . . . 52
VITA . . . . . . . . . . . . . . . . . . . . . . . . . . . . . . . . . . . . . . . . 56
Page 7
vii
LIST OF TABLES
TABLE Page
I NS-2 simulation experiment setup . . . . . . . . . . . . . . . . . . . . 11
II Video streaming performance comparison . . . . . . . . . . . . . . . 22
Page 8
viii
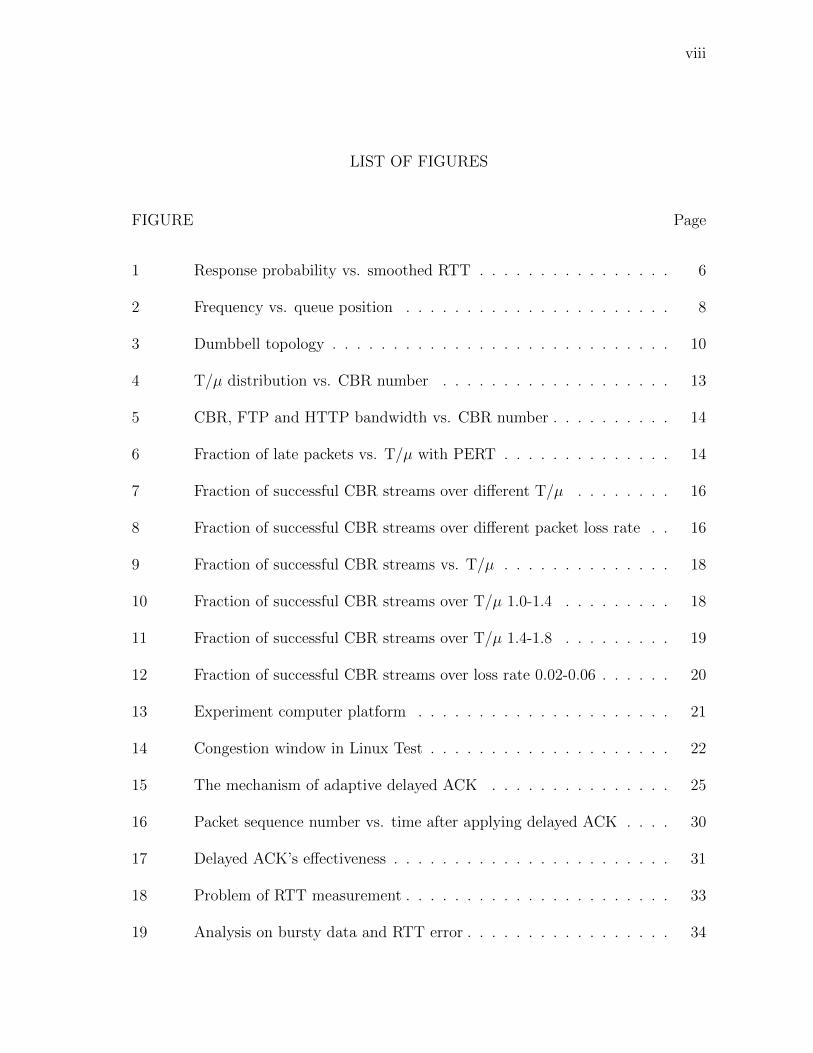
LIST OF FIGURES
FIGURE Page
1 Response probability vs. smoothed RTT . . . . . . . . . . . . . . . . 6
2 Frequency vs. queue position . . . . . . . . . . . . . . . . . . . . . . 8
3 Dumbbell topology . . . . . . . . . . . . . . . . . . . . . . . . . . . . 10
4 T/µ distribution vs. CBR number . . . . . . . . . . . . . . . . . . . 13
5 CBR, FTP and HTTP bandwidth vs. CBR number . . . . . . . . . . 14
6 Fraction of late packets vs. T/µ with PERT . . . . . . . . . . . . . . 14
7 Fraction of successful CBR streams over different T/µ . . . . . . . . 16
8 Fraction of successful CBR streams over different packet loss rate . . 16
9 Fraction of successful CBR streams vs. T/µ . . . . . . . . . . . . . . 18
10 Fraction of successful CBR streams over T/µ 1.0-1.4 . . . . . . . . . 18
11 Fraction of successful CBR streams over T/µ 1.4-1.8 . . . . . . . . . 19
12 Fraction of successful CBR streams over loss rate 0.02-0.06 . . . . . . 20
13 Experiment computer platform . . . . . . . . . . . . . . . . . . . . . 21
14 Congestion window in Linux Test . . . . . . . . . . . . . . . . . . . . 22
15 The mechanism of adaptive delayed ACK . . . . . . . . . . . . . . . 25
16 Packet sequence number vs. time after applying delayed ACK . . . . 30
17 Delayed ACK’s effectiveness . . . . . . . . . . . . . . . . . . . . . . . 31
18 Problem of RTT measurement . . . . . . . . . . . . . . . . . . . . . . 33
19 Analysis on bursty data and RTT error . . . . . . . . . . . . . . . . . 34
Page 9
ix
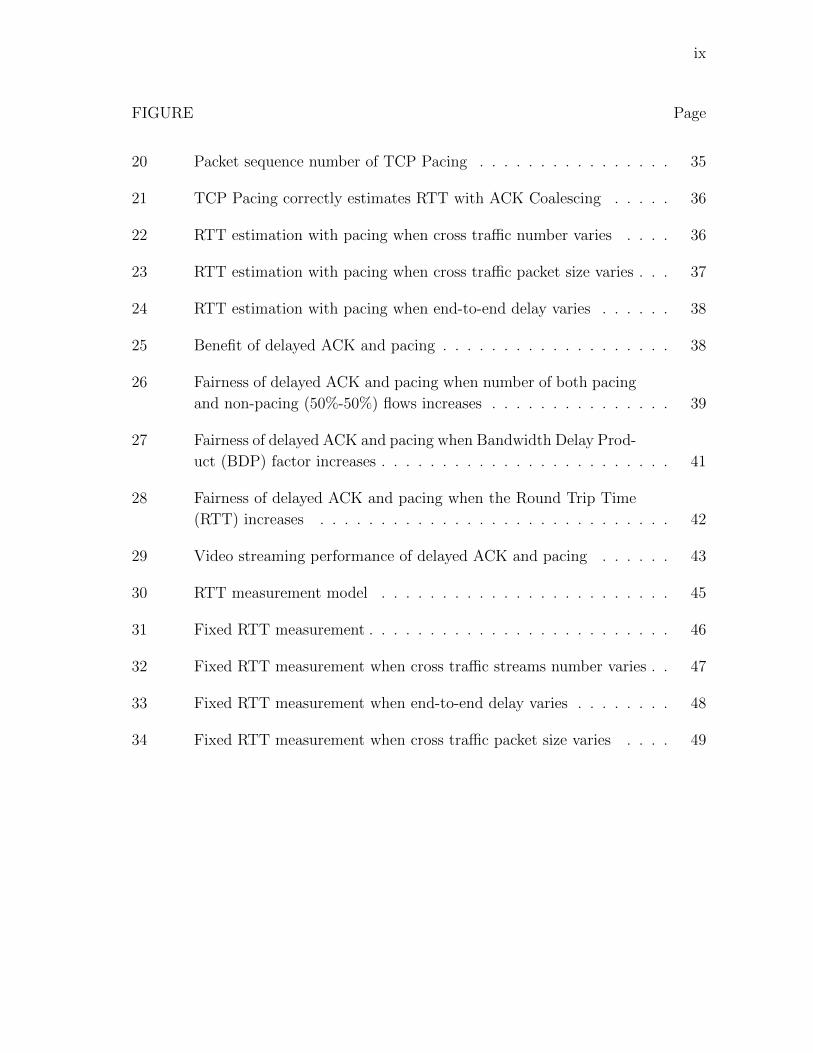
FIGURE Page
20 Packet sequence number of TCP Pacing . . . . . . . . . . . . . . . . 35
21 TCP Pacing correctly estimates RTT with ACK Coalescing . . . . . 36
22 RTT estimation with pacing when cross traffic number varies . . . . 36
23 RTT estimation with pacing when cross traffic packet size varies . . . 37
24 RTT estimation with pacing when end-to-end delay varies . . . . . . 38
25 Benefit of delayed ACK and pacing . . . . . . . . . . . . . . . . . . . 38
26 Fairness of delayed ACK and pacing when number of both pacing
and non-pacing (50%-50%) flows increases . . . . . . . . . . . . . . . 39
27 Fairness of delayed ACK and pacing when Bandwidth Delay Prod-
uct (BDP) factor increases . . . . . . . . . . . . . . . . . . . . . . . . 41
28 Fairness of delayed ACK and pacing when the Round Trip Time
(RTT) increases . . . . . . . . . . . . . . . . . . . . . . . . . . . . . 42
29 Video streaming performance of delayed ACK and pacing . . . . . . 43
30 RTT measurement model . . . . . . . . . . . . . . . . . . . . . . . . 45
31 Fixed RTT measurement . . . . . . . . . . . . . . . . . . . . . . . . . 46
32 Fixed RTT measurement when cross traffic streams number varies . . 47
33 Fixed RTT measurement when end-to-end delay varies . . . . . . . . 48
34 Fixed RTT measurement when cross traffic packet size varies . . . . 49
Page 10
1
CHAPTER I
INTRODUCTION
A. Motivation
Data transfers over Internet are increasingly dominated by video data transfers. Cisco
forecasts that video transfers will account for 60-90% of network traffic by 2014 [1].
Recent studies indicate that a large portion of Internet streaming media in current In-
ternet is delivered over HTTP/TCP. To achieve satisfactory quality of service (QOS),
video and audio data are supposed to be delivered before playback or buffered if they
arrive earlier. However, current TCP is not suitable for video streaming applications
due to its insistence on reliable transmission and inability of real-time data delivery.
Moreover, in today’s Internet, many other services like web surfing, FTP download,
as well as P2P file sharing are also competing for the limited bandwidth. This makes
it more difficult for TCP to meet the demands of smooth video streaming.
Nowadays, the demand for ubiquitous connectivity and cloud computing has led to
an interest in improving TCP for wireless or high-speed networks, both in terms of
commercial exploitation and with regard to research inquiry. Storing massive content
in the cloud and streaming to the clients becomes more and more popular today.
In the cloud system, the cluster of servers are connected to the high-speed Internet.
On the client end, users usually are using mobile devices like laptop or smart phone
The journal model is IEEE Transactions on Mobile Computing.
Page 11
2
via Wi-Fi or 3G networks. For example, recently Amazon.com Inc. has released
its cloud player and instant video to provide on-demand audio and video streaming
from their distributed cloud system to their users’ personal computers, netbooks and
smart phones via TCP connections. Such applications ask for high performance of
TCP over complex mixture of high-speed Internet and wireless 3G or Wi-Fi networks.
This increasing trend of mobile audio and video streaming services requires further
extension and enhancement of TCP to satisfy quality of service.
B. Related Work
Motivated by such demand on multimedia applications over the Internet, protocols for
video streaming have been explored by many researchers. TFRC (TCP Friendly Rate
Control) [2] and its variant [3] have been proposed to maintain long-term TCP fairness
while maintaining smooth transmission rates. In [4], Wang et al. analytically studied
the TCP performance for multimedia streaming. They built discrete-time Markov
models for both constrained and unconstrained streaming. Smaller than MSS-sized
packets have been used in CBR workloads to exploit the TCP ACK counting mech-
anism, and thereby reducing the TCP transport delay and its impact on congestion
window variations in [5]. In [6], the authors compared Linux implementations of
NEWRENO, H-TCP and CUBIC and found dynamic latency fluctuations induced
by each TCP variant. They noticed that CUBIC induces larger latency than the
other two when concurrent TCP flows take place. All of these studies explore the
possibility of employing TCP like congestion control even for real-time video delivery.
To improve the on-time data delivery and quality of service, especially in wireless
Page 12
3
networks, many studies focus on reducing the TCP transmission overhead by min-
imizing the number of produced ACKs for TCP without compromising reliability.
Unlike the TCP DATA packets, ACKs are considered as control traffic since they are
used only to confirm the reliable delivery. Therefore, it is desirable to minimize the
amount of ACKs traffic so as to make more bandwidth available for the actual data
delivery. The delayed ACKs mechanism is first proposed by the paper [7] and has
been enabled as a feature of TCP standard. The basic idea relies on the cumulative
nature of TCP ACKs. The TCP receiver set-up a timer for ACK (100-500 ms by
default [8]) upon receiving the data packet, and inject a single ACK into the pipe
when the timer times out. To avoid causing problems to TCP round trip-time (RTT)
estimation and ACK-clocking, the maximum timeout for a ACK is limited to no more
than a single data packet (usually 500ms), according to RFC [9]. The authors of [10]
proposed to enable delay ACKs by default based on its substantial benefit for TCP
throughput. It also reports the possibility of raising the TCP delay response so as
to reduce the competition of ACK for bottleneck bandwidth with DATA packets.
Later on, they implemented the delay ACK in TCP as a default feature, which en-
ables the receiver to wait for a short period of time instead of immediately replying
to each data packet [11]. In this case, if the subsequent packet arrives, then the
receiver sends ACK to verify both of them. Further, the authors of [12] introduced
the possibility of producing delayed ACK for more than two received data packets,
and confirmed with extensive experiments that an ACK for four data packets can
guarantee good performance when applying delayed ACK in general environments.
In wireless networks, the throughput enhancement effect [13] has been fully demon-
strated in static and dynamic topologies, with reactive [14] and proactive [15] TCP
hosts. But there are still some problems to be solved, before delayed ACK mecha-
nism can be widely deployed on the Internet. The main shortcoming is its impact on
Page 13
4
ACK clocking mechanism, which results in the burstiness in the transmission pattern
[16]. We refer this delayed ACK mechanism and its data burstiness defects as ACK
coalescing. To solve this burstiness problem, the paper [17] initially suggested using
pacing to reduce burstiness of TCP traffic caused by ACK compression. The basic
idea is to pace out the packets at the intervals of RTTcwnd
, so that less data packets
will be queued up in the router buffer and the self-induced delay will be reduced.
This is later on referred as TCP pacing in literature. Also, many researchers have
found that TCP’s congestion control mechanism can result in bursty traffic, with a
negative influence on network efficiency. According to [18], however authors found
TCP pacing is susceptible to synchronized packet losses and delays congestion signals.
They further proposed ways to eliminate this impact and validate its effectiveness.
Moreover, researchers [19] found that pacing helps to reduce the worst-flow latency
and improve the aggregate throughput, which are important for increasingly popular
type of distributed application platforms nowadays.
In this thesis, we explore the performance of a new TCP congestion control - PERT
and compare it with other TCP variants like RENO and CUBIC for real-time video
transmission. Here RENO is short for RENO-SACK. We study if the delay-based
PERT mechanism can provide better support for video delivery than RENO and
CUBIC. We study this problem through NS-2 based simulations and real live video
transmission tests on a testbed. Both our NS-2 simulation and Linux test results
show that PERT provides significant improvement on video viewing quality when
compared to RENO and CUBIC. Moreover, we made an extension of PERT, making
it work with delayed ACK and pacing, in order to achieve better performance. We
carefully implemented an adaptive delayed ACK mechanism and verified its benefits of
significantly reducing ACK traffic while improving the throughput. We identified that
Page 14
5
delayed ACK mechanisms can disrupt the delay estimation mechanism of PERT. To
be specific, the burst of data sent after the reception of an ACK results in self-induced
delay and as a result causes RTT to be incorrectly over-estimated. To overcome this
issue, we applied TCP pacing and verified its effectiveness. We further demonstrated
that pacing bring more fairness benefits and therefore makes delayed ACK more
practical. Finally, we perform video streaming tests for PERT with delayed ACK
and pacing. Our results indicated that the more friendly PERT tends to have higher
aggregate throughput and lower late packet rate when multiple flows are competing,
especially when the Bandwidth-Delay-Product (BDP) is small. This is to say, the
new extension makes PERT more useful in wider network settings.
Page 15
6
CHAPTER II
A BRIEF DESCRIPTION OF PERT
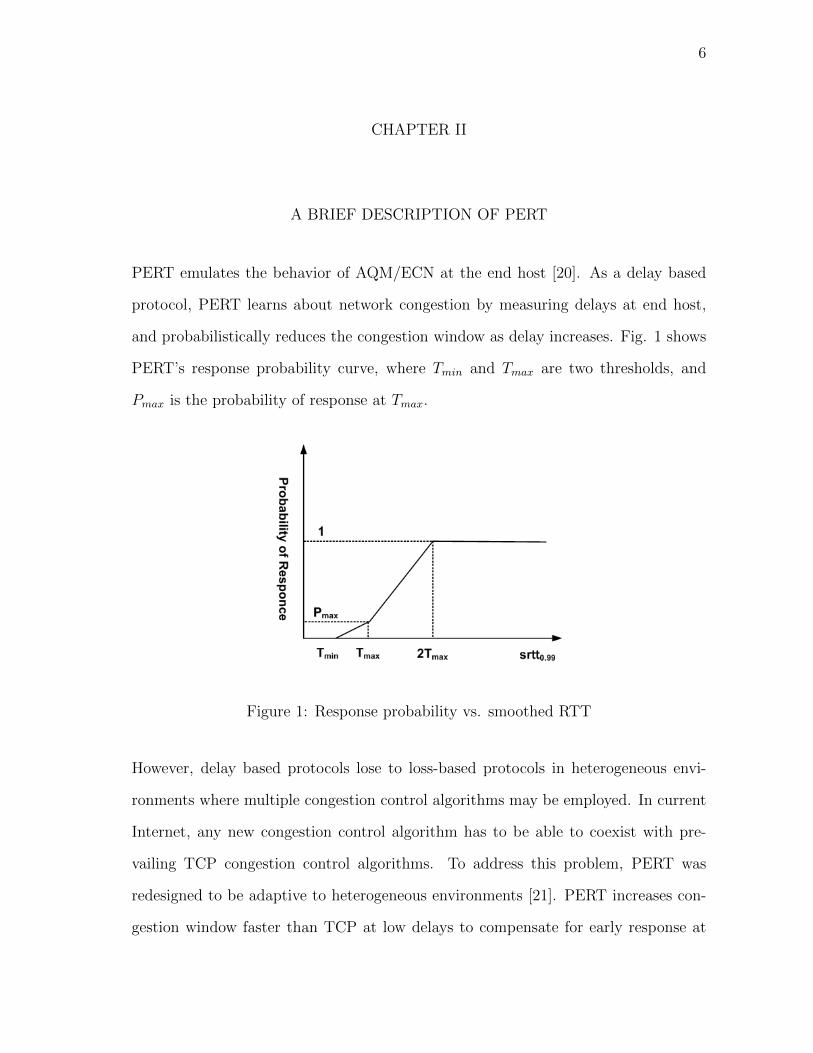
PERT emulates the behavior of AQM/ECN at the end host [20]. As a delay based
protocol, PERT learns about network congestion by measuring delays at end host,
and probabilistically reduces the congestion window as delay increases. Fig. 1 shows
PERT’s response probability curve, where Tmin and Tmax are two thresholds, and
Pmax is the probability of response at Tmax.
Figure 1: Response probability vs. smoothed RTT
However, delay based protocols lose to loss-based protocols in heterogeneous envi-
ronments where multiple congestion control algorithms may be employed. In current
Internet, any new congestion control algorithm has to be able to coexist with pre-
vailing TCP congestion control algorithms. To address this problem, PERT was
redesigned to be adaptive to heterogeneous environments [21]. PERT increases con-
gestion window faster than TCP at low delays to compensate for early response at
Page 16
7
higher delays, in order to equalize the bandwidth.
PERT basically operates in 3 modes. When the observed delay is very low (or below
the minimum threshold), it assumes that it is operating in a ”high-speed” mode and
increases the window fast to fill the link. In this mode, the window increase factor
α in W = W + α, is increased linearly until a maximum value of αmax (currently
set to 32). When the observed delay is above a TCP-compete threshold (currently
set to 0.65*maximum observed queuing delay), PERT assumes it is operating in
a heterogeneous environment and increases the window every RTT additively with
α = 1 + p′/p, where p′ is the early response probability and p is the observed packet
loss rate. When the observed delay is above the minimum threshold, but below
the TCP-compete threshold, PERT assumes it is operating in a ”safe” mode and
increments window additively with α = 1. In addition, PERT reduces the window
conservatively in the early response phase, W = W × (1− β), where β = q′/(q′ + q),
where q′ is the estimated queuing delay at early response phase and q is the observed
maximum queueing delay. It is observed that this leads to W = W/2 upon a packet
loss.
Simultions and real-network evalutions have shown that, (a) a single PERT flow can
scale to high-speed links of up to 10Gbps, (b) PERT can compete with TCP in
heterogeneous environments and (c) still benefit from near-zero packet loss rates and
very low queuing delays when operating in homogeneous environments. Details of
PERT design can be found in [21, 22].
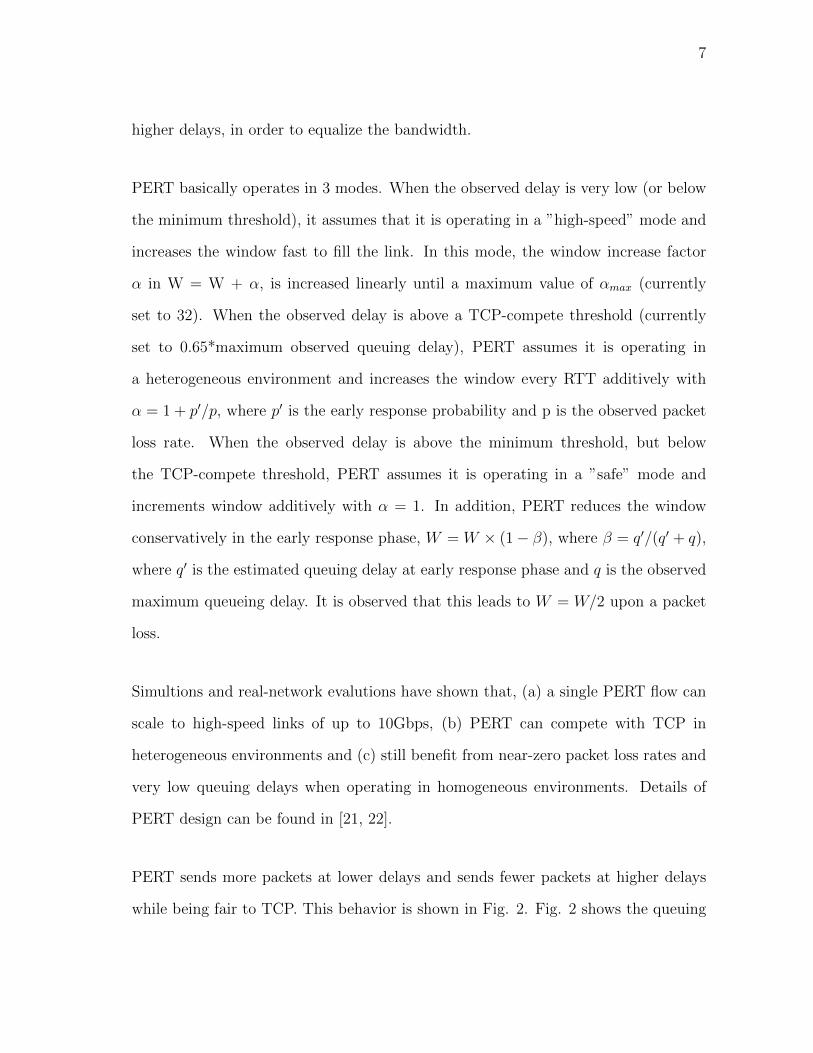
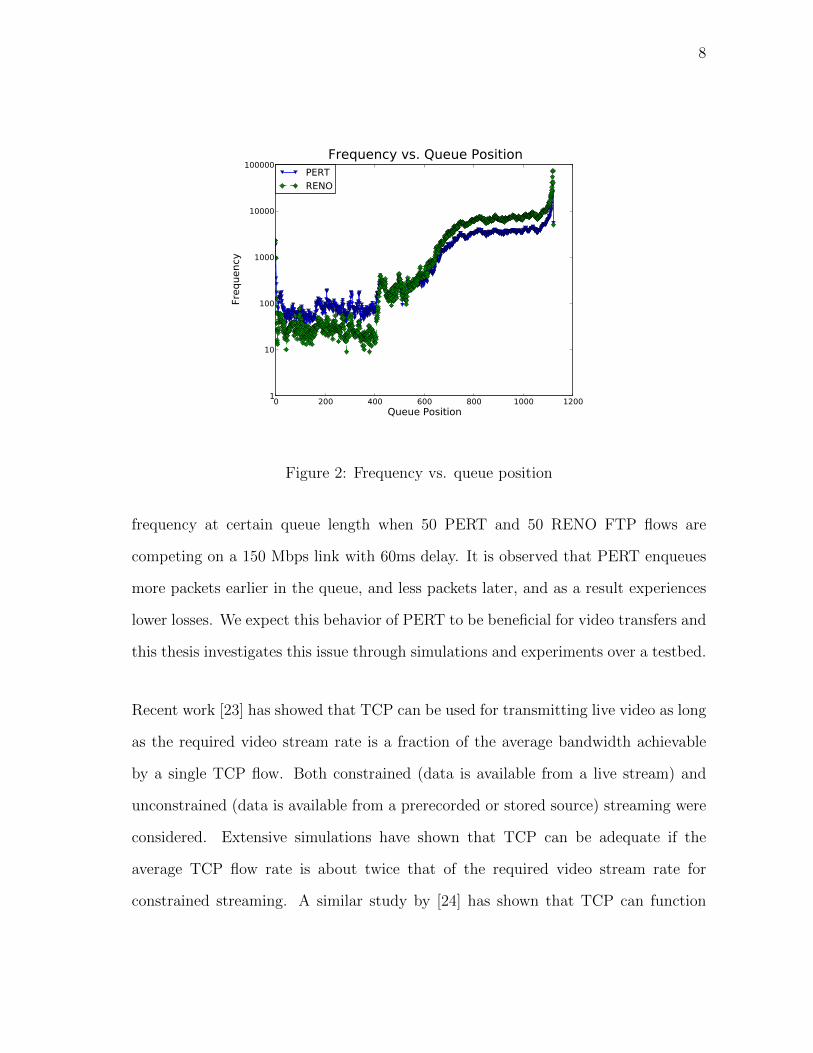
PERT sends more packets at lower delays and sends fewer packets at higher delays
while being fair to TCP. This behavior is shown in Fig. 2. Fig. 2 shows the queuing
Page 17
8
0 200 400 600 800 1000 1200Queue Position
1
10
100
1000
10000
100000
Freq
uenc
y
Frequency vs. Queue PositionPERTRENO
Figure 2: Frequency vs. queue position
frequency at certain queue length when 50 PERT and 50 RENO FTP flows are
competing on a 150 Mbps link with 60ms delay. It is observed that PERT enqueues
more packets earlier in the queue, and less packets later, and as a result experiences
lower losses. We expect this behavior of PERT to be beneficial for video transfers and
this thesis investigates this issue through simulations and experiments over a testbed.
Recent work [23] has showed that TCP can be used for transmitting live video as long
as the required video stream rate is a fraction of the average bandwidth achievable
by a single TCP flow. Both constrained (data is available from a live stream) and
unconstrained (data is available from a prerecorded or stored source) streaming were
considered. Extensive simulations have shown that TCP can be adequate if the
average TCP flow rate is about twice that of the required video stream rate for
constrained streaming. A similar study by [24] has shown that TCP can function
Page 18
9
adequately with a 1.5 higher bandwidth than required stream rate in unconstrained
streaming and that Vegas could support unconstrained streaming better than TCP
NEWRENO. The question we try to answer in this thesis is if a delay-based protocol
such as PERT can support constrained video streaming at a lower available bandwidth
than two times of the required video stream rate as required by RENO.
We carry out extensive NS-2 based simulations and live video transmissions on a
real network testbed within the lab. We present data from both simulations and
the emulations to show that PERT indeed provides better support for live video
transmission than RENO and CUBIC.
Page 19
10
CHAPTER III
MEASUREMENT FOR VIDEO STREAMING
A. NS-2 Simulation
1. Experiment Setup
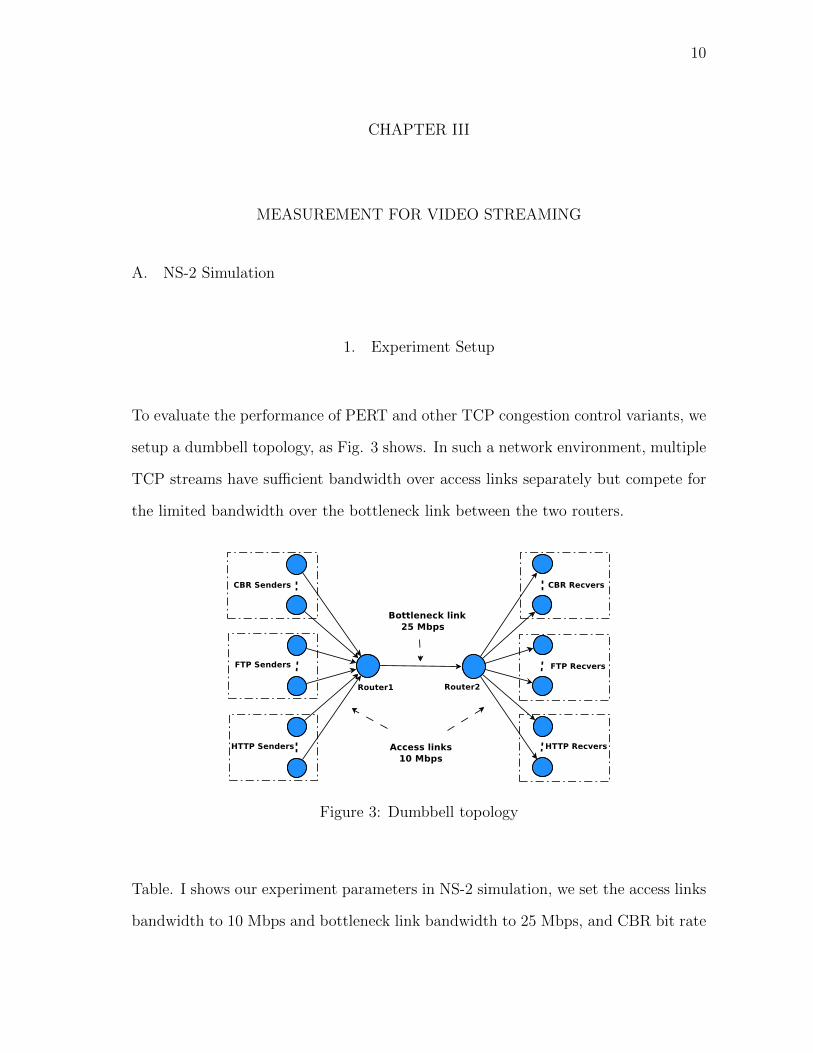
To evaluate the performance of PERT and other TCP congestion control variants, we
setup a dumbbell topology, as Fig. 3 shows. In such a network environment, multiple
TCP streams have sufficient bandwidth over access links separately but compete for
the limited bandwidth over the bottleneck link between the two routers.
Figure 3: Dumbbell topology
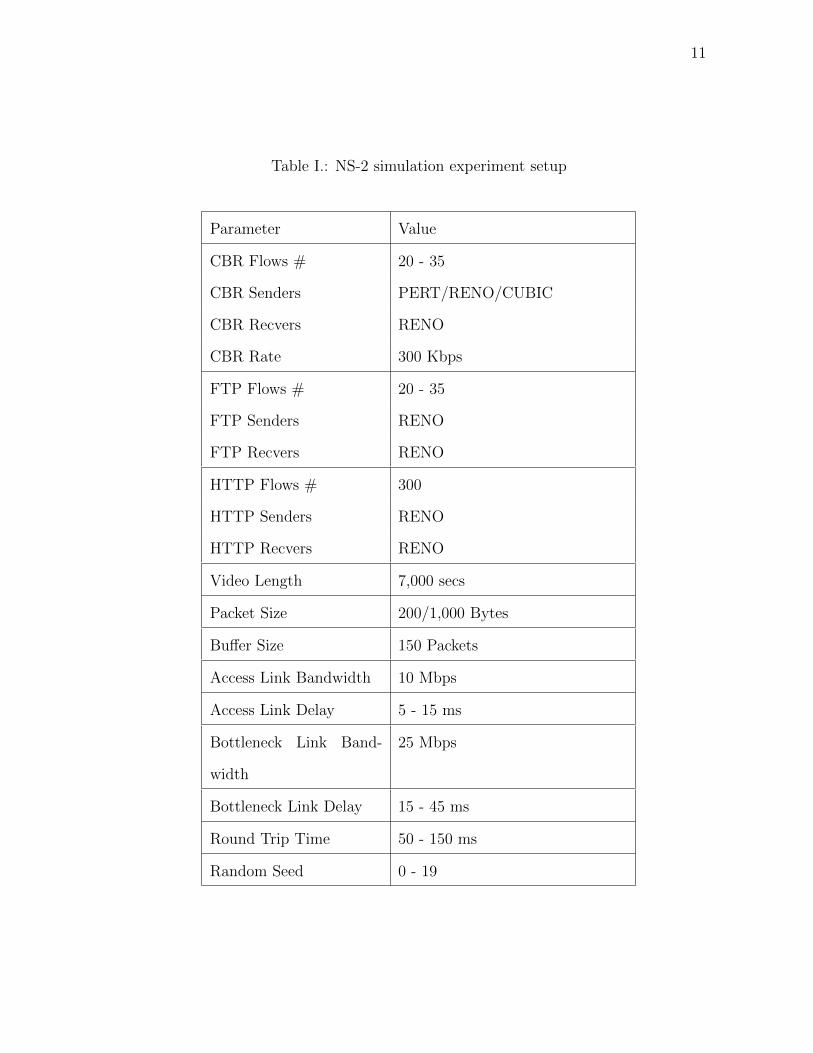
Table. I shows our experiment parameters in NS-2 simulation, we set the access links
bandwidth to 10 Mbps and bottleneck link bandwidth to 25 Mbps, and CBR bit rate
Page 20
11
Table I.: NS-2 simulation experiment setup
Parameter Value
CBR Flows # 20 - 35
CBR Senders PERT/RENO/CUBIC
CBR Recvers RENO
CBR Rate 300 Kbps
FTP Flows # 20 - 35
FTP Senders RENO
FTP Recvers RENO
HTTP Flows # 300
HTTP Senders RENO
HTTP Recvers RENO
Video Length 7,000 secs
Packet Size 200/1,000 Bytes
Buffer Size 150 Packets
Access Link Bandwidth 10 Mbps
Access Link Delay 5 - 15 ms
Bottleneck Link Band-
width
25 Mbps
Bottleneck Link Delay 15 - 45 ms
Round Trip Time 50 - 150 ms
Random Seed 0 - 19
Page 21
12
to 300 Kbps. Moreover, TCP packet size is set to 200 or 1,000 bytes, router buffer
size to 150 packets, and video length to 7,000 seconds. We keep the above parameters
constant to get rid of their impacts on TCP video streaming performance. We take
HTTP and FTP flows as the background traffic, RENO and CUBIC as the control
group. As a loss based protocol, RENO additively increases the congestion window
by one MSS (Maximum Segment Size) every RTT (Round Trip Time), cuts down the
congestion window by half on a packet loss and decreases it to one MSS on a timeout
event. As for CUBIC, the congestion window growth follows a cubic function in
terms of the elapsed time since the last loss event. To emulate a realistic network,
we vary link delay (RTT) by altering the access link delay and bottleneck link delay.
We also vary the number of CBR streams and the number of FTP streams from
20-35 and keep the number of HTTP streams constant at 300 to achieve different
TCP throughputs. Finally, we run the simulation 20 times with seed values of 0-19
to randomize the start time of the TCP streams, in order to statistically reduce its
effect on the experiment results.
2. Simulation Results
a. Parameters Exploration
In this section, we explored the experiment parameters to study the performance
of PERT under different conditions. As [23] concludes, the performance of TCP
generally provides good streaming performance when the T/µ is roughly 2.0, where
T is the achievable TCP throughput and µ is the video bit-rate. To demonstrate
PERT’s performance under different T/µs, we pick sample data with certain CBR
Page 22
13
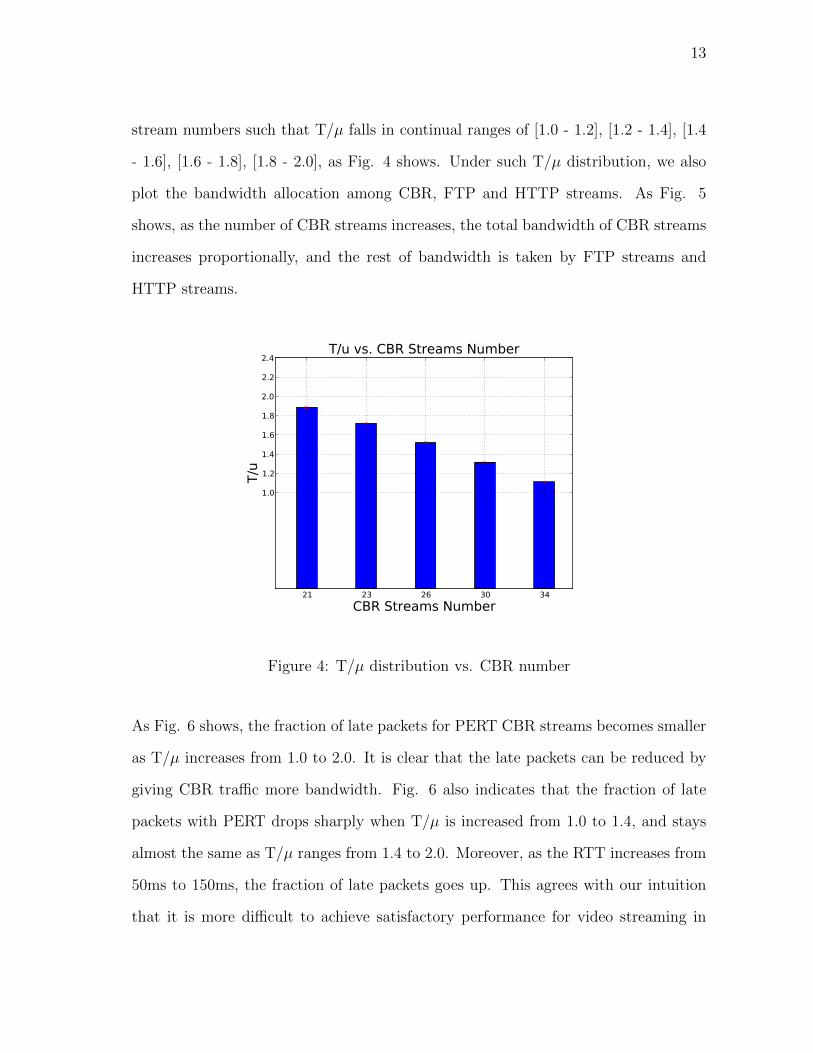
stream numbers such that T/µ falls in continual ranges of [1.0 - 1.2], [1.2 - 1.4], [1.4
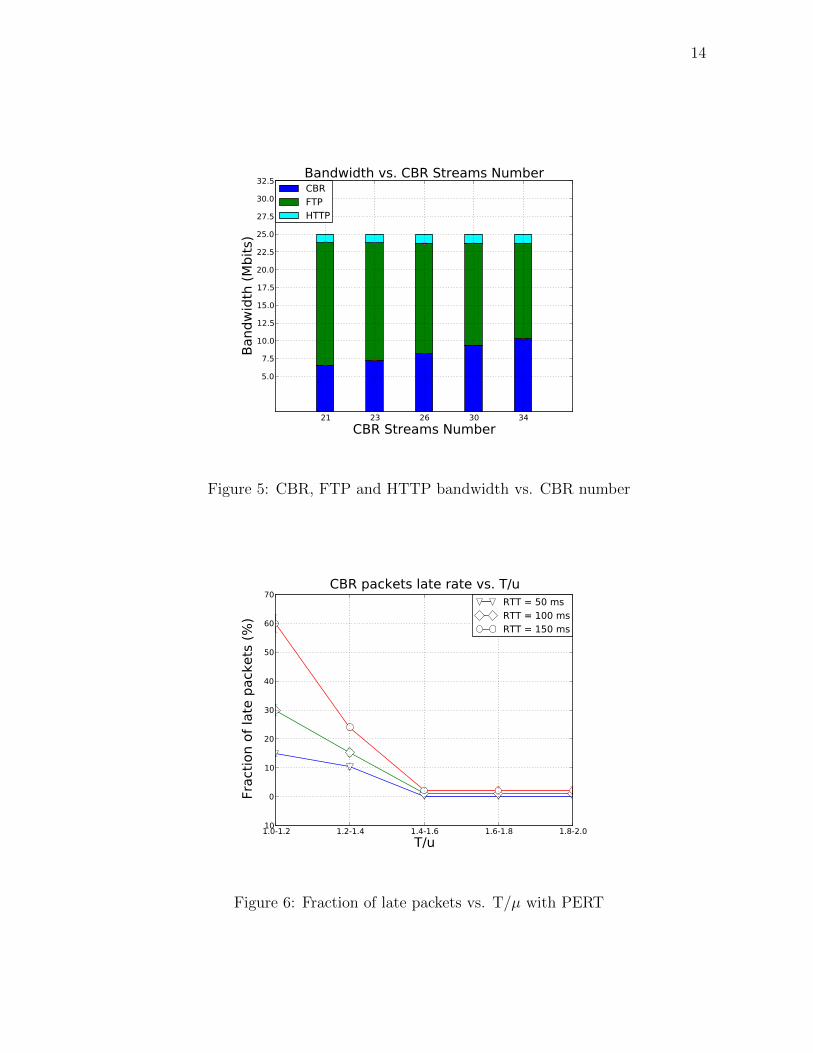
- 1.6], [1.6 - 1.8], [1.8 - 2.0], as Fig. 4 shows. Under such T/µ distribution, we also
plot the bandwidth allocation among CBR, FTP and HTTP streams. As Fig. 5
shows, as the number of CBR streams increases, the total bandwidth of CBR streams
increases proportionally, and the rest of bandwidth is taken by FTP streams and
HTTP streams.
21 23 26 30 34CBR Streams Number
1.0
1.2
1.4
1.6
1.8
2.0
2.2
2.4
T/u
T/u vs. CBR Streams Number
Figure 4: T/µ distribution vs. CBR number
As Fig. 6 shows, the fraction of late packets for PERT CBR streams becomes smaller
as T/µ increases from 1.0 to 2.0. It is clear that the late packets can be reduced by
giving CBR traffic more bandwidth. Fig. 6 also indicates that the fraction of late
packets with PERT drops sharply when T/µ is increased from 1.0 to 1.4, and stays
almost the same as T/µ ranges from 1.4 to 2.0. Moreover, as the RTT increases from
50ms to 150ms, the fraction of late packets goes up. This agrees with our intuition
that it is more difficult to achieve satisfactory performance for video streaming in
Page 23
14
21 23 26 30 34CBR Streams Number
5.0
7.5
10.0
12.5
15.0
17.5
20.0
22.5
25.0
27.5
30.0
32.5
Band
wid
th (M
bits
)
Bandwidth vs. CBR Streams NumberCBRFTPHTTP
Figure 5: CBR, FTP and HTTP bandwidth vs. CBR number
1.0-1.2 1.2-1.4 1.4-1.6 1.6-1.8 1.8-2.0T/u
�10
0
10
20
30
40
50
60
70
Frac
tion
of la
te p
acke
ts (%
)
CBR packets late rate vs. T/uRTT = 50 msRTT = 100 msRTT = 150 ms
Figure 6: Fraction of late packets vs. T/µ with PERT
Page 24
15
higher delay networks (retransmissions may not arrive in time, for example).
Studies show that the video viewing quality is closely related to the fraction of late
packets. We define that a CBR stream is successful as long as the fraction of late
packets is below 10−4, with only a few seconds of startup delay as the paper [23] did.
Under such an evaluation metric, we validate PERT’s performance and compare with
others in the aspect of delivered video quality.
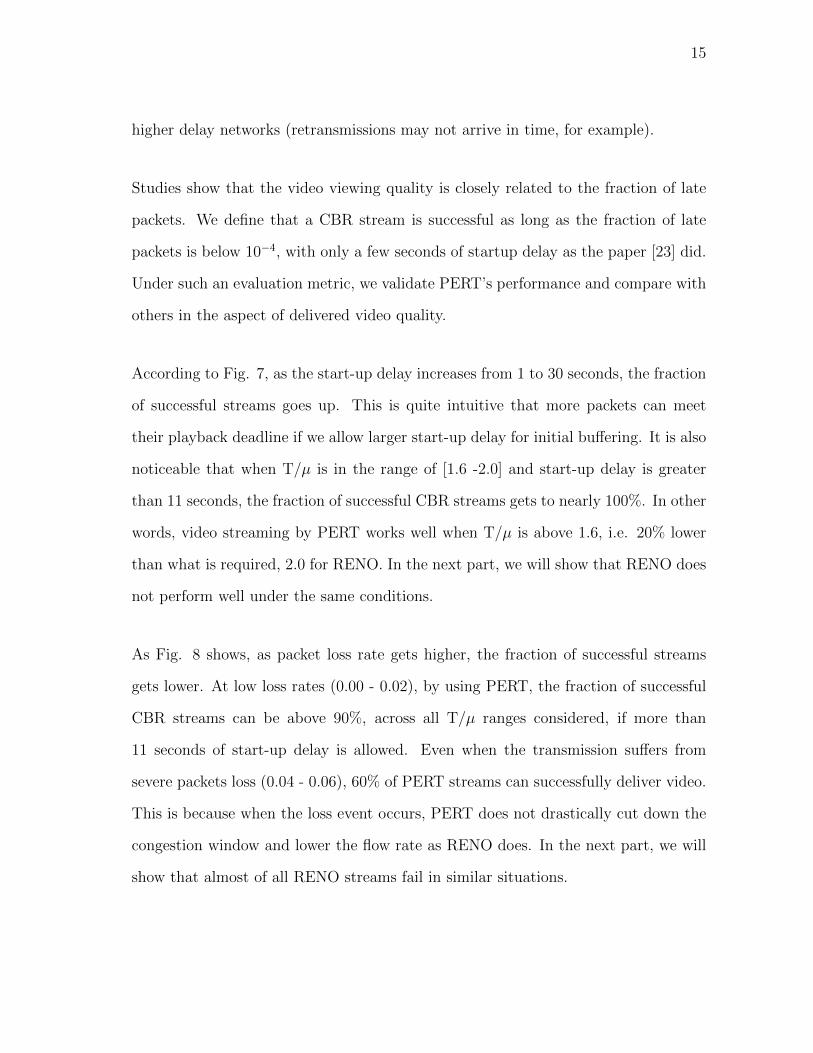
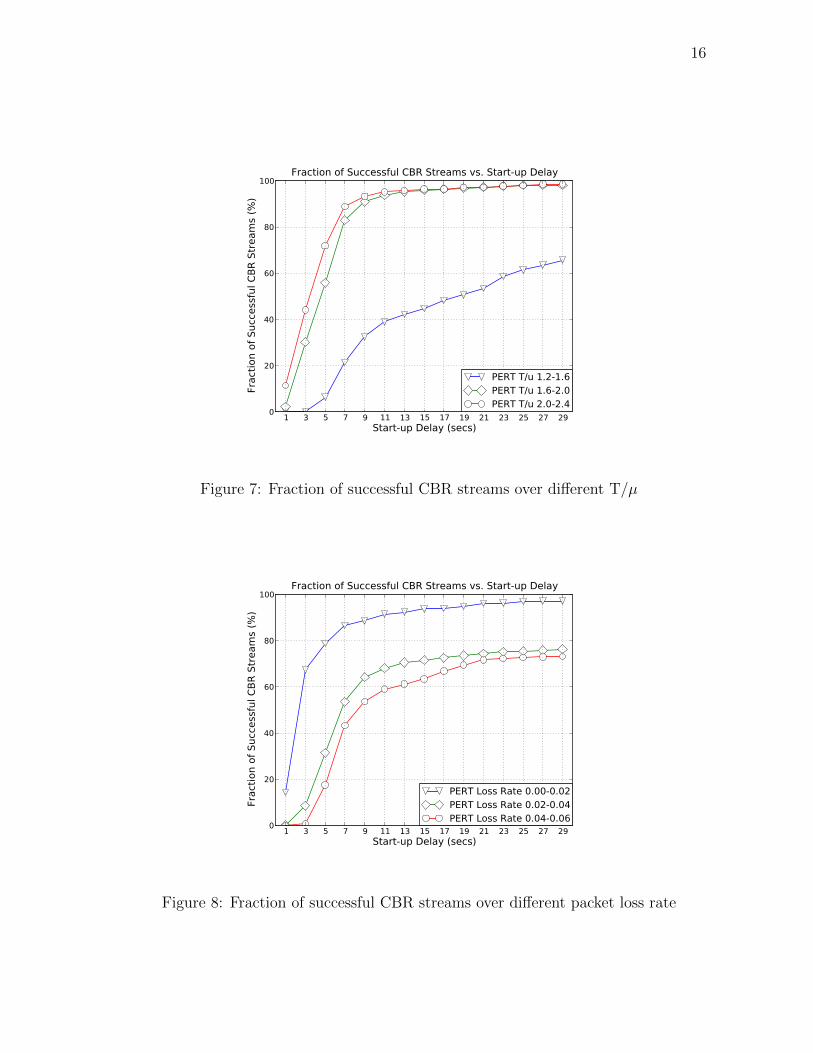
According to Fig. 7, as the start-up delay increases from 1 to 30 seconds, the fraction
of successful streams goes up. This is quite intuitive that more packets can meet
their playback deadline if we allow larger start-up delay for initial buffering. It is also
noticeable that when T/µ is in the range of [1.6 -2.0] and start-up delay is greater
than 11 seconds, the fraction of successful CBR streams gets to nearly 100%. In other
words, video streaming by PERT works well when T/µ is above 1.6, i.e. 20% lower
than what is required, 2.0 for RENO. In the next part, we will show that RENO does
not perform well under the same conditions.
As Fig. 8 shows, as packet loss rate gets higher, the fraction of successful streams
gets lower. At low loss rates (0.00 - 0.02), by using PERT, the fraction of successful
CBR streams can be above 90%, across all T/µ ranges considered, if more than
11 seconds of start-up delay is allowed. Even when the transmission suffers from
severe packets loss (0.04 - 0.06), 60% of PERT streams can successfully deliver video.
This is because when the loss event occurs, PERT does not drastically cut down the
congestion window and lower the flow rate as RENO does. In the next part, we will
show that almost of all RENO streams fail in similar situations.
Page 25
16
1 3 5 7 9 11 13 15 17 19 21 23 25 27 29Start-up Delay (secs)
0
20
40
60
80
100
Frac
tion
of S
ucce
ssfu
l CBR
Str
eam
s (%
)
Fraction of Successful CBR Streams vs. Start-up Delay
PERT T/u 1.2-1.6PERT T/u 1.6-2.0PERT T/u 2.0-2.4
Figure 7: Fraction of successful CBR streams over different T/µ
1 3 5 7 9 11 13 15 17 19 21 23 25 27 29Start-up Delay (secs)
0
20
40
60
80
100
Frac
tion
of S
ucce
ssfu
l CBR
Str
eam
s (%
)
Fraction of Successful CBR Streams vs. Start-up Delay
PERT Loss Rate 0.00-0.02PERT Loss Rate 0.02-0.04PERT Loss Rate 0.04-0.06
Figure 8: Fraction of successful CBR streams over different packet loss rate
Page 26
17
b. Performance Comparison
In this part, we compare the performance of PERT, RENO and CUBIC for video
streaming in the same parameter space that we described in the last section. As our
simulation results indicate, PERT outperforms RENO over all T/µ, loss rates and
start-up delays, and CUBIC over low T/µ, high loss rates and strict start-up delay
constraints.
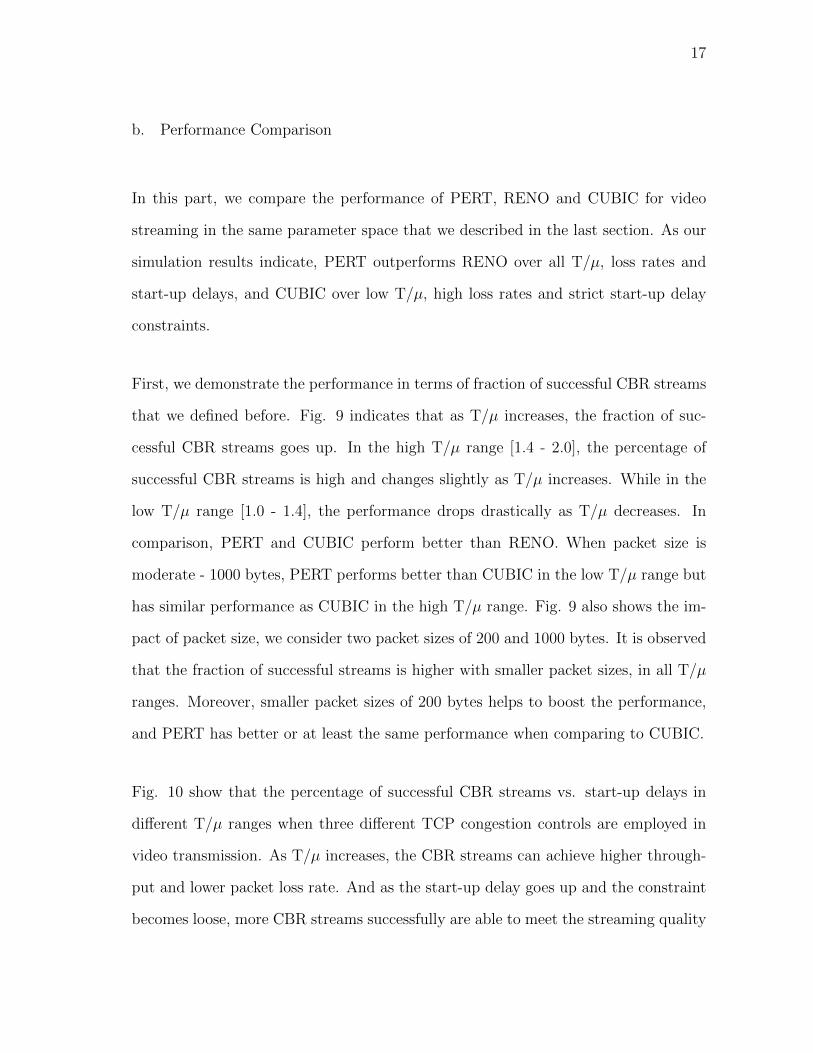
First, we demonstrate the performance in terms of fraction of successful CBR streams
that we defined before. Fig. 9 indicates that as T/µ increases, the fraction of suc-
cessful CBR streams goes up. In the high T/µ range [1.4 - 2.0], the percentage of
successful CBR streams is high and changes slightly as T/µ increases. While in the
low T/µ range [1.0 - 1.4], the performance drops drastically as T/µ decreases. In
comparison, PERT and CUBIC perform better than RENO. When packet size is
moderate - 1000 bytes, PERT performs better than CUBIC in the low T/µ range but
has similar performance as CUBIC in the high T/µ range. Fig. 9 also shows the im-
pact of packet size, we consider two packet sizes of 200 and 1000 bytes. It is observed
that the fraction of successful streams is higher with smaller packet sizes, in all T/µ
ranges. Moreover, smaller packet sizes of 200 bytes helps to boost the performance,
and PERT has better or at least the same performance when comparing to CUBIC.
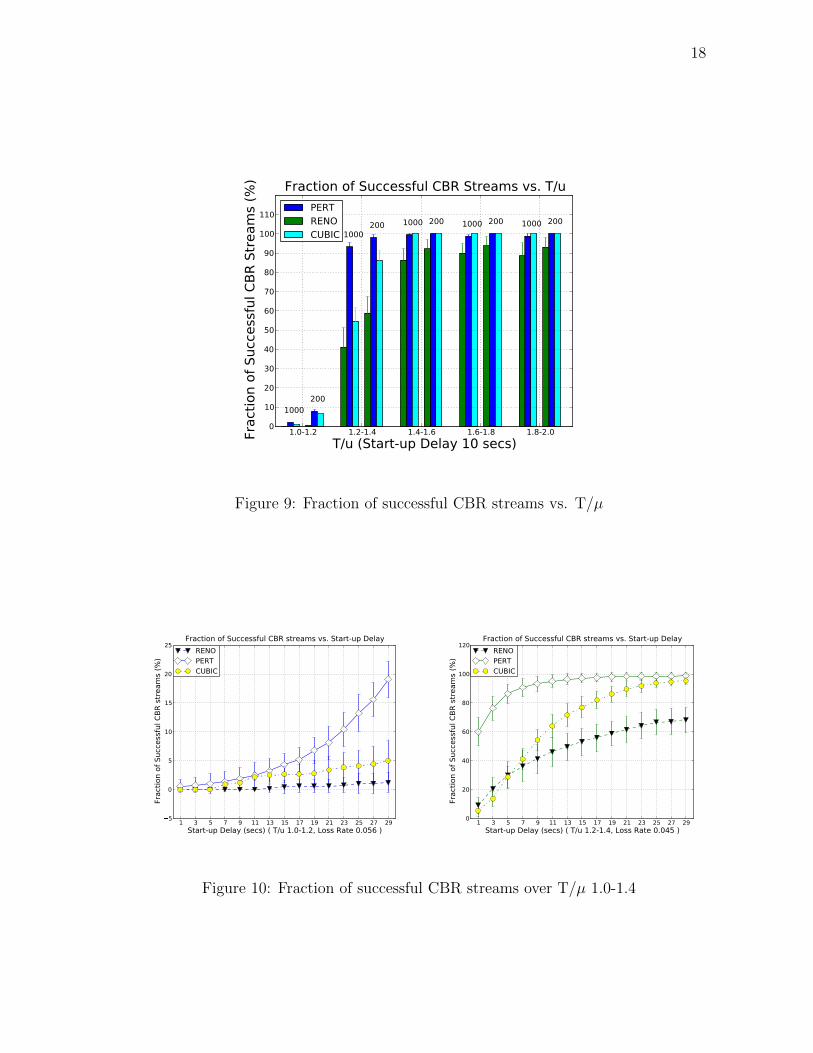
Fig. 10 show that the percentage of successful CBR streams vs. start-up delays in
different T/µ ranges when three different TCP congestion controls are employed in
video transmission. As T/µ increases, the CBR streams can achieve higher through-
put and lower packet loss rate. And as the start-up delay goes up and the constraint
becomes loose, more CBR streams successfully are able to meet the streaming quality
Page 27
18
1.0-1.2 1.2-1.4 1.4-1.6 1.6-1.8 1.8-2.0T/u (Start-up Delay 10 secs)
0
10
20
30
40
50
60
70
80
90
100
110
Frac
tion
of S
ucce
ssfu
l CBR
Str
eam
s (%
)
1000
10001000 1000 1000
200
200 200 200 200
Fraction of Successful CBR Streams vs. T/uPERTRENOCUBIC
Figure 9: Fraction of successful CBR streams vs. T/µ
1 3 5 7 9 11 13 15 17 19 21 23 25 27 29Start-up Delay (secs) ( T/u 1.0-1.2, Loss Rate 0.056 )
�5
0
5
10
15
20
25
Frac
tion
of S
ucce
ssfu
l CBR
str
eam
s (%
)
Fraction of Successful CBR streams vs. Start-up DelayRENOPERTCUBIC
1 3 5 7 9 11 13 15 17 19 21 23 25 27 29Start-up Delay (secs) ( T/u 1.2-1.4, Loss Rate 0.045 )
0
20
40
60
80
100
120
Frac
tion
of S
ucce
ssfu
l CBR
str
eam
s (%
)
Fraction of Successful CBR streams vs. Start-up DelayRENOPERTCUBIC
Figure 10: Fraction of successful CBR streams over T/µ 1.0-1.4
Page 28
19
requirement. These observations are consistent with the earlier study [23].
In comparison, when the T/µ is in the low range [1.0 - 1.4], the loss rate is relatively
high, PERT achieves the best performance, CUBIC is in the middle, and RENO is
the worst.
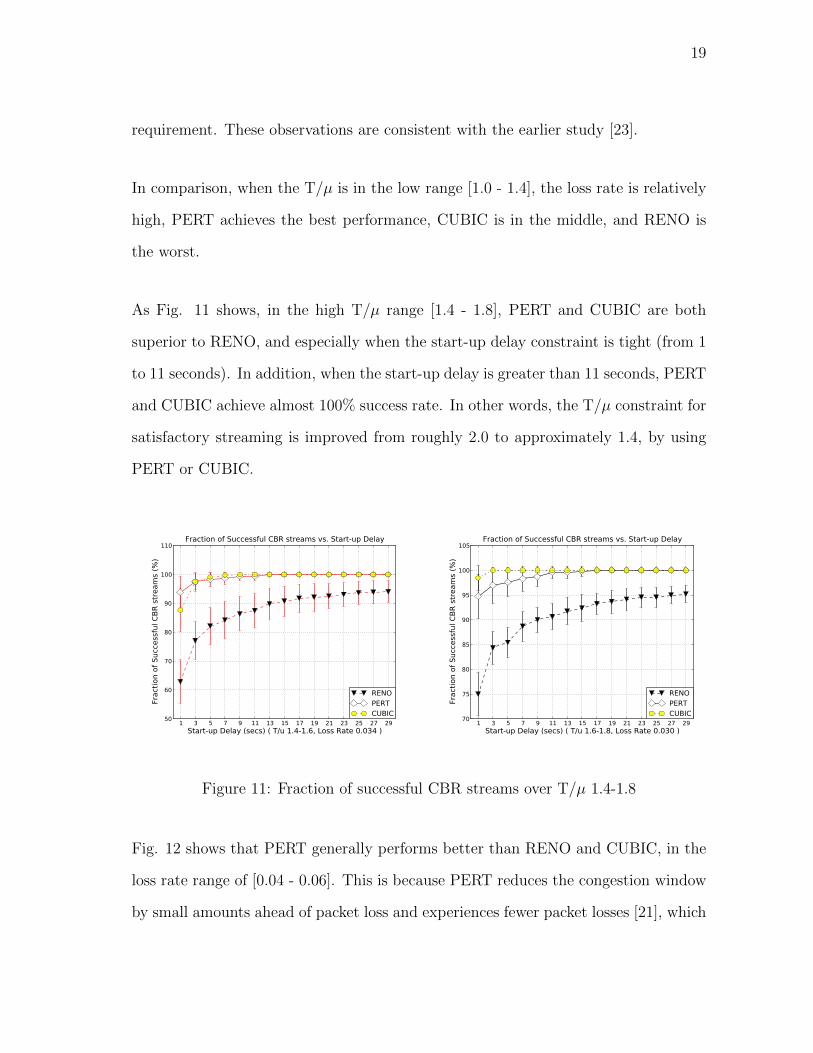
As Fig. 11 shows, in the high T/µ range [1.4 - 1.8], PERT and CUBIC are both
superior to RENO, and especially when the start-up delay constraint is tight (from 1
to 11 seconds). In addition, when the start-up delay is greater than 11 seconds, PERT
and CUBIC achieve almost 100% success rate. In other words, the T/µ constraint for
satisfactory streaming is improved from roughly 2.0 to approximately 1.4, by using
PERT or CUBIC.
1 3 5 7 9 11 13 15 17 19 21 23 25 27 29Start-up Delay (secs) ( T/u 1.4-1.6, Loss Rate 0.034 )
50
60
70
80
90
100
110
Frac
tion
of S
ucce
ssfu
l CBR
str
eam
s (%
)
Fraction of Successful CBR streams vs. Start-up Delay
RENOPERTCUBIC
1 3 5 7 9 11 13 15 17 19 21 23 25 27 29Start-up Delay (secs) ( T/u 1.6-1.8, Loss Rate 0.030 )
70
75
80
85
90
95
100
105
Frac
tion
of S
ucce
ssfu
l CBR
str
eam
s (%
)
Fraction of Successful CBR streams vs. Start-up Delay
RENOPERTCUBIC
Figure 11: Fraction of successful CBR streams over T/µ 1.4-1.8
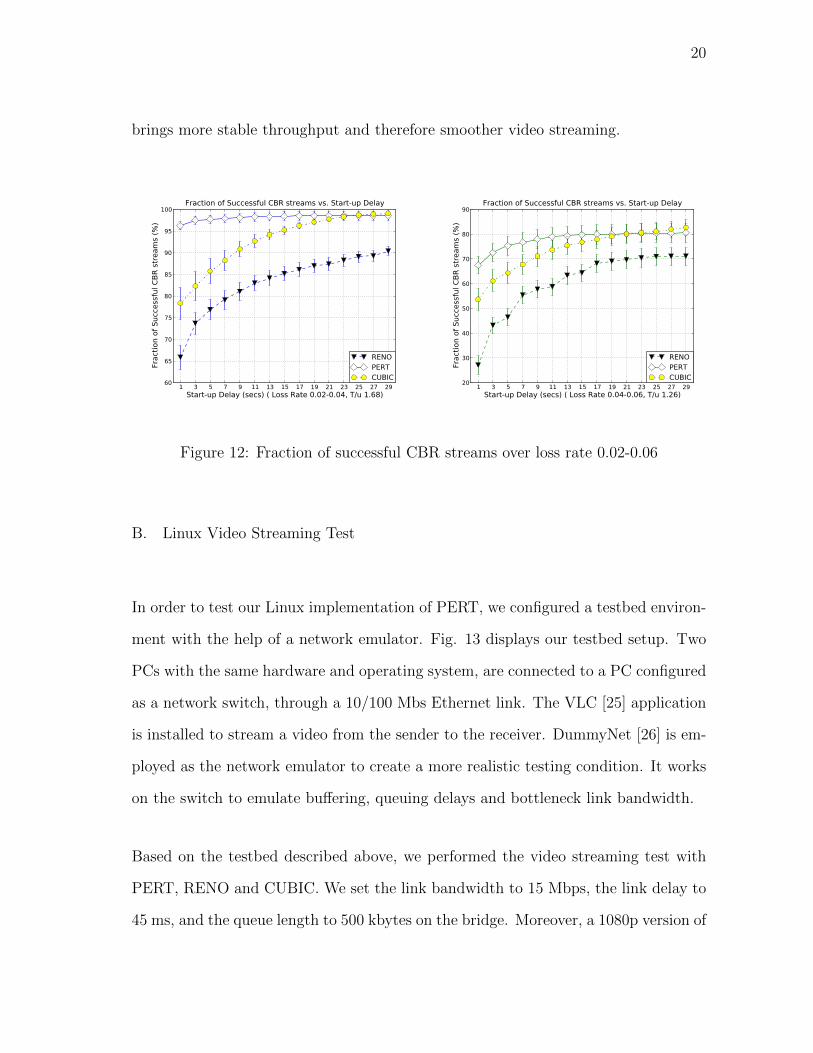
Fig. 12 shows that PERT generally performs better than RENO and CUBIC, in the
loss rate range of [0.04 - 0.06]. This is because PERT reduces the congestion window
by small amounts ahead of packet loss and experiences fewer packet losses [21], which
Page 29
20
brings more stable throughput and therefore smoother video streaming.
1 3 5 7 9 11 13 15 17 19 21 23 25 27 29Start-up Delay (secs) ( Loss Rate 0.02-0.04, T/u 1.68)
60
65
70
75
80
85
90
95
100
Frac
tion
of S
ucce
ssfu
l CBR
str
eam
s (%
)
Fraction of Successful CBR streams vs. Start-up Delay
RENOPERTCUBIC
1 3 5 7 9 11 13 15 17 19 21 23 25 27 29Start-up Delay (secs) ( Loss Rate 0.04-0.06, T/u 1.26)
20
30
40
50
60
70
80
90
Frac
tion
of S
ucce
ssfu
l CBR
str
eam
s (%
)
Fraction of Successful CBR streams vs. Start-up Delay
RENOPERTCUBIC
Figure 12: Fraction of successful CBR streams over loss rate 0.02-0.06
B. Linux Video Streaming Test
In order to test our Linux implementation of PERT, we configured a testbed environ-
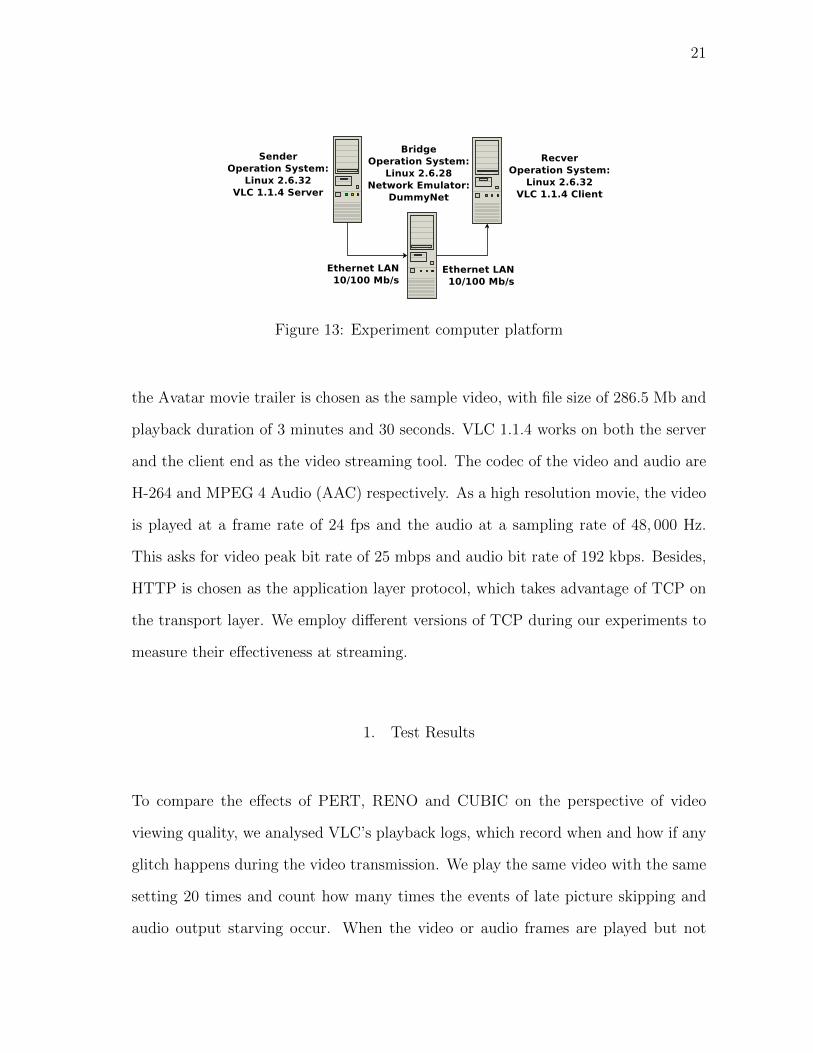
ment with the help of a network emulator. Fig. 13 displays our testbed setup. Two
PCs with the same hardware and operating system, are connected to a PC configured
as a network switch, through a 10/100 Mbs Ethernet link. The VLC [25] application
is installed to stream a video from the sender to the receiver. DummyNet [26] is em-
ployed as the network emulator to create a more realistic testing condition. It works
on the switch to emulate buffering, queuing delays and bottleneck link bandwidth.
Based on the testbed described above, we performed the video streaming test with
PERT, RENO and CUBIC. We set the link bandwidth to 15 Mbps, the link delay to
45 ms, and the queue length to 500 kbytes on the bridge. Moreover, a 1080p version of
Page 30
21
Figure 13: Experiment computer platform
the Avatar movie trailer is chosen as the sample video, with file size of 286.5 Mb and
playback duration of 3 minutes and 30 seconds. VLC 1.1.4 works on both the server
and the client end as the video streaming tool. The codec of the video and audio are
H-264 and MPEG 4 Audio (AAC) respectively. As a high resolution movie, the video
is played at a frame rate of 24 fps and the audio at a sampling rate of 48, 000 Hz.
This asks for video peak bit rate of 25 mbps and audio bit rate of 192 kbps. Besides,
HTTP is chosen as the application layer protocol, which takes advantage of TCP on
the transport layer. We employ different versions of TCP during our experiments to
measure their effectiveness at streaming.
1. Test Results
To compare the effects of PERT, RENO and CUBIC on the perspective of video
viewing quality, we analysed VLC’s playback logs, which record when and how if any
glitch happens during the video transmission. We play the same video with the same
setting 20 times and count how many times the events of late picture skipping and
audio output starving occur. When the video or audio frames are played but not
Page 31
22
found in the client’s buffer, one of these events will occur. They lead to playback
glitches, VLC client buffering, user waiting and therefore impair the viewing quality.
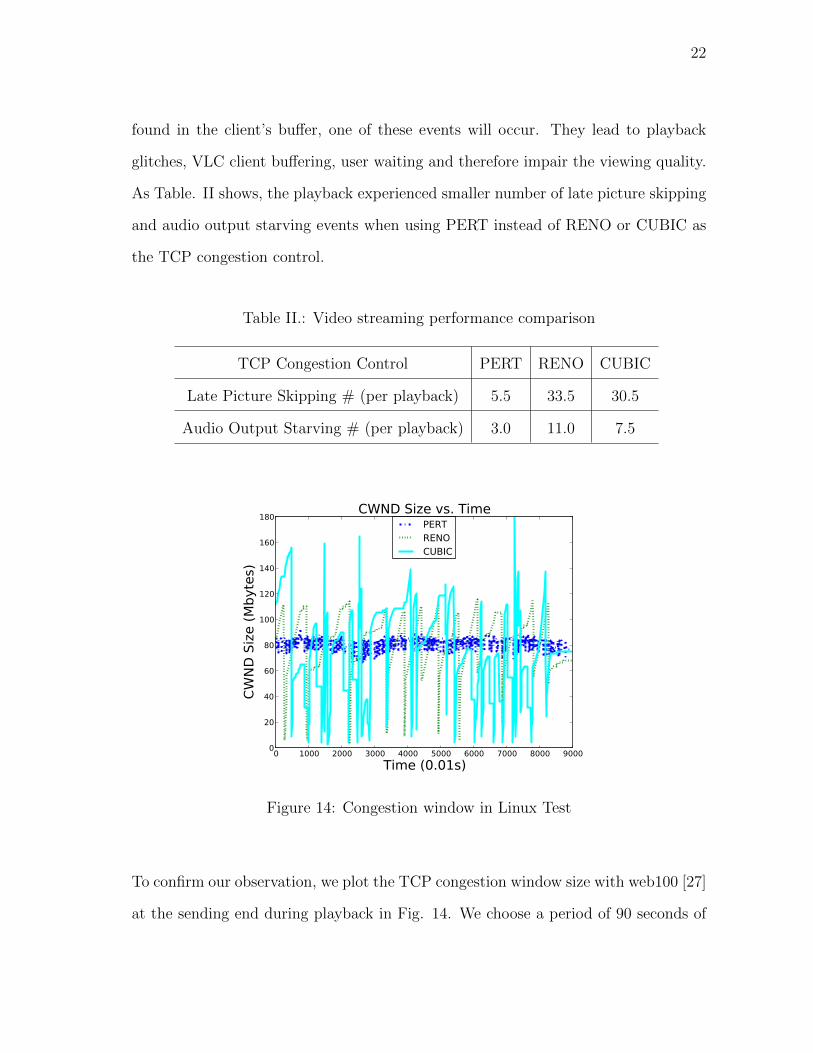
As Table. II shows, the playback experienced smaller number of late picture skipping
and audio output starving events when using PERT instead of RENO or CUBIC as
the TCP congestion control.
Table II.: Video streaming performance comparison
TCP Congestion Control PERT RENO CUBIC
Late Picture Skipping # (per playback) 5.5 33.5 30.5
Audio Output Starving # (per playback) 3.0 11.0 7.5
0 1000 2000 3000 4000 5000 6000 7000 8000 9000Time (0.01s)
0
20
40
60
80
100
120
140
160
180
CWND
Siz
e (M
byte
s)
CWND Size vs. TimePERTRENOCUBIC
Figure 14: Congestion window in Linux Test
To confirm our observation, we plot the TCP congestion window size with web100 [27]
at the sending end during playback in Fig. 14. We choose a period of 90 seconds of
Page 32
23
playback time at the end of the movie, since the streaming is relatively stable during
that time. And we track the congestion window size every 0.01 second. As Fig. 14
shows, the congestion window size of PERT has fewer fluctuations than that of RENO
or CUBIC do. CUBIC increases the congestion window fast and achieves sightly
better performance than RENO does, but still incurs large fluctuations. Therefore,
the throughput of PERT’s video streams are more steady and their data frames are
more likely to arrive before playback deadline. This can explain the smaller number
of late picture skipping and audio output starving events we observed, when PERT
is employed as the TCP congestion control.
Page 33
24
CHAPTER IV
ENHANCEMENT WITH DELAY ACKS AND PACING
A. Delayed ACK
In this section, we discuss our extension of PERT with delayed ACK and pacing. We
first describe our implementation of adaptive delayed ACK mechanism and observa-
tion that delayed ACK mechanisms can disrupt the delay estimation mechanism of
PERT. To overcome the RTT over-estimation issue, we introduce TCP pacing and its
effectiveness of reducing data bustiness. We further demonstrate that pacing bring
more fairness benefits and therefore makes delayed ACK more practical. Finally, we
show our video streaming tests results for PERT with delayed ACK and pacing.
1. Implementation
Combining the ideas of paper [11] and [12], we proposed an adaptive delayed ACK
algorithm. In our algorithm, not only the number of accumulated ACKs (1 - 4 in our
implementation), but also The ACKs sending time (0 - 2× data packet arrival interval
in out implementation), are adaptive, according to current transmission status. The
specific mechanism will be fully described and its effectiveness will be validated in
this section.
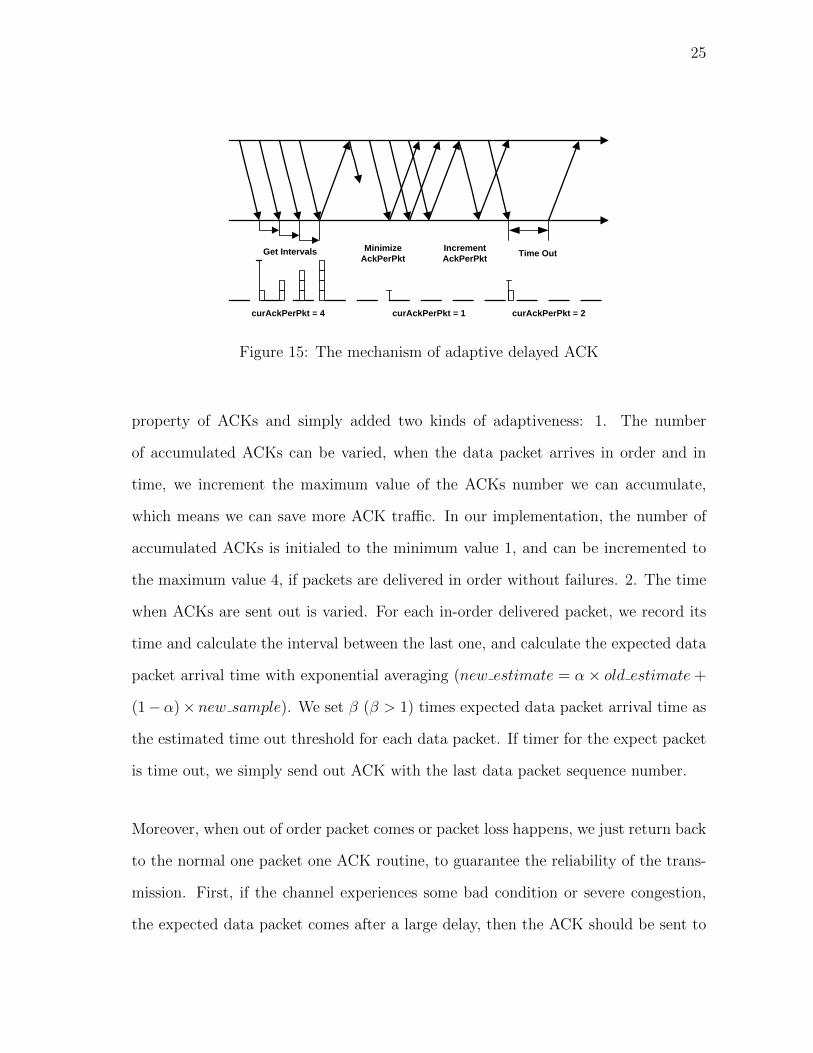
As the Fig. 15 shows. Our proposed algorithm takes advantage of the cumulative
Page 34
25
curAckPerPkt = 4 curAckPerPkt = 1 curAckPerPkt = 2
Get Intervals Time OutMinimize
AckPerPkt
Increment
AckPerPkt
Figure 15: The mechanism of adaptive delayed ACK
property of ACKs and simply added two kinds of adaptiveness: 1. The number
of accumulated ACKs can be varied, when the data packet arrives in order and in
time, we increment the maximum value of the ACKs number we can accumulate,
which means we can save more ACK traffic. In our implementation, the number of
accumulated ACKs is initialed to the minimum value 1, and can be incremented to
the maximum value 4, if packets are delivered in order without failures. 2. The time
when ACKs are sent out is varied. For each in-order delivered packet, we record its
time and calculate the interval between the last one, and calculate the expected data
packet arrival time with exponential averaging (new estimate = α× old estimate+
(1− α)× new sample). We set β (β > 1) times expected data packet arrival time as
the estimated time out threshold for each data packet. If timer for the expect packet
is time out, we simply send out ACK with the last data packet sequence number.
Moreover, when out of order packet comes or packet loss happens, we just return back
to the normal one packet one ACK routine, to guarantee the reliability of the trans-
mission. First, if the channel experiences some bad condition or severe congestion,
the expected data packet comes after a large delay, then the ACK should be sent to
Page 35
26
keep the sender updated about the transmission status. And this time-out mecha-
nism is also designed to avoid ’deadlock’, which can happen when the receiver will
still accumulate (does not send) ACKs but actually the sender has no more packets
to send. In such a case, the sender expects the receiver to send the acknowledgement
for the last data packet, but, the receiver cannot send out the ACK since it try to
accumulate more ACKs.
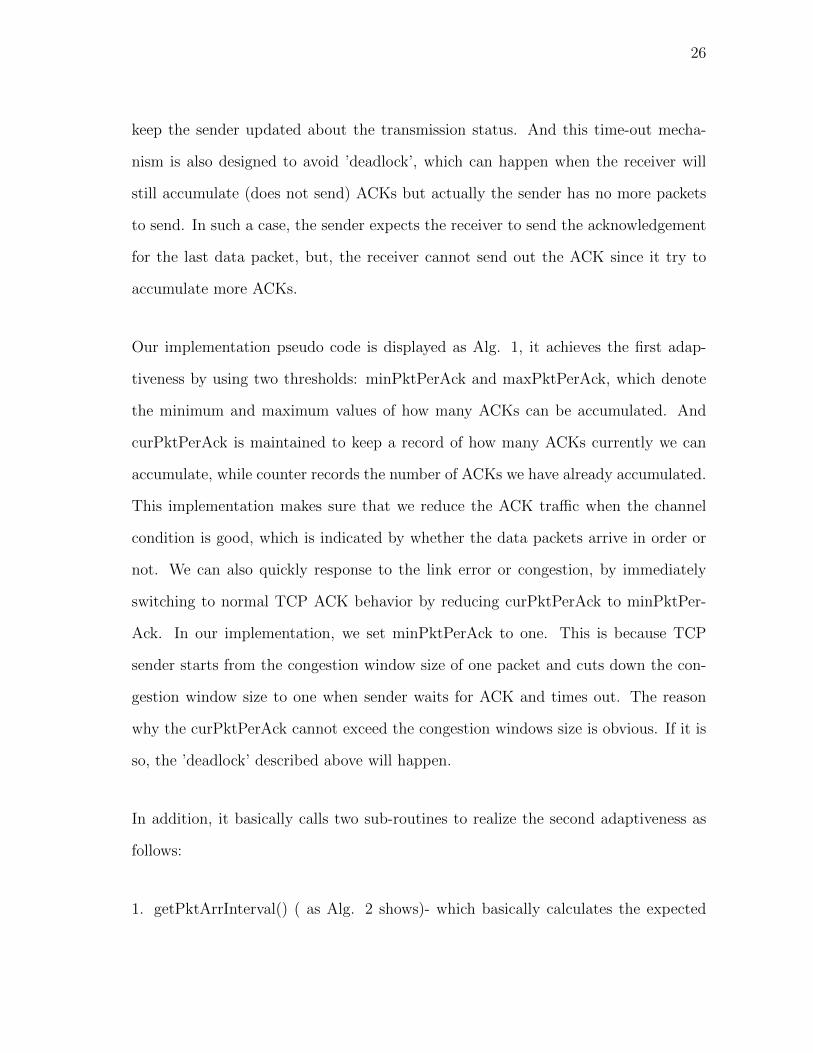
Our implementation pseudo code is displayed as Alg. 1, it achieves the first adap-
tiveness by using two thresholds: minPktPerAck and maxPktPerAck, which denote
the minimum and maximum values of how many ACKs can be accumulated. And
curPktPerAck is maintained to keep a record of how many ACKs currently we can
accumulate, while counter records the number of ACKs we have already accumulated.
This implementation makes sure that we reduce the ACK traffic when the channel
condition is good, which is indicated by whether the data packets arrive in order or
not. We can also quickly response to the link error or congestion, by immediately
switching to normal TCP ACK behavior by reducing curPktPerAck to minPktPer-
Ack. In our implementation, we set minPktPerAck to one. This is because TCP
sender starts from the congestion window size of one packet and cuts down the con-
gestion window size to one when sender waits for ACK and times out. The reason
why the curPktPerAck cannot exceed the congestion windows size is obvious. If it is
so, the ’deadlock’ described above will happen.
In addition, it basically calls two sub-routines to realize the second adaptiveness as
follows:
1. getPktArrInterval() ( as Alg. 2 shows)- which basically calculates the expected
Page 36
27
Algorithm 1: Adaptive Delay ACK
Input: minPktPerAck = 1, maxPktPerAck = 4, α = 0.9, β = 2.0.
begin
interval←− 0;
counter ←− 0;
curPktPerAck ←− minPktPerAck;
if dataPktSeqNo == ackPktSeqNo then
getPktArrInterval(); ( Algorithm 2 ) ;
counter ←− counter + 1;
if curPktPerAck == curPktPerAck then
send ACK with ackPktSeqNo;
counter ←− 0;
else
setupPktTimer(); ( Algorithm 3 ) ;
end
if curPktPerAck < maxPktPerAck then
curPktPerAck ←− curPktPerAck + 1;
end
else
send ACK with ackPktSeqNo;
curPktPerAck ←− 0;
curPktPerAck ←− minPktPerAck;
end
end
Page 37
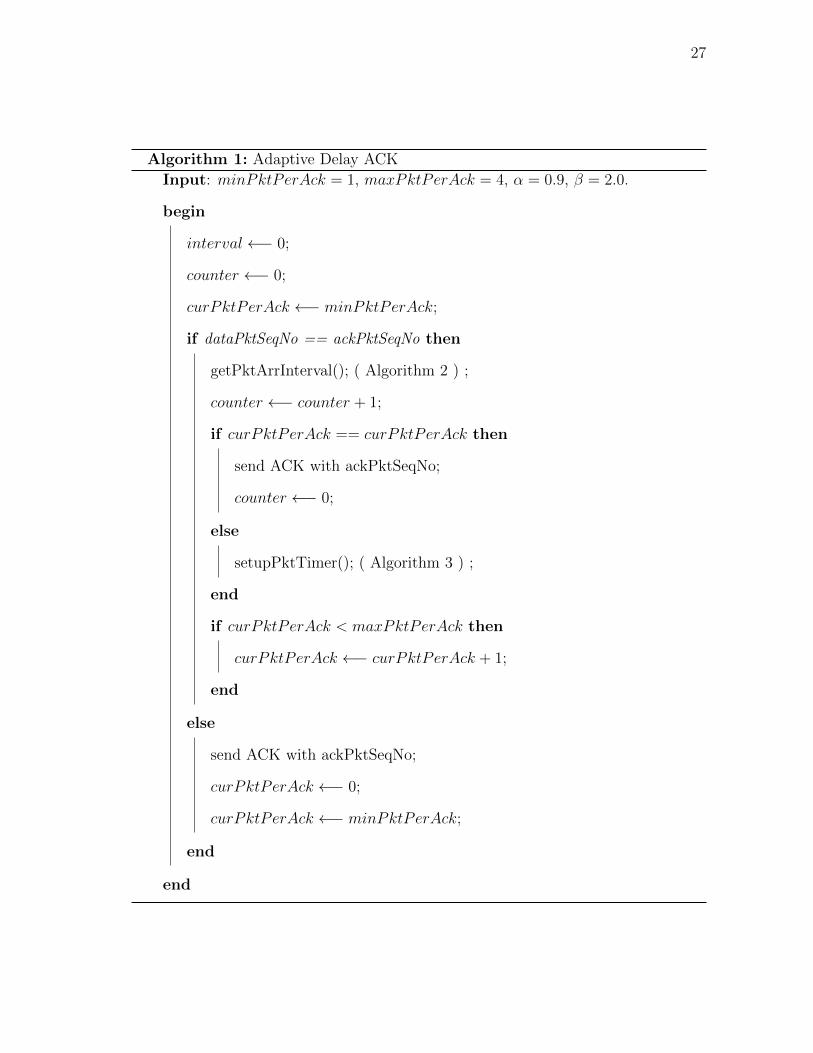
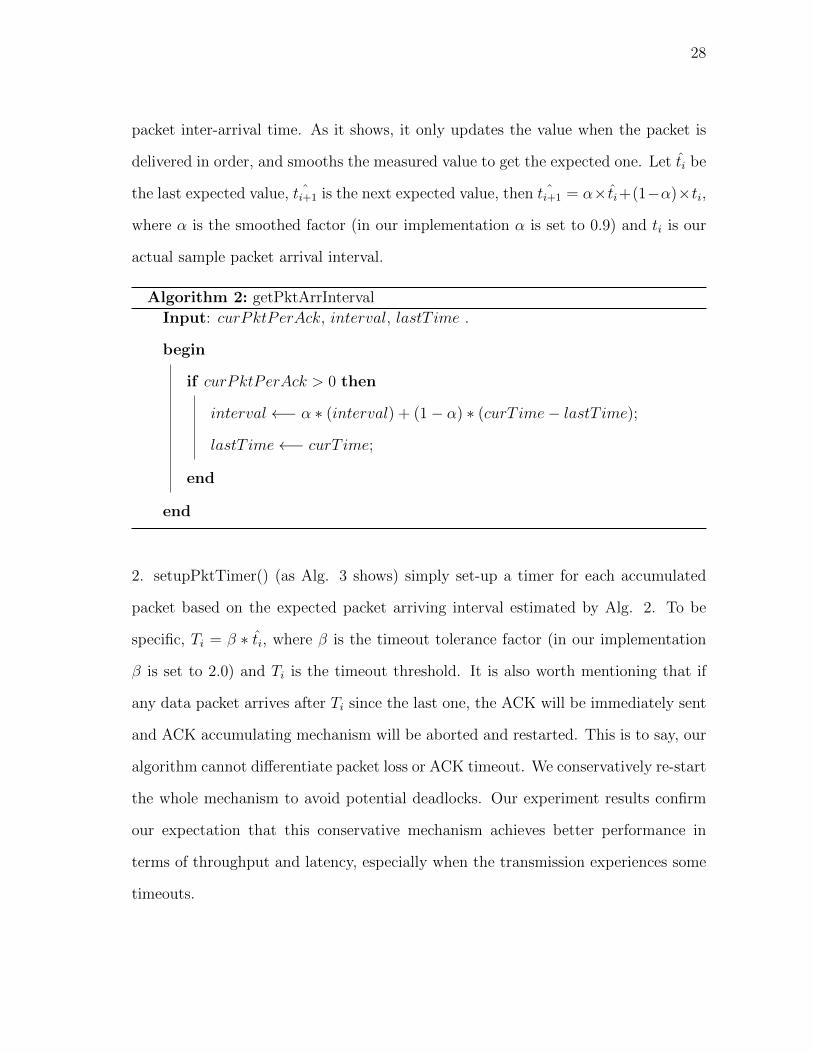
28
packet inter-arrival time. As it shows, it only updates the value when the packet is
delivered in order, and smooths the measured value to get the expected one. Let t̂i be
the last expected value, ˆti+1 is the next expected value, then ˆti+1 = α× t̂i+(1−α)×ti,
where α is the smoothed factor (in our implementation α is set to 0.9) and ti is our
actual sample packet arrival interval.
Algorithm 2: getPktArrInterval
Input: curPktPerAck, interval, lastT ime .
begin
if curPktPerAck > 0 then
interval←− α ∗ (interval) + (1− α) ∗ (curT ime− lastT ime);
lastT ime←− curT ime;
end
end
2. setupPktTimer() (as Alg. 3 shows) simply set-up a timer for each accumulated
packet based on the expected packet arriving interval estimated by Alg. 2. To be
specific, Ti = β ∗ t̂i, where β is the timeout tolerance factor (in our implementation
β is set to 2.0) and Ti is the timeout threshold. It is also worth mentioning that if
any data packet arrives after Ti since the last one, the ACK will be immediately sent
and ACK accumulating mechanism will be aborted and restarted. This is to say, our
algorithm cannot differentiate packet loss or ACK timeout. We conservatively re-start
the whole mechanism to avoid potential deadlocks. Our experiment results confirm
our expectation that this conservative mechanism achieves better performance in
terms of throughput and latency, especially when the transmission experiences some
timeouts.
Page 38
29
Algorithm 3: setupPktTimer()
Input: curPktPerAck, interval, lastT ime.
begin
// set-up a timer for each accumulated packet,
// in case of packet loss or no more packets.
timeout←− β ∗ interval;
// if timeout occurs, send ACK with ackPktSeqNo,
// curPktPerAck ←− minPktPerAck,
// counter ←− 0.
end
About the implementation overhead, our algorithm only requires the modification
of the receiving end and does not require the cooperation of sender. There is some
processing overhead associated with this method, such as the tracking of data packet
arriving interval, setting up the timer, as well as condition judgement. But the trade-
off is beneficial in comparison with the general increase in useful throughput and
better utilization of channel, that we will show later.
2. Validation
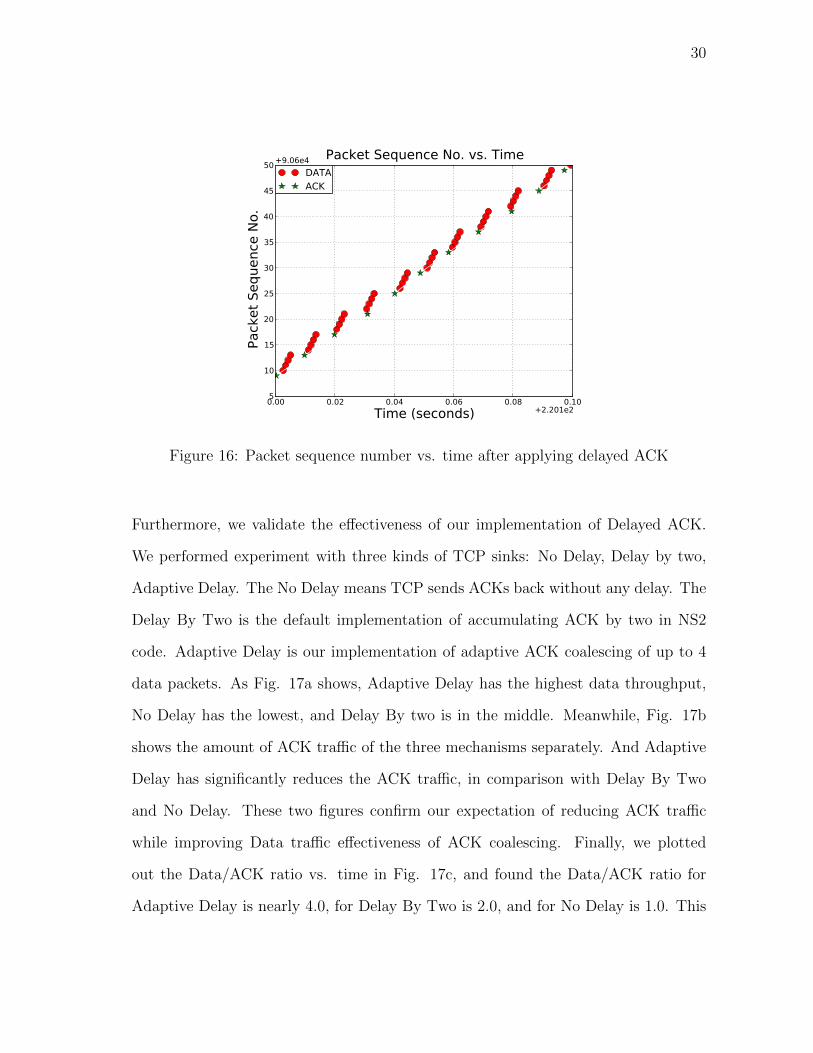
To verify the correctness of our delay ACK implementation, we first performed a
simple NS2 simulation with one sender streaming a FTP flow to one receiver. We
plotted the packet sequence number vs. time as Fig. 16 shows. We observed that
upon receiving every four data packets one ACK packet was sent, which is exactly as
we expected.
Page 39
30
0.00 0.02 0.04 0.06 0.08 0.10Time (seconds) +2.201e2
5
10
15
20
25
30
35
40
45
50
Pack
et S
eque
nce
No.
+9.06e4 Packet Sequence No. vs. TimeDATAACK
Figure 16: Packet sequence number vs. time after applying delayed ACK
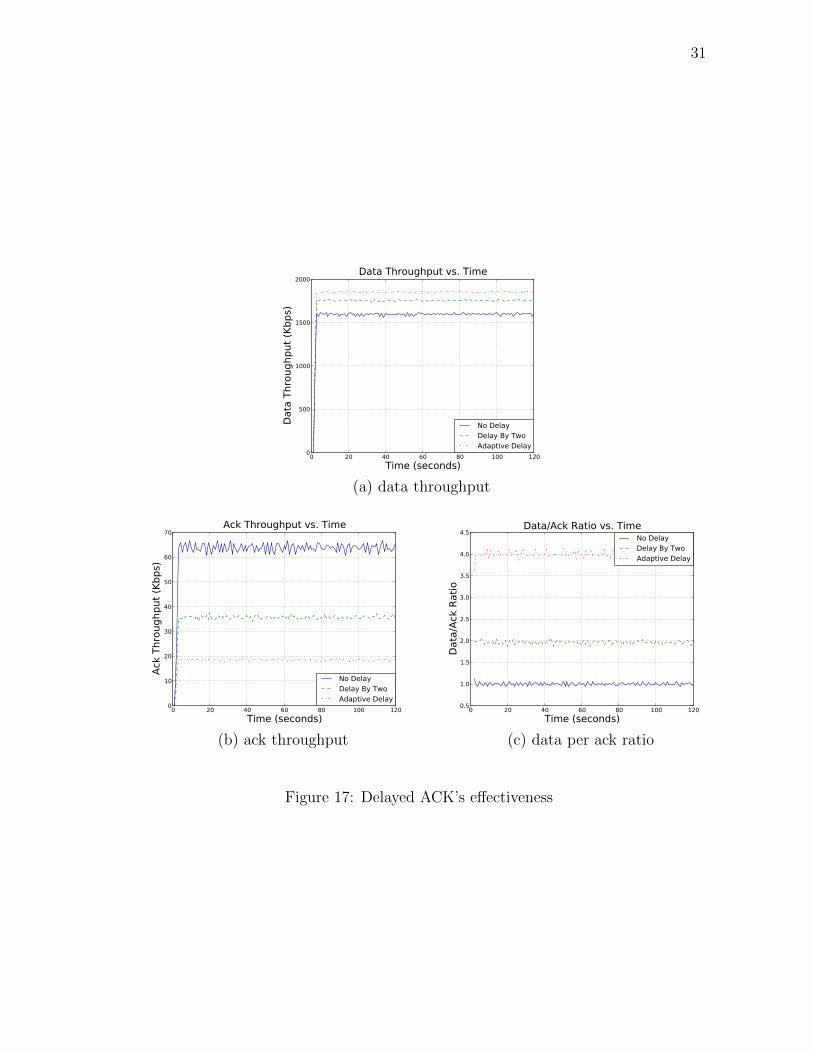
Furthermore, we validate the effectiveness of our implementation of Delayed ACK.
We performed experiment with three kinds of TCP sinks: No Delay, Delay by two,
Adaptive Delay. The No Delay means TCP sends ACKs back without any delay. The
Delay By Two is the default implementation of accumulating ACK by two in NS2
code. Adaptive Delay is our implementation of adaptive ACK coalescing of up to 4
data packets. As Fig. 17a shows, Adaptive Delay has the highest data throughput,
No Delay has the lowest, and Delay By two is in the middle. Meanwhile, Fig. 17b
shows the amount of ACK traffic of the three mechanisms separately. And Adaptive
Delay has significantly reduces the ACK traffic, in comparison with Delay By Two
and No Delay. These two figures confirm our expectation of reducing ACK traffic
while improving Data traffic effectiveness of ACK coalescing. Finally, we plotted
out the Data/ACK ratio vs. time in Fig. 17c, and found the Data/ACK ratio for
Adaptive Delay is nearly 4.0, for Delay By Two is 2.0, and for No Delay is 1.0. This
Page 40
31
0 20 40 60 80 100 120Time (seconds)
0
500
1000
1500
2000D
ata
Thro
ughp
ut (K
bps)
Data Throughput vs. Time
No DelayDelay By TwoAdaptive Delay
(a) data throughput
0 20 40 60 80 100 120Time (seconds)
0
10
20
30
40
50
60
70
Ack
Thro
ughp
ut (K
bps)
Ack Throughput vs. Time
No DelayDelay By TwoAdaptive Delay
(b) ack throughput
0 20 40 60 80 100 120Time (seconds)
0.5
1.0
1.5
2.0
2.5
3.0
3.5
4.0
4.5
Dat
a/Ac
k Ra
tio
Data/Ack Ratio vs. TimeNo DelayDelay By TwoAdaptive Delay
(c) data per ack ratio
Figure 17: Delayed ACK’s effectiveness
Page 41
32
exactly matches our design objective.
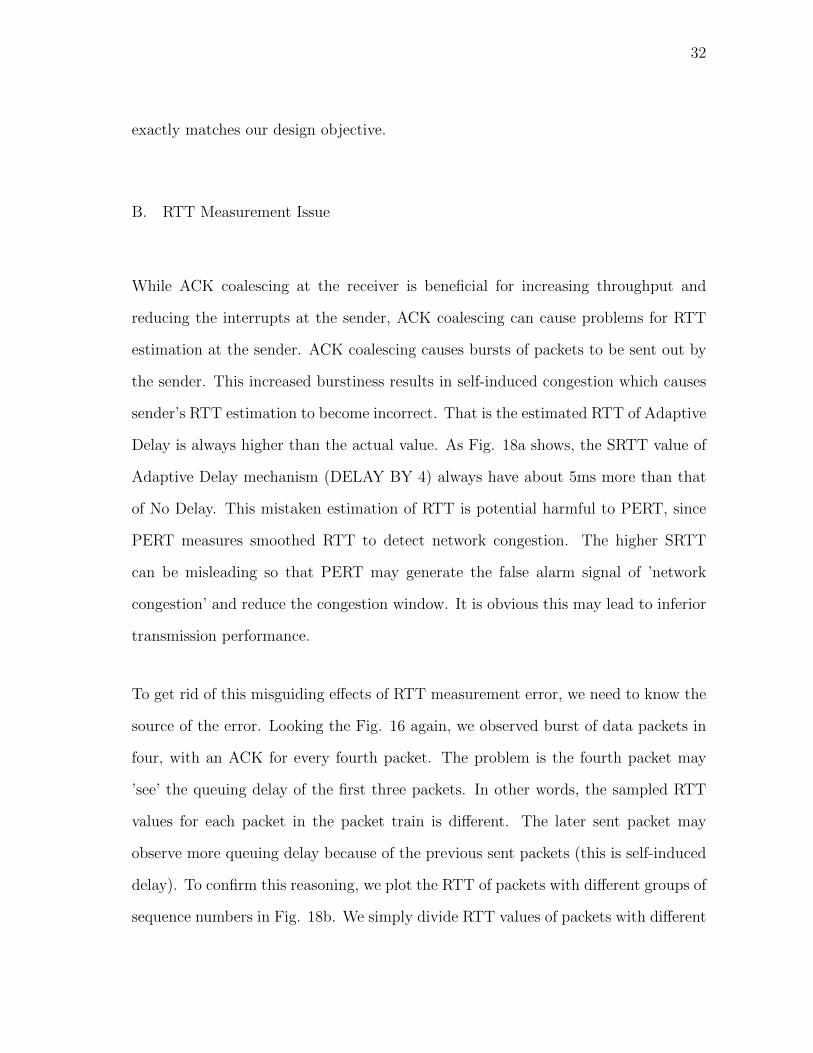
B. RTT Measurement Issue
While ACK coalescing at the receiver is beneficial for increasing throughput and
reducing the interrupts at the sender, ACK coalescing can cause problems for RTT
estimation at the sender. ACK coalescing causes bursts of packets to be sent out by
the sender. This increased burstiness results in self-induced congestion which causes
sender’s RTT estimation to become incorrect. That is the estimated RTT of Adaptive
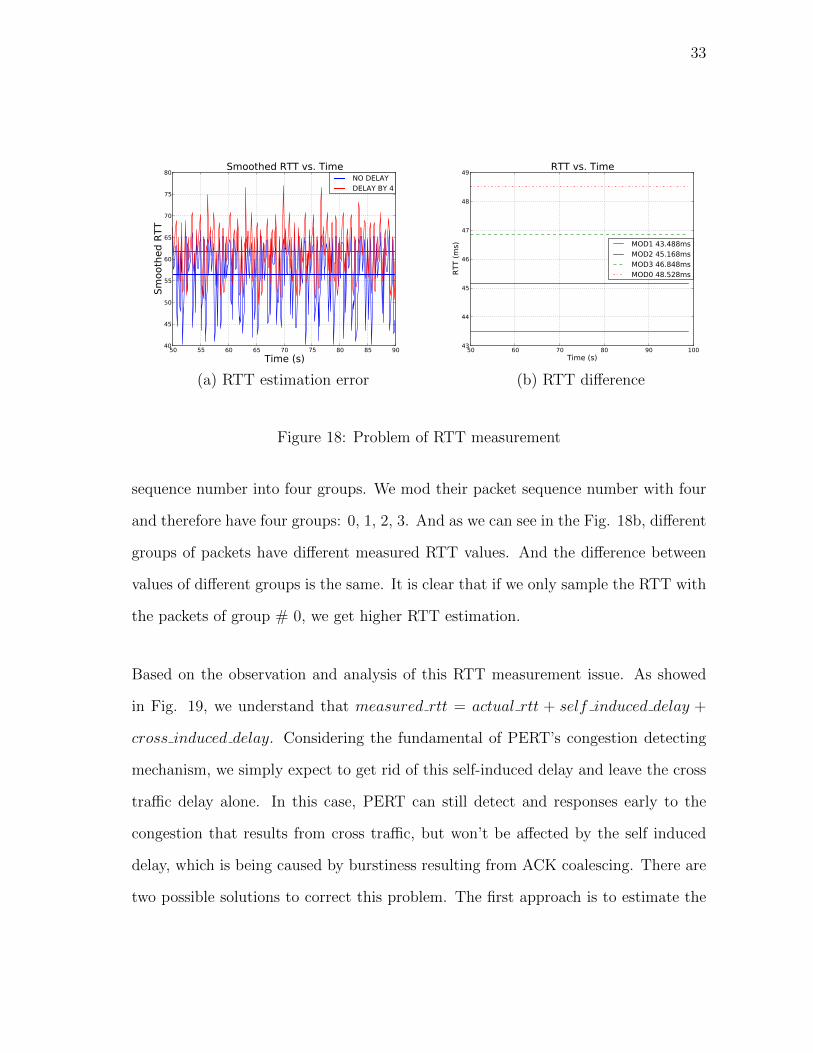
Delay is always higher than the actual value. As Fig. 18a shows, the SRTT value of
Adaptive Delay mechanism (DELAY BY 4) always have about 5ms more than that
of No Delay. This mistaken estimation of RTT is potential harmful to PERT, since
PERT measures smoothed RTT to detect network congestion. The higher SRTT
can be misleading so that PERT may generate the false alarm signal of ’network
congestion’ and reduce the congestion window. It is obvious this may lead to inferior
transmission performance.
To get rid of this misguiding effects of RTT measurement error, we need to know the
source of the error. Looking the Fig. 16 again, we observed burst of data packets in
four, with an ACK for every fourth packet. The problem is the fourth packet may
’see’ the queuing delay of the first three packets. In other words, the sampled RTT
values for each packet in the packet train is different. The later sent packet may
observe more queuing delay because of the previous sent packets (this is self-induced
delay). To confirm this reasoning, we plot the RTT of packets with different groups of
sequence numbers in Fig. 18b. We simply divide RTT values of packets with different
Page 42
33
50 55 60 65 70 75 80 85 90Time (s)
40
45
50
55
60
65
70
75
80
Smoo
thed
RTT
Smoothed RTT vs. Time NO DELAYDELAY BY 4
(a) RTT estimation error
50 60 70 80 90 100Time (s)
43
44
45
46
47
48
49
RTT
(ms)
RTT vs. Time
MOD1 43.488msMOD2 45.168msMOD3 46.848msMOD0 48.528ms
(b) RTT difference
Figure 18: Problem of RTT measurement
sequence number into four groups. We mod their packet sequence number with four
and therefore have four groups: 0, 1, 2, 3. And as we can see in the Fig. 18b, different
groups of packets have different measured RTT values. And the difference between
values of different groups is the same. It is clear that if we only sample the RTT with
the packets of group # 0, we get higher RTT estimation.
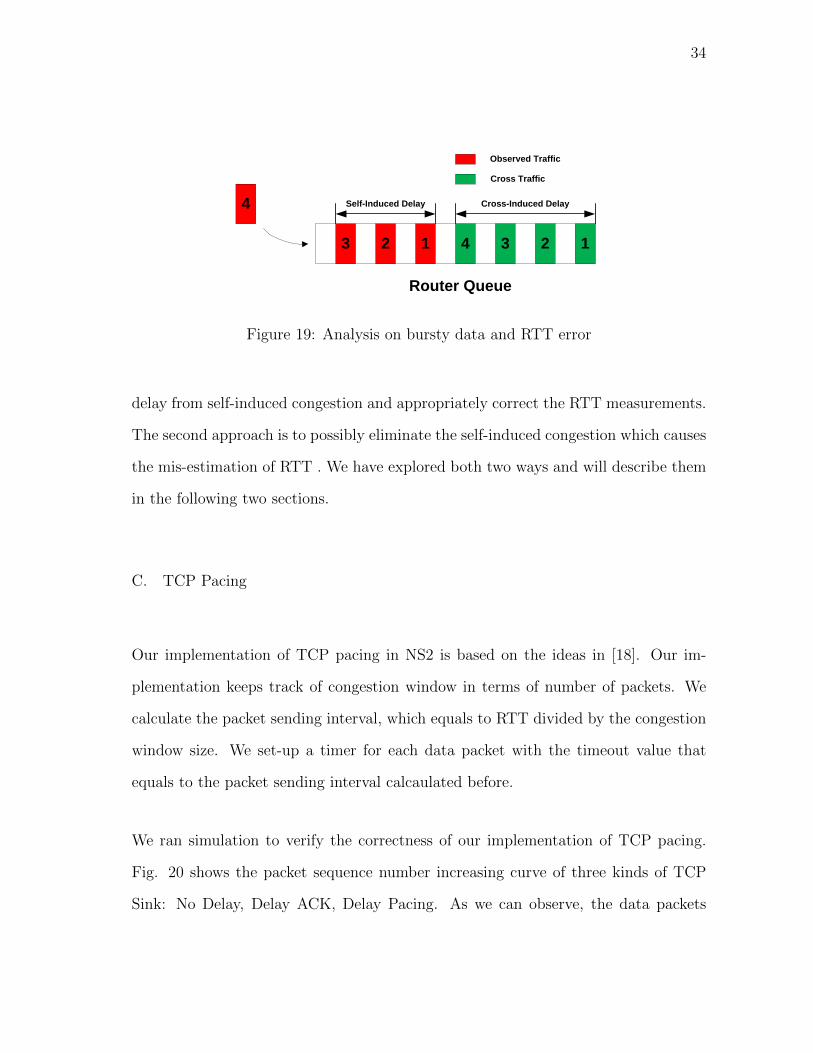
Based on the observation and analysis of this RTT measurement issue. As showed
in Fig. 19, we understand that measured rtt = actual rtt + self induced delay +
cross induced delay. Considering the fundamental of PERT’s congestion detecting
mechanism, we simply expect to get rid of this self-induced delay and leave the cross
traffic delay alone. In this case, PERT can still detect and responses early to the
congestion that results from cross traffic, but won’t be affected by the self induced
delay, which is being caused by burstiness resulting from ACK coalescing. There are
two possible solutions to correct this problem. The first approach is to estimate the
Page 43
34
1234123
4
Router Queue
Self-Induced Delay Cross-Induced Delay
Observed Traffic
Cross Traffic
Figure 19: Analysis on bursty data and RTT error
delay from self-induced congestion and appropriately correct the RTT measurements.
The second approach is to possibly eliminate the self-induced congestion which causes
the mis-estimation of RTT . We have explored both two ways and will describe them
in the following two sections.
C. TCP Pacing
Our implementation of TCP pacing in NS2 is based on the ideas in [18]. Our im-
plementation keeps track of congestion window in terms of number of packets. We
calculate the packet sending interval, which equals to RTT divided by the congestion
window size. We set-up a timer for each data packet with the timeout value that
equals to the packet sending interval calcaulated before.
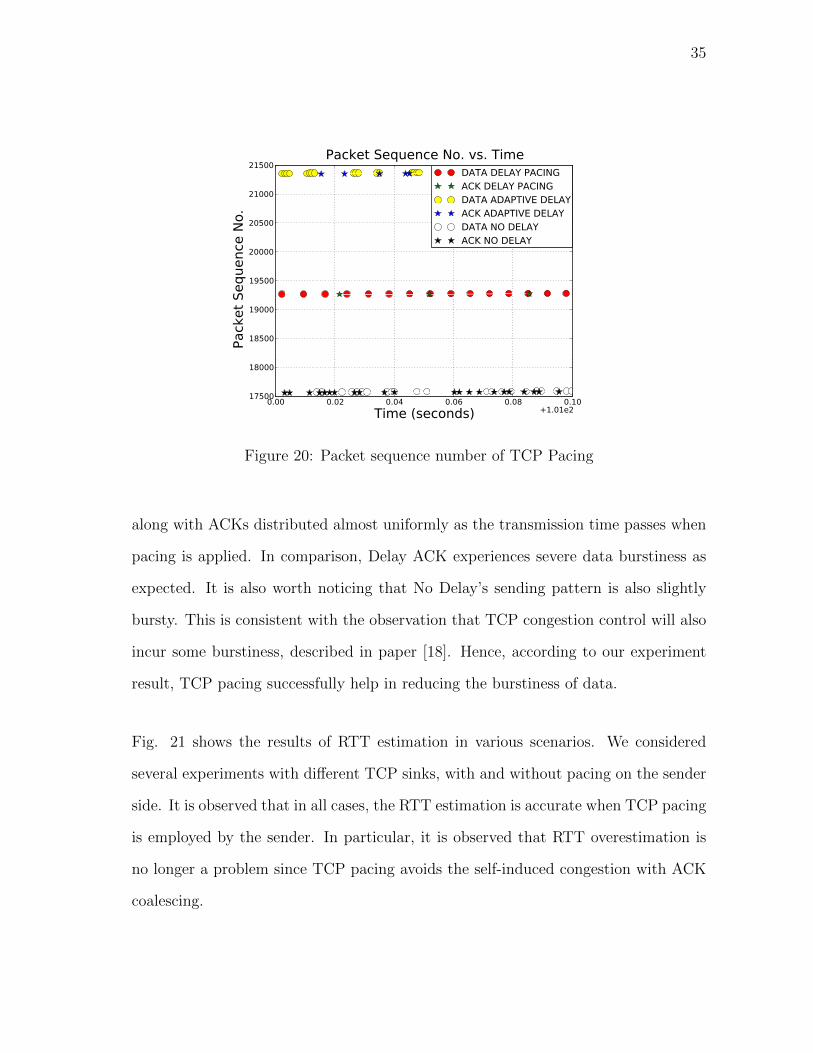
We ran simulation to verify the correctness of our implementation of TCP pacing.
Fig. 20 shows the packet sequence number increasing curve of three kinds of TCP
Sink: No Delay, Delay ACK, Delay Pacing. As we can observe, the data packets
Page 44
35
0.00 0.02 0.04 0.06 0.08 0.10Time (seconds) +1.01e2
17500
18000
18500
19000
19500
20000
20500
21000
21500
Pack
et S
eque
nce
No.
Packet Sequence No. vs. TimeDATA DELAY PACINGACK DELAY PACINGDATA ADAPTIVE DELAYACK ADAPTIVE DELAYDATA NO DELAYACK NO DELAY
Figure 20: Packet sequence number of TCP Pacing
along with ACKs distributed almost uniformly as the transmission time passes when
pacing is applied. In comparison, Delay ACK experiences severe data burstiness as
expected. It is also worth noticing that No Delay’s sending pattern is also slightly
bursty. This is consistent with the observation that TCP congestion control will also
incur some burstiness, described in paper [18]. Hence, according to our experiment
result, TCP pacing successfully help in reducing the burstiness of data.
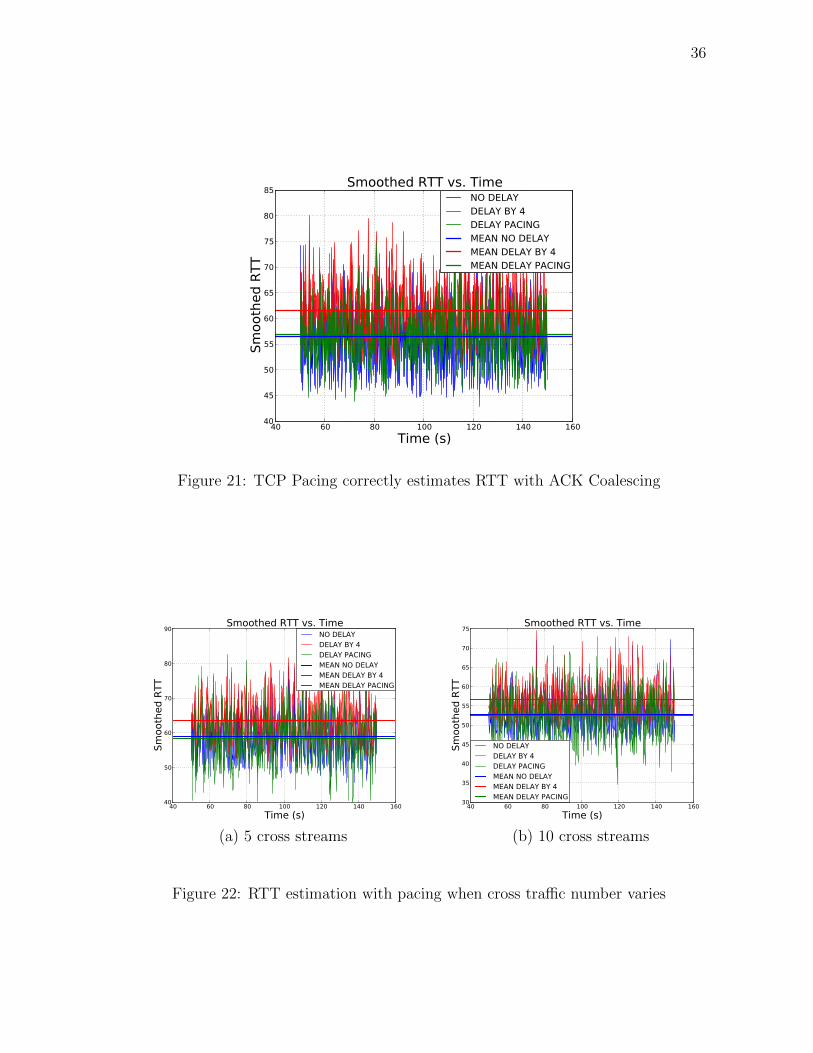
Fig. 21 shows the results of RTT estimation in various scenarios. We considered
several experiments with different TCP sinks, with and without pacing on the sender
side. It is observed that in all cases, the RTT estimation is accurate when TCP pacing
is employed by the sender. In particular, it is observed that RTT overestimation is
no longer a problem since TCP pacing avoids the self-induced congestion with ACK
coalescing.
Page 45
36
40 60 80 100 120 140 160Time (s)
40
45
50
55
60
65
70
75
80
85
Smoo
thed
RTT
Smoothed RTT vs. Time NO DELAYDELAY BY 4DELAY PACINGMEAN NO DELAYMEAN DELAY BY 4MEAN DELAY PACING
Figure 21: TCP Pacing correctly estimates RTT with ACK Coalescing
40 60 80 100 120 140 160Time (s)
40
50
60
70
80
90
Smoo
thed
RTT
Smoothed RTT vs. Time NO DELAYDELAY BY 4DELAY PACINGMEAN NO DELAYMEAN DELAY BY 4MEAN DELAY PACING
(a) 5 cross streams
40 60 80 100 120 140 160Time (s)
30
35
40
45
50
55
60
65
70
75
Smoo
thed
RTT
Smoothed RTT vs. Time
NO DELAYDELAY BY 4DELAY PACINGMEAN NO DELAYMEAN DELAY BY 4MEAN DELAY PACING
(b) 10 cross streams
Figure 22: RTT estimation with pacing when cross traffic number varies
Page 46
37
40 60 80 100 120 140 160Time (s)
35
40
45
50
55
60
65
70
75
Smoo
thed
RTT
Smoothed RTT vs. Time
NO DELAYDELAY BY 4DELAY PACINGMEAN NO DELAYMEAN DELAY BY 4MEAN DELAY PACING
(a) packet size 500 bytes
40 60 80 100 120 140 160Time (s)
40
50
60
70
80
90
100
Smoo
thed
RTT
Smoothed RTT vs. Time NO DELAYDELAY BY 4DELAY PACINGMEAN NO DELAYMEAN DELAY BY 4MEAN DELAY PACING
(b) packet size 1500 bytes
Figure 23: RTT estimation with pacing when cross traffic packet size varies
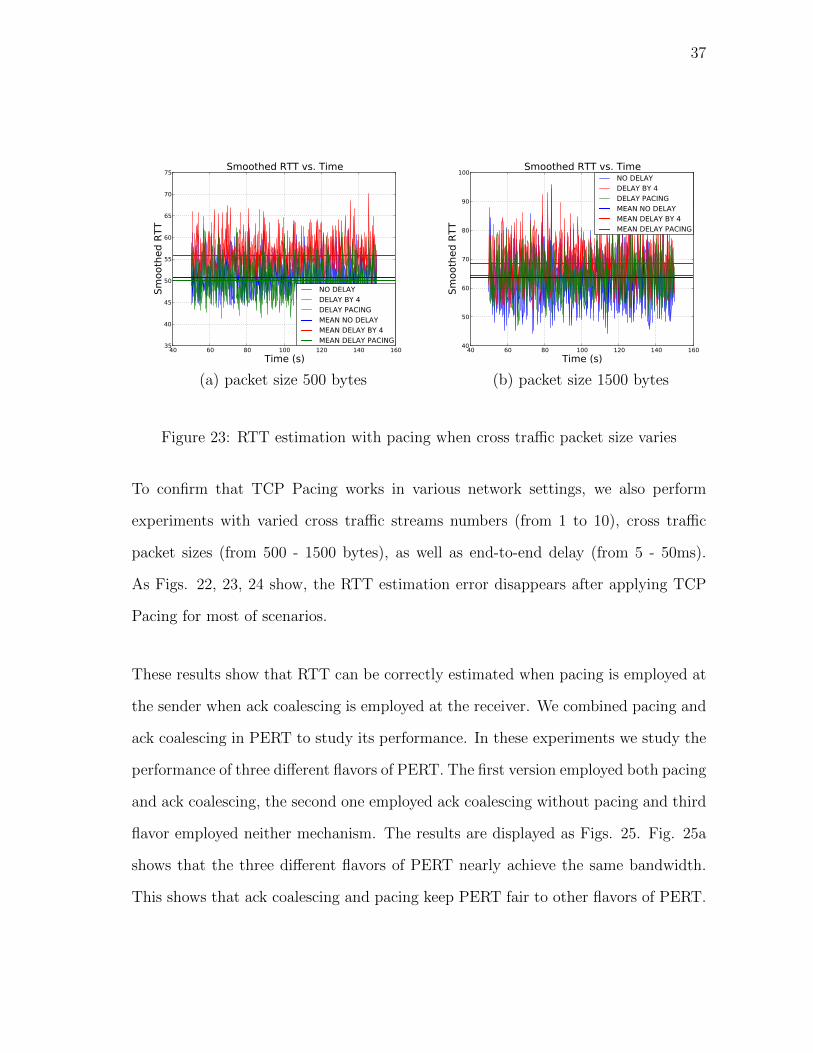
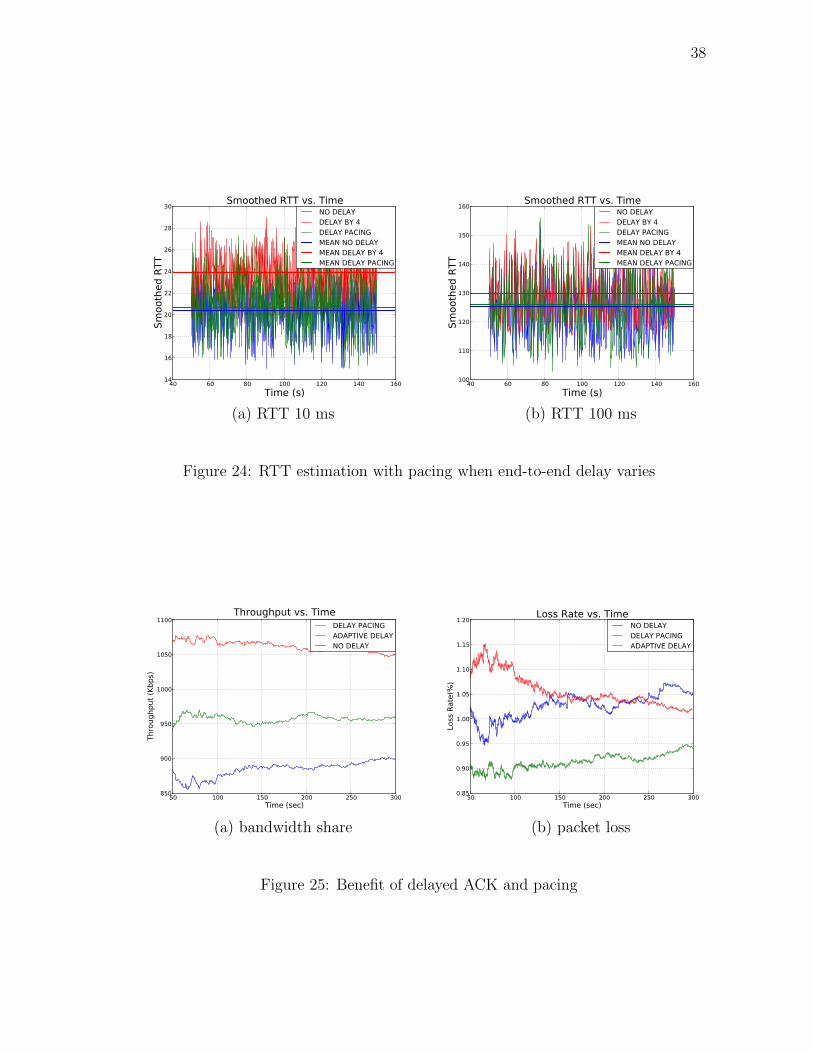
To confirm that TCP Pacing works in various network settings, we also perform
experiments with varied cross traffic streams numbers (from 1 to 10), cross traffic
packet sizes (from 500 - 1500 bytes), as well as end-to-end delay (from 5 - 50ms).
As Figs. 22, 23, 24 show, the RTT estimation error disappears after applying TCP
Pacing for most of scenarios.
These results show that RTT can be correctly estimated when pacing is employed at
the sender when ack coalescing is employed at the receiver. We combined pacing and
ack coalescing in PERT to study its performance. In these experiments we study the
performance of three different flavors of PERT. The first version employed both pacing
and ack coalescing, the second one employed ack coalescing without pacing and third
flavor employed neither mechanism. The results are displayed as Figs. 25. Fig. 25a
shows that the three different flavors of PERT nearly achieve the same bandwidth.
This shows that ack coalescing and pacing keep PERT fair to other flavors of PERT.
Page 47
38
40 60 80 100 120 140 160Time (s)
14
16
18
20
22
24
26
28
30
Smoo
thed
RTT
Smoothed RTT vs. Time NO DELAYDELAY BY 4DELAY PACINGMEAN NO DELAYMEAN DELAY BY 4MEAN DELAY PACING
(a) RTT 10 ms
40 60 80 100 120 140 160Time (s)
100
110
120
130
140
150
160
Smoo
thed
RTT
Smoothed RTT vs. Time NO DELAYDELAY BY 4DELAY PACINGMEAN NO DELAYMEAN DELAY BY 4MEAN DELAY PACING
(b) RTT 100 ms
Figure 24: RTT estimation with pacing when end-to-end delay varies
50 100 150 200 250 300Time (sec)
850
900
950
1000
1050
1100
Thro
ughp
ut (K
bps)
Throughput vs. TimeDELAY PACINGADAPTIVE DELAYNO DELAY
(a) bandwidth share
50 100 150 200 250 300Time (sec)
0.85
0.90
0.95
1.00
1.05
1.10
1.15
1.20
Loss
Rat
e(%
)
Loss Rate vs. TimeNO DELAYDELAY PACINGADAPTIVE DELAY
(b) packet loss
Figure 25: Benefit of delayed ACK and pacing
Page 48
39
Fig. 25b shows that PERT with pacing and ACK coalescing has lower packet loss
rate than the other two flavors of PERT. Pacing helps the data sending pattern to
become less bursty and this allows packets to experience a smaller loss rate at the
buffers. These results show that PERT with pacing and ACK coalescing can attain
fair bandwidth at a lower loss rate. We explore the performance of PERT with these
two mechanisms further in different network settings.
10 20 30 40 50 60 70 80 90 100Number of Flows
55
60
65
70
75
Band
wid
th S
hare
(%)
Bandwidth Share vs. Number of FlowsDELAY PACINGADAPTIVE DELAY
(a) bandwidth share
10 20 30 40 50 60 70 80 90 100Number of Flows
0.465
0.470
0.475
0.480
0.485
0.490
0.495
0.500
0.505
0.510
Pack
et D
rop
Ratio
Packet Drop Ratio vs. Number of FlowsDELAY PACINGADAPTIVE DELAY
(b) packet drop ratio
10 20 30 40 50 60 70 80 90 100Number of Flows
75
80
85
90
95
100
Jain
Fai
rnes
s In
dex
(%)
Jain Fairness Index vs. Number of FlowsDELAY PACINGADAPTIVE DELAY
(c) Jain fairness index
10 20 30 40 50 60 70 80 90 100Number of Flows
0.4
0.5
0.6
0.7
0.8
0.9
1.0
Norm
aliz
ed Q
ueue
Len
gth
Normalized Queue Length vs. Number of FlowsDELAY PACINGADAPTIVE DELAY
(d) normalized queue length
Figure 26: Fairness of delayed ACK and pacing when number of both pacing and
non-pacing (50%-50%) flows increases
Page 49
40
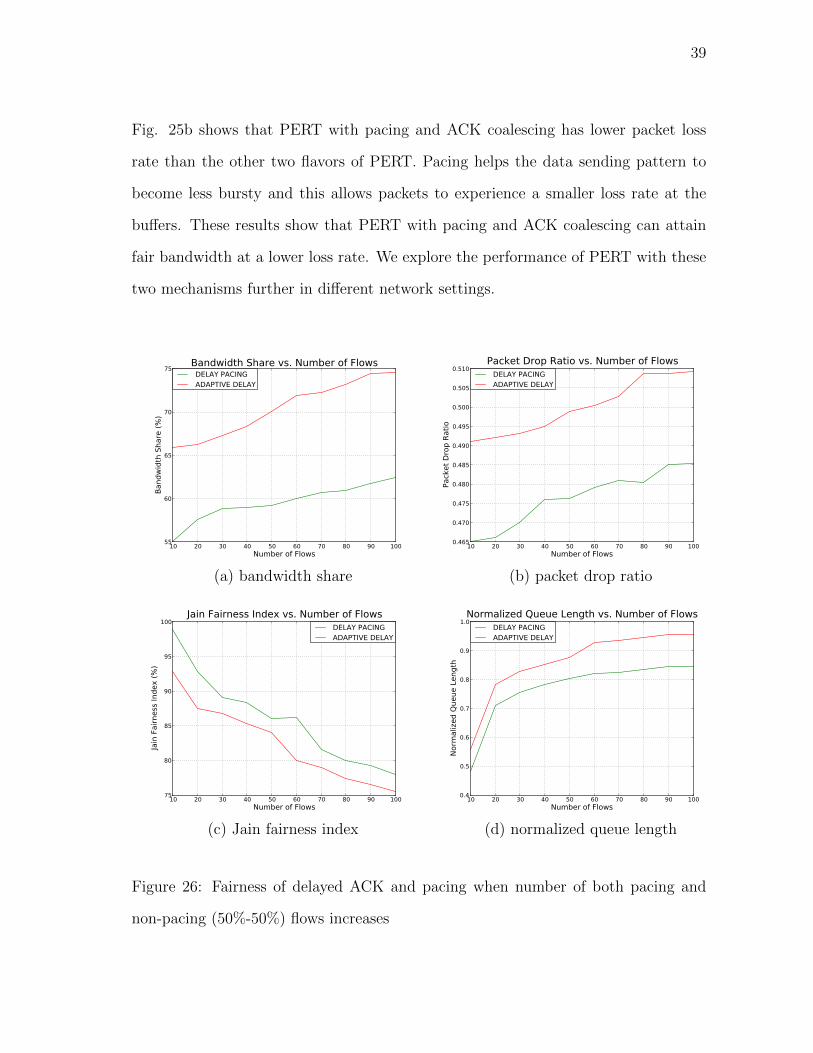
Next, we further explore the fairness and potential benefits brought by Delay ACK.
First we change the number of total flows from 10 to 100 with Delay Pacing and
Delay ACK in proportion of 50% and 50%, and plot four kinds of important fairness
metrics in Fig. 26. Our results show that as the flow number increases, the fairness
of both Delay Pacing and Delay ACK decreases in the aspects of bandwidth share,
packets drop ratio, Jain fairness index as well as normalized queue length. Delay
Pacing always show better fairness than Delay ACK (without TCP pacing). TCP
pacing helps to improve the fairness by avoiding congestion on the router.
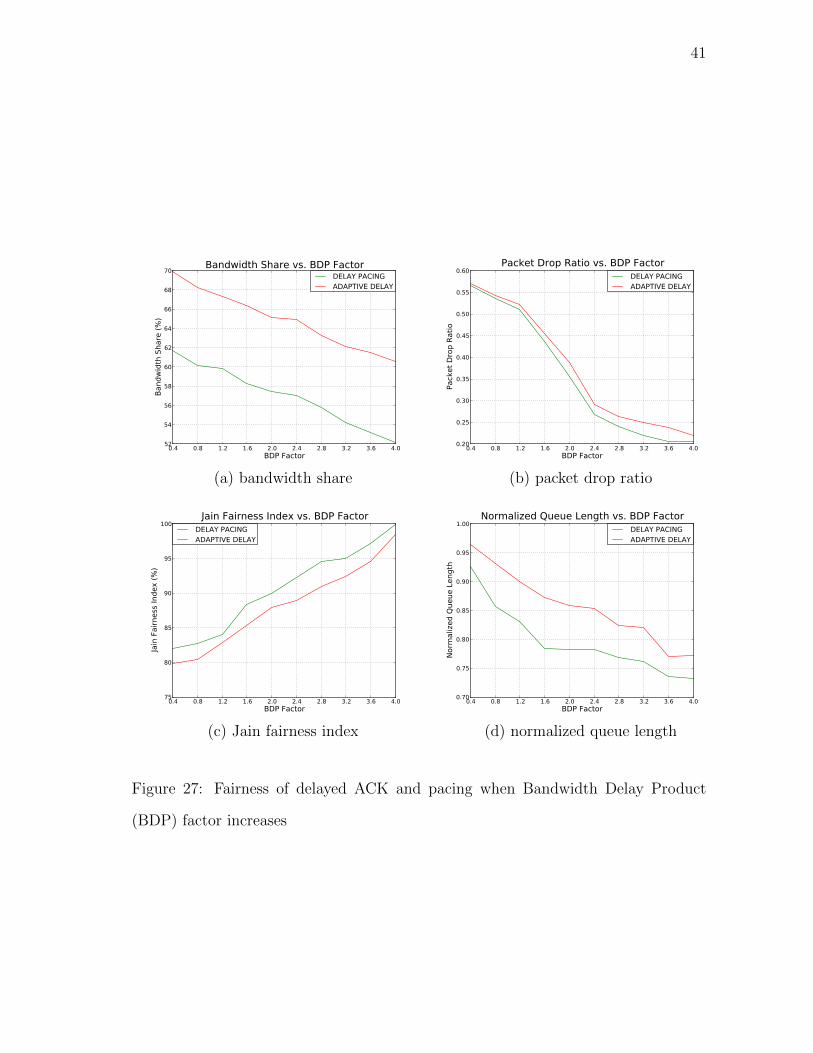
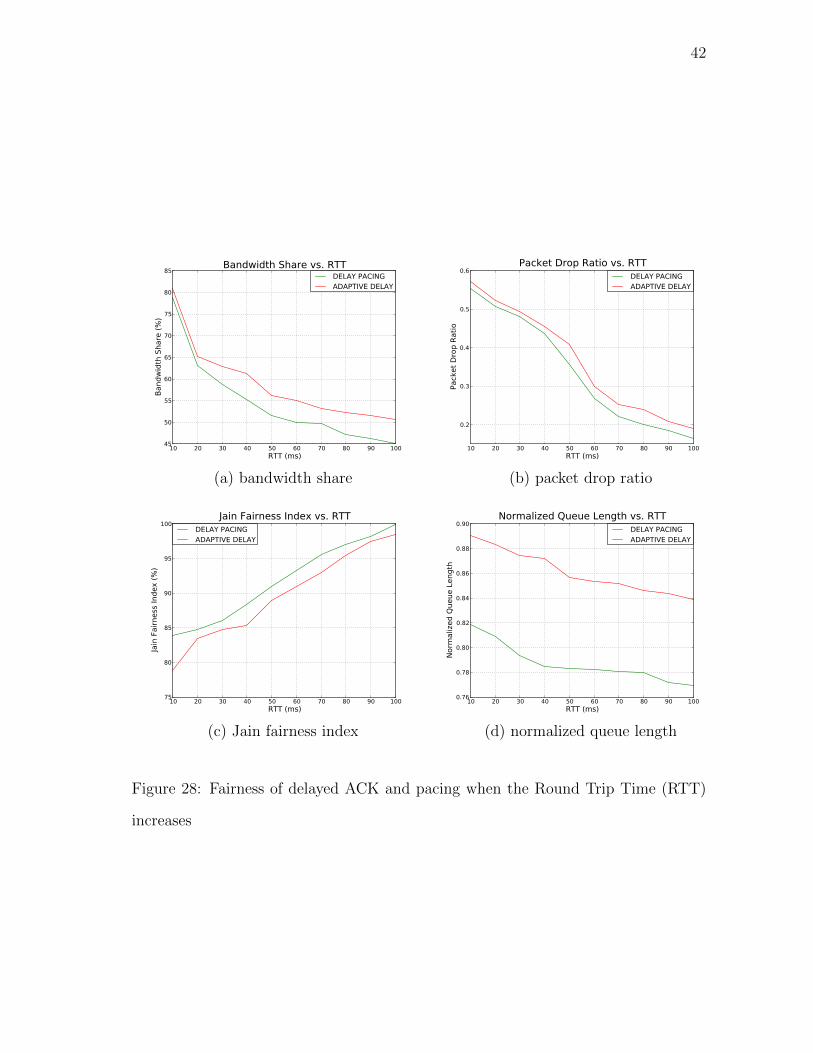
To confirm our observation on the improved fairness of Delay Pacing, we change
the percentage of Delay ACK flows (from 10% to 100%), BDP (Bandwidth Delay
Product) Factor (from 0.4 to 4.0), Round Trip Time (from 10 to 100ms), as well as
number of cross traffic (HTTP) flows (from 100 to 1000), as Figs. 27, 28 show. Then
we are safe to claim in almost cases, Delay Pacing has better fairness than Delay ACK
(without pacing). This is to say, in most cases Delay Pacing has better performance
when multiple network flows are competing for limited bottleneck bandwidth.
Page 50
41
0.4 0.8 1.2 1.6 2.0 2.4 2.8 3.2 3.6 4.0BDP Factor
52
54
56
58
60
62
64
66
68
70
Band
wid
th S
hare
(%)
Bandwidth Share vs. BDP FactorDELAY PACINGADAPTIVE DELAY
(a) bandwidth share
0.4 0.8 1.2 1.6 2.0 2.4 2.8 3.2 3.6 4.0BDP Factor
0.20
0.25
0.30
0.35
0.40
0.45
0.50
0.55
0.60
Pack
et D
rop
Ratio
Packet Drop Ratio vs. BDP FactorDELAY PACINGADAPTIVE DELAY
(b) packet drop ratio
0.4 0.8 1.2 1.6 2.0 2.4 2.8 3.2 3.6 4.0BDP Factor
75
80
85
90
95
100
Jain
Fai
rnes
s In
dex
(%)
Jain Fairness Index vs. BDP FactorDELAY PACINGADAPTIVE DELAY
(c) Jain fairness index
0.4 0.8 1.2 1.6 2.0 2.4 2.8 3.2 3.6 4.0BDP Factor
0.70
0.75
0.80
0.85
0.90
0.95
1.00
Norm
aliz
ed Q
ueue
Len
gth
Normalized Queue Length vs. BDP FactorDELAY PACINGADAPTIVE DELAY
(d) normalized queue length
Figure 27: Fairness of delayed ACK and pacing when Bandwidth Delay Product
(BDP) factor increases
Page 51
42
10 20 30 40 50 60 70 80 90 100RTT (ms)
45
50
55
60
65
70
75
80
85
Band
wid
th S
hare
(%)
Bandwidth Share vs. RTTDELAY PACINGADAPTIVE DELAY
(a) bandwidth share
10 20 30 40 50 60 70 80 90 100RTT (ms)
0.2
0.3
0.4
0.5
0.6
Pack
et D
rop
Ratio
Packet Drop Ratio vs. RTTDELAY PACINGADAPTIVE DELAY
(b) packet drop ratio
10 20 30 40 50 60 70 80 90 100RTT (ms)
75
80
85
90
95
100
Jain
Fai
rnes
s In
dex
(%)
Jain Fairness Index vs. RTTDELAY PACINGADAPTIVE DELAY
(c) Jain fairness index
10 20 30 40 50 60 70 80 90 100RTT (ms)
0.76
0.78
0.80
0.82
0.84
0.86
0.88
0.90
Norm
aliz
ed Q
ueue
Len
gth
Normalized Queue Length vs. RTTDELAY PACINGADAPTIVE DELAY
(d) normalized queue length
Figure 28: Fairness of delayed ACK and pacing when the Round Trip Time (RTT)
increases
Page 52
43
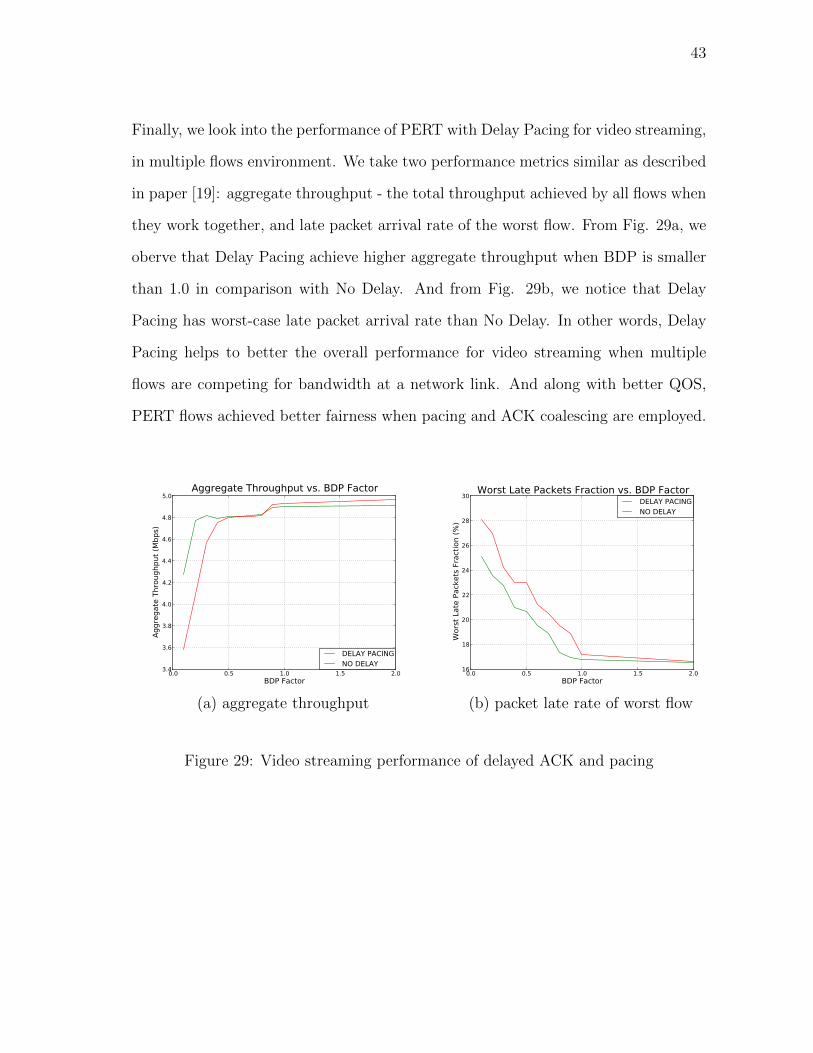
Finally, we look into the performance of PERT with Delay Pacing for video streaming,
in multiple flows environment. We take two performance metrics similar as described
in paper [19]: aggregate throughput - the total throughput achieved by all flows when
they work together, and late packet arrival rate of the worst flow. From Fig. 29a, we
oberve that Delay Pacing achieve higher aggregate throughput when BDP is smaller
than 1.0 in comparison with No Delay. And from Fig. 29b, we notice that Delay
Pacing has worst-case late packet arrival rate than No Delay. In other words, Delay
Pacing helps to better the overall performance for video streaming when multiple
flows are competing for bandwidth at a network link. And along with better QOS,
PERT flows achieved better fairness when pacing and ACK coalescing are employed.
0.0 0.5 1.0 1.5 2.0BDP Factor
3.4
3.6
3.8
4.0
4.2
4.4
4.6
4.8
5.0
Aggr
egat
e Th
roug
hput
(Mbp
s)
Aggregate Throughput vs. BDP Factor
DELAY PACINGNO DELAY
(a) aggregate throughput
0.0 0.5 1.0 1.5 2.0BDP Factor
16
18
20
22
24
26
28
30
Wor
st L
ate
Pack
ets
Frac
tion
(%)
Worst Late Packets Fraction vs. BDP FactorDELAY PACINGNO DELAY
(b) packet late rate of worst flow
Figure 29: Video streaming performance of delayed ACK and pacing
Page 53
44
CHAPTER V
ESTIMATING THE RTT ERROR DUE TO SELF-INDUCED CONGESTION
A. Approach
We consider a second solution for RTT estimation error brought by burstiness of
data. 1. The basic idea is to estimate the self-induced delay and subtract it from the
observed RTT value, in order to obtain a correct RTT estimate.
Before we can describe describe our approach, we introduce some notation. First we
model the burst of data as a packet train, and define the average time to finish a
packet transmission in a packet train as average packet dispersion. Let D denote the
average packet dispersion and k denote the number of packets in a packet train. We
draw the timeline of the transmission of a packet train with packet sequence number
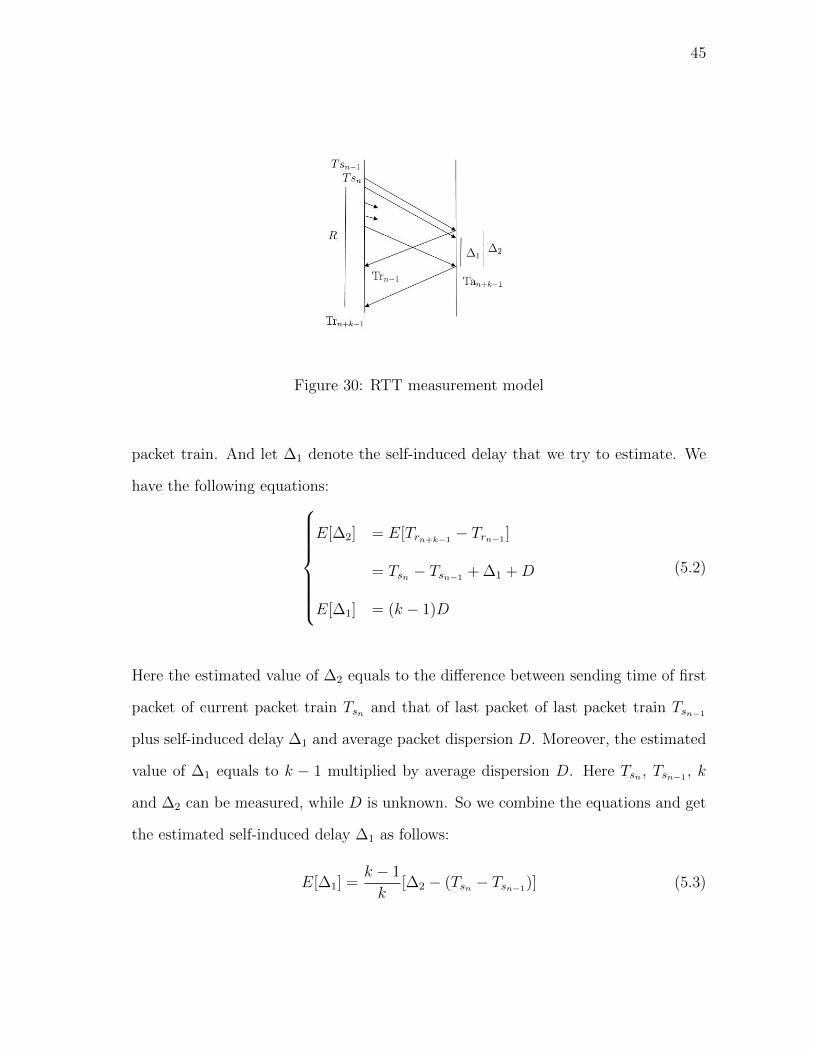
from n to n + k − 1, as Fig. 30 shows. We define Ts as the sending time of data
packets, and Tr as the receiving time of ACK packets. Then we can see that Tsn is
the sending time of (more precisely the first packet in) our packet train, and Trn+k−1
is the receiving time of the ACK of our packet train. Hence we have the total delivery
time of our packet train:
R = Trn+k−1− Tsn (5.1)
Let ∆2 denote the difference between the receiving time of ACK for current and last
1joint work with Ankit Singh
Page 54
45
Figure 30: RTT measurement model
packet train. And let ∆1 denote the self-induced delay that we try to estimate. We
have the following equations:E[∆2] = E[Trn+k−1
− Trn−1 ]
= Tsn − Tsn−1 + ∆1 +D
E[∆1] = (k − 1)D
(5.2)
Here the estimated value of ∆2 equals to the difference between sending time of first
packet of current packet train Tsn and that of last packet of last packet train Tsn−1
plus self-induced delay ∆1 and average packet dispersion D. Moreover, the estimated
value of ∆1 equals to k − 1 multiplied by average dispersion D. Here Tsn , Tsn−1 , k
and ∆2 can be measured, while D is unknown. So we combine the equations and get
the estimated self-induced delay ∆1 as follows:
E[∆1] =k − 1
k[∆2 − (Tsn − Tsn−1)] (5.3)
Page 55
46
50 55 60 65 70 75 80 85 90Time (s)
50
52
54
56
58
60
62
Smoo
thed
RTT
Smoothed RTT vs. Time
NO DELAYDELAY BY 4
Figure 31: Fixed RTT measurement
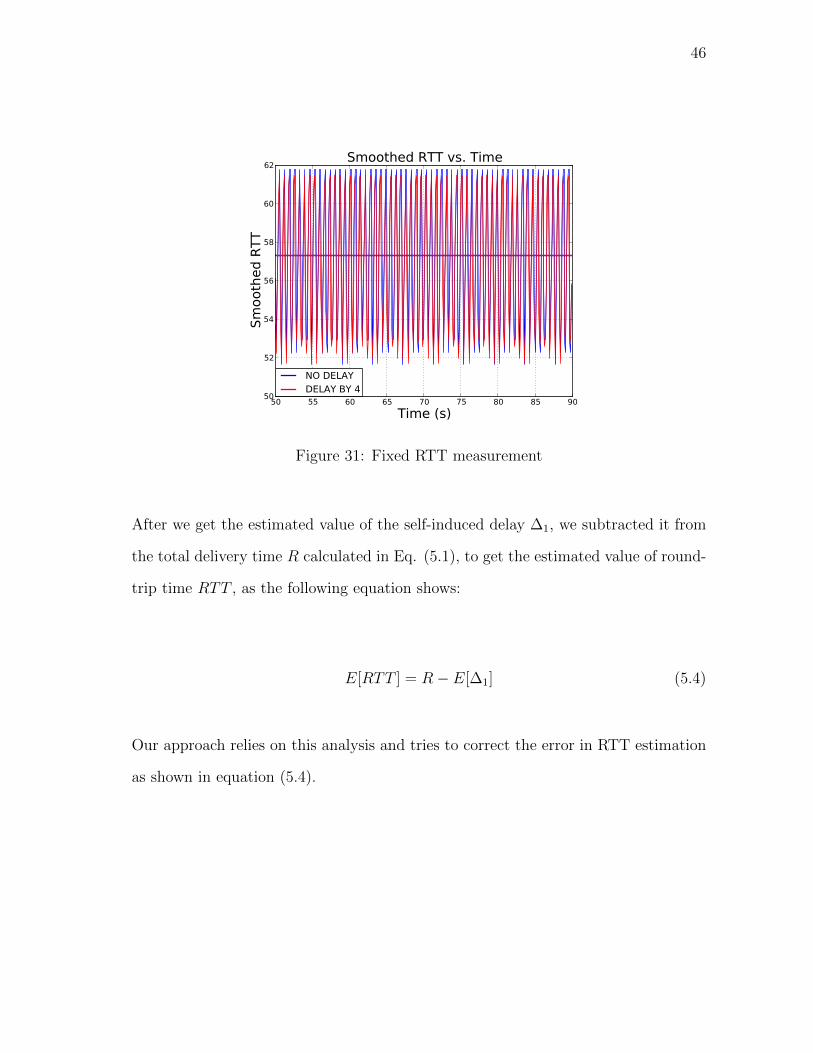
After we get the estimated value of the self-induced delay ∆1, we subtracted it from
the total delivery time R calculated in Eq. (5.1), to get the estimated value of round-
trip time RTT , as the following equation shows:
E[RTT ] = R− E[∆1] (5.4)
Our approach relies on this analysis and tries to correct the error in RTT estimation
as shown in equation (5.4).
Page 56
47
50 55 60 65 70 75 80 85 90Time (s)
50
55
60
65
70
75
80
85
90
Smoo
thed
RTT
Smoothed RTT vs. Time NO DELAYDELAY BY 4
(a) 5 cross streams
50 55 60 65 70 75 80 85 90Time (s)
60
65
70
75
80
85
Smoo
thed
RTT
Smoothed RTT vs. Time NO DELAYDELAY BY 4
(b) 10 cross streams
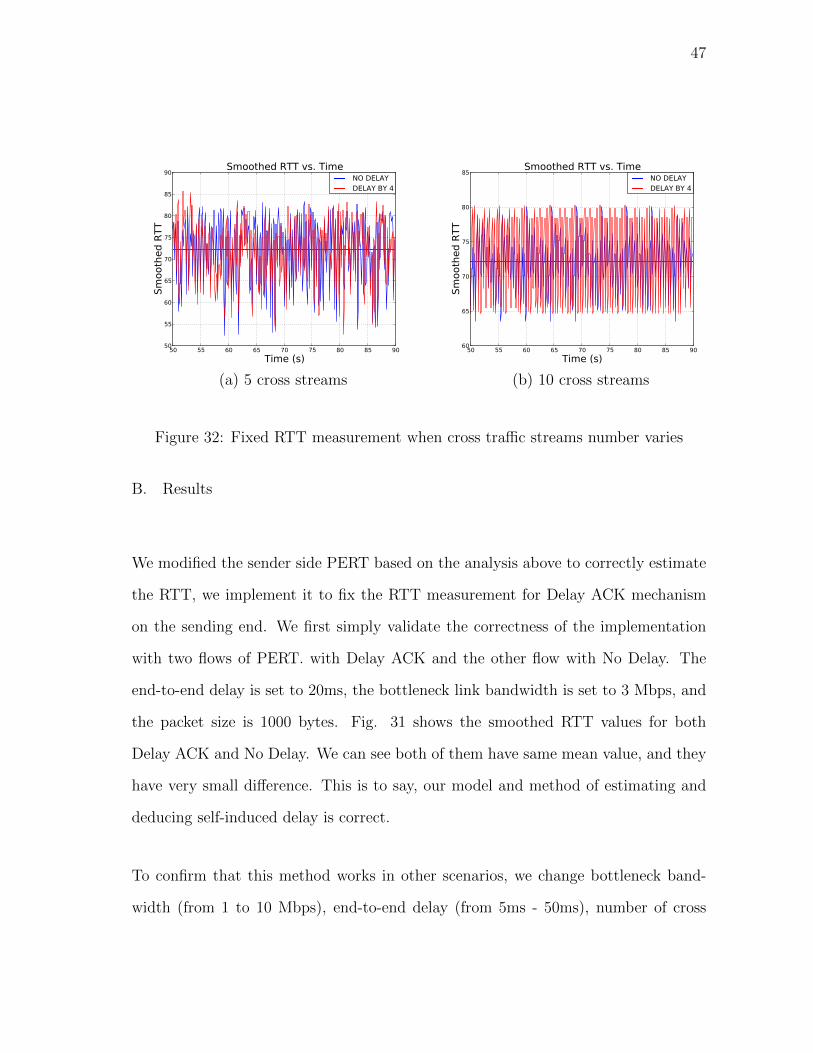
Figure 32: Fixed RTT measurement when cross traffic streams number varies
B. Results
We modified the sender side PERT based on the analysis above to correctly estimate
the RTT, we implement it to fix the RTT measurement for Delay ACK mechanism
on the sending end. We first simply validate the correctness of the implementation
with two flows of PERT. with Delay ACK and the other flow with No Delay. The
end-to-end delay is set to 20ms, the bottleneck link bandwidth is set to 3 Mbps, and
the packet size is 1000 bytes. Fig. 31 shows the smoothed RTT values for both
Delay ACK and No Delay. We can see both of them have same mean value, and they
have very small difference. This is to say, our model and method of estimating and
deducing self-induced delay is correct.
To confirm that this method works in other scenarios, we change bottleneck band-
width (from 1 to 10 Mbps), end-to-end delay (from 5ms - 50ms), number of cross
Page 57
48
50 55 60 65 70 75 80 85 90Time (s)
15
16
17
18
19
20
21
22
Smoo
thed
RTT
Smoothed RTT vs. Time
NO DELAYDELAY BY 4
(a) RTT 10 ms
50 55 60 65 70 75 80 85 90Time (s)
108
110
112
114
116
118
120
Smoo
thed
RTT
Smoothed RTT vs. Time
NO DELAYDELAY BY 4
(b) RTT 100 ms
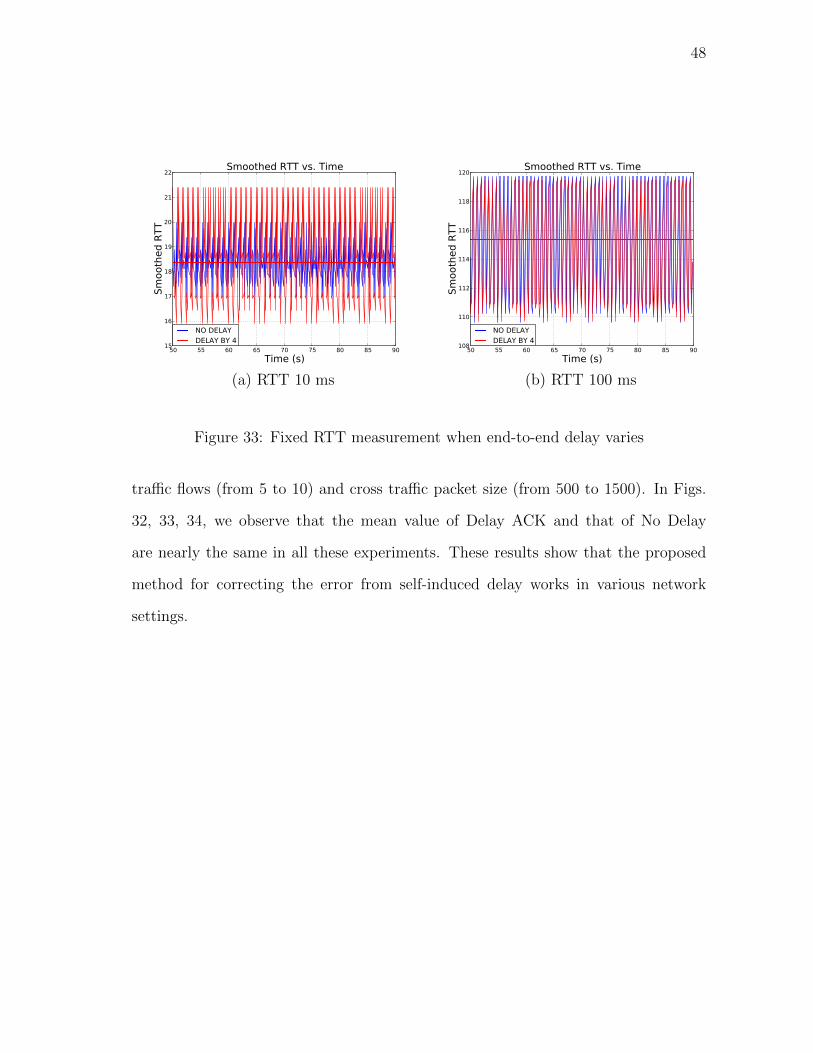
Figure 33: Fixed RTT measurement when end-to-end delay varies
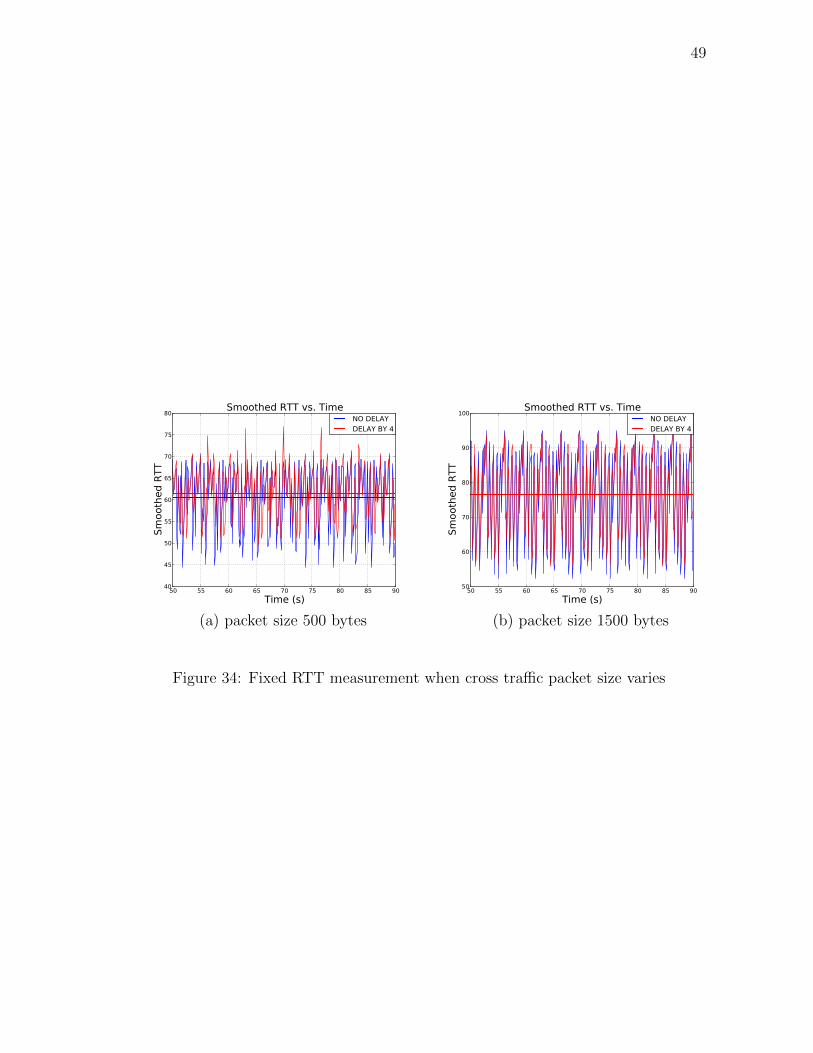
traffic flows (from 5 to 10) and cross traffic packet size (from 500 to 1500). In Figs.
32, 33, 34, we observe that the mean value of Delay ACK and that of No Delay
are nearly the same in all these experiments. These results show that the proposed
method for correcting the error from self-induced delay works in various network
settings.
Page 58
49
50 55 60 65 70 75 80 85 90Time (s)
40
45
50
55
60
65
70
75
80
Smoo
thed
RTT
Smoothed RTT vs. Time NO DELAYDELAY BY 4
(a) packet size 500 bytes
50 55 60 65 70 75 80 85 90Time (s)
50
60
70
80
90
100
Smoo
thed
RTT
Smoothed RTT vs. Time NO DELAYDELAY BY 4
(b) packet size 1500 bytes
Figure 34: Fixed RTT measurement when cross traffic packet size varies
Page 59
50
CHAPTER VI
CONCLUSION AND FUTURE WORK
In this thesis, we have demonstrated the performance of PERT for on-demand video
streaming. Our NS-2 simulation experiments are performed in a heterogeneous en-
vironment, where the background traffic is delivered by RENO. PERT outperforms
RENO and CUBIC in successfully delivering video in constrained streaming scenar-
ios we considered here. Moreover, the real-life video streaming test confirms PERT’s
ability to improve video playback quality when comparing to RENO and CUBIC.
Also, we extended PERT with to work with ACK coalescing to improve PERT’s per-
formance in high-speed and wireless networks. We identified that ACK coalescing
causes data to be sent in bursts or packet trains and these bursts result in overesti-
mating RTT due to self-induced congestion. We proposed two solutions to correctly
estimate RTT in the presence of ACK coalescing. The first method employed pac-
ing at the sender side and the second method estimated the error caused by the
self-induced congestion and appropriately corrected RTT estimations. We showed
through experiments that both these techniques correctly estimate RTT and allowed
PERT to function well with ACK coalescing. In addition, pacing is shown to improve
the observed loss rate and hence delivered video performance. These enhancements
allow PERT’s suitability to a wider set of network scenarios.
In the future, we will implement PERT with Delay ACK and Pacing in Linux
kernel and measure its processing overhead. The processing overhead is especially
Page 60
51
important in high speed networks. ACK coalescing is expected to relieve the sender
by reducing the number of interrupts processed per Mbyte. However pacing requires
timers which results in higher overheads. We will study if the resulting overall over-
head is lower than normal PERT that doesn’t employ both these mechanisms. Fur-
ther, our efforts will be devoted to carry out more evaluations on PERT with Delay
ACK and Pacing, in comparison against other protocols, especially for video stream-
ing.
Page 61
52
REFERENCES
[1] Cisco Visual Networking Index: Forecast and Methodology, 2009-2014, www.cis-
co.com, June 2010.
[2] S. Floyd, M. Handley, J. Pahdye, and J. Widmer, ”RFC 5348: TCP Friendly
Rate Control (TFRC): Protocol Specification,” RFC 5348, Proposed Standard,
September 2008.
[3] J. Feng, L. Xu, ”Throughput-Smoothness Tradeoff in Preventing Competing TCP
from Starvation,” Proc. of the 17th International Workshop on Quality of Service,
July 2009.
[4] B. Wang, J. Kurose, P. Shenoy and D. Towsley, ”Multimedia Streaming via TCP:
An Analytic Performance Study,” Proc. of ACM Multimedia (Multimedia 2004),
October 2004.
[5] S. A. Baset, E. Brosh, V. Misra, D. Rubenstein, and H. Schulzrinne, ”Understand-
ing The Behavior of TCP for Real-Time CBR Workloads,” Proc. of International
Conference On Emerging Networking Experiments And Technologies archive, De-
cember 2006.
[6] L. Stewart, G. Armitage and A. Huebner, ”Collateral Damage: The Impact of
Optimised TCP Variants on Real-Time Traffic Latency in Consumer Broadband
Environments,” IFIP International Federation for information Processing, 2009.
[7] D. D. Clark, ”Window and Acknowledgment strategy in TCP. Internet Draft,”
RFC 813, Proposed Standard, July 1982.
Page 62
53
[8] RFC 793: Transmission Control Protocol. Internet Draft, http://www.ietf.org
/rfc/rfc793.txt, September 1981.
[9] Requirements for Internet Hosts Communication Layers. Internet Draft, http:
//www.ietf.org/rfc/rfc1122.txt, October 1989.
[10] M. Allman, ”On The Generation and Use of TCP Acknowledgments,” Proc. of
SIGCOMM Computer Communication Review, 28(5):4-21, 1998.
[11] RFC 2581: TCP Congestion Control. Internet Draft, http://www.ietf.org/rfc
/rfc2581.txt, April 1999.
[12] E. Altman and T. Jimenez, ”Novel Delayed ACK Techniques for Improving
TCP Performance in Multihop Wireless Networks,” Personal Wireless Commu-
nications, Vol. 2775, SpringerVerlag, Heidelberg, 2003, pp. 237-250.
[13] A. A. Kherani and R. Shorey, ”Performance Improvement of TCP with Delayed
ACKs in IEEE 802.11 Wireless LANs,” Prof. of Wireless Communications and
Networking Conference (WCNC), Vol. 3, pp. 1703-1708, 2004.
[14] S. Xu and T. Saadawi, ”Performance Evaluation of TCP Algorithms in Multi-
Hop Wireless Packet Networks”. Proc. of Wireless Communications and Mobile
Computing, 2(1):85-100, 2002.
[15] Papanastasiou and M. Ould-Khaoua, ”Exploring The Performance of TCP Vegas
in Mobile Ad Hoc Networks,” International Journal of Communication Systems,
17(2):163-177, 2004.
[16] V. Paxson, M. Allman, S. Dawson, W. Fenner, J. Griner, I. Heavens, K. Lahey,J.
Semke, and B. Volz, ”Known TCP Implementation Problems,” Internet Draft,
http//www.ietf.org/rfc/rfc2525.txt, March 1999.
Page 63
54
[17] L. Zhang, S. Shenker, D. D. Clark, ”Observations on The Dynamics of a Con-
gestion Control Algorithm: The Effects of Two-Way Traffic,” Proc. of the ACM
Conf. on Communications Architectures and Protocols, pp. 133-147, 1991.
[18] A. Aggarwal, S. Savage, and T. Anderson, ”Understanding The Performance of
TCP Pacing,” Proc. of the IEEE International Conf. on Computer Communica-
tions, pp. 1157-1165, March 2000.
[19] D. X. Wei, P. Cao, S. H. Low, ”TCP Pacing Revisited,” Proc. of IEEE Inter-
national Conference on Computer Communications, pp. 56-63 , April 2006.
[20] S. Bhandarkar, A. L. Narasimha Reddy, Y. Zhang, and D. Loguinov, ”Emulating
AQM from End Hosts,” Proc. of SIGCOMM Computer Communication Review,
vol. 37, no. 4, pp. 349-360, October 2007.
[21] K. Kotla and A. L. Narasimha Reddy, ”Making a Delay-based Protocol Adaptive
to Heterogeneous Environments,” Proc. of the 16th International Workshop on
Quality of Service (IWQoS 2008), June 2008.
[22] K. Kotla, ”Adapting a Delay-Based Protocol to Heterogeneous Environments,”
Master’s thesis, Texas A&M University, August 2008.
[23] B. Wang, J. Kurose, P. Shenoy and D. Towsley, ”Multimedia Streaming via TCP:
An Analytic Performance Study,” ACM Transactions on Multimedia Computing
Communications and Applications (TOMCCAP), vol. 4, no. 2, pp. 25:1-23, April
2008.
[24] S. Boyden, A. Mahanti and C. Williamson, ”TCP Vegas Performance with
Streaming Media,” Proc. of International Performance Computing and Commu-
nications Conference, pp. 35-44, April 2007.
Page 64
55
[25] The Videolan Project, http://www.videolan.org, June 2011.
[26] L. Rizzo, ”Dummynet: a Simple Approach to The Evaluation of Network Pro-
tocols,” Proc. of ACM Computer Communication Review, pp. 27:31-41, January
1997.
[27] A. Tirumala, L. Cottrell, and T. Dunigan, ”Measuring End-to-End Bandwidth
with Iperf Using Web100,” Proc. of Passive and Active Measurement Workshop,
2003.
Page 65
56
VITA
Bin Qian received his B.E degree in automation from the Zhejiang University (ZJU),
Hangzhou, China in 2007 and his M.S. in computer enginnering from Texas A&M
University, College Station, Texas, in 2011. His research interests are in the areas of
networking congestion protocols and multimeida networking. He has been a recipient
of the Scholarship for Merits Students from the ZJU, Hangzhou, China during 2003-
2006 and Industry Huawei Scholarship sponsored by Huawei Inc., China in 2008. Prior
to arriving at Texas A&M University, he studied in the postgradaute program in the
University of Science and Technology of China during 2007-2009. He can be contacted
at the following address : Department of Electrical and Computer Engineering, Texas
A&M University, 331B WERC, College Station, TX 77843-3118.
The typist for this thesis was Bin Qian.