23
Evaluation of Recovery Technology for the Grosmont Carbonate Reservoir Qi Jiang Jian-Yang Yuan Jen Russel-Houston Bruce Thornton Andrew Squires Osum Oil Sands Corp. CIPC Paper 2009-067

Evaluation of Recovery Technology
for the Grosmont Carbonate Reservoir
Qi Jiang
Jian-Yang YuanJen Russel-Houston
Bruce Thornton
Andrew Squires
Osum Oil Sands Corp.
CIPC Paper 2009-067

Outline
• Geology in Osum!s Saleski area
• CSS Test at Buffalo Creek
• Analog to the McMurray Formation
• Laboratory Tests of Solvent Process
• Commercial Prospective
• Conclusions

Osum’s Saleski/Liege Project Area
Buffalo
Creek Pilot
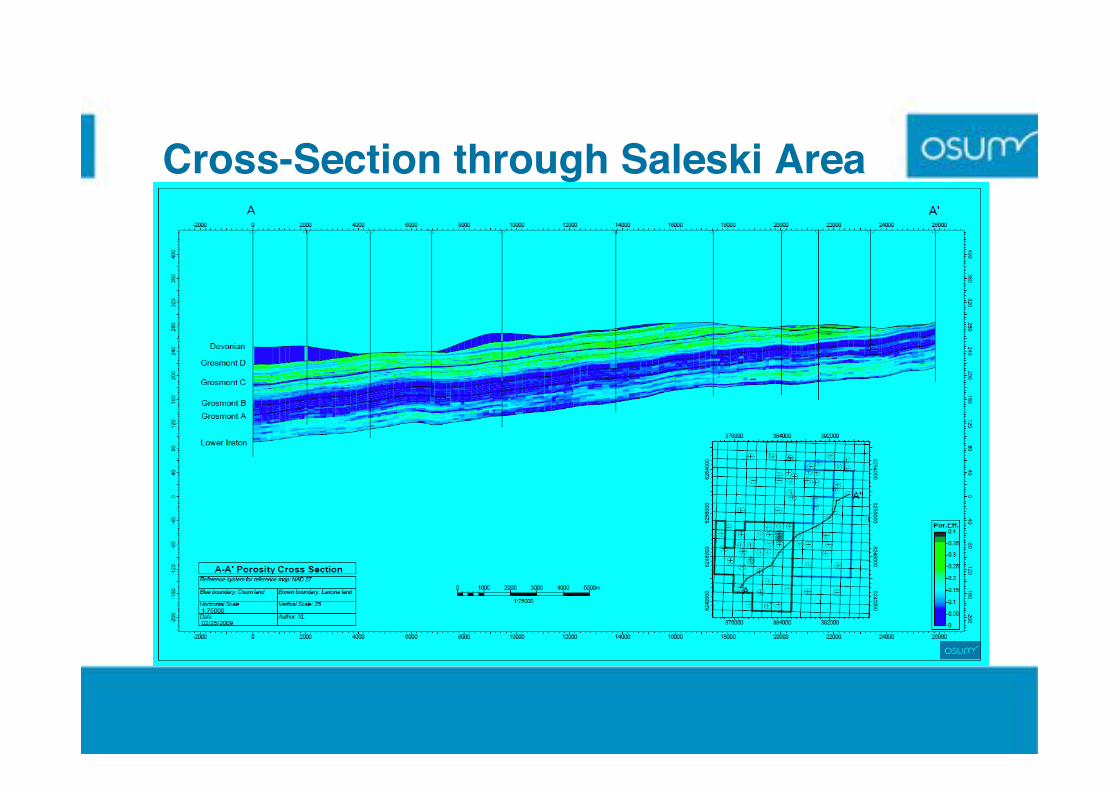
Cross-Section through Saleski Area

Pilot Test in Buffalo Creek
•Peak oil rate close to 500
Bbl/d (80 m3/d)
•High Steam Injectivity
•Best cycle SOR was 4.0
•Low produced water to
injected steam ratio (<0.7)
Buffalo Creek CSS Pilot 10A-5-88-19W4 in Grosmont
(Cum. SOR: 6.4)
-
20,000
40,000
60,000
80,000
100,000
120,000
Nov-79 Oct-80 Oct-81 Oct-82 Oct-83 Oct-84 Oct-85 Oct-86
Production Time
Cu
m.
Oil
, W
ate
r a
nd
Ste
am
(m
3) Stm Inj Cum (m3)
Water Cum (m3)
Oil Cum (m3)
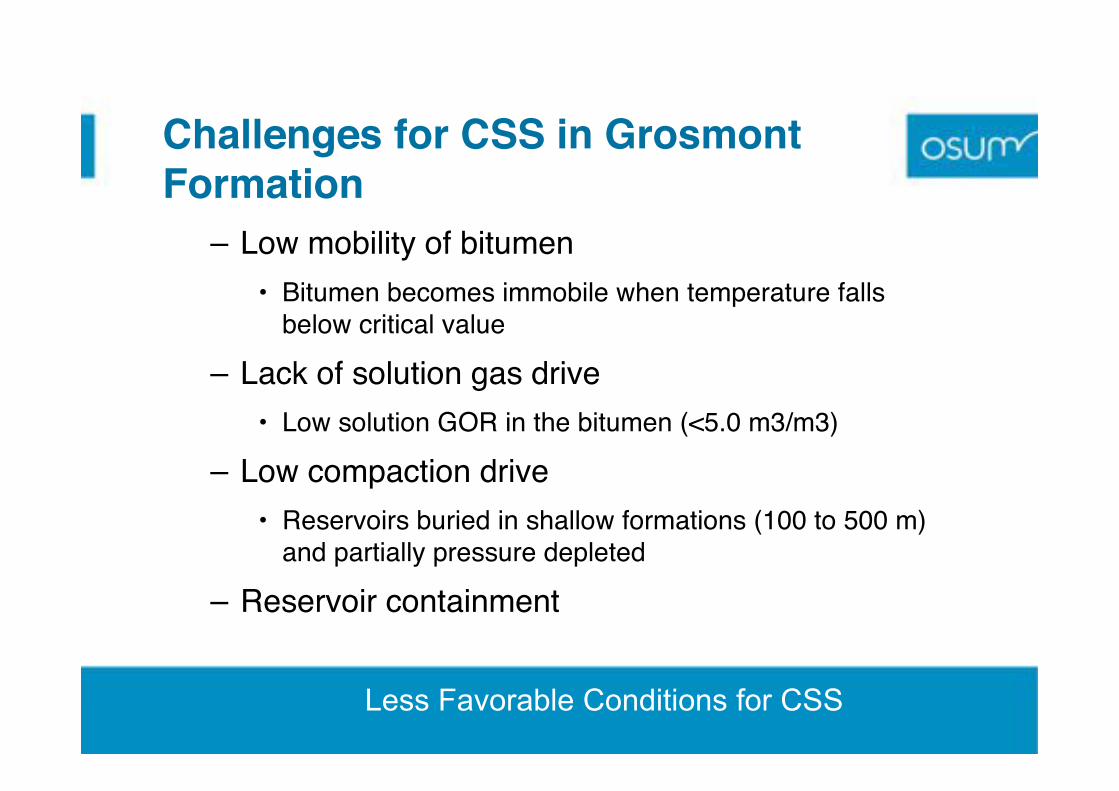
Challenges for CSS in Grosmont
Formation
– Low mobility of bitumen
• Bitumen becomes immobile when temperature falls
below critical value
– Lack of solution gas drive
• Low solution GOR in the bitumen (<5.0 m3/m3)
– Low compaction drive
• Reservoirs buried in shallow formations (100 to 500 m)
and partially pressure depleted
– Reservoir containment
Less Favorable Conditions for CSS

CSS in McMurray Formation at JACOS
Hangingstone
Higher SOR and Lower Productivity than Buffalo Creek Pilot
CSS Pad
SAGD Pad
Hangingstone CSS Pilot in McMurray Formation
(Cum. SOR: 11.7)
0
50000
100000
150000
200000
250000
Jan-90 Jan-91 Jan-92 Dec-92 Dec-93 Jan-95
Production Time
Cu
mu
lati
ve
Oil
, W
ate
r a
nd
Ste
am
(m
3)
Stm Inj Cum (m3)
Water Cum (m3)
Oil Cum (m3)

SAGD in McMurray Formation at JACOSHangingstone
Hangingstone SAGD Pilot in McMurray Formation
(2 Well Pairs, Peak Oil 150 m3/d per Well Pair, CSOR 3.5)
0
100
200
300
400
500
600
700
800
900
1000
Jan-01 Jan-02 Jan-03 Jan-04 Dec-04 Jan-06 Jan-07 Jan-08 Dec-08
Production Time
Da
ily
Oil
an
d S
tea
m R
ate
(m3
/d)
Oil Daily (m3/d)
Stm Inj Daily (m3/d)

Comparison of CSS and SAGD at
Hangingstone Pilot Area
0.37.5Ratio between
SAGD & CSS
3.5150SAGD
11.720CSS
CSOR (m3/m3)Peak Rate
(m3/d/Well)
Process
Step Change in McMurray Performance with SAGD
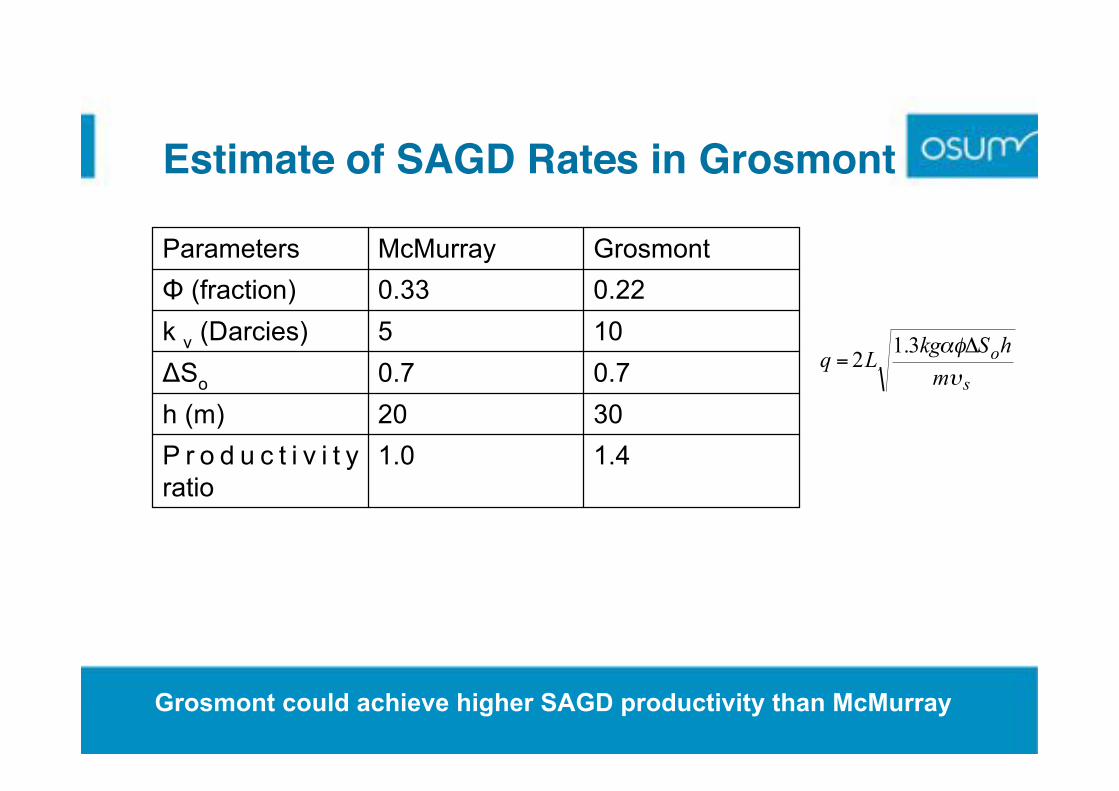
Estimate of SAGD Rates in Grosmont
1.41.0P r o d u c t i v i t y
ratio
3020h (m)
0.70.7!So
105k v (Darcies)
0.220.33" (fraction)
GrosmontMcMurrayParameters
s
o
m
hSkgLq
!
"#$=
3.12
Grosmont could achieve higher SAGD productivity than McMurray
Laboratory Studies
• Gravity Drainage process
– Steam
– Cold Solvent
– Warm Solvent
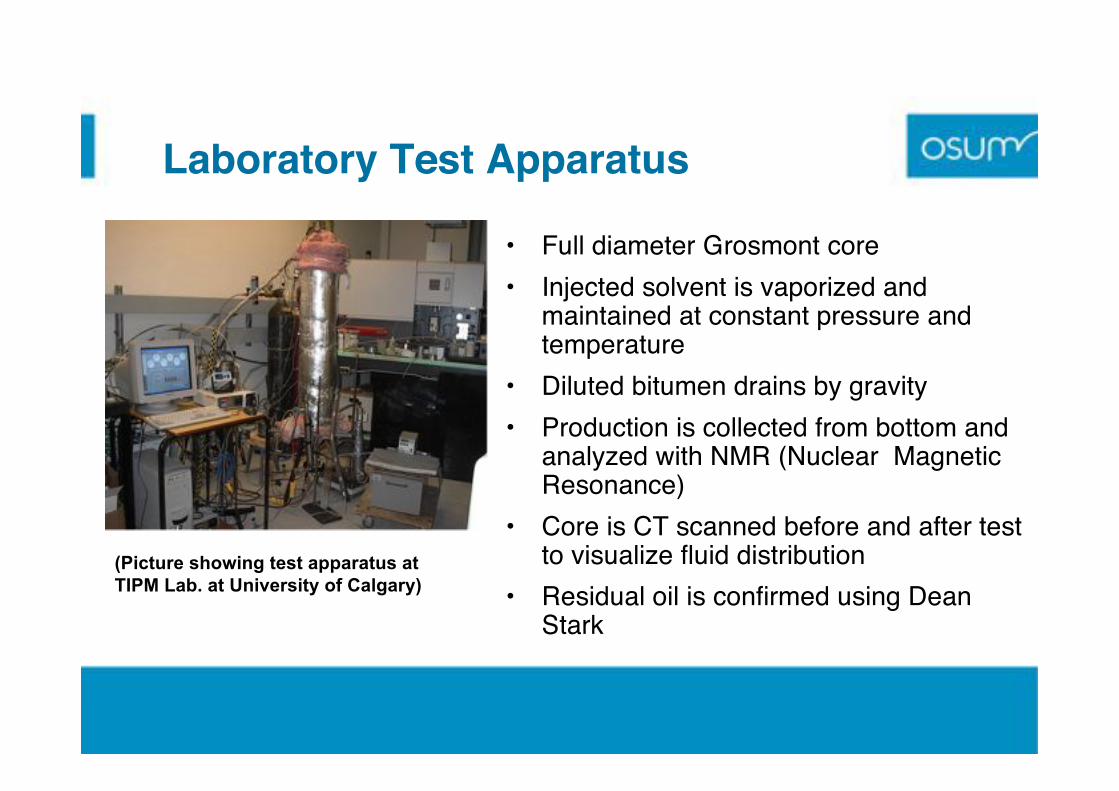
Laboratory Test Apparatus
• Full diameter Grosmont core
• Injected solvent is vaporized andmaintained at constant pressure andtemperature
• Diluted bitumen drains by gravity
• Production is collected from bottom andanalyzed with NMR (Nuclear MagneticResonance)
• Core is CT scanned before and after testto visualize fluid distribution
• Residual oil is confirmed using DeanStark
(Picture showing test apparatus at
TIPM Lab. at University of Calgary)
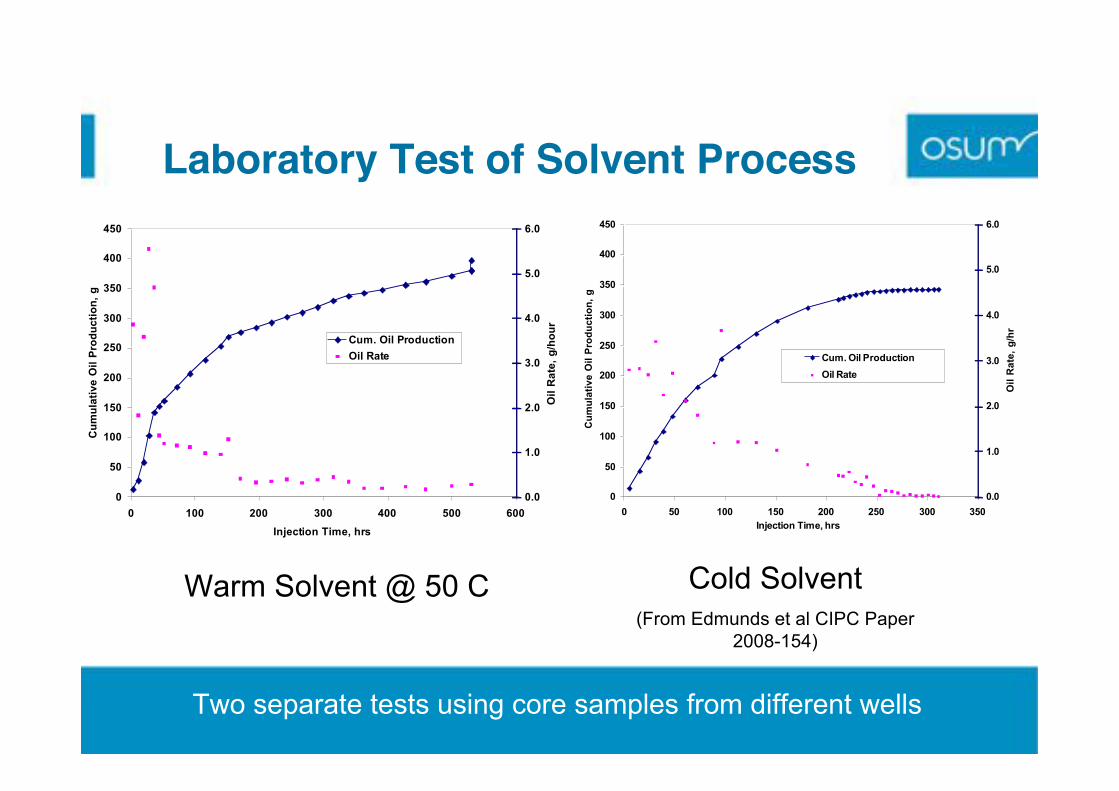
Laboratory Test of Solvent Process
Cold Solvent
(From Edmunds et al CIPC Paper
2008-154)
Warm Solvent @ 50 C
0
50
100
150
200
250
300
350
400
450
0 100 200 300 400 500 600
Injection Time, hrs
Cu
mu
lati
ve
Oil
Pro
du
cti
on
, g
0.0
1.0
2.0
3.0
4.0
5.0
6.0
Oil
Ra
te,
g/h
ou
r
Cum. Oil Production
Oil Rate
0
50
100
150
200
250
300
350
400
450
0 50 100 150 200 250 300 350
Injection Time, hrs
Cu
mu
lati
ve
Oil
Pro
du
cti
on
, g
0.0
1.0
2.0
3.0
4.0
5.0
6.0
Oil
Ra
te,
g/h
r
Cum. Oil Production
Oil Rate
Two separate tests using core samples from different wells

Over 50% RF Achieved from Both Cold and
Warm Solvent Tests
0
0.1
0.2
0.3
0.4
0.5
0.6
0 50 100 150 200 250 300 350 400 450 500 550 600
Time (hrs)
Re
co
ve
ry F
ac
tor
(Fra
cti
on
) Cold solvent
warm solvent
Oil from Clearing
Apparatus and Lines
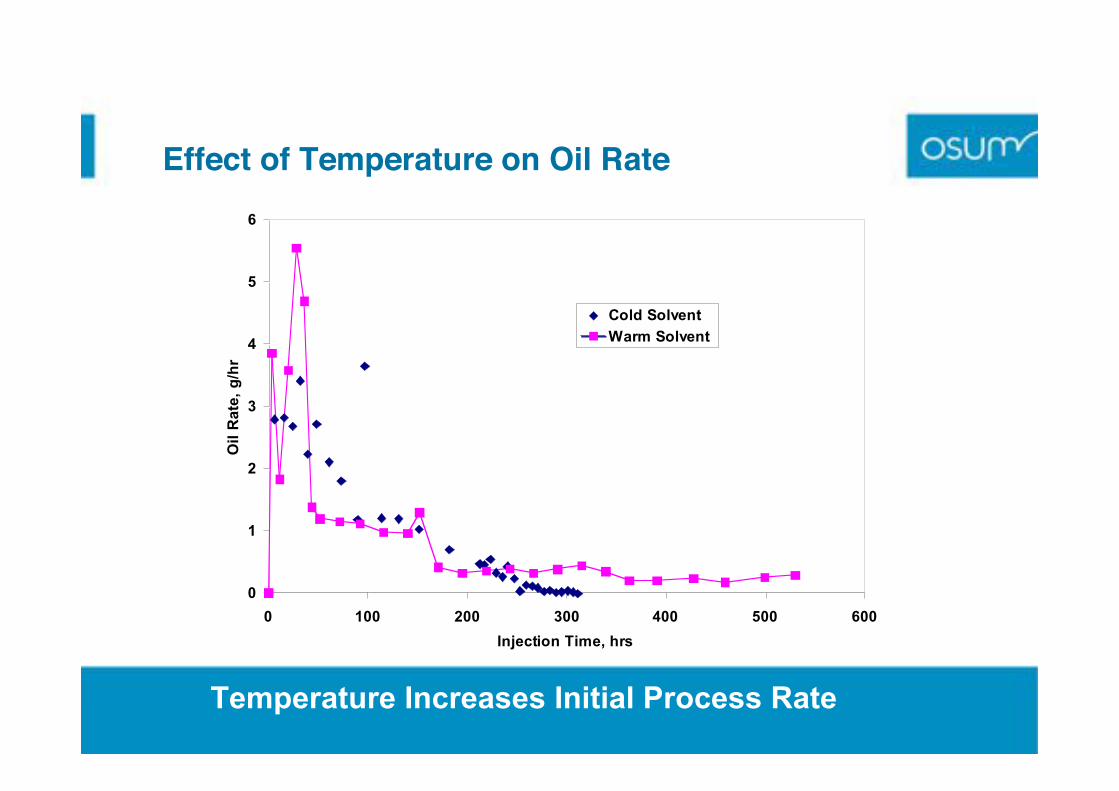
Effect of Temperature on Oil Rate
0
1
2
3
4
5
6
0 100 200 300 400 500 600
Injection Time, hrs
Oil
Ra
te,
g/h
r
Cold Solvent
Warm Solvent
Temperature Increases Initial Process Rate

Drainage Patterns
• High initial rate following by reduced rates
– Initial high oil rate is most likely due to drainage
from fractures
– Slower drainage rates in late stages could be the
combination of flow from both matrix and fracture
• Drainage from both fracture and matrix isconfirmed from CT Scan

High Residual Oil in Core (>40%)
• Less drainage head (0.9 m) in the core than in the
field (20 to 60 meters)
• Less drainage time (days) in the core than in the field
(years)
• Higher percentage of the liquid hold-up by capillary
pressure in the core than in the field

Interpretation of Lab. Test Results
• Scaling Factor
– Geometrical Similarity
• Hfield
= 27.0 m; Hmodel
=0.9 m
– Permeability
• Kfield
=10 D; Kmodel
=300 D
– Time Similarity
• Tfield
=10 Yrs; Tmodel
=4.0 Days
!"
#$=
eC
Cs C
dC
D
CN
µ
%)1(
elo
fieldo
f
m
SN
h
SN
h
K
K
mod
!!"
#$$%
&
'
!!
"
#
$$
%
&
'
=
( )( )field
el
f
m
h
h
t
t
2
mod
2
=
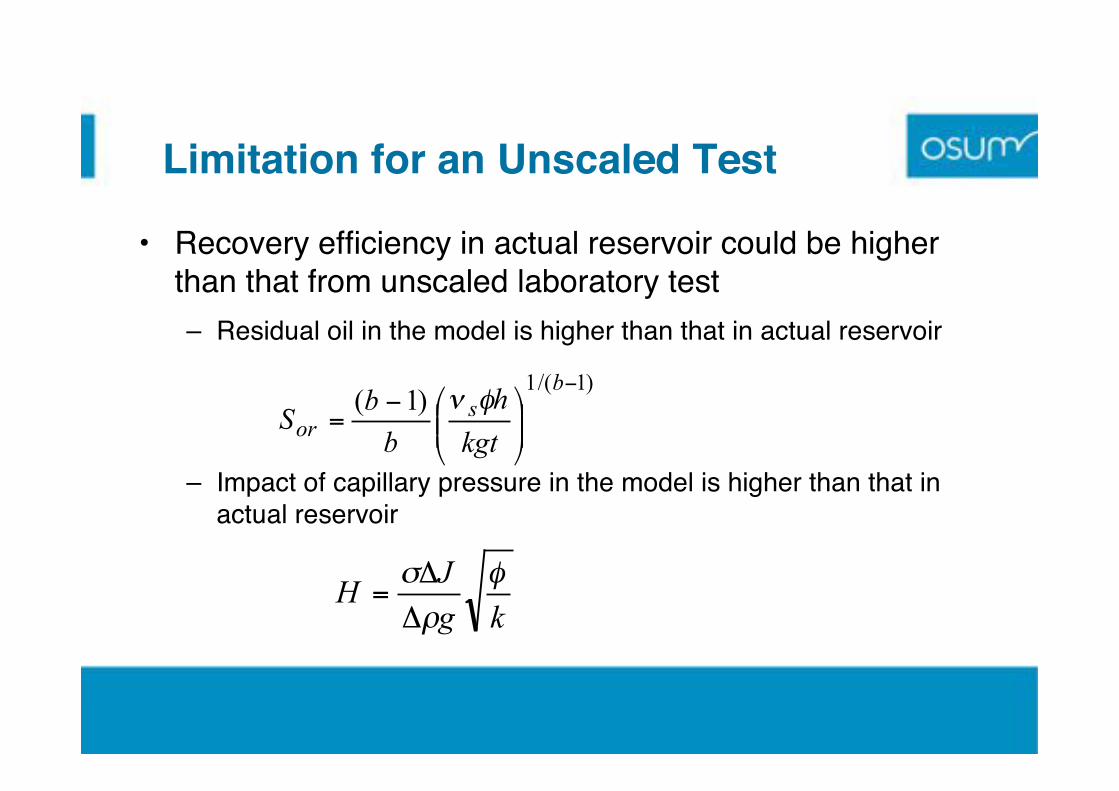
Limitation for an Unscaled Test
• Recovery efficiency in actual reservoir could be higher
than that from unscaled laboratory test
– Residual oil in the model is higher than that in actual reservoir
– Impact of capillary pressure in the model is higher than that in
actual reservoir
)1/(1)1(
!
""#
$%%&
'!=
b
sor
kgt
h
b
bS
()
kg
JH
!
"
#
$
$=
Evaluation of Commercial Prospect
• Scaled experiments
– Very challenging for multiple porosity medium
• Field-scale reservoir simulation
– PVT, transport and interfacial properties in porous medium
– History match of laboratory and field tests
• Field test towards commercial development
– Promising results have been obtained from initial solvent
tests at Laricina-Osum JV property (From Edmunds et al
CIPC paper 2008-154)
– Large-scale pilot tests are planned
Conclusions
• CSS pilot test at Buffalo Creek demonstrated high
injectivity and high productivity in Grosmont
Formation.
• Both cold and warm solvent soak tests achieved over50% recovery from a Grosmont core.
• Drainage of oil occurred also from the low porosity
(<10%) section of the Grosmont core.
• Warm solvent test achieved higher oil drainage rates
than cold solvent test especially during the initial
production stage.
Conclusions (Cont!d)
• Solvent process could be more efficient in the fieldthan the unscaled core test.
• Scaled physical modeling and field pilot testing arerequired to evaluate the commercial potential forfuture Grosmont development.
• Gravity drainage process applied to Grosmontreservoirs appears to hold great promise.
• Optimization of the recovery process for theGrosmont reservoir should be focused on acombination of solvent and thermal processes.

Acknowledgement
• Permission from Osum Oil Sands Corp. to publish
this paper
• The University of Calgary's Tomographic Imaging
and Porous Media (TIPM) laboratory for conductingthe laboratory tests.


![RANDOMISED EVALUATION OF COVID-19 THERAPY (RECOVERY) · Page 1 of 35 RECOVERY [V6.0 2020-05-14] ISRCTN50189673 EudraCT 2020-001113-21 RANDOMISED EVALUATION OF COVID-19 THERAPY (RECOVERY)](https://static.documents.pub/doc/80x56/5f8cba5c807f2f61b04e1fbc/randomised-evaluation-of-covid-19-therapy-recovery-page-1-of-35-recovery-v60.jpg)


