Evaluation of relationship between meteorological parameters and air pollutant concentrations during winter season in Elazığ, Turkey S. Akpinar & Hakan F. Oztop & Ebru Kavak Akpinar Received: 6 July 2007 / Accepted: 6 November 2007 / Published online: 15 December 2007 # Springer Science + Business Media B.V. 2007 Abstract In recent years, due to the rapid increase in population density, building density and energy consumption, the outdoor air quality has deteriorated in the crowded urban areas of Turkey. Elazığ city, which is located in the east Anatolia region of Turkey, is also influenced by air pollutants. In the present study, relationship between monitored air pollutant concentrations such as SO 2 and the total suspended particles (TSP) data and meteorological factors such as wind speed, temperature, relative humidity, solar radiation and atmospheric pressure was investigated in months of October, November, December, January, February, and March during the period of 3 years (2003, 2004 and 2005) for Elazığ city. According to the results of linear and non-linear regression analy- sis, it was found that there is a moderate and weak level of relation between the air pollutant concen- trations and the meteorological factors in Elazığ city. The correlation between the previous day’ s SO 2 , TSP concentrations and actual concentrations of these pollutants on that day was investigated and the coefficient of determination R 2 was found to be 0.64 and 0.54, respectively. The statistical models of SO 2 and TSP including all of meteorological parameters gave R 2 of 0.20 and 0.12, respectively. Further, in order to develop this model, previous day’ s SO 2 and TSP concentrations were added to the equations. The new model for SO 2 and TSP was improved consid- erably with R 2 =0.74 and 0.61, respectively. Keywords Sulphur dioxide . Total suspended particles (TSP) . Meteorological parameters . Regression analysis . Elazığ–Turkey Nomenclature AP atmospheric pressure (mbar) RH relative humidity (%) SR solar radiation (cal/cm 2 ) T temperature (°C) WS wind speed (m/s) Introduction The level of air pollution concentrations monitored in an urban area depends on several factors such as types of fuels consumed, geographical and topographical peculiarities, meteorological factors and town plan- ning, etc. As with other crowded urban areas in Turkey, the outdoor air quality in urban Elazığ has deteriorated due to air pollution. The main causes of air pollution in Turkish residential areas are low Environ Monit Assess (2008) 146:211–224 DOI 10.1007/s10661-007-0073-9 S. Akpinar Physics Department, Firat University, 23119 Elazığ, Turkey H. F. Oztop : E. Kavak Akpinar (*) Department of Mechanical Engineering, Firat University, 23119 Elazığ, Turkey e-mail: [email protected]
Transcript
Evaluation of relationship between meteorologicalparameters and air pollutant concentrations during winterseason in Elazığ, Turkey
S. Akpinar & Hakan F. Oztop &
Ebru Kavak Akpinar
Received: 6 July 2007 /Accepted: 6 November 2007 / Published online: 15 December 2007# Springer Science + Business Media B.V. 2007
Abstract In recent years, due to the rapid increase inpopulation density, building density and energyconsumption, the outdoor air quality has deterioratedin the crowded urban areas of Turkey. Elazığ city,which is located in the east Anatolia region of Turkey,is also influenced by air pollutants. In the presentstudy, relationship between monitored air pollutantconcentrations such as SO2 and the total suspendedparticles (TSP) data and meteorological factors suchas wind speed, temperature, relative humidity, solarradiation and atmospheric pressure was investigatedin months of October, November, December, January,February, and March during the period of 3 years(2003, 2004 and 2005) for Elazığ city. According tothe results of linear and non-linear regression analy-sis, it was found that there is a moderate and weaklevel of relation between the air pollutant concen-trations and the meteorological factors in Elazığ city.The correlation between the previous day’s SO2, TSPconcentrations and actual concentrations of thesepollutants on that day was investigated and thecoefficient of determination R2 was found to be 0.64
and 0.54, respectively. The statistical models of SO2
and TSP including all of meteorological parametersgave R2 of 0.20 and 0.12, respectively. Further, inorder to develop this model, previous day’s SO2 andTSP concentrations were added to the equations. Thenew model for SO2 and TSP was improved consid-erably with R2=0.74 and 0.61, respectively.
Keywords Sulphur dioxide . Total suspendedparticles (TSP) .Meteorological parameters .
Regression analysis . Elazığ–Turkey
NomenclatureAP atmospheric pressure (mbar)RH relative humidity (%)SR solar radiation (cal/cm2)T temperature (°C)WS wind speed (m/s)
Introduction
The level of air pollution concentrations monitored inan urban area depends on several factors such as typesof fuels consumed, geographical and topographicalpeculiarities, meteorological factors and town plan-ning, etc. As with other crowded urban areas inTurkey, the outdoor air quality in urban Elazığ hasdeteriorated due to air pollution. The main causes ofair pollution in Turkish residential areas are low
Environ Monit Assess (2008) 146:211–224DOI 10.1007/s10661-007-0073-9
S. AkpinarPhysics Department, Firat University,23119 Elazığ, Turkey
H. F. Oztop : E. Kavak Akpinar (*)Department of Mechanical Engineering, Firat University,23119 Elazığ, Turkeye-mail: [email protected]
quality coal and fuel-oil consumption, as well as alsoexhaust gases emitted by transportation vehicles(Demirci and Cuhadaroglu 2000).
Meteorology, along with emissions and atmospher-ic chemistry, is well known as a major contributor toair pollution episodes. For that reason, the air qualityin cities has been correlated with the combination ofthe various meteorological factors statistically inseveral studies over the past decade.
Given a set of observations from air monitoringand meteorological stations, calculating statisticalrelationships among the variables is possible by usingsome statistical techniques such as regression analy-sis. Some statistical models establish how closerelationships are between concentration estimatesand values actually measured under similar circum-stances. Effects of all factors that determine atmosphericpollutant concentrations are implicitly accounted for inthe air quality data used to develop and optimize themodels. These models also have low development costand resource requirements (Turalıoglu et al. 2005).
There are some studies in the literature whichinvestigate the air pollution in some big cities in theworld such as Paris (Escourrou 1990), Ravenna(Tribassi et al. 1990) and Shangai (Chao 1990). Also,characterization of the concentration and distributionof urban submicron PM1 aerosol particles at the cityof Kaohsiung were investigated by Lin and Lee(2004). Cuhadaroglu and Demirci (1997) performeda study to show the influence of some meteorologicalfactors on air pollution in Trabzon city in Turkey.They used SPSS code to make statistical analyses andobtained correlations for SO2 and particle concen-trations between meteorological factors. Their resultsindicated that there is a moderate and weak level ofrelation between the SO2 level and the meteorologicalfactors in Trabzon city. In their other study, Demirciand Cuhadaroglu (2000) considered wind circulationand air pollution by taking into account winddirections with the same statistical code. They foundthat there is a weak relationship between wind speedsblowing from different directions and pollutant con-centrations. Also, they suggested that the newlyconstructed residential blocks should be divided bythe main roads and streets on directions of WNW-ESE and SSW-NNE in the urban. In the studypresented by Bridgman et al. (2002), the relationshipof SO2 concentrations to six major meteorologicalparameters has been investigated. Results found that
SO2 concentrations strongly related to colder temper-ature, higher relative humidity and lower wind speed.For prediction of SO2 and smoke concentrations ofKayseri-Turkey, multiple regression equations includ-ing meteorological parameters and previous day’spollutant concentrations have been used by Kartal andOzer (Kartal and Ozer 1998). The changes of airquality in Erzurum-Turkey and the correlation of SO2
and total suspended particles (TSP) pollution inErzurum city with meteorological parameters such aswind speed, temperature, atmospheric pressure, pre-cipitation, and relative humidity were researched bythe Turalıoglu et al. (2005). Ensar et al. (2003)statistically analyzed the relationship between outdoorair quality data and meteorological factors, such aswind speed, rainfall, temperature, sunshine hours andrelative humidity using the code SPSS. Latini et al.(2002) investigated the effects of meteorologicalconditions on the urban and suburban air pollution.Ezzatian (2007) studied the effect of meteorologicalparameters on Esfahan Air Quality Index by IsfahanMeteorological Weather Station, Environmental Or-ganization Stations. Yordanov (1977) performedstatistical processing of air pollution data in theplanetary boundary layer in terms of meteorologicalconditions. Andò et al. (2000) proposed models forthe enforcement of the air quality standards in bothurban and industrial areas.
The main purpose of the present study is to obtainrelationship between air pollution concentrations andmeteorological data such as wind speed, temperature,relative humidity, solar radiation and atmosphericpressure for Elazığ city. The characteristics of topo-graphic, climatic and air quality of Elazığ city werepresented first, then the relationship of SO2 and TSPconcentrations with the combination of meteorologicalparameters for months of October, November, Decem-ber, January, February and March of the 2003-2004was investigated. Finally, the contribution of theprevious day’s air quality level to the actual air qualityconcentration was examined.
Material and Methods
Features of study area
Elazığ city (longitude; 40° 21′ and 38° 30′, latitude;38° 17′ and 39° 11′) is situated in north part of
212 Environ Monit Assess (2008) 146:211–224
Euphrates River of east Anatolia region of Turkey.The area of Elazığ city is 9.281 km2 which isequivalent to 0.12% of Turkey. Height above sealevel is 1067 m. It is a peninsula due to dams in itsboundaries such as Keban, Kralkizi, Karakaya andÖzlüce. Elazığ city has a typical highland climate, inthat it is generally cold in winter and hot in summer
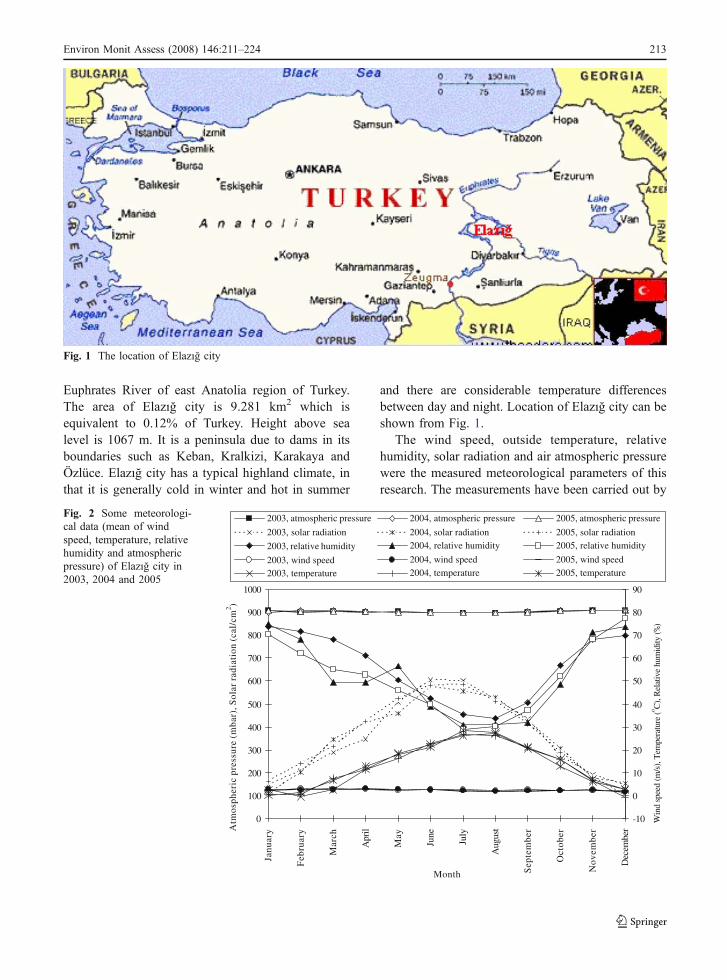
and there are considerable temperature differencesbetween day and night. Location of Elazığ city can beshown from Fig. 1.
The wind speed, outside temperature, relativehumidity, solar radiation and air atmospheric pressurewere the measured meteorological parameters of thisresearch. The measurements have been carried out by
2003, temperature 2004, temperature 2005, temperature
Fig. 2 Some meteorologi-cal data (mean of windspeed, temperature, relativehumidity and atmosphericpressure) of Elazığ city in2003, 2004 and 2005
Environ Monit Assess (2008) 146:211–224 213
conventional meteorological instruments at the stationlocated in the east of the Elazığ city by the TurkishMeteorological State Department (TMSD). Figure 2shows the monthly average wind speed, temperature,relative humidity, solar radiation and atmosphericpressure values in the years of 2003, 2004 and2005. It can be seen from the figure that the values
are very close to each other for both years. As it wasshown from Fig. 2, for Elazığ city, the annual averagetemperature is about 13°C, the annual average windspeed is about 2.5 m/s, the annual average relativehumidity is about %54, the annual average solarradiation is about 357 cal/cm2 and the annual averageatmospheric pressure is about 902 mbar.
0
50
100
150
200
250
300
January February March October November December
Month
SO2
conc
entr
atio
n ( µ
g/m
3 ) 2003
2004
2005
0
20
40
60
80
100
120
140
January February March October November December
Month
TSP
con
cent
rati
on (
µ g/m
3 ) 2003
2004
2005
a
b
Fig. 4 Monthly average aSO2 and b total suspendedparticles (TSP) concentra-tions values in 2003–2005winter seasons
0
50
100
150
200
250
300
1995-1996
1996-1997
1997-1998
1998-1999
1999-2000
2000-2001
2001-2002
2002-2003
2003-2004
2004-2005
Winter season
Con
cent
rati
ons
(µg/
m3 )
SO2 TSP WSLSO2 WSLTSPFig. 3 SO2 and totalsuspended particles (TSP)concentrations betweenyears of 1995–2005 atwinter season in Elazığ city(WSL: winter season limitvalue)
214 Environ Monit Assess (2008) 146:211–224
The Elazığ city needs at least 6 months of artificialheating. As no important industrial company as apoint source of air pollution exists in the city, themajor source of air pollution is heating. Sugar andcement factories, the most important point sourcesnear the city, are far away from city center, about 15and 2 km, respectively.
SO2 and TSP concentrations measurements
The Environmental and Forestry State Departmenthave been doing sulphur dioxide and particle concen-trations measurements at two stations in Centrum ofthe Elazığ city. Measurements were made withneutralization titration for SO2 and with refractmetric
and TSP concentrations andmeteorological parametersin 2003–2005 winterseasons
0
50100
150200
250
300350
400
0 1 2 3 4 5 6 7 8 9 10 11
Wind speed (m/s)
SO2
conc
entr
atio
n ( µ
g/m
3 )
0
50
100
150
200
250
0 1 2 3 4 5 6 7 8 9 10 11
Wind speed (m/s)
TSP
con
cent
rati
on (
µg/
m3 )
a
b
Fig. 5 a SO2 and b totalsuspended particles (TSP)concentrations versus windspeed in 2003–2005 winterseasons
Environ Monit Assess (2008) 146:211–224 215
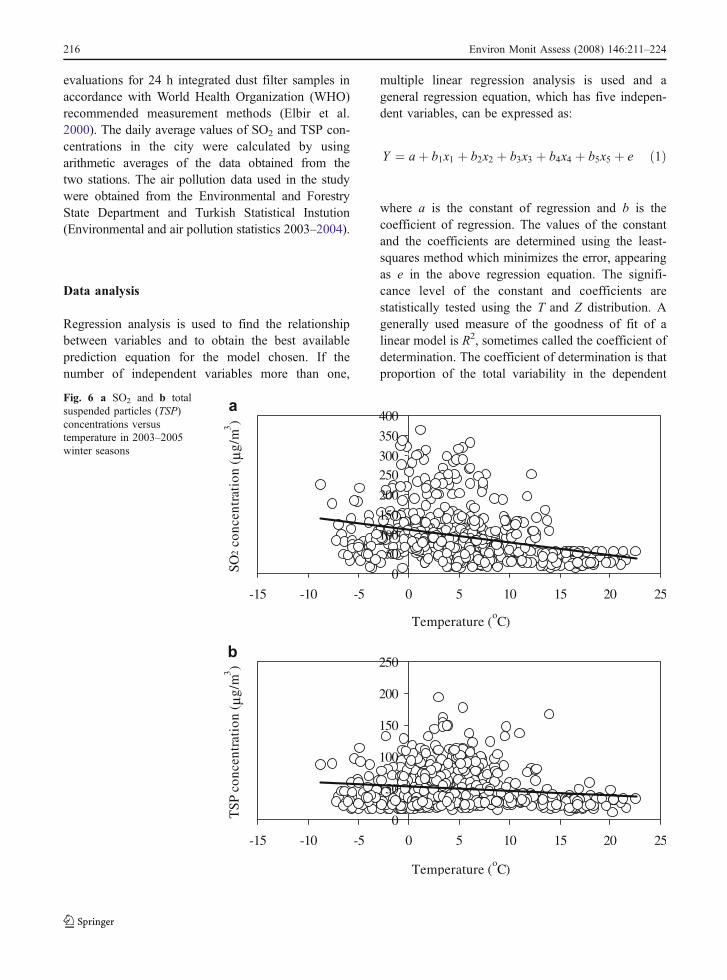
evaluations for 24 h integrated dust filter samples inaccordance with World Health Organization (WHO)recommended measurement methods (Elbir et al.2000). The daily average values of SO2 and TSP con-centrations in the city were calculated by usingarithmetic averages of the data obtained from thetwo stations. The air pollution data used in the studywere obtained from the Environmental and ForestryState Department and Turkish Statistical Instution(Environmental and air pollution statistics 2003–2004).
Data analysis
Regression analysis is used to find the relationshipbetween variables and to obtain the best availableprediction equation for the model chosen. If thenumber of independent variables more than one,
multiple linear regression analysis is used and ageneral regression equation, which has five indepen-dent variables, can be expressed as:
Y ¼ aþ b1x1 þ b2x2 þ b3x3 þ b4x4 þ b5x5 þ e ð1Þ
where a is the constant of regression and b is thecoefficient of regression. The values of the constantand the coefficients are determined using the least-squares method which minimizes the error, appearingas e in the above regression equation. The signifi-cance level of the constant and coefficients arestatistically tested using the T and Z distribution. Agenerally used measure of the goodness of fit of alinear model is R2, sometimes called the coefficient ofdetermination. The coefficient of determination is thatproportion of the total variability in the dependent
0
50100
150
200
250300
350
400
-15 -10 -5 0 5 10 15 20 25
Temperature (oC)
Temperature (oC)
SO2
conc
entr
atio
n ( µ
g/m
3 )
0
50
100
150
200
250
-15 -10 -5 0 5 10 15 20 25
TSP
con
cent
rati
on (
µg/m
3 )
a
b
Fig. 6 a SO2 and b totalsuspended particles (TSP)concentrations versustemperature in 2003–2005winter seasons
216 Environ Monit Assess (2008) 146:211–224
variable that is accounted for by the regressionequation and expressed as:
R2 ¼ 1�P
Yi;pred � Y� �2
PYi;obs � Y� �2 ð2Þ
where Yi,pred is the value of Y predicted by the regres-sion line, Yi,obs is the value of Y observed, and Y is themean value of the Yi.
A value of R2=1 indicates that the fitted equationaccounts for all the variability of the values of thedependent variables in the sample data. At the otherextreme, R2=0 indicates that the regression equationexplains none of the variability. It is assumed that ahigh R2 assures a statistically significant regressionequation and that a low R2 proves the opposite(Norusis 1990; Turalıoglu et al. 2005).
In the present study, a stepwise regression modelwas used. Stepwise regression of independent varia-
bles is basically a combination of backward andforward procedures in essence and is probably themost commonly used method. After the first variableis entered, stepwise selection differs from forwardselection: the first variable is examined to see whetherit should be removed according to the removalcriterion as in backward elimination. In the next step,variables not included in the equation are examinedfor removal. Variables are removed until none of theremaining variables meet the removal criterion.Variable selection terminates when no more variablesmeet entry and removal criteria. As well as establish-ing the correlations between pollutant concentrationsand meteorological parameters by Eq. 1, the equationexpressed as:
Y ¼ f X1ð Þ; Y ¼ f X2ð Þ; ::::::; Y ¼ f X2;X3ð Þ; . . . ;Y ¼ f X1;X2;X3;X4;X5ð Þ
050
100150200
250300350400
20 30 40 50 60 70 80 90 100 110
Relative humidity ( )
Relative humidity ( )
SO2
conc
entr
atio
n (µ
g/m
3 ) µ
0
50
100
150
200
250
20 30 40 50 60 70 80 90 100 110
TSP
con
cent
rati
on (
g/m
3 )
%
%
a
b
Fig. 7 a SO2 and b totalsuspended particles (TSP)concentrations versus rela-tive humidity in 2003–2005winter seasons
Environ Monit Assess (2008) 146:211–224 217
has also been analyzed separately and the independentvariables which have small values of R2 have beeneliminated. Using the remaining variables, equationshaving one, two, three or four variables are developed.
SO2 and particle concentrations data together withmeteorological parameters such as wind speed,temperature, relative humidity, solar radiation andatmospheric pressure, were analyzed by multiplelinear regression using the SPSS programme. SO2
and TSP concentrations were considered as dependentvariables while meteorological parameters such astemperature, wind speed, relative humidity, solarradiation and atmospheric pressure were consideredas independent variables. Then, multiple linear re-gression analysis was applied by adding previousdays’ SO2 and TSP concentrations to the independentvariables.
Results and discussion
The mean values of sulphur dioxide and TSPconcentrations obtained from daily observation net-work including two stations for the winter seasons(November-December-January-February-March) ofthe 1995–2005, were graphed together with winterseason limit values as 250 μg/m3 for SO2 and200 μg/m3 for TSP in Turkish Air Quality ProtectionRegulation (MOE 1986), are shown in Fig. 3. It isseen from Fig. 3 that winter season limit (WSL) ofTurkish Air Quality Protection Regulation have notbeen exceeded by the values of SO2 and TSP concen-trations for all years. But, these values of the pollutantconcentration levels on winter days were higher thanthe standard values accepted by the WHO and theUnited States. The monthly averages of SO2 and TSP
0
50
100
150
200
250
300
350
400
0 100 200 300 400 500 600
Solar radiation (cal/cm2)
SO2
conc
entr
atio
n (µ
g/m
3 )
0
50
100
150
200
250
0 100 200 300 400 500 600
Solar radiation (cal/cm2)
TSP
con
cent
rati
on (
µg/m
3 )
a
b
Fig. 8 a SO2 and b totalsuspended particles (TSP)concentrations versus solarradiation in 2003–2005winter seasons
218 Environ Monit Assess (2008) 146:211–224
values in 2003, 2004 and 2005 are graphed in Fig. 4aand b to see the monthly trends in concentrations. Asseen from Fig. 4a and b, the maximum SO2 and TSPvalues are in January-February months, which are thecoldest months of the year in Elazığ city. However,Table 1 shows means and standard deviations of SO2
and TSP concentrations and meteorological parame-ters in months of October, November, December,January, February, and March during the period of3 years (2003, 2004 and 2005).
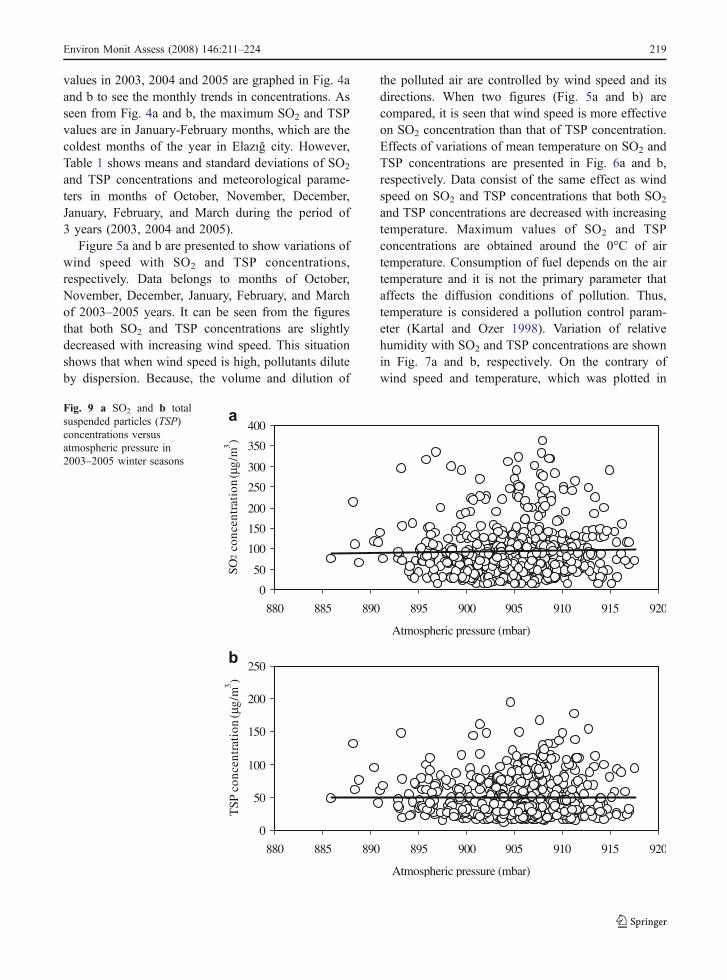
Figure 5a and b are presented to show variations ofwind speed with SO2 and TSP concentrations,respectively. Data belongs to months of October,November, December, January, February, and Marchof 2003–2005 years. It can be seen from the figuresthat both SO2 and TSP concentrations are slightlydecreased with increasing wind speed. This situationshows that when wind speed is high, pollutants diluteby dispersion. Because, the volume and dilution of
the polluted air are controlled by wind speed and itsdirections. When two figures (Fig. 5a and b) arecompared, it is seen that wind speed is more effectiveon SO2 concentration than that of TSP concentration.Effects of variations of mean temperature on SO2 andTSP concentrations are presented in Fig. 6a and b,respectively. Data consist of the same effect as windspeed on SO2 and TSP concentrations that both SO2
and TSP concentrations are decreased with increasingtemperature. Maximum values of SO2 and TSPconcentrations are obtained around the 0°C of airtemperature. Consumption of fuel depends on the airtemperature and it is not the primary parameter thataffects the diffusion conditions of pollution. Thus,temperature is considered a pollution control param-eter (Kartal and Ozer 1998). Variation of relativehumidity with SO2 and TSP concentrations are shownin Fig. 7a and b, respectively. On the contrary ofwind speed and temperature, which was plotted in
0
50
100
150
200
250
300
350
400
880 885 890 895 900 905 910 915 920
Atmospheric pressure (mbar)
SO2
conc
entr
atio
n (µ
g/
m3 )
0
50
100
150
200
250
880 885 890 895 900 905 910 915 920
Atmospheric pressure (mbar)
TSP
con
cent
rati
on (
µg/m
3 )
a
b
Fig. 9 a SO2 and b totalsuspended particles (TSP)concentrations versusatmospheric pressure in2003–2005 winter seasons
Environ Monit Assess (2008) 146:211–224 219
Figs. 5, 6, SO2 and TSP concentrations are increasedwith increasing relative humidity. Relative humidityshould also be inversely related to pollutant concen-trations since it controls the rate of absorption ofpollutants (Kartal and Ozer 1998). Impacts of varia-tion of mean solar radiation with SO2 and TSPconcentrations are shown in Fig. 8a and b, respec-tively. Solar radiation has no direct physical influenceon diffusion controls as wind speed, but it determinesthe amount of consumed fuel for space heating.Therefore, it should be inversely proportional topollutant concentrations. Variations of SO2 and TSPconcentrations with atmospheric pressure are plottedin Fig. 9a and b, respectively. These figures show thatSO2 and TSP concentrations are slightly increasedwith increasing atmospheric pressure. However, at-mospheric pressure is more effective parameter onSO2 concentration than on TSP concentration.
0
50
100
150
200
250
300
350
400
0 50 100 150 200 250 300 350 400
SO2 concentration of previous day (µg/m3)
Act
ual S
O2
conc
entr
atio
n ( µ
g/m
3 )
0
50
100
150
200
250
0 50 100 150 200
TSP concentration of previous day (µg/m3)
Act
ual T
SP c
once
ntra
tion
(µg
/m3 )
a
b
Fig. 10 Actual concentra-tions versus previous day’sconcentrations a for SO2
and b for total suspendedparticles (TSP)
Table 2 Correlations for SO2 and TSP with wind speed,temperature, relative humidity and atmospheric pressure
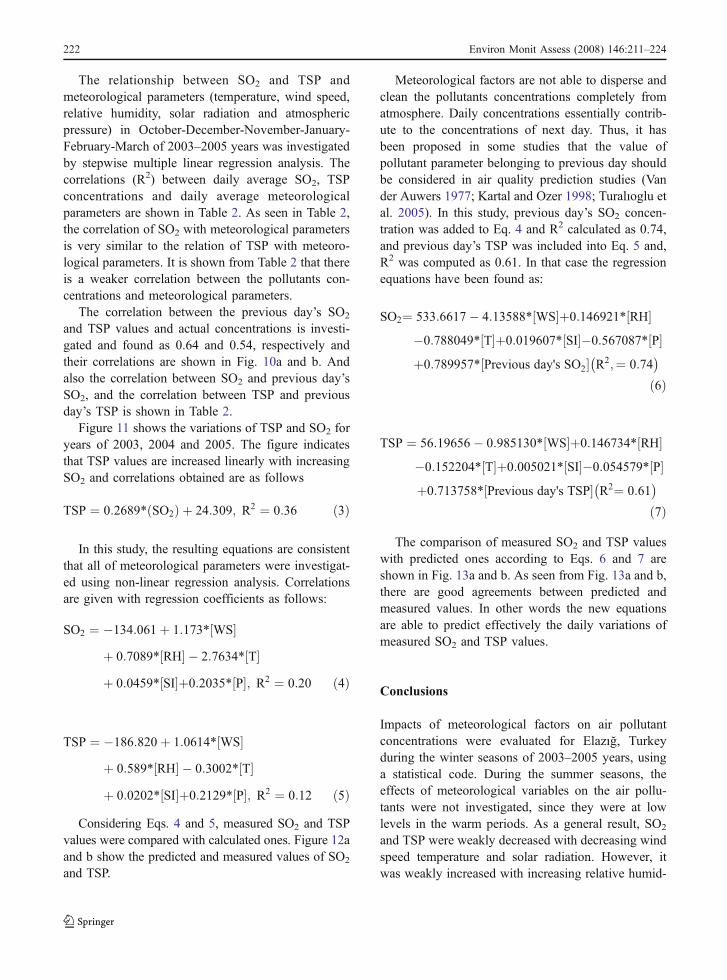
The relationship between SO2 and TSP andmeteorological parameters (temperature, wind speed,relative humidity, solar radiation and atmosphericpressure) in October-December-November-January-February-March of 2003–2005 years was investigatedby stepwise multiple linear regression analysis. Thecorrelations (R2) between daily average SO2, TSPconcentrations and daily average meteorologicalparameters are shown in Table 2. As seen in Table 2,the correlation of SO2 with meteorological parametersis very similar to the relation of TSP with meteoro-logical parameters. It is shown from Table 2 that thereis a weaker correlation between the pollutants con-centrations and meteorological parameters.
The correlation between the previous day’s SO2
and TSP values and actual concentrations is investi-gated and found as 0.64 and 0.54, respectively andtheir correlations are shown in Fig. 10a and b. Andalso the correlation between SO2 and previous day’sSO2, and the correlation between TSP and previousday’s TSP is shown in Table 2.
Figure 11 shows the variations of TSP and SO2 foryears of 2003, 2004 and 2005. The figure indicatesthat TSP values are increased linearly with increasingSO2 and correlations obtained are as follows
TSP ¼ 0:2689* SO2ð Þ þ 24:309; R2 ¼ 0:36 ð3Þ
In this study, the resulting equations are consistentthat all of meteorological parameters were investigat-ed using non-linear regression analysis. Correlationsare given with regression coefficients as follows:
Considering Eqs. 4 and 5, measured SO2 and TSPvalues were compared with calculated ones. Figure 12aand b show the predicted and measured values of SO2
and TSP.
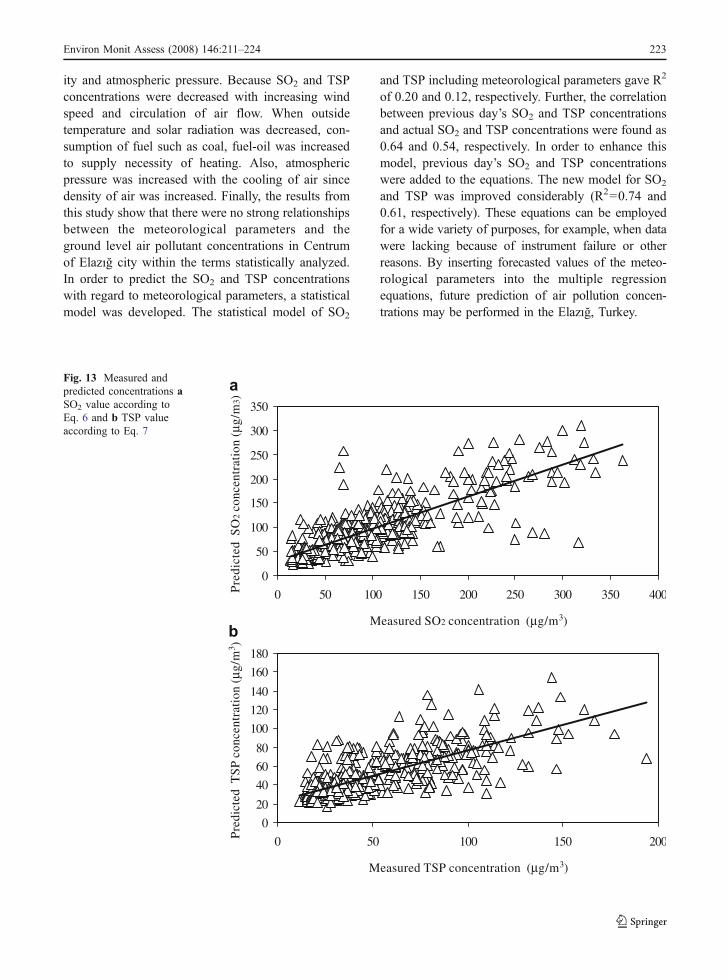
Meteorological factors are not able to disperse andclean the pollutants concentrations completely fromatmosphere. Daily concentrations essentially contrib-ute to the concentrations of next day. Thus, it hasbeen proposed in some studies that the value ofpollutant parameter belonging to previous day shouldbe considered in air quality prediction studies (Vander Auwers 1977; Kartal and Ozer 1998; Turalıoglu etal. 2005). In this study, previous day’s SO2 concen-tration was added to Eq. 4 and R2 calculated as 0.74,and previous day’s TSP was included into Eq. 5 and,R2 was computed as 0.61. In that case the regressionequations have been found as:
The comparison of measured SO2 and TSP valueswith predicted ones according to Eqs. 6 and 7 areshown in Fig. 13a and b. As seen from Fig. 13a and b,there are good agreements between predicted andmeasured values. In other words the new equationsare able to predict effectively the daily variations ofmeasured SO2 and TSP values.
Conclusions
Impacts of meteorological factors on air pollutantconcentrations were evaluated for Elazığ, Turkeyduring the winter seasons of 2003–2005 years, usinga statistical code. During the summer seasons, theeffects of meteorological variables on the air pollu-tants were not investigated, since they were at lowlevels in the warm periods. As a general result, SO2
and TSP were weakly decreased with decreasing windspeed temperature and solar radiation. However, itwas weakly increased with increasing relative humid-
222 Environ Monit Assess (2008) 146:211–224
ity and atmospheric pressure. Because SO2 and TSPconcentrations were decreased with increasing windspeed and circulation of air flow. When outsidetemperature and solar radiation was decreased, con-sumption of fuel such as coal, fuel-oil was increasedto supply necessity of heating. Also, atmosphericpressure was increased with the cooling of air sincedensity of air was increased. Finally, the results fromthis study show that there were no strong relationshipsbetween the meteorological parameters and theground level air pollutant concentrations in Centrumof Elazığ city within the terms statistically analyzed.In order to predict the SO2 and TSP concentrationswith regard to meteorological parameters, a statisticalmodel was developed. The statistical model of SO2
and TSP including meteorological parameters gave R2
of 0.20 and 0.12, respectively. Further, the correlationbetween previous day’s SO2 and TSP concentrationsand actual SO2 and TSP concentrations were found as0.64 and 0.54, respectively. In order to enhance thismodel, previous day’s SO2 and TSP concentrationswere added to the equations. The new model for SO2
and TSP was improved considerably (R2=0.74 and0.61, respectively). These equations can be employedfor a wide variety of purposes, for example, when datawere lacking because of instrument failure or otherreasons. By inserting forecasted values of the meteo-rological parameters into the multiple regressionequations, future prediction of air pollution concen-trations may be performed in the Elazığ, Turkey.
0
50
100
150
200
250
300
350
0 50 100 150 200 250 300 350 400
Measured SO2 concentration (µg/m3)
Pre
dict
ed S
O2
conc
entr
atio
n (µ
g/m
3)
0
20
40
60
80
100
120
140
160
180
0 50 100 150 200
Measured TSP concentration (µg/m3)
Pre
dict
ed T
SP
con
cent
rati
on (
µg/m
3 )
a
b
Fig. 13 Measured andpredicted concentrations aSO2 value according toEq. 6 and b TSP valueaccording to Eq. 7
Environ Monit Assess (2008) 146:211–224 223
References
Andò, B., Baglio, S., Graziani, S., & Pitrone, N. (2000).Models for air quality management and assessment. IEEETransactions on Systems, Man, and Cybernetics—Part C:Applications and Reviews, 30(3), 358–362.
Bridgman, H. A., Davies, T. D., Jickells, T., Hunova, I., Tovey, K.,Bridges, K., et al. (2002). Air pollution in the Krusne Horyregion, Czech Republic during the 1990s. AtmosphericEnvironment, 36, 3375–3389.
Chao, Z. (1990). Urban climate and air pollution in Shangai.Energy Building, 15, 647–656.
Cuhadaroglu, B., & Demirci, E. (1997). Influence of somemeteorological factors on air pollution in Trabzon city.Energy Buildings, 25, 179–184.
Demirci, E., & Cuhadaroglu, B. (2000). Statistical analysis of airpollution in urban Trabzon. Energy Buildings, 31, 49–53.
Elbir, T., Muezzinoglu, A., & Bayram, A. (2000). Evaluation ofsome air pollution indicators in Turkey. EnvironmentInternational, 26, 5–10.
Ensar, O., Kaya, M. D., & Nuhoglu, Y. (2003). Interactionbetween air pollution and meteorological parameters inErzurum, Turkey. International Journal of Environmentand Pollution, 19(3), 292–300.
Escourrou, G. (1990). Climate and pollution in Paris. EnergyBuilding, 15, 673–676.
Ezzatian, V. (2007). The study of the impacts of meteorologicalparameters on the air quality ındex in the Esfahan City.The 10th International Meetings on Statistical Climatolo-gy, 10IMSC August 20 to 24 2007, Beijing, China.
Kartal, S., & Ozer, U. (1998). Determination and parameter-izationof some air pollutants as a function of meteorolo-gicalparameters in Kayseri, Turkey. Air and WasteManagement Association, 48, 853–859.
Latini, G., Grifoni, R. C., & Passerini, G. (2002). Influence ofmeteorological parameters on urban and suburban air pollution.Air Pollution X, Transaction: Ecology and the Environment, 53.
Lin, J. J., & Lee, L. C. (2004). Characterization of theconcentration and distribution of urban submicron (PM1)aerosol particles. Atmospheric Environment, 38, 469–475.
MOE (Ministry of Environment) (1986). Air Quality ProtectionRegulation (AQPR). Offical Gazette 19269, Ankara-Turkey.
Norusis, M. J. (1990). SPSS base system user’s guide. Chicago,IL: SPPS.
Tribassi, T., Fortezza, F., & Vandini, W. (1990). Windcirculation and air pollutant concentration in the coastalcity of Ravenna. Energy Building, 15, 699–704.
Turalıoglu, F. S., Nuhoglu, A., & Bayraktar, H. (2005). Impactsof some meteorological parameters on SO2 and TSPconcentrations in Erzurum, Turkey. Chemosphere, 59,1633–1642.
Van der Auwers, L. (1977) Forecasting the air pollutionpotential by means of a multiple regression model. In:Proceedings of the Eighth International Technical Meetingon Air Pollution Modeling and its Application, Amster-dam, pp. 38–54.
Yordanov, D. (1977) A statistical analysis of air pollution datain terms of meteorological conditions. Boundary-LayerMeteorology, 11(1), 27–32.
Sinan Akpinar was born in 1970 in Elazığ, Turkey. He receivedhis BE, ME and PhD degrees from the University of Firat, Elazığ,Turkey in 1991, 1996 and 2001, respectively. He is currently anAssistant Professor in the Department of Physics, at the Universityof Firat. His main interests are atom and molecule physics,renewable energy.
Hakan F. Oztop was born in 1973 in Elazığ, Turkey. He graduatedfrom the Mechanical Engineering Department at the Firat Univer-sity, Turkey in 1996 and completed her MSc in 1998 in theMechanical Engineering Department at Firat University. He alsogained his PhD degree in 2003 at Firat University. He had been inEcole Polytechnique in Montreal in Canada when he was doingPhD thesis and Auburn University, Alabama, USA to study post-doctoral research. He is currently an Assistant Professor in theMechanical Engineering Department at the Firat University. Hisscientific areas are computational fluid dynamics and heat transfer,heat transfer enhancement, heat transfer in porous media andrenewable energy.
Ebru Kavak Akpinar was born in 1973 in Elazığ, Turkey. Shegraduated from the Mechanical Engineering Department at the FiratUniversity, Turkey in 1994 and completed her MSc in 1997 in theMechanical Engineering Department at Firat University. She alsogained her PhD degree in 2002 at Firat University. Since 2005 shehas been working as an Associated Professor in the MechanicalEngineering Department at Firat University and her main interestsinclude thermodynamics, heat and mass transfer, analysis andmodeling energy systems, solar, and wind energy applications.