751 Evaluation of soybean germplasm for its resistance to several foliar pathogens in Indonesia Y. Suryadi * , M.A. Suhendar, A. Akhdiya, I. Manzila and Wawan Microbiology and Phytopathology Department. ICABIOGRAD. Jl Tentara Pelajar 3A Bogor 16111, Indonesia Y. Suryadi, M.A. Suhendar, A. Akhdiya, I. Manzila and Wawan (2012) Evaluation of soybean germplasm for its resistance to several foliar pathogens in Indonesia. Journal of Agricultural Technology 8(2): 761-773. An evaluation of resistant genotypes to three major soybean foliar diseases, viz. Soybean Stunt Virus (SSV), Bacterial Blight (BB), and Bacterial Pustule (BP) was done by screening 100 soybean accessions of ICABIOGRAD - Bogor germplasm collections. The results showed wide variability between genotypes, disease severity and each location. It was revealed that visually healthy-looking soybean had various color intensity on the membrane ranging from light purple to dark violet, suggesting there were a close relationship between responses of soybean leaves with color intensity which indicated SSV density present on plants. This test also confirms that symptomless plants could be infected by SSV-latent infection. BB and BP area under disease progress curve (AUDPC) on soybean genotypes at three location were ranging from 120.49 - 770.79; and 0 - 629.57, respectively. Rated disease response of soybean accessions to BB in the field test showed 48 resistant (R), 31 moderate resistant (MR), 13 moderate susceptible (MS), and 8 susceptible (S); whilst rated to BP disease were 43 R, 41 MR, 14 MS, and 2 S, respectively. Based on resistance criteria against SSV, BB and BP diseases, out of 19 accessions were categorized as MR to R. The selected soybean accessions showed yields ranging from 0.76 to 1.48 t/ha. The highest yield increment (70%) was shown by M 3109 accession. Key words: soybean, germplasm, evaluation, resistance, SSV, bacterial blight, bacterial pustule Introduction Soybean [Glycine max (L.) Merrill], is an important cash crop in Indonesia being used as a raw material for food consumption, as well as feed stock and industrial purposes. Soybean planting areas are found in almost all provinces in Indonesia viz. Aceh, North Sumatra, Lampung, Java, Bali, West Nusa Tenggara and South Sulawesi. Total area of soybean production in 1998 was 1,306,203 ha with the total production reached 1,474,313.42 tons. The national soybean production is still low due to the total area harvested is not * Corresponding author: Y. Suryadi; e-mail: [email protected]Journal of Agricultural Technology 2012 Vol. 8(2): 751-763 Available online http://www.ijat-aatsea.com ISSN 1686-9141
Transcript
Journal of Agricultural Technology 2012, Vol. 8(2): 751-763
751
Evaluation of soybean germplasm for its resistance to several foliar pathogens in Indonesia Y. Suryadi*, M.A. Suhendar, A. Akhdiya, I. Manzila and Wawan Microbiology and Phytopathology Department. ICABIOGRAD. Jl Tentara Pelajar 3A Bogor 16111, Indonesia Y. Suryadi, M.A. Suhendar, A. Akhdiya, I. Manzila and Wawan (2012) Evaluation of soybean germplasm for its resistance to several foliar pathogens in Indonesia. Journal of Agricultural Technology 8(2): 761-773. An evaluation of resistant genotypes to three major soybean foliar diseases, viz. Soybean Stunt Virus (SSV), Bacterial Blight (BB), and Bacterial Pustule (BP) was done by screening 100 soybean accessions of ICABIOGRAD - Bogor germplasm collections. The results showed wide variability between genotypes, disease severity and each location. It was revealed that visually healthy-looking soybean had various color intensity on the membrane ranging from light purple to dark violet, suggesting there were a close relationship between responses of soybean leaves with color intensity which indicated SSV density present on plants. This test also confirms that symptomless plants could be infected by SSV-latent infection. BB and BP area under disease progress curve (AUDPC) on soybean genotypes at three location were ranging from 120.49 - 770.79; and 0 - 629.57, respectively. Rated disease response of soybean accessions to BB in the field test showed 48 resistant (R), 31 moderate resistant (MR), 13 moderate susceptible (MS), and 8 susceptible (S); whilst rated to BP disease were 43 R, 41 MR, 14 MS, and 2 S, respectively. Based on resistance criteria against SSV, BB and BP diseases, out of 19 accessions were categorized as MR to R. The selected soybean accessions showed yields ranging from 0.76 to 1.48 t/ha. The highest yield increment (70%) was shown by M 3109 accession. Key words: soybean, germplasm, evaluation, resistance, SSV, bacterial blight, bacterial pustule Introduction
Soybean [Glycine max (L.) Merrill], is an important cash crop in Indonesia being used as a raw material for food consumption, as well as feed stock and industrial purposes. Soybean planting areas are found in almost all provinces in Indonesia viz. Aceh, North Sumatra, Lampung, Java, Bali, West Nusa Tenggara and South Sulawesi. Total area of soybean production in 1998 was 1,306,203 ha with the total production reached 1,474,313.42 tons. The national soybean production is still low due to the total area harvested is not * Corresponding author: Y. Suryadi; e-mail: [email protected]
Journal of Agricultural Technology 2012 Vol. 8(2): 751-763 Available online http://www.ijat-aatsea.com
ISSN 1686-9141
752
sufficient and the productivity is still relatively low averaging of 1.2 t/ha (Saleh, 2007). Potential development of soybean commodity is still widely open because the land outside Java island both in acid soil and upland still allowing for planting soybeans.
Foliar soybean disease could affect the leaves easily and quickly fall off, consequently pods filling so imperfect and yields declined. Among the foliar major diseases of soybean in Indonesia, Soybean Stunt Virus (SSV), bacterial blight (BB) caused by Pseudomonas syringae pv. glycinea (PSG) and bacterial pustule (BP) caused by Xanthomonas axonopodis pv. glycinea (XAG) were become a major concern during dry and wet seasons and increasingly threatened soybean production. Losses resulting from the BB disease ranging from 11-20%, and in severe circumstances can reach up to 40% (Sinclair, 1983). Habazar and Rudolph (1996) reported widespread of BB incidence at soybean production centers in West Sumatra, Lampung, Yogyakarta, East Java and South Sulawesi. Fluctuations of disease severity in the field are influenced by differences in cultivation methods, planting time, environmental conditions, and types of varieties.
Use of quality seed is one effort towards the success of soybean farming. So far, the seed health program has not been fully implemented in the seed certification (Saleh, 2007). Seed infection by the pathogen may affect seed performance both in quality and quantity. In addition, seeds that contain the pathogen can be a source of inoculums in the subsequent cropping (Sinclair, 1983). A number of soybean genotypes resistant to SSV, BB, and BP diseases have been reported (Habazar and Rudolph, 1996; Asadi et al., 1998; Goradia et al., 2008). However; use of resistant varieties to control soybean diseases is still limited. The emergence of pathogenic strains of diverse virulence between seasons and locations also causes resistance of plants against pathogens still varied, so that soybean control diseases through the use of resistant varieties has not been managed optimally (Sharma et al., 1993). The strategy needs to develop resistant varieties could be done by involving the conserved resistance gene and implementation of pathogen management technology. Introduction of soybean genotypes with resistance genes to SSV, BB, and BP diseases also needs to be done through the mechanism of rotation of space and time. Various studies have proven the use of resistant varieties combined with planting time is very effective for controlling foliar diseases of soybean.
In connection with the exploration of genetic resources which useful in suppressing the disease, the availability of soybean germplasm resources is very important. In spite of its importance towards research on genetic resistance for these foliar pathogens have been limited, In the present study we conducted study to evaluate and screen of soybean germplasms for resistance against
Journal of Agricultural Technology 2012, Vol. 8(2): 751-763
753
foliar pathogens (SSV, BB and BP). The resistance towards the disease complex is expected to become major components and effective measures in controlling soybean diseases in an integrated management. In addition, it can be used as improved varieties or further developed into a source of resistance. Materials and methods
Experimental sites - the intensity of disease and resistance of soybean accession the experiment were conducted at three different agroecological environments in West Java, Indonesia viz. Pacet (1200 m asl), Ciranjang (288 m asl), and Ciwidey (1000 m asl) with the maximum temperature of 24.5oC, 31.3oC, and 25.5oC, respectively. The cultivations were undertaken in the prevailing wet conditions of land (clay texture) with acidic soil pH ranging from 4.35 to 5.74; and moderate P content (Table 1).
Table 1. Soil characteristics at three locations of experiment in West Java, Indonesia
Soil content Ciwidey (1000 m asl)
Pacet (1200 m asl) Ciranjang (288m asl)
texture sandy (%) 26.17 1.45 8.21 loam (%) 20.87 12.90 28.72 clay (%) 52.96 85.65 63.07 pH H2O (1: 2,5) 4.85 5.74 5.32 pH KCl (1:2,5) 4.35 5.16 4.62 Organic: N (%) 0.365 0.343 0.363 C (%) 2.925 2.965 2.686 C/N ratio 8.014 8.644 7.399 P Bray I (mg/100g) 0.525 0.970 0.151 Cation: Ca (me) 9.817 18.642 8.218 Mg (me) 1.267 1.496 1.357 K (me) 0.356 0.270 0.288 Na (me) 0.407 0.500 0.438 Cation exchange capacity (me) 28.864 24.358 44.070 Total Cation (me) Base saturity (%) Al-exchange (me) 6.264 2.523 1.914 H-exchange (me) 1.184 2.548 1.547 Fe (ppm) 234.215 43.276 17.805 Mn (ppm) 11.315 0.333 0.405 Cu (ppm) 10.12 8.13 10.02 Zn (ppm) 16.291 4.405 9.085
754
The 100 soybean accessions were supplied containing both local and exotic collections of ICABIOGRAD germplasm. Screening was also included four improved soybean cultivars i.e. Wilis, Lompobatang, Cikuray and Orba. Soybean seeds cv. Seulawah and Orba were used as a source of inoculums for SSV and bacterial diseases (susceptible check). Cropping was allowed to be naturally infected with bacterial inoculums, since the incidence of BB and BP diseases in previous experiment at the location was suitable for disease spread ranging from 20-30%.The susceptible seeds were planted as border plant, two rows within spacing of 40 cm x 20 cm around the experimental plots a week before the test plants were planted. The experiment was carried out in experimental plots size of 2 x 8 m2 with spacing of 40 cm x 20 cm which was arranged in a randomized block design with three replications. Crops were fertilized with N, P and K with a dose of 60 kg urea, 90 kg of TSP, and 50 kg KCl /ha, respectively. Spraying of insecticides was done depending upon the conditions of insect pest infestation in the field; whilst weeds were controlled with hand hoeing.
Disease assessment- observations to record the development of disease symptoms were taken four times beginning at one month-old soybean plants and continued every two weeks interval until final observation (two weeks before harvest). The severity of SSV disease was scored based on 0-4 scala basis i.e, score 0 = no symptoms, 1 = symptoms of mosaic; 2 = symptoms of mosaic, slightly leaf curl, 3 = symptoms of mosaic, leaf curling, stunted plants; 4 = heavy mosaic symptoms, leaf curling, and stunted plants (Asadi, 2005).
Laboratory testing to confirm the presence of SSV on soybean accessions and its resistance in the field was performed with Enzyme-Linked Immunosorbent Assay (ELISA) using Nitrocellulose membrane following procedure of Fuentes (1993) using specific Cucumber Mosaic Virus-SSV antisera obtained from DSMZ Plant Virus Collection (Braunschweig, Germany). Five young soybean leaves infected with SSV grown in three experimental locations was taken randomly from each plot. Each samples leaves was placed in a plastic bag ca.7 x 10 cm2 containing a preservative silica gel, and then taken to the laboratory and stored in a refrigerator until required. Small pieces of soybean leaves were taken from each sample using 10 mm cork borer, placed in plastic bags ca. 7 x 10 cm2, then it was added with 1 ml of extraction buffer and crushed with a pestle until smooth. Furthermore, 100 μl of leaf extracts were dropped into pieces of membrane size 8 x 12 cm2 and each treatment repeated twice. Soybean accessions evaluation for SSV resistance levels were assessed based on the thickness of the color appearance on the membrane following the criteria of Asadi (2005) i.e, 0 = no color (R); 1= light
Journal of Agricultural Technology 2012, Vol. 8(2): 751-763
755
purple (+/-) (MR); 2= thin violet (+) (MS); 3= violet (+ +) (S) and 4= dark violet (+++) (HS).
SSV isolate (strain Jakarta) was taken from ampoules; and it was homogenized with 0.05 M phosphate buffer pH 7.2. One week old-plants cv were grown in a greenhouse in a polybag size of 5 kg containing a mixture of soil and fertilizer. Plant was mechanically inoculated by rubbing leaves with carborundum 600 mesh containing virus sap extracts. Two weeks after inoculation, the SSV infected soybean leaves were harvested, placed in plastic bags, and stored in a refrigerator for further use in the greenhouse test. Each soybean genotype seed was planted in a polybag diameter of 20 cm containing a mixture of soil and fertilizer. The experiment was arranged in randomized complete block design with four replications. Soybeans plants at V1 stage (age 10-12 days) were inoculated mechanically with SSV inoculums and observations were made daily for SSV symptoms until four weeks after inoculation.
The development of BB disease symptoms were based on disease scale as follows: 0 = no visible symptoms, 1 = symptoms of blight <1% leaf area; 3 = symptoms of blight 1 - <10% of the total leaf area; 5 = symptoms of blight extending to 11 - <25% broad leaf; 7 = symptoms of blight spread and join together to reach 25 - <50% broad leaf; 9 = symptom on leaf area extends > 50% leaf area, chlorosis symptoms appeared. The development of BP disease symptoms was observed based on a scale (score) of disease as follows: 0 = no visible symptoms; 1 = small pustule symptoms <1% leaf area; 3 = small abscess symptoms 1 - <10% of the total leaf area; 5 = symptom of a larger abscess extending to 11 - <25% leaf area; 7 = symptoms of abscess extended and joined each other to reach 25 - <50% leaf area ; 8 = symptoms of abscess extending to> 50% leaf area, chlorosis symptoms appeared. Disease intensity was calculated with the formula I =∑ nz / NZ x 100%, where: I = intensity of the disease; n = number of leaves for each category of infection; v = numerical value of the category of infection; N = total number of leaves were observed, and Z = numeric value for the highest category of infection. Resistance of soybean genotypes to BB and BP diseases were determined using the following criteria: disease intensity 0-25% (Resistant-R); > 25-50% (Moderately Resistant- MR); > 50-75% (Moderately Susceptible-MS); and > 75-100% (Susceptible-S).
The area under disease progress curve (AUDPC) was calculated using the following formula AUDPC = Σ [(Xi+1 + Xi)/2) (ti+1 – ti)] where Xi is the disease severity at the ith observation; ti is the time at the ith observation; and n is the total number of observations (Shaner and Finney, 1977). Yield data obtained
756
from five samples of each soybean accessions (seed weight per hills) then converted into t/ha.
Results
SSV disease. The field research showed high diversity between the resistance of soybean accessions at each location and severity of the disease among locations. The statistical analysis of collective data revealed significant differences for three locations. Results of analysis of variance (ANOVA) in Pacet, Ciranjang, and Ciwidey showed different values of coefficient variation (CV) 23.95%, 29.07%, and 35%, respectively. The intensity of SSV disease on soybean accessions in Pacet ranged between 0 - 66.7% (mean average 3.99 + 0.91%), in Ciranjang 0 - 8.18% (mean 1.79 + 0.27%), and in Ciwidey 0-100% (mean 3.29 + 1.31%). Resistance in the field test results showed that out of 100 accessions tested, 79 accessions were reacted R in Pacet, 90 accessions were reacted R in Ciranjang, and 93 accessions showed R in Ciwidey, respectively (Table 2).
Table 2. Resistance of 100 soybean accessions to SSV based on field test at three locations in W. Java-Indonesia and laboratory test (NCM-ELISA)
Location Test Reaction R M S
Pacet Field 79 9 12 Laboratory 45 32 23 Ciranjang Field 90 8 2 Laboratory 81 19 0 Ciwidey Field 93 0 7 Laboratory 73 27 0
Notes: Accession grouping was performed according to the modified criteria of Asadi (2005). R = Resistant; M = moderate ; S = susceptible. Orba was used as susceptible check.
Infected soybean seeds showed symptoms of brown mottle concentric circle on the surface of the seeds. Seeds of seven soybean accessions, namely TGM 131-1-1-6, M 3028, 1248/1291/39/21/0/0/0, Naga Handaka, Local Nganjuk-1, Menyapa, and Seulawah showed typical symptom which may indicate an infection seeds by SSV.
Strain SSV originated from Jakarta was successfully reared on soybean cv. Orba. Plants which inoculated at the age of 7-10 days after planting began showing symptoms 7 days after inoculation as indicated by the emergence of pale green symptoms on leaves (vein clearing). NCM-ELISA to the samples from each genotype of soybean leaves grown at three locations showed varying
Journal of Agricultural Technology 2012, Vol. 8(2): 751-763
757
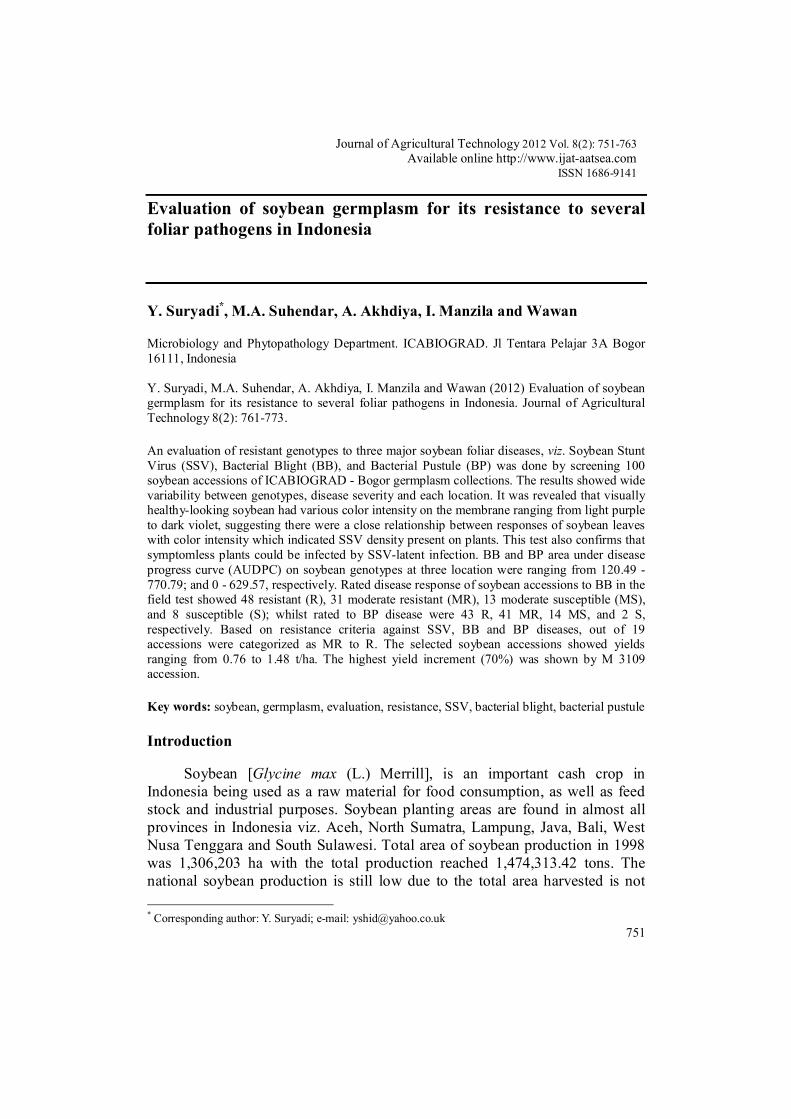
reactions as indicated by different color spot on the membrane ranging from colorless to dark violet (Figure 1).
A B C Fig. 1. An example of NCM-ELISA test to soybean accession collected from the field. A= samples of Pacet, B= samples of Ciranjang, C= samples of Ciwidey
The result of the assay was read visually by color changes on membrane. A thin violet spot means a positive reaction (samples were infected with SSV); increasingly the more dark violet color means the higher the level of infection. Colorless spots, or light purple means a negative reaction (samples were not infected with SSV).
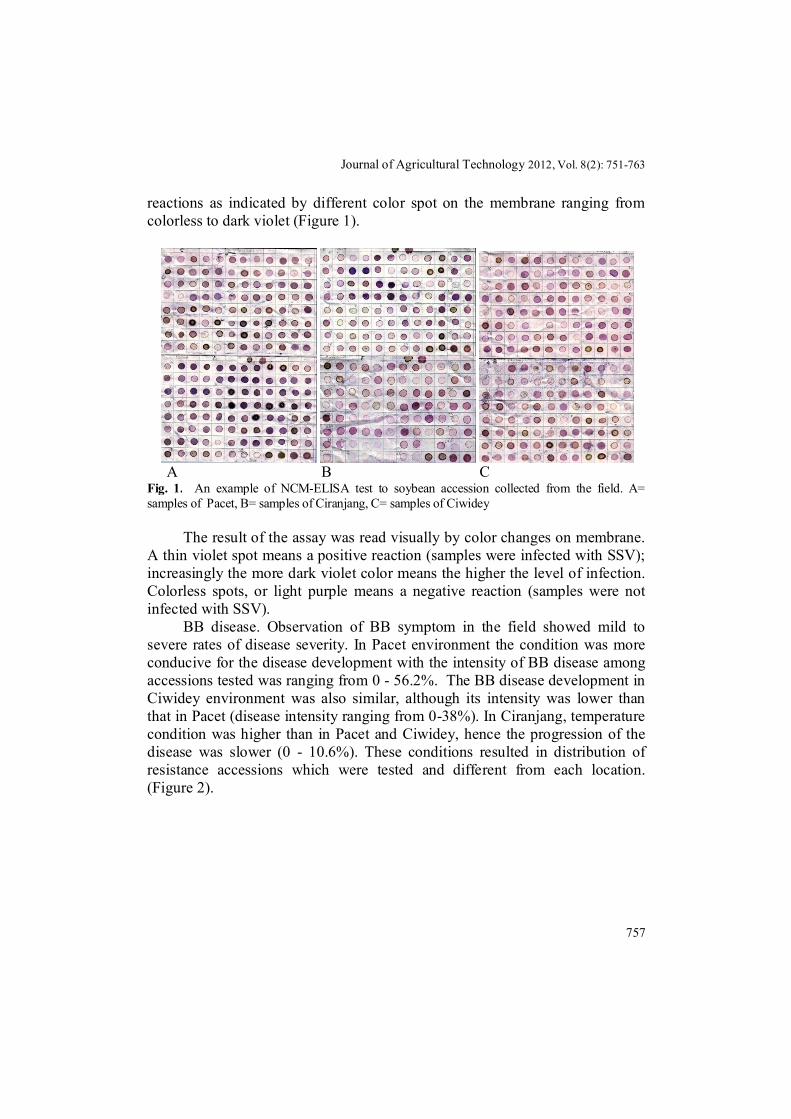
BB disease. Observation of BB symptom in the field showed mild to severe rates of disease severity. In Pacet environment the condition was more conducive for the disease development with the intensity of BB disease among accessions tested was ranging from 0 - 56.2%. The BB disease development in Ciwidey environment was also similar, although its intensity was lower than that in Pacet (disease intensity ranging from 0-38%). In Ciranjang, temperature condition was higher than in Pacet and Ciwidey, hence the progression of the disease was slower (0 - 10.6%). These conditions resulted in distribution of resistance accessions which were tested and different from each location. (Figure 2).
758
Fig. 2. Distribution of soybean accessions against BB disease at three locations.
BP disease. BP disease progression was relatively slower, because the
temperature and humidity conditions was not conducive for the development of BP symptom since they might not support the growth and proliferation of XAG. So, the overall development of the disease was less than BB. The range of BP disease intensity in each location of the experiment were as follows, in Ciwidey 0 to 31.7% with an average of 7.39 + 0.69%, at Pacet 0 to 49.1% with an average of 8.69 + 1.33%, and in Ciranjang 0 to 12.4% with an average of 2.92 + 0.24%. BP disease intensity in Pacet was the highest, in Ciwidey was high but lower than in Pacet, whereas the lowest was observed in Ciranjang. Based on the distribution and intensity of BP disease in three locations, the number of BP resistant accession in Pacet and in Ciwidey relatively was lower than in Ciranjang because disease pressure on soybean accessions in Pacet and Ciwidey was higher than that of Ciranjang (Figure 3).
Fig. 3. Distribution of soybean accessions against BP disease at three locations.
0102030405060
freq
uenc
y di
strib
utio
n (%
)
Pacet Ciranjang Ciwidey
location
RMRMSS
Journal of Agricultural Technology 2012, Vol. 8(2): 751-763
759
The severity of three major diseases of soybean under condition of natural infections in the field is standardized by weighted average (WA) (Table 3). Based on the criteria of resistance reactions, almost all the selected genotypes showed BB and BP disease reaction in field varied from MR to R. Overall result of soybean accessions evaluation against foliar pathogen SSV, BB, and BP in the field has been selected 19 accessions of soybean resistant (R) and moderately resistant (MR) reaction against the three diseases. Table 3. Evaluation of the resistance of some selected soybean accessions to SSV, BB, and BP pathogen based on the reaction in the field Accession WA Ranking Locations
Pacet Ciranjang Ciwidey SSV BB BP SSV BB BP SSV BB BP
Improve Pelican 0.88 3 R R R MR MR R R R R Avoyelles 17193 1.77 8 R R R R R R R MR R 23695/Hawes Reh-2 1.82 10 R R R R R R MR MR R TGM 131-1-1-6 2.64 16 R R R MR R R MR MR R M.2996 2.84 17 MR MR R R MR R MR MR R M.3019 1.95 11 MR R R MR MR R R MR R M.3024 2.57 15 R R R MR MR R MR MR R M.3025 1.53 6 R R R R R R MR MR R M.3026 1.80 9 MR R R MR MR R R MR R M.2566 2.31 13 MR MR R R R R MR MR R 17/20/16/13/0 1.67 7 MR R R R R R MR R R PI.24807xPI.867736 0.83 2 R R R MR MR R R R R IB 2 / 2 2.43 14 MR MR R MR MR R R R R M.3109 3.97 19 MR MR R R MR R MR MR R M.3192 1.34 5 R R R R R R R MR R 30114-5-1 3.28 18 R MR R MR R R MR MR R GM.2789 Si 2.22 12 MR MR R R R R R MR R GM 4779 Si 0.53 1 R R R R R R R R R M.3077 0.98 4 MR MR R R R R R R R Orba - - R MR R R MR R R MR R Notes: R = Resistant; MR = moderately resistant; MS= moderately susceptible; S= susceptible; (SSV: R = <25%, MR = 25-50%; S = > 50%); (BB/BP: R <2.85%; MR = 2.85-12.80%; MS = 12.80 - 5.28%, S = > 28.5%). WA (weighted average) = Σ (Yi/S2)/Σ (1/S2).
From the present study, GM 4779 Si showed the lowest severity. This accession was observed as the 1st ranking and showed stable reactions to the foliar diseases in three locations. Mean analysis of bacterial disease progression as measured by AUDPC value at different interval observation of whole soybeans accessions at three locations showed the BB AUDPC value ranged from 120.49 to 770.79, and BP from 0 - 629.57, respectively (Table 4).
760
Among the accessions tested, 17/20/16/3/0 accession was recorded had zero BP AUDPC value followed by Improve Pelican accession (<50). The average soybean yield was range 0.59 to 1.49 t/ha. The seed yield at harvest was still low compared with the potential yield and this fact was might due to various factors. The harvesting seed of 19 selected soybean accessions ranged from 0.76 to 1.48 t/ha, and the highest difference (70%) obtained by F 3109 accession, whilst TGM 131-1 - 1-6; M.3024, M.2566, M.3192 were lower when compared with the standard cv Orba. Results showed differences in seed yield compared with cv. Orba ranged from -32.18% to 70.11%. Relationship between BB and BP disease development and yield showed the declining trend of seed yield with increasing intensity of the disease as indicated by the linear regression equation for BB and BP viz. Y = 1.31 - 0.007 (X) r =- 0.33; and Y = 1.69 -0.009 (X); r =- 0.28, respectively. Table 4. Analysis of disease epidemics AUDPC value of BB and BP at the three locations and comparison between 19 accessions and 10 cultivars of soybean Accessions Mean AUDPC value Yield Yield differences with Orba
Journal of Agricultural Technology 2012, Vol. 8(2): 751-763
761
Cikuray 299.24 126.39 0.81 (-6.89) Seulawah 377.56 248.13 0.89 2.29 Willis 311.63 132.28 1.27 45.98 Lompobatang 535.98 212.20 0.82 (-5.75) Orba 454.58 340.41 0.87 - Notes: The yield data was converted to t/ha with a population of 125 000 plants/ha. Disscussion
The average of coefficient variation (CV) data observed at all three locations of the experiment was 29%. CV with a relatively high value was probably caused by the differences of the ecological environment factors, the diversity of varieties, source of inoculums, inoculums quantity, and the population vector of SSV.
The present study revealed that some symptomless soybean leaf samples to SSV, reacted positively to the SSV antisera. This phenomenon may be indicated that latent infection of viral pathogens present on several soybean accessions. It was shown that 45 samples of soybean accessions originated from Pacet reacted resistant, 81 samples of Ciranjang reacted resistant, and 73 accessions of Ciwidey reacted resistant.
Results of the laboratory test were not consistent with the field test. This was possible because the observations in the field based solely on visual symptoms, whilst viral infection of the plants did not always show symptoms although infected with a virus (latent infection), particularly in the tolerant varieties. Confirmation test of soybean accessions in the greenhouse which is done by artificial inoculation technique using SSV inoculums strains Jakarta showed similar results with the field test results (data not shown). This indicates that observations data was in line with the results of field tests, hence the greenhouse test can be used for rapid initial screening, then it was suggested to retest by NCM-ELISA to confirm its resistance to SSV.
Based on artificial inoculation techniques using SSV and CMMV and NCM- ELISA against 100 soybean accessions showed that five soybean accessions (Lompobatang, MLG 2521, B3570, Engopa 305, and UFV-10-1) were reported resistant to SSV and CMMV, while Taichung only resistant to SSV (Asadi et al., 1998). Brown color aberration (striped brown seed discoloration) can be used as an indicator of SSV infection on soybean seeds. If the intensity of the striped brown seed is high, then the chances of early infection and disease intensity of plants in the field would also high, because the SSV would be transmitted via seed. If a new planting in the field was infected by SSV at early stage, the disease severity usually would cause very high seed infection and poor yields (Tamada, 1977).
762
Soybean BB pathogen had shown high ability to form new races to defend its existence on the varieties containing different resistance genes. PSG virulence studies on cv. Willis showed that isolates varied from low to high virulence soybean plants which inoculated by PSG at the flowering stage can produce a high intensity of seed infection. Four types or races of BB pathogens were reported in Indonesia which causes damage to the crop. Habazar and Rudolph (1996) reported that the virulence of PSG on seven soybean differential varieties (Acme, Chippewa, Flambeau, Harosoy, Lindarin, the Merit, and Norchief) in West Sumatra belongs to Race 4, Race 5, and Race 9. Fluctuations in the composition of the dominant race of bacteria from one place to another place and season to season have been reported in several countries which is closely related to the composition of the host genotype planted in the field (Machmud and Surachmat, 1988). Aini (1992) evaluated the resistance of some soybean cultivars to BB disease at semi-field conditions in South Kalimantan and reported that cv. Lokon and Orba reacted resistant. Meanwhile, Dirmawati (1996) evaluated five soybean cultivars in Yogyakarta and showed that cv. Malabar and Cikuray were resistant to BB with yield losses varies between 13-17%. In East Java, three soybean genotypes (Lokon, Willis, and MSC 6813-6-8) were reported reacted resistant to BB (Rahayu, 2008). Resistance of soybean to BB disease showed that varieties Willis was more resistant compared with Galunggung and Orba (Machmud and Surachmat, 1988). Habazar and Rudolph (1996) evaluated 11 cultivars of soybean resistance to artificial inoculation and reported that cultivars Orba and Lokon were resistant, while Willis was susceptible.
It was still need to find other sources of resistance on soybean germplasm to enrich the information for selection of soybean plants resistant mainly to foliar diseases. To view genotypic differences that can improve the control efficiency of much higher yield it still require further study to re-plant selected resistant accessions at the field conditions with or without full protection in many soybean production centers to determine the effectiveness of genetic resistance to foliar SSV, BB and BP diseases. Conclusion
It was shown that 19 accessions were promising and selected as the source for resistance to foliar pathogens SSV, BB and BP. Resistance of soybean accession to SSV in the field has been confirmed by laboratory testing using NCM-ELISA which can be used as a rapid and practical technique for confirmation of soybean accession resistant to SSV. Selected soybean accessions had yield ranged from 0.76 – 1.48 t/ha when compared with control cv. Orba, with the highest differences obtained by accession of M 3109 (70%
Journal of Agricultural Technology 2012, Vol. 8(2): 751-763
763
higher). To follow up the field test, these resistant accessions should be explored further in large scale in many soybean production centers for both the mechanism of its durability and efficiency to foliar disease control.
Acknowledgments
The authors are very grateful to the Indonesian Ministry of Education research project through AARD-SINTA Project No 952/HM.240/I.9/10/2009 for supporting the financial aid to conduct this experiments. The authors would like to thank Dr. Muhammad Machmud for his critical reading of the manuscript. References Aini, M.H. (1992). Penyakit bakteri pada kedelai di Kalimantan Selatan: Identifikasi, kehilangan hasil,
dan kelangsungan hidup patogen. PhD Thesis, Institut Pertanian Bogor (IPB), Bogor [In Indonesian].
Asadi, Sawahata H, Nakano M, Roechan M, Jumanto H, Dewi N, Arsyad, D.M. (1998). In: Soybean breeding for resistance to SSV and CMMV diseases. Proc. JICA Seminar, CRIFC, Bogor.
Asadi. 2005. Genetika ketahanan dan pemuliaan kedelai terhadap virus kerdil (soybean stunt virus). PhD Thesis, UGM, Yogyakarta. [In Indonesian].
Dirmawati, S.R. (1996). Ketahanan lima varietas kedelai terhadap dua isolat X. campestris pv. glycines. J. Penel. Pengemb. Wil. Lahan Kering. No. 17. Lembaga Penelitian Univ. Lampung. [In Indonesian].
Fuentes, S. (1993). Detection of sweet potato viruses using NCM-ELISA techniques. Int. Potato center (CIP), Lima, Peru.
Goradia, L., Hartman, G.L. and Daniel, S.L. (2008). Evaluation of glyphosate-tolerant soybean cultivars for resistance to bacterial pustule. Eur. J. of Plant Pathol. 124(2): 331-335.
Habazar, T. and Rudolph, K. (1996). Isolation and characterization of bacterial diseases of soybean from different region in Indonesia. In: Internat'l. Conf. on Plant Pathogenc Bacteria. Madras.
Machmud, M Surachmat. (1988). Current major diseases of important crops in Indonesia. In: Rifai et al., (eds). Proc. of the symposium on crop pathogens and nematodes. Biotrop special publications no 34. p:41-61.
Rahayu, M. (2008). Tanggapan varietas kedelai terhadap penyakit pustul X. axonopodis dan potensi ekstrak nabati untuk pengendaliannya. Balitkabi, Malang p: 392-399. [In Indonesian].
Saleh, N. (2007). Sistem produksi kacang-kacangan untuk menghasilkan benih bebas virus. Iptek Tan. Pangan 2 (1): 66 – 78. [In Indonesian].
Shaner G, Finney RE. 1977. The effect of Nitrogen fertilization on the expression of slow mildewing resistance in Knox wheat. Phytopathology 67:1051-1056.
Sharma A, Nair PM, Pawar SE. 1993. Identification of soybean strains resistant to X. campestris pv. glycines. Euphytica 67(12):95-99.
Sinclair, J.B. (1983). Compendium of soybean diseases. Amer. Phytopathol. Soc., St Paul, Minn. 104 pp. Tamada, T. (1977). The virus diseases of soybean in Japan. ASPAC Food and Fertilizer Technol. Center.