201
Evaluation of the American Indian Vocational Rehabilitation Services Program Paul J. Hopstock Carol Ann Baker Joseph E. Kelley Todd G. Stephenson June 30, 2002 DEVELOPMENT ASSOCIATES, INC.

Evaluation of the American IndianVocational Rehabilitation Services Program
Paul J. HopstockCarol Ann BakerJoseph E. Kelley
Todd G. Stephenson
June 30, 2002
DEVELOPMENT ASSOCIATES, INC.

Prepared for theRehabilitation Services Administration
U.S. Department of EducationWashington, D.C.
Prepared byDevelopment Associates, Inc.
1730 North Lynn Street Arlington, VA 22209
(703) 276-0677
Contract No. ED-99-CO-0127

TABLE OF CONTENTS
Executive Summary......................................................................................................iAcknowledgements.......................................................................................................vii1. Introduction.......................................................................................................1
A. Background...........................................................................................1B. The AIVRS Program.............................................................................1C. Law and Regulation for the AIVRS Program.......................................4D. Training and Technical Assistance Resources......................................5E. Prevalence of Disabilities Among Native Americans..........................5F. Challenges for AIVRS Projects............................................................6G. Terms Used in This Report...................................................................7
2. Study Design and Methodology........................................................................9A. Objectives.............................................................................................9B. Design...................................................................................................11C. Sampling...............................................................................................12D. Data Analysis........................................................................................15
3. Community Contexts for AIVRS Projects........................................................17A. Physical Settings for Projects................................................................17B. Project Service Areas............................................................................18C. Service Availability..............................................................................21D. Economic Environments.......................................................................22
4. Consumer Population........................................................................................26A. Numbers of Consumers Served............................................................26B. Consumer Characteristics.....................................................................30C. Comparison with State VR Programs...................................................34D. Unserved Populations...........................................................................36
5. Organizational Structure and Management......................................................39A. Organizational Location........................................................................39B. Personnel...............................................................................................40C. Outreach................................................................................................45D. Record Keeping....................................................................................46E. Advisory Group....................................................................................49F. Coordination with the State VR Agency..............................................52G. Coordination with Other Service Providers..........................................53H. Monitoring and Evaluation...................................................................53I. Communication and Assistance from RSA..........................................54J. Implementation Issues..........................................................................54
6. Vocational Rehabilitation Practices..................................................................57A. Eligibility Determination......................................................................57B. Vocational Assessment.........................................................................58 C. Service Plans.........................................................................................58 D. Consumer Choice..................................................................................59E. Due Process...........................................................................................60
7. Vocational Rehabilitation Services...................................................................61A. Services Offered by Projects.................................................................61 B. Service Providers..................................................................................66 C. Comparison with State VR Programs...................................................69
8. Consumer Outcomes.........................................................................................72A. Employment Outcomes.........................................................................72 B. Comparison with State VR Programs...................................................79C. Variables Related to Successful Outcomes...........................................82
9. Program Costs...................................................................................................87 A. Costs of Services...................................................................................87 B. Cost Effectiveness.................................................................................90 C. Comparison with State VR Programs...................................................91
10. Assessments of the Program..................................................................................94A. Innovative and Effective Practices........................................................94 B. Project Improvement.............................................................................96 C. Program Improvement..........................................................................97
11. Conclusions and Recommendations.................................................................99 A. Conclusions...........................................................................................99 B. Recommendations.................................................................................101
References ...............................................................................................................103Appendices
Appendix A: AIVRS Projects (2000-2001).....................................................105Appendix B: Description of Effective Practices .............................................107Appendix C: Draft Guidelines for AIVRS Rehabilitation
Counselor Training...................................................................110Appendix D: Draft Guidelines on the Use of Objectives to
Manage AIVRS Projects...........................................................116

EXECUTIVE SUMMARY
On August 31, 1999, the Rehabilitation Services Administration (RSA) of the U.S. Department of Education awarded a contract to Development Associates, Inc. of Arlington, Virginia to conduct an evaluation of the American Indian Vocational Rehabilitation Services (AIVRS) program. The AIVRS program provides grants to governing bodies of Indian tribes located on Federal and State reservations and to consortia of such governing bodies to provide vocational rehabilitation (VR) services.
The AIVRS program has expanded rapidly in recent years, from 16 projects in 1992 to 64 projects in 2000-2001. Nine of the 64 projects in 2000-2001 initiated their program activities beginning October 1, 2000. One project had previously received funding, but has not operated with Federal funding since September 1988. These ten new projects were not included in the evaluation. Approximately 40 percent of the 2000-2001 AIVRS grants were between $300,000 and $349,999, and 70 percent were between $250,000 and 399,999.
The major objectives of the evaluation were:
1. Describe and analyze the characteristics, services received, and outcomes of Native Americans with disabilities.
2. Identify the degree to which Native Americans are not served or are underserved in the AIVRS projects' services areas.
3. Describe the organizational structures and management of the projects.4. Describe the projects' vocational rehabilitation (VR) practices, regarding: vocational
assessment, determining eligibility for services, developing plans for services, fostering consumer choice, and delivering services.
5. Identify the cost-effectiveness of established AIVRS projects.6. Describe the economic and resource environments of the projects.7. Identify best practices and make recommendations for program improvement.
The evaluation included five data collection activities:
1. A mail survey to the 54 AIVRS projects with funding in FY1999 and FY20002. Site visits to 29 of those projects
Interviews with the project director, tribal representative(s), advisory group members, service providers, and local State VR staff member(s)
A focus group with project staff members Case record reviews of 30 closed cases and 20 open cases
3. Telephone interviews with 3 other AIVRS project directors4. Telephone interviews with Rehabilitation Services Administration staff members 5. Comparison of AIVRS case records with State VR case records
i

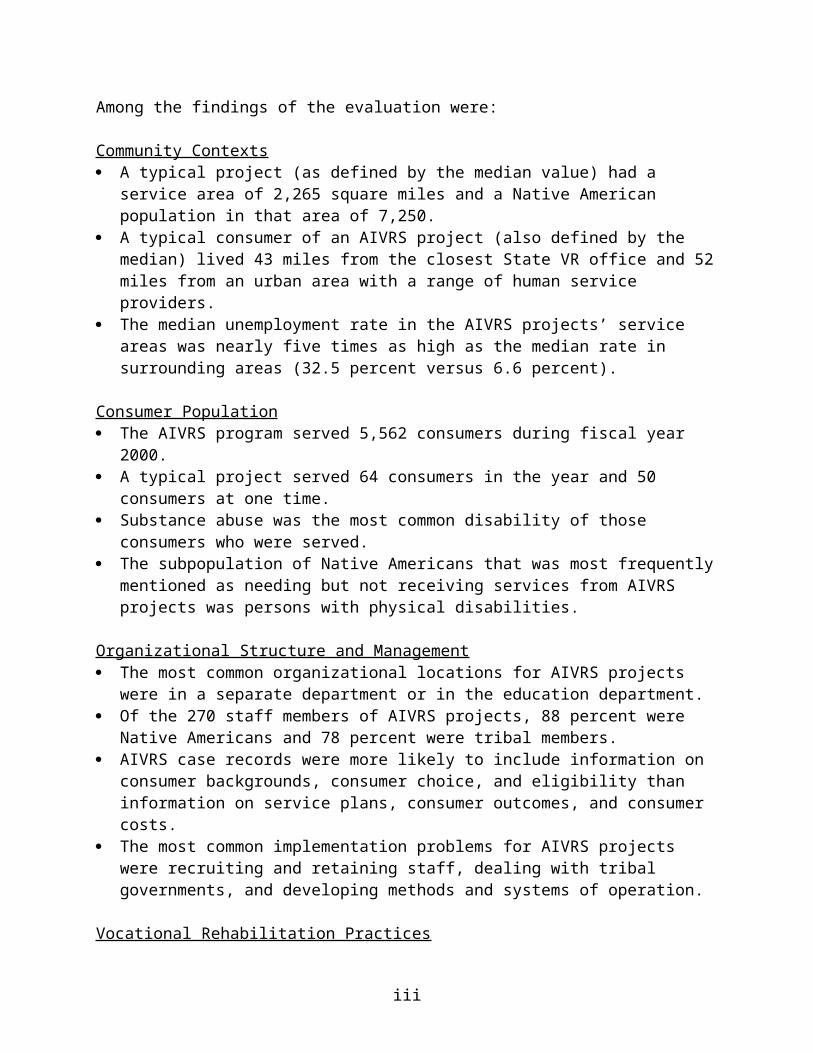
Among the findings of the evaluation were:
Community Contexts A typical project (as defined by the median value) had a service area of 2,265 square miles
and a Native American population in that area of 7,250. A typical consumer of an AIVRS project (also defined by the median) lived 43 miles from
the closest State VR office and 52 miles from an urban area with a range of human service providers.
The median unemployment rate in the AIVRS projects’ service areas was nearly five times as high as the median rate in surrounding areas (32.5 percent versus 6.6 percent).
Consumer Population The AIVRS program served 5,562 consumers during fiscal year 2000. A typical project served 64 consumers in the year and 50 consumers at one time. Substance abuse was the most common disability of those consumers who were served. The subpopulation of Native Americans that was most frequently mentioned as needing but
not receiving services from AIVRS projects was persons with physical disabilities.
Organizational Structure and Management The most common organizational locations for AIVRS projects were in a separate
department or in the education department. Of the 270 staff members of AIVRS projects, 88 percent were Native Americans and 78
percent were tribal members. AIVRS case records were more likely to include information on consumer backgrounds,
consumer choice, and eligibility than information on service plans, consumer outcomes, and consumer costs.
The most common implementation problems for AIVRS projects were recruiting and retaining staff, dealing with tribal governments, and developing methods and systems of operation.
Vocational Rehabilitation Practices AIVRS projects were fulfilling the legislation requirements concerning consumer eligibility. All of the projects had consumer appeals processes, but there were few appeals by AIVRS
consumers.
Vocational Rehabilitation Services According to records, the services most often received by AIVRS consumers were vocational
counseling and guidance, vocational assessments, medical consultation and treatment, and substance abuse services. In addition, AIVRS projects indicated that they provided transportation services to many consumers.
A typical consumer received three different services.
ii

Consumer Outcomes According to projects, 64 percent of AIVRS consumers who received services under an
Individual Plan of Employment (IPE) and whose cases were closed between October 1, 1999 and September 30, 2000 had successful employment outcomes. The comparable rate for Native American consumers in the State VR program in FY98 and FY99 was 53 percent.
Of all closed cases reviewed (including those not eligible and who did not receive any services under an IPE), 25 percent had successful employment outcomes. This is comparable to the rate for Native Americans served by State VR agencies.
At the project level, the professional staffs’ years of vocational rehabilitation experience was positively related to the proportion of successful outcomes. The number of years that projects had received federal funding was positively related to the number of successful outcomes.
The consumers with successful outcomes were generally older, had more education, possessed more work experience, and were more likely to be previously served by AIVRS than the consumers with unsuccessful outcomes.
Program Costs AIVRS projects spent approximately 45 percent of their budgets on staff salaries, 28 percent
on purchased services and other consumer costs, and 27 percent on other costs. More established AIVRS projects were more cost-effective than the newer projects.
Assessments of the Program Common effective features of AIVRS projects according to project directors were cultural
sensitivity to consumers, consumer involvement in planning services, a consumer-centered approach, teamwork among staff, effective coordination with other agencies, cost-sharing, and extensive staff training.
The major areas identified by non-project staff for project improvement were staffing, facilities, additional funding, and interagency coordination.
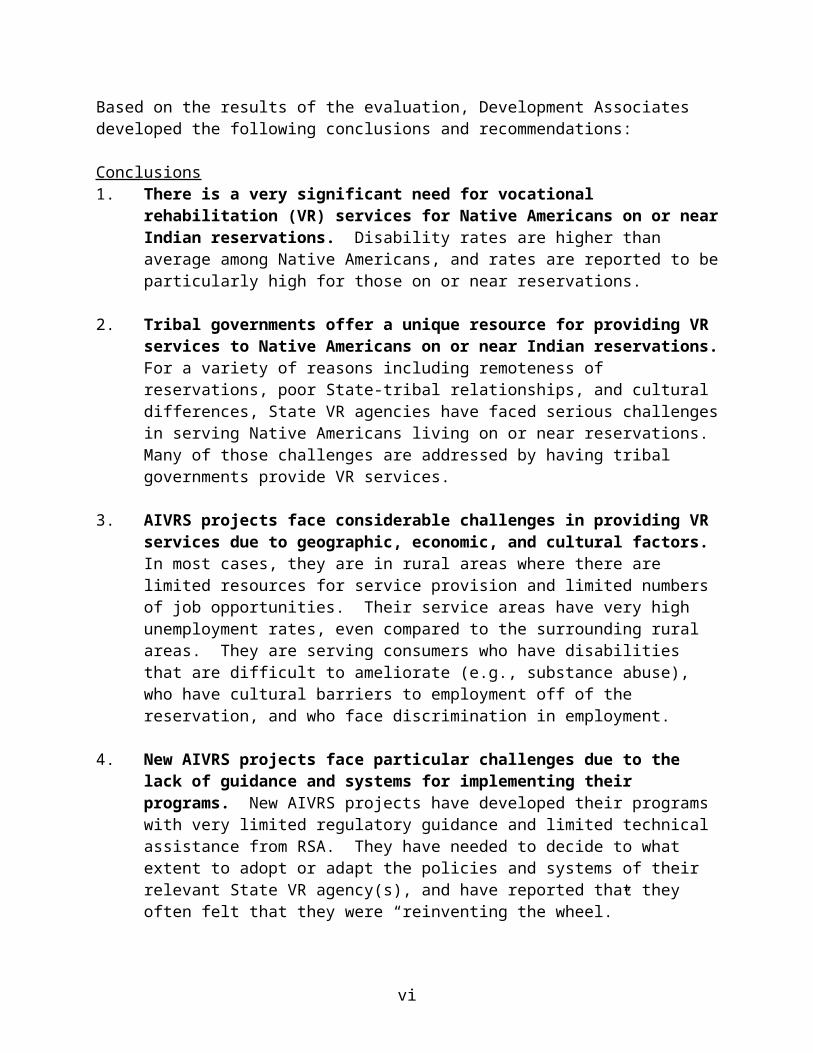
Based on the results of the evaluation, Development Associates developed the following conclusions and recommendations:
Conclusions1. There is a very significant need for vocational rehabilitation (VR) services for
Native Americans on or near Indian reservations. Disability rates are higher than average among Native Americans, and rates are reported to be particularly high for those on or near reservations.
2. Tribal governments offer a unique resource for providing VR services to Native Americans on or near Indian reservations. For a variety of reasons including remoteness of reservations, poor State-tribal relationships, and cultural differences, State VR agencies have faced serious challenges in serving Native Americans living on or near reservations. Many of those challenges are addressed by having tribal governments provide VR services.
iii
3. AIVRS projects face considerable challenges in providing VR services due to geographic, economic, and cultural factors. In most cases, they are in rural areas where there are limited resources for service provision and limited numbers of job opportunities. Their service areas have very high unemployment rates, even compared to the surrounding rural areas. They are serving consumers who have disabilities that are difficult to ameliorate (e.g., substance abuse), who have cultural barriers to employment off of the reservation, and who face discrimination in employment.
4. New AIVRS projects face particular challenges due to the lack of guidance and systems for implementing their programs. New AIVRS projects have developed their programs with very limited regulatory guidance and limited technical assistance from RSA. They have needed to decide to what extent to adopt or adapt the policies and systems of their relevant State VR agency(s), and have reported that they often felt that they were “reinventing the wheel.”
5. Many AIVRS projects face challenges in recruiting and retaining qualified staff members and in developing appropriate relationships with their tribal governments. The combinations of skills required for project director and counselor positions in AIVRS projects (VR knowledge, cultural knowledge, management skills, and personal/ counseling skills) are extremely difficult to find in Native American communities, and persons with those skills have a range of job opportunities.
Some projects also have difficulty in maintaining the autonomy needed to implement VR requirements, because tribal officials desire to have management control. Projects sometimes have difficulty in applying VR eligibility standards, maintaining the confidentiality of consumers, and efficiently controlling project resources to meet the needs of consumers.
6. AIVRS projects are generally applying established VR principles and methods to providing services. Despite the fact that many of the projects are new to VR, projects appear to be providing services that are comparable to services provided by State VR agencies. They are applying VR eligibility criteria, developing IPEs, involving consumers in decision-making, and providing a range of rehabilitation services.
7. The quality and completeness of case records is satisfactory at a majority of AIVRS projects, but there are record-keeping weaknesses at a number of projects. There was wide variability both in the quality of record-keeping systems and in the implementation of those systems. Projects that worked closely with the State VR programs appeared to be more likely to have effective record-keeping systems.
8. The functioning of AIVRS project advisory groups could be strengthened. AIVRS projects are not required to have advisory groups. Where there are groups, project directors and advisory group members reported some confusion about the groups’ roles, and reported problems with attendance. Native Americans have experience participating in tribal government structures, but not in advisory groups.
iv

9. AIVRS projects are generating appropriate levels of successful employment outcomes at reasonable costs. Given the challenging environments in which they work, the rates of successful closures by AIVRS projects should be considered as very good. They are comparable to rates for Native Americans served by State VR agencies, who often live in areas with more positive economic environments. The costs per consumer are also reasonable, especially for more established projects.
10. AIVRS projects in geographically remote areas face the most challenges. Projects in remote locations were working in service areas with higher unemployment rates, had fewer resources for services, and had lower rates of successful closures. They needed to be particularly creative in providing VR services to meet the needs of their consumers.
Recommendations1. Consideration should be given to developing orientation materials and training for
new AIVRS projects, including materials for tribal officials. Many new projects have slow start-ups, at least partially because of the time needed to learn about VR. RSA could facilitate project start-ups by developing a manual for new projects, developing orientation materials for tribal officials, and holding an orientation session for new projects.
2. RSA should develop training guidelines for AIVRS counselors with limited backgrounds in VR. Many of the persons serving in counselor positions in AIVRS projects have limited backgrounds in VR. Projects provide a great deal of training to address the needs of these counselors, but the content and design of that training varies widely. RSA could assist AIVRS projects by developing guidelines for the types of training non-certified counselors should receive.
3 RSA should develop monitoring and evaluation guidelines for AIVRS projects to strengthen internal project assessment and reporting to RSA. It would be useful to projects if RSA would provide guidelines for monitoring and evaluating their efforts. Such guidelines could define the types of objectives that might be measured, methods, procedures, and schedules for measuring progress, and possible roles for project staff and others in implementing monitoring and evaluation activities.
4. RSA should develop an initiative to increase communication and cooperation between State VR agencies and AIVRS projects. Many AIVRS projects work closely and well with their relevant State VR agency(s), but others do not. RSA can facilitate such communication and cooperation by encouraging contacts, by providing information about the AIVRS program to State agencies, and by disseminating effective models of collaboration to State agencies and AIVRS projects.
5. RSA should provide training to AIVRS project directors on the development and effective use of advisory groups. Advisory groups can be a useful mechanism for getting input and reactions from community members and service providers on project services. Advisory group training could address such topics as the composition of
v

effective groups, useful roles for advisory groups, how to train advisory group members, and how to motivate effective participation.
6. RSA should identify and publicize models for improving transportation systems and developing small businesses that can serve and employ AIVRS consumers. Many of the AIVRS projects are in areas that lack transportation infrastructure and small business opportunities. RSA’s technical assistance providers could identify and publicize creative approaches that have been used to address these issues.
7. RSA should increase on-site monitoring and technical assistance by RSA staff to AIVRS projects. Both AIVRS project directors and RSA staff members indicated that there was a need for more on-site visits to AIVRS projects by RSA staff. Such visits provide useful monitoring information for RSA, encourage self-evaluation by projects, and increase the visibility of the projects among tribal officials and the community.
vi
ACKNOWLEDGEMENTS
The authors would like to thank Dr. Harold Kay of the Rehabilitation Services Administration (RSA) of the U.S. Department of Education (ED), who served as the Contracting Officer’s Technical Representative (COTR) for the project and who provided much useful guidance and assistance throughout the evaluation process.
We would also like to thank the members of the Panel of Experts who helped to guide the direction of the evaluation and who provided useful comments throughout the process (in alphabetical order): James Alarid, New Mexico Highlands University; James Downing, U.S. Department of Labor; Alvin Ducheneaux, consumer representative; Becky Hayward, Research Triangle Institute; Joe Mathews, Montana Division of Disability Services; Treva Roanhorse, The Navajo Nation; Priscilla Sanderson, American Indian Rehabilitation Research and Training Center; and Delorna Strong, Apache Tribe of Oklahoma.
A number of other staff members from ED were also helpful in providing information and in offering guidance, in particular Suzanne Tillman, Pamela Martin, and Richard Corbridge from RSA, Laurie Collins from the Budget Service, and James Maxwell of the Planning and Evaluation Service.
We would like to thank our data collection team leaders who were responsible for on-site data collection: Mary Helen Deer, Nancy Gale, Gerald Hill, Pamela Iron, Jerry Kinsman, Daniel Van Otten, and Caren Trujillo. They were assisted ably in performing record reviews by local data collectors at each site.
Finally, we would like to thank the project directors and staff members at AIVRS projects who assisted us in our data collection. The evaluation placed considerable demands on projects, and their help was essential to the evaluation. We thank them for their efforts.
vii

1. INTRODUCTION
A. Background
On August 31, 1999, the U.S. Department of Education (ED) awarded a contract to Development Associates, Inc. of Arlington, Virginia to conduct an evaluation of the American Indian Vocational Rehabilitation Services (AIVRS) program. The Rehabilitation Services Administration (RSA) of ED oversees the AIVRS program
The broad purposes of the evaluation were to provide a descriptive picture of the AIVRS program, to examine the costs and outcomes of the program, and to draw conclusions and make recommendations concerning the future of the program. The detailed evaluation objectives are presented in Section 2A of this report.
B. The AIVRS Program
Under Section 121 of the Rehabilitation Act, the American Indian Vocational Rehabilitation Services (AIVRS) program provides grants to governing bodies of Indian tribes located on Federal and State reservations and to consortia of such governing bodies to provide vocational rehabilitation services. Vocational rehabilitation services may include any goods or services necessary to render an individual with disability employable, such as vocational evaluation, counseling, mental and physical restoration, education, vocational training, work adjustment, job placement, and post employment services. The services provided can include native healing services when these are determined to be necessary to the rehabilitation of the individual. Priority is given to serving individuals with the most significant disabilities.
The first grant to a tribe was in 1981 to the Navajo Vocational Rehabilitation Program (NVRP). Funding to other tribes began in 1986, and the program has been funded as a set-aside since 1987. The AIVRS program has expanded rapidly in recent years, from 16 projects in 1992 to 64 projects in 2000-2001. Nine of the 64 projects in 2000-2001 initiated their program activities beginning October 1, 2000. One project had previously received funding, but has not operated with Federal funding since September 1988. These ten new projects were not included in the evaluation.
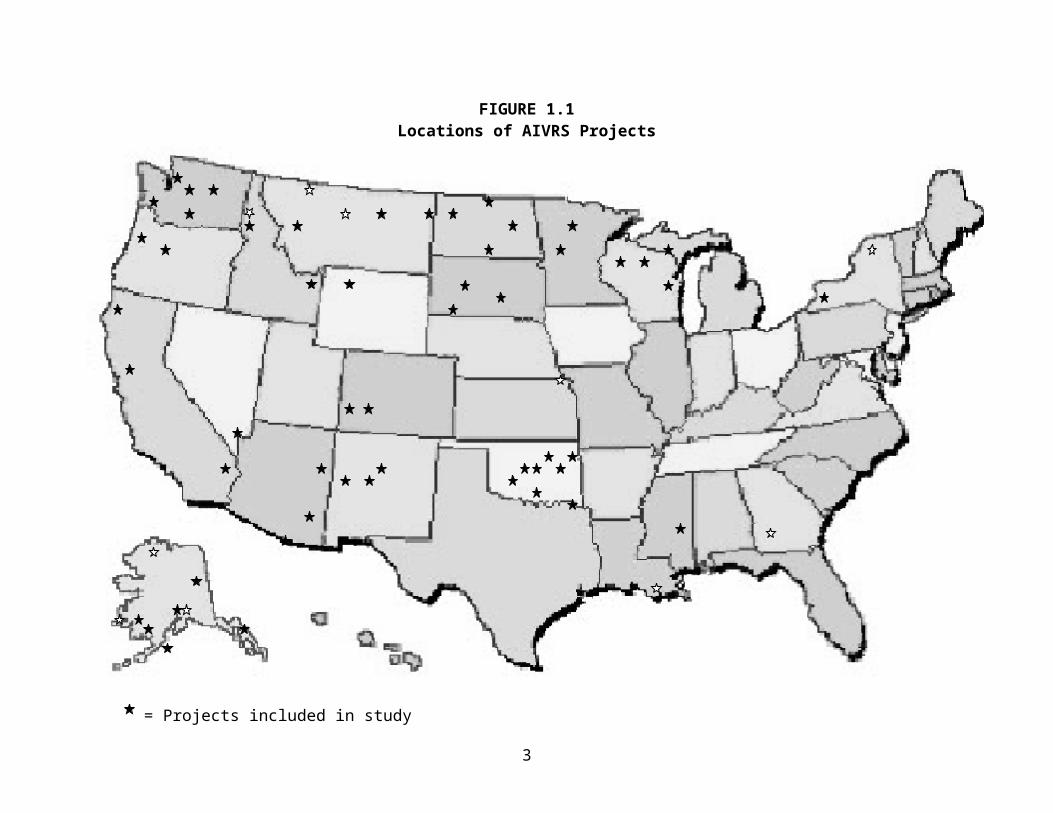
The geographic locations of the 64 projects in operation in 2000-2001 are shown in Figure 1.1. Most of the projects are in the western portion of the U.S., which parallels the location of Native American people. In 1993, the Bureau of Indian Affairs estimated that there were 1.2 million Native Americans living on or near Federal Indian reservations. A listing of the grantees and their locations is provided in Appendix A.
.
1

FIGURE 1.1 Locations of AIVRS Projects
= Projects included in study=Projects not included in study (first funded during FY 2000)
2

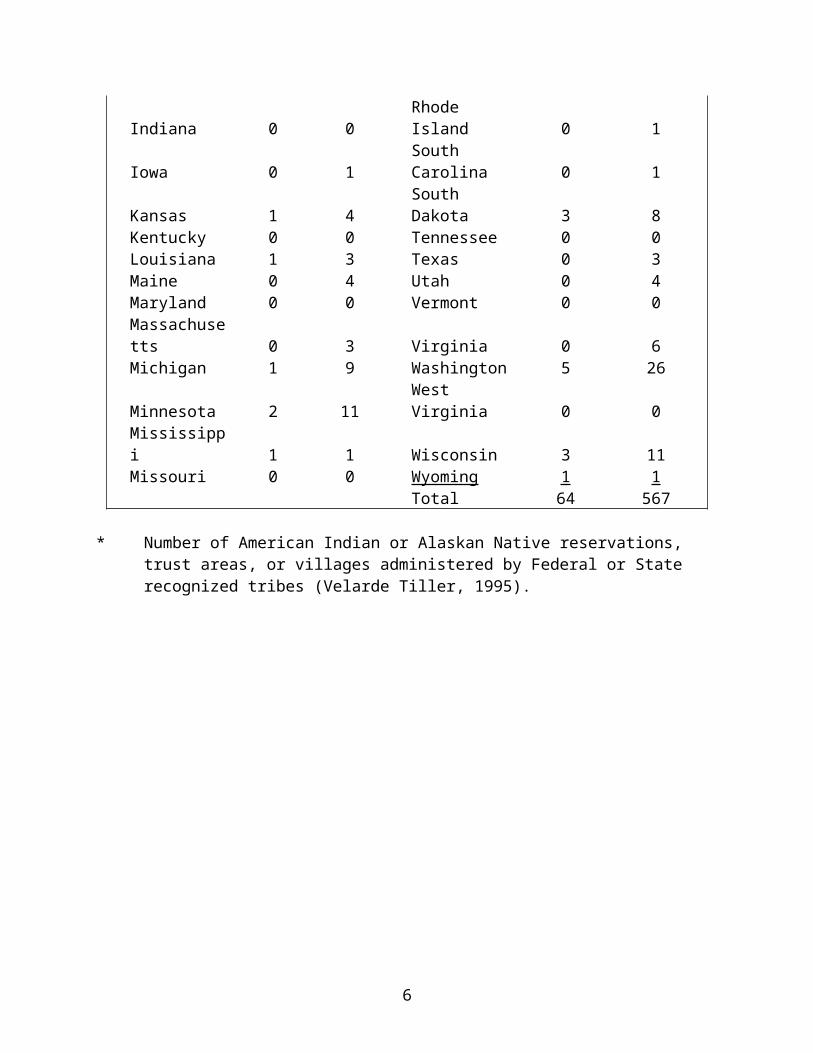
Table 1.1 shows the number of AIVRS projects in each State, as well as the number of American Indian or Alaskan Native reservations, trust areas, or villages administered by Federal or State recognized tribes. The latter number represents the potential population of grantees, as each area could conceivably be served by a separate project. However, many of the current projects serve more than one area or tribe. For example, in Alaska, projects are operated by groups serving large numbers of Alaskan Native villages.
TABLE 1.1Number of AIVRS Projects and the Number of
Eligible Locations in Each State
StateAIVRS Projects
Eligible for
AIVRS Grants* State
AIVRS Projects
Eligible for AIVRS Grants*
Alaska 9 223 Montana 5 7Alabama 0 1 Nebraska 0 4Arizona 3 20 Nevada 1 25Arkansas 0 0 New Hampshire 0 0California 3 79 New Jersey 0 3Colorado 2 2 New Mexico 3 24Connecticut 0 5 New York 2 11Delaware 0 1 North Carolina 0 6Florida 0 7 North Dakota 4 4Georgia 1 2 Ohio 0 0Hawaii 0 0 Oklahoma 8 30Idaho 3 4 Oregon 2 12Illinois 0 0 Pennsylvania 0 0Indiana 0 0 Rhode Island 0 1Iowa 0 1 South Carolina 0 1Kansas 1 4 South Dakota 3 8Kentucky 0 0 Tennessee 0 0Louisiana 1 3 Texas 0 3Maine 0 4 Utah 0 4Maryland 0 0 Vermont 0 0Massachusetts 0 3 Virginia 0 6Michigan 1 9 Washington 5 26Minnesota 2 11 West Virginia 0 0Mississippi 1 1 Wisconsin 3 11Missouri 0 0 Wyoming 1 1
Total 64 567
* Number of American Indian or Alaskan Native reservations, trust areas, or villages administered by Federal or State recognized tribes (Velarde Tiller, 1995).
3

Table 1.2 shows the grant amounts for the 2000-2001 year. Approximately 40 percent of the grants were between $300,000 and $349,999, and 70 percent were between $250,000 and 399,999. Four of the seven projects that were receiving less than $250,000 were in their first year of operation. The Navajo Nation received the largest grant, which was almost three times as large as the next largest grant.
TABLE 1.2AIVRS Grant Amounts for 2000-2001 Year
Amount Number of ProjectsLess than $250,000 7$250,000-$299,999 9$300,000-$349,999 26$350,000-$399,999 10$400,000-$449,999 5450,000 or more 7
Total 64
C. Law and Regulation for the AIVRS Program
The AIVRS program officially began with the 1978 reauthorization of the Rehabilitation Act. By January of 1981, Federal regulations had been formulated to provide basic guidance for the fledgling AIVRS program (34 CFR 371). The AIVRS regulations were quite short, approximately seven pages. These regulations are augmented by various other federal regulations such as 34 CFR 369, the Education Department General Administrative Regulations (EDGAR), and OMB Circular A-87. While 34 CFR 371 regulations are specific to the AIVRS program, 34 CFR 369 regulations are an umbrella set of regulations to provide guidance to eight discretionary grant programs. EDGAR is a compilation of regulations to govern many different Department of Education programs for non-profit and governmental entities. Finally, OMB Circular A-87 was established to provide “cost principles” to State, Local and Tribal governments.
For a number of years, AIVRS project directors have struggled to find regulatory guidance on many issues they have faced. Many have sought guidance from the Federal guidelines for the State VR program (34 CFR 361). These regulations are much more prescriptive as they are 160 pages in length as compared to seven pages for the AIVRS program. AIVRS directors often have utilized the regulations for the State program because they provide more guidance than the AIVRS regulations. This has seemed appropriate, as the Act requires AIVRS programs to provide services “to the maximum extent feasible, comparable to rehabilitation services provided” by the State program. Currently RSA is in the process of rewriting the AIVRS regulations.
4

D. Training and Technical Assistance Resources
There are a range of training and technical assistance resources that are available to AIVRS projects. Projects have access to RSA’s network of training institutions and continuing education centers. In particular, there are currently two Rehabilitation Research and Training Centers (RRTCs) and two Rehabilitation Continuing Education Programs (RCEPs) offering special assistance to AIVRS projects.
American Indian Rehabilitation Research and Training Center (AIRRTC). The center is located at Northern Arizona University. In cooperation with the Consortia of Administrators for Native American Rehabilitation (CANAR) and other RRTCs, this center conducts research and training activities focusing on analyzing disability data and recommending methodologies for planning and evaluating vocational services, recommending successful strategies, developing and evaluating innovative and culturally appropriate services, and disseminating research results and evaluation models.
American Indian Disability Technical Assistance Center. The center is administered through the University of Montana Rural Institute. The center works with American Indian tribes to develop culturally sensitive ways to discuss disability issues and to develop long-term care options for elders and people with disabilities.
The Oyate’ Project. Administered through Western Washington University’s Center for Continuing Education in Rehabilitation, the project offers assistance to AIVRS projects to enhance their capacity to serve their consumers. Assistance includes an orientation and training program for new staff and AIVRS projects, follow-up technical assistance, education and training, and a mentoring program. The Region X RCEP also offers a certificate program for Tribal Native American Vocational Rehabilitation.
Interwork Institute of San Diego State University. The Region IX RCEP offers an advanced graduate certificate program designed to provide post-employment training for rehabilitation personnel who coordinate and manage programs for American Indian consumers. The program includes three on-campus training sessions plus monthly distance learning sessions over a fifteen-month cycle. The RCEP also provides capacity-building assistance in developing new applications for VR services.
E. Prevalence of Disabilities Among Native Americans
The most definitive study to date on the prevalence of disabilities among American Indians and Alaska Natives is currently being conducted by the AIRRTC at Northern Arizona University. The purpose of the study is to identify statistically reliable disability estimates for this population. An Analysis of Disability and Employment Outcome Data for American Indians and Alaska Natives: Year Two Progress Report uses national data bases such as Indian Health Service data, RSA 911 data, National Health Interview Survey data, Medicaid Statistical Report data, Survey of Income and Program Participation (SIPP) data, the U.S. Census 2000, and other data such as Tribal VR Government Performance Results Act (GPRA) reports and Community-based Rehabilitation Programs (CRP) public data to identify the prevalence of disabilities.
5

According to the report, each database analyzed to date contains major flaws that leave the data unreliable. The AIRRTC study will weight the data on the number of American Indians and Alaska Natives with disabilities to accommodate to the flaws in data collection for minority populations and the lack of common categories across data base sources and present its findings in 2003.
In terms of overall disability rates, the AIRRTC study cited 1994-95 SIPP data to indicate that Native Americans reported higher rates of disability (23.9 percent versus 20.6 percent) and severe disability (10.5 percent versus 9.9 percent) than the overall U.S. population. Native Americans also reported higher than average rates of being limited in their kind or amount of work activity or in being unable to work. The report emphasized, however, that the number of persons reporting disabilities is usually much smaller than the number of persons having disabilities. This reporting problem may be a particular issue for Native Americans, given their cultural views of disability (see Section F below).
According to the AIRRTC study, the most prevalent disability conditions for the Native American population are alcoholism, other mental and emotional conditions, learning disabilities, diabetes, orthopedic impairments, cardiovascular diseases, hypertension, cholithiasis and disorders of gallbladder, kidney diseases, malignant neoplasms, pneumonia, and chronic pulmonary diseases. F. Challenges for AIVRS Projects
AIVRS projects face special challenges in providing services to their consumers. Some of those challenges are based on the fact that most AIVRS projects are located in rural areas, and some are based on the unique cultural backgrounds of Native Americans.
Rural locations. AIVRS projects face challenges similar to those experienced by other rural VR programs. In various surveys, State VR counselors in rural areas (RTC: Rural; Arnold and Seekins, 1998) have identified conditions that inhibit rural vocational rehabilitation programs, including poor rural transportation, the dearth of service providers, the lack of rural economic development, and difficulty in finding staff. Research has demonstrated that these factors affect rural vocational rehabilitation programs’ outcomes (Wheeler and Hall 1995).
Economic development in rural areas has become the focus of efforts to establish a more stable source of income for persons with disabilities and a more stable economy in the local region. Self-employment opportunities, particularly for persons with disabilities, are often considered a way to address rural unemployment (Forrester, 1995). Self-employment accommodates a flexible schedule of temporary work, home-based, contractual and part-time employment. Economic development in rural areas often requires training programs to support self-employment. VR funds have been used to provide a variety of services, including small business incubator programs and awarding small stipends to individuals to develop their own businesses (Schriner, 1995).
6
Native American cultures. The ethnic minority status of their consumers also challenges AIVRS projects. Specifically, language issues, views of the role and value of work, and other cultural values and priorities often affect minority groups’ vocational outlooks (Sanderson, 1997; Rojewski, 1997). The State VR system has responded slowly to these issues by not adjusting their service patterns for Native Americans and other minority groups (Trevino and Syzmanski, 1996; Ma and Coyle, 1999; Locust and Lang. 1996; Harley, Feist-Price and Alston, 1996).
The foundation of the VR process is a definition of disability, yet many Native American languages do not contain a word or phrase for “disability.” People are known as individuals with a wide range of abilities and ways to contribute to the community, rather than having limitations measured against a social expectation or standard. A disability is a characteristic of a person, not a definition. There is not a tendency to stigmatize an individual with a disability but to help the family and person so that the disability is not limiting (Faubion et.al., 1998). It can be disrespectful to identify a tribal member as having a disability. As a part of the VR process, applicants for services are determined eligible or ineligible for services. Native American culture is community, tribe and family based. All of the norms and expectations of these aspects of life take precedence over individual needs and priorities. Often tribal governments and members do not have a cultural reference for sponsoring a tribal service to only a limited group of members. Implementation problems often can be traced to the expectation that members of a tribe or coalition receive services equally, for example when demands for services to ineligible individuals are made by families and tribal organizations.
Another concept of providing VR services is that services are time-limited. There is an emphasis on preparing for the future and using time actively and efficiently. Native American cultures value the present, the sense of a right time for everything, being patient, involving the extended family in decision-making, listening as learning, and a holistic approach to life. (Weddington and Sanderson. 1995). Thus, scheduling appointments for specific times, an emphasis on making personal decisions and direct statements of plans at set points in time, tying the achievement of goals to calendar time, and narrowing the focus of services to a single aspect of life conflict with Native American values of time and learning. Long periods of limited consumer involvement in project services because of cultural priorities of family, ceremonies, and personal harmony with the present can be interpreted as “being uncooperative” or as “refusing services” within the context of providing time-limited services.
G. Terms Used in This Report
There are a number of terms that are used in this report that may not be familiar to persons not intimately involved in the VR system. They are described below.
A VR consumer is a person on the caseload of a VR program or project. An individual becomes part of the caseload when he/she formally applies for services. A consumer may later be determined to be ineligible for VR services or may leave the program prior to receiving services under an Individualized Plan for Employment. Some consumers are employed at the time of application but apply because they are underemployed or need VR services to retain employment.
7
An Individualized Plan for Employment (IPE) is a planning process used to identify the consumer’s employment goal, the steps and services needed to reach that goal, and the providers and schedule for services.
An employment goal is the desired employment result that is defined by the consumer. In most cases, it involves employment in competitive, integrated settings, but it also may include supported employment, being an unpaid family worker or homemaker, or subsistence activities such as hunting, fishing, or harvesting.
VR services involve a range of programs, activities, and supports designed to help a consumer reach an employment goal. Most VR services are provided following development of an IPE, but some services are provided earlier to help determine the best goal (e.g., vocational counseling and guidance, vocational assessment, medical consultation).
A successful employment outcome is achieved when the consumer achieves his/her employment goal. Successful outcomes involve stable employment over a period of time as defined by the VR program.
An unsuccessful employment outcome is when a consumer leaves the VR program without having achieved a successful outcome. The consumer may move, may become too ill to complete the plan, may refuse services, or may be unable to find employment appropriate to the employment goal.
Summary of Chapter 1: Introduction
There were 64 AIVRS projects in 2000-2001, ten of which were new projects and thus not included in the evaluation.
Approximately 40 percent of the grants were between $300,000 and $349,999, and 70 percent were between $250,000 and 399,999.
There are no definitive data on rates of disability among Native Americans, but the evidence suggests that they are higher than in the overall population.
AIVRS projects face a range of challenges in providing VR services, including their rural locations and the cultural beliefs and values of Native American communities.
8

2. STUDY DESIGN AND METHODOLOGY
This chapter presents a description of the study design and methodology used in the evaluation. It includes separate sections on the objectives of the evaluation, the evaluation design, the sampling approach, and data analysis procedures.
A. Objectives
RSA defined the following objectives for the evaluation:
1. Describe and analyze the characteristics, services received, and outcomes of Native Americans with disabilities.
1.1 Identify the Native Americans served in the AIVRS projects in terms of the following characteristics: age, gender, educational level, type of disability, severity of disability (e.g., receipt of Social Security Disability benefits), and prior work experience.
1.2 Describe the types and amounts of services, including culturally relevant traditional Native American services, provided to individuals who apply for AIVRS project services; identify the costs of services purchased for those individuals; identify the services provided to AIVRS consumers that are not purchased by AIVRS projects (e.g., those provided by AIVRS staff or other individuals, agencies, or organizations).
1.3 Identify the outputs of AIVRS projects in terms of the percentages of individuals whose cases are closed and who: (a) apply for services but are not determined eligible, including the reasons they are not eligible; (b) eligible for services but do not receive them; (c) are eligible and receive services but do not obtain an employment outcome; and (d) who are eligible, receive services, and obtain an employment outcome.
1.4 Describe the AIVRS projects’ employment outcomes in terms of: (a) types of employment outcomes including self-employment and subsistence employment; (b) earnings; (c) type of employment; and (d) duration of employment (if data are available).
1.5 Compare the characteristics of individuals served, the outcomes obtained, employment achieved, and the services provided of the AIVRS projects with the characteristics, outcomes, employment, and services of: (a) Native Americans served by the relevant State VR program alone; (b) individuals served jointly by AIVRS projects and VR agencies; and (c) other persons served by the relevant VR agency.
1.6 Consistent with the analysis in Subobjective 1.5, identify significant correlations among the following variables: characteristics of persons served, services provided, purchased service costs, and consumer outcomes.
2. Identify the degree to which Native Americans are not served or are underserved in the AIVRS projects' services areas.
9

3. Describe the organizational structures and management of the projects.
3.1 Describe the organizational locations of the AIVRS projects within their respective tribal government structures and identify relationships between organizational location and AIVRS projects’ planning, management structures, services, and outcomes.
3.2 Describe the AIVRS projects’ personnel in terms of education, qualifications, experience, Native American heritage, and opportunities for training.
3.3 Identify the quality of the AIVRS projects’ record keeping, particularly in terms of documenting eligibility, planning and providing services, tracking costs, supporting required reports and evaluations, and describing consumers’ outcomes.
3.4 Identify implementation problems of new projects and effective implementation strategies.
3.5 Describe the nature and extent of collaboration and cooperation between AIVRS projects and the relevant State VR agencies; identify barriers to collaboration and cooperation.
4. Describe the projects' vocational rehabilitation (VR) practices, regarding: vocational assessment, determining eligibility for services, developing plans for services, fostering consumer choice, and delivering services.
5. Identify the cost-effectiveness of established AIVRS projects.
6. Describe the economic and resource environments of the projects.
6.1 Describe the economic environments of the AIVRS projects including the relationships of those environments to eligible individuals’ employment outcomes.
6.2 Describe the availability of services in the projects’ communities, including medical, psychological, psychiatric, and substance abuse services; training opportunities, economic development initiatives and transportation; identify the relationship between the availability of services in the community and AIVRS projects’ services and consumer outcomes.
7. Identify best practices and make recommendations for program improvement.
7.1 Identify promising practices utilized by the projects including planning, coordination with other agencies and the State VR agency, employment initiatives, practices relating to particularly effective and efficient program/consumer outcomes, and the provision of culturally relevant services.
7.2 As a result of analyzing the data gathered in support of the above evaluation objectives, make recommendations for improving the impact, structure, funding and accountability of AIVRS projects.
10
7.3 Based on the evaluation findings, make recommendations to RSA for program and management improvement.
B. Design
The evaluation included five data collection activities:
1. A mail survey to the 54 AIVRS projects with funding in FY1999 and FY20002. Site visits to 29 of those projects in the period from March-June 2001
An interview with the project director A focus group with project staff members 1–2 interviews with a tribal representative(s) 2 interviews with project advisory group members, if there was a group 4 interviews with service providers 1-2 interviews with local State VR staff member(s) Case record reviews of 30 closed cases and 20 open cases (at the Navajo project,
larger numbers of cases were reviewed)3. Telephone interviews with 3 other AIVRS project directors4. Telephone interviews with Rehabilitation Services Administration staff members 5. Comparison of AIVRS case records with State VR case records
Data collection involved the use of 12 data collection instruments:
Project Description Summary Form (mail questionnaire); Project Director Interview Form; Project Staff Group Interview Form; Project Advisory Group Interview Form; Tribal Representative Interview Form; Service Provider Interview Form; State VR Agency Staff Member Interview Form; Case Record Review Form; Record Review Summary Form (to summarize completeness of records); Community Context Summary Form (to describe impressions of the community); Project Director Telephone Interview Form; and RSA Staff Member Interview Form.
11

Table 2.1 shows the relationship between the seven major evaluation objectives and the 12 data collection instruments.
TABLE 2.1Relationship Between Objectives and Instruments
InstrumentObjective*
1 2 3 4 5 6 7Project Description Summary Form x x x x x xProject Director Interview Form x x x x xProject Staff Group Interview Form x xProject Advisory Group Interview Form x x xTribal Representative Interview Form x x x xService Provider Interview Form x x xState VR Agency Staff Member Interview Form x x xCase Record Review Form x xRecord Review Summary Form xCommunity Context Summary Form xProject Director Telephone Interview Form xRSA Staff Member Interview Form x x
* 1. Describe and analyze the characteristics, services received, and outcomes of American Indians with disabilities.
2. Identify the degree to which Native Americans are unserved or underserved in the AIVRS projects' services areas.
3. Describe the organizational structure and management of the projects.4. Describe the projects' vocational rehabilitation (VR) practices, regarding: vocational
assessment, determining eligibility for services, developing plans for services, fostering consumer choice, and delivering services.
5. Identify the cost-effectiveness of established AIVRS projects.6. Describe the economic and resource environments of the projects.7. Identify best practices and make recommendations for program improvement.
C. Sampling
The sampling universe for the study consisted of 54 projects. This number included all projects operating in FY2001 with FY2000 funds that also received Federal funding in FY1999, plus one project that did not receive funding in FY1999 but was operating on a no-cost extension in that year. We did not include projects newly funded in FY2000 in the sampling universe. These projects began implementing their program on October 1, 2000, and had not been in operation long enough to be useful in answering the evaluation questions. Table 2.2 shows the initial year of funding for the 54 projects included in the study.
TABLE 2.2
12

First Year that AIVRS Projects Received Federal Funding
Year Number of Projects1991 and earlier 81992-1993 101994-1995 71996-1997 81998-1999 21Total 54
Source: Project Description Summary Form
The sampling plan for the evaluation included three major components: (1) the sampling of 29 of the 54 AIVRS projects for site visits; (2) the sampling of persons to be interviewed during site visits; and (3) the sampling of consumers to be included in the case record review.
Sampling of Projects. We selected 29 of the 54 projects for site visits. In examining the program, we concluded that a key factor that influences the operations of projects and their success in achieving employment outcomes is the number of years that the project has received funding from the U.S. Department of Education. In selecting projects, therefore, we stratified projects into four groups on this dimension. Because of its length of operation and size, the Navajo VR project was placed into its own stratum and selected with certainty. In the remaining three strata, we randomly selected projects with approximately equal probabilities of selection. We also implicitly stratified the sample by ordering on the sampling lists in each strata geographically, and then using systematic sampling techniques (nth case sampling) so that States were represented proportionally to the number of projects in the AIVRS program.
Sampling of Interviewees. During the site visits, three categories of respondents were sampled: (1) project advisory group members; (2) tribal officials; and (3) staff of service providers for the project.
When there was a project advisory group, two advisory group members were interviewed at each site. They were selected based on their availability and their level of knowledge of the AIVRS project. Recent additions (within the past three months) or inactive members (those missing 50 percent or more of meetings) were not interviewed.
One or two tribal officials were interviewed. We sought to interview a single official who had significant knowledge of the project, knowledge of local economic conditions, and broad knowledge of tribal government issues. This person was frequently the direct supervisor of the AIVRS Project Director. However, if one individual did not have such knowledge, we interviewed more than one person. Also, in projects that represented a consortium of tribes, we interviewed at least two tribal representatives.
13

We also interviewed four individuals from organizations providing services for the project. These included tribal and other organizations providing health services, social services, educational and training programs, job and career counseling, and other types of services. We asked the AIVRS Project Director to list two tribal service providers in departments of health, education, and/or employment, and two other providers, particularly those providing psychological or vocational assessments and community rehabilitation services (including State VR staff). We then asked to interview the person with the most knowledge of AIVRS consumers and services in each organization.
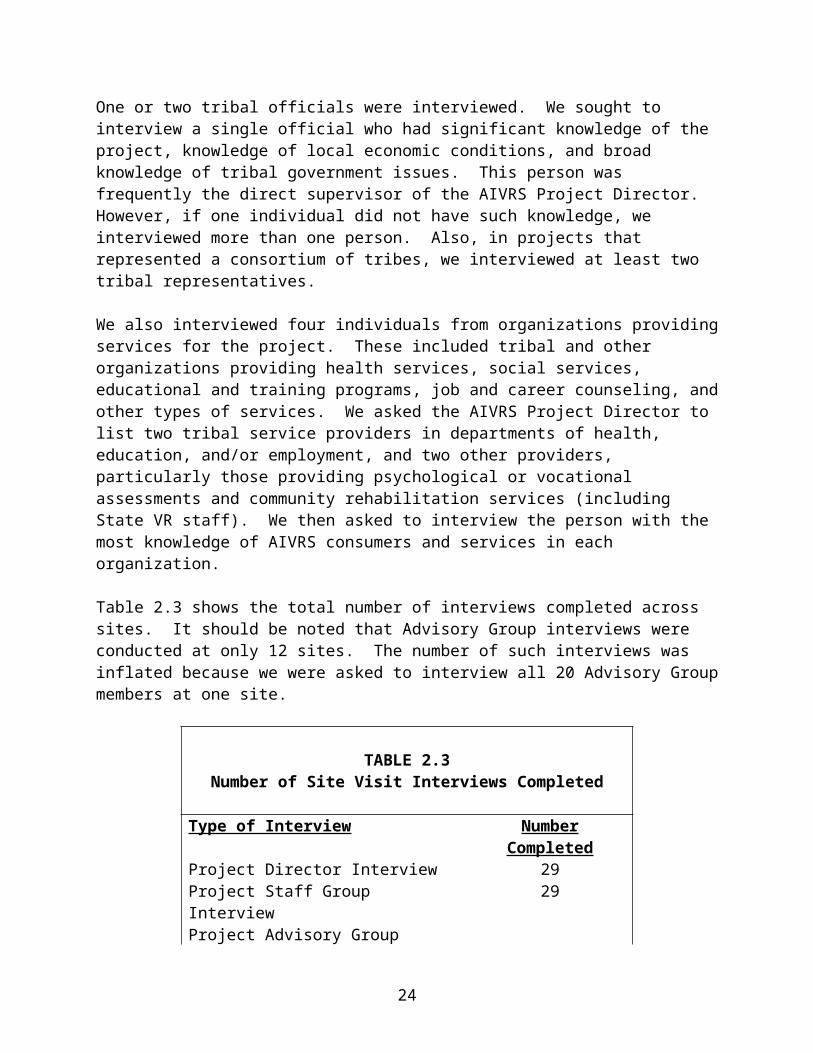
Table 2.3 shows the total number of interviews completed across sites. It should be noted that Advisory Group interviews were conducted at only 12 sites. The number of such interviews was inflated because we were asked to interview all 20 Advisory Group members at one site.
TABLE 2.3Number of Site Visit Interviews Completed
Type of Interview Number CompletedProject Director Interview 29Project Staff Group Interview 29Project Advisory Group Interview 38 (12 sites)Tribal Representative Interview 36Service Provider Interview 110State VR Agency Staff Member Interview 31
Sampling of Consumers for Case Record Review. There were two groups of consumers that were independently selected for the case record review: (1) consumers whose cases had been closed in the two years preceding the site visit (site visits occurred in the period from March-June 2001); and (2) consumers whose cases were active at the time of the site visit. Data on consumers from the first group were used to draw comparisons with data from the RSA-911 system. Data on consumers from both groups were used to provide a description of the program’s caseload.
We selected up to 50 consumers per site: (1) up to 30 consumers whose cases had been closed in the previous two years; and (2) up to 20 consumers whose cases were active at the time of the site visit. Because of its very large number of consumers, at the Navajo project we selected 90 closed cases and 60 active cases. If a site had fewer than the desired number of consumers in a sampling group, we selected all consumers in that group. If a site had more than the desired number of consumers in a group, we randomly selected consumers using systematic sampling techniques (e.g., selection of every third case).
14

D. Data Analysis
There were three categories of data that were used in the analyses, each of which was treated somewhat differently: (1) data from the Project Description Summary Form; (2) data from the Case Record Review Form; and (3) data from the interviews.
Data on the Project Description Summary Form were obtained from all 54 AIVRS projects that were in operation in 1999-2000 and 2000-2001. This group was the population of interest for this evaluation. The data from this form provided the quantitative core for this evaluation report, with the AIVRS project serving as the unit of analysis.
There were two major variables used to compare subgroups of AIVRS projects for the evaluation: (1) year of initial grant (1996 or before (n = 31); 1997 or later (n = 23)); and (2) distance from urban areas (average resident in the service area lives less than 50 miles from nearest urban area containing a range of human service providers (n = 26); average resident lives 50 or more miles from such an urban area (n = 28)). The differences that are presented in this report were found to be statistically significant at the p < .05 level. In general, medians are used in presenting results, because means were often too strongly influenced by outlying cases. Medians represent the middle value in a distribution, with equal numbers of cases above and below the median. The 25th and 75th percentile values are also frequently presented.
Data on the Case Record Review Form were obtained on a sample of 830 cases closed in the two years preceding the site visits and a sample of 604 cases that were open at the time of the site visits. The closed cases included 234 cases with successful employment outcomes, 253 cases in which services were provided under an IPE without successful employment outcomes, 228 cases in which no services were provided under an IPE, and 110 cases in which the consumer was determined not to be eligible (there were 5 cases that were missing on this item). Case Record Review data from open and closed cases were used in the report to describe AIVRS consumer characteristics, and data from closed cases were used to describe services and outcomes. The number of cases available for analysis varied by item, with some items relatively complete (826 of 830 closed cases on services provided) and other with large amounts of missing data (808 of 1,434 open and closed cases with data on Federal disability-related income). Because these analyses were based on samples and cases had different probabilities of selection, the data from this form were weighted to be representative of all AIVRS cases in these two groups. Thus, for example while closed cases with successful employment outcomes represent 28.4 percent of the sample (not including those with missing data), weighted data suggest that they represent 24.8 percent of the population.
For selected variables, data from the Case Record Review Form were compared with two subgroups from RSA-911 database for fiscal years 1998 and 1999: (1) Native American consumers served by State VR programs in States with AIVRS projects (n = 9,247); and (2) all consumers served by State VR programs in those same States (n = 408,045). (The first group is a subset of the second.) The overall AIVRS group was also compared with the subset of AIVRS cases shared with State VR programs (n = 164).
15

Data from the interviews were used in this report to provide qualitative detail. These data were not used to develop quantitative estimates, so they were not weighted for analyses. Rather they were used to describe more common and less common practices and outcomes among AIVRS projects, and the findings were presented in that form. Data from interviews and observations during site visits were also used to provide illustrative detail and examples for the report.
Summary of Chapter 2: Study Design and Methodology
The evaluation studied the 54 AIVRS projects that had been in operation for more than a year at the time of the data collection.
The data collection methodology included mail surveys to all 54 projects, site visits to 29 projects, and telephone interviews with RSA staff members and three other AIVRS project directors.
The site visits included interviews with AIVRS project directors, staff members, tribal representatives, project advisory group members, State VR staff, and other service providers.
The evaluation reviewed selected case files for both open cases and closed cases at each of the sites visited, and compared the data from closed cases with State VR data from the RSA-911 system.
16

3. COMMUNITY CONTEXTS FOR AIVRS PROJECTS
This chapter describes the contexts in which AIVRS projects are operating, including their physical settings, project service areas, service availability in those areas, and economic environments. The chapter addresses the sixth evaluation objective: Describe the economic and resource environments of the projects.
A. Physical Settings for Projects
For AIVRS projects, there are three predominant types of physical settings. The situation most commonly found is that of tribes living on reservations or pueblos. In that situation, the tribe owns the land and has jurisdiction over who lives there. In these settings there is usually little physical integration with the surrounding community unless one or more of the tribal communities on the reservation is close to a “border town” (non-native community adjacent to the reservation).
In Oklahoma, the projects are located on trust lands (the land has been allotted to individual tribal members) and are not on reservations but have “service areas” which cover a number of State designated counties. As there are no reservation boundaries, in most situations there is a significant amount of physical integration. Tribal members may live in somewhat segregated communities made up primarily of Native American individuals or they may be part of a predominately non-native community or large urban setting.
In Alaska, regional for-profit and non-profit corporations are the norm. Each is composed of a number of generally remote villages ranging in population of 50 to over 3000 residents. These communities or villages are only connected to the rest of the State or region by air transportation, sea-going ferry service, and/or barge and tugboat service. Most of these villages are not located near urban or non-native communities and there is little physical integration. While the villages are generally remote, some of the regional corporation headquarters are located in or near urban areas where there is a great deal of physical integration.
During group interviews with AIVRS project staffs, the staffs were asked to rate two dimensions of the project environment: (1) the level of physical integration of the families of consumers with non-Native people in terms of housing, schools, jobs, shopping, etc.; and (2) the level of cultural integration of families of consumers with non-Native people in terms of attitudes, beliefs, values and ways of living. On both dimensions, the response choices were: very integrated, somewhat integrated, not very integrated, or not at all integrated. The most common response on both dimensions was “somewhat integrated.” Project staffs were more likely to rate their communities as “very integrated” physically in terms of housing, schools, employment, and shopping than as “very integrated” culturally in terms of attitudes, beliefs, and values.
Physical isolation is a characteristic of many of the AIVRS projects. Project staff reported that many consumers lacked access to telephones, making home visits and open-ended appointments part of the delivery of services. Some projects provided consumers with cell phones in order to maintain contact with an employer offering employment. Few projects were located in areas with public transportation and there was limited access to State-maintained roads. Tribal
17

governments with resources for economic development often developed their own transportation systems.
B. Project Service Areas
The location and size of the AIVRS projects’ service areas varied. Thirty-nine of the 54 projects served Indian reservations and areas near the reservations, while the remaining 15 served only reservations.
Table 3.1 presents the sizes of the projects’ service areas. Seven of the 54 projects served areas of at least 10,000 square miles (equivalent to a square of 100 miles on a side). Eight of the projects served areas of less than 500 square miles (equivalent to a square of 22.4 miles on a side). Two of the largest service areas are in Alaska, which cover very large and remote areas. The largest service area in the continental U.S. is the Navajo project, which covers 26,109 square miles (equivalent to a square of 162 miles on a side).
TABLE 3.1Size of Projects’ Service Areas
Size in Square Miles Number of ProjectsLess than 500 8500-999 61,000-1,499 81,500-2,999 93,000-4,999 75,000-9,999 910,000 or more 7Total 54
Median size = 2,265 square miles25th percentile = 879 75th percentile = 6,085
Source: Project Description Summary Form
18

Table 3.2 shows the total populations (Native American and non-native) of the AIVRS projects’ service areas. Twenty-eight of the 54 projects served areas containing at least 20,000 people.
TABLE 3.2Total Population in Projects’ Service Areas
Population Number of Projects500-4,999 65,000-9,999 910,000-19,999 1120,000-59,999 960,000-199,999 7200,000-499,999 7500,000 or more 5Total 54
Median population = 22,37525th percentile = 8,699 75th percentile = 162,147
Source: Project Description Summary Form
19

Table 3.3 describes the Native American populations in the projects’ service areas. Twenty-nine of the 54 projects operated in areas containing at least 7,000 Native Americans.
TABLE 3.3Native American Population in Projects’ Service Areas
Population Number of Projects400-2,499 72,500-4,499 94,500-6,999 97,000-9,999 1010,000-19,999 1020,000 or more 9Total 54
Median population = 7,25025th percentile = 4,000 75th percentile = 16,126
Source: Project Description Summary Form
20

C. Service Availability
Table 3.4 presents data from the Project Description Summary Form on the average distances in miles that residents residing in the AIVRS projects’ service areas lived from the closest State Vocational Rehabilitation (VR) agency office and from the nearest urban area with a range of human service providers. The average resident in the majority of service areas lived at least 40 miles from the closest State VR agency office and also from the nearest urban area containing a range of human service providers.
TABLE 3.4Distance of Average Resident from the Nearest State Vocational Rehabilitation
Agency Office and the Nearest Urban Area with Service Providers
Distance in MilesNumber of Projects
VR State Agency Urban Area with ProvidersLess than 10 2 210-19 8 720-29 9 830-39 6 440-59 9 860-79 6 780-99 4 4100 or more 10 14Total 54 54
Median = 43 miles Median = 52 miles25th percentile = 2075th percentile = 80
25th percentile = 2175th percentile = 100
Source: Project Description Summary Form
The types of services providers that were most frequently available were general health services (often through the Indian Health Service) and social services provided by the tribe. Specialized services (e.g., orthopedic, hearing specialists) were often a considerable distance from consumers. Tribal and IHS sponsored alcohol and drug abuse programs were generally available for outpatient treatment only. Projects located in more urban areas generally had access to a wider variety of specialists, but at a higher cost. Community facilities also ran the gamut from none to well developed networks. Projects located in areas where there were few tribal resources had few community resources such as a library, recreation area, or community meeting facility. Some tribal governments developed retail stores for food, essentials, and gas. Unless the project was located in a more urban setting, more familiar opportunities such as shopping malls, movie theatres, and chain stores were not available.
21

D. Economic Environments
Table 3.5 presents the rates of unemployment for the projects’ service areas and the counties surrounding the service areas. Thirty of the 54 projects’ service areas had an unemployment rate of more than 30 percent. In contrast, only 5 of the projects’ surrounding areas had unemployment rates exceeding 30 percent.
TABLE 3.5Rate of Unemployment for AIVRS Service Areas and the Areas Surrounding the
Projects’ Service Areas
Percentage of Unemployment
Number of Projects
AIVRS Service Area Surrounding Counties5.00 or less 5 205.01-10.00 5 1910.01-20.00 5 620.01-30.00 9 430.01-40.00 8 140.01-60.00 9 260.01 and higher 13 2Total 54 54
Source: Project Description Summary Form
22

Figure 3.1 compares the median unemployment rate in the AIVRS projects’ service areas to the corresponding unemployment rate in the areas surrounding the projects’ service areas. The median unemployment rate in the AIVRS projects’ service areas (32.5 percent, 25th percentile = 17.7, 75th percentile = 59.8) was nearly five times as high as the median rate in the surrounding areas (6.6 percent, 25th percentile = 4.0, 75th percentile = 12.0).
The unemployment rates of service areas were particularly high for projects in remote areas. For projects in which the average resident of the service area lived 50 or more miles from the nearest urban area containing a range of human service providers, the median unemployment rate was 45 percent (n = 28). For less remote projects, the median unemployment rate was 29.5 percent (n = 26).
23

Table 3.6 lists the most common types of employment found in the service areas. The total number of projects in the table exceeds 54 because most projects listed several employment types. Services and tribal and other government employment were most frequently mentioned. Among the service industries listed were health/hospitals, hotels, restaurants, casinos, grocery stores, and automobile repair.
TABLE 3.6Most Common Types of Employment in
Service Areas of AIVRS Projects(n = 54)
Employment Type Number of ProjectsServices 27Tribal/other government (unspecified) 23Construction/labor 19Gaming 14Professional 13Clerical 11Manufacturing/industrial 11Agriculture 9Logging/mining 7Retail 7Other 6Fishing 4Tourism 3Source: Project Description Summary Form
In interviews, approximately half of the AIVRS project directors indicated that local job opportunities were poor. A small number of projects located near urban areas that had profitable casinos had good job opportunities for consumers. For projects located near IHS, tribal community colleges, and BIA facilities, entry level employment was available for employees with a high school education and fluency in English. Some of the reasons given for poor job opportunities were: remoteness, educational requirements, ability to read English, transportation, lack of skill or training, low wages, cultural incongruence, and prejudice. Project directors also indicated that individuals in remote areas or on the reservations might work a combination of jobs to meet their needs. An excellent example of this would be an Alaskan village where the individual would hunt, fish, or trap and work one or more part time or seasonal jobs to survive. Similar scenarios also occur in other tribal areas where seasonal or part-time employment may compose many of the existing job opportunities.
Virtually all of tribes have developed employment initiatives or are in the process of developing them for their members. However, only a small portion of these tribes had established special initiatives that targeted employing individuals with disabilities. When asked about the relationship
24

of the VR project to tribal economic development or employment initiatives, few project directors indicated that their projects were partners in developing these initiatives. Approximately half of the tribal representatives interviewed indicated that the most likely employment opportunities for individuals with disabilities were with the tribe, either in a tribal business or within the tribal government.
A majority of the tribes have retained traditional jobs in their communities that continue to be meaningful. These jobs range in importance from somewhat important to very important. Some examples of the traditional jobs in Native American communities or villages are: subsistence hunting, fishing and trapping, basket making, rug making, pottery, jewelry, bead work, traditional garment making, various types of artistry, language instruction, and traditional healer or medicine person.
Summary of Chapter 3: Community Contexts for AIVRS Projects
A typical project (as defined by the median value) had a service area of 2,265 square miles and a Native American population in that area of 7,250.
A typical consumer of an AIVRS project (also defined by the median) lived 43 miles from the closest State VR office and 52 miles from an urban area with a range of human service providers.
The median unemployment rate in the AIVRS projects’ service areas was nearly five times as high as the median rate in surrounding areas (32.5 percent versus 6.6 percent).
Projects varied considerably in employment opportunities and the types of employment that were available. Traditional jobs were important in many of the communities.
25

4. CONSUMER POPULATION
This chapter provides information about the consumers assisted through the American Indian Vocational Rehabilitation Services (AIVRS) program. The chapter describes the number of individuals served, their background and demographic characteristics, and the types of persons who needed vocational rehabilitation services but were not receiving them. The chapter addresses the first part of the first evaluation objective: Describe and analyze the characteristics, services received, and outcomes of Native Americans with disabilities. It also addresses the second objective: Identify the degree to which Native Americans are not served or are underserved in the AIVRS projects' services areas.
A. Numbers of Consumers Served
Data from the Project Description Summary Form indicate that from October 1, 1999 to September 30, 2000, 4,632 individuals applied for services to the AIVRS projects. Of these individuals, 3,473 (75 percent) were defined to be eligible to receive services. Of the eligible consumers, 521 did not receive services (were on a waiting list, etc., according to the project) and 625 were referred to the State VR program (either as simple referrals or as shared cases). Six of the 54 projects had waiting lists for services and were operating under an order of selection.
26

Over the course of the same year, the AIVRS projects served 5,562 consumers (including cases carried over from previous years). This number included individuals at various stages of the VR process, from application to case closure. Table 4.1 groups the projects by the number of consumers served during the 12-month interval. Thirty-six of the 54 projects provided services to 50 or more consumers.
TABLE 4.1Number of Consumers Served by AIVRS Projects
During 12-Month Period
Number of Consumers Number of ProjectsLess than 30 830-49 1050-69 1170-99 8100-199 7200-299 7300 or more 3Total 54
Median number of consumers served = 6425th percentile = 41 75th percentile = 140
Source: Project Description Summary Form
27
Figure 4.1 presents the median number of consumers served by established projects (initiated before 1997) and new projects (1997-present) from October 1, 1999 to September 30, 2000. The median number of consumers served by the established projects (median = 82, 25th percentile = 56, 75th percentile = 208, n = 31) was almost twice as much as the median number of consumers served by the new projects (median = 45, 25th percentile = 25, 75th percentile = 77, n = 23).
28
The average caseload across all projects at any single point during the year was 3,756 consumers. This figure is smaller than the total number of consumers served because some consumers remained in the program for less than the full year. Table 4.2 groups projects by the average number of consumers. On any given day, more than 35 of the 54 projects were serving 40 or more consumers.
TABLE 4.2Average Number of Consumers Being Served by
AIVRS Project At Any One Time
Consumers Number of ProjectsLess than 20 920-39 1040-59 1160-79 1080-149 9150 or more 5Total 54
Median of the average project caseload = 5025th percentile = 29 75th percentile = 80
Source: Project Description Summary Form
29

B. Consumer Characteristics
Table 4.3 shows the ages of consumers at the time of application. The results indicated that 63 percent of consumers were below the age of 40.
TABLE 4.3Age of AIVRS Consumers at Time of Application
(n = 1,378)
Age Percentage of Consumers19 and younger 13.220-29 23.830-39 25.940-49 22.250 and older 14.9Total 100.0
Median Age = 34.725th percentile = 24.2 75th percentile = 44.6
Source: Case Record Review Form-open and closed cases (weighted data)
30

Data was also collected on the consumers’ gender. Males made up a majority (52.6 percent) of the consumers.
Table 4.4 presents the consumers’ educational levels at time of application. Twenty-nine percent had not completed high school or received a GED, while 30 percent of consumers had attended college or received a college degree or post-secondary vocational certificate. However, only 5 percent of consumers had earned an Associate’s, Bachelor’s or advanced degree. The rate of college attendance among AIVRS consumers was probably influenced by the availability of tribal colleges which are free to tribal members.
TABLE 4.4Highest Education Level of AIVRS Consumers
(n = 1,347)
Level Percentage of ConsumersLess than high school 7.4Some high school 22.0Certificate of completion 0.7GED recipient 15.7High school graduate 24.7Some college 17.9Vocational certificate 6.6Associate’s degree 2.5Bachelor’s degree 2.4Advanced degree 0.1Total 100.0
Source: Case Record Review Form- open and closed cases (weighted data)
31

Table 4.5 indicates the various kinds of disabilities of AIVRS consumers. Some consumers had more than one disability, meaning that the sum of percentages in the table is greater than 100. No single disability affected more than 30 percent of consumers. Substance abuse affected the most consumers. More than 10 percent of consumers also had an orthopedic disability, other medical problems, a mental or emotional condition, a learning disability, and/or diabetes. Other medical conditions included asthma, emphysema, epilepsy, and a range of cardiac and respiratory conditions.
TABLE 4.5Disabilities of AIVRS Consumers
(n = 1,377)
Disability Percentage of ConsumersSubstance abuse 28.2Other medical condition 25.6Orthopedic impairment 21.5Mental or emotional condition 16.9Learning disability 14.9Diabetes 10.0Hearing impairment 6.6Mental retardation 6.5Visual impairment 5.0Spinal cord injury 2.3Traumatic brain injury 1.8Amputation or absence of limb 1.4Fibromyalgia 1.2Fetal alcohol syndrome 0.3
Source: Case Record Review Form- open and closed cases (weighted data)
In our case record review, we examined records to determine whether or not consumers were severely or significantly disabled. (This information is not required to be recorded under AIVRS regulations.) This information was available on only 55.1 percent of consumer records. The data indicated that 53.8 percent of those for whom information was available were listed as severely or significantly disabled.
32

Financial support for disability from government is another indication of the severity of disability. As with the records on the severity of disability, only 56.9 percent of consumer records indicated whether the consumer was receiving financial assistance from the government. Table 4.6 displays the different types of financial support provided to consumers by the government (consumers may receive more than one type of support). Of those with data, 33.1 percent of AIVRS consumers were receiving one or more of the listed types of support. Supplemental Security Income was the most commonly provided assistance.
TABLE 4.6Government Support of AIVRS Consumers
(n =808)
Type of Support Percentage of ConsumersSupplemental Security Income 22.2Social Security Disability Insurance 13.0Workman’s Compensation 3.8Veterans’ Disability Insurance 0.6
Source: Case Record Review Form- open and closed cases (weighted data)
More than 9 out of 10 (92.5 percent) of consumers (n =1,303) had previous work experience at one time or another during their lives. During the two years prior to applying for AIVRS services, 69.6 percent of consumers (n = 1,142) had worked at some point in that time period. Finally, 34.0 percent of consumers (n = 1,047) were working when they applied for services under the program.
The percentage of consumers with work experience varied significantly with the projects’ remoteness from other service providers. The consumers in projects in which the average consumer lived 50 or more miles from the nearest urban area were less likely to have had work experience in the two years before they applied for AIVRS services than were other consumers (60.6 percent in remote projects (n=642) vs. 77.0 percent in non-remote projects (n=500), p < .05). The consumers in these remote projects were also less likely to have been employed when they applied (29.4 percent in remote projects (n=601) vs. 37.8 percent in non-remote projects (n=446), p < .05).
The percentage of consumers with work experience in the two years before they applied for AIVRS services varied significantly with the unemployment rates in the project service areas. The consumers in service areas with 30 percent or higher unemployment rates were less likely to have worked during the two years prior to their application than the other consumers (65.0 percent (n=748) and 74.7 percent (n=394), p < .05).
33

C. Comparison with State VR Programs
Table 4.7 compares the AIVRS consumers’ characteristics with three other groups: (1) AIVRS consumers whose cases are shared with the State VR agency (i.e., those on the caseloads of both the AIVRS project and State VR program, a subset of all AIVRS consumers); (2) all consumers enrolled in State VR programs in States that have AIVRS projects (from FY98 and FY99 RSA-911 data); and (3) Native American consumers in State VR programs in States that have AIVRS projects (a subset of the previous group). It should be noted that data on the AIVRS and shared cases are not strictly comparable to the RSA-911 data because: (1) they cover somewhat different time periods; and (2) AIVRS data include both open and closed cases, while RSA-911 includes only closed cases. However, because the time periods overlap and because all AIVRS cases will eventually be closed, the groups are similar enough so that comparisons can be made.
The results indicated that AIVRS consumers were more likely to have substance abuse and medical conditions as disabilities and were more likely to be working at time of application than were State VR consumers. Also, cases shared with the State VR agency were more likely to involve severe or significant disability than were other AIVRS cases. Our observations during site visits suggest that AIVRS projects are most likely to share their most difficult and expensive cases with the State VR program, in order to maximize the benefits that are available to these consumers.
34

TABLE 4.7Consumer Characteristic Comparisons
Characteristic Categories of Consumer
AIVRS Consumers
(n = 1,434)
AIVRS Consumers Shared with
State VR(n = 164)
Native American State VR Consumers
in AIVRS States(n = 9,247)
All State VR Consumers in AIVRS States
(n = 408,045)Median age 34.7 35.0 34.8 35.2Percentage of males 52.6 49.8 56.3 56.0Percentage with continued education after high school graduation 29.4 25.4 21.0 25.7Percentage with substance abuse 28.2 18.8 24.6 15.5Percentage with other medical condition 25.6 21.9 14.3 15.3Percentage with other orthopedic impairment 21.5 22.6 27.2 25.1Percentage severely or significantly disabled 53.8 77.9 67.9 73.5Percentage receiving Supplemental Security Income, Social Security Disability Insurance, or Veterans’ Disability benefits 33.1 26.7 24.3 28.2Percentage working at time of application 34.0 36.2 13.3 15.5Sources: Case Record Review Form- open and closed cases (weighted data), 1998 and 1999 RSA-911 Case Service Report databases
35

D. Unserved Populations
The AIVRS projects were asked to estimate the numbers of persons in their service areas who needed vocational rehabilitation services but were not receiving them. Table 4.8 shows the numbers of projects by size of unserved population. It should be noted that many of these persons may be unserved by their own choice. Thirty-one of the 54 projects operated in areas that were reported to have 700 or more Native Americans who needed but were not receiving vocational rehabilitation services.
TABLE 4.8Estimated Number of Native Americans By Project Needing Vocational Rehabilitation Services But Not Receiving Them
Native Americans Needing VR Number of ProjectsLess than 150 5150-399 10400-699 8700-1,199 101,200-1,999 82,000-4,999 65,000 or more 7Total 54
Median of Native Americans in need of services but not receiving them = 1,031.5
25th percentile = 348.8 75th percentile = 2,078.8
Source: Project Description Summary Form
Respondents to the mail survey were asked to indicate how they had developed the estimates presented in Table 4.8. The most common response was that the project estimated the percentage of persons with disabilities in the service area and multiplied that by the Native American population. Other common responses were that the estimate was based on staff estimates, or that data from the State, Indian Health service, the tribe, or special education programs were used to develop the estimate. The data thus must be considered to provide an imprecise measure of service needs.
Project directors, advisory group members, tribal representatives, and State VR staff were asked to identify populations that were not currently served by the projects. Nearly half of the interviewees identified physically disabled consumers as the largest unserved population. Other unserved populations that were identified were:
36

Consumers with mental health and substance abuse disabilities; Students with disabilities preparing for work; Consumers with multiple disabilities and social service needs; and Consumers who needed vocational rehabilitation in the area of work habits and social
skills at work.
Nearly all of the project directors stated that they had plans to increase services to these populations.
The same groups of respondents were asked to describe the major issues and barriers to providing services to these populations. Responses fell into four categories: (1) those associated with culture; (2) those related to the economic and job environment; (3) those related to program resources; and (4) those related to consumer characteristics.
Many of the issues and barriers were culturally specific, including:
Having no language to encompass a concept of disability; The stigma attached to acknowledging a disability; A reluctance by many consumers to re-locate off the reservation in order to obtain
employment; and The priority of social and family obligations over attendance at work.
Tribes vary in their response to persons with disabilities. In some tribes, disabled members are kept hidden by families, and individuals are hesitant to be labeled as eligible for VR services. To address the stigma attached to disability, one site co-located their VR services with other job programs. In this way, it was less obvious if the consumer was receiving VR or other job services. Other tribes value each individual for their contribution to the community and find that disabilities are so common that they are unremarkable or that they are a blessing as they teach families how to treat each other.
The following economic and job factors were also barriers to serving consumers:
The general level of unemployment/availability of jobs in the local area; The travel distance between the reservation and employment opportunities; The lack of reliable personal and public transportation; The seasonal nature of some employment opportunities made employment less
attractive; and Competition for/special preference given for job positions when they become
available on the reservation.
Tribal governments were frequent employers of AIVRS consumers, sometimes setting aside a percentage of openings for consumers. However, entry-level positions were those most likely to be made available.
37

Program resources were also cited as barriers to the availability of services:
Program outreach services that were not addressed to unserved consumers; The limited knowledge of project staff regarding the effects and rehabilitation of
specific disabilities; Inadequate project funds to address staff and consumer training needs; and The lack of a service network for consumers who need a more comprehensive
approach to vocational rehabilitation.
Finally, specific consumer characteristics were mentioned as barriers to providing VR services:
Consumers receiving Social Security benefits were less likely to apply for services; and
Previous consumers did not return for services when they became unemployed.
Summary of Chapter 4: Consumer Population
Number of Consumers Served The AIVRS program served 5,562 consumers during fiscal year
2000. A typical project served 64 consumers in the year and 50
consumers at one time.Consumer Characteristics 63 percent of consumers were under the age of 40. 53 percent of consumers were male. 71 percent of consumers had earned a high school degree or had
completed their GED. Only 5 percent had completed degrees above the secondary level.
Substance abuse was the most common disability of those consumers who were served.
86 percent of consumers had worked during their lives. 28 percent were working when they applied to the AIVRS program.
Unserved Populations The subpopulation of Native Americans that was most frequently
mentioned as needing but not receiving services from AIVRS projects was persons with physical disabilities.
38

5. ORGANIZATIONAL STRUCTURE AND MANAGEMENT
The chapter presents information on the organizational structure and management of AIVRS projects. It includes descriptions of the organizational locations of projects, project staffing, outreach and record keeping systems, project advisory groups, coordination with State VR agencies and other providers, monitoring and evaluation systems, interaction with RSA, and major implementation issues. The chapter addresses the third objective of the evaluation: Describe the organizational structures and management of the projects.
A. Organizational Location
The location of an AIVRS project within its tribal organization could potentially influence such factors as the project’s ability to make decisions quickly, the nature and scope of VR services provided, and the amount of resources available to consumers. A number of questions therefore were asked of tribal representatives and the project directors about organizational location.
The most common location of the AIVRS project within the tribal organization was in its own department. The next most common location was within the education department, which mirrors the Federal Government, as RSA is located within the Department of Education. Other organizational locations included the health department, tribal employment, social services, tribal colleges, and human resources.
Only a small number of project directors felt that location played a role in determining the amount of resources available to the project. Autonomy was not necessarily a guarantee of resources, in that some programs felt that being folded into a larger department gave them more resources and insulated them from some of the political pressures within the tribal government.
According to tribal officials, the resources provided by tribes to support the AIVRS projects are significant. Some of these resources are designed to meet the 10 percent matching requirement for the program, but a number of the tribes appeared to support the programs in excess of the minimum amount. Support falls into several categories: office and facility space, direct dollars to meet the programmatic needs beyond AIVRS grant resources, vehicles and transportation for consumers and staff, free medical and health services for consumers, equipment and supplies for the program, communication expenses such as mail, phones, e-mail and internet connection, supervision, and support structure. The most commonly mentioned resource was that of office space and facilities, with supervision and support services second.
Of significant benefit to AIVRS projects are the resources available to them as “similar or comparable benefits” through relationships with other tribal service providers. As the AIVRS projects are relatively small in relation to the fiscal demands placed upon them, other tribal programs are essential in allowing them to complete their mandate. The tribal programs that were commonly mentioned by tribal officials for providing services were: (1) Social Services; (2) Employment and Training; (3) Education; (4) Health; (5) Housing; and (6) Substance Abuse Treatment.
39

The majority of project directors indicated that they reported to their tribal supervisor on a monthly basis. The location of the project seemed to have little effect on the frequency of reporting or the method of reporting. Some of the project directors indicated that they reported in writing while others reported verbally.
B. Personnel
The size and composition of the AIVRS projects’ staffs varied across projects. The number of staff members ranged from one to sixteen employees. The median was five employees. Table 5.1 lists the different employment positions held by AIVRS project staff, the number of staff members in those positions, and the number of staff members who worked full-time. “Counselor” was the most common position held by staff members. A common project staffing pattern (in 22 projects) included a project director, 2-3 counselors and other professionals, and 1-2 other staff members. The largest projects were those most likely to have staff in specialized roles such as outreach coordinator, placement specialist, trainer, etc. Approximately 9 out of 10 AIVRS employees worked in full-time positions.
40

TABLE 5.1Staff Positions of the AIVRS Program
(n = 54)
Position Title
Personnel Information
Number in Position Number Full-Time
Counselor, social worker, specialist, vocational evaluator 99 99Director, acting director, and other AIVRS project leader 53 45Administrative assistant, clerk, office assistant, office manager, program assistant 29 28Case aide, case service assistant, counselor assistant, counselor trainee, eligibility technician, intake coordinator/statistician, rehabilitation aide, rehabilitation assistant, rehabilitation technician 26 22Secretary, receptionist, support staff 15 12Career planning and placement specialist, CRP coordinator, employment counselor, employment specialist, job coach, job developer, job placement specialist, school/work, transition coordinator, work adjustment counselor 15 9Assistant director, assistant director/lead counselor, assistant director/senior counselor, co-director/counselor, counselor supervisor, counselor/coordinator, lead worker, program manager, senior counselor 14 13Outreach coordinator, outreach counselor, outreach worker 8 5Field trainer, horticultural trainer, industrial trainer, instructor, training assistant 5 5Driver 3 3Budget analyst, finance officer 3 2Total 270 243
Source: Project Description Summary Form
41

Tables 5.2 and 5.3 provide additional data on the projects’ staff members. For analysis purposes, the job titles from the previous table have been combined into three categories: directors, other professionals, and support staff (e.g., administrative assistants, secretaries, drivers). Table 5.2 presents the percentages of staff who were Native Americans and tribal members, who spoke the tribal language, and the median years of experience working for the tribe(s) and working in the area of vocational rehabilitation. More than 8 in 10 of the staff members in each group were Native American, with support staff having the highest percentage. Half of the “Other Professional” group spoke the tribal language. The AIVRS project directors possessed the most tribal and vocational rehabilitation experience of the three groups.
TABLE 5.2Characteristics of AIVRS Project Staff
Characteristic
Categories of Employees
Directors(n=53)
Other Professionals
(n=170)
Support Staff(n=47)
All Staff Members
(n=270)
Percentage Native American 81.1 88.2 95.7 88.1Percentage tribal member 73.6 78.2 83.0 78.1Percentage using tribal language 32.1 50.0 44.7 45.6Median years of tribal experience 11.0 6.5 5.0 7.0Median years of VR experience 5.0 2.5 1.0 2.5
Source: Project Description Summary Form
42

Table 5.3 displays the three groups’ educational levels. More than 8 in 10 of the project directors had earned at least a bachelor’s degree and more than 1 in 3 had completed an advanced degree. The majority of the other professionals had also completed degrees beyond the high school level.
TABLE 5.3Characteristics of AIVRS Project Staff
Educational Level
Percentage of Employees
Directors(n = 53)
Other Professionals(n = 170)
Support Staff(n = 47)
All Staff Members
(n = 270)No high school degree 1.9 1.8 2.1 1.9High school degree 5.6 29.4 59.6 30.0Associate or vocational degree 11.3 24.1 27.7 22.2Bachelor’s degree 47.2 29.4 8.5 29.3Advanced degree 34.0 15.3 2.1 16.7Total 100.0 100.0 100.0 100.0
Source: Project Description Summary Form
Interviews with AIVRS project directors indicated that two-thirds of the study projects experienced problems with hiring and retaining staff. Approximately one-third of the projects had unfilled staff positions. The most common problems were finding qualified applicants, finding applicants willing to accept the salary and benefits package, and a cumbersome hiring process.
Most of the project directors reported that they were unable to find applicants with the experience, skills, and educational background required for vocational rehabilitation positions. Many attributed staff turnover and unfilled positions to low salaries and limited benefits packages for staff.
A few projects experienced difficulties with tribal hiring processes that did not support the timely hiring of staff, placed additional restrictions on the qualifications of the applicants, or left some positions in a part-time status with a full-time work load.
The most consistent approach to addressing the lack of candidates with appropriate training and experience was to provide training for staff. All project directors reported providing opportunities for some type of staff training. The number and extent of training opportunities varied according to the resources of the project and the accessibility to training sources. Training
43

opportunities ranged from 1 to 19 per project in the past year. The median number of trainings events was seven.
The majority of training events were related to information on specific disabilities, rehabilitation skills, professional skills, administrative skills, vocational rehabilitation issues, and health issues such as the medical aspects of disabilities.
Specific disabilities fetal alcohol syndrome/fetal alcohol effect traumatic brain injury mental health deaf/sensory substance abuse learning disability
Rehabilitation skills informed choice supported employment small business and self-employment opportunities Social Security benefits job development transitioning students domestic violence
Professional skills counseling writing interviewing case management conflict resolution multicultural/diversity training
Administration computers filing grant writing management
Vocational rehabilitation Rehabilitation Act vocational rehabilitation process Workforce Investment Act
Health HIV women’s health medical aspects of disabilities
Most of the project directors identified “all staff” as taking part in training. A few reported either counselors only or project directors only as training participants.
44
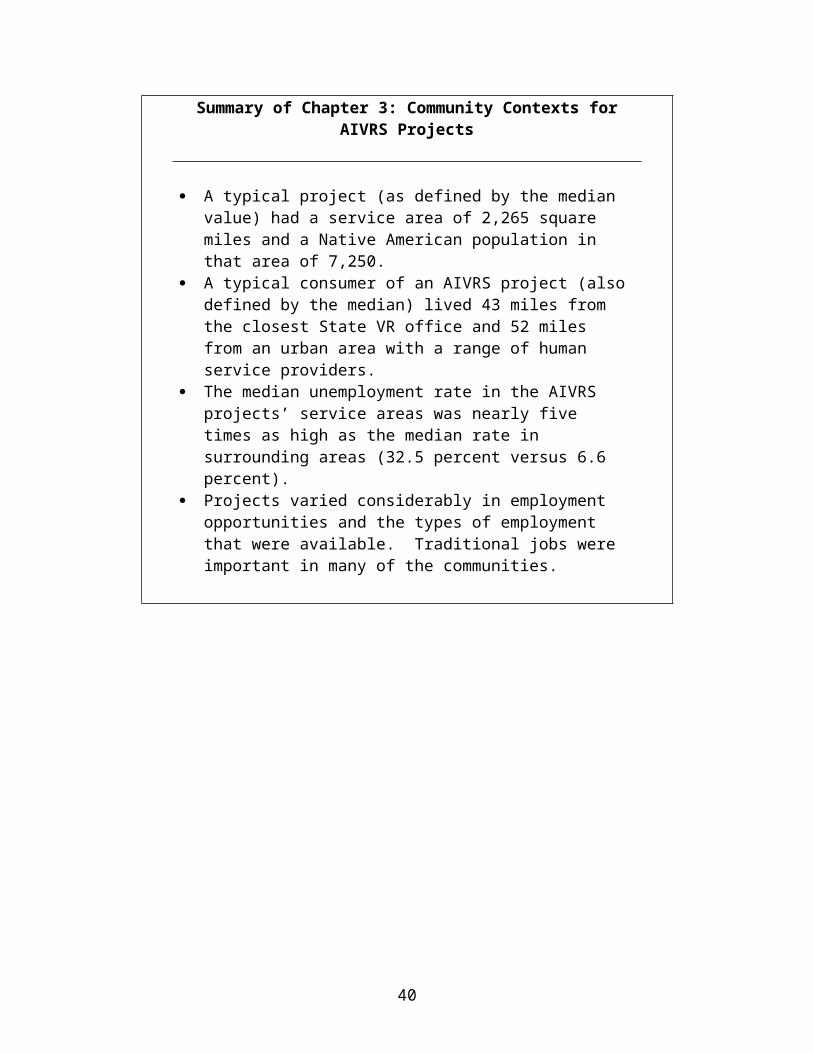
State VR offices, colleges, the Consortia of Administrators for Native American Rehabilitation (CANAR) and other conferences, and RSA’s Regional Continuing Education Programs (RCEPs) provided most training events. Some training events were provided by consultants, RSA, tribal organizations, and the American Indian Rehabilitation Research and Training Center.
All of the project directors were interested in providing additional staff training. Administration, professional skills and information regarding disabilities were the most frequently requested training issues. Some projects indicated that training specifically related to continuing college education in rehabilitation or CRC certification was a focus for continuing training. When asked about plans for improving project services, most project directors identified increased financial resources for staff training as a priority.
C. Outreach
All of the AIVRS projects advertised the availability of their services. Table 5.4 presents the various means of advertising that the projects used and the number of projects that used these means. More than 8 out of 10 projects employed a minimum of three methods to publicize their activities.
TABLE 5.4Advertising Methods Used by Projects
(n = 54)
Method Number of ProjectsPresentations to tribal or community groups 53Visits to other service providers 51Articles in general interest publications 46Written announcements to other service providers 42Media presentations (radio, TV, etc.) 29Other methods (included brochures/posters, word of mouth, health fairs, internet websites, parties/dances, parades) 21
Source: Project Description Summary Form
45

Table 5.5 lists the total number of times throughout the year that the 54 AIVRS projects reported using different advertising techniques. In-person group presentations were the most commonly used methods to promote the projects’ activities.
TABLE 5.5Number of Times Projects Used Different Advertising Methods
(n = 54)
Method Times During YearVisits to other service providers 1042Presentations to tribal or community groups 988Media presentations (radio, TV, etc.) 773Written announcements to other service providers 399Articles in general interest publications 325
Source: Project Description Summary Form
In interviews, AIVRS project directors were asked to indicate what they believed to be the most effective types of outreach. The most common response was “word of mouth,” which indicates the importance of informal communication methods in Native American communities. The project directors also listed presentations to other providers, newspaper articles, community presentations, radio, special events (fairs, etc.) in the community, and brochures as effective outreach methods.
D. Record Keeping
Record keeping and consumer information requirements of AIVRS projects are limited, but specific. AIVRS projects are required to inform consumers about the services offered by the project and to record specific information about each consumer as it relates to providing vocational rehabilitation services. Consumers must be informed of the eligibility requirements, services provided by the project, and their right to a fair hearing and appeal regarding decisions made by the project staff. Information about the consumer’s eligibility status, information gathered to assess the need for service, and an Individual Plan for Employment (IPE) are required to be kept by each project. All information concerning consumers is confidential, as required by the 34 CFR 369 regulations.
AIVRS project directors provided copies of forms, policy and procedure manuals, and a mock consumer case record file for review. In addition, some projects provided consumer handbooks, consumer surveys, employee review forms, and Management Information System (MIS) descriptions. Many of the projects had adopted or adapted forms used by their relevant State VR
46

agencies, particularly if there was a strong relationship with the State agency. Two categories of forms were evident: Forms providing information regarding:
eligibility services provided by the project consumer rights and responsibilities to a fair hearing and appeals process State Client Assistance Program (CAP)
Forms recording and storing information regarding: eligibility determination assessment of service needs consumer background information IPE and service plans services actually provided consumer involvement in service plans consumers’ understanding of their rights and responsibilities program cost per individual consumer individual consumer outcomes overall program costs
Project brochures and consumer handbooks were the most common source of information about consumer eligibility and services provided. Some projects also informed potential consumers through posters, flyers, and service orientation sessions. Projects used a number of mechanisms to inform consumers of their rights to a fair hearing and appeal and responsibilities for participating in services. Most projects used three or more sources to repeat the information throughout the vocational rehabilitation process. A separate rights and responsibilities statement, a consumer handbook, and the application for services were the most common resources. For information about the Client Assistance Program, most projects provided a brochure developed by the State explaining that individual State’s appeals process.
Forms used for recording information in individual case records appeared to be influenced by state vocational rehabilitation programs. Most of the forms used for documenting individual services closely resembled state forms in their layout, content and use. Some were identical to state forms; others adopted with minor changes to fit the project. A few developed unique forms for use only by their project.
Most of the projects documented consumer eligibility using a separate form that identified whether the consumer was eligible or ineligible. This decision was verified in a letter to the consumer, along with an appointment date to see a counselor for further intake or an explanation of ineligibility. A few projects included additional verification through a tribal enrollment statement, extension of eligibility form, or certificate of severe disability. A counselor and the project director signature were required for eligibility forms.
With few exceptions, the same forms were used to gather information to assess the service needs of the consumer and to provide additional background information. All projects relied on obtaining testing or medical evaluation reports to augment other consumer background
47

information. Some forms were completed by both the consumer and provider, such as a health questionnaire or functional assessment of the impact of the consumer’s disability. Two projects included career and interest surveys completed by the consumer as a part of assessment records. An application for services, intake interview, or income statement was most commonly used to record additional consumer background information. A few projects also included MIS records as a means of recording this same information.
Projects used an IPE form to record the vocational goal and intended vocational rehabilitation services. The IPE form also sometimes documented the actual services provided. A few projects used forms for specific conditions for providing services, such as compliance with a prohibition on alcohol and substance abuse, and financial aid agreements for consumers receiving training.
Most of the forms used to record and store information about the services actually provided documented the cost of the service, consumer participation in cost-sharing, and consumer participation in services. These included training and employment progress reports, contracts and requests for services, expenditure and purchase order forms, time and attendance sheets for consumers, and transcripts for consumers involved in education programs. Case notes were frequently used to document services provided to consumers. A few projects used a checklist or MIS record to provide a summary overview of the services, service dates, and the consumer’s rehabilitation status.
The presence of a consumer’s signature was used to confirm involvement in the vocational plans and services and informed choice. Many, but not all, of the forms collected from project directors required signatures. The forms most likely to include consumers’ signatures were those documenting: (1) the consumer’s understanding of their rights and responsibilities; (2) service plans; (3) eligibility determination; and (4) consumer background information. A consumer’s signature was not required on internal forms such as case notes, client status sheet, MIS data, and service summary checklists.
Some projects encouraged consumers to complete the IPE in their own handwriting as evidence of consumer involvement in service plans. A few provided consumers with a guide explaining each aspect of the IPE and suggestions for making decisions about the vocational rehabilitation process. A few projects provided consumers with a listing of local service providers and native healing services for their review. Other projects framed the content of some forms in “I” statements for consumers to complete.
From the forms provided by project directors, two categories of forms emerged as sources of documentation of the consumers’ understanding of their rights and responsibilities. One was a separate form usually including the words “rights and responsibilities” in the title. Many projects used separate sections within other forms that included the words “rights and responsibilities.” The forms most commonly structured to include rights and responsibilities statements were application and IPE forms.
Forms for recording and storing information program costs per individual consumer and overall program costs varied according to project mechanisms for financial accountability. Almost all of the projects used an agreement to provide services from a vendor that included the
48

cost and the name of the consumer receiving the service. Many projects included vouchers, requisition forms and other accounting forms to record individual costs. Some projects included a specific cost summary sheet in each case record to keep a running record of individual costs. A few projects recorded projected and actual costs for services in the IPE form or MIS system. A separate administrative or accounting department system, sometimes as a part of the tribal council responsibilities, generally recorded overall program costs.
The comprehensiveness of record-keeping systems appeared to vary based on the size of the project and experience of the project director in managing human service programs. Larger projects and those with experienced directors appeared to have more detailed systems.
As a measure of quality of record keeping, at the conclusion of our site visits, Development Associates’ data collection team leaders were asked to rate the completeness of consumer records. Team leaders used a six point scale (1-6) of presence and completeness of records from “none” to “more than 9/10” complete. They rated eight types of information in consumer records: (1) consumer eligibility; (2) consumer background characteristics; (3) consumer service plans (IPE and others); (4) services provided to consumers; (5) consumer involvement in service planning; (6) consumer understanding of rights and responsibilities; (7) costs related to specific consumers; and (8) consumer outcomes.
Approximately two-thirds of the projects had an average rating across information types of greater than 5.0 on the six-point scale (more than ¾ of the required data present), while one-third had average ratings below 5.0. In terms of types of information, data were most likely to be reported available on consumer background characteristics (mean rating = 5.36), consumer involvement in service planning (5.35), and consumer eligibility (5.31). Data were least likely to be reported available on consumer outcomes (5.00), consumer service plans (4.88), and costs related to specific consumers (4.85). Projects that worked closely with the State VR programs appeared to be more likely to have effective record-keeping systems.
Data collection team leaders also rated the ease of information access using a three point scale from “poorly organized and hard to access” to “moderately well organized” to “very well organized and easy to access.” Records in two thirds of the projects were rated as “very well organized and easy to access.” Virtually all of the remaining projects had project records that were rated as “moderately well organized.”
E. Advisory Group
An advisory group is not required under the AIVRS program. However, in order to gain community input, some AIVRS programs have established advisory groups. The involvement of an advisory group comprised of consumers and professionals is a common practice in the delivery of social services. The use of advisory groups is especially relevant for administering rural vocational rehabilitation programs (Harley, Rice & Dean, 1996; Larsen & Foley; 1992), for strengthening the delivery of services (Fry, 1996), and for assessing the needs of American Indians with disabilities (Marshall, 1994).
49
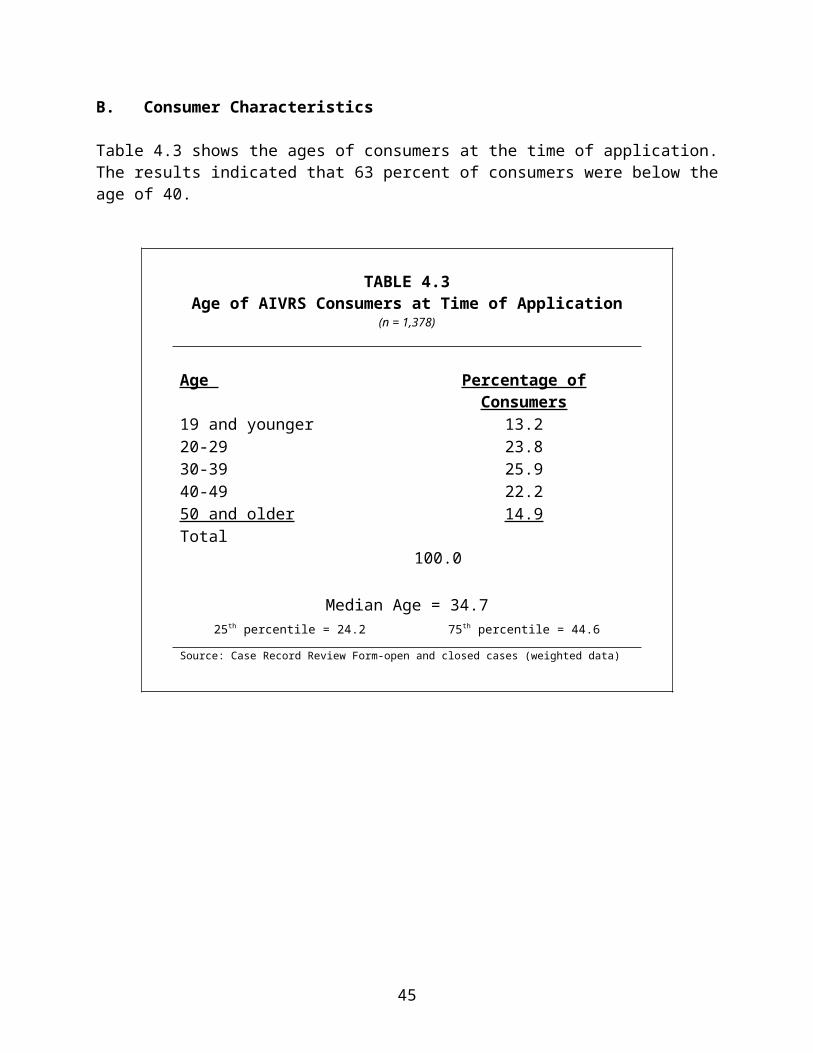
The success of an advisory group is closely associated with the training provided for the group members and leaders. Fry (1996) indicates that leadership development, trust and respect, a clear definition of role and responsibilities of the members and leaders, specific recruitment strategies for membership, and operational strategies to keep the advisory group involved in the growth of the rehabilitation program are essential to its success. There are a range of resources for training advisory group members and leaders to carry out their roles (Davis & Glenn; 1997; RRTC on Aging with a Disability, 1998; Oregon Developmental Disabilities Council, 1995).
Participation in advisory groups calls for skills that are not valued in American Indian culture (making direct statements/suggestions and strong advocacy skills) or for which there is limited opportunity for gaining experience (administration and public relations). AIVRS projects thus face particular challenges in implementing and sustaining advisory groups.
Thirty-three of the 54 AIVRS projects had advisory groups. However, four of the groups had not met and four had met only once in the previous year, suggesting an inactive status. The groups’ sizes ranged from 4 to 34 members. Table 5.6 presents the medians for various advisory group characteristics.
TABLE 5.6Advisory Group Characteristics
(n = 33)
Characteristic Median Number of group members 8Number of group members with disabilities 3Number of Native Americans in advisory group 6Number of meetings during the past year 4Average attendance at meetings 5
Source: Project Description Summary Form
Interviews with project directors and advisory group members requested information regarding the relationship of the project and advisory group. The interviews focused on the background of group members, group topics for business, and the influence of the group on the project.
When asked why they were serving on the group, most advisory group members indicated that they were in some way familiar with individuals with disabilities through personal experience, as a family member, service provider, or advocate for an individual with a disability. All had experience with vocational rehabilitation, social services and education.
Advisory group members identified their personal contributions to the project as:
50
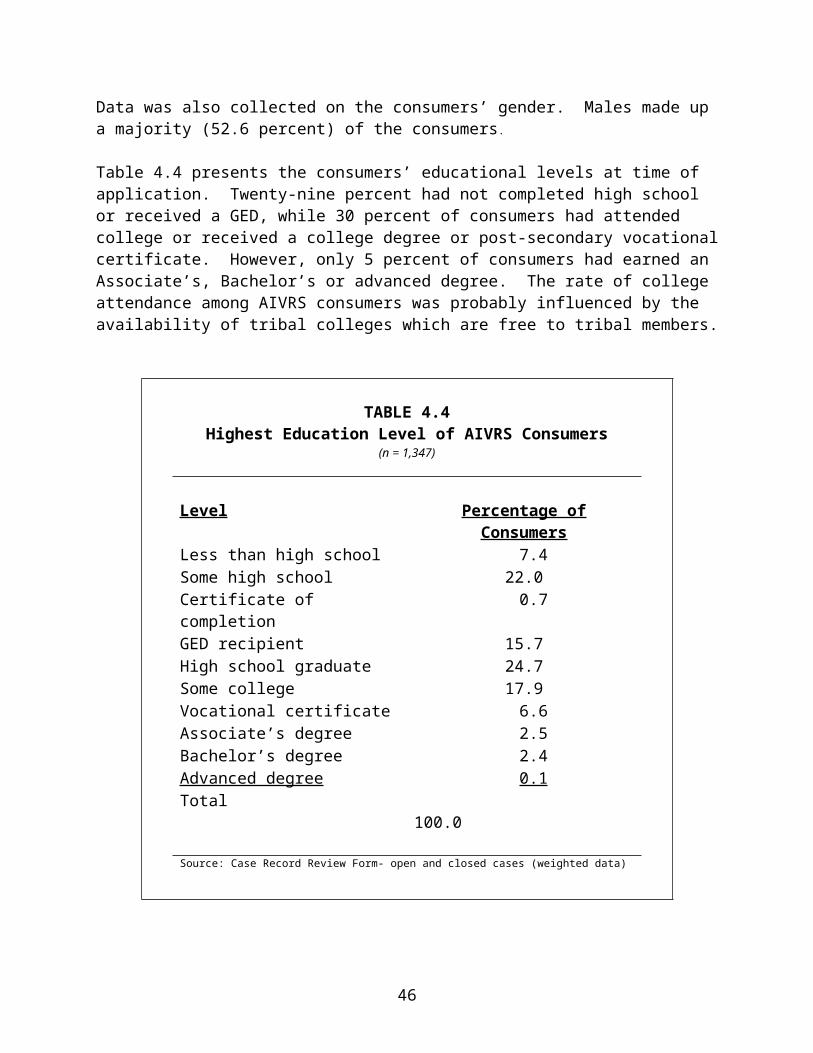
Providing information; Assisting with outreach activities; Bringing diversity to the project; Giving guidance to the project services; Listening; and Adding another level of professionalism
AIVRS project directors identified the purposes of advisory group meetings as: Monitoring and evaluating the progress of the program; Reviewing policies and procedures; Reviewing the types and focus of services to various disability populations; Increasing access to additional support services; and Increasing disability awareness.
One advisory group was specifically charged with identifying their own purpose and chose disability awareness as its sole focus.
Both project directors and advisory group members were asked whether the advisory group has had an impact on the project. Advisory group members most often characterized the group as being somewhat influential. Project directors, however, most often characterized their advisory group as consistently influential.
Advisory group members and project directors were also asked to identify problems or issues that affected the relationship and effectiveness of the advisory group. Nearly all advisory group members indicated that there were no problems or issues that affected the relationship with the project director or program. A few mentioned changes in project director and leadership as an issue.
Of the project director responses, most identified the low attendance at advisory group meetings as a problem that affected the program’s relationship with the advisory group. Project directors without an advisory group also identified low attendance as a major influence on their decision to not have an active advisory group.
Various approaches were cited to deal with the attendance problem, including providing meals at the advisory group meetings, and meeting more often to maintain the interest of group members. To address low attendance and distance problems, one project used teleconference calls to convene and conduct advisory group meetings.
51

F. Coordination with the State VR Agency Forty-six out of the 54 AIVRS projects had a formal written Memorandum of Understanding with the corresponding State Vocational Rehabilitation (VR) program. Table 5.7 lists the most common ways that AIVRS projects coordinated with the State VR programs and the number of AIVRS projects that worked with the State programs in each way. The most common approach was through case sharing. The median number of cases shared was four.
TABLE 5.7Types of Coordination Between AIVRS Projects and State VR Offices
(n = 54)
Method of Coordination Number of Projects AIVRS project shared cases with State VR 46AIVRS project staff received training from the State VR 45State VR provided services to AIVRS project cases 39AIVRS project provided services to State VR cases 36AIVRS project provided training to State VR staff 35Other methods* 14
Source: Project Description Summary Form*(included: membership on State VR councils, consulting with each other, attending each other’s staff meetings, cash match agreements, contact with Indian desk-state liaison, meeting with staff, networking with State VR counselors, State CAP, and joint presentation at a CANAR conference.
Interviews with AIVRS project directors and State VR staff members provided information about the nature and extent of their collaboration and specific barriers to collaboration.
Collaboration and cooperation efforts included case management, interagency meetings, joint training, exchanging formal reports on consumers, and participation on advisory boards.
Most State VR agency staff and AIVRS project directors did not express any concerns about the relationship. In a minority of projects, however, there were serious concerns that affected the relationship. State VR staff concerns about AIVRS projects included the quality of VR services provided, the limited VR experience of the project staff, the limited services provided by projects, the lack of follow-through on the part of project consumers referred for services, and the lack of feedback regarding the progress of consumers referred to projects. AIVRS project directors expressed concerns about large State VR caseloads, the quality of services provided, the denial of services to some consumers, the lack of knowledge about tribal approaches to VR, and lack of sensitivity to consumers practicing traditional tribal ways.
52

Both AIVRS project directors and State VR staff members agreed that the problems and issues were in the process of being addressed through increased contact between the two agencies.
Observations during site visits suggested that formal mechanisms such as memoranda of understanding and participation on State VR councils were not the most important factors in determining the quality of coordination between State VR agencies and AIVRS projects. The assignment of State VR staff as liaisons was often quite helpful, but the most important factor was the quality of relationships between local State VR agency staff and AIVRS staff members.
G. Coordination with Other Service Providers
Representatives of other organizations making referrals to and/or providing services to AIVRS consumers and AIVRS project directors were asked to describe the relationship between organizations. Most service providers identified their relationship with projects as informal, characterized by phone calls and personally introducing consumers to staff. More formal relationships were characterized by the use of specific referral forms along with telephone contacts, sometimes required supporting documents as a part of the referral process.
The most common forms of collaboration and cooperation efforts between AIVRS projects and other agencies were: (1) case management activities; (2) interagency meetings; (3) joint training sessions; (4) joint participation on advisory boards; (5) exchanging formal reports on consumers; (6) attending conferences together; (7) sharing the same physical space or visiting the project; and (8) providing job placements for consumers.
Most service providers reported having no problems or issues with AIVRS projects. The most common issues that were reported were lack of feedback regarding the progress of consumers referred to projects, lack of readiness for employment by consumers referred for vocational services, delayed payments for services, and the lack of follow-through on the part of project consumers. Some service providers indicated that the problems had been resolved or the situation had changed for the better, while others indicated that there had been no resolution or change in response to the problems.
H. Monitoring and Evaluation
There are relatively few monitoring and evaluation requirements for AIVRS projects. Projects are required to submit annual performance reports to RSA, but there are no specific content or data requirements for those reports. As part of the Government Performance and Reporting Act (GPRA), RSA staff annually request three pieces of information from projects: (1) the number of consumers served under an individualized plan for employment (IPE); (2) the number served under an IPE with a successful employment outcome; and (3) the number of cases closed without a successful employment outcome.
In addition, RSA staff members reported making approximately 14 visits to projects in the previous year (FY2000). The primary purpose of these visits was project monitoring for compliance with RSA regulations, though the visits also included technical assistance activities.
53

RSA staff members indicated that the number of visits was somewhat lower than in previous years.
In interviews, AIVRS project directors were asked about their monitoring and evaluation practices. They all reported that the projects had defined measurable objectives, and that those objectives were documented in grant applications and/or annual reports. Most but not all indicated that the objectives included target dates for completion.
When asked who was responsible for monitoring and evaluation, the most common response was the AIVRS project director. Some projects also mentioned the involvement of the project director’s supervisor, project staff members, and tribal finance office staff. Approximately one-fifth of the project directors reported the involvement of an external evaluator.
In addition to the annual performance report required by RSA, project directors reported a number of other reporting mechanisms. Approximately one-third reported preparing either monthly or quarterly reports on the project, and a few described external evaluation reports, customer satisfaction survey reports, and financial audits. Project results were also communicated through verbal reports to tribal administrators, meetings of various program directors, presentations to tribal councils, community meetings, tribal newspapers, radio reports, and information being posted on a Web site.
I. Communication and Assistance from RSA
The AIVRS program is managed by a three-person team, two in RSA offices in Washington, DC and one in a regional RSA office in Seattle, Washington. These three persons reported spending the equivalent of 1.3 full time equivalents (FTE) on the program. Other staff members in these two offices also provide assistance to the program.
RSA hosts a monthly conference call to communicate with projects. In addition, among the RSA staff members interviewed, in the past year they estimated making more than 1600 telephone calls, sending more than 60 letters, sending more than 1500 e-mail messages, and receiving 16 visits by projects in their offices. The most common topics of these communications were program regulations, program reporting requirements, staffing and other project management issues, accounting and financial issues, and effective VR practices. RSA staff also reported more than 70 telephone calls and more than 60 e-mail messages to potential AIVRS grantees.
Among the AIVRS project directors who were interviewed, all but four reported seeking assistance from RSA personnel in Washington, DC or Seattle, Washington. When asked to rate the quality of the assistance they had received, with three exceptions, they rated the assistance positively. They used phrases such as “extremely helpful,” “excellent,” and “very approachable” to describe RSA staff.
J. Implementation Issues
In interviews, AIVRS project directors were asked to describe the major issues that they had faced in implementing their projects. RSA staff members were asked a similar question about
54
AIVRS projects. Although there was a great deal of diversity in the responses, some common issues did emerge:
Difficulty in finding and retaining qualified staff; Problems in dealing with tribal governments; The lack of guidance and models for forms, policies, procedures, etc.; The uncertainty of funding weakens project stability; Inadequate facilities; and The need for a job developer.
One of the most common issues mentioned was the difficulty in finding and retaining qualified staff. Project directors reported difficulty in finding staff with appropriate qualifications, and had problems with turnover after they were hired. In some cases, this problem was caused or worsened by low salary and benefit levels set by the tribes. Observations during site visits suggested that staff turnover problems included the project directors, a number of whom changed or were replaced while visits were being planned. Such changes in leadership were particularly disruptive to project operations.
Another common issue was difficulties in dealing with tribal governments. Tribal leaders often do not understand key elements of the VR process, such as eligibility requirements and the need for confidentiality. Thus, they may seek more control over project resources than is appropriate. Tribal government fiscal systems are also often slow and cumbersome, which interferes with payment of service providers and others.
A third common issue, especially for new projects, was the lack of guidance and models for how to administer a VR program. Many of the project directors are not VR professionals, so they do not know what forms, policies, and procedures are appropriate for their projects. They often have adopted or adapted the systems used in their State VR programs, but these may not have been appropriate. Project directors thus often have felt like they were “reinventing the wheel.”
Another common issue for projects was uncertainty about future funding. Because AIVRS is a competitively funded discretionary grant program, future funding is not assured beyond the typical five-year grant period. Thus, project staff members were reported to spend time worrying about future funding, and the uncertainty of or lack of refunding was reported to have weakened the stability of some projects.
A major issue for some projects was the lack of appropriate facilities. Counselors may not have adequate space for confidential interviews, the facilities may not be fully accessible, or there may be inadequate equipment (computers, phone lines, etc.). During site visits, in a number of cases counselors were observed conducting interviews in spaces lacking privacy.
Finally, some project directors suggested the lack of a job developer as an issue. The functions of VR counselors and job developers are very different, so when they are combined in one position there is often job stress. Projects that reported hiring a separate job developer have generally been pleased with the results.
55
Summary of Chapter 5: Organizational StructureAnd Management
Organizational Location The most common organizational locations for AIVRS projects
were in a separate department or in the education department.Personnel Of the 270 staff members of AIVRS projects, 88 percent were
Native Americans and 78 percent were tribal members. Two-thirds of the projects reported problems with recruiting and
retaining staff.Outreach The most common activities for outreach were visiting other
service providers, giving presentations to tribal or community groups, and advertising through radio, television, and other media.
Record Keeping The record keeping systems of projects were strongly influenced
by the systems of relevant State VR agencies. AIVRS case records were more likely to include information on
consumer backgrounds, consumer choice, and eligibility than information on service plans, consumer outcomes, and consumer costs.
Advisory Group Less than half of the AIVRS projects had active advisory groups
(i.e., that met more than once a year). A typical advisory group had eight members, six of whom were
Native American, and three of whom had disabilities. Interagency Coordination The most common forms of coordination between AIVRS projects
and State VR agencies were sharing cases and the State VR agency providing training to the AIVRS staff.
Implementation Issues The most common implementation problems for AIVRS projects
were recruiting and retaining staff, dealing appropriately with tribal governments, and developing methods and systems of operation.
56

6. VOCATIONAL REHABILITATION PRACTICES
Vocational rehabilitation has historically been a program built around a process that enables an individual with a disability to move from unemployment or underemployment to employment through a structured process. Five key elements of that process are eligibility determination, vocational assessment, service planning, consumer choice, and due process. This chapter describes how AIVRS projects address these elements. The chapter addresses the fourth evaluation objective: Describe the projects' vocational rehabilitation (VR) practices, regarding: vocational assessment, determining eligibility for services, developing plans for services, fostering consumer choice, and delivering services.
A. Eligibility Determination
The Rehabilitation Act Amendments of 1998 defines an individual eligible for vocational rehabilitation services as meeting the following criteria:
The individual has a physical or mental impairment which constitutes or results in a substantial impediment to employment;
The individual requires vocational rehabilitation services to prepare for, secure, retain, or regain employment; and
The individual can benefit in terms of an employment outcome from vocational rehabilitation services.
There are two additional requirements under the AIVRS program:
The individual is a member of any Federal or State Indian tribe; The individual resides on or near a reservation, Alaskan village or regional village
corporation.
Among the sites visited, all appeared to be fulfilling the legislative requirements regarding eligibility and non-eligibility criteria for services. Consumers were informed of the criteria for eligibility and their own eligibility status. According to data from the case record review, the median number of days between application date and eligibility date was 26.0 days.
Project directors identified counselors and project directors as the staff responsible for determining consumer eligibility. A few projects identified specific intake staff. Brochures and promotional material, consumer handbooks, consumer rights and responsibility statements, intake and assessment sessions with counselors, and exit interviews were used to inform consumers about the eligibility criteria.
The legislation was also the basis for decisions regarding ineligibility for services. The most common reason for ineligibility was related to the applicant’s present state of disability. Often there was a lack of documentation regarding the disability or the consumer’s functioning was not stable. The latter was especially true for consumers diagnosed with substance abuse.
57

The second most common reason was an inability to benefit from services such as non-compliance with treatment goals, lack of follow-through on the part of the consumer, or simply being too severely disabled to work. A few projects reported applicants who were actually capable of finding employment on their own. Only a few reported a lack of documentation of tribal membership.
B. Vocational Assessment
One of the foundational pieces of the vocational rehabilitation process is vocational assessment. Under the current Rehabilitation Act, VR programs are required to assess the individual’s “vocational rehabilitation needs.” Vocational assessment is part of assessing ones vocational rehabilitation needs. The Act discusses providing a “comprehensive assessment to determine the unique strengths, resources, priorities, concerns, abilities, capabilities, interests, and informed choice” of the individual. Vocational assessment is designed to assist the individual in the planning for and development of their plan of services.
Under the heading of “vocational assessment”, a VR counselor will look at such things as aptitudes, interests, intellectual functioning, physical capacities, and or prevocational/vocational skills. Study findings indicate that all AIVRS programs provide some form of vocational assessment. The majority of AIVRS projects provide formal vocational evaluation through some type of arrangement with a state job service, a licensed psychologist, a community rehabilitation program, a private vendor, or a State VR vocational evaluation center or evaluator. Few programs provided their own formal evaluations due to program size.
AIVRS vocational assessment activities included informal assessment sessions in which the counselor and consumer discussed the individual’s vocational history, interests, transferable skills, personal preferences and plans. In addition, the individual was sometimes referred to a local psychologist for more extensive evaluation of intellectual functional abilities and aptitudes. A psychologist may also be used to examine such things as personality traits and emotional factors along with interests and preferences. A valuable resource for a few of the programs that were adjacent to urban areas were community rehabilitation programs that provided a fairly broad range of vocational assessment options. Finally, several tribes partnered with State vocational evaluation centers or evaluators to secure necessary vocational evaluation services.
Approximately half of the responding programs indicated that they have written program guidelines for vocational assessments.
C. Service Plans
The heart of each AIVRS consumer case record is the Individual Plan of Employment (IPE). The AIVRS program has its own set of regulations that were implemented in 1981. However, more current guidance is found in Section 102(b) of the Rehabilitation Act as amended in 1998. This section of the Act describes the development of the IPE. Section 102(b) states that the IPE shall be a written document prepared on forms provided by the designated State unit, and that a qualified VR counselor be available to assist the individual and or their representative through the IPE process. This part of the Act indicates that the individual and or their representative along with the VR counselor shall complete the IPE. In addition, the Act states that the VR
58

counselor along with the consumer and or their representative will review the IPE at least annually, and it will be amended on an as needed basis.
The responses of AIVRS project directors indicated that all AIVRS projects utilize an IPE form for recording the plan of service. In most cases the VR counselor completes the form. A few indicated that the counselor and the consumer complete the form. Data from the case record review indicate that the median number of days between the date of eligibility and completion of the IPE was 14.7 days.
IPE forms were reviewed for content to determine how well they met the overall guidelines in the federal regulations. Most of the projects included the required elements such as the steps needed to reach the goal, identification of services needed, and time frames for service. The elements most frequently missing from the IPE forms were the identification of specific service providers and service cost, dates for completing the steps of the plan, and a measurement for indicating progress or completeness of a goal. All IPE forms included the counselor’s signature; a few required the project director’s signature.
When asked if their project utilizes the same or different forms to record the services that are actually provided to the individual, project directors indicated two patterns: the IPE only and the IPE and other case materials. The majority indicated that case recording and other materials was the primary methodology in tracking the services actually provided. A few of the project directors indicated the IPE as the primary method. When asked who actually recorded the information, virtually all of the project directors indicated that the counselor recorded the information, while a few indicated that the counselor and the consumer recorded the material.
Finally, the directors were asked who reviews the IPE and how often it is amended. The most common response as to who reviews the IPE was, “the counselor”, with a few stating the IPEs were reviewed by the project director, and a few stating the project director and the counselor together. Most of the project directors indicated that IPE forms were reviewed and amended “as needed,” and not based on a specific schedule. A few indicated annual or monthly reviews were made, and a few indicated reviews between one and three times a year.
D. Consumer Choice
Consumer choice is one of the key elements of the 1998 amendments to the Rehabilitation Act. The right to informed choice is stated as one of the findings of Congress and is alluded to under other sections stating purpose and policy. Informed choice is elaborated upon in several sections of the Act that emphasize its importance in rehabilitation legislation thought and practice.
All of the AIVRS project directors interviewed indicated an awareness of the need for informed choice and described how they encouraged the consumer’s involvement during the rehabilitation process. The most common response to how the projects encouraged consumer choice was by utilizing some form of counseling. When asked which method of encouraging choice was most effective, the most effective method described was some form of counseling or “personal approach.”
59

When asked how choice was documented, virtually all of the directors indicated that the IPE form documented the consumer’s participation or choice. A number of the directors indicated that case notes were also utilized to document informed choice.
E. Due Process
The issue of due process or the right to appeal is well documented in the Rehabilitation Act. However, references in the Act only address the State VR system, and there is no reference to the issue of “due process” specifically related to AIVRS program. The AIVRS regulations developed in 1981 address the requirement for “a review” and refer to State VR regulations in that they indicate the process must be “comparable” to that of the State. Currently there is no clear guidance on the issue of due process for AIVRS programs.
Interviews with AIVRS project directors indicate that all of the programs have an appeals process that is formal, informal or both. Of the programs evaluated, approximately half have a formal process only, only a small number have an informal process only, and slightly less than half of them have both formal and informal processes.
Project directors were asked how often consumers are notified as to their right to seek review. Responses were from one to three times during the case history; the most common response was that the individual received notification three times. Less than half of the programs utilized a specific form to notify individuals of their right to due process.
During the year preceding the interviews, only a small percentage of the project directors indicated that they had received formal or informal appeals and the total number of appeals was very small.
Summary of Chapter 6: VocationalRehabilitation Practices
AIVRS projects were fulfilling the legislation requirements concerning consumer eligibility.
All AIVRS projects provided some form of vocational assessment, most often through an arrangement with an outside provider.
The Individualized Plan for Employment (IPE) forms used by projects to record service plans contained most of the elements defined by Federal guidelines.
All of the projects had consumer appeals processes, but there were few appeals by AIVRS consumers.
60
7. VOCATIONAL REHABILITATION SERVICES
AIVRS projects and other VR agencies are authorized to provide a wide range of services to consumers in order to help them reach their employment goals. The AIVRS program is unique in that native healing services are among the services that are allowed. This chapter describes the services that AIVRS projects offered, the providers of those services, and comparisons with the services offered by State VR agencies. This chapter addresses the second part of the first objective of the evaluation: Describe and analyze the characteristics, services received, and outcomes of Native Americans with disabilities.
A. Services Offered by Projects
All 54 AIVRS projects in the evaluation were asked to identify vocational rehabilitation services provided to consumers and the number of consumers (none, a few, some, most) receiving these services. Table 7.1 presents these project-level data. The table lists the number of AIVRS projects that provided vocational rehabilitation services to “some” or “most” consumers. AIVRS projects were most likely to provide financial support for transportation, vocational counseling and guidance services, and vocational assessment services.
61

TABLE 7.1Services Provided by AIVRS Projects to Consumers
(n = 54)
ServiceNumber of Projects Providing Services to
“Some” or “Most” ConsumersTransportation 46Vocational counseling and guidance (beyond normal case management)
43
Vocational assessments 42Substance abuse services 41Medical consultation and treatment 40Job finding training 39Job placement services 39Psychological or psychiatric services 39Tools, equipment, supplies, licenses, certificates 38Vocational or business training 37Maintenance 30On-the-job training 27Post-employment services 24Post-secondary education 22Secondary/GED education 21Personal and work adjustment training 20Self employment services 18Native healing services 16Services to families of consumers 11Supported employment services 9Rehabilitation technology services 7Personal assistance services 5Independent living services 3Source: Project Description Summary Form
62

The second source of information on services received came from the review of case records. Table 7.2 shows the percentage of AIVRS consumers whose cases were closed during the previous two years (including those determined not eligible and those not receiving services under an IPE) who received each service. A majority of consumers received vocational counseling and guidance services, and almost half of the consumers received vocational assessment services. Transportation support was found in case records less frequently than would be expected based on project responses, perhaps because transportation assistance was often provided informally by the project (in staff cars or project vans).
TABLE 7.2Percentage of Consumers Receiving Services
(n = 826) Service PercentageVocational counseling and guidance 55.3Vocational assessment 47.4Medical consultation and treatment 39.5Maintenance 27.0Tools 24.5Transportation 23.5Psychological or psychiatric services 21.6Vocational or business training 21.4Substance abuse services 15.7On-the-job training 14.6Job placement services 13.8Personal assistance services 12.9Job finding training 12.6Adjustment training 9.6Secondary/GED education 8.5Rehabilitation technology services 8.3Post-employment services 7.6Post-secondary education 7.0Supported employment services 5.4Services to families of consumers 5.2Self-employment services 3.5Native healing services 2.3Independent living services 2.2Source: Case Record Review Form-closed cases (weighted data)
63

Table 7.3 shows the number of different services that consumers received. A typical consumer received three different types of services.
TABLE 7.3Percentage of Consumers Receiving Different Services
(n = 826)
Number of Services Provided Percentage of Consumers0 services 24.21-2 services 21.93-4 services 18.65-6 services 13.57-8 services 9.79-10 services 3.611-12 services 3.013-14 services 3.615 or more services 1.9Total 100.0
Median = 3.0 services
25th percentile = 1 75th percentile = 6
Source: Case Record Review Form-closed cases (weighted data)
The number of services received varied based on type of closure. Consumers with successful employment outcomes received a median of six services (25th percentile = 4, 75th percentile = 9), unsuccessfully closed consumers who received services under an IPE were provided a median of five services (25th percentile = 3, 75th percentile = 7), consumers not receiving services under an IPE received a median of one service (25th percentile = 0, 75th percentile = 2), and individuals classified as not eligible received a median of zero services (25th percentile = 0, 75th percentile = 1).
64

Figure 7.1 provides data on the number of months that consumers received services from the AIVRS program (time was measured from the consumer’s IPE date to his/her closure date). It should be noted that a large number of the consumers did not receive services under an IPE and thus are not included in these calculations, and a large number of those served were missing either an IPE date or closure date in the records. The majority of consumers (63.0 percent) who were served under an IPE were in the program for less than one year. AIVRS consumers in projects established prior to 1997 spent significantly more time in the AIVRS program compared to the consumers in newer projects (median = 8.6 months in established projects vs. 6.4 months in new projects). Consumers in more remote projects (i.e., in which the average resident lived 50 or more miles from the nearest urban area with a range of human service providers) also spent more time in the program (median = 8.9 months) than consumers in other projects (median = 8.0 months).
Interviews with AIVRS project staff identified issues the project experienced in providing services. The major issues were:
The lack of transportation for consumers which limited the services and employment available;
Limited local employment; The consumers’ limited education, training, and experience to apply for open
positions; Limited funds available to increase staff and services; The need for staff training about disabilities and VR services in order to provide
better services; and Lack of confidentiality through limited office space and control of information by
other tribal programs.
65

B. Service Providers
Table 7.4 provides data as described by projects on the most common service providers for each vocational rehabilitation service. The numbers of projects included under each service varies because individual projects did not provide all of the services. For example, 53 of the projects reported providing vocational counseling and guidance (beyond normal case management) to at least “a few” consumers, and 37 projects reported providing native healing services. The study did not ask about the service providers for maintenance, transportation, and tools because these three services largely involve financial payments. AIVRS staff members were the most common service providers for 7 services and “other providers” (non-profit and for profit) for 11 services.
66

TABLE 7.4Most Common Provider of Each Service for Projects
Service
Percentage of Projects by the Most Common Service Provider
Staff Members
Tribal Agency
StateVR
Other Provider Total
Vocational counseling and guidance (beyond normal case management) (n = 53)
74 9 4 13 100
Vocational assessments (n = 53) 34 6 17 43 100Medical consultation and treatment (n = 53) 2 43 0 55 100Job placement services (n = 51) 78 8 0 14 100Psychological or psychiatric services (n = 51) 4 39 0 57 100Vocational or business training (n = 51) 20 20 0 61 100Substance abuse services (n = 50) 8 62 0 30 100Secondary/GED education (n = 50) 2 46 0 52 100Job finding training (n = 49) 74 14 0 12 100On-the-job training (n = 49) 22 49 0 29 100Post-secondary education (n = 48) 0 27 2 71 100Self employment services (n = 48) 75 8 2 15 100Personal and work adjustment training (n = 47) 49 21 0 30 100Post-employment services (n = 46) 91 4 0 4 100Services to families of consumers (n = 41) 61 27 0 12 100Rehabilitation technology services (n = 39) 13 8 10 69 100Native healing services (n = 37) 8 24 0 68 100Independent living services (n = 30) 27 10 13 50 100Supported employment services (n = 28)
29
18 4 50 100
Personal assistance services (n = 28)
21
14 7 57 100
Source: Project Description Summary Form
67

Table 7.5 presents data from the case record review on the type of provider of services to consumers whose cases were closed during the past two years. The number of cases in each row is based on the number of consumers receiving a service and for whom data were available on service provider. The AIVRS program staff was the most common provider of services to the consumers on 13 out of 20 services.
TABLE 7.5Type of Provider of Services for Consumers
Service
Percentage of Consumers by Type of Service Provider
Staff Members
Tribal Agency
StateVR
Other Provider Total
Vocational counseling and guidance (n = 417) 98 1 0 1 100Vocational assessment (n = 381) 75 2 11 13 100Medical consultation and treatment (n = 322) 9 37 0 53 100Job placement services (n = 104) 81 2 9 8 100Psychological or psychiatric services (n = 162) 8 22 19 51 100Vocational or business training (n = 121) 68 4 3 25 100Substance abuse services (n = 123) 4 68 0 28 100Secondary/GED education (n = 46) 16 33 0 51 100Job finding training (n = 83) 91 1 0 8 100On-the-job training (n = 122) 35 36 0 29 100Post-secondary education (n = 58) 33 14 0 53 100Self-employment services (n = 25) 97 0 0 4 100Adjustment training (n = 49) 78 15 0 6 100Post-employment services (n = 48) 85 3 6 6 100Services to families of consumers (n = 35) 85 2 1 12 100Rehabilitation technology services (n = 54) 66 5 0 29 100Native healing services (n = 30) 26 18 0 57 100Independent living services (n = 22) 86 3 2 10 100Supported employment services (n = 49) 89 3 1 8 100Personal assistance services (n = 88) 94 0 0 6 100Case Record Review Form-closed cases (weighted data)
68

In interviews, AIVRS project staff and representatives of service providers described the services used by the project and issues in service provision.
According to project staff, most of the tribal service providers were located within a 5-10 mile radius of the project and were accessible to consumers using personal or family transportation. Non-tribal service providers and State VR agencies were often located from 50 to 300 miles from the project. This distance required other transportation resources, including payment for consumer travel. Few projects were located in areas accessible to adequate public transportation. Consumers at a few projects relied on boats and airplanes for transportation to services due to the isolation of their local communities.
Almost all of the project staff indicated that non-tribal service providers were making an effort to provide culturally sensitive services to consumers. Many indicated that service providers’ efforts were successful to some extent, and that some service provider efforts were still in progress.
According to project staff and service providers, the most common and successful approaches used to increase the cultural sensitivity of services were informal contact and discussion, using native language interpreters, diversity training, and efforts to adapt assessment and evaluation techniques and resources. Other approaches included hiring agency staff who were bilingual, using a holistic approach that included attention to spirituality, making individual efforts to learn about the tribal culture (such as cooking native foods and paying attention to cultural holidays and family obligations), spending time on the reservation to get to know the culture, and serving on community and tribal advisory boards.
Project staff indicated that there were additional issues that needed to be addressed, however. The most common issues with other providers were slowness to respond to requests for information and to provide services for consumers, lack of information and sensitivity to cultural issues, a lack of commitment to consumers, services that were not accessible in terms of transportation and physical accessibility, and a lack of coordination that resulted in service provider staff being poorly prepared to service consumers.
C. Comparison with State VR Programs
Table 7.6 compares the percentage of AIVRS consumers receiving selected vocational rehabilitation services (according to the case record reviews) to the percentages receiving those services from State VR programs. AIVRS consumers were more likely to receive medical consultation and treatment, maintenance, vocational or business training, and on-the-job training than were State VR consumers. They were less likely to receive transportation support and job finding services. The finding concerning transportation may reflect a greater use by AIVRS projects of informal (i.e., undocumented) transportation services. Cases shared with the State VR agency (a subset of AIVRS consumers) were particularly likely to include vocational counseling and guidance, maintenance, transportation, and job placement services. Because shared cases involve two agencies and consumers with more severe disabilities (see Chapter 4), it is not surprising that they are more likely to include vocational counseling and guidance and other types of services.
69
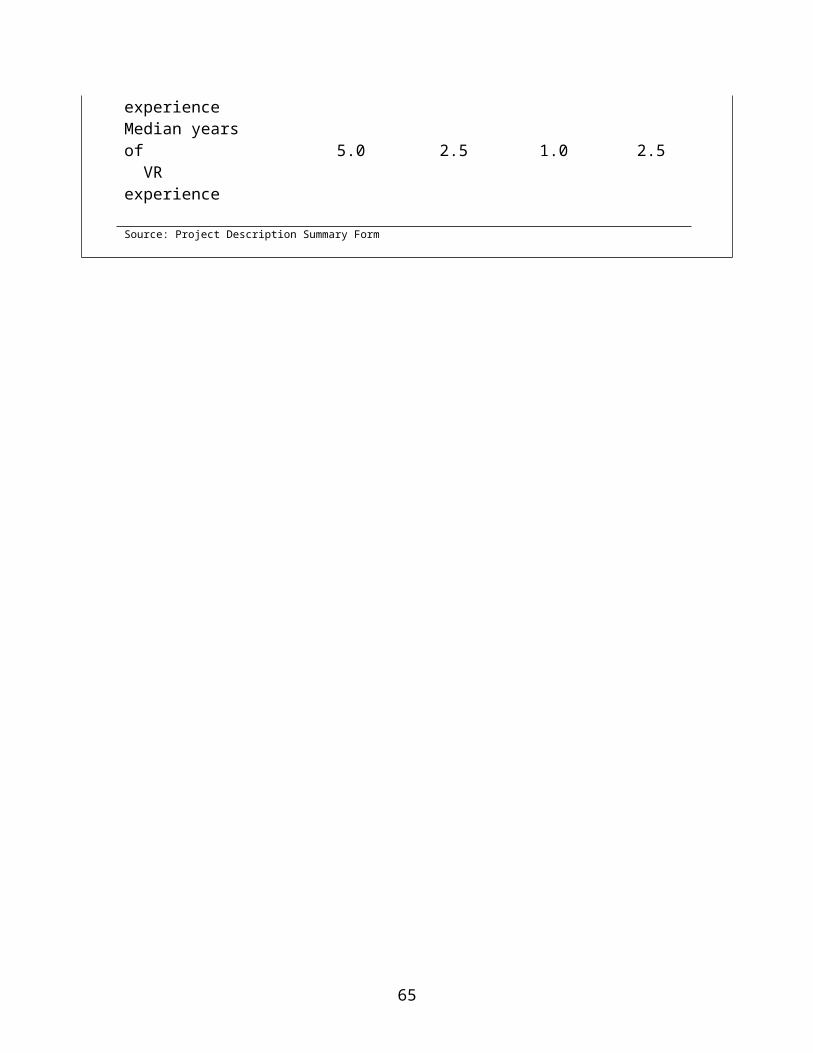
TABLE 7.6Percentage of Consumers Receiving Specific Services from AIVRS Projects and from State VR Programs
Service Categories of Consumer
AIVRS Consumers
(n = 826)
AIVRS Consumers Shared with
State VR(n = 78)
Native American State VR Consumers in
AIVRS States(n = 9,247)
All State VR Consumers in AIVRS States
(n = 408,045)Vocational counseling and guidance 55.3 75.2 67.7 59.5Medical consultation and treatment 39.5 40.9 14.6 14.4Maintenance 27.0 49.9 15.7 12.0Transportation 23.5 34.7 32.2 31.6Vocational or business training 21.4 26.3 9.8 9.8On-the-job training 14.6 13.3 6.3 4.4Job placement services 13.8 27.1 16.5 18.3Job finding services 12.6 16.5 24.3 23.7Adjustment training 9.6 3.0 13.5 14.6Secondary/GED education 8.5 4.9 11.6 13.1Post-secondary education 7.0 3.3 12.7 12.9
Sources: Case Record Review Form- closed cases (weighted data), 1998 and 1999 RSA-911 Case Service Report databases
70
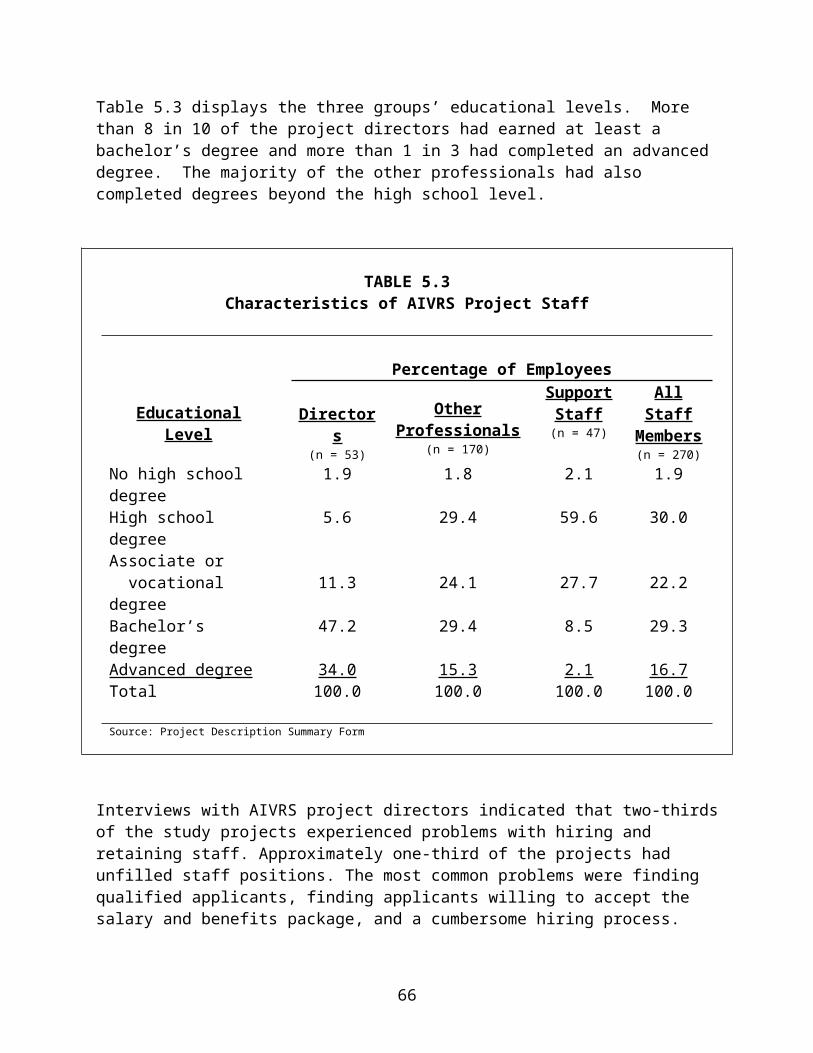
Summary of Chapter 7: VocationalRehabilitation Services
Services Provided to Consumers Case record reviews indicated that the services most often received
by AIVRS consumers were vocational counseling and guidance, vocational assessments, medical consultation and treatment, and substance abuse services. In addition, AIVRS projects indicated that they provided transportation services to many consumers.
A typical consumer received three different services. Service Providers The consumers most often received a majority of services from the
AIVRS staffs.Comparisons with State VR Programs AIVRS consumers were more likely than State VR consumers in
AIVRS States to receive medical consultation and treatment, maintenance, vocational and business training, and on-the-job training, and less likely to receive transportation and job finding services.
71

8. CONSUMER OUTCOMES
This chapter presents information on the outcomes of AIVRS projects. It presents the employment results for AIVRS projects, compares AIVRS outcomes with those of State VR programs, and describes factors associated with successful outcomes. This chapter addresses the third part of the first objective of the evaluation: Describe and analyze the characteristics, services received, and outcomes of Native Americans with disabilities.
A. Employment Outcomes
Figure 8.1 compares the number of AIVRS consumers who received AIVRS services under an IPE from October 1, 1999 to September 30, 2000 who achieved and did not achieve successful employment outcomes. The projects successfully closed more than 6 in 10 consumers (64.3 percent) served under an IPE. Given the challenging environments in which AIVRS projects work (see Chapter 3), this is a very good closure rate. Of the successful closures, 826 (81.1 percent) left the program with competitive, integrated employment.
72

Table 8.1 describes the numbers of consumers with successful employment outcomes per project during fiscal year 2000. Thirty-one of the 54 projects had more than 10 successful closures over this time period.
TABLE 8.1Number of Consumers With Successful Employment Outcomes per
Project
Number of Successful Outcomes Number of ProjectsLess than 5 95-10 1411-15 916-20 721-40 841 or more 7Total 54
Project Median = 12
25th percentile = 6 75th percentile = 25
Source: Project Description Summary Form
73

Table 8.2 presents project-level data on the proportion of successful closures to total closures among those served under an IPE during the period from October 1, 1999 to September 30, 2000. Thirty-four of the 54 AIVRS projects closed more than half of their cases successfully.
TABLE 8.2Proportion of Successful Closures per Project
Proportion of Success Number of ProjectsLess than .33 7.33-.44 8.45-.50 5.51-.66 9.67-.74 8.75-.84 7.85 or more 10Total 54
Project Median = .62
25th percentile = .44 75th percentile = .76
Source: Project Description Summary Form
Projects in less remote areas had a higher rate of successful closures. The median proportion of successful outcomes for projects in which the average resident lived less than 50 miles from the nearest urban area with a range of human service providers was .72, while the median for more remote projects was .47.
Tables 8.3-8.6 show outcome data from the Case Record Review Form. These data came from a random sample of closed cases in the two years preceding site visits at 29 AIVRS projects (which occurred in March-June 2001). It should be noted that these data come from a sample, include cases determined not eligible and not receiving services under an IPE, and cover a different time period than the data in Figure 8.1 and Tables 8.1-8.2, and thus are not directly comparable to those data.
Table 8.3 presents the closure outcomes of AIVRS cases that were closed in the previous two years. Unlike the data presented in Figure 8.1 and Table 8.2, these include cases closed due to the consumer being ineligible and cases closed before a consumer received services under an IPE. Approximately one-quarter of consumers who applied for AIVRS services left the program with a successful employment outcome.
74

TABLE 8.3Outcomes of Closed AIVRS Cases During the Last Two Years
(n = 825)
Closure Status Percentage of ConsumersReceived services under an IPE, employment outcome 24.8Received services under an IPE, no employment outcome 29.1Eligible, no services under an IPE 29.6Not eligible 16.5Total 100.0
Source: Case Record Review Form-closed cases (weighted data)
Table 8.4 lists the most common reasons other than ineligibility that cases closed unsuccessfully. These data include those consumers who received services and those that did not. Most cases were closed unsuccessfully because consumers did not cooperate, refused services, moved, or could not be found.
TABLE 8.4Reasons for Unsuccessfully Closed Cases
(n = 408)
Reason Percentage of ConsumersFailure to cooperate 46.2Moved/can’t locate 21.8Refused services 19.0Other 6.9Transferred to other agency 2.4Disability too severe 1.7Institutionalized 1.4Death 0.4Transportation not available 0.1Total 100.0
Source: Case Record Review Form-closed cases (weighted data)
75

In interviews, AIVRS project directors were asked if they had problems with consumer dropout. Most indicated that dropout was a problem, though a number volunteered that they thought the problem was no greater for their project than for other VR service providers.
When asked about the causes of consumer dropout, project directors most commonly mentioned:
Consumers with substance abuse issues who relapsed into abuse; Consumers who were unwilling to complete the work involved with IPE activities; Consumers who were concerned about losing Social Security or welfare benefits; Consumers who were fearful of entering the world of work; and Consumers who move from the area or become more disabled.
Projects have addressed these issues primarily through increased training for staff members and through improved case management procedures.
Table 8.5 lists the employment outcomes at closure for successfully closed cases in the previous two years. More than 8 in 10 rehabilitated consumers held competitive employment positions when their cases closed.
TABLE 8.5Employment Outcomes for Successfully Closed Cases
(n = 213)
Outcome Percentage of ConsumersCompetitive employment 82.1Self-employment 11.8Supported employment 4.3Homemaker 0.8Extended employment 0.6Unpaid family worker 0.4Subsistence activities 0.0Total 100.0
Source: Case Record Review Form-closed cases (weighted data)
76

Table 8.6 shows the number of hours worked in the week before closure for individuals with successful employment outcomes and working in competitive, supported, extended, or self-employment. More than four-fifths were working 40 or more hours per week.
TABLE 8.6Hours Worked in Week Before Closure
For Those with Successful Outcomes (n = 156)
Hours Percentage of ConsumersLess than 30 12.730-39 4.740 or more 82.5Total 100.0
Median = 40 hours
25th percentile = 40 75th percentile = 40Source: Case Record Review Form-closed cases (weighted data)
Table 8.7 shows the weekly earnings in the week before closure for individuals with successful employment outcomes and working in competitive, supported, extended, or self-employment. Approximately two-thirds were earning $250 or more per week.
TABLE 8.7Earnings During the Week Before Closure
For Those with Successful Outcomes (n = 138)
Earnings Percentage of ConsumersLess than $250 34.3$250-399 37.0$400 or more 28.7Total 100.0
Median = $320
25th percentile = $220 75th percentile = $400Source: Case Record Review Form-closed cases (weighted data)
77

Table 8.8 shows the number of weeks in the current work situation prior to closure for individuals with successful employment outcomes and working in competitive, supported, extended, or self-employment. Many were closed after 12 weeks based on State VR practices in their relevant States.
TABLE 8.8Weeks in Work Situation Before Closure
For Those with Successful Outcomes (n = 167)
Weeks Percentage of ConsumersLess than 12 7.412 48.5More than 12 44.2Total 100.0
Median = 12 weeks
25th percentile = 12 75th percentile = 20Source: Case Record Review Form-closed cases (weighted data)
Consumers with successful closures in projects established prior to 1997 worked more hours in the week before closure than their counterparts in the newer projects (means = 37.8 hours (n=132) vs. 32.1 hours (n=24), p < .05). In established projects, 83.9 percent worked 40 or more hours, while in newer projects, 63.7 percent did so. They also earned more per week than their peers in newer projects (means = $330.82 (n=121) vs. $238.11 (n=17), p < .05). In established projects, 30.1 percent of successful consumers earned $400 or more per week, in comparison to 4.4 percent in new projects. Successfully closed consumers in areas with less than 30 percent unemployment earned more per week than consumers in areas with 30 percent unemployment or more (means = $341.21 (n=49) vs. $300.36 (n=89), p < .05). In lower unemployment areas, 32.4 percent of successfully closed consumers earned $400 or more per week, while in higher unemployment areas, only 23.2 percent did so.
78

B. Comparison with State VR Programs
Table 8.9 compares outcomes of AIVRS consumers (using weighted data) with outcomes for consumers in State VR programs. The percentage of successfully closed AIVRS consumers was very similar to the percentage of successfully closed Native Americans in the State VR programs in AIVRS States, but somewhat less than for all consumers in those States. Cases shared with State VR programs (a subset of AIVRS cases) were more likely to receive services but be closed unsuccessfully. This may be because shared cases were more likely to have severe disabilities (see Chapter 4).
The reasons for unsuccessful closures varied between AIVRS projects and the State programs. For instance, the percentage of cases closed unsuccessfully because the consumer did not cooperate (46.2 percent) was higher for the AIVRS projects compared to consumers in the State VR programs in AIVRS States (13.0 percent) and Native American consumers in the State VR programs in AIVRS States (18.4 percent). In contrast, the percentages of cases closed unsuccessfully because the consumer either refused services or moved/can’t locate were higher for the two State comparison groups (62.9 percent and 60.6 percent) than for the AIVRS consumers (40.8 percent).
Table 8.10 presents AIVRS and State program data on the median number of months between consumers’ application and closure dates. (Cases are missing from the table if case records did not show an application or closure date.) AIVRS consumers spent less time in the program than did their State program counterparts, with the exception of those who were determined to be not eligible. AIVRS consumers who were shared with the State program spent more time in the AIVRS program than did other AIVRS consumers.
79

TABLE 8.9Program Outcomes of the AIVRS Program and the
State Vocational Rehabilitation Program
Outcomes
Percentage of Consumers
AIVRS Consumers
(n = 825)
AIVRS Consumers Shared with
State VR(n = 78)
Native American State VR Consumersin AIVRS States
(n = 9,247)
All State VR Consumers in AIVRS States
(n = 408,045)
Received services under an IPE, employment outcome
24.8 25.7 25.3 35.2
Received services under an IPE, no employment outcome
29.1 46.2 22.7 23.7
Eligible, no services under an IPE 29.6 24.6 27.2 22.2Not eligible 16.5 3.5 24.8 19.0Total 100.0 100.0 100.0 100.0Sources: Case Record Review Form- closed cases (weighted data), 1998 and 1999 RSA-911 Case Service Report databases
80

TABLE 8.10Median Number of Months between the Application and Closure Dates for Consumers in the
AIVRS Program and the State Vocational Rehabilitation Program
Closure Type
Categories of Consumer
AIVRS Consumers
(n = 737)
AIVRS Consumers Shared with
State VR(n = 57)
Native American State VR Consumersin AIVRS States
(n = 9,247)
All State VR Consumers in AIVRS States
(n = 408,044)
Received services under an IPE, employment outcome
12.65 17.38 17.26 16.89
Received services under an IPE, no employment outcome
8.97 14.92 19.19 21.72
Eligible, no services under an IPE 4.76 7.10 9.30 9.49Not eligible 2.36 --* 2.30 2.60Total 6.71 14.92 10.22 12.45Sources: Case Record Review Form- closed cases (weighted data), 1998 and 1999 RSA-911 Case Service Report databases*No shared cases were recorded as ineligible for services.
81

C. Variables Related to Successful Outcomes
We conducted statistical analyses at the project level to identify variables relating to two measures of success: (1) proportion of success (the number of successful closures divided by the sum of the number of successful closures and the number of unsuccessful closures who received services under an IPE, including only those projects with at least 10 cases served under an IPE); and (2) the number of successful closures. The following variables were analyzed:
The number of years the project had received federal funding; The unemployment rate in the reservation or service area; The distance of the average resident from the nearest human service providers; The AIVRS professional staff’s average years of VR experience; The AIVRS professional staff’s average educational level; and The ratio of staff to consumers.
There was one statistically significant relationship for each measure. The analyses indicated a positive relationship between the AIVRS professional staff’s average years of VR experience and the proportion of successful closures (r = .355, p < .05, n = 46). For AIVRS projects whose professional staff had an average of less than four years of VR experience, the median proportion of success was .47 (n = 24). The median proportion of success for those AIVRS projects whose professional staff had an average of at least four years of VR experience was .68 (n = 22).
The analyses also showed a positive relationship between the number of years that the projects had received federal funding and the number of successful closures (r = .345, p < .05, n = 54). For AIVRS projects established before 1997, the median number of successful closures was 17 (n = 31). The median number of successful closures for those AIVRS projects established in 1997 and later was 7 (n = 23).
We also conducted a series of analyses on the case record review data to examine which factors were related to successful outcomes for consumers. The consumers were placed into two groups: (1) those with successful closures; and (2) those with any type of unsuccessful closure. The following tables present these tests’ weighted results. The tests of significance were conducted on the unweighted data.
82

Table 8.11 shows selected background characteristics of consumers whose cases closed successfully and unsuccessfully in the two years preceding the site visits. Unsuccessful outcomes included those determined to be not eligible and those closed prior to development of an IPE. Successful consumers were more likely to be older and to have possessed more education and work experience. For example, 42.3 percent of successful consumers had continued their education beyond high school compared to 19.6 percent of unsuccessful consumers. Also, 90.2 percent of successful consumers had work experience in the two years prior to application compared to 64.5 of unsuccessful consumers.
TABLE 8.11Background Characteristics of Consumers with
Successful and Unsuccessful Outcomes
Characteristic*
OutcomesSuccessful
(n = 234)Unsuccessful
(n = 591)Total
(n = 825)
Mean age at time of application 39.0 34.9 35.9Percentage with education after high school 42.3 19.6 25.3Percentage who ever worked 98.3 90.7 92.7Percentage who worked in the two years prior to application 90.2 64.5 71.9
Source: Case Record Review Form-closed cases (weighted data)*All of the differences shown were significant at the P < .05 level.
83

Table 8.12 provides the percentage of closed cases receiving specific services who had successful employment outcomes. Thus, for example, 79.6 percent (weighted) of the 52 persons who received post-employment services had successful employment outcomes. The successful closure rates for persons receiving 19 out of the 23 service types were significantly higher (by statistical test) than the overall successful closure rate (24.8 percent). This is true because: (1) not all consumers received any services; (2) many consumers received more than one service; and (3) persons with successful closures received more services. Persons with successful closures received a median of six services (n=234), while those with unsuccessful closures received a median of two services (n=591)
TABLE 8.12Percentage of Cases with Successful Outcomes by Type of Service
Type of Service
Percentage of Cases with Successful
OutcomesPost-employment services* (n=52) 79.6Self employment services* (n=29) 70.3Supported employment services* (n=55) 67.8Independent living services* (n=23) 67.3Job placement services* (n=109) 64.1Job finding services* (n=86) 61.8Rehabilitation technology services* (n=56) 61.1Post-secondary education* (n=63) 60.8Tools* (n=200) 58.4On-the-job training* (n=130) 57.4Adjustment training* (n=50) 53.9Vocational or business training* (n=125) 53.8Transportation* (n=210) 53.2Personal assistance services* (n=91) 51.0Maintenance* (n=210) 50.8Services to families with consumers (n=35) 46.5Vocational counseling and guidance* (n=439) 39.5Medical consultation and treatment* (n=328) 38.0Psychological or psychiatric services (n=167) 33.9Substance abuse services* (n=123) 32.7Vocational assessment* (n=385) 31.6Secondary/GED training (n=46) 31.2Native healing services (n=32) 24.3
Source: Case Record Review Form-closed cases (weighted data)*Difference from overall rate of successful closures statistically significant at the p < .05 level.
84

Table 8.13 presents the percentage of closed cases (weighted) with specific disabling conditions who achieved successful employment outcomes. For example, of the 67 persons in the case record review with diabetes, 28.0 percent had successful employment outcomes. The successful closure rates for those consumers with hearing impairments and mental retardation were the only two that were significantly higher (by statistical test) than the overall closure rate (24.8 percent). The type of disabling condition was thus not a major factor in the rate of successful outcomes among AIVRS consumers.
TABLE 8.13Percentage of Cases with Successful Outcomes by Disabling Condition
Disabling ConditionPercentage of Cases with
Successful OutcomesFibromyalgia (n=8) 44.7Traumatic brain injury (n=12) 40.4Hearing impairment* (n=64) 39.0Mental retardation* (n=30) 35.3Spinal cord injury (n=18) 34.9Other medical condition (n=191) 30.8Diabetes (n=67) 28.0Other orthopedic impairment (n=161) 25.9Visual impairment (n=40) 25.1Amputation or absence of limb (n=14) 22.4Substance abuse (n=249) 22.0Learning disability (n=109) 19.2Mental or emotional condition (n=101) 18.5Fetal alcohol syndrome (n=3) 0.0
Source: Case Record Review Form-closed cases (weighted data)*Difference from overall rate of successful closures statistically significant at the p < .05 level.
85

Summary of Chapter 8: Consumer Outcomes
Employment Outcomes Data from the Project Description Summary Form indicate that 64
percent of AIVRS consumers who received services under an IPE had successful employment outcomes.
Of all closed cases whose records were reviewed (including those not eligible and who did not receive any services under an IPE), 25 percent had successful employment outcomes. This is comparable to the rate for Native Americans served by State VR agencies.
Predictors of Successful Outcomes At the project level, the professional staffs’ years of vocational
rehabilitation experience related to the proportion of successful outcomes. The number of years that projects had received federal funding related to the number of successful outcomes.
The consumers with successful outcomes were generally older, had more education, possessed more work experience, and were more likely to be previously served by AIVRS than the consumers with unsuccessful outcomes.
The type of disability was not a major factor in determining whether cases closed successfully.
86

9. PROGRAM COSTS
This chapter presents data on the amount and allocation of the AIVRS program’s expenses and the costs of purchased services for its closed cases. Data on overall program expenditures were collected on the Project Description Summary Form, and data on consumer service costs were collected from consumer case files. The chapter addresses the fifth study objective: Identify the cost-effectiveness of established AIVRS projects
A. Costs of Services
During the October 1, 1999 to September 30, 2000 period (fiscal year 2000), the AIVRS projects reported spending $18,282,167.29. Table 9.1 lists the total expenditures during fiscal year 2000 by the 54 AIVRS projects included in the evaluation. The majority of the projects spent between $250,000 and $449,999.
TABLE 9.1Total Expenses of AIVRS Projects
Expenses Number of ProjectsLess than $250,000 13$250,000-$299,999 13$300,000-$349,999 9$350,000-$399,999 4$400,000-$449,999 5$450,000 or more 10Total 54
Median = $308,93525th percentile = $251,210 75th percentile = 424,775
Source: Project Description Summary Form
87

The mean amount of project expenditures from October 1, 1999 through September 30, 2000 was $338,558.65. Figure 9.1 presents the mean expenditures as reported on the Project Description Summary Form for staff salaries, purchased services, and other costs (e.g., utilities, supplies, etc.). Staff salaries represented approximately 45 percent of the total expenses.
88
Table 9.2 presents data from case records on expenses for different case closure statuses. These expenses include purchased services, devices, and cash assistance, but they do not include staff labor or other costs. The expenses were highest for the consumers who received services under an IPE who achieved a successful employment outcome.
TABLE 9.2Means and Medians of Case Service Expenses for Closed Cases
StatusMeasures for Cases
Mean MedianReceived services under an IPE, employment outcome (n = 230) $3,028.49 $1,921.15
25th percentile = $605.0075th percentile = $3,994.83
Received services under an IPE, no employment outcome (n = 245) $1,315.96 $402.63
25th percentile = $30.0075th percentile = $1,676.91
Eligible, no services under an IPE (n = 217) $19.15
$0
25th percentile = $075th percentile = $0
Not eligible (n = 107) $34.16 $025th percentile = $075th percentile = $0
Source: Case Record Review Forms- closed cases (weighted data)
The expenses for the consumers with successful employment outcomes were higher in projects in which the average consumer lived 50 or more miles from the nearest urban area than for other projects (remote areas, mean = $4,071.41 (n = 126), less remote areas, mean = $2,442.07 (n = 104), p < .05). The expenses for consumers with successful employment outcomes were also higher in the projects established prior to 1997 than for newer projects (older projects, mean = $3,187.94 (n = 191), newer projects, mean = $1,430.27 (n = 39), p < .05).
89
B. Cost Effectiveness
We used two measures to define cost-effectiveness. The first measure divided each project’s total expenditures by its total number of consumers served during fiscal year 2000. The second measure divided each project’s total expenditures by its total number of successfully closed cases during fiscal year 2000. Table 9.3 presents the medians of these measures for new (established 1997 or later) and established (1996 or before) AIVRS projects. The established projects tended to be more cost-effective on both measures, though the differences just failed to reach levels of statistical significance. These data suggest that the AIVRS projects improve their cost-effectiveness as they become more established.
TABLE 9.3Cost-Effectiveness Measures
MeasureAIVRS Projects
New Projects Established ProjectsMedian expenditure per consumer $5,766
25th percentile = $2,66675th percentile = $6,411
n = 23
$3,56825th percentile = $2,45075th percentile = $5,434
n = 31Median expenditure per successful closure
$33,659*25th percentile = $16,70275th percentile = $56,868
n = 21
$20,54225th percentile = $10,39975th percentile = $38,449
n = 31
Source: Project Description Summary Form*Two of the new projects did not have any successfully closed cases during fiscal year 2000. Therefore, it was not possible to calculate this cost-effectiveness measure for these two projects.
A number of other factors were examined to determine if they might be related to cost-effectiveness, including distance from urban areas, unemployment rate in the service area, and the percentage of services are being provided by the tribe. None of these variables were found to be significantly related to project cost-effectiveness, though there was a trend for projects in which the tribe(s) provided more of the VR services to have somewhat lower costs.
90

C. Comparison with State VR Programs
The State VR agencies also provide data on case expenses on the RSA-911 report. These expenses include purchased services, devices, and cash assistance. They do not include staff labor, which are reported separately on the RSA 2 report. Table 9.4 compares the means of the AIVRS closed cases’ expenses to those of the State VR agencies in AIVRS states. On average, both the AIVRS projects and the State VR agencies spent more for case expenses on successfully closed cases than on other cases. The AIVRS program spent slightly less on successfully closed cases than did State VR agencies. Costs were highest for successfully closed cases shared by AIVRS projects and State VR agencies.
91

TABLE 9.4Cost of Services of Closed Cases: Comparison of Means
Status Categories of Consumer
AIVRS Consumers
(n = 799)
AIVRS Consumers Shared with
State VR(n = 77)
Native American State VR Consumers
in AIVRS States(n = 9,247)
All State VR Consumers in AIVRS States
(n = 408,045)Received services under an IPE, employment outcome
$3,028.49 $4,322.26 $3,281.45 $3,165.81
Received services under an IPE, no employment outcome $1,315.96 $792.62 $1,935.70 $2,301.26Eligible, no services under an IPE $19.15 $51.53 $221.21 $233.76Not eligible $34.16 $200.00 $84.86 $115.85
Sources: Case Record Review Form- closed cases (weighted data), 1998 and 1999 RSA-911 Case Service Report databases
92

Summary of Chapter 9: Program Costs
Costs of Services AIVRS projects spent approximately 45 percent of their budgets
on staff salaries, 28 percent on purchased services and other consumer costs, and 27 percent on other costs.
Cost-Effectiveness More established AIVRS projects were more cost-effective than
the newer projects.Comparisons with State VR Programs AIVRS projects spent slightly less in direct costs on successfully
closed cases than did State VR agencies in AIVRS States.
93

10. ASSESSMENTS OF THE PROGRAM
Many of the persons who were interviewed for the evaluation were asked to provide judgments about strengths and weaknesses of AIVRS projects and about the design and implementation of the AIVRS program as a whole. This chapter summarizes their responses to these questions. The chapter addresses the first half of the seventh objective of the evaluation: Identify best practices and make recommendations for program improvement.
A. Innovative and Effective Practices
In interviews, project directors were asked to describe elements of their projects that they thought were innovative or effective. In general, they hesitated to label what they did as “innovative,” but they were willing to describe what they thought were effective practices.
There were a number of practices that were mentioned by significant numbers of project directors, and which thus could be considered as key components of an effective AIVRS project:
Cultural sensitivity to program consumers (e.g., through native language use, knowledge of religious and family obligations, applying cultural norms concerning speech and behavior, etc.);
Consumer involvement in planning services; A consumer-centered (non-bureaucratic) approach; Teamwork among staff; Effective coordination with other service providers and with the State VR program; Cost-sharing and the identification of non-project resources; and Extensive staff training.
Project directors also mentioned more specific aspects of services that they thought were effective (those marked with an asterisk (*) are described in more detail in Appendix B):
Project Outreach and Publicity
1. Outreach through media and special events, counselors and technicians required to conduct PR activities as part of job responsibilities (The Navajo Nation, Window Rock, AZ)
2. Using the project van for publicity (Fort Mohave Indian Tribe, Needles, CA)3. Outreach through video and employee of the month (consumers) and employer of the
year awards (Pueblo of Laguna, New Laguna, NM)4. Staff serve on off-reservation committees to learn about surrounding community (Seneca
Nation of Indians, Irving, NY)5. Outreach through radio and community events (Apache Tribe of Oklahoma, Anadarko,
OK)
94

Project Management and Administration
1. Long term planning (Tlinget & Haida Tribes, Juneau, AL)2. Use of teleconferencing (Hoopa Valley Tribe, Hoopa, CA)3. Development of policies, procedures, job descriptions, and bylaws (Fort Peck
Assiniboine & Sioux Tribes, Poplar, MT) (The Navajo Nation, Window Rock, AZ)4. Computerized management information system (Pueblo of Jemez, Jemez Pueblo, NM)*
(The Navajo Nation, Window Rock, AZ)5. Use of the Internet for VR information (Turtle Mountain Band of Chippewa Indians,
Belcourt, ND)6. Use of job placement counselors and social worker (Choctaw Nation of Oklahoma, Hugo,
OK)
Service Coordination
1. Coordination with labor, health and social service agencies in three States (The Navajo Nation, Window Rock, AZ)
2. Coordination with Projects With Industry (PWI) project (Choctaw Nation of Oklahoma, Hugo, OK)
3. Intertribal structure reduces duplication and overhead, improves collaboration (South Puget Intertribal Planning Agency, Shelton, WA)
4. Intertribal project provides services to 10 tribes (Great Lakes Intertribal Council, Lac du Flambeau, WI)
5. Access to health data facilitates services (Lac Courte Oreilles Indian Tribe, Hayward, WI)
Consumer Access
1. Staff travel to remote villages to serve consumers (Association of Village Council Presidents, Bethel, AK)
2. Full range of services on site, including State VR and Social Security Administration (Seneca Nation of Indians, Irving, NY)*
3. Use of 12 field offices to bring services closer to clients (Choctaw Nation of Oklahoma, Hugo, OK)
Job Readiness
1. Job readiness skills included in all IPEs (The Navajo Nation, Window Rock, AZ)2. Career readiness training provided to all consumers (Seneca Nation of Indians, Irving,
NY)*3. Consumer training on work ethics and financial management (Apache Tribe of
Oklahoma, Anadarko, OK)4. Training in resume preparation, job readiness skills, interview skills, self-esteem
(Delaware Tribe of Western Oklahoma, Oklahoma City, OK)
95

Service Components
1. Job placement (Red Lake Band of Chippewa Indians, Red Lake, MN)2. Involvement in school-to-work transition (Mississippi Band of Choctaw Indians,
Philadelphia, MS)3. Use of native healing services (Fort Belnap Tribes, Harlem, MT) (The Navajo Nation,
Window Rock, AZ)4. Consumers do volunteer work to give back to the community (Pueblo of Laguna, New
Laguna, NM)4. Services designed for ADD, ADHD, and addiction consumers (Turtle Mountain Band of
Chippewa Indians, Belcourt, ND)5. Use of native healing and transportation services (Spirit Lake Nation, Fort Totten, ND)6. Video orientation to VR process (Apache Tribe of Oklahoma, Anadarko, OK)7. Computer lab for training (Delaware Tribe of Western Oklahoma, Oklahoma City, OK)8. Job skills training, alcohol treatment with native healer, and health information sessions
(Lower Brule Sioux Tribe, Lower Brule, SD)
Specific Training Programs
1. Training in subsistence activities (Association of Village Council Presidents, Bethel, AK)2. Carpentry training program (Shoshone-Bannock Tribes, Fort Hall, ID)3. Apprenticeship program (Hannahville Indian Community, Wilson, MI)4. Consumer business incubator program (Pueblo of Jemez, Jemez Pueblo, NM)*
Job Development
1. Job development/ business development (The Navajo Nation, Window Rock, AZ)2. Project business (laundromat) operated by consumers (Fort Peck Assiniboine & Sioux
Tribes, Poplar, MT)3. Two new tribal enterprises (grocery store, public transportation program) have VR
consumers as employees (Pueblo of Zuni, Zuni, NM)4. Tribal detailing business created VR job opportunities (Choctaw Nation of Oklahoma,
Hugo, OK)
The fact that certain project directors mentioned these specific project elements as effective does not imply that they are not being used by other projects as well. Specific projects are named only so that those interested in particular practices can contact projects to gain more information about the approaches that are being used.
B. Project Improvement
Tribal representatives, State VR personnel, service providers, and advisory group members were asked to provide suggestions for improving services by the AIVRS projects. A number of common themes resulted from this question.
96

The first major theme related to staffing. The most common suggestion was that projects needed additional staff to meet service needs. Concern for staffing stability was also noted quite often. There were a few comments that AIVRS staff needed to receive more ongoing training and professional education.
A second important theme related to facilities. Respondents indicated that staff members need more adequate and confidential office space to meet with their consumers
A third common theme was that the programs needed additional funding. Some of the specific funding needs mentioned were transportation for the consumers, expanded services, higher pay and benefits for the staff, and better facilities. Tribal representatives commonly mentioned the need for more funding for outreach and higher visibility within the community.
A common theme from the State VR representatives was the need for closer collaboration, communication, and joint training. State representatives acknowledged that this is a need for both State VR agencies and AIVRS projects to work harder on communication, collaboration, and shared training.
Representatives of other service providers and State VR staff were asked for suggestions for improving collaboration. The majority of comments indicated that this process is working well. Some service providers did however indicate that additional staff meetings on mutual consumers and issues would be helpful. Also, some of the state VR partners indicated that they would like to develop a more formal referral process.
C. Program Improvement
AIVRS project directors were asked two questions about how the AIVRS program could be improved: (1) how the design of the program could be improved to improve services by projects; and (2) how the administration of the program by RSA could be improved to increase effectiveness.
In terms of program design, the most common recommendation was for some form of formula or non-competitive funding. Other common recommendations were to increase the total resources for the program, to integrate independent living services into projects, to lengthen the grant period, to create better coordination mechanisms with State VR agencies, and to define a clearer monitoring and reporting system.
In terms of RSA administration, the most common recommendation was to increase the number of on-site visits to projects. Other common recommendations were to increase the amount of training and technical assistance provided to projects, to provide better orientations for new projects, and to provide projects with up-to-date information about rules and regulations, programs, and models.
When RSA staff members were asked about AIVRS program improvement, the two common themes were the need for more staff to monitor the projects and the need for travel funds to visit
97
projects. Project directors and RSA staff thus agreed on the need for more RSA staff support for the AIVRS program.
Summary of Chapter 10: Assessmentsof the Program
Effective Practices Common effective features of AIVRS projects were cultural
sensitivity to consumers, consumer involvement in planning services, a consumer-centered approach, teamwork among staff, effective coordination with other agencies, cost-sharing, and extensive staff training.
Project directors reported a number of other effective practices in the areas of outreach, management and administration, service coordination, consumer access, job readiness, service components, specific training programs, and job development.
Project and Program Improvement The major areas identified for project improvement by persons
other than project staff were staffing, facilities, additional funding, and interagency coordination.
The most common recommendations by project directors for improving the overall AIVRS program were to have continued non-competitive funding for established projects and to increase the number of visits to projects by RSA staff.
98
11. CONCLUSIONS AND RECOMMENDATIONS
This chapter presents Development Associates’ conclusions and recommendations concerning the AIVRS program. These conclusions and recommendations are based both on the results of the evaluation and on our experience with vocational rehabilitation programs and other programs for Native Americans. These conclusions and recommendations are our own and do not necessarily represent the opinions of RSA and/or AIVRS project personnel. This chapter addresses the second part of the seventh evaluation objective: Identify best practices and make recommendations for program improvement.
A. Conclusions
1. There is a very significant need for vocational rehabilitation (VR) services for Native Americans on or near Indian reservations. Disability rates are higher than average among Native Americans, and rates are reported to be particularly high for those on or near reservations.
2. Tribal governments offer a unique resource for providing VR services to Native Americans on or near Indian reservations. For a variety of reasons including remoteness of reservations, poor State-tribal relationships, and cultural differences, State VR agencies have faced serious challenges in serving Native Americans living on or near reservations. Many of those challenges are addressed by having tribal governments provide VR services. Tribal governments are close to and knowledgeable about the needs of Native American VR consumers, and thus have advantages in providing services.
3. AIVRS projects face considerable challenges in providing VR services due to geographic, economic, and cultural factors. AIVRS projects are operating in environments that are extremely challenging. In most cases, they are in rural areas where there are limited resources for service provision and limited numbers of job opportunities. Their service areas have very high unemployment rates, even compared to the surrounding rural areas. They are serving consumers who have disabilities that are difficult to ameliorate (e.g., substance abuse), who have cultural barriers to employment off of the reservation, and who face discrimination in employment.
4. New AIVRS projects face particular challenges due to the lack of guidance and systems for implementing their programs. New AIVRS projects have developed their programs with very limited regulatory guidance and limited technical assistance from RSA. They have needed to decide to what extent to adopt or adapt the policies and systems of their relevant State VR agency(s), and have reported that they often felt that they were “reinventing the wheel.” These challenges have been only partially addressed by recent RSA efforts (e.g., technical assistance visits to new projects, mentoring system for new project directors).
99

5. Many AIVRS projects face challenges in recruiting and retaining qualified staff members and in developing appropriate relationships with their tribal governments. The combinations of skills required for project director and counselor positions in AIVRS projects (VR knowledge, cultural knowledge, management skills, and personal/ counseling skills) are extremely difficult to find in Native American communities, and persons with those skills have a range of job opportunities. Projects thus must recruit persons who can be trained for the positions, and provide the training needed.
Some projects also have difficulty in maintaining the autonomy needed to implement VR requirements, because tribal officials desire to have management control. Projects sometimes have difficulty in applying VR eligibility standards, maintaining the confidentiality of consumers, and efficiently controlling project resources to meet the needs of consumers. They must sometimes rely on RSA to insist that project staff rather than tribal officials make management decisions.
6. AIVRS projects are generally applying established VR principles and methods to providing services. Despite the fact that many of the projects are new to VR, projects appear to be providing services that are comparable to services provided by State VR agencies. They are applying VR eligibility criteria, developing IPEs, involving consumers in decision-making, and providing a range of rehabilitation services. AIVRS projects have fewer record-keeping requirements than State VR programs, and appear to provide more personalized services. These differences would appear to make sense given the nature of the program environments and consumer populations.
7. The quality and completeness of case records is satisfactory at a majority of AIVRS projects, but there are record-keeping weaknesses at a number of projects. There was wide variability both in the quality of record-keeping systems and in the implementation of those systems. Projects that worked closely with the State VR programs appeared to be more likely to have effective record-keeping systems.
8. The functioning of AIVRS project advisory groups could be strengthened. AIVRS projects are not required to have advisory groups, and less than half of the projects had active advisory groups. Where groups were active, project directors and advisory group members reported some confusion about the groups’ roles, and reported problems with attendance. Native Americans have experience participating in tribal government structures, but not in advisory groups. AIVRS project directors also have limited experience in working with and guiding advisory groups.
9. AIVRS projects are generating appropriate levels of successful employment outcomes at reasonable costs. Given the challenging environments in which they work (see #3 above), the rates of successful closures by AIVRS projects should be considered as very good. They are comparable to rates for Native Americans served by State VR agencies, who often live in areas with more positive economic environments. The costs per consumer are also reasonable, especially for more established projects, and the costs for contracted services are similar to those of State VR agencies.
100

10. AIVRS projects in geographically remote areas face the most challenges. Projects in remote locations were working in service areas with higher unemployment rates, had fewer resources for services, took longer to provide services, and had lower rates of successful closures. They needed to be particularly creative in providing VR services to meet the needs of their consumers.
B. Recommendations
1. Consideration should be given to developing orientation materials and training for new AIVRS projects, including materials for tribal officials. Many new projects have slow start-ups, at least partially because of the time needed to learn about VR. RSA could facilitate project start-ups by developing a manual for new projects (including regulations and requirements, samples of record-keeping forms and policies and procedures manuals, and suggestions for monitoring and evaluation systems), developing orientation materials for tribal officials (explaining key VR concepts and the need for project autonomy), and holding an orientation session for new projects. The training and orientation materials could be developed by RSA’s current technical assistance providers, and the orientation sessions could be directed by RSA staff.
2. RSA should develop training guidelines for AIVRS counselors with limited backgrounds in VR. Many of the persons serving in counselor positions in AIVRS projects have limited backgrounds in VR. Projects provide a great deal of training to address the needs of these counselors, but the content and design of that training varies widely. RSA could assist AIVRS projects by developing guidelines for the types of training counselors should receive. Such guidelines could include the content areas of training, the amount of recommended training in specific content areas, and an order of priority for those content areas. RSA could also distribute to AIVRS projects a list of sources from which in-person and distance education training could be received. A draft outline for these guidelines is presented in Appendix C.
3. RSA should develop monitoring and evaluation guidelines for AIVRS projects to strengthen internal project assessment and reporting to RSA. Most of the AIVRS projects have defined measurable objectives for assessing their efforts, but with no specific guidance from RSA on what those objectives should be and how they should be measured. It would therefore be useful to projects if RSA would provide guidelines for monitoring and evaluating their efforts. Such guidelines could define the types of objectives that might be measured (relating to both process and outcomes), methods, procedures, and schedules for measuring progress, and possible roles for project staff and others in implementing monitoring and evaluation activities. A draft version of these guidelines is presented in Appendix D.
4. RSA should develop an initiative to increase communication and cooperation between State VR agencies and AIVRS projects. Many AIVRS projects work closely and well with their relevant State VR agency(s), but others do not. RSA cannot generate effective communication and cooperation between State VR agencies and AIVRS projects by mandate or regulation. It can, however, facilitate such communication and
101
cooperation by encouraging contacts, by providing information about the AIVRS program to State agencies, and by disseminating effective models of collaboration to State agencies and AIVRS projects. The initiative could be led by RSA staff with participation by the Consortia of Administrators for Native American Rehabilitation (CANAR) and the Council of State Administrators of Vocational Rehabilitation (CSAVR).
5. RSA should provide training to AIVRS project directors on the development and effective use of advisory groups. Advisory groups can be a useful mechanism for getting input and reactions from community members and service providers on project services. Advisory group training could address such topics as the composition of effective groups, useful roles for advisory groups, how to train advisory group members, and how to motivate effective participation. Such training could be offered by RSA’s current technical assistance providers.
6. RSA should identify and publicize models for improving transportation systems and developing small businesses that can serve and employ AIVRS consumers. Many of the AIVRS projects are in areas that lack transportation infrastructure and small business opportunities. RSA’s technical assistance providers could identify and publicize creative approaches that have been used to address these issues. Once models have been identified, the providers could offer technical assistance to implement those models.
7. RSA should increase on-site monitoring and technical assistance by RSA staff to AIVRS projects. Both AIVRS project directors and RSA staff members indicated that there was a need for more on-site visits to AIVRS projects by RSA staff. Such visits provide useful monitoring information for RSA, encourage self-evaluation by projects, and increase the visibility of the projects among tribal officials and the community. Development Associates believes that on-site visits would be very useful in the second year for new projects and every three years after that.
102

REFERENCES
Arnold, N. and Seekins T.. 1998. “Rural and Urban Vocational Rehabilitation: Counselors Perceived Strengths and Problems”. Journal of Rehabilitation V64, N1.
Davis, A., & Glenn, M. 1997. “Rehabilitation Consumer Satisfaction Assessment: Collaboration Between a State Vocational Rehabilitation Agency and a Pre-service Training Program.” Paper presented at the Montana Vocational Rehabilitation conference.
Faubion, C., Roessler, T. et. al. 1998. “Meeting the Needs of Underserved Populations: Vocational Rehabilitation and the Cherokee National 130 Project”. Rehabilitation Counseling Bulletin. Vol. 41, Issue 3
Forrester, A. 1995. “Beyond Job Placement: The Self-Employment Boom”. Journal of Rehabilitation Administration. V19 (2).
Fry, R. (ed.) 1996. “Shaping State Rehabilitation Programs Through Consumer Partnerships: Issues and Strategies.” Report from the Study Group, Research and Training Center, Neuomonic, Wisc.
Harley, D., Feist-Price, S. and Alston, R. 1996. “Cultural Diversity: A Content Analysis of the Rehabilitation Literature”. Journal of Applied Rehabilitation Counseling. Vol. 27, No.2, Summer.
Harley, D., Rice, S., & Dean, G. 1996. “Rural Rehabilitation: A Consortium for Administration, Coordination, and Delivery of Services.” Journal of Rehabilitation Administration, Volume 2 (2).
Larson C. & Foley, J. 1992. “Rural Issues in Rehabilitation Service Delivery: A Goodwill Industries of America Study.” American Rehabilitation, Spring.
Locust, C. and Lang, J. 1996. “Walking in Two Worlds: Native Americans and the VR System”. American Rehabilitation. Summer 96, Vol. 22. Issues 2.
Ma, G. and Coyle, C. 1999. “Assessment of Services to American Indians with Disabilities”. Journal of Rehabilitation. Vol 65. Issue 3.
Marshall C. et. al. 1994. “The Assessment of a Model for determining Community-Based Needs of American Indians with Disabilities: Follow-up in Denver, Colorado.” Final Report. Northern Arizona University, Flagstaff, Colorado.
Oregon Developmental Disabilities Council. 1995. “Not Another Board Meeting: A Guide to Building Inclusive Decision-making Groups.”
103

Rojewski, J. 1997. “Cultural Diversity and Its Impact on Career Counseling”. in The Hatherleigh Guide of Vocational and Career Counseling. The Hatherleigh Guide Series. Vol. 9. Hatherleigh Press, New York.
Rehabilitation Research and Training Center on Aging. “Serving on Research Advisory Boards: Practical tips for Achieving Maximum Impact.” (Video) Los Amigos Research and Education Center.
RTC: Rural. “Priorities for Rural Vocational Rehabilitation”. RURALFACTS . University of Montana.
Sanderson, P. 1997. “People Characteristics That Affect Employment Outcomes”. In Lessons for Improving Employment of People with Disabilities from Vocational Research. (eds.) Menz, Eggers, Wehman and Brooke. American Indian Rehabilitation Research and Training Center, Northern Arizona University, Flagstaff AZ
Schriner, K. 1995. “Introduction”. Self-Employment in Vocational Rehabilitation: Building on Lessons from Rural America. Research and Training Center in Vocational Rehabilitation, University of Arkansas.
Trevino, B. and Syzmanski, E. 1996. “A Qualitative Study of Career Development of Hispanics with Disabilities”. Journal of Rehabilitation.
Velarde Tiller, V.E. 1995. “American Indian Reservations and Indian Trust Areas.” Reference guide prepared for the Economic Development Administration of the U.S. Department of Commerce. Tiller Research, Inc.
Weddington, J., Sanderson, P.. 1995. Twenty-first Institute on Rehabilitation Issues Report from the Study Group on American Indian Rehabilitation Programs: Unmet Needs. Arkansas Research and Training Center in Vocational Rehabilitation, Arkansas Rehabilitation Services, University of Arkansas at Fayetteville.
Wheeler, J and Hall, P. 1995. “Supported Employment in Rural Areas: The Demographics of Job Development in South Dakota”. Rural Special Education Quarterly. V14. N1.
104

APPENDIX AAIVRS Projects (2000- 2001)
Grantee City StateAssociation of Village Council Presidents Bethel AKAleutian/Pribilof Islands Association Anchorage AKBristol Bay Native Association Dillingham AKCook Inlet Tribal Council, Inc.* Anchorage AKInupiat Community of the Arctic Slope* Barrow AKKawerak, Inc.* Nome AKKodiak Area Native Association Kodiak AKTanana Chiefs Conference Fairbanks AKTlinget & Haida Tribes Juneau AKThe Navajo Nation Window Rock AZTohono O’odham Nation Sells AZWhite Mountain Apache Tribe Whiteriver AZFt. Mohave Indian Tribe Needles CAHoopa Valley Tribe Hoopa CAPinoleville Band of Pomo Indians Ukiah CASouthern Ute Indian Tribe Ignacio COUte Mountain Ute Tribe Towaoc COLower Muskogee Creek Tribe* Whigham GACoeur d”Alene Tribe* Plummer IDNez Perce Tribe* Lapwai IDShoshone-Bannock Tribes Fort Hall IDPrairie Band of Potawatomi Nation* Mayetta KSUnited Houman Nation, Inc.* Houma LAHannahville Indian Community Wilson MIRed Lake Band of Chippewa Indians Red Lake MNWhite Earth Reservation Tribal Council Naytahwaush MNMississippi Band of Choctaw Indians Philadelphia MSBlackfeet Tribal Business Council* Browning MTConfederated Salish & Kootenai Tribes Pablo MTChippewa Cree Tribe* Box Elder MTFort Belnap Tribes Harlem MTFort Peck Assiniboine & Sioux Tribes Poplar MTMoapa Band of Paiutes Las Vegas NVPueblo of Jemez Jemez Pueblo NMPueblo of Laguna New Laguna NMPueblo of Zuni Zuni NMSeneca Nation of Indians Irving NYSt. Regis Mohawk Tribe* Hoganburg NYThree Affiliated Tribes New Town NDTurtle Mountain Band of Chippewa Indians Belcourt NDStanding Rock Sioux Tribe Ft. Yates ND
105
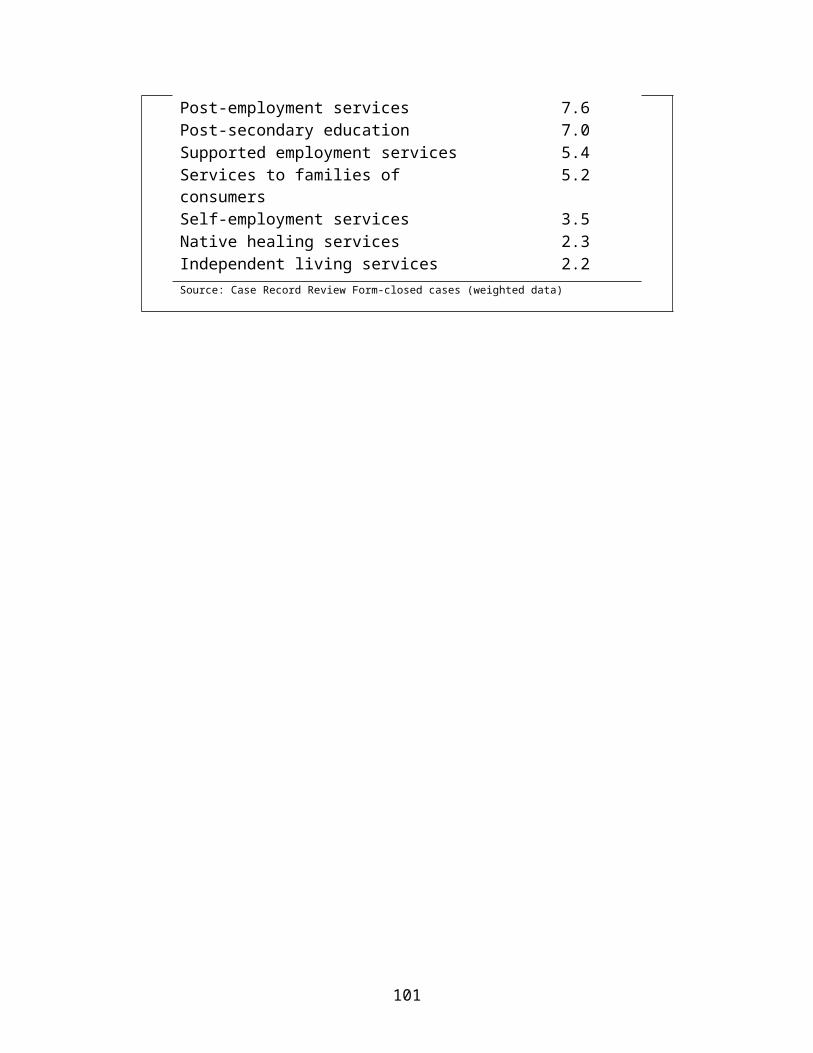
Spirit Lake Nation Fort Totten NDApache Tribe of Oklahoma Anadarko OKCherokee Nation Tahlequah OKCheyenne/Arapaho Tribes of Oklahoma Concho OKChickasaw Nation Ada OKChoctaw Nation of Oklahoma Hugo OKDelaware Tribe of Western Oklahoma Oklahoma City OKIowa Tribe of Oklahoma Perkins OKMuscogee Creek Nation Okemah OKConfederated Tribes of Grand Ronde Grand Ronde ORConfederated Tribes of Warm Springs Warm Springs ORCheyenne River Sioux Eagle Butte SDLower Brule Sioux Tribe Lower Brule SDOgala Sioux Tribe Pine Ridge SDColville Confederated Tribes Nespelem WALummi Nation Bellingham WASouth Puget Intertribal Planning Agency Shelton WAStillaguamish Tribe of Indians Arlington WAYakama Indian Nation Toppenish WAGreat Lakes Intertribal Council Lac du Flambeau WILac Courte Oreilles Indian Tribe Hayward WIOneida Tribe of Indians of Wisconsin Oneida WIEastern Shoshone Tribe Fort Washakie WY
* New project in 2000-2001 – not included in evaluation.
106

APPENDIX BDescriptions of Effective Practices
AIVRS projects listed in Chapter 10 were asked if they wished to provide additional detail concerning their effective practices. Presented below are descriptions of effective practices that were provided by two AIVRS projects.
Pueblo of Jemez, Jemez Pueblo, NM
Computerized management information system. The Jemez/Zia Vocational Rehabilitation (JZVR) Project Information Management System: Regarding the JZVR infrastructure, the most valuable data collection tool that was implemented in 2000 was in the area of attaining and maintaining accurate consumer information. In July 2000, the JZVR implemented a computer information management system (IMS) in order to collect data and provide direction for the future. With this valuable information, the JZVR can assess consumer needs and pour its energy into providing services that meet those needs. The use of the IMS has proven to be a tremendous asset to the program. The IMS was specifically designed for our program and not just a software kit that we purchased. The staff was involved in creating this system so through the process of designing the system, they became familiar with how to use it. The IMS targets Native American VR and produces information and data that are pertinent to reporting requirements.
Small business incubator program. Since self-employment seems to attract a number of consumers who do not have the knowledge of what it means to run a business, the JZVR has developed a preliminary self-employment training facility. The JZVR calls the training facility its “small business incubator.” Each consumer pursuing a self-employment outcome is required to go through an 8-week trial self-employment experience in the JZVR Small Business Workshop in order to determine the consumer’s ability to perform the craft before pursuing a self-employment plan. In addition to assessing the consumer’s motivation and determination for owning a business, the incubator also gives opportunity to see if a client’s disability will be impaired due to performing the craft. The other valuable aspect of the incubator is that it allows the JZVR time to search for other funding options and resources before monies are spent from the JZVR budget. There are basically 8 steps to the self-employment process:
1. Consumer participation in an 8-week trial self-employment work experience through the JZVR Small Business Incubator Workshop.
2. Learning a craft, art or skill and assessing the consumer’s motivation and determination to run a business. The consumer is taught the art/craft by a past JZVR consumer who is paid for his/her training.
3. Assessing the consumer’s ability to perform the craft, art or skill. Facilitating a vocational assessment, physical capacity assessment or other related evaluations to determine if self-employment is a good match for the consumer’s situation.
4. Self-employment/business mentoring/coaching. This applies to assisting the consumer during and after the process of developing his/her business. The JZVR contracts with prior consumers to provide training to current consumers within the traditional trades. This encourages the mentorship process and provides the valuable interaction between
107

consumers needed to create a foundation of stability within self-employment. Since the consumer will be working with a past JZVR consumer who successfully completed an IPE in self-employment, the past consumer will assist the current consumer in developing his/her business.
5. The consumer will learn how to financially run a business by completing a 2-part financial management workshop. The first part of the workshop focuses on personal budgeting and the second part of the workshop focuses on financially managing a business. A JZVR staff member who speaks the native language will facilitate the workshop.
6. Development of a business plan with the consumer. The JZVR has successfully collaborated with a local community member who has a business degree to assist the consumer in developing the business plan. This process involves time spent with consumers pursuing self-employment to educate them in their own language regarding the small business process and procedures. Since the business plan developer is a community member, he is able to communicate effectively the pros and cons of running a business within the Tribal community.
7. Assistance with marketing the consumer’s business. The trainer and JZVR counselor will assist the consumer in learning how to develop business cards, flyers, brochures and how to display his/her work. In addition, the consumer will learn how to promote his/her business when selling at local and statewide arts and crafts shows.
8. During the 8-week trial self-employment, the JZVR consumer will be responsible to work on his/her physical, mental, emotional and spiritual health. This means that the consumer will become up-to-date in medical appointments, behavioral health (counseling) appointments, attending AA or Alcohol education appointments, diabetes education classes, etc. In addition, the JZVR will support any traditional healing that the consumer desires to participate in for overall health and well-being.
The trial self-employment provides consumers with valuable insight regarding running a small business and provides the JZVR the opportunity to assess a consumer’s self-employment interest before expenditures are made. Although we have only been using the incubator for a few months, it has already proven to be very successful in developing self-employment outcomes.
108

Seneca Nation of Indians, Irving, NY
Full range of services on site, including State VR and Social Security Administration. The Indian community is entitled to a full range of comparable services as the non-Indian community. However, to access the services, transportation is an issue in reaching the services that are often a 40-minute to 1 hour and half from their respective homes. This program has found that there is lack of public transportation surrounding the Seneca Nation territories. The program will screen the service providers and ask if they can meet the consumers at the offices
This program has opened up their office doors to various service providers to meet community members on the reservation. The service providers are from various agencies such as:
1. Department of Social Services – Food stamp/Medicaid/cash benefits2. Social Security Administration – discusses their benefit package, obtain social security
cards, apply for Social security benefits, etc.3. State Vocational Rehabilitation office 4. Optometrist sponsored by Commission for the Blind and Visually Handicapped (Vision
exam, prescription are dispensed, which when filled are mailed to the consumer, if they choose)
5. Native American Independent Living Services6. Every women’s Opportunity Center
Career readiness training provided to all consumers. We provide extensive career readiness training. The program wants to provide to the consumer a strong foundation to build their chosen career on. The counselors will provide bi-monthly trainings in group settings or “one on one” to the consumer. Each consumer is given a certificate for his or her portfolio. The examples of some of the workshops:
Basic Job Search Strategies –1. Self – Assessment2. Job Seeking Strategies3. Resumes, Cover Letters, Applications4. Interview Tips & Techniques
The 3 A’s of Keeping a Job: Appearance, Attendance, Attitude Job Success
1. Your Job: Now its up to You2. Values, Decisions, Success3. Workplace Motivation
Self-Confidence Workshop Barriers to Employment Success Inventory Mock Interviews Computer Classes Job Search: Internet Budgeting
109

APPENDIX CDraft Guidelines for AIVRS Rehabilitation Counselor Training
A. Purpose
The purpose of this document is to provide guidance and suggestions to AIVRS projects concerning training in vocational rehabilitation, in particular for individuals serving as rehabilitation counselors. These guidelines are the suggestions of Development Associates, Inc., and have not been approved by the U.S. Department of Education. We believe that it would be useful for these guidelines to be reviewed and expanded by CANAR and/or a working group of AIVRS grantee staff. The guidelines are intended for individuals who do not have extensive backgrounds in VR, counseling, or serving persons with disabilities. The guidelines might also be used in developing training plans for other AIVRS staff members.
B. Developing a Training Plan
AIVRS projects often are in a difficult situation with regard to hiring counselors who are experienced in VR and who also relate well to Native American consumers. Often the best of staff members are in need of some training, usually in the areas of VR practices and process and how to apply those principles within the values and practices of Native American culture. The geographical location and isolation of many AIVRS projects, the limited exposure of staff to the foundations of the rehabilitation process, and lack of knowledge concerning resources available for learning about vocational rehabilitation are additional challenges for AIVRS projects.
Projects also share many of the same challenges as other rural VR programs – high unemployment rates, limited transportation, limited opportunities for employment, and limited educational backgrounds of consumers. Barriers faced by AIVRS consumers are similar to those of other VR consumers - long-term unemployment, disability limitations, motivation, limited financial and social support, obtaining adequate health insurance, and conflicts with the security of SSI, SSDI and workman’s compensation entitlements.
There is no one single model for how learning happens, nor is there one single point of access to knowledge. Practical hands-on learning, self-study, short-term workshops, and formal academic study are all satisfactory paths to information and the development of new skills. Each AIVRS project should define the specific methods and training sources that are most appropriate to their needs.
C. A General Outline for AIVRS Rehabilitation Counselor Training
In developing these training guidelines, material from the Council on Rehabilitation Education (CORE) was used in identifying the key elements for quality VR training programs. The guidelines below present key topics for training. Further development of these guidelines might include the amount of time to be devoted to each topic. The topics are listed in order of priority, from those needed at the beginning of service to those needed for further development.
110

Vocational Rehabilitation VR principles and process VR regulations and AIVRS regulations Adapting the regulations to Native American culture and rural economics
Professionalism Confidentiality The helping process Setting goals Consumer involvement Case management Record management
Applying the VR process and AIVRS regulations Recruitment of consumers Assessment Family involvement Concept of person-environment-fit IPE Accessing additional resources
Outreach/Education Outreach education to the tribal government Outreach education to other social services Outreach education to the local State VR office Outreach education to the consumer community
Persons with disabilities Characteristics Life patterns Motivation Psychological aspects Medical aspects Influence of entitlements Influence of long-term unemployment
Consumer abilities and limitations associated with specific disabilities Disabilities prevalent in Native American communities
Psychological aspects Medical aspectsSocial/family aspects
Other disabilitiesPsychological aspects Medical aspectsSocial/family aspects
111
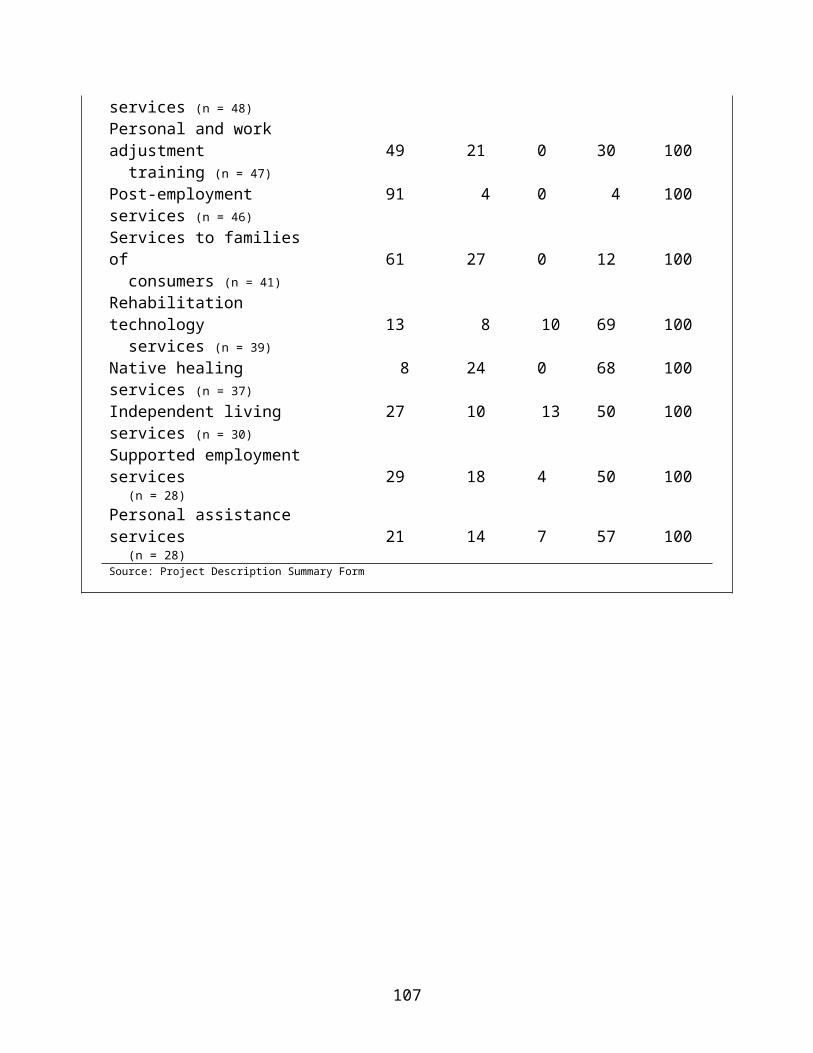
Entitlements SSI, SSDI regulations Effect of the regulations on employment Effect of the loss of entitlements on consumer decisions
Placement/Employment Applying the concept of person-environment-fit Job development in a rural economic setting Job placement in a rural economic setting Self-employment Small business development
Sustaining employment Supported employment Follow-along Maintaining SSA/health insurance
D. Further Recommendations
Given the professional movement toward establishing standards for VR counselors and the availability of the Internet as a resource for immediate information and self-study, AIVRS rehabilitation counselors can currently benefit from a combination of certificate programs and self study as a first phase of training. Training should incorporate the CORE topics, address adapting the delivery of VR services to Native American culture and rural economic conditions, and take advantage of existing certificate programs and resources such as the community college, Internet, Rehabilitation Continuing Education Programs (RCEP), State VR training, and CANAR conference meetings.
The second phase of training can extend to more formal academic credentialing through undergraduate or master level academic degrees. Many universities offer rehabilitation degrees on-line.
The role of self-study in AIVRS projects is that of continuing education and exploration. Self study, particularly through the Internet, can be used for access to information on specific disabilities, skills and federal regulations. It is self-paced and specific to the immediate needs of the counselor. The approaches vary from one-time research on a disability to current articles and reports to updates on regulations affecting consumers. Self-study can be conducted at the convenience of the counselor and used to familiarize counselors with VR terms and general practices before considering more formal training.
The role of certificate programs in AIVRS projects is in addressing immediate training need and establishing professional credentials. Certificate programs concentrate on the basic principals of VR as well as practical skills that counselors use daily. Often certificate programs are limited in length, cover a specific topic and provide a solid orientation/foundation to VR. Because they emphasize practical skills, staff and supervisors can see the immediate benefit of their learning. Certificate programs also allow staff to make informed decisions about further education in the
112

field. They serve as the first step in preparing staff to best serve consumers. Many certificate programs include a continuing education element that is helpful for honing skills or preparing for more formal educational approaches.
The role of degree programs in AIVRS projects is greater with on-line offerings. Degree programs are more theoretically based, involve a longer time and financial commitment, a more concentrated effort to include reading and writing resources, and include practicum or lab experience at either the undergraduate or graduate level. The immediate supervisor is much more involved in monitoring staff and may be required to have a MA in a closely related subject. Practical skills are not developed until the latter part of the program.
The role of professional licensing in AIVRS projects is increasing. Professional associations are considering the licensing of VR counselors as a future requirement for all VR staff. The movement toward licensing is grounded in providing the best service to consumers. The field of VR practitioners is made up of many professionals from other disciplines who are using their skills and experience in a secondary setting. Only recently were degree programs available in any abundance. Most practitioners developed specific skills for VR through experience, and continuing education workshops sponsored by federally funded Rehabilitation Counselor Education Programs located at universities. Currently, to become a Certified Rehabilitation Counselor counselors are required to have a degree in Rehabilitation Counseling, pass an initial exam, and update their certification with continuing education hours.
The role of CORE in VR training programs is to set the curriculum content for undergraduate and graduate degree programs in rehabilitation counseling. Although course titles may vary from one program to another, the following is a list of typically required courses:
a. Introduction to Rehabilitation Counseling b. Counseling Theories and Techniques c. Personality Theories d. Psychosocial Aspects of Disability e. Medical Aspects of Disability f. Evaluation and Assessment g. Vocational Aspects of Disability h. Rehabilitation Case Management i. Research Methods j. Practicum k. Internship
113

E. Resources
Self-study materials available on-line are sponsored by disability related sites, CORE and the CRC certification site.
Core Accreditation Manual (www.core-rehab.org/manual) Disability and Rehabilitation Studies Self-Study of Curriculum Content Areas
(www.core-rehab.org/SelfStudy99.html) World Wide Web Review Guide for the CRC Examination
(www.luna.cas.usf.edu/rasch/) University of South Carolina non-degree coursework ([email protected].) Using the Internet as a Resource to the Work of the State VR Counselor
(www.rcep6.org/IRI_Forward.html) ADA A-Z (www.ada-infonet.org/training/ada_a-z)
Individual courses/workshops are also available on-line and at specific locations. A State VR sponsored distance learning site is the Michigan Rehabilitation Services On-line Learning Center (www2.mrs.state.mi.us/). Additional workshops are available thorough:
The Oyate Project (www.ccer.org/natvamer1.htm) The Din Project (www.ccer.org/natamer/dine.htm) University of Wisconsin-Stout Continuing Education Center for Community-Based
Rehabilitation Programs (www.cec.uwstout.edu//about/whatis.htm) Cornell University’s Program on Employment and Disability Living, Learning and
Earning: How SSA’s disability, return-to-work and work incentives can promote adult success (www.ilr.cornell.edu/ped/ssa).
Rehabilitation Continuing Education Programs(www.ed.gov/offices/OSERS/RSA/PGMS/RT)
University of South Carolina non-degree courses in rehabilitation
Existing certificate programs are available on-line and at specific locations. There are few certificate programs specifically addressing the unique cultural issues of AIVRS projects.
Post-employment Training – American Indian Rehabilitation (PET-AIR) graduate level training for administrators (www.interwork.sdsu.edu/deg_cer.html)
The Rural Institute at the University of Montana has an American Indians and Disability initiative that currently focuses on self-employment and small business start-ups for consumers.
Other certificate programs include but are not limited to:
Certificate Program in Disability Management (www.nidmr.ca/textonly/training.htm) Supported Employment Web-based Certificate Series
(www.vcu.edu/rrtcweb/cyneru/webcourse/) Job Coach Certification (www.coe.uga.edu/hsmi/) Community Rehabilitation Administration Certificate (www.org/workshops.htm)
114

Certification in Supported Employment and Transition (www.interwork.sdsu.edu/web_deg_cer/rcp_sdu.html)
Certification in Rehabilitation Technology (www.interwork.sdsu.edu) Regional RCEPs
A complete listing of rehabilitation distance learning, continuing education, degree and certificate programs can be found on the National Clearinghouse of Rehabilitation Training Materials (www.nchrtm.okstate.edu/pages/) and the Unofficial Rehabilitation Counseling Web Page (www.luna.cas.usf.edu/rasch/) web sites. Many linked sites list courses and content.
Links to federal regulations, professional organizations and journals and specific disability links can be found at the George Washington University Rehabilitation Counseling Web Links (www.hfni.gsehd.gwu.edu/chaos/rehab/Links4.html.) and the Unofficial Rehabilitation Counseling Web Page (www.luna.cas.usf.edu/rasch/) web sites.
115

APPENDIX DDraft Guidelines on the Use of Objectives to Manage AIVRS Projects
A. Purpose
The purpose of this document is to provide guidance and suggestions to AIVRS projects concerning the establishment and use of objectives in managing their projects. These guidelines are the suggestions of Development Associates, Inc., and have not been approved by the U.S. Department of Education. The guidelines are intended for internal use by project staff, though projects may wish to involve non-project staff in their monitoring efforts. Projects may also wish to include some of the information that is collected in their performance reports to RSA.
The document discusses the concept of measurable objectives, and proposes specific areas in which objectives might be developed. It discusses the importance of defining challenging but achievable goals, and of defining schedules for assessment and review. The document discusses methods and procedures for collecting monitoring and evaluation information, and the possible roles of project staff and others in implementing monitoring and evaluation systems.
B. The Concept of Measurable Objectives
At the heart of any project monitoring and evaluation system is a set of objectives used to judge the project. All projects have objectives, though sometimes they are unstated. To judge a project, one needs to know what the project intends to do.
A project’s objectives can be very generally stated, such as “to improve the lives of the consumers.” However, in order to be useful in a monitoring and evaluation system, the objective needs to be stated in such a way that information can be collected to judge whether the objective has been achieved. Thus, an objective “to close with a successful employment outcome at least __ percent of cases in which a consumer has received services under an IPE” provides the type of detail that is necessary to judge success.
An objective is measurable if information can be collected that clearly indicates that the objective has been achieved. A measurable objective does not have to be quantitative in nature. For example, a project may define as an objective “to develop a brochure for potential consumers that describes eligibility for AIVRS services, the types of services that are available, and the way to contact the project to access services.” The objective is measurable because the presence of a brochure with these three elements can be verified by anyone inside or outside of the project.
To be most useful, the statement of a measurable objective should include: (1) the objective stated in a way that is clearly measurable; (2) a date or schedule for achievement of the objective; (3) the method in which information will be collected to verify achievement (regular project records, consumer surveys, etc.); and (4) the person(s) who will be responsible for collecting information and assessing achievement.
Thus, for example, a complete statement of the objective on a brochure would be:
116

Objective: To develop a brochure for potential consumers that describes eligibility for AIVRS services, the types of services that are available, and the way to contact the project to access services.
Date/Schedule: Brochure to be completed by June 30, 2002.
Method of Data Collection/Verification: Examination of completed brochure.
Person(s) Responsible: Lead Counselor will develop brochure. Project director will review contents.
The best objectives are those that are both challenging and achievable. If the objectives are not challenging, then there is little purpose in defining them, because achievement will be almost automatic. If the objectives are not achievable, they will serve only to discourage project staff. Setting, communicating, and achieving challenging objectives, on the other hand, can be very motivating for project staff.
C. Objectives for AIVRS Projects
Because each AIVRS project is unique in its history and in the challenges that it faces, there is not a single set of objectives that can be applied to all projects. There are, however, a set of topic areas concerning which projects should consider defining objectives. These areas include both project activities and project outcomes.
Listed below are some areas concerning which projects might develop objectives, and some examples of objectives that might be used. The specific wording for the objectives is illustrative, and should be revised to meet the specific objectives of the project. It also should be noted that dates, methods of data collection, and persons responsible are not listed, though they should be described in an actual statement of objectives.
Project Outreach Develop a brochure that describes eligibility criteria, services offered, and how to contact
project. Give presentations to at least __ other organizations concerning project services. As assessed through a community survey, at least __ percent of the adult target
population is aware of the program.Staffing
Project staff positions are filled for at least __ percent of the total staff time for the year. Professional staff members receive at least __ hours of training relevant to their positions
per year.
117

Record-keeping Based on random case record reviews, all required forms and documents are present in __
percent of case records. Consumer has signed application and IPE in __ percent of cases.
Case Management IPE prepared within __ days for __ percent of eligible cases. Less than __ percent of current cases are inactive (i.e., no services or contacts in past __
days).Advisory Group
Advisory group has met at least __ times in the year with at least __ percent attendance by members.
Coordination with State VR A memorandum of understanding is signed by both the State and the tribe.
Coordination with Service Providers A service agreement document is completed and signed by __ percent of providers. Service providers are contacted every __ months to assess status of service coordination.
Service Outputs Services are provided to at least __ consumers in the project year. Services are provided to at least __ persons with severe/significant disabilities.
Consumer Outcomes At least __ percent of all consumers served are closed with a successful employment
outcome. At least __ percent of consumers receiving services under an IPE are closed with a
successful employment outcome. At least __ percent of successful closures involve integrated, competitive employment.
D. Methods and Procedures for Monitoring and Evaluation
A monitoring and evaluation system for an AIVRS project should be integrated into day-to-day operations. In most cases, the information for the system should be collected and recorded as a regular part of program record-keeping (in consumer files and/or computer management information systems).
The monitoring and evaluation system will likely involve periodic review of project records, such as a random review of consumer files. Such a review will likely be conducted by a manager, such as the project director or lead counselor, and are a typical component of effective management systems.
The monitoring and evaluation system may also involve some special data collections. For example, some projects may wish to conduct periodic community surveys to assess visibility of the project in the service area. They may also wish to conduct periodic surveys of consumers to assess satisfaction with services or with former consumers to assess the impact of services. In general, special data collections should be closely tied to the assessment of project objectives and should be scheduled only when necessary for that assessment.
118

All project staff should be aware of the project objectives so that they understand the importance of accurate record-keeping and so that they are motivated to assist in their achievement. Progress towards objectives should be discussed periodically during project staff meetings.
E. Personnel Assignments
For most elements of monitoring and evaluation systems, project staff should be responsible for data collection, record-keeping, and reporting. Counselors and other staff should be recording much of the information as part of their regular record-keeping responsibilities. In most cases, project managers will be responsible for activities such as file reviews and reviews of other products, and they should be responsible for summarizing information and preparing reports.
Some projects may wish to involve someone outside the project (an “evaluator”) for activities such as community surveys or consumer surveys. Such a person might bring special expertise in survey design and implementation, and might also provide both perceived and actual “objectivity” to the process. The use of an outside evaluator sometimes also brings increased credibility to the entire evaluation process, which may be helpful when describing results to tribal governments or RSA.
Even if an outside evaluator is used, the project objectives need to be “owned” by the project staff. The objectives should be viewed as important parts of everyone’s work, and should be periodically reviewed and revised based on the experiences of the project. Such reviews should be completed at least every year, and should occur whenever it becomes obvious that the objectives either represent little challenge or are completely unrealistic.
119


