South Dakota State University Open PIRIE: Open Public Research Access Institutional Repository and Information Exchange Bulletins South Dakota State University Agricultural Experiment Station 7-1-1964 Evaluation of the Boarding School Diets of Indian Children of the Dakotas and Observations on the Growth and Development of Adolescent Indian Girls C. Schuck B. G. Wenberg M. T. Boedeker Follow this and additional works at: hp://openprairie.sdstate.edu/agexperimentsta_bulletins is Bulletin is brought to you for free and open access by the South Dakota State University Agricultural Experiment Station at Open PIRIE: Open Public Research Access Institutional Repository and Information Exchange. It has been accepted for inclusion in Bulletins by an authorized administrator of Open PIRIE: Open Public Research Access Institutional Repository and Information Exchange. For more information, please contact [email protected]. Recommended Citation Schuck, C.; Wenberg, B. G.; and Boedeker, M. T., "Evaluation of the Boarding School Diets of Indian Children of the Dakotas and Observations on the Growth and Development of Adolescent Indian Girls" (1964). Bulletins. Paper 514. hp://openprairie.sdstate.edu/agexperimentsta_bulletins/514
Transcript
South Dakota State UniversityOpen PRAIRIE: Open Public Research Access InstitutionalRepository and Information Exchange
Bulletins South Dakota State University AgriculturalExperiment Station
7-1-1964
Evaluation of the Boarding School Diets of IndianChildren of the Dakotas and Observations on theGrowth and Development of Adolescent IndianGirlsC. Schuck
B. G. Wenberg
M. T. Boedeker
Follow this and additional works at: http://openprairie.sdstate.edu/agexperimentsta_bulletins
This Bulletin is brought to you for free and open access by the South Dakota State University Agricultural Experiment Station at Open PRAIRIE: OpenPublic Research Access Institutional Repository and Information Exchange. It has been accepted for inclusion in Bulletins by an authorizedadministrator of Open PRAIRIE: Open Public Research Access Institutional Repository and Information Exchange. For more information, pleasecontact [email protected].
Recommended CitationSchuck, C.; Wenberg, B. G.; and Boedeker, M. T., "Evaluation of the Boarding School Diets of Indian Children of the Dakotas andObservations on the Growth and Development of Adolescent Indian Girls" (1964). Bulletins. Paper 514.http://openprairie.sdstate.edu/agexperimentsta_bulletins/514
Other Observations on 12-14 Year Old Girls -------------------------------------------- 7
Heights and Weights Age at Menarche Hemoglobin
Res u Its and Discuss ion ________________________ _ -------------------------------------------------------- 7 Dietary Observations Analysis of Variance Heights and Weights of 12-14-Y.ear Old Girls Relation of Age at Menarche to Physical Measurements Hemoglobin Levels
Summary ____________ ---------------------------------------------. _____ --------�--_______________________________ l l
Literature Cited________________________________________________________________________________________________ l 9
Appendix Forms Used in Collection of Dietary Data ---------------------------------------------------- 20 Recommended Daily Dietary Allowan ces, Revised 1958 ____________________________ 22 Detailed Resu Its of Analysis of Variance ---------------------------------------------------- 23
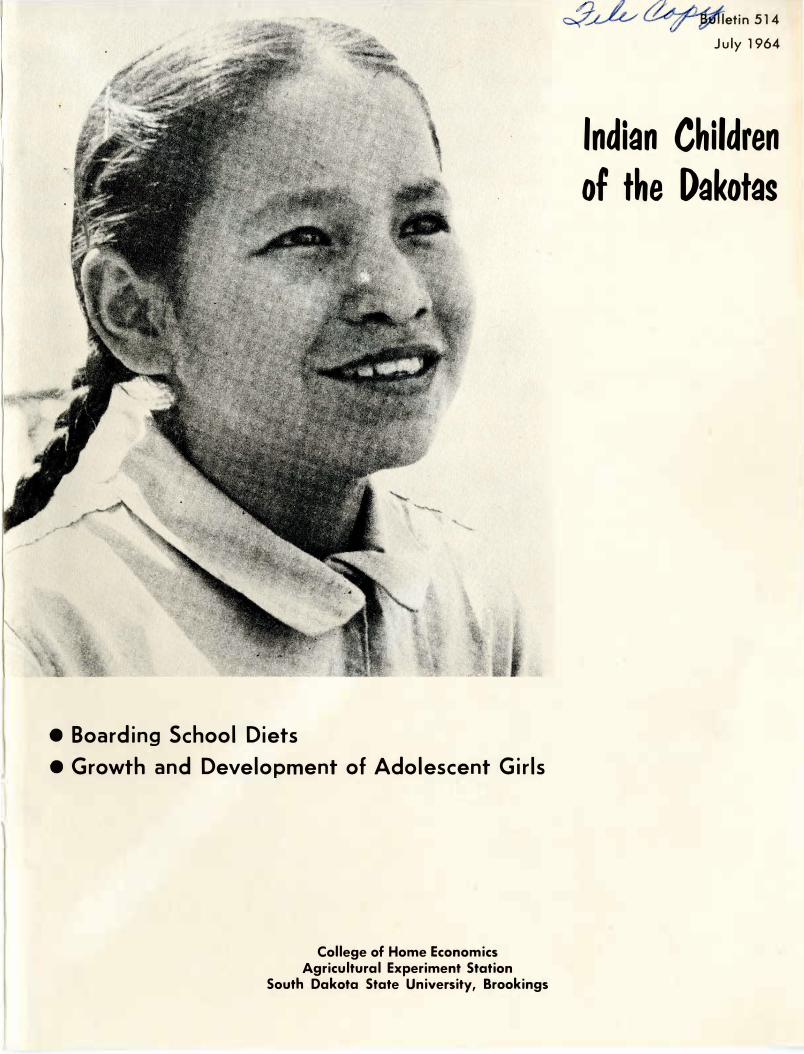
COVER PHOTO - An alert, happy young Sioux. Holy Rosary Mission School, Pine Ridge, S. Dak.
TABLES
( Beginning page 12) No.
1. Mean Daily Nutritive Values of Diets of Individual Schools.
2. Mean Daily Calorie and Nutrient Value of Diets-All Schools.
3. Percent Calories Derived from the Three Organic Nu-trients.
4. Mean Nutritive Value of Diets-Analyzed.
5. Percent of NRC Allowances.
6. Mean Daily Nutritive Values Based on Inventories.
7. Mean Nutritive Values of Diets of BIA and Mission Schools.
8. Mean Heights and Weights for Three Successive Periods ( 8 Schools).
9. Mean Heights and Weights at Winter Measure Compared with Meredith Growth Norms for Nearest Age (8 Schools).
10. Mean Heights and Weights by Age at Menarche and Comparison of Winter Measures with Meredith Norms (Age 13).
11. Hemoglobin Levels.
Evaluation of the Boarding School Diets
of Indian Children of the Dakotas
and Observations on the
Growth and Development of Adolescent
Indian Girls
By Cecilia Schuck, Burness G. Wenberg, and Margaret Talcott Boedeker*
INTRODUCTION
Anthropological, sociological, and general health studies among Indian population groups point to importance of additional information about dietary practices and nutritional status. Dr. Bertlyn Bosley,1 Chief of the Nutrition and Dietetic Branch of the Division of Indian Health, Department of Health, Education, and Welfare, has underlined relationship of nutrition and health by stating "Nutritionists as well as other members of the health profession should be concerned about a death rate among Indian infants approximately three times that of the infants of the rest of the United States and the fact that the life expectancy for Indians is approximately 10 years less than for non-Indians."
In 1950 South Dakota ranked fifth among all States in total number of Indian people and third in largest proportion of Indians within the State's population. The census gave the State's Indian population as 23,344, approximately 4% of the total population. The 1960 census showed an increase to 25,794. Since total population also increased slightly the percentage of Indians was virtually unchanged. The Indian population consists largely of different tribes of the Sioux Nation. There are, however, some Mandan, Arikara, Gros Ventre, Black Foot and other tribes residing in the State. Of particular interest in connection with this study is number of Indian children of school age in South Dakota, which in 1956 was 10,031 according to the school census report of the United States Bureau
3
of Indian Affairs. This figure included all Indian children ages 6-18 plus those older and younger, but attending school at the time. Dr. Vernon Malan, Professor of Rural Sociology, South Dakota State University, has provided valuable background information on the Dakota Indian, 7
• 8 part of which deals with ac
culturation in various aspects of living. No doubt, boarding schools are playing a part in this process as young people grow up and carry back to their people the way of life of non-Indians. This is true of eating practices and other changes they encounter in the boarding schools.
Further information on Indians of South Dakota has been provided by Gordon MacGregor6 in his book "Warriors Without Weaponf' pubUshed in 1946. MacGregor presents results of an interdisciplinary study conducted among 166 Sioux children 6 to 18 years old, from three communities on the Pine Ridge Reservation. The section of the book entitled "Health and Personality" is based on Dr. Dorothea Leighton's analysis of medical records secured through members of the local medical staff. The author qualifies the material in this fashion: "Because of the variations between medical examiners and because of lack of any absolute standards for good health or various dis-*Professor, and ass:stant professor, Food and Nutrition Research, and
graduate assistant, respectively. Miss Wenberg is now assistant professor, Department of Preventative Medicine, School of Medicine, Ohio State University, Columbus. Mrs. Boedeker is now a resident of Randalia, Iowa.
eased conditions that can be determined by a single routine examination, the analysis can hardly be considered conclusive." Later he adds that the same holds true for any determination of "adequate and inadequate nutrition." Findings reported were: generally good health-20%; undernourished-40%; decayed teeth-50%; enlarged tonsils-SO%; and many with possible symptoms of vitamin deficiency, such as swollen gums, flaring ribs and enlarged sore tongues. It was pointed out that the classification of "undernourished" was determined by comparing each child's height and weight with the average for his tribal age group. Tribal age group physical measurements as a height-weight standard might be questioned. A controlled diet study was not possible, but information gathered indicated that the average meals of the children were inadequate in calories and yitamins. All children attended day schools in the three communities represented. In a grade school home economics class the answers received to questions on home breakfasts revealed that some of the children came to school without breakfast, that no child had milk or fruit, only one had an egg and that a typical breakfast might have consisted of cake purchased at the "trader's", fried bread or potatoes, or pancakes and syrup, and coffee.
In May 1958, the Division of Indian Health in the Aberdeen area began use of a pamphlet5 designed to give information on the Pine Ridge Reservation as a means of orienting new employees assigned to duty there. The pamphlet is divided into narrative and statistical sections. Statistics on health include causes of death and major items of diet. Causes of death are listed in this order: pneumonia, wounds, accidents, etc., tuberculosis, malnutrition, diarrhea for young babies, and old age. Diet items include mush, potatoes,
4
dried beans, Indian bread or baking powder bread, light bread, rice, some cheese, some dried fruits, beef (heart, kidney, ribs, hamburger), smoked bacon, fat back, bologna, frankfurters, cabbage, some canned milk, and some canned fruit. Milk, vegetables and fruits are obviously low.
A 1957 Public Health Service report covering the years 1949-5311 shows the average annual birth rate for Indians was 32.1 per 1,000 population as compared with 24.5 per 1,000 for all races in the United States. This publication reported a larger proportion of children in the Indian population which in turn brought the birth rate when calculated per 1,000 women of child bearing age to a figure approximately 50°/o higher than that for the general population. A possible implication of these statistics is that the adolescent girl in the Indian population will be bearing children earlier, more frequently, and over a longer period of years than adolescent girls in the general population.
Most pertinent to the present study because of emphasis on diet and health conditions of South Dakota Indians is another study on the Crow Creek Reservation by Jessie Anderson Stene9 in the summer if 1927. This has been reported in a dissertation written in partial fulfillment for the master's degree at the University of Chicago. Mrs. Stene was acquainted with the Federal officials at the reservation and the fact that' members of her famiily lived in the area placed her in an advantageous position for obtaining the desired information. Her description of diets, methods of living and physical conditions probably have a high degree of accuracy for the period in which the study was made but certain changes likely have occurred since that time.
Of the total population (about 900), Mrs. Stene gathered information on 323 individuals comprising
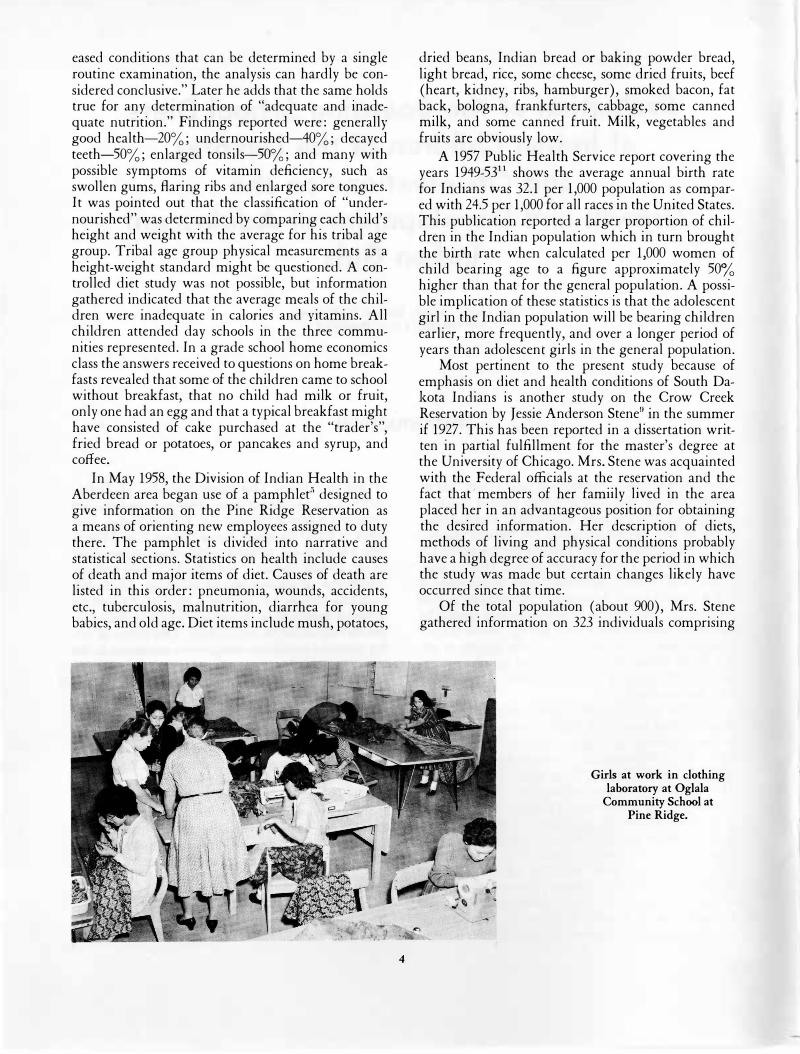
Girls at work in clothing laboratory at Oglala
Community School at Pine Ridge.
67 families living on the reservation. Adults (21 years of age and above) included 131 individuals. Of 192 children only 16 were under 2 years of age. The remaining children were in three groups-pre-school, school age, and over 18 years of age-with approximately one-third in each group.
Information was obtained by use of a comprehensive questionnaire which the investigator completed in the homes by asking questions of an adult in the family and by making personal observations. Adults in about one-fourth of the families visited did not speak English so it was necessary to have an interpreter during the family interview. To verify and supplement information obtained at the homes, Mrs. Stene· studied official records on family and medical histories which were made available to her. She also consulted storekeepers as to buying practices, the Agency Issue Clerk as to "Ration Rolls", government physicians as to health and home conditions and teachers in regard to cleanliness and physical condition of children in school. Some reference was made to a boarding school, which was probably the school at Pierre, in connection with health of the children, but no mention was made of any school feeding program.
At the time of the study the "Ration Roll", with some exceptions, was limited to the older Indians with no other means of obtaining subsistence. Rations, issued monthly, included the following: beef, 25-40 pounds; salt pork instead of beef twice a year, 10 pounds; flour or hardtack (alternated), 15 pounds; sugar, 2 Yz pounds; coffee, 2 Yz pounds; rice or beans (alternated), 2Yz pounds; baking powder, � pound; and a 15-pound bag of cornmeal, if subsistence ran out before the next ration issue.
The author considered that both �'faulty diet" and "faulty food habits" contributed to the malnutrition observed. Of 94 children between 1 and 12 years of age, only 38 drank milk, and of 68 children under 7 years of age, 46 were drinking coffee. In 48 families children had candy after they were a year old and in 26 families infants of less than a year were given candy.
Adequacy of the diets was classified in the following descending order: 1-those containing meat or eggs and small amounts of milk, vegetables and fruits; 2-similar to No. 1 but lacking either vegetable or fruit; 3-those containing bread, coffee, meat, and potatoes or beans; and 4-those consisting chiefly of bread and coffee. It is probable that diets in the first two categories included bread also. Only five families with a total of 10 children had diet 1: 19 families with 44 children diet 2; 28 families with 106 children diet 3 · ' and 15 families with 32 children diet 4.
5
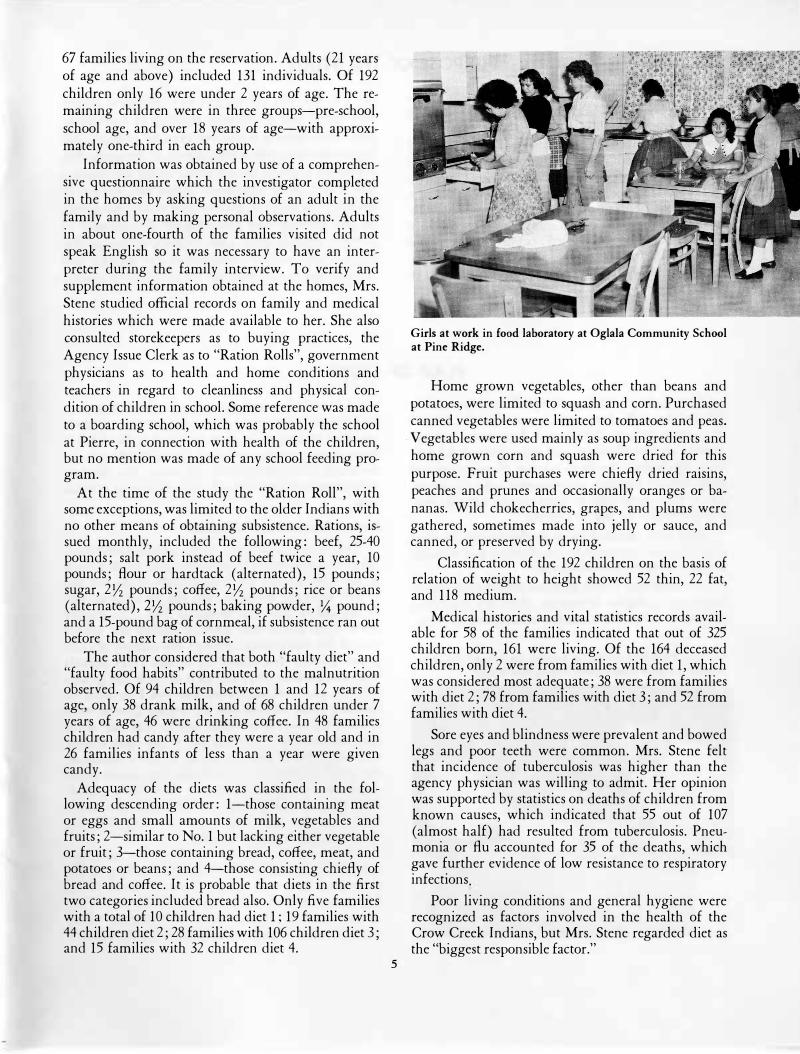
Girls at work in food laboratory at Oglala Community School at Pine Ridge.
Home grown vegetables, other than beans and potatoes, were limited to squash and corn. Purchased canned vegetables were limited to tomatoes and peas.
· Vegetables were used mainly as soup ingredients and home grown corn and squash were dried for this purpose. Fruit purchases were chiefly dried raisins, peaches and prunes and occasionally oranges or bananas. Wild chokecherries, grapes, and plums were gathered, sometimes made into jelly or sauce, and canned, or preserved by drying.
Classification of the 192 children on the basis of relation of weight to height showed 52 thin, 22 fat, and 118 medium.
Medical histories and vital statistics records available for 58 of the families indicated that out of 325 children born, 161 were living. Of the 164 deceased children, only 2 were from families with diet 1, which was considered most adequate; 38 were from families with diet 2; 78 from families with diet 3; and 52 from families with diet 4.
Sore eyes and blindness were prevalent and bowed legs and poor teeth were common. Mrs. Stene felt that incidence of tuberculosis was higher than the agency physician was willing to admit. Her opinion was supported by statistics on deaths of children from known causes, which indicated that 55 out of 107 ( almost half) had resulted from tuberculosis. Pneumonia or flu accounted for 35 of the deaths, which gave further evidence of low resistance to respiratory infections.
Poor living conditions and general hygiene were recognized as factors involved in the health of the Crow Creek Indians, but Mrs. Stene regarded diet as the "biggest responsible factor."
PURPOSE OF THE STUDY
This study, which deals with the nutrient intake of Indian boarding school children, was carried out in conjunction with a larger study in which South Dakota State University cooperated with the National Institutes of Health and the Indian Health Division of the United States Public Health Service. Objectives of the study as a whole were: (a) observe effect of a supplement of di-calcium phosphate on prevention of dental caries; (b) obtain information on nutritive value of boarding school diets; ( c) obtain height and weight data for consecutive periods that might be used for developing standards for Indian children of
the Dakotas; and ( d) attempt to relate rate of growth and dental and periodontal findings to nutrient intake. This report as it concerns the total group of children deals only with dietary aspects of the study. But, because of a special interest of one of the investigators (M. T .B.), in the adolescent Indian girl, there is induded in addition to dietary data some information on the physical and physiological development of 12-to-14 year-old girls. Later reports, to appear elsewhere, will present observations on heights and weights and dental findings for all children studied.
PLAN OF STUDY
Eight Indian boarding schools of the Dakotas were selected for study. Four were operated by the Bureau of Indian Affairs (BIA) and four were mission schools. In two schools of each type, diets of children were supplemented with di-calcium phosphate mixed with sodium chloride incorporated into the bread. These were designated as experimental schools, with the other four serving as contols.
Data were obtained through observations at meal time on food consumed by the children and through inventories of the foods available.
The boarding school situation afforded an opportunity for a degree of control often not attainable in dietary studies. But a number of variables are recog-
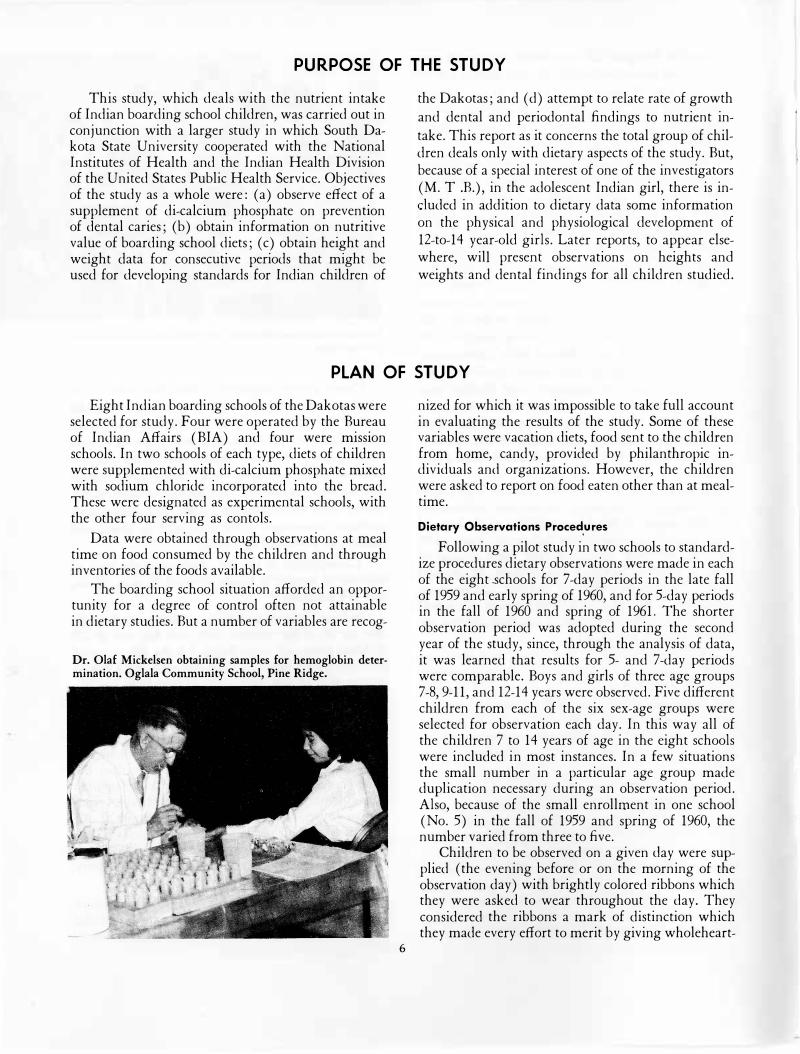
Dr. Olaf Mickelsen obtaining samples for hemoglobin determination. Oglala Community School, Pine Ridge.
6
nized for which it was impossible to take full account in evaluating the results of the study. Some of these variables were vacation diets, food sent to the children from home, candy, provided by philanthropic individuals and organizations. However, the children were asked to report on food eaten other than at mealtime. Dietary Observations Proced.ures
Following a pilot study in two schools to standardize procedures dietary observations were made in each of the eight .schools for 7-day periods in the late fall of 1959 and early spring of 1960, and for 5-day periods in the fall of 1960 and spring of 1961. The shorter observation period was adopted during the second year of the study, since, through the analysis of data, it was learned that results for 5- and 7-day periods were comparable. Boys and girls of three age groups 7-8, 9-11, and 12-14 years were observed. Five different children from each of the six sex-age groups were selected for observation each day. In this way all of the children 7 to 14 years of age in the eight schools were included in most instances. In a few situations the small number in a particular age group made duplication necessary during an observation period. Also, because of the small enrollment in one school (No. 5) in the fall of 1959 and spring of 1960, the number varied from three to five.
Children to be observed on a given <lay were supplied ( the evening before or on the morning of the observation day) with brightly colored ribbons which they were asked to wear throughout the day. They considered the ribbons a mark of distinction which they made every effort to merit by giving wholeheart-
Bun time at St. Francis Mission School.
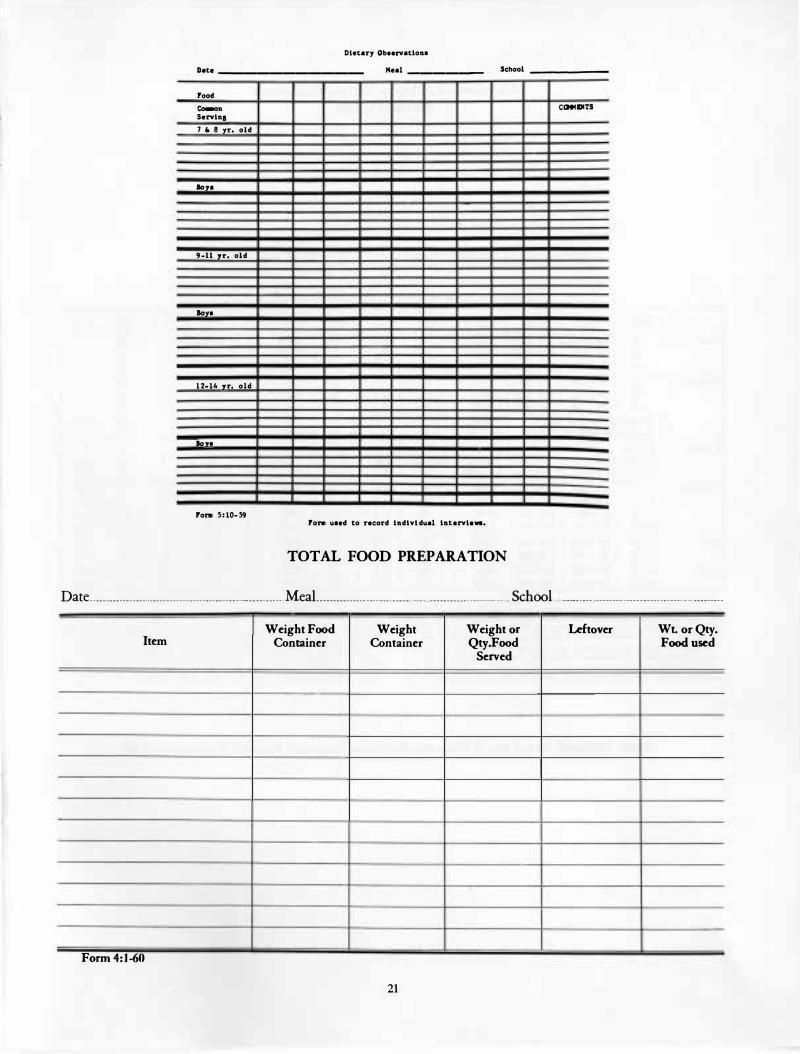
ed cooperation. Ribbons served as a means of identification and also as a reminder to the children that they were to see the nutrition investigator immediately after each meal to report on what they had eaten. At this time they were also to report anything eaten between meals. The report was given in terms of number of servings of each item of the meal, average weights of which were determined. A mean number of servings for the five cJ:iildren of each sex-age group was then computed for use in nutrient evaluation. Information on kinds and amounts of ingredients of mixed dishes and total yields of cooked food from recipes used was obtained in the kitchen during preparation of meals as a basis for computing nutrients of servings of items of this type.
In addition to these procedures, an effort was made to obtain data for nutrient evaluation of diets by use of the inventory method. A yearly inventory was first attempted, but did not prove satisfactory due to lack of conformity in keeping records. Application of this method in the second year of the study during the week when observations were being made in the dining room proved more satisfactory, and could be used as a rough check on dining room observations. Standard food composition tables were used for estimating nutrient values of servings of both· single foods and mixed dishes. The coded data were transferred to IBM cards and calculations were carried out by an electronic computer. During the 1959-1960 study aliquots of the mean quantity of the different food items consumed each day by groups of five children of each s.ex-age classification were made into weekly composites for chemical analysis. Samples were analyzed for protein fat, total ash, calcium and phosphorus.
7
Other Observations on 12-14 Year-Old Girls*
Heights and Weights. Height and weight measures in this report were obtained cooperatively With personnel of the National Institutes of Health and the Indian Health Division of the United States Public Health Service. Procedures were establishe<l by the NIH group and standardized portable equipment supplied by NIH was used. Heights were measured to the nearest quarter inch and weights to the nearest half pound. Measurements were taken with subjects in light clothing and without shoes.
Age at Menarche. With cooperation of school personnel, it was possible to schedule meetings with groups of adolescent girls for the purpose of interviewing them concerning age at onset of menstruation. Further information was secured through dormitory advisors. Data on age at menarche was thus obtained on 259 girls residing in six of the schools under study.
Hemoglobin. Hemoglobin levels were determined by the National Institutes of Health on the basis of an approximate 10% sampling of the total group of children in four schools and data was made available to the authors on 133 of the 12-14 year-old girls. Drabkin's method2 which utilizes standard solutions considered both stable and accurate for this purpose was employed. It is recommended for clinical hemoglobinometry by the United States armed services medical group.
Results and Discussion
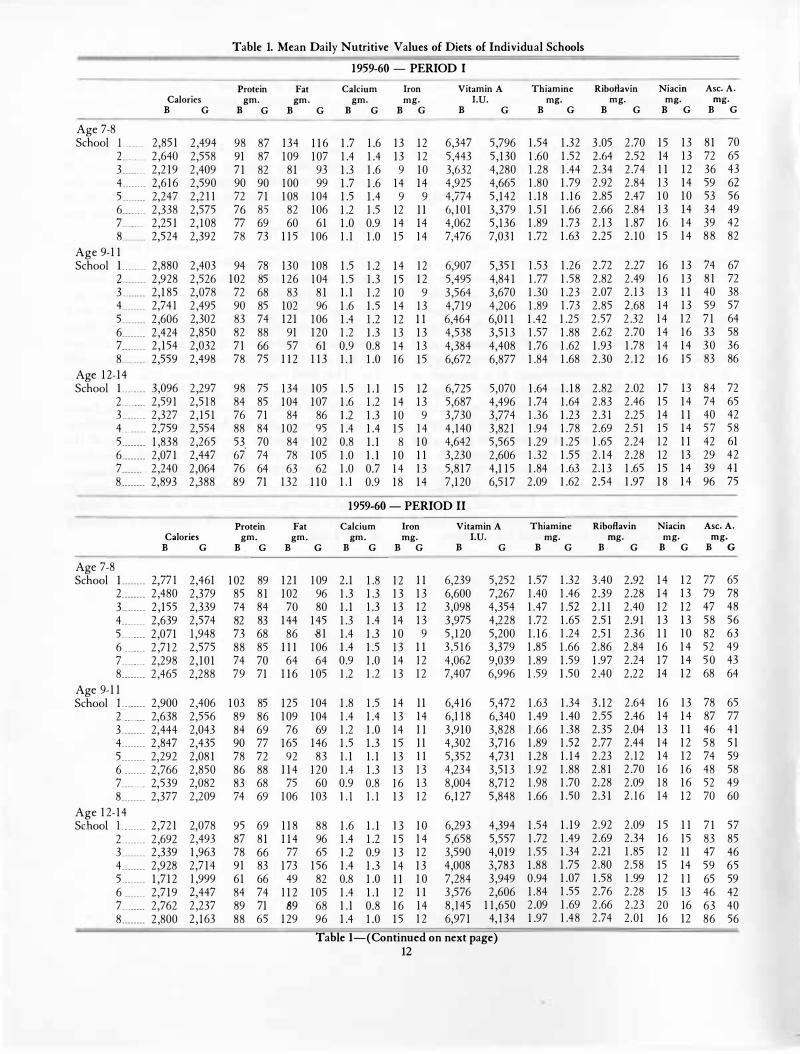
Dietary Observations. Table 1 presents estimated mean daily nutritive values of diets of the individual schools based on mealtime observations. Table 2 gives mean values by age and period for all 8 schools. Percent of total calories derived from each of the organic nutrients is given in table 3. Table 4 records data obtained by chemical analyses.
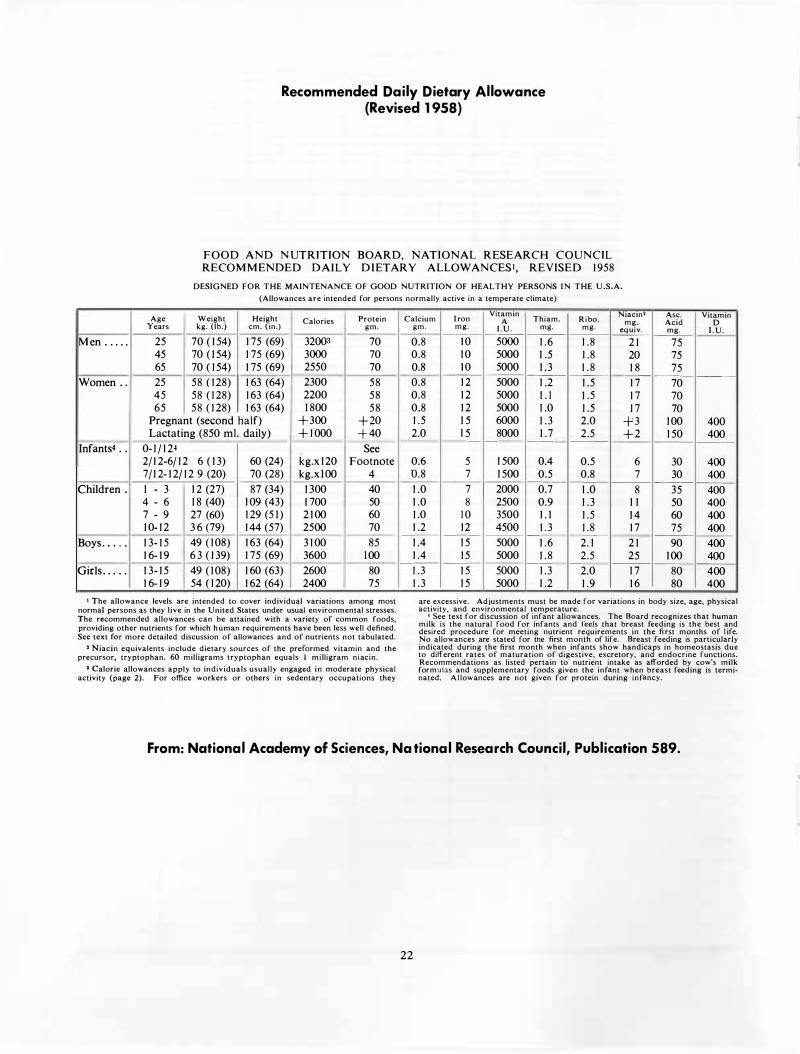
Diets of the 7-8 year-old group both years of the observations approximated, equaled or exceeded the NRC Recommended Allowances (see appendix) for calories and all nutrients with the exception of ascorbic acid, which was frequently below the recommended amount in a number of the schools. Larger numbers of diets failed to reach recommended amounts for older groups particularly the girls. Ascorbic acid was below the recommended amounts in diets of 12-14 year-old girls in all eight schools both years of the study.
While ascorbic acid levels below the NRC Recommended Allowances were most frequently observed,
*Data obtained from a thes1� bv Margaret Talcott Boedeker in partial fulfillment of requirements for the M.S. <legree.
diets of older groups, especially girls, were below recommendations in a number of respects. Table 5 indicates percentages of NRC Allowances furnished by the diets. The frequent failure of 1 2-14 year-old Indian girls to meet dietary recommendations is in line with studies of non-Indian girls of this age group. There is much concern over quality of diets of teenage girls; many of whom will be undergoing the stress of child bearing in a few years.
While the NRC Recommended Daily Dietary Allowances furnish a useful yardstick for evaluation of diets, they are liberal and have been considered a �hir_d _higher than actual needs of most normal,healthy md1v1duals. Recommendations for ascorbic acid in particular are regarded by some a�thorities as well above the minimal requirement for health. However, optimal levels for children have not been established a-?d today _we are more concerned with providin� diets that will promote the highest level of health than �ith merely adequate diets. With this as an objective, 1t would seem desirable for some schools to seek to increase consumption of citrus fruits and vitamin C rich vegetables.
As might be expected, nutritive values based on inventories were usually somewhat higher than values based on data obtained through observation at mealtim�. Value� ?ased on records obtained during the penods of dmmg room observations are in table 6.
. Th_e mean i:ercentage of calories derived from protein did not differ greatly among diets of the eight schools ( table 3) . Also little difference was noted among age groups. There was a wider variation for fat and carbohydrates, with a range among the eight schools <?f fat calories from 24% to 44% for 1959-60 observat10ns and 25% to 45% for 1960-61 observations. Lowest percentages for fat were found in diets of school 7. This was true for all three age groups. Cal-
Teenage girls at lunch, BIA Indian School at Wahpeton, North Dakota.
8
ories derived from carbohydrates ranged from 43% to 63% and 36% to 63% for the two observation periods respectively, with highest values occurring in school 7. Higher levels of carbohydrate were associated with high consumption of cereal products.
The mean estimated and analyzed values for protein and calories ( with the exception of calorie values for the 7-8 year-old girls) did not differ much, but all estimated fat values were considerably higher than the analyzed. This might be expected, since the samples of meat on which the figures in the standard food table used are based had higher fat content than meats as they are purchased and served today.
In estimating calcium content of diets, no account was taken of di-calcium phosphate added to the bread of the experimental schools, since in order to avoid bias in evaluating the overall results, the identity of the experimental schools was not generally known to the investigators. One person was made responsible for selecting schools to receive the small bags of salt containing di-calcium phosphate. Estimated calcium values of diets of the two types of schools differed only with variations in natural sources of calcium in the diets. Phosphorus was not estimated, but analyzed values for both calcium and phosphorus, as was anticipated, were always higher for experimental schools than for control schools.
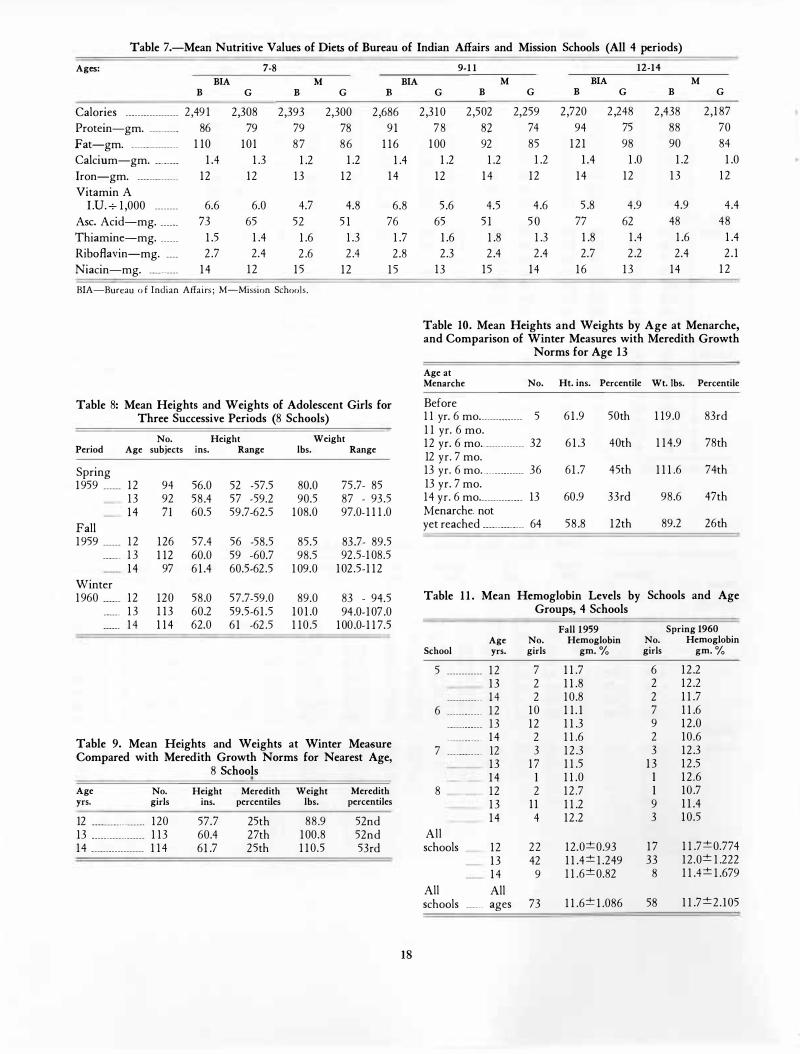
Table 7 shows mean calories and nutrients per day for all four periods in diets of BIA schools compared with mission schools. Largest differences occurred in fat, vitamin A and ascorbic acid levels of the diets which were lower in the mission schools. This is ex� plained chiefly by less frequent inclusion of meat and smaller variety of fruits and vegetables in diets of mission schools. Citrus fruits in particular were served less �r�quently in mission schools, breakfast usually cons1stmg of a cereal, bread and butter and milk. As can be seen by calcium levels, both types of schools provided liberal amounts of milk.
Milk and bread were important sources of protein in diets of mission schools. Both bread and cereal consumption was high in mission schools. Bread baked in these schools was often of superior quality. Excellent use was made of donated fat-free milk, dried eggs and sometimes cheese in preparation of bread. Much of the bread was graham or whole wheat, which also contained dark molasses.
It is thought that lower nutritive value of diets of mission schools as compared with BIA schools can be attributed to a considerable extent to a difference in amount of money available for purchase of food.
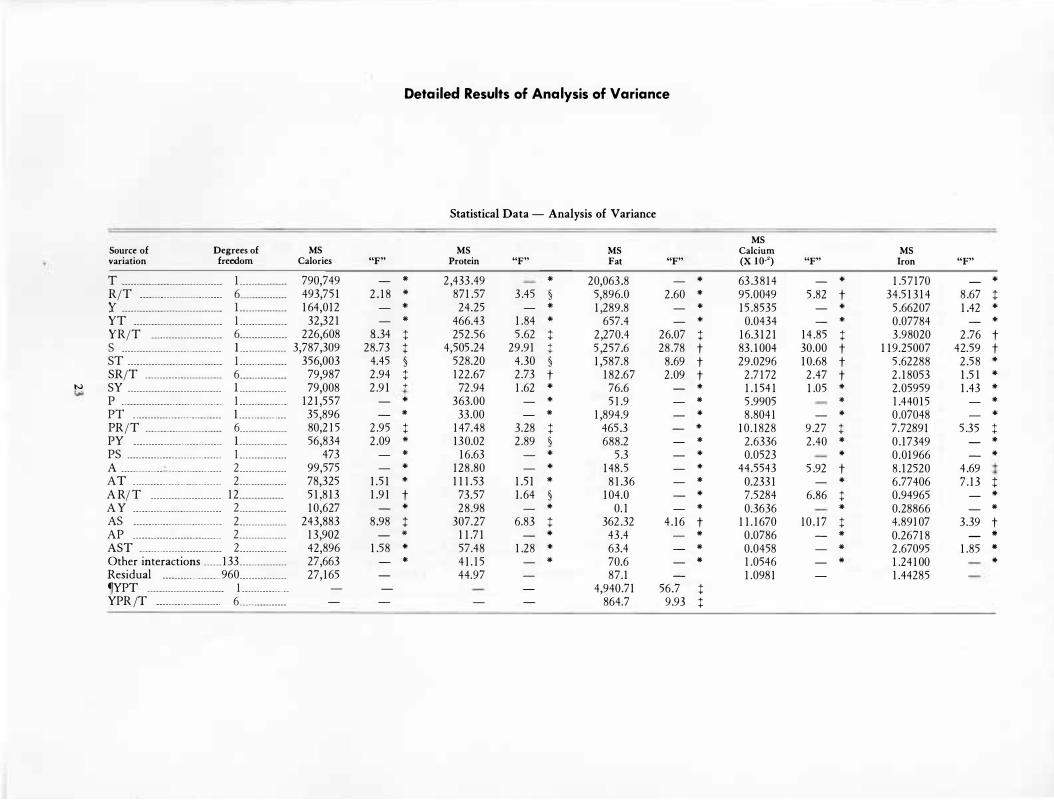
Analysis of Variance*. An analysis of variance was made to test significance of variations in nutritive *Anal yses were made in the statistical laboratory of Iowa State Univer
sity under direction of Dr. Donald K. Hotchkiss.
I -
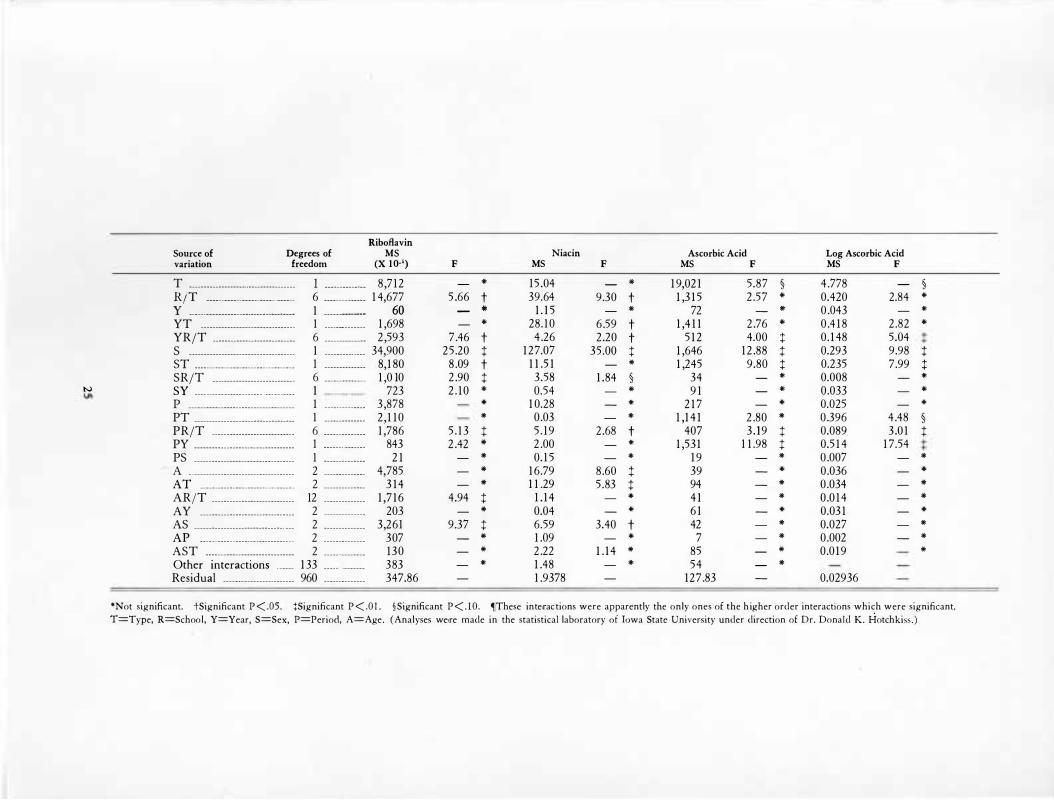
values of the diets. Results of the statistical treatment of data are found in the appendix. Differences observed between the two types of schools, BIA and mission, were not significant, but for schools within a type differences were significant for iron, thiamine and niacin at the 1% level of probability and for calcium and riboflavin at the 5% level. Variations in nutritive value of diets for the two years were not significant, but interaction of year and type of school showed significant differences for thiamine ( 1 % level) and niacin (5% level). For interaction of year and schools within a type, variations were highly significant for calories, protein, fat, calcium, riboflavin, and ascorbic acid, and significant at the 5% level of probability for iron and niacin.
Sex differences were significant for calories and all nutrients at the 1 % level, with the exception of fat and iron, which were significant at the 5% level. Interaction of sex and type of school indicated significant variations for vitamin A and ascorbic acid (1 % level) and fat, calcium and riboflavin (5% level) and the interaction of sex and schools within a type for calories, thiamine and riboflavin (1% level) and protein, fat and calcium (5% level). No significant differences were found for the sex-year interaction. There were no ·significant differences between periods, or for interaction of period and type of school, but interaction of period and schools within a type showed significant variations for all nutrients at the 1% level, with the exception of vitamin A and niacin, which differed significantly at the 5% level.
Age differences were significant for iron and niacin at the 1 % level and for calcium at the 5% level. Significant variations were found for the age-sex interaction at the 1 % level for calories, protein, calcium, thiamine, and riboflavin and at the 5% level for iron and niacin. Interaction between age and type of school revealed significant differences for niacin ( 1 % level) and thiamine (5% level) , and the interaction between age and schools within a type for calcium and riboflavin (1 % level) and calories (5% level) . Age-year and age-period interactions indicated that variations were not significant for any of the nutrients.
Height and Weights of 12-14 Year-Old Girls. Table 8 records heights and weights for three sucessive seasons of 12-, 13- and 14-year-old girls enrolled in the eight boarding schools. Increments in height from one age level to another were approximately 2 inches and in weight 10 to 12 pounds. A greater increase in both heights and weights occurred in 12- and 13-yearold groups than in the 14-year-old during a nine months period. The increases in height were more marked at the earlier ages than were increases in
9
weight .. Contrary to expectations, based on the probability that home diets would be less adequate than boarding school diets, no slowing up of growth was noted during the summer months.
Twelve year old girls gained 1.4 inches in height and 5.5 pounds in weight during the summer months and only 0.6 inch in height and 3.5 pounds in weight during the fall months. Corresponding gains for 13-year-old girls were 1.6 inches in he�ght and 8 pounds in weight during the summer and 0.2 inches in height and 2.5 pounds in weight during the fall. For 14-yearold girls, gains were 0.9 inches in height and 1 pound in weight between April and September and 0.6 inches in height and 1.5 pounds in weight between September and January.
Since there are no published "standards" for growth and physical condition of Sioux Indian children for comparison, the percentile rating of the Dakota adolescent Indian girls was determined by using Stuart-Meredith norms1 0 as "standards." As indicated in table 9, heights fall in the 25th and 27th percentiles which characterizes the girls as "short and moderately short." However, weights place them in the 52nd to 53rd percentiles or average weight zone. But, since they were below average in height, they were heavier than non-Indian girls of like age when weight was related to height, and therefore were of a stockier build. They were taller than adolescent Papago13 and
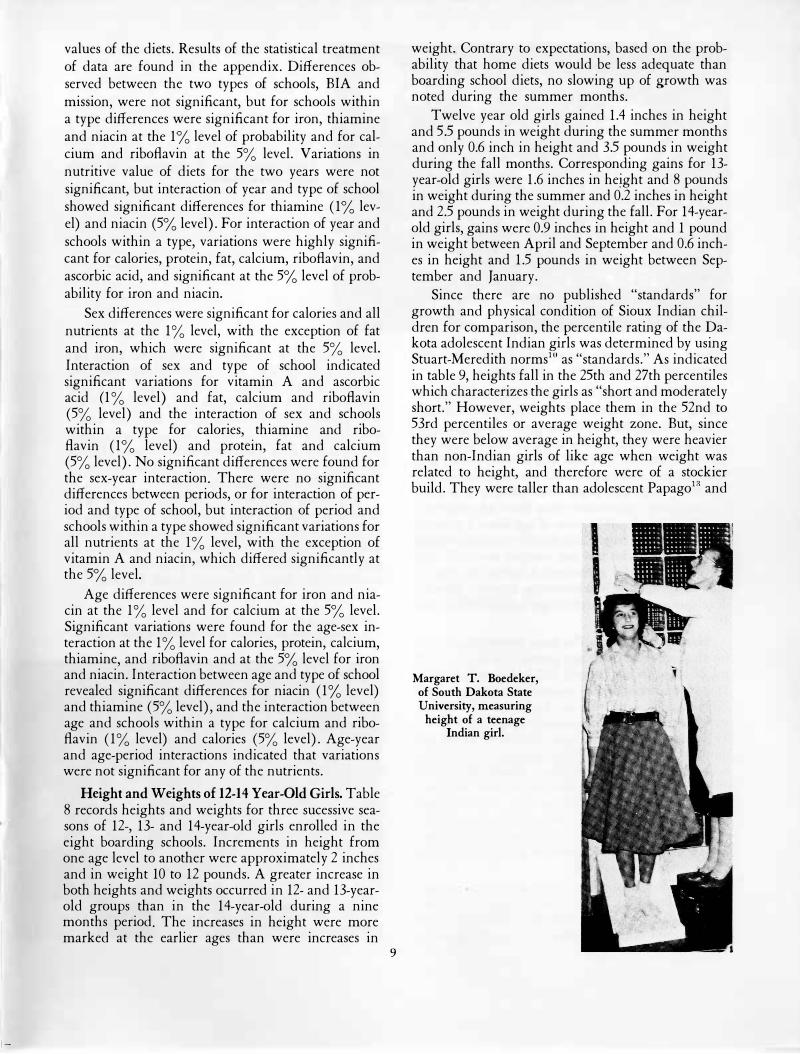
Margaret T. Boedeker, of South Dakota State University, measuring
height of a teenage Indian girl.
Navajo3 Indian girls. They were lighter than the Papago girls but heavier than the Navajos.
Relation of Age at Menarche to Physical Measurements. The age at menarche was found to be similar to that reported for non-Indian girls1
:!. A larger number began to menstruate at about 13 years of age. Relationship between physical and sexual development observed by Gschneider et al.4 was also observed in this study. Girls who began to menstruate at an early age were taller and heavier than those who menstruated later. At 12 and 13 years of age there is a spread of 4 to 6 inches in height and 16 to 26 pounds in weight between those who had not reached menarche and the few girls who menstruated before 11 year� 6 months of age. This relationship between physical development and menarcheal age is indicated in table 10.
Hemoglobin Levels. The mean hemoglobin values for the combined three age groups was 11.6 gm/100 ml. of blood in the fall and 11.7 in the spring ( table 11). Hemoglobin levels reported for Papago13 and Navajd1 adolescent girls are higher than levels observed in this study. The mean hemoglobin level for 53 Papago girls was 12.5 gm/100 ml. of blood a1:d only 7% of a group of Navajo girls had hemoglobm below 12.3 gm./100 ml. of blood. Hemoglobin levels of 50% of the Navajo girls were higher than 14.2 gm./ 100 ml. of blood. Geographic location, involving high elevation, may explain in part the higher hemoglobin levels of the Papago and Navajo Indian girls. However, it is likely that a number of factors contributed to the differences observed.
In adults hemoglobin levels are often lowered through blood loss. With adolescent girls menstrual loss could influence hemoglobin concentration adversely. Data on hemoglobin and age at menarche
10
Young Indian boys at mealtime at St. Paul's, Marty, South Dakota.
was examined to determine whether the latter had exerted any influence on the hemoglobin lev.el,. b�t no clear cut relationship could be found. This 1s m agreement with observations of Gschneider et �/4 . who reported that the hemoglobin levels for earlier maturing girls were essentially the same as for those who matured later. There was likewise no evident relationship between iron and/ or protein content of current diets and hemoglobin levels.
It is hoped that results of this study will be of interest and value to those responsible for feeding of children in Indian boarding schools and to others seeking information on development of �dolescent girls in the particular segment of our soCiety represented by the Sioux Indians of South Dakota.
A group of Indian children at St. Francis Mission School.
SUMMARY
Information was obtained on kinds and amounts of foods consumed by children of both sexes of three age groups, 7-8, 9-11, and 12-14 years in eight boarding schools, four BIA and four mission schools. The study covered two 7-day periods during the school year of 1959-60 and two 5-day periods during 1960-61. One period each year was in the fall and one in the spring. Standard food tables were used to estimate nutrient intakes, and chemical analyses. were made on food composites for certain nutrients.
Diets of 7-8-year-old children, in both years of observations, approximated, equalled or exceeded the NRC Recommended Allowances for calories and all nutrients with the exception of ascorbic acid, which was frequently below the recommended amounts. While ascorbic acid levels below the NRC Recommended Allowances were most often observed, diets of older groups, especially the 12-14 year-old girls, were also below recommendations in a number of other respects. The frequent failure of adolescent Indian girls to meet dietary recommendations is in line with studies on non-Indian girls. This is a matter of concern to nutritionists, since many of these girls will soon be undergoing the stresses of pregnancy for which nutritional reserves are needed. While NRC Recommended Allowances are liberal, particular! y with respect to ascorbic acid, nutritional scientists might well question whether the lowest values found in this study approach the optimal for children.
11
An analysis of variance was made to determine significance of nutrient differences observed between types of schools, schools within a type, year, period, age, sex.
Mean heights of 12-14 year-old Indian girls of this study places them in the short classification in relation to Meredith norms, but' weights were near average. This indicates they are of a stockier build than non-Indian girls of like age. Obesity was not commonly observed.
The age at menarche was found to be similar to that of the general population of the United States. Girls who menstruated early were taller and heavier than those in whom sexual maturation occurred at a later age. These observations are in agreement with those of Gschneider et al. on non-Indian girls. Mean hemoglobin values were slighly below 12 grams per 100 ml. of blood, which, at best, can be considered only fair. This level was definite! y lower than that of Papago and Navajo Indian girls. The higher altitude at which the latter live may be an influencing factor that accounts in part for this difference. No explanation of the relatively low hemoglobin levels of the girls included in this study can be offered on the basis of current diets. However, earlier dietary inadequacies may be reflected or a number of unknown factors including a genetic influence may be involved. Further investigation is needed to seek a causative relationship of any kind.
Table 1. Mean Daily Nutritive Values of Diets of Individual Schools
1959-60 - PERIOD I Protein Fat Calcium Iron Vitamin A Thiamine Riboflavin Niacin Ase. A.
Calories gm. gm. gm. mg. LU. mg. mg. mg. mg. B G B G B G B G B G B G B G B G B G B G
Protein Fat Calcium Iron Vitamin A Thiamine Riboflavin Niacin Ase. A. Calories gm. gm. gm. mg. LU. mg. mg. mg. mg. B G B G B G B G B G B G B G B G B G B G
•Fat x 9 plus (dry matter-ash-fat) x 4 . tReflects values of the di-calcium phosphate incorporated in the bread for the experimental schools ( 1 , 3 , 6, 8 ) .
16
Table 5. Per cent of NRC Allowance. (Based on means of 4 observations) Protein Calcium Iron Vitamin A Thiamine Riboflavin Niacin* Ase. A.
Calories gm. gm. mg. I.U. mg. mg. mg. mg. B G B G B G B G B G B G B G B G B G
All All schools ______ ages 73 1 1 .6± 1 .086 58 1 1 .7±2 . 105
18
LITERATURE CITED
1 . BosLEY, BERTLYN, "Nutrition in the Indian health program," Journal American Dietetic Association, 35 : 905, 1959.
2. CROSBY, W. M., JoHN, I. and FuRTH, F. W., "Standardizing a method for clinical hemoglobinometry," U. S. Armed Forces Medical Journal, Vol. V., 693, 1954.
3. DARBY, W. J., C. G. SALISBURY, W. F. McGANITY, H. F. JoHNsoN, E. B. BRIDGFORT, H. R. SANDSTEAD, C. M. ADAMS, M. PoLLARD, E. DALTON, P. McKINLEY, H. H. SMITH, L. TIMECHE, A. K. SrncKELL, H. H. SANDSTEAD, J. A. EFFNER, N. HouK and L. TRACY, "A study of the dietary background and nutriture of the Navajo Indian, I II," "Physical findings, IV," "Biochemical findings, V," "Interpretation." Journal Nutrition, 60 : Supplement 2, 1956.
4. GscHNEIDER, M. P. and RoDERUCK, C. E. "Nutriture of School Girls of Different Physiques," /. Am. Dietetic A. 36 : 22, 1960.
5. JoNz, W. W. and W. J. CARDWELL. "A narrative description of Pine Ridge Reservation." Division of Indian Health, Aberdeen Area, Mimeo., 1958.
6. MAcGREGOR, G. Warriors without weapons. University of Chicago Press, 1946.
7. MALAN, V. D. "The Dakota Indian family." South Dakota Agricultural Experiment Station Bulletin No. 470, 1958.
8. MALAN, V. D. and PowERS, J. F. "The Crow Creek Indian family." South Dakota Agricultural Experiment Station Bulletin No. 487, 1960.
9. STENE, J. A. "Diets, methods of living and physical condition of the Sioux Indians of the Crow Creek Reservation." Unpublished master's thesis, University of Chicago, 1927.
10. STUART, H. C. and MEREDITH, H. V. Use of body measurements in a school health program, Part II. "Methods to be followed in taking and interpreting measurements and norms to be used." American Journal of Public Health 36 : 1373, 1946.
1 1 . U. S. Department of Health, Education and Welfare, Public Health Services Publication No. 531, 1957.
12. U. S. Department of Health, Education and Welfare, Children's Bureau Publication No. 247, 1954. The Adolescent in Your Family.
13. VAVICH, M. G., KEMMERER, A. R. and HrnscH, J. "Nutritional status of Papago Indian children." f. Nutrition 54 : 12 1 , 1954.
19
APPENDIX
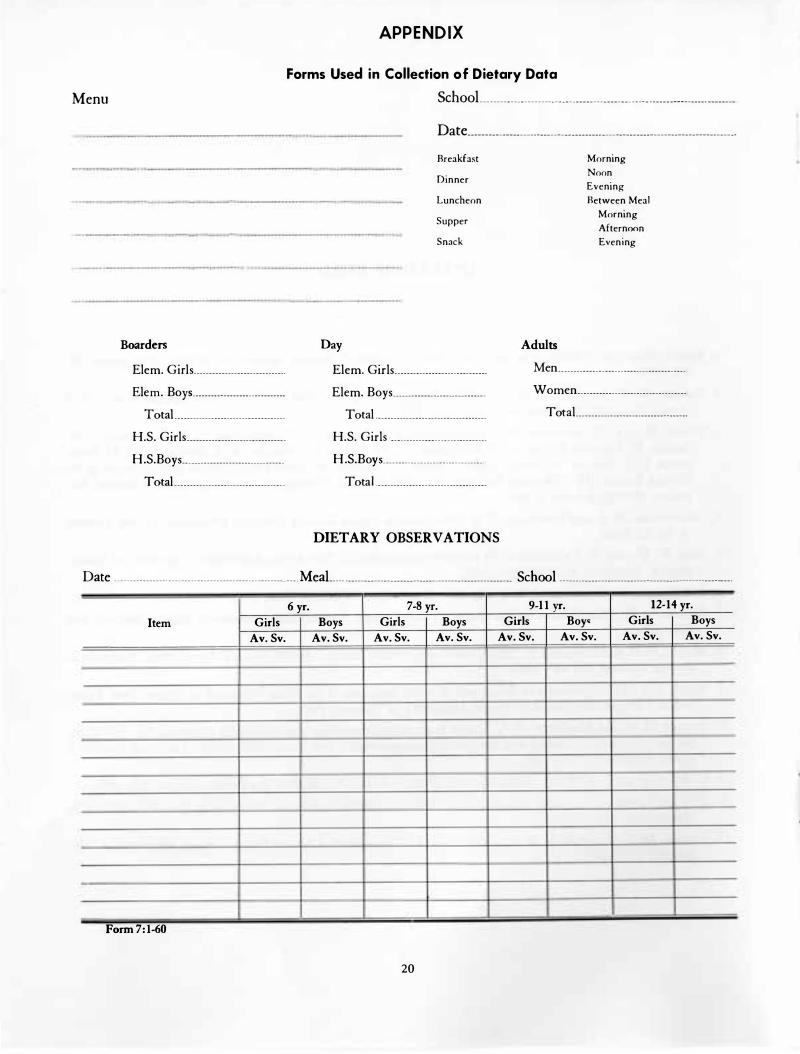
Forms Used in Collection of Dietary Data
Menu School ___ _ _______________________ ______________________ _________________ --------·
Date _____________________________________________________________________________ _
Breakfast Morning
Dinner Noon Evening
Luncheon Retween Meal
Supper Morning Afternoon
Snack Evening
Boarders Day Adults
Elem. Girls _____________________________ _ Elem. Girls _____________________________ _ Men _________________________________________
Elem. Boys _____________________________ _ Elem. Boys _____________________________ _ Women __________________________________ _
Total ___________________________________ _ Total ___________________________________ _ Total ___________________________________ _
1 The allowance levels are intended to cover individual variations among most normal persons as they live in the United States under usual environmental stresses. The recommended allowances can be attained with a variety of common foods, providing other nutrients for which human requirements have been less well defined. See text for more detailed discussion of allowances and of nutrients not tabulated.
2 Niacin equivalents include dietary sources of the preformed vitamin and the precursor, tryptophan. 60 milligrams tryptophan equals I milligram niacin.
2 Calorie allowances apply to individuals usually engaged in moderate physical activity (page 2). For office workers or others in sedentary occupations they
are excessive. Adjustments must be made for variations in body size, age, physical activity, and environmental temperature.
4 See text for discussion of infant allowances. The Board recognizes that human milk is the natural food for infants and feels that breast feeding is the best and desired procedure for meeting nutrient requirements in the first months of l ife. No allowances are stated for the first month of life. Breast feeding is particularly indicated during the first month when infants show handicaps in homeostasis due to different rates of maturation of diges\ive, excretory, and endocrine functions. Recommendations as listed pertain to nutrient intake as afforded by cow's milk formu las and supplementary foods given the infant when breast feeding is terminated. Al lowances are not given for protein during infancy.
From: Nationa l Academy of Sciences, Na tiona l Research Counci l, Publ ication 589.
22
Source of Degrees of MS variation freedom Calories "F"
•Not significant. tSignificant P < .05 . tSignificant P < .O L §Significant P < . IO . �These inte,rac tions were apparently the only ones of the h igher order interactions which were significant. T=Type, R=School, Y=Year, S=Sex, P=Period, A=Age. (Analyses we,re made in the statistical laboratory of Iowa State University under direction of Dr. Donald K. Hotchkiss . )
11
J
1
Acknowledgements
This study was supported largely by a contract (SA-43-ph 2443 ) and a grant (A-3398) from the National Institutes of Health, and the U. S. Department of Health, Education and Welfare.
Recognition is given to Dr. Bertlyn Bosley and to Miss Helen Ger Olson, Division of Indian Health, Department of Health, Education and Welfare for helpful counsel and advice in planning and carrying out this study. The authors also acknowledge with gratitude the cooperation of Dr. Olaf MiGhelsen of the National Institutes of Health (present address Food and Nutrition Department, Michigan State University) in securing data on heights and weights and making available information on hemoglobin levels. Appreciation is expressed for excellent cooperation of the Indian boarding schools.