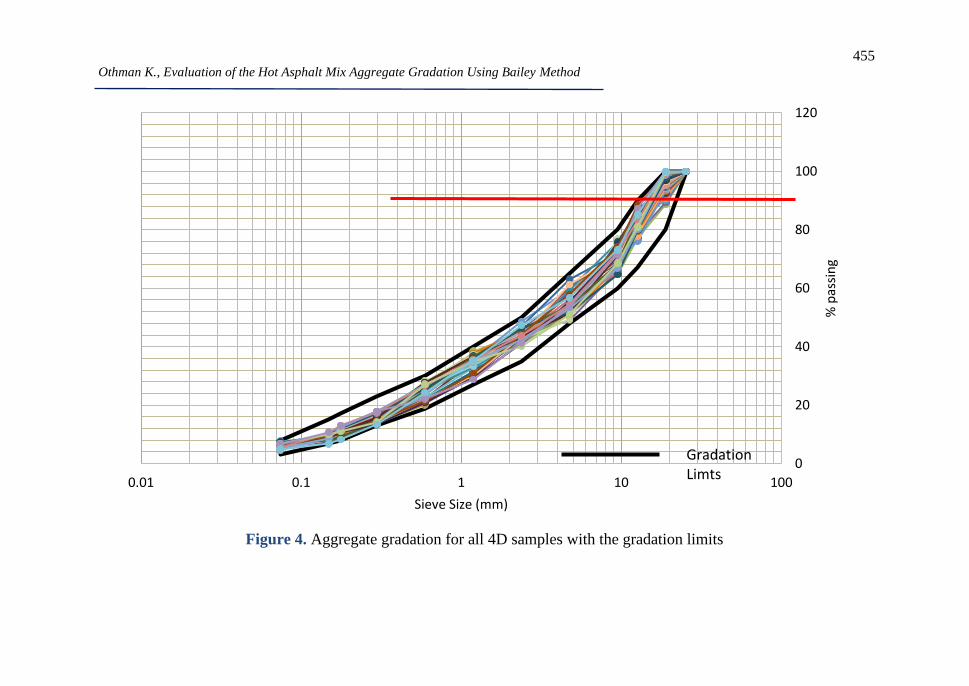
446 Journal of Engineering Sciences Assiut University Faculty of Engineering Vol. 49, No. 4 July 2021 PP. 446 - 475 Evaluation of the Hot Asphalt Mix Aggregate Gradation Using Bailey Method: State-of-the-art Kareem Othman 1,2 1 Civil engineering department, University of Toronto, Toronto, Canada, 35 St George St, Toronto, ON M5S 1A4 [email protected]2 Public works department, Faculty of engineering, Cairo University, Giza, Egypt [email protected]Received 5 April 2021; Revised 17 May 2021; Accepted 23 May 2021 Abstract The selection of the aggregate gradation, in the process of the asphalt mix design, is one of the most critical steps because it accounts for the overall strength of the asphalt mixture in terms of resisting the permanent deformation or rutting. This paper focuses on evaluating the current aggregate gradation selection procedure for the hot asphalt mix (HAM) using the three Bailey ratios. Additionally, this study analyzes, theoretically, the compaction and performance characteristics of the resulting HAM designed using the traditional design procedures which follow the trial-and-error technique in order to have a mix that satisfies the specification range. Results show that 14% of the samples prepared using the traditional technique satisfy the Bailey method guidelines and thus indicate good performance in the field. However, almost 80% of the asphalt mixes are tender asphalt mixes that are prone to segregation in the field, and 6 to 7% of the asphalt mixes are hard to compact.
Transcript
446
Journal of Engineering
Sciences Assiut University
Faculty of Engineering
Vol. 49, No. 4
July 2021
PP. 446 - 475
Evaluation of the Hot Asphalt Mix Aggregate
Gradation Using Bailey Method: State-of-the-art
Kareem Othman1,2
1 Civil engineering department, University of Toronto, Toronto, Canada, 35
St George St, Toronto, ON M5S 1A4
[email protected] 2 Public works department, Faculty of engineering, Cairo University, Giza,
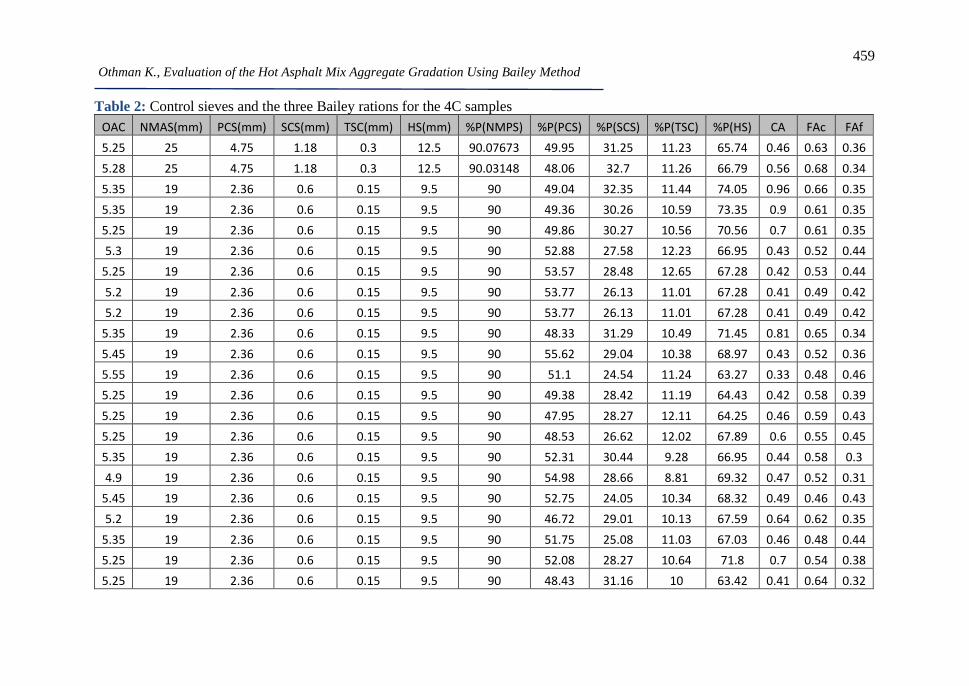
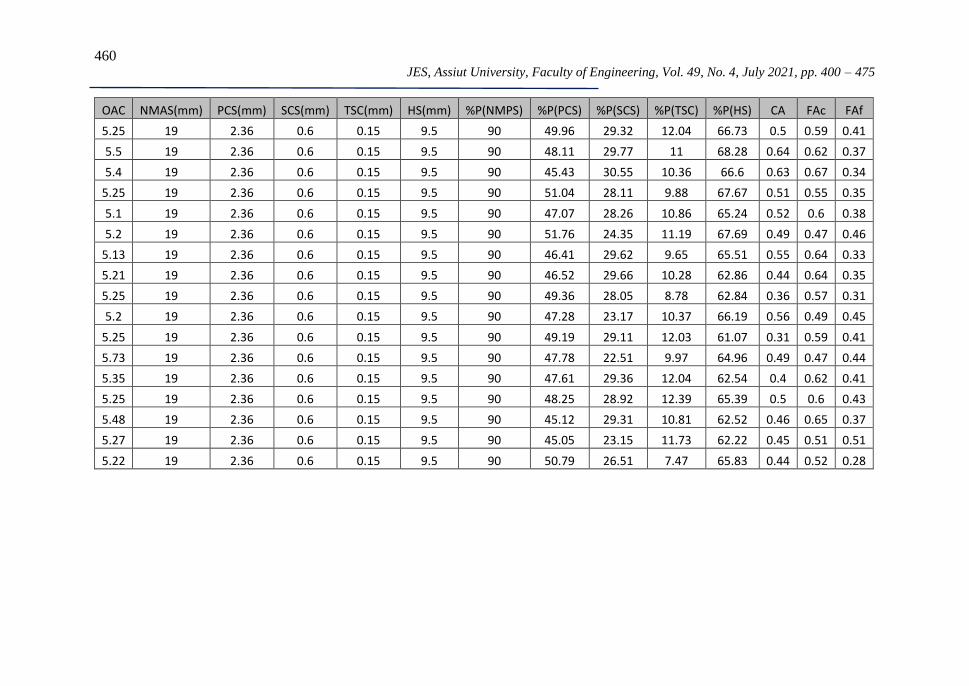
459 Othman K., Evaluation of the Hot Asphalt Mix Aggregate Gradation Using Bailey Method Table 2: Control sieves and the three Bailey rations for the 4C samples
OAC NMAS(mm) PCS(mm) SCS(mm) TSC(mm) HS(mm) %P(NMPS) %P(PCS) %P(SCS) %P(TSC) %P(HS) CA FAc FAf
461 Othman K., Evaluation of the Hot Asphalt Mix Aggregate Gradation Using Bailey Method
2.1 Control sieves:
In the Bailey method, there are three main control sieves to classify the
different particles in the aggregate gradation as shown in Figure 5.
Starting with the Primary Control Sieve (PCS) which can be defined as
the sieve that separates the coarse and fine particles and it is calculated
based on the Nominal Maximum Aggregate Size (NMAS) [[28]] as
follows:
𝑃𝐶𝑆 = 0.22 ∗ 𝑁𝑀𝐴𝑆
The value of 0.22 was adopted from the packing theory as an average of
aggregate diameter ratios that theoretically ranges from 0.15 for rounded
aggregate to 0.29 for flat aggregates. The second control sieve is called
the secondary control sieve (SCS) and the main objective of this control
point is to split the fine part into two further fractions and the SCS is
calculated based on the PCS as follows:
𝑆𝐶𝑆 = 0.22 ∗ 𝑃𝐶𝑆
Finally, the third control point is the Tertiary Control Sieve (TCS) which
is calculated as follows:
𝑇𝐶𝑆 = 0.22 ∗ 𝑆𝐶𝑆
Figure 5. overview of the three control points [8]
2.2 Analysis of the Design Blend
In addition to the previous control points, the Bailey method suggested
three additional ratios for the purpose of evaluating the aggregate blend.
These ratios are used to understand the aggregate gradation based on the
462 JES, Assiut University, Faculty of Engineering, Vol. 49, No. 4, July 2021, pp. 400 – 475
previous control points. These ratios are the Coarse Aggregate Ratio (CA
Ratio), Fine Aggregate Coarse Ratio (FAc), and Fine Aggregate Fine
Ratio (FAf).
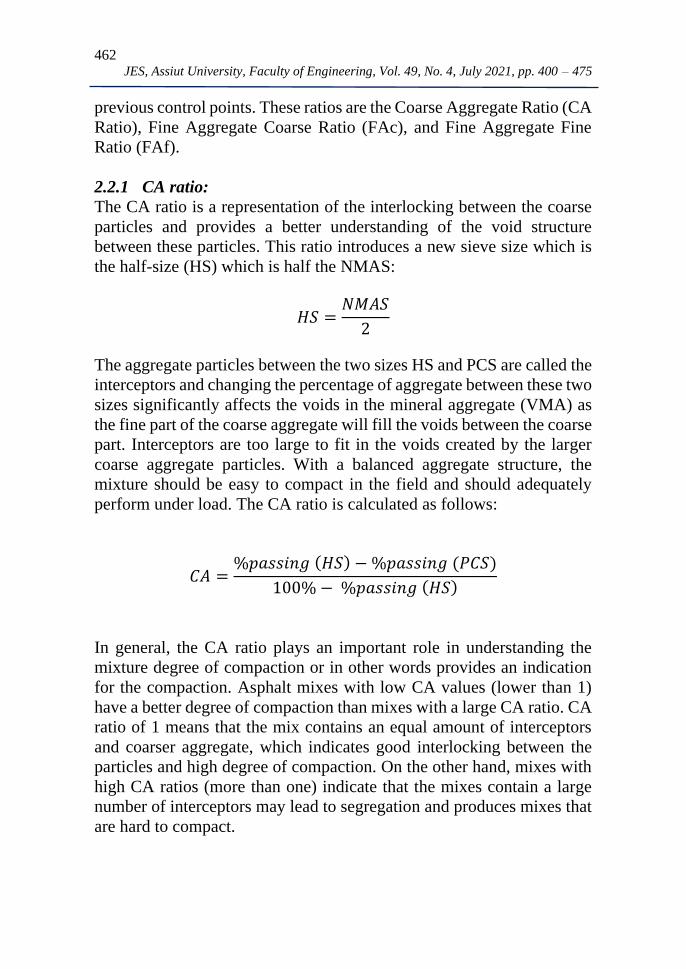
2.2.1 CA ratio:
The CA ratio is a representation of the interlocking between the coarse
particles and provides a better understanding of the void structure
between these particles. This ratio introduces a new sieve size which is
the half-size (HS) which is half the NMAS:
𝐻𝑆 =𝑁𝑀𝐴𝑆
2
The aggregate particles between the two sizes HS and PCS are called the
interceptors and changing the percentage of aggregate between these two
sizes significantly affects the voids in the mineral aggregate (VMA) as
the fine part of the coarse aggregate will fill the voids between the coarse
part. Interceptors are too large to fit in the voids created by the larger
coarse aggregate particles. With a balanced aggregate structure, the
mixture should be easy to compact in the field and should adequately
perform under load. The CA ratio is calculated as follows:
𝐶𝐴 =%𝑝𝑎𝑠𝑠𝑖𝑛𝑔 (𝐻𝑆) − %𝑝𝑎𝑠𝑠𝑖𝑛𝑔 (𝑃𝐶𝑆)
100% − %𝑝𝑎𝑠𝑠𝑖𝑛𝑔 (𝐻𝑆)
In general, the CA ratio plays an important role in understanding the
mixture degree of compaction or in other words provides an indication
for the compaction. Asphalt mixes with low CA values (lower than 1)
have a better degree of compaction than mixes with a large CA ratio. CA
ratio of 1 means that the mix contains an equal amount of interceptors
and coarser aggregate, which indicates good interlocking between the
particles and high degree of compaction. On the other hand, mixes with
high CA ratios (more than one) indicate that the mixes contain a large
number of interceptors may lead to segregation and produces mixes that
are hard to compact.
463 Othman K., Evaluation of the Hot Asphalt Mix Aggregate Gradation Using Bailey Method
2.2.2 FAc ratio:
Similar to the previous case, voids will be introduced between the
particles of the coarse part of the fine aggregate. Thus, the main objective
of the finer particles is to fill the void between these particles. The FAc
is used to show the ratio of these fractions and it is estimated using the
following equation:
𝐹𝐴𝑐 =%𝑝𝑎𝑠𝑠𝑖𝑛𝑔 (𝑆𝐶𝑆)
%𝑝𝑎𝑠𝑠𝑖𝑛𝑔 (𝑃𝐶𝑆)
The desired FAc value should be around 0.5, as high values of FAc
(higher than 0.5) indicate that the mix contains a large amount of fine
particles. On the other hand, the very low values of FAc (lower than 0.5)
indicate that the mix is not uniformly graded because of the low fine
aggregates in the mix.
2.2.3 FAf ratio:
The FAc is the most important ratio for understanding the mix air voids
and the required binder content because it focuses on the fine particles
in the mix, including the filler, and it is calculated using the following
equation:
𝐹𝐴𝑓 =%𝑝𝑎𝑠𝑠𝑖𝑛𝑔 (𝑇𝐶𝑆)
%𝑝𝑎𝑠𝑠𝑖𝑛𝑔 (𝑆𝐶𝑆)
2.2.4 Effect of the FAc and FAf ratio:
High values of FAc and FAf indicate that the mix contains excessive
amount of fine particles. If the ratio of any of these two ratios goes higher
than 0.5, it indicates that the mix will show a “hump” in the sand portion
of the gradation curve of a 0.45 gradation chart, which is generally
accepted as an indication of a potentially tender mixture. On the other
hand, if the ratios are lower than the guidelines, the gradation is not
uniform. These mixtures are generally gap-graded and have a “belly” in
the 0.45-power grading chart, which can indicate instability and may
lead to compaction problems.
2.2.5 Summary of the ratios:
- CA ratio: this ratio describes how the coarse particles of the
aggregate are packed together and how these particles compact the
464 JES, Assiut University, Faculty of Engineering, Vol. 49, No. 4, July 2021, pp. 400 – 475
fine aggregate portion of the aggregate blend that fills the voids
created by the coarse aggregate.
- FAc ratio: this ratio shows how the coarse particles of the fine
particles are packed together and how these particles compact the
material that fills the voids created.
- FAf ratio: this ratio shows how the fine portion of the fine particles
are packed together.
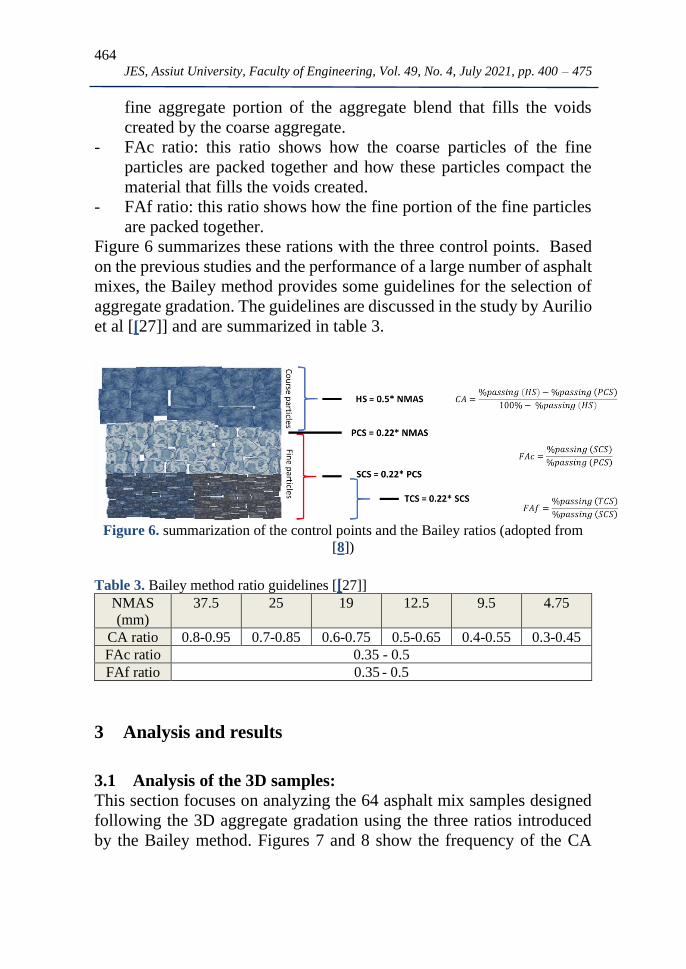
Figure 6 summarizes these rations with the three control points. Based
on the previous studies and the performance of a large number of asphalt
mixes, the Bailey method provides some guidelines for the selection of
aggregate gradation. The guidelines are discussed in the study by Aurilio
et al [[27]] and are summarized in table 3.
Figure 6. summarization of the control points and the Bailey ratios (adopted from
[8])
Table 3. Bailey method ratio guidelines [[27]]
NMAS
(mm)
37.5 25 19 12.5 9.5 4.75
CA ratio 0.8-0.95 0.7-0.85 0.6-0.75 0.5-0.65 0.4-0.55 0.3-0.45
FAc ratio 0.35 - 0.5
FAf ratio 0.35 - 0.5
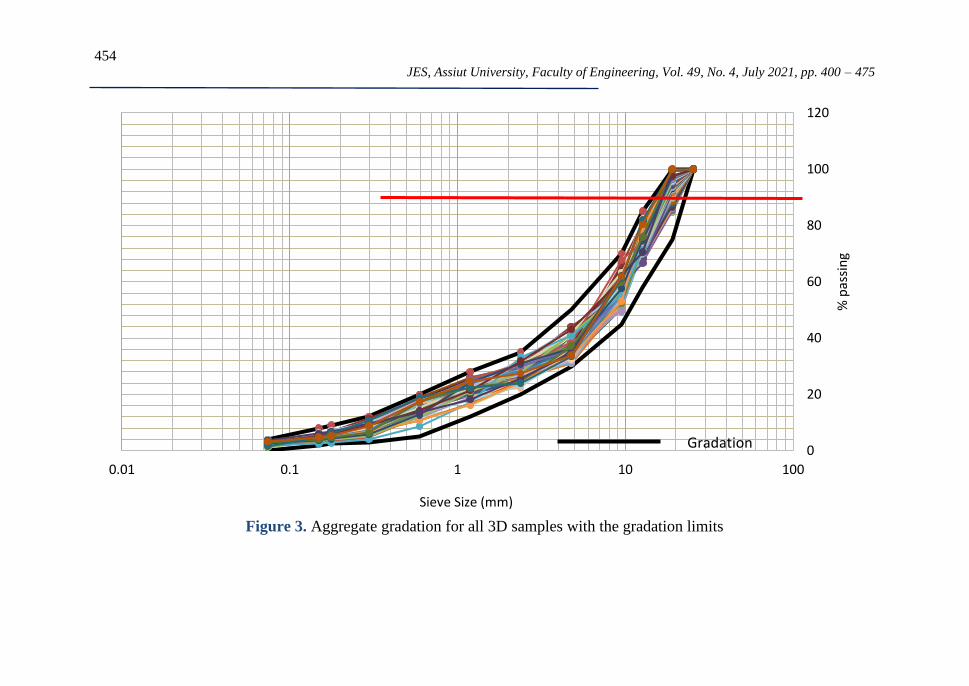
3 Analysis and results
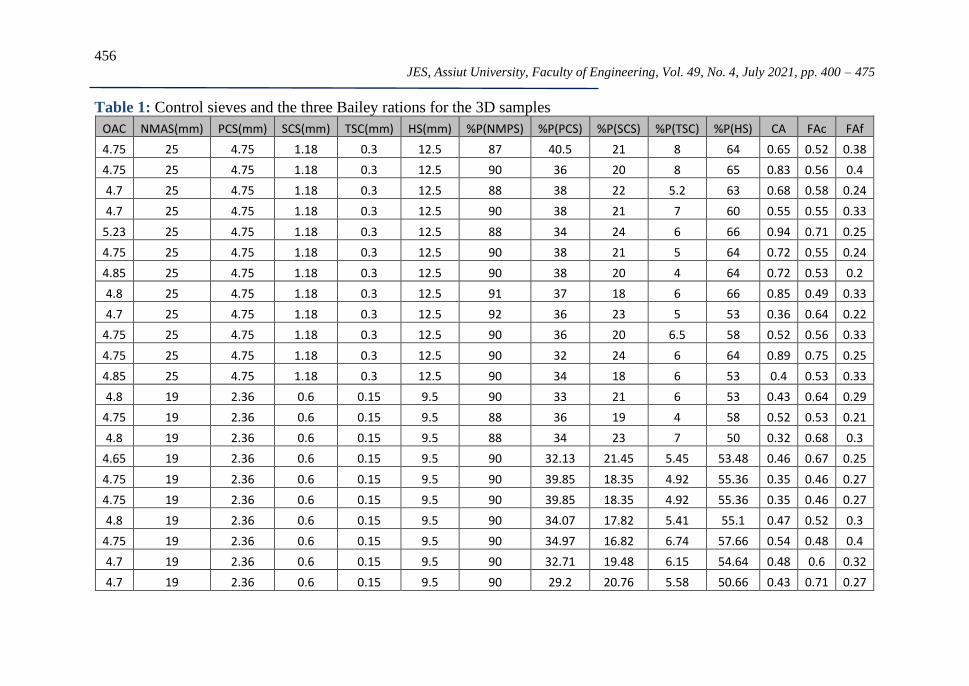
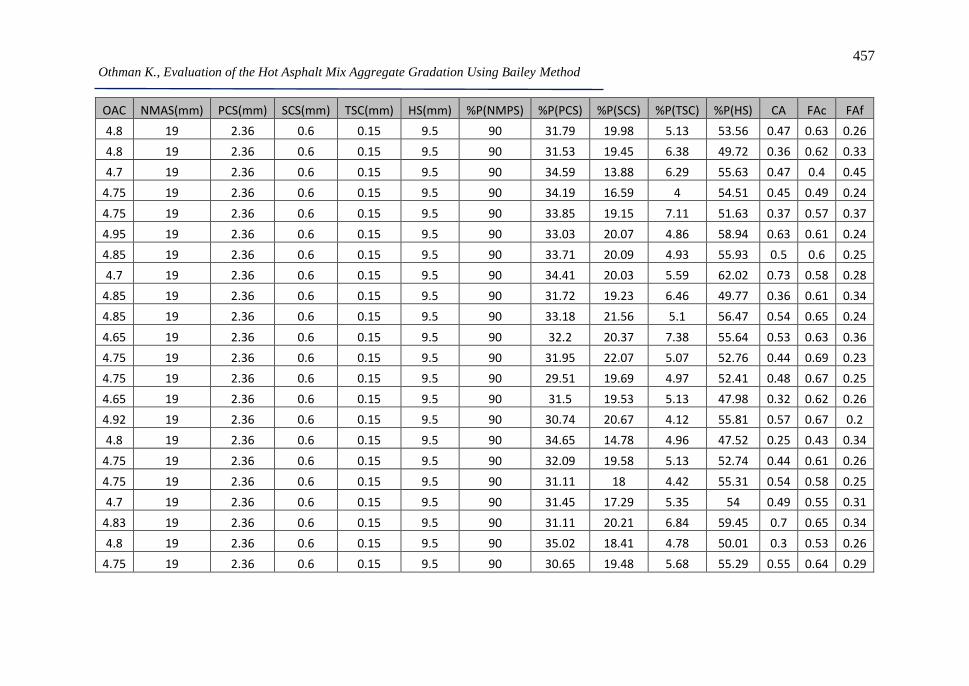
3.1 Analysis of the 3D samples:
This section focuses on analyzing the 64 asphalt mix samples designed
following the 3D aggregate gradation using the three ratios introduced
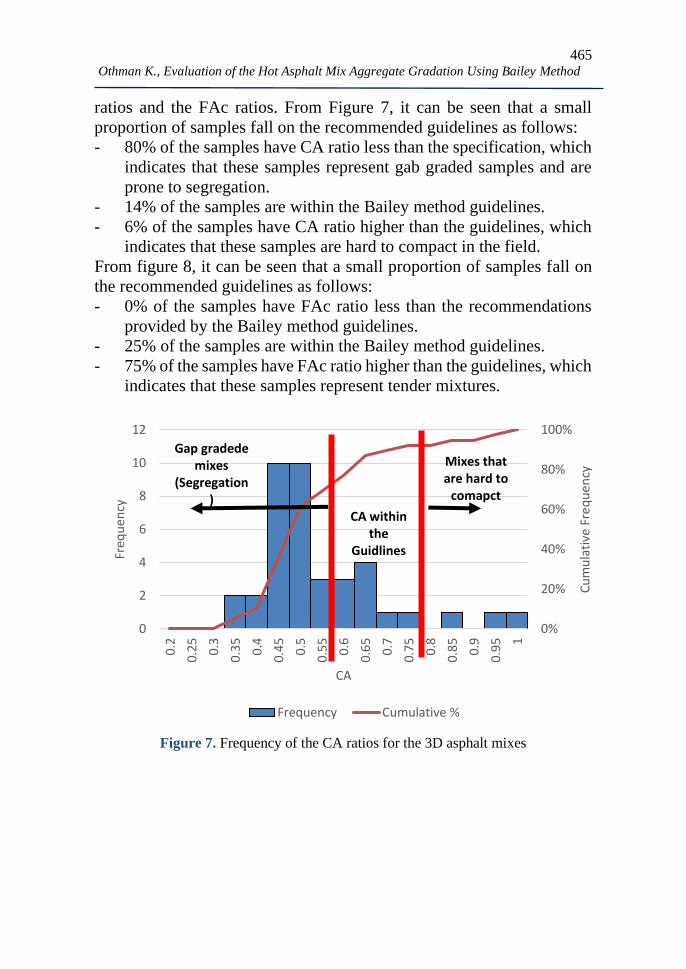
by the Bailey method. Figures 7 and 8 show the frequency of the CA
465 Othman K., Evaluation of the Hot Asphalt Mix Aggregate Gradation Using Bailey Method
ratios and the FAc ratios. From Figure 7, it can be seen that a small
proportion of samples fall on the recommended guidelines as follows:
- 80% of the samples have CA ratio less than the specification, which
indicates that these samples represent gab graded samples and are
prone to segregation.
- 14% of the samples are within the Bailey method guidelines.
- 6% of the samples have CA ratio higher than the guidelines, which
indicates that these samples are hard to compact in the field.
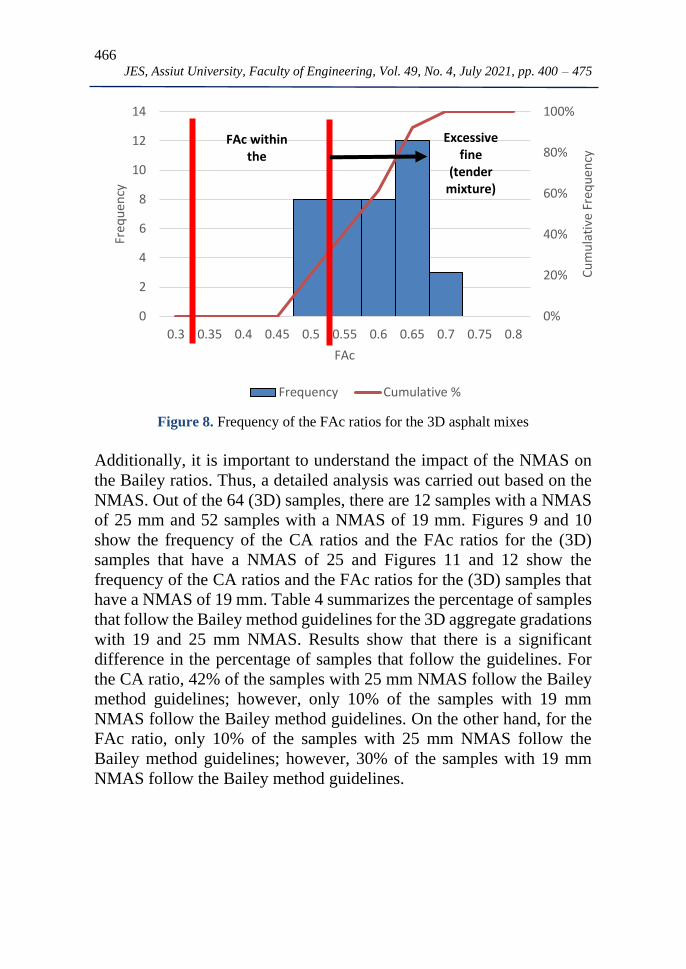
From figure 8, it can be seen that a small proportion of samples fall on
the recommended guidelines as follows:
- 0% of the samples have FAc ratio less than the recommendations
provided by the Bailey method guidelines.
- 25% of the samples are within the Bailey method guidelines.
- 75% of the samples have FAc ratio higher than the guidelines, which
indicates that these samples represent tender mixtures.
Figure 7. Frequency of the CA ratios for the 3D asphalt mixes
0%
20%
40%
60%
80%
100%
0
2
4
6
8
10
12
0.2
0.2
5
0.3
0.3
5
0.4
0.4
5
0.5
0.5
5
0.6
0.6
5
0.7
0.7
5
0.8
0.8
5
0.9
0.9
5 1
Cu
mu
lati
ve F
req
uen
cy
Freq
uen
cy
CA
Frequency Cumulative %
CA within the
Guidlines
Mixes that are hard to
comapct
Gap gradede mixes
(Segregation)
466 JES, Assiut University, Faculty of Engineering, Vol. 49, No. 4, July 2021, pp. 400 – 475
Figure 8. Frequency of the FAc ratios for the 3D asphalt mixes
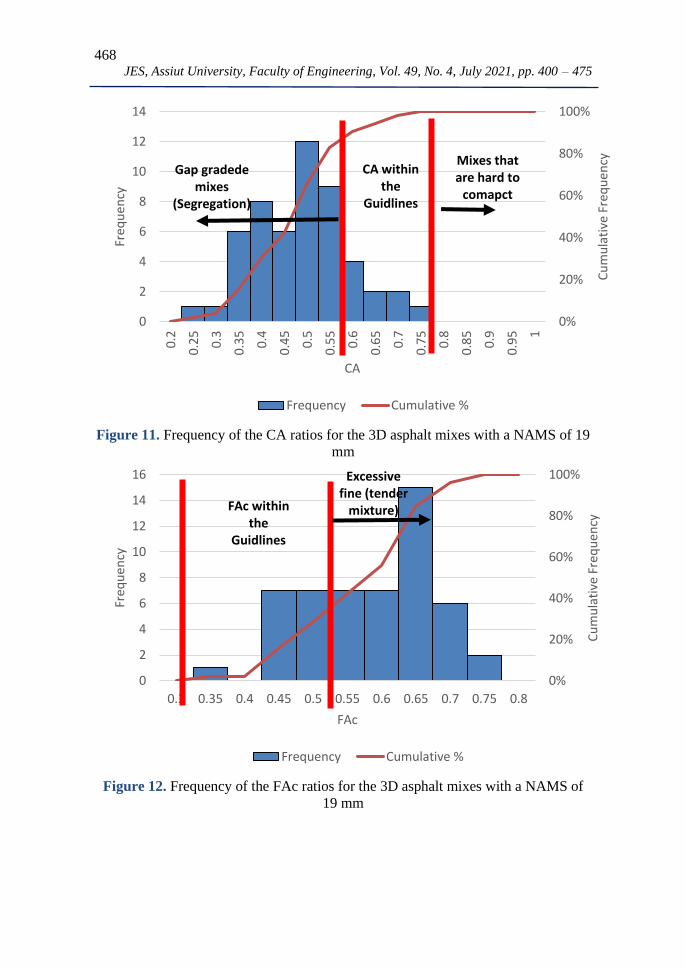
Additionally, it is important to understand the impact of the NMAS on
the Bailey ratios. Thus, a detailed analysis was carried out based on the
NMAS. Out of the 64 (3D) samples, there are 12 samples with a NMAS
of 25 mm and 52 samples with a NMAS of 19 mm. Figures 9 and 10
show the frequency of the CA ratios and the FAc ratios for the (3D)
samples that have a NMAS of 25 and Figures 11 and 12 show the
frequency of the CA ratios and the FAc ratios for the (3D) samples that
have a NMAS of 19 mm. Table 4 summarizes the percentage of samples
that follow the Bailey method guidelines for the 3D aggregate gradations
with 19 and 25 mm NMAS. Results show that there is a significant
difference in the percentage of samples that follow the guidelines. For
the CA ratio, 42% of the samples with 25 mm NMAS follow the Bailey
method guidelines; however, only 10% of the samples with 19 mm
NMAS follow the Bailey method guidelines. On the other hand, for the
FAc ratio, only 10% of the samples with 25 mm NMAS follow the
Bailey method guidelines; however, 30% of the samples with 19 mm
NMAS follow the Bailey method guidelines.
0%
20%
40%
60%
80%
100%
0
2
4
6
8
10
12
14
0.3 0.35 0.4 0.45 0.5 0.55 0.6 0.65 0.7 0.75 0.8
Cu
mu
lati
ve F
req
uen
cy
Freq
uen
cy
FAc
Frequency Cumulative %
FAc within the
Excessive fine
(tender mixture)
467 Othman K., Evaluation of the Hot Asphalt Mix Aggregate Gradation Using Bailey Method
Figure 9. Frequency of the CA ratios for the 3D asphalt mixes with a NAMS of 25
mm
Figure 10. Frequency of the FAc ratios for the 3D asphalt mixes with a NAMS of
25 mm
0%
20%
40%
60%
80%
100%
0
0.5
1
1.5
2
2.5
0.2
0.2
5
0.3
0.3
5
0.4
0.4
5
0.5
0.5
5
0.6
0.6
5
0.7
0.7
5
0.8
0.8
5
0.9
0.9
5 1
Cu
mu
lati
ve F
req
uen
cy
Freq
uen
cy
CA
Frequency Cumulative %
CA within the
Guidlines Mixes that are hard to
comapct
Gap gradede mixes
(Segregation)
0%
20%
40%
60%
80%
100%
0
1
2
3
4
5
6
0.3 0.35 0.4 0.45 0.5 0.55 0.6 0.65 0.7 0.75 0.8
Cu
mu
lati
ve F
req
uen
cy
Freq
uen
cy
FAc
Frequency Cumulative %
FAc within the
Guidlines Excessive fine (tender
mixture)
468 JES, Assiut University, Faculty of Engineering, Vol. 49, No. 4, July 2021, pp. 400 – 475
Figure 11. Frequency of the CA ratios for the 3D asphalt mixes with a NAMS of 19
mm
Figure 12. Frequency of the FAc ratios for the 3D asphalt mixes with a NAMS of
19 mm
0%
20%
40%
60%
80%
100%
0
2
4
6
8
10
12
14
0.2
0.2
5
0.3
0.3
5
0.4
0.4
5
0.5
0.5
5
0.6
0.6
5
0.7
0.7
5
0.8
0.8
5
0.9
0.9
5 1
Cu
mu
lati
ve F
req
uen
cy
Freq
uen
cy
CA
Frequency Cumulative %
CA within the
Guidlines
Mixes that are hard to
comapct
Gap gradede mixes
(Segregation)
0%
20%
40%
60%
80%
100%
0
2
4
6
8
10
12
14
16
0.3 0.35 0.4 0.45 0.5 0.55 0.6 0.65 0.7 0.75 0.8
Cu
mu
lati
ve F
req
uen
cy
Freq
uen
cy
FAc
Frequency Cumulative %
FAc within the
Guidlines
Excessive fine (tender
mixture)
469 Othman K., Evaluation of the Hot Asphalt Mix Aggregate Gradation Using Bailey Method Table 4. percentage of samples less than, within, or higher than the Bailey method
guidelines for the 3D aggregate gradations for samples with 25 and 19 mm NAMS
NMAS
CA FAc
less than
the
guidelines
Within the
guidelines
Higher
than the
guidelines
less than
the
guideline
s
Within
the
guidelines
Higher
than the
guidelines
25 mm 33% 42% 25% 0% 10% 90%
19 mm 90% 10% 0% 0% 30% 70%
3.2 Analysis of the 4C samples:
This section focuses on analyzing the 39 asphalt mix samples designed
following the 4C aggregate gradation using the three ratios introduced
by the Bailey method. Figures 13 and 14 show the frequency of the CA
ratios and the FAc ratios. The percentage of the samples less than, within,
and higher than the specifications for the 4C samples are similar to the
3D samples. From Figure 13, it can be seen that a small proportion of
samples fall on the recommended guidelines as follows:
- 77% of the samples have CA ratio less than the specification, which
indicates that these samples represent gab graded samples and are
prone to segregation.
- 16% of the samples are within the Bailey method guidelines.
- 7% of the samples have CA ratio higher than the guidelines, which
indicates that these samples are hard to compact in the field.
From figure 14, it can be seen that a small proportion of samples fall on
the recommended guidelines as follows:
- 0% of the samples have FAc ratio less than the recommendations
provided by the Bailey method guidelines.
- 21% of the samples are within the Bailey method guidelines.
- 79% of the samples have FAc ratio higher than the guidelines, which
indicates that these samples represent tender mixtures.
470 JES, Assiut University, Faculty of Engineering, Vol. 49, No. 4, July 2021, pp. 400 – 475
Figure 13. Frequency of the CA ratios for the 4C asphalt mixes
Figure 14. Frequency of the FAc ratios for the 4C asphalt mixes
For the impact of the NMAS on the Bailey ratios, this analysis was not
carried out because there are only 2 samples that have a NMAS of 25
0%
10%
20%
30%
40%
50%
60%
70%
80%
90%
100%
0
2
4
6
8
10
12
0.2
0.2
5
0.3
0.3
5
0.4
0.4
5
0.5
0.5
5
0.6
0.6
5
0.7
0.7
5
0.8
0.8
5
0.9
0.9
5 1
Cu
mu
lati
ve F
req
uen
cy
Freq
uen
cy
CA
Frequency Cumulative %
CA within the
Guidlines
Mixes that are hard to
comapct
Gap gradede mixes
(Segregation)
0%
20%
40%
60%
80%
100%
0
2
4
6
8
10
12
14
0.3 0.35 0.4 0.45 0.5 0.55 0.6 0.65 0.7 0.75 0.8
Cu
mu
lati
ve F
req
uen
cy
Freq
uen
cy
FAc
Frequency Cumulative %
FAc within the
Guidlines Excessive fine (tender mixture)
471 Othman K., Evaluation of the Hot Asphalt Mix Aggregate Gradation Using Bailey Method
mm and the remaining 37 samples have a NMAS of 19 mm. thus, the
data are not sufficient for analyzing the impact of the NMAS on the
Bailey ratios.
4 Conclusions The transportation system is an essential element for any long-term
progress of a country that one of the most important indices for the socio-
economic development of nations is the growth of the road network. In
2014, Egypt started a major plan for the development of the
transportation infrastructure. This plan managed to significantly improve
the quality of roads in Egypt. Thus, the appropriate planning, designing,
and construction of road networks with the proper materials and soil
properties is an essential step for the construction of these roads. In this
study, 103 asphalt mix samples are designed following the trial-and-error
approach to select the aggregate gradation that satisfies some aggregate
gradation specifications or limits. In this study, the Bailey ratios are used
to evaluate the traditional aggregate gradation selection technique and
results show that:
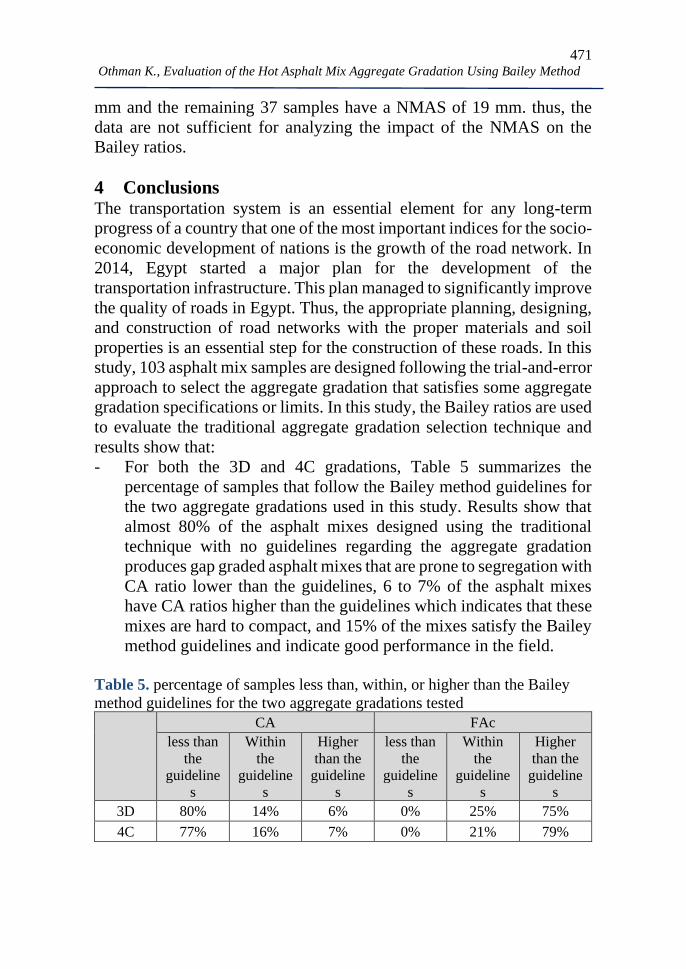
- For both the 3D and 4C gradations, Table 5 summarizes the
percentage of samples that follow the Bailey method guidelines for
the two aggregate gradations used in this study. Results show that
almost 80% of the asphalt mixes designed using the traditional
technique with no guidelines regarding the aggregate gradation
produces gap graded asphalt mixes that are prone to segregation with
CA ratio lower than the guidelines, 6 to 7% of the asphalt mixes
have CA ratios higher than the guidelines which indicates that these
mixes are hard to compact, and 15% of the mixes satisfy the Bailey
method guidelines and indicate good performance in the field.
Table 5. percentage of samples less than, within, or higher than the Bailey
method guidelines for the two aggregate gradations tested
CA FAc
less than
the
guideline
s
Within
the
guideline
s
Higher
than the
guideline
s
less than
the
guideline
s
Within
the
guideline
s
Higher
than the
guideline
s
3D 80% 14% 6% 0% 25% 75%
4C 77% 16% 7% 0% 21% 79%
472 JES, Assiut University, Faculty of Engineering, Vol. 49, No. 4, July 2021, pp. 400 – 475
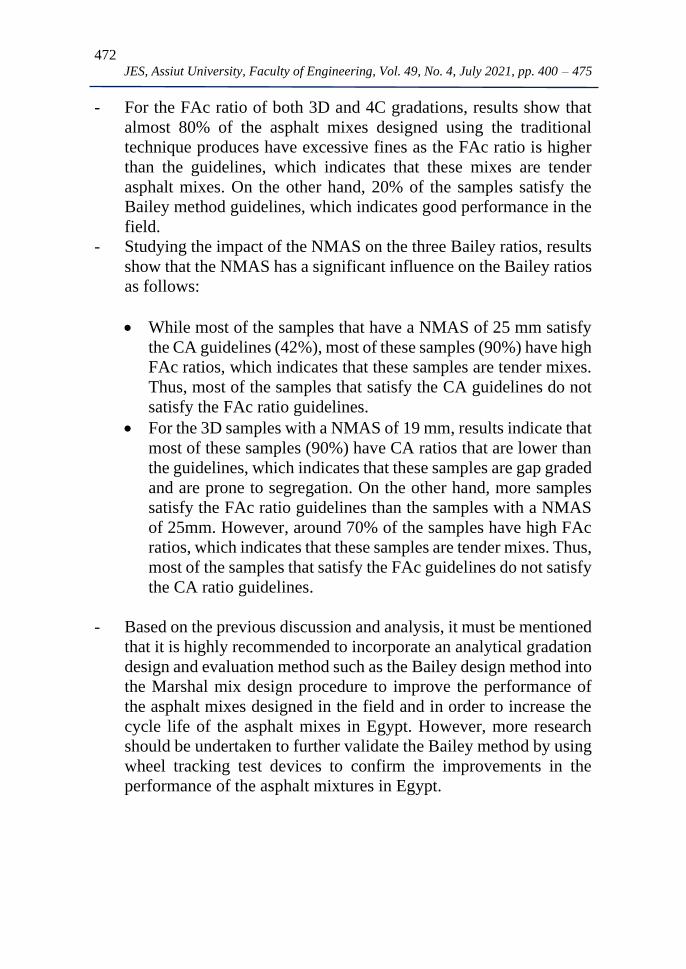
- For the FAc ratio of both 3D and 4C gradations, results show that
almost 80% of the asphalt mixes designed using the traditional
technique produces have excessive fines as the FAc ratio is higher
than the guidelines, which indicates that these mixes are tender
asphalt mixes. On the other hand, 20% of the samples satisfy the
Bailey method guidelines, which indicates good performance in the
field.
- Studying the impact of the NMAS on the three Bailey ratios, results
show that the NMAS has a significant influence on the Bailey ratios
as follows:
• While most of the samples that have a NMAS of 25 mm satisfy
the CA guidelines (42%), most of these samples (90%) have high
FAc ratios, which indicates that these samples are tender mixes.
Thus, most of the samples that satisfy the CA guidelines do not
satisfy the FAc ratio guidelines.
• For the 3D samples with a NMAS of 19 mm, results indicate that
most of these samples (90%) have CA ratios that are lower than
the guidelines, which indicates that these samples are gap graded
and are prone to segregation. On the other hand, more samples
satisfy the FAc ratio guidelines than the samples with a NMAS
of 25mm. However, around 70% of the samples have high FAc
ratios, which indicates that these samples are tender mixes. Thus,
most of the samples that satisfy the FAc guidelines do not satisfy
the CA ratio guidelines.
- Based on the previous discussion and analysis, it must be mentioned
that it is highly recommended to incorporate an analytical gradation
design and evaluation method such as the Bailey design method into
the Marshal mix design procedure to improve the performance of
the asphalt mixes designed in the field and in order to increase the
cycle life of the asphalt mixes in Egypt. However, more research
should be undertaken to further validate the Bailey method by using
wheel tracking test devices to confirm the improvements in the
performance of the asphalt mixtures in Egypt.
473 Othman K., Evaluation of the Hot Asphalt Mix Aggregate Gradation Using Bailey Method
References [1]. Egypt Independent. Egypt’s road quality now 2nd place in Africa: Prime