Marketing and beneficiary communications ............................................................................. 20
Challenges to improving Star Ratings ...................................................................................... 21
CONCLUSIONS AND NEXT STEPS .................................................................................................. 24
APPENDIX I. DISCUSSION GUIDE FOR CONTRACT ADMINISTRATORS ........................................ 25
APPENDIX II: ANALYSIS OF STAR RATING FOR CASE STUDY MA ORGANIZATIONS ................ 30
LIST OF TABLES
Table 1. Characteristics of case study organizations ...................................................................... 6
Table 2. Overall Rating of competitor MA contracts by Overall Rating of case study organization contracts, 2014 .............................................................................................................................. 11
Table 3. Comparison of case study organizations’ areas of QI focus and their performance for specific domains............................................................................................................................ 15
Table 4. Overall Rating and domain ratings for case study MA organizations and contracts, 2011 and 2014 ........................................................................................................................................ 31
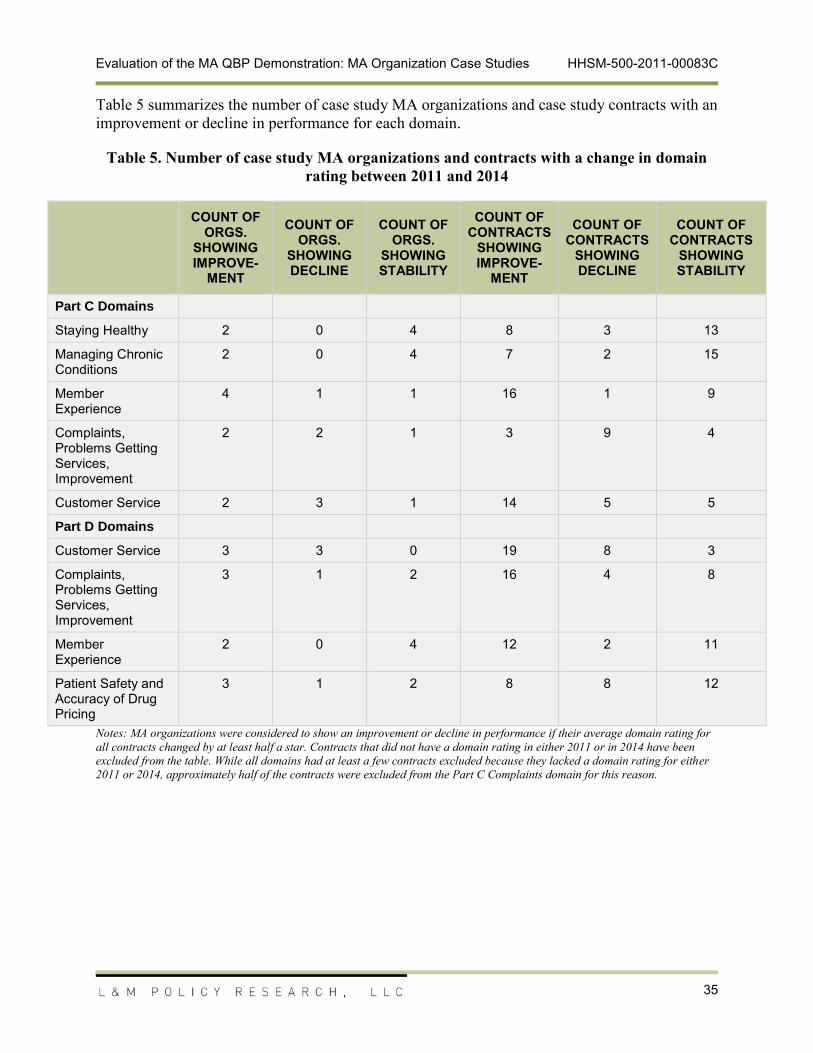
Table 5. Number of case study MA organizations and contracts with a change in domain rating between 2011 and 2014 ................................................................................................................ 35
Evaluation of the MA QBP Demonstration: MA Organization Case Studies HHSM-500-2011-00083C
1
EXECUTIVE SUMMARY
This report contains findings of the case study component of the Centers for Medicare & Medicaid Services’ (CMS) Medicare Advantage (MA) Quality Bonus Payment (QBP) demonstration evaluation. The case studies offer insights into six diverse MA organizations’ quality improvement (QI) programs and the effects of the MA QBP Demonstration on their strategies and QI activities.
Case study organizations’ assessments of the QBP impact were largely focused on benefits of the additional time and funding it provided to improve their Star Ratings, noting that the demonstration also helped make the business case for QI within their organizations and with some of their network providers. One organization noted that the demonstration was especially important to maintaining plan participation in the Medicare Advantage program and, by extension, beneficiary choice. Participants also indicated that the demonstration gave MA organizations with more average-rated contracts an opportunity to improve their ratings before the implementation of the ACA bonus payment methodology. The Star Ratings of immediate competitors factored into organizations’ strategies for improving Star Ratings and marketing to beneficiaries, though most organizations noted that beneficiaries prioritize benefits, cost, and provider network over Star Ratings when selecting a plan. MA organizations provided examples of scenarios where competitors’ Star Ratings blunted or enhanced incentives to improve their Star Ratings.
MA organizations reported that the Star Ratings generally, and the demonstration more specifically, have had an impact on their QI efforts. Although most of the participating MA organizations reported that their engagement in QI and their focus on Star Ratings preceded the announcement of the QBP demonstration, several indicated that the demonstration provided important incentives for improving Star Ratings. Several case study MA organizations described changes in how they approached QI that coincided with the announcement of the demonstration and several explicitly stated that the demonstration was an added incentive for the changes. While many participants acknowledged that all of the Star Rating measures are important, budget and time realities meant that MA organizations tended to prioritize certain types of measures or certain domains for their QI efforts. Nearly all of the case study MA organizations indicated that their organizations were increasingly using data analytics to support their QI efforts. Although most case study MA organizations did not attribute these efforts to the QBP demonstration, it appeared that the Star Ratings provided an impetus for several to invest in these analyses. During the case study discussions, all of the participants indicated that they are continuing their QI activities after the end of the demonstration and did not anticipate any future changes in their QI efforts as a result of the end of the demonstration.
Evaluation of the MA QBP Demonstration: MA Organization Case Studies HHSM-500-2011-00083C
2
BACKGROUND
The Medicare Modernization Act of 2003 (MMA) allowed the Centers for Medicare & Medicaid Services (CMS) to offer a broader array of coverage options that emphasize high-quality and cost-effective health care delivery under the Medicare Advantage (MA) program. This program offers an alternative to fee-for-service Original Medicare. The majority of Medicare beneficiaries still receive care through Original Medicare, but the reduced cost-sharing, additional benefits, and prescription drug (Part D) options offered through the MA program provide an increasingly attractive alternative. In 2014, 15.7 million Medicare beneficiaries (about 30 percent) received their Medicare benefits though MA plans.1 This is the largest number and share of beneficiaries ever enrolled in Medicare private health plans.
To help monitor the quality and performance of MA contracts, CMS introduced the Five-Star Quality Rating System in 2008. Since its introduction, the agency has continued to improve the rigor of the Star Ratings, adding new metrics and adjusting specifications for others – these changes have led to ongoing improvements in quality among MA contracts.
As MA enrollment has increased and Medicare costs have risen, policymakers have explored the role of financial incentives in encouraging MA organizations to deliver high-quality care while controlling costs. One approach to building a stronger business case for quality is to employ pay-for-performance (P4P) or value-based purchasing (VBP) strategies that motivate quality improvement (QI) through better alignment of financial incentives. Efforts to link provider-driven market forces with quality have driven the push for P4P initiatives in health care markets that extend beyond MA organizations.2 Congress formalized the shift toward VBP for the MA program when it passed the Affordable Care Act of 2010 (ACA), which required quality bonus payments (QBPs) to all contracts earning 4 or 5 stars in the context of Medicare’s Star Ratings program beginning in 2012.
As an extension of this legislation, CMS launched the three-year MA QBP Demonstration, which accelerates the phase-in of QBPs by extending bonus payments to 3-star contracts and eliminating the cap on blended county benchmarks that would otherwise limit QBPs. The demonstration is in effect from 2012-2014. Through this demonstration, CMS seeks to understand how incentive payments affect plan quality across a broader spectrum of plans. To this end, CMS contracted with L&M Policy Research, LLC (L&M), to conduct an evaluation of the demonstration, guided by the following aims:
Document changes in QI under the demonstration;
Document MA contract, enrollee, and market characteristics associated with quality ratings and improvements; and
Document the relationship across QBPs, quality initiatives, and enrollment.
1 Marsha Gold et al., “Medicare Advantage 2014 Spotlight: Enrollment Market Update,” The Henry J. Kaiser Family Foundation, April 2014, available at http://kaiserfamilyfoundation.files.wordpress.com/2014/04/8588-medicare-advantage-2014-spotlight-enrollment-market-update.pdf. 2 Rosenthal, M. B., Frank, R.G., Li, Z., and Epstein, A.M. (2005). Early experience with pay-for-performance: from concept to practice. JAMA 294 (14), 1788-93.
Evaluation of the MA QBP Demonstration: MA Organization Case Studies HHSM-500-2011-00083C
3
The evaluation incudes several key research activities:
Survey of MA organizations. The team fielded a survey of all MA organizations to capture high-level information on perceptions of the demonstration, changes to quality initiatives in response to the demonstration, and factors that help or hinder them in achieving QI.
Case studies with MA organizations. In-depth discussions with selected MA organizations to explore these organizations' QI programs and the effects of the demonstration on their strategies and activities.
Analyses of MA plan, enrollment, and quality data. Using CMS administrative data, the team is documenting patterns in quality ratings and enrollment over time and conducting multivariate analyses to identify which factors are predictors of plan quality. The team is also examining trends in quality in the pre-demonstration (2007-10) and the demonstration (2010-12) periods in the broader health care industry by comparing an overlapping set of Star Ratings measures that are also reported in the Medicaid and commercial settings. These analyses are ongoing. Final results will be presented within the team's Final Evaluation Report in March 2015.
This report presents the findings the case study activity. The team will synthesize the findings from the case studies, survey, and secondary data analysis within the Final Evaluation Report, which will be submitted to CMS in summer 2015.
Evaluation of the MA QBP Demonstration: MA Organization Case Studies HHSM-500-2011-00083C
4
METHODS
The descriptive case studies are a key component of the evaluation, contributing insights about the effects of the MA QBP Demonstration on a small number of MA organizations’ decision-making around QI efforts. The case studies explored the mechanics of the QI programs, as well as the contextual factors that impact the nature, structure, and scope of the programs. The findings from the case studies are not intended to be generalized to the universe of MA quality programs. However, the organizations interviewed reflect diversity in key MA organization characteristics, such that the findings may be indicative of the range of quality-related activities that one is likely to observe in MA organization programs.
Site Selection
Star Ratings are assigned at the contract level and a single MA organization may sponsor multiple contracts. The case studies were conducted at the organization level because QI programs are often developed and administered centrally for all of the organizations’ contracts.
To capture a broad cross-section of organizational experiences and performance under the demonstration, L&M aimed for a diverse set of case study MA organizations, selected for variety across several characteristics, including number of contracts, enrollment size, profit status, inclusion of a Special Needs Plan (SNP) among the parent organization’s plan offerings, and geographic region. Given the demonstration’s goal of improving Star Ratings for MA organizations across the broad spectrum of the Ratings scale, we also sought to include variation in performance within the Star Ratings program, as well as varying levels of improvement over the course of the demonstration. To capture Star Ratings performance, we used the average 2011 Overall Rating (the rating at the time of the demonstration announcement) for all of the contracts under the parent organization to categorize each parent organization into one of three groups based on the incentives of the bonus payment methodology in the ACA and the demonstration:
Low performers: Average rating less than 3.0 stars: Contracts with fewer than 3 stars receive bonus payments under neither the ACA nor the demonstration method; thus, organizations have an incentive to improve to at least 3 stars in the short-term, as well as an incentive to improve to at least 4 stars in the long-term.
Mid performers: Average rating between 3.0 and 3.99 stars: Contracts with 3 or 3.5 stars receive bonus payments under the demonstration methodology but will not receive them under the ACA methodology; thus organizations have an incentive to maintain3 at least 3 stars in the short-term, as well as an incentive to improve to at least 4 stars in the long-term.
High performers: Average rating of 4.0 or more stars: Contracts with 4, 4.5, or 5 stars receive bonus payments under both the ACA and the demonstration methodology; thus,
3 We recognize that these categories simplify the incentive structure by looking only at whether a contract would qualify for a bonus payment under the methodology and do not taking into account the size of the QBP. Since plans with higher Star Ratings can receive higher QBPs under both methodologies, there is still an incentive for the parent organization to improve the contract’s Star Rating. While simplified, we found these categories useful for creating an initial stratification of parent organizations.
Evaluation of the MA QBP Demonstration: MA Organization Case Studies HHSM-500-2011-00083C
5
organizations have an incentive to maintain at least 4 stars on both a short-term and a long-term basis.
The team then considered the change in the ratings between 2011 Overall Rating and the 2014 Overall Rating, creating subcategories to further stratify the plans:
MA organizations with an Overall Rating that moved them from a higher performance category to a lower performance category (e.g., from high performer to mid-level performer) were considered to have Declining Performance.
MA organizations with an Overall Rating that kept them within the same performance category were considered to have Stable Performance.
MA organizations with an Overall Rating that moved them from a lower performance category to a higher performance category (e.g., from mid-level performer to high performer) were considered to have Improving Performance.
Once MA organizations were arrayed by performance and change in performance over the demonstration period, L&M selected case study candidates from each group, also taking into account the need for diversity across the set of characteristics as described earlier.
Case Study Participants
The list of proposed participants and alternatives (selected as described above) was submitted to CMS for review and approval. L&M invited the selected MA organizations via e-mail to participate in interviews. For those that did not respond to the initial e-mail, L&M followed up via telephone or e-mail. When they refused to participate or did not respond to several contacts, we reached out to alternate organizations. Ultimately, six organizations agreed to participate in case study interviews, representing a range of low and high performing plans and variation in their level of improvement. Although CMS helped select the set of MA organizations from which we drew case study subjects, the identities of the final set of case study participants are not included in order to provide some degree of anonymity and promote candor in our conversations.
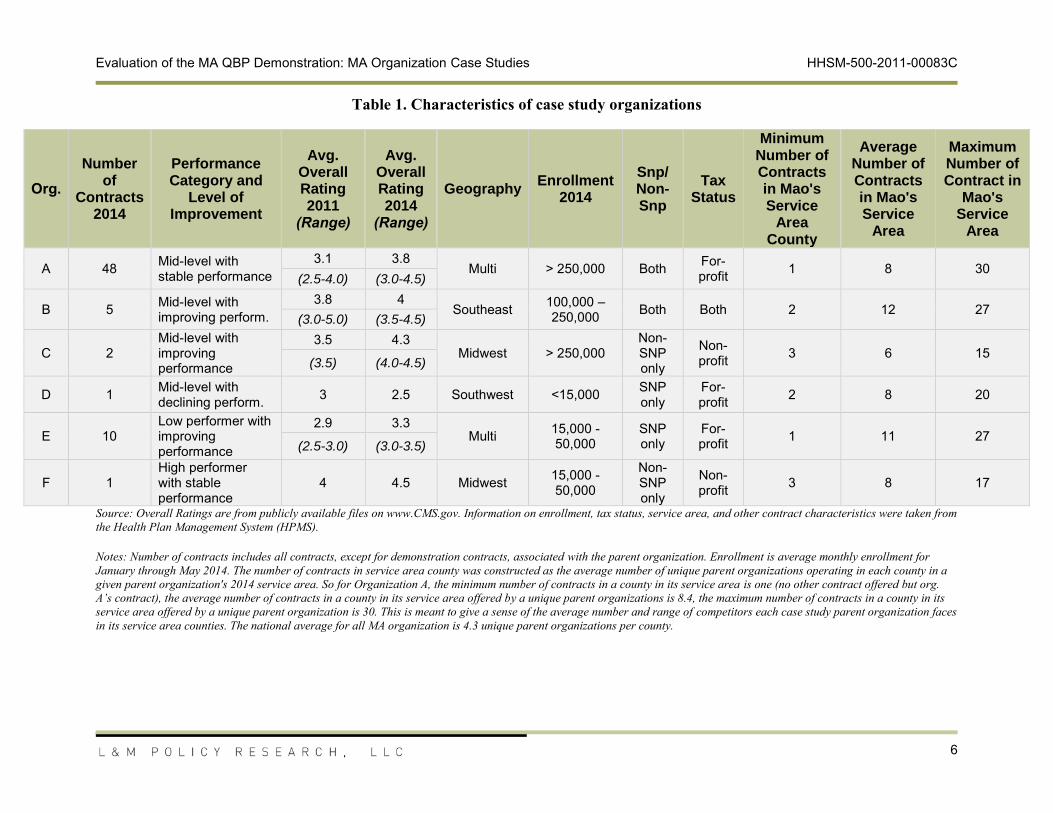
Table 1 describes features of the case study organizations, including each organization’s performance category (low, mid-level, or high performer) based on their average 2011 Overall Rating and their level of improvement (declining, stable, or improving performance) based on the change between their average 2011 and 2014 Overall Rating. It is important to note that all of the organizations with “stable performance” improved their average Overall Ratings, in two cases by 0.5 stars or more, but they are categorized as stable performers, rather then improvers, because they did not improve enough to move from a lower category of performance to a higher category of performance.
Evaluation of the MA QBP Demonstration: MA Organization Case Studies HHSM-500-2011-00083C
6
Table 1. Characteristics of case study organizations
Org.
Number of
Contracts 2014
Performance Category and
Level of Improvement
Avg. Overall Rating 2011
(Range)
Avg. Overall Rating 2014
(Range)
GeographyEnrollment
2014
Snp/ Non-Snp
Tax Status
Minimum Number of Contracts in Mao's Service
Area County
Average Number of Contracts in Mao's Service
Area
Maximum Number of Contract in
Mao's Service
Area
A 48 Mid-level with stable performance
3.1 3.8Multi > 250,000 Both For-
profit 1 8 30(2.5-4.0) (3.0-4.5)
B 5
Mid-level with improving perform.
3.8 4Southeast 100,000 –
250,000 Both Both 2 12 27(3.0-5.0) (3.5-4.5)
C 2Mid-level with improving performance
3.5 4.3Midwest > 250,000
Non-SNP only
Non-profit
3 6 15
(3.5) (4.0-4.5)
D
1 Mid-level with declining perform. 3 2.5 Southwest <15,000 SNP
onlyFor-profit 2 8 20
E 10Low performer with improving performance
2.9 3.3Multi 15,000 -
50,000SNP only
For-profit 1 11 27
(2.5-3.0) (3.0-3.5)
F 1High performer with stable performance
4 4.5 Midwest 15,000 -50,000
Non-SNP only
Non-profit 3 8 17
Source: Overall Ratings are from publicly available files on www.CMS.gov. Information on enrollment, tax status, service area, and other contract characteristics were taken from the Health Plan Management System (HPMS).
Notes: Number of contracts includes all contracts, except for demonstration contracts, associated with the parent organization. Enrollment is average monthly enrollment for January through May 2014. The number of contracts in service area county was constructed as the average number of unique parent organizations operating in each county in a given parent organization's 2014 service area. So for Organization A, the minimum number of contracts in a county in its service area is one (no other contract offered but org. A’s contract), the average number of contracts in a county in its service area offered by a unique parent organizations is 8.4, the maximum number of contracts in a county in its service area offered by a unique parent organization is 30. This is meant to give a sense of the average number and range of competitors each case study parent organization faces in its service area counties. The national average for all MA organization is 4.3 unique parent organizations per county.
Evaluation of the MA QBP Demonstration: MA Organization Case Studies HHSM-500-2011-00083C
7
Case Study Approach
L&M conducted the case study interviews between April and June 2014. Of the six case studies, five were conducted entirely over the telephone and one was conducted on-site and supplemented with telephone interviews with additional staff. The interviews generally took the form of group discussions, with staff members relevant to the particular topic area answering questions about their area of expertise. To ensure that the relevant staff was present for the case study interviews, L&M shared the discussion protocol topic areas in advance of the interview. The organizations ultimately determined which staff members participated in the interviews. The number of participants from each organization ranged from one to more than 10, with several types of MA organization staff participating in discussions, including executives, medical directors, pharmacists, information systems staff, quality assurance staff, and sales and marketing staff.
An interview protocol was used to structure the discussions and serve as a checklist for the team to ensure that all key subject areas were covered over the course of the case studies. The protocol content was informed by findings from the evaluation team’s previous survey of MA organizations, key informant interviews conducted at the outset of the evaluation with industry stakeholders and MA organizations, and an environmental scan. The protocol was used as a guide and not intended to facilitate a highly structured question and answer format. A copy of the protocol is included in the appendix to this report.
Evaluation of the MA QBP Demonstration: MA Organization Case Studies HHSM-500-2011-00083C
8
CASE STUDY FINDINGS
The findings from the case study discussions are organized by key areas that could be impacted by the Star Ratings program and the demonstration: leadership and organizational strategy, QI activities, provider relationships and contracting, and marketing and enrollment. The team also described the challenges for improving their Star Ratings reported by the case study MA organizations.
Several case study organizations described the demonstration as beneficial in focusing leadership on Star Ratings and prioritize improving their ratings because it tied funding to QI. MA organizations’ Star Ratings influenced their perception of the MA QBP Demonstration: they generally saw the demonstration as an opportunity to improve quality and improve their competitive positions, but case study organizations with lower rated contracts were also concerned about the low performer icon and remaining in the MA program. The MA organizations also described how their competitors’ Star Ratings and the alternatives available to beneficiaries in their markets factored into their organization’s Star Rating strategies, thus illustrating how competition can mitigate or enhance the effects of QBP incentives and the stars program more broadly.
Although most of the participating MA organizations reported that their QI activities and focus on Star Ratings preceded the announcement of the demonstration, several indicated that the demonstration provided added incentives for improving Star Ratings and in some cases reorganizing internally to better focus organizational resources on their Star Ratings. Although participants did not attribute major changes to their quality initiatives in response to the demonstration, CMS’s Star Ratings and quality bonus payments, as well as industry trends toward quality measurement, collectively provided an impetus for several MA organizations to invest in data analytics and staff or consultants to support their QI programs. Quality bonus payments have also created the opportunity to improve provider awareness of Star Ratings and, for some MA organizations, to align payment incentives for providers with quality measures, including Star Ratings. The case study organizations reported that they did not emphasize Star Ratings in their marketing materials for beneficiaries because of their perception that beneficiaries give more weight to additional benefits, provider networks, and out-of-pocket costs, rather than to Star Ratings. Given that the MA organizations see little benefit to using Star Ratings for marketing purposes, it appears that the impetus for improving Star Ratings, or maintaining high ratings, lies elsewhere. This underscores the importance of other CMS incentives, such as linking payment to quality scores. Finally, although MA organizations were motivated to improve their Star Ratings during the demonstration period, they cited a variety of measurement issues and challenges with patient populations as ongoing challenges to improving their Star Ratings.
Evaluation of the MA QBP Demonstration: MA Organization Case Studies HHSM-500-2011-00083C
9
Leadership perspective and organizational strategy
This section summarizes themes from discussions with leadership about their reaction to the MA QBP Demonstration’s design and incentives and the effects the demonstration had on operations, strategy, and investment of resources.
The demonstration helped define the internal business case for QI
Several organizations indicated that the MA QBP Demonstration was beneficial in helping focus leadership on Star Ratings and their improvement because it tied funding to QI in the wake of MA payment reductions in the ACA. This theme from the case study interviews is consistent with our early findings from a survey of MA contracts: among respondents that said that the demonstration helped improve the contract’s Star Ratings, the most commonly cited mechanism (62 percent of respondents) was the incentive it provided to senior management to focus on improving the ratings. One case study organization explained that Star Ratings are an important part of its business strategy because the ratings are a revenue stream for contracts that are performing well as they see MA reimbursement declining. Echoing this, another case study organization noted that QI had historically been a cost center, but the opportunity to make up some of the ACA’s MA payment reductions through QBPs is changing that. Organizations we interviewed described a number of investments in analytics, provider and beneficiary outreach, and changes to organizational structure to focus on Star Ratings that are described in more detail in the QI, provider relations, and beneficiary outreach sections.
Organization’s Star Ratings influenced perception of the demonstration
Leadership in three of the case study MA organizations characterized the demonstration as a way to provide essential funding to offset ACA payment changes, while creating an opportunity for organizations to focus on quality to improve their competitive position. Each of these organizations had at least some contracts with 4.5 stars in 2014. Leadership from one case study organization spoke about the effects of the demonstration across the industry, saying that the demonstration was especially important in markets that have a lot of average or lower rated plans that would not have otherwise qualified for QBPs because the QBPs offered under the demonstration helped mitigate the rate cuts. This organization felt that it would have been challenging for all plans to operate without that demonstration – but especially in markets with a concentration of more average rated plans that would have seen larger reductions under the ACA payment methodology. The infusion of funding from the demonstration allowed these plans to remain competitive, delivering zero premiums and valuable benefits.
Organizations’ Overall Rating informed their perception of what level of achievement was possible for their organizations and their perspective on the incentives in the demonstration. One organization that had an average Overall Rating of 3.8 (with individual contracts ranging from 3.0 to 4.5 stars) in 2014 described the demonstration as providing a “glide path” to achieve a four-star rating and an acknowledgment from CMS that it takes time and resources to improve Star Ratings. This organization viewed the three-year period of the demonstration as an opportunity to invest aggressively and be well positioned when the demonstration ended. Similarly, another organization that had improved its Star Rating to the 4.0 to 4.5 star range by 2014 noted that it had invested heavily to achieve four stars because the stars were one of the
Evaluation of the MA QBP Demonstration: MA Organization Case Studies HHSM-500-2011-00083C
10
most important levers the organization had to improve revenue. They believe that organizations that have not achieved 4 stars by 2015 will not be able to maintain current benefit levels.
The most highly rated organization we interviewed, which improved its rating from 4.0 in 2011 to 4.5 in 2014, was the lone organization to strike a somewhat critical note about the demonstration. Leadership initially felt the demonstration watered down the incentives by giving bonuses to any plan with three stars or above. Organization leaders felt bonus payments should be provided to contracts with 4 stars or more, rather than to contracts they perceived as more average quality. Another official with the same organization offered that despite this initial reaction, she came to see that the demonstration was designed to move all plans along in improving their quality during the demonstration period.
Two highly rated organizations also indicated that, unlike in the ACA methodology, the amount of bonus payments should differ between 4, 4.5, and 5 stars to provide incentives to continue QI above the 4.0 star level.
Two SNP organizations on the lower end of the Star Ratings spectrum were focused on avoiding the low performer icon, which was not a concern for the other organizations in this study. One of the organizations said that given its 2.5 Overall Rating, it is working to remain in the program and have an added incentive of maintaining dual-eligible SNP (D-SNP) participation because it is a crucial aspect of its Medicaid line of business. However, this organization’s representatives also noted that, while they are fighting to improve their Overall Rating, they remain able to offer the rich supplemental benefits that members want (particularly dental benefits) absent quality bonus payments. This suggests that the incentives to improve quality to achieve higher payments may be blunted where plans are able to offer the level of benefits to remain competitive without additional bonus dollars. In contrast, the other case study organization offering SNPs exclusively viewed the Star Ratings and related bonus payments as a mechanism to weed out low performers because performance below a certain threshold means that the plan cannot achieve a level of payment that is adequate to provide competitive benefits. Both of these organizations described SNPs as disadvantaged in the Star Ratings because of the populations they serve. This topic is discussed in more detail in the challenges to increasing Star Ratings section below.
MA organization’s ratings and their competitors’ ratings drive organizational Star Rating strategies
Perhaps not surprising for a program built on harnessing choice and competition for beneficiaries, the case study organizations described how competitors’ Star Ratings and the alternatives available to beneficiaries in their markets factored into their own organization’s Star Rating strategies. This illustrates how competition can mitigate or enhance the effects of QBP incentives and the Star Ratings program more broadly to attain higher Star Ratings. One organization noted that most of its competitors have an Overall Rating of 4.5 stars but no plan in their market has achieved 5 stars, so beneficiaries do not have a 5-star option. They explained that given that plans in their markets all have similar Star Ratings, brand and benefits are what makes them stand out. Another organization also stressed the homogeneity of (relatively low) Star Ratings among SNPs in its market, describing it as “not a 5-star system but a 3-star system.” Although they currently have an Overall Rating of 2.5 stars, they explained that the beneficiaries in their SNP do not have a lot of higher-rated SNP options. The other SNP organization we
Evaluation of the MA QBP Demonstration: MA Organization Case Studies HHSM-500-2011-00083C
11
interviewed noted that one competitive advantage of being a 5-star plan in your market – year round marketing and enrollment – is not an added advantage for D-SNPs because they can enroll dual-eligible members every month.
Leadership within one large national plan explained that while they understand the benefits of being a 5-star plan, there are not many of them, saying “It’s elite company to be in.” They further noted that their goal is not merely achieving the highest rating in a market but getting a 5-star rating before their competitors. This organization said that in a market where all the competitors are 3-star plans, having a 4.5-star rating is good enough. But in markets where there are high-quality contracts on the cusp of very high ratings, they feel acute pressure to achieve 5 stars so they can put that information on their products, take advantage of the year-round enrollment, and chip away at their competitors’ market share. (Use of Star Ratings in marketing materials is discussed in more detail below.)
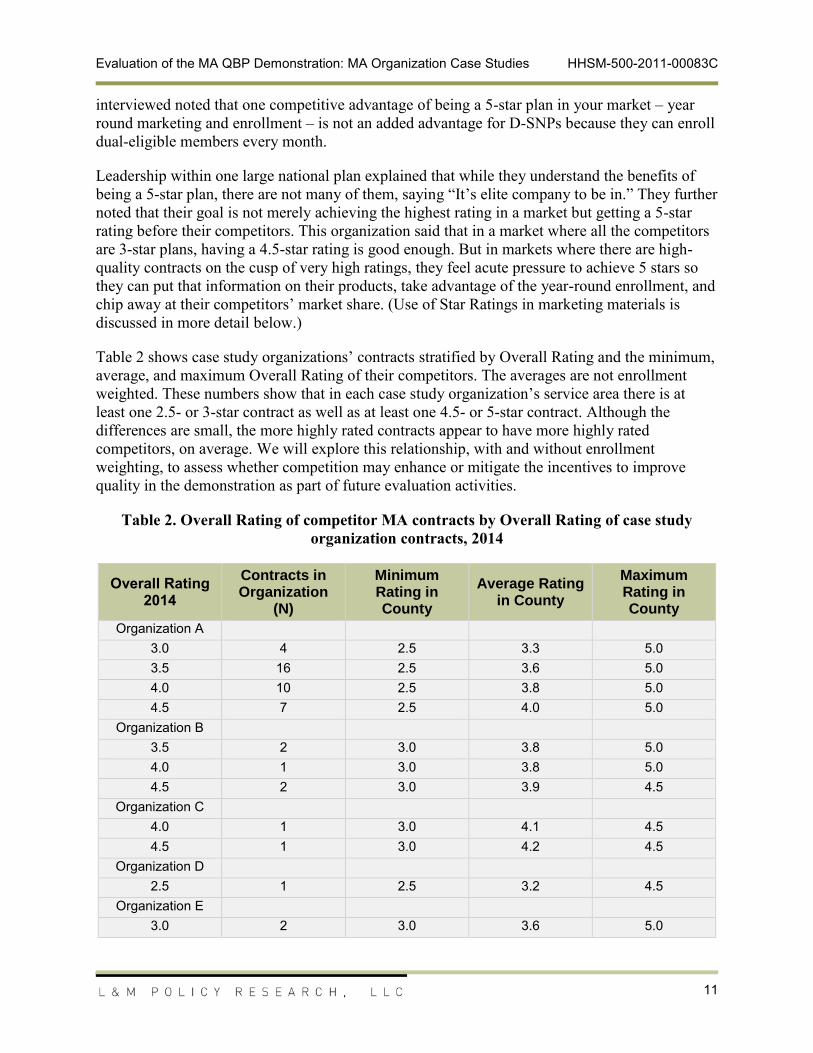
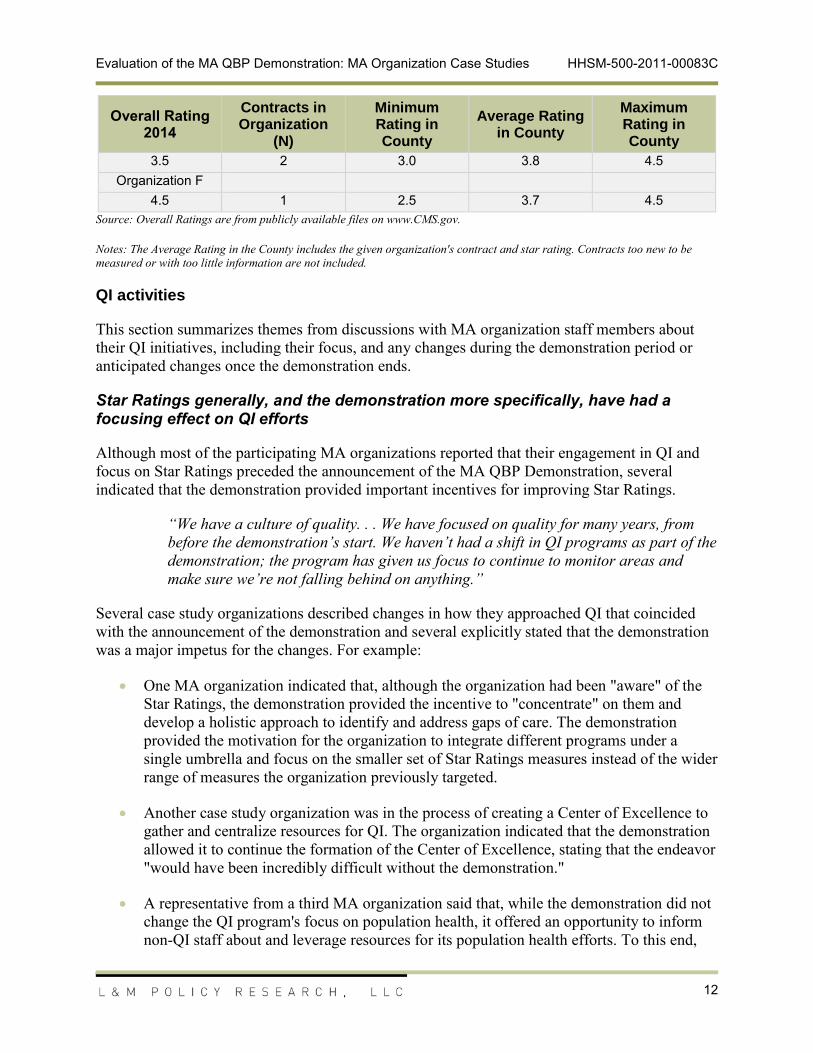
Table 2 shows case study organizations’ contracts stratified by Overall Rating and the minimum, average, and maximum Overall Rating of their competitors. The averages are not enrollment weighted. These numbers show that in each case study organization’s service area there is at least one 2.5- or 3-star contract as well as at least one 4.5- or 5-star contract. Although the differences are small, the more highly rated contracts appear to have more highly rated competitors, on average. We will explore this relationship, with and without enrollment weighting, to assess whether competition may enhance or mitigate the incentives to improve quality in the demonstration as part of future evaluation activities.
Table 2. Overall Rating of competitor MA contracts by Overall Rating of case study organization contracts, 2014
Evaluation of the MA QBP Demonstration: MA Organization Case Studies HHSM-500-2011-00083C
12
Overall Rating
2014
Contracts in Organization
(N)
Minimum Rating in County
Average Rating in County
Maximum Rating in County
3.5 2 3.0 3.8 4.5Organization F
4.5 1 2.5 3.7 4.5Source: Overall Ratings are from publicly available files on www.CMS.gov.
Notes: The Average Rating in the County includes the given organization's contract and star rating. Contracts too new to be measured or with too little information are not included.
QI activities
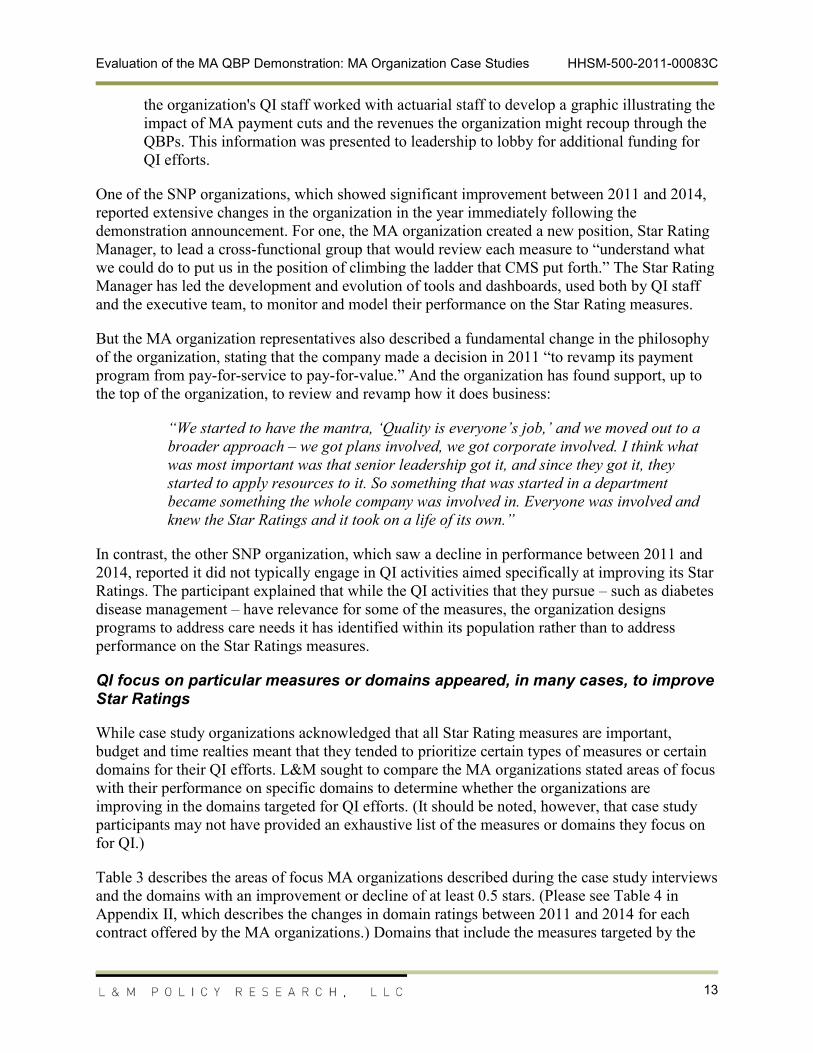
This section summarizes themes from discussions with MA organization staff members about their QI initiatives, including their focus, and any changes during the demonstration period or anticipated changes once the demonstration ends.
Star Ratings generally, and the demonstration more specifically, have had a focusing effect on QI efforts
Although most of the participating MA organizations reported that their engagement in QI and focus on Star Ratings preceded the announcement of the MA QBP Demonstration, several indicated that the demonstration provided important incentives for improving Star Ratings.
“We have a culture of quality. . . We have focused on quality for many years, from before the demonstration’s start. We haven’t had a shift in QI programs as part of the demonstration; the program has given us focus to continue to monitor areas and make sure we’re not falling behind on anything.”
Several case study organizations described changes in how they approached QI that coincided with the announcement of the demonstration and several explicitly stated that the demonstration was a major impetus for the changes. For example:
One MA organization indicated that, although the organization had been "aware" of the Star Ratings, the demonstration provided the incentive to "concentrate" on them and develop a holistic approach to identify and address gaps of care. The demonstration provided the motivation for the organization to integrate different programs under a single umbrella and focus on the smaller set of Star Ratings measures instead of the wider range of measures the organization previously targeted.
Another case study organization was in the process of creating a Center of Excellence to gather and centralize resources for QI. The organization indicated that the demonstration allowed it to continue the formation of the Center of Excellence, stating that the endeavor "would have been incredibly difficult without the demonstration."
A representative from a third MA organization said that, while the demonstration did not change the QI program's focus on population health, it offered an opportunity to inform non-QI staff about and leverage resources for its population health efforts. To this end,
Evaluation of the MA QBP Demonstration: MA Organization Case Studies HHSM-500-2011-00083C
13
the organization's QI staff worked with actuarial staff to develop a graphic illustrating the impact of MA payment cuts and the revenues the organization might recoup through the QBPs. This information was presented to leadership to lobby for additional funding for QI efforts.
One of the SNP organizations, which showed significant improvement between 2011 and 2014, reported extensive changes in the organization in the year immediately following the demonstration announcement. For one, the MA organization created a new position, Star Rating Manager, to lead a cross-functional group that would review each measure to “understand what we could do to put us in the position of climbing the ladder that CMS put forth.” The Star Rating Manager has led the development and evolution of tools and dashboards, used both by QI staff and the executive team, to monitor and model their performance on the Star Rating measures.
But the MA organization representatives also described a fundamental change in the philosophy of the organization, stating that the company made a decision in 2011 “to revamp its payment program from pay-for-service to pay-for-value.” And the organization has found support, up to the top of the organization, to review and revamp how it does business:
“We started to have the mantra, ‘Quality is everyone’s job,’ and we moved out to a broader approach – we got plans involved, we got corporate involved. I think what was most important was that senior leadership got it, and since they got it, they started to apply resources to it. So something that was started in a department became something the whole company was involved in. Everyone was involved and knew the Star Ratings and it took on a life of its own.”
In contrast, the other SNP organization, which saw a decline in performance between 2011 and 2014, reported it did not typically engage in QI activities aimed specifically at improving its Star Ratings. The participant explained that while the QI activities that they pursue – such as diabetes disease management – have relevance for some of the measures, the organization designs programs to address care needs it has identified within its population rather than to address performance on the Star Ratings measures.
QI focus on particular measures or domains appeared, in many cases, to improve Star Ratings
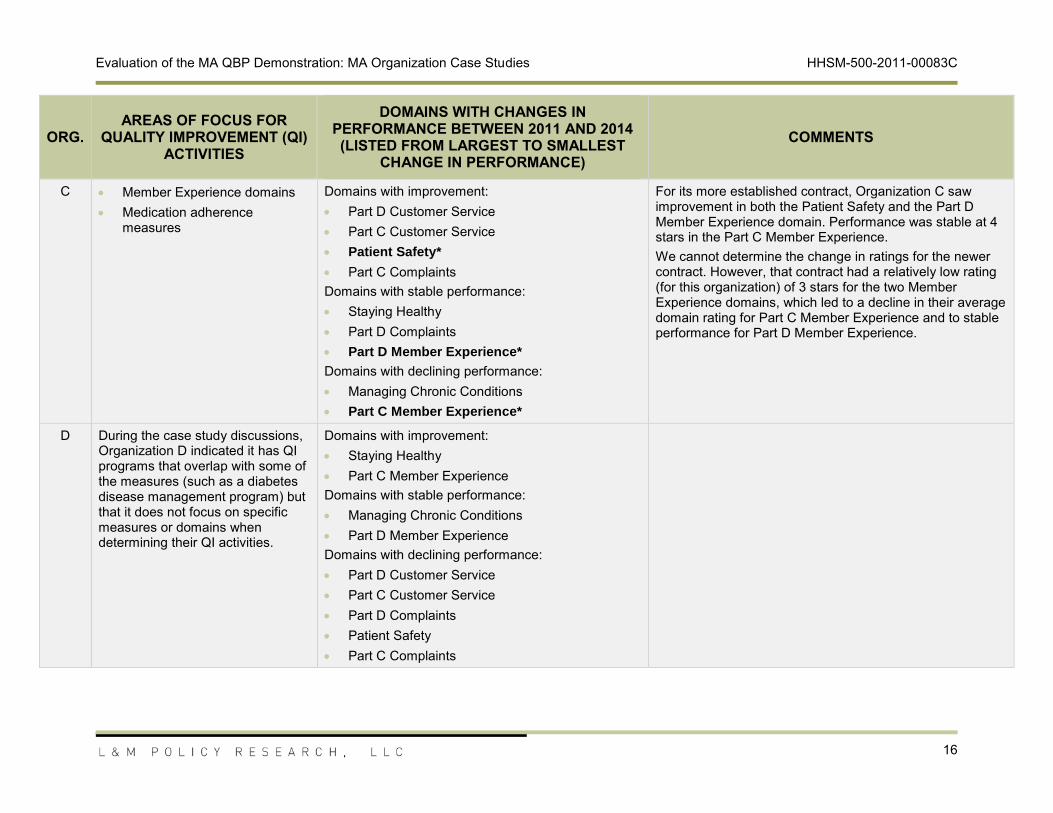
While case study organizations acknowledged that all Star Rating measures are important, budget and time realties meant that they tended to prioritize certain types of measures or certain domains for their QI efforts. L&M sought to compare the MA organizations stated areas of focus with their performance on specific domains to determine whether the organizations are improving in the domains targeted for QI efforts. (It should be noted, however, that case study participants may not have provided an exhaustive list of the measures or domains they focus on for QI.)
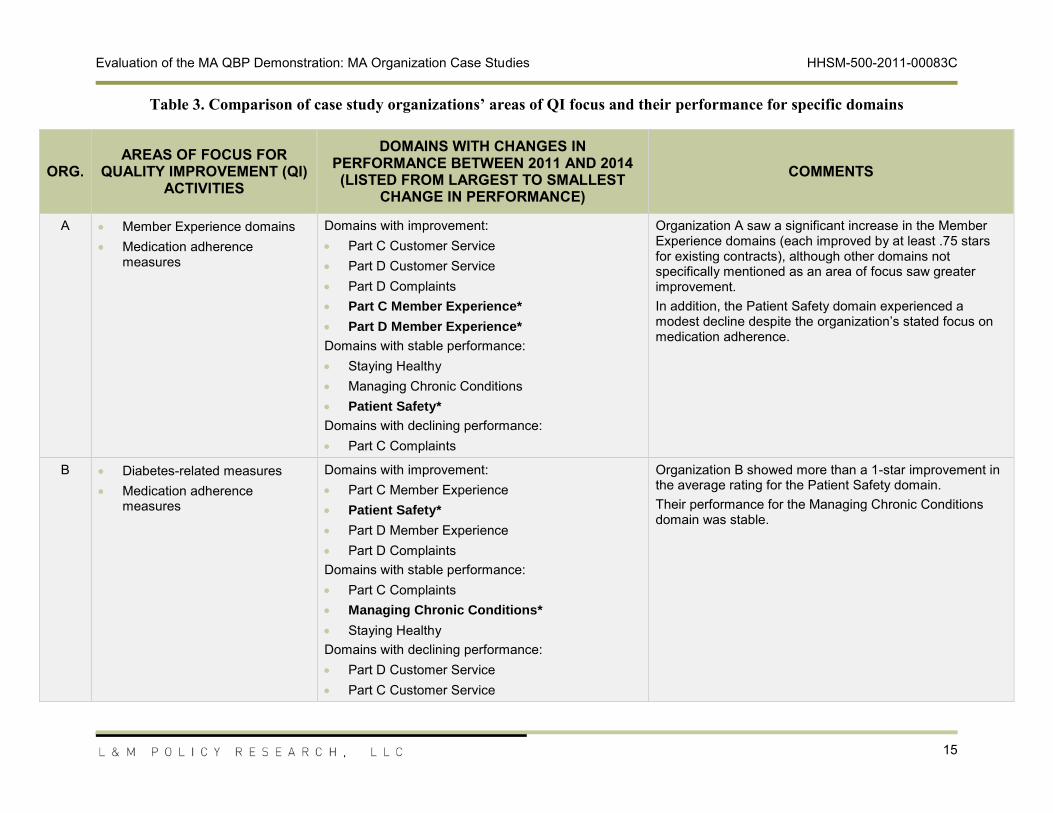
Table 3 describes the areas of focus MA organizations described during the case study interviews and the domains with an improvement or decline of at least 0.5 stars. (Please see Table 4 in Appendix II, which describes the changes in domain ratings between 2011 and 2014 for each contract offered by the MA organizations.) Domains that include the measures targeted by the
Evaluation of the MA QBP Demonstration: MA Organization Case Studies HHSM-500-2011-00083C
14
MA organization are bolded and marked with an asterisk. Despite the organizations’ QI efforts, the analysis showed that there were instances where the MA organization’s domain rating remained stable (that is, within 0.5 stars of the 2011 rating) and a few cases where the ratings actually declined. However, several of the case study organizations saw significant improvement in the domains they targeted for QI efforts, suggesting that organizations have the ability to impact their ratings.
Evaluation of the MA QBP Demonstration: MA Organization Case Studies HHSM-500-2011-00083C
15
Table 3. Comparison of case study organizations’ areas of QI focus and their performance for specific domains
ORG.
AREAS OF FOCUS FOR QUALITY IMPROVEMENT (QI)
ACTIVITIES
DOMAINS WITH CHANGES IN PERFORMANCE BETWEEN 2011 AND 2014 (LISTED FROM LARGEST TO SMALLEST
CHANGE IN PERFORMANCE)
COMMENTS
A Member Experience domains Medication adherence
measures
Domains with improvement: Part C Customer Service Part D Customer Service Part D Complaints Part C Member Experience*
Domains with declining performance: Part C Complaints
Organization A saw a significant increase in the Member Experience domains (each improved by at least .75 stars for existing contracts), although other domains not specifically mentioned as an area of focus saw greater improvement. In addition, the Patient Safety domain experienced a modest decline despite the organization’s stated focus on medication adherence.
B Diabetes-related measures Medication adherence
measures
Domains with improvement:
Part C Member Experience Patient Safety*
Part D Member Experience Part D ComplaintsDomains with stable performance: Part C Complaints Managing Chronic Conditions*
Staying Healthy Domains with declining performance: Part D Customer Service Part C Customer Service
Organization B showed more than a 1-star improvement in the average rating for the Patient Safety domain.Their performance for the Managing Chronic Conditions domain was stable.
Evaluation of the MA QBP Demonstration: MA Organization Case Studies HHSM-500-2011-00083C
16
ORG.
AREAS OF FOCUS FOR QUALITY IMPROVEMENT (QI)
ACTIVITIES
DOMAINS WITH CHANGES IN PERFORMANCE BETWEEN 2011 AND 2014 (LISTED FROM LARGEST TO SMALLEST
CHANGE IN PERFORMANCE)
COMMENTS
C Member Experience domains Medication adherence
measures
Domains with improvement: Part D Customer Service Part C Customer Service Patient Safety*
Part C ComplaintsDomains with stable performance:
Staying Healthy Part D Complaints Part D Member Experience*
Domains with declining performance: Managing Chronic Conditions Part C Member Experience*
For its more established contract, Organization C saw improvement in both the Patient Safety and the Part D Member Experience domain. Performance was stable at 4 stars in the Part C Member Experience. We cannot determine the change in ratings for the newer contract. However, that contract had a relatively low rating (for this organization) of 3 stars for the two Member Experience domains, which led to a decline in their average domain rating for Part C Member Experience and to stable performance for Part D Member Experience.
D During the case study discussions, Organization D indicated it has QI programs that overlap with some of the measures (such as a diabetes disease management program) but that it does not focus on specific measures or domains when determining their QI activities.
Domains with improvement: Staying Healthy Part C Member Experience
Domains with stable performance: Managing Chronic Conditions Part D Member ExperienceDomains with declining performance: Part D Customer Service Part C Customer Service Part D Complaints Patient Safety Part C Complaints
Evaluation of the MA QBP Demonstration: MA Organization Case Studies HHSM-500-2011-00083C
17
ORG.
AREAS OF FOCUS FOR QUALITY IMPROVEMENT (QI)
ACTIVITIES
DOMAINS WITH CHANGES IN PERFORMANCE BETWEEN 2011 AND 2014 (LISTED FROM LARGEST TO SMALLEST
CHANGE IN PERFORMANCE)
COMMENTS
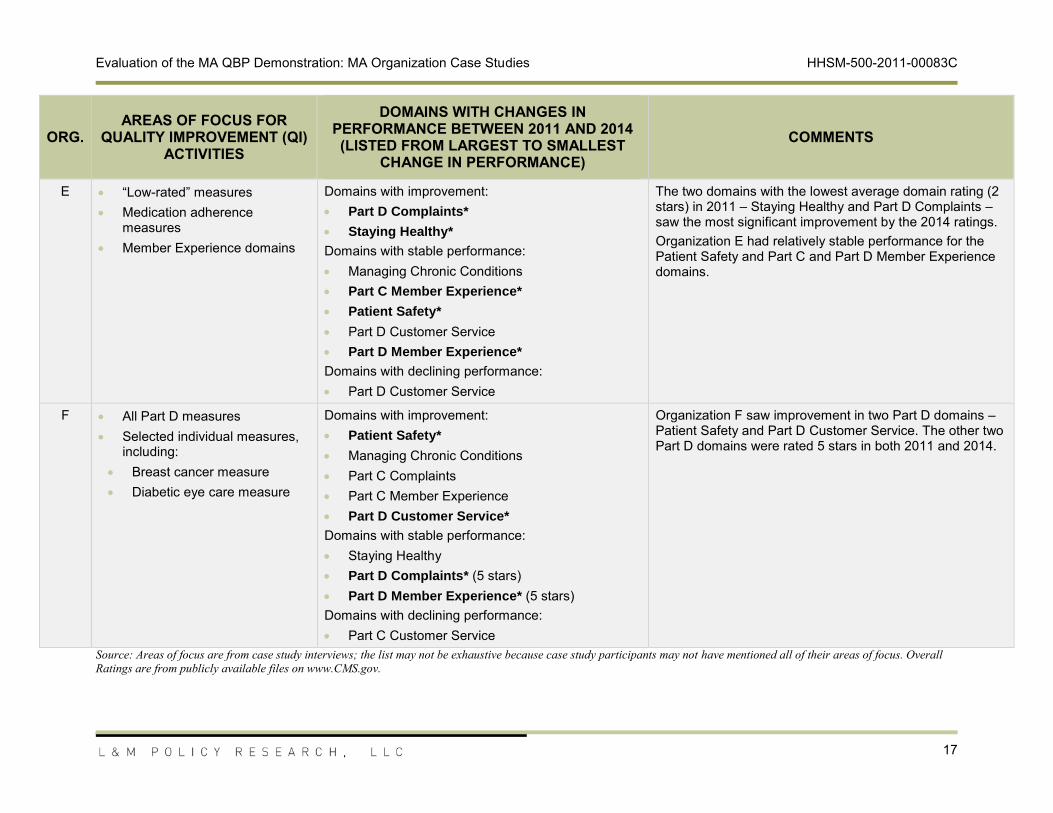
E “Low-rated” measures Medication adherence
measures Member Experience domains
Domains with improvement: Part D Complaints*
Staying Healthy*
Domains with stable performance: Managing Chronic Conditions Part C Member Experience*
Patient Safety*
Part D Customer Service Part D Member Experience*
Domains with declining
performance: Part D Customer Service
The two domains with the lowest average domain rating (2 stars) in 2011 – Staying Healthy and Part D Complaints – saw the most significant improvement by the 2014 ratings. Organization E had relatively stable performance for the Patient Safety and Part C and Part D Member Experience domains.
F All Part D measures Selected individual measures,
including: Breast cancer measure Diabetic eye care measure
Domains with improvement: Patient Safety*
Managing Chronic Conditions Part C Complaints Part C Member Experience Part D Customer Service*
Domains with stable performance: Staying Healthy Part D Complaints* (5 stars) Part D Member Experience* (5 stars)Domains with declining performance: Part C Customer Service
Organization F saw improvement in two Part D domains – Patient Safety and Part D Customer Service. The other two Part D domains were rated 5 stars in both 2011 and 2014.
Source: Areas of focus are from case study interviews; the list may not be exhaustive because case study participants may not have mentioned all of their areas of focus. Overall Ratings are from publicly available files on www.CMS.gov.
Evaluation of the MA QBP Demonstration: MA Organization Case Studies HHSM-500-2011-00083C
18
MA organizations are increasingly using data and predictive analytics to support their QI programs, with the demonstration providing additional impetus for investment
Nearly all the case study organizations indicated that they were increasingly using data analytics to support their QI efforts. While most participants did not highlight the demonstration specifically, it appeared that CMS’s Star Ratings initiatives collectively provided an impetus for several to invest in these analyses. One MA organization said its information technology (IT) investments were a direct result of the demonstration.
“In general, [analyses of quality measures] would not have received the attention within the organization were there not money tied to it. The demo gave us the opportunity and financial support when we reached three and three-and-a-half stars to transition . . . [The data analytics] would have been done eventually but not with the intensity and focus we have given it with the stars program.”
Some case study organizations conduct the analyses of their performance on Star Ratings measures in-house. Others contracted with an analytics vendor (either Inovalon or Optum), although in several cases this was seen as the short-term solution until the MA organization had the resources to perform the analyses internally.
“We have a vendor that helps us with our analytics and with our member outreach. . . We are engaging to take that whole [data analytics] task on – we want to do it all in house as much as possible. With the announcement of the demonstration, something quickly had to be done. Our long-term strategy is to bring that in house.”
The case study organizations report they will continue to pursue the same quality agenda post- demonstration
During the case study discussions, all of the participants indicated they will continue their QI activities after the end of the demonstration and did not anticipate any future changes in this area.
“I don’t think we are making any substantial changes, assuming the stars program continues in something like its current form. . . We are acting under the assumption that something like the stars program will be continued going forward. We can quibble with this or that measure or the details . . . but we are in support of the program. I never imagined it coming this far, so it is hard to imagine going back.”
While participants did not have plans to modify QI efforts, several organizations stated that lower-performing contracts, which would not qualify for QBPs under the ACA methodology, would be forced to cut benefits or raise costs for their plans when they lose the additional QBP revenue. One predicted this would lead to significant member dissatisfaction and the further erosion of their quality scores.
“We won’t have the funding, so impact to the member will be huge. Not just challenging for the plan, but challenging to the member—they will see higher costs and fewer benefits.”
Evaluation of the MA QBP Demonstration: MA Organization Case Studies HHSM-500-2011-00083C
19
Provider relationships
This section summarizes themes from discussions with MA organization staff about monitoring providers’ performance on Star Ratings measures and feedback given to providers and the effect of the MA QBP Demonstration on those activities. Discussions also addressed provider incentives, including P4P, to encourage QI.
Participating MA organizations have leveraged the demonstration to engage providers in efforts to improve Star Ratings
The case study organizations stated that quality bonus payments have created the opportunity to improve provider awareness of Star Ratings and align payment incentives for providers with quality measures, including Star Rating, while also noting this is part of a broader trend in the industry:
“QBP has accelerated the urgency in the industry and providers now understand why ratings are important. Stars defines what quality metrics are important because CMS has made it explicit with payment incentives. With stars, CMS basically defined what is important to them. I think providers now have consistency in message . . . I imagine providers now get it. Network providers now understand what they’re being measured against it. When I first started I was surprised at how many providers didn’t get it. And now providers do understand these things.”
Most case study organizations offer financial incentives to providers tied to Star Rating measures
Most participating MA organizations offer financial incentives for quality care provision, often only to the most engaged segments of their provider networks. Providers are typically incentivized on a per member per month basis for good or outstanding quality measure scores. Physician groups within multiple networks are offered gain-sharing opportunities that center on quality measure attainment. Within one of these organizations, HMO physicians can increase their gain share if they attend educational seminars on quality. In this organization, 30 percent of HMO physicians are engaged in incentive-based contracting.
Two organizations interviewed do not engage in incentive-based contracting. One of these does not yet track quality at the individual physician level or provide data on care gaps. However, their network providers are informed of general areas (e.g., diabetic hemoglobin testing) that need to be targeted. Physician receptivity to P4P models varies within this network but is highest in regions where other payer organizations offer incentive-based contracts. This organization is testing various initiatives surrounding data collection and provision and quality measurement with the goal of eventually implementing a P4P structure. This MA organization conducts claims data analytics using an in-house team and models projected Star Ratings within its quality department. This organization’s members commonly transition in and out of its products, which they feel complicates holding physicians accountable for the quality of care provided.
Evaluation of the MA QBP Demonstration: MA Organization Case Studies HHSM-500-2011-00083C
20
MA organizations provide Star Ratings information and resources to providers to help them close measure gaps
Case study organizations provide education on quality measures to participating physicians. The MA organizations reported providing physicians with information on quality metrics performance through scorecards or dashboards. The provision of that information varies in frequency, and information was generally provided more frequently to closely aligned physician groups. Several organizations encourage physicians to target the closure of specific gaps in care, using portals that show areas for improvement. And one organization that reported providing all physicians with performance data described a resulting “reduction in hospitalization [and] ED visits.”
One organization noted that it offers a call center for provider questions. Others mentioned providing support staff, such as healthy outcomes nurses, to visit physician practices and provide educational information. One distributes a provider newsletter and uses stars consultants to answer physician questions. Another organization created a subset of its provider network termed the “high performing network” who – identified on the basis of hospital affiliation, dual-eligible service, and strong performance – are invited to monthly seminars. At least one perceives that its provider relationships have improved in recent years, largely because of consistent physician outreach and open dialogue.
The case study organizations also reported providing resources like education and staff support to their physicians to help them improve on Star Ratings and other quality measures. These services were typically offered to a subset of the provider network. In general, physicians targeted for resource provision and knowledge sharing were those most closely aligned with the organization, having a greater share of patients in the MA product or greater financial incentives to improve Star Ratings. Depending on the organization, these included physicians in HMO products, Collaborative Care Models (CCMs), and high performance networks.
Marketing and beneficiary communications
This section summarizes themes from discussions with MA organization staff members about their use of Star Ratings in marketing materials.
The case study organizations do not typically emphasize Star Ratings in their beneficiary marketing materials
In general, the MA organizations did not attribute any changes to marketing as a result of demonstration and their comments about marketing and beneficiary communications focused on Star Ratings more generally. Participating organizations reported that they did not emphasize Star Ratings in marketing materials for beneficiaries beyond required disclosure. This approach was typically attributed in case study interviews to information the organizations acquired from brokers or consumer research, indicating that beneficiaries give more weight to additional benefits, provider networks, and out-of-pocket costs, rather than Star Ratings. These findings are consistent with those from our stakeholder interviews in 2012, in which the MA organizations “noted feeling the star rating itself had little influence on attracting enrollees and rather was equated with an MA organization’s capacity to offer a more price and benefits competitive
Evaluation of the MA QBP Demonstration: MA Organization Case Studies HHSM-500-2011-00083C
21
product.” In the case study interviews, one organization noted that, while the Star Rating system has increased plan quality, quality measures remain a low priority for its target customers. In the organization’s view, while members understand the meaning of the ratings, an organization’s network and brand tends to resonate more with beneficiaries than quality ratings. The organization’s perception that consumers prioritize benefit levels over quality ratings underscores the rationale for linking payment to quality. Policy that relied on providing quality information alone to consumers would likely have far less of an effect on organizations than linking payment to Star Ratings, since payment is critical to the level of benefits that can be provided.
Although not greatly emphasized in marketing, the case study organizations explained how their Overall Rating and competitive position factored into their use of Star Ratings in marketing to beneficiaries. For example, one organization with an average of 4.5 rating in 2014 noted that, while it competes largely on benefits, it uses Star Ratings as part of the overall appeal to agents and individuals and in advertisements. By contrast, the organization with the 2.5-star contract does not use Star Ratings in marketing and does not see evidence that it rating affects its ability to attract new enrollees; interviewees said they might use it in marketing materials if they had a 4-star rating, but beneficiaries are much more interested in the plan benefits. Two organizations noted that because they are competing with MA organizations in markets that have similar Star Ratings, stars do not differentiate between product offerings. One reported that other MA organizations in its market tend not to emphasize Star Ratings in beneficiary outreach but individual measures might sometimes be used as part of the sales presentation, depending on the interest of the potential member.
MA organizations also noted that some beneficiaries were more sensitized to quality than others. Staff at one case study organization reported that members who have received CMS letters about low-performing plans are especially likely to raise the issue of quality in sales conversations and plan outreach discussions. Another reported that potential members were more likely to be conscious of quality if they had found a plan through the Medicare Plan Finder available on Medicare.gov, where quality measures were discussed and ratings provided. Potential members who contact the plan directly are more likely to be focused on benefits than quality rating.
Challenges to improving Star Ratings
This section summarizes MA organization staff opinions about the challenges facing organizations as they work to improve Star Ratings.
Organizations cite patient populations and measurement issues as main challenges to improving Star Ratings
Both case study organizations that exclusively offer Special Needs Plans (SNPs) stressed that being a SNP placed them at a particular disadvantage relative to non-SNPs in raising Star Ratings. This made it more difficult, although they were motivated to improve their ratings, to take advantage of QBPs. This was a strong theme during discussions with both SNPs in the case study cohort. The two SNPs specified a number of SNP population characteristics that make it more difficult to achieve higher Star Ratings, including, higher propensity to be non-compliant, higher prevalence of comorbidities, higher prevalence of a young and disabled population, and
Evaluation of the MA QBP Demonstration: MA Organization Case Studies HHSM-500-2011-00083C
22
higher prevalence of behavioral health issues. As a result of these factors, comparing SNP plans to non-SNP plans penalizes organizations that serve the most vulnerable and frail populations, according to the two SNP organizations we interviewed. These organizations would like to see Star Ratings stratified for SNP populations in organizations that serve both SNP and non-SNP beneficiaries to see how these organizations are performing among the SNP population. One organization offered additional recommendations for improving the rating of SNPs, including: placing more weight on improvement or using an entirely different set of measures for SNPs. They feel that the CMS duals demonstration offers a completely different paradigm to measure performance that CMS should perhaps apply to SNPs.
In a similar vein to the SNPs, another large, multi-market MA organization cited regional disparities as on major challenge, noting it has contracts in multiple markets, it applies the same approach in each market it serves, and it does not try to improve in some areas and not others. However, differences in Star Ratings performance persist, which interviewees attributed to variation in beneficiary populations, giving the example of areas with higher obesity tending to have higher incidence of diabetes. They also noted that in addition to health risk factors, regional and cultural differences drive utilization differences that show up in measures like flu vaccination rates. They observed that CMS adjusts for some differences in Consumer Assessment of Healthcare Providers and Systems (CAHPS) measures but not for Healthcare Effectiveness Data and Information Set (HEDIS) or medication adherence measures. But given these differences, they would like to see the Stars program use different benchmarks for different contracts by comparing SNPs to SNPs and non-SNPs to non-SNPs, or contracts within a state to get a fairer comparison of performance.
One organization we interviewed offered a different perspective on improving Star Ratings among different demographic/geographic groups, noting that “too often we say it’s the members’ fault that they are not receiving appropriate care.” Starting with evidence of their lower measure results among members in the large cities and rural areas, this organization hired nurses to go into physician offices in these areas to work with physicians and members to get patients into the office. It implemented this intervention in one large urban area and not in others, as a control. Once the organization saw results in the intervention area and not in the control group areas, it expanded this program statewide.
One organization said the most difficult part of the Star Ratings program is the lag between making improvements and seeing those improvement reflected in their Star Rating. It feels that larger organizations have an advantage in their quality data analytics and can better predict how certain changes will ultimately affect the ratings. While this organization has made improvements in its ratings, its inability to improve ratings quickly enough means it will have fewer financial resources available and will have to cut benefits or increase costs for its plan offerings. As a result, they expect their performance on Star Ratings measures will fall; for example, members may be less satisfied with the plan, causing reductions in the contract’s scores for CAHPS measures, or the plan may have fewer resources to devote to quality improvement. This can create a downward spiral for the plan under the ACA payment methodology – when their Star Ratings decline, they will have to make further reductions in their benefits and/or quality improvement efforts, which leads to further decline in their ratings. This organization thinks that if it had a few more years under the demonstration it would be able to make additional improvements in its Star Rating to reach the 4-star threshold. For this reason, organizational
Evaluation of the MA QBP Demonstration: MA Organization Case Studies HHSM-500-2011-00083C
23
representatives would like to see the demonstration extended for plans that have shown improvements under the demonstration.
Organizations also mentioned a number of other challenges to improving Star Rating not directly related to the demonstration but, rather, to the Star Ratings program more generally. Two organizations mentioned that the elimination of the 4-star thresholds,4 which was announced in 2014 and is scheduled to be implemented for the 2016 Star Ratings, will be challenging for MA organizations. The predictability and transparency of the 4-star threshold allows them to set specific targets with providers and eliminating that threshold makes it difficult to specify what providers need to achieve to satisfy their contracts and focus on a clear goal. One organization noted that changes to measures and elimination of measures also makes management more difficult because organizations have made investments in tracking and improving measures that are no longer useful for their Star Ratings.
4 Since the 2011 Star Ratings, CMS has provided a “4-star threshold” for many of the Star Ratings measures. Any contract that performs better than the threshold will be assigned at least 4 stars for the measure; those that do not will be assigned 3 or fewer stars. In the Contract Year 2015 Call Letter, CMS announced its intention to eliminate the 4-star thresholds for the 2016 Star Ratings, indicating that such a revision both improves the ability of the agency to assign stars in a statistically meaningful way and encourages improvement in performance. (http://www.cms.gov/Medicare/Health-Plans/MedicareAdvtgSpecRateStats/Downloads/Announcement2015.pdf)
Evaluation of the MA QBP Demonstration: MA Organization Case Studies HHSM-500-2011-00083C
24
CONCLUSIONS AND NEXT STEPS
These case studies reveal that the case study organizations view the QBPs as vital. For organizations above 3 stars, the MA QBP Demonstration was seen as a fixed period of time to apply their resources to improving Star Ratings before the full effect of the ACA payment changes take effect. Although they experienced different trajectories in the Star Ratings over the course of the demonstration, both SNP organizations we interviewed felt that their populations presented challenges to improving their Star Ratings. Nevertheless, all organizations were investing in improving analytics and, in some cases, re-organizing staff to focus on improving Star Ratings. The QBPs available under the demonstration were cited as an impetus to focus MA organization leadership on the Star Ratings program and to marshal resources to quality improvement efforts that may increase their ratings. Similarly, the Star Ratings program and the demonstration were seen by some organizations as a tool to help focus contracted providers on improving quality, especially related to Star Ratings measures, and align provider and organizational goals.
Results discussed in the case studies will supplement the information gathered from the survey and data analysis, providing valuable context and details about successful QI activities. While the case study findings are not generalizable to all MA organizations, the perspectives presented here underscore the need identified in the stakeholder interviews to consider specific organization characteristics and market conditions, as well as enrollment changes over the course of the demonstration, as the research team continues the evaluation. To this end, the team analyses in the Final Evaluation Report will include: (1) stratifying results by HMO and PPO, the proportion of SNP enrollment, and contract-level HCC score and (2) examining the relationship between that market competition, particularly the Star Ratings of market competitors, and Star Ratings changes during the demonstration period.
Evaluation of the MA QBP Demonstration: MA Organization Case Studies HHSM-500-2011-00083C
25
APPENDIX I. DISCUSSION GUIDE FOR CONTRACT ADMINISTRATORS
[NOTE: THIS DISCUSSION GUIDE INCLUDES THE FULL RANGES OF QUESTIONS FOR ALL MAO STAFF THAT WOULD BE INTERVIEWED AS PART OF THE CASE STUDIES; ACTUAL QUESTIONS FIELDED WOULD DEPEND ON THE PARTICULAR COMPOSITION OF THE GROUP (or INDIVIDUAL) IN THE ROOM]
Introduction
Thank you for participating in the study and speaking with us today. As you know, the Centers for Medicare & Medicaid Services (CMS) has contracted L&M Policy Research, LLC, to assess the impact of the Medicare Advantage (MA) Quality Bonus Payment (QBP) Demonstration, which was designed to reward MA plans with high Medicare Star Rating. The demonstration broadened the Affordable Care Act of 2010 (ACA) mandate that MA plans earning at least four out of five stars be awarded a QBP by also extending payments to three-star plans and accelerating the phase-in of the QBP amounts.
As part of the evaluation, we are conducting case studies by speaking with a selected number of Medicare Advantage Organizations (MAOs) to better understand how operations may have changed in response to the bonus payments. We are also interested in understanding the related quality improvement (QI) activities your organization has undertaken.
We appreciate your willingness to speak with us about these issues—your honest opinions and comments will be extremely helpful for the purpose of this research. Please be assured that the information you share today will be kept confidential and will not be shared with anyone outside of the research team; additionally, your comments will not be linked to you or your agency/organization in any identifiable way. We would like to record the interview for internal use so we may refer back to it if we have questions in our notes. Recorded interviews will be kept in secure storage and then destroyed at the end of the study. Would it be okay to record our interview with you? Before we begin, do you have any questions regarding this project or our aims today?
General background
1. I’d like to start by asking you a few questions about your backgrounds and current roles within [name of organization].
A. Current position? B. How long have you been with [name of organization]? C. Can you tell me about your past experience working with MA plans, prior to joining
[name of organization]? D. What are your responsibilities related to the MA Star Rating program?
2. At what level are you monitoring the Star Rating – e.g., contract level vs. plan level? [Depending on response, the moderator will tailor the remaining interview questions to focus on contracts or plans.]
Evaluation of the MA QBP Demonstration: MA Organization Case Studies HHSM-500-2011-00083C
26
3. [If multiple contracts:] What do you think are some of the major driving factors in variance in Star Rating among your different contracts/plans?
4. Let’s talk a little about your QI efforts in general.
A. Do you target certain contracts/plans or have one general approach across all contracts/plans?
B. What, if any, sub-populations of beneficiaries do you target certain for QI efforts? C. [Tailor depending on number of and Star Rating for contracts under that parent
organization:]
I. What, if any, work have you done with helping already high-performing contracts/plans continue to improve their Star Rating?
II. What, if any, work have you done with low performing contracts/plans?
D. To what extent are you monitoring specific providers and their impact on your Star Rating? How does your market position and network configuration impact your ability to influence providers?
E. [For MAOs in diverse geographic areas:] To what extent do your QI efforts differ by geographic areas? Are these differences due to your organizations’ varying provider network configurations and market standing or due to other reasons?
QI initiatives related to Star Rating prior to the demonstration
5. Prior to the demonstration, what were the major areas of focus for your QI efforts? 6. Prior to the demonstration, did your organization implement QI efforts specifically
related to improving Star Rating? To what extent did the organization focus on boosting/maintaining your Star Rating? [If needed:] That is, to what extent did the Star Rating drive your overall QI efforts? Why?
A. Are there certain domains or measures that are easier for your organization to focus on to improve overall Star Rating? Which ones and why?
B. Are there domains or measures that are more difficult to improve? Which ones and why? How are your QI efforts and strategy influenced by this?
C. [If needed:] What are the factors that determine whether particular measures are within your control and therefore actionable?
D. In general, are there any barriers to impacting Star Rating? If so, what are they?
Evaluation of the MA QBP Demonstration: MA Organization Case Studies HHSM-500-2011-00083C
27
Impact of demonstration on MA plans
[INTERVIEWERS WILL REVIEW THE SURVEY RESULTS FOR EACH CASE STUDY PARTICIPANT IN ORDER TO BECOME FAMILIAR WITH THE CONTRACT’S QI ACTIVITIES/APPROACH AND WILL TAILOR THE QUESTIONS BELOW AS NEEDED.]
7. If you can recall, what was your reaction to the QBP demonstration announcement?
A. What types of analysis or planning, if any, did you conduct once you became aware of the demonstration?
8. To what extent are your QI efforts any different as a result of the demonstration? 9. Please describe what has changed in your organization’s QI focus and activities, either
due to the demonstration, or otherwise, since the demonstration began.
A. What types of activities did your organization engage in to improve Star Rating? How extensive were these efforts?
B. Were there any Star Rating domains that your organization specifically targeted to improve overall quality? Why?
I. How did your organization decide to invest your resources in these particular quality domains within the Star Rating system as opposed to others?
C. Did you devote more resources overall to QI efforts (as opposed to simply shifting the focus of your efforts)? If so, what level of increase?
D. Have changes in QI activities made in response to the demonstration continued after the demonstration ended?
10. Did you target specific contracts/plans? If so, what types and why?
A. Did your efforts to respond to the demonstration differ by (tailor questions as needed to reflect the number of and Star Rating for the parent organization’s contracts):
I. Regions? II. Populations served? III. Plans with a certain market position/standing? IV. Plans with influence with their provider network? V. Plans with certain Star Rating?
11. [For those offering plans in double bonus counties] Are there any differences in the way you responded to the QBPs in double bonus counties? Why?
A. Did you focus more resources on the qualifying counties compared to the non-qualifying counties in your service areas? What types of focused efforts did you implement for qualifying counties?
Evaluation of the MA QBP Demonstration: MA Organization Case Studies HHSM-500-2011-00083C
28
12. In which quality domains did you see the greatest improvement in quality performance ratings? Least improvement? Why?
A. Do you think successes of specific contracts/plans will be replicable? If so, in what instances?
13. What other impacts, if any, has the demonstration had on your organization? For example, impacts on:
A. Data and reporting systems B. Provider communications and feedback C. Provider incentives (positive or negative) to encourage quality improvement D. Staff incentives and accountability for Star Rating (E.g., Are Star Rating now tied to
performance bonuses, performance plans, etc.?)
14. Did you expect a significant return on investment (ROI) for the changes made in response to the demonstration?
A. Prior to the first year of QBPs, did you estimate bonus payment amounts under the demonstration based on your current ratings? Based on hypothetical scenarios for your Star Rating? [If yes:] How did this factor into your plans for QI initiatives? How close were your estimates to your actual QBPs? [If different:] Why?
B. What factors do you consider when calculating your ROI?
15. Was the bonus payment used for a specific purpose? If so, how was it used? (For example: QI efforts, staff bonuses, other improvements, passed on to the beneficiary.)
A. Did the bonus payment allow you to undertake extra activities that you otherwise would not have been able to do?
Other incentives related to Star Rating
16. Do you expect improvements in Star Rating will yield enrollment increases? Why or why not?
A. Are there particular domains that you would expect to drive changes in enrollment?
17. How have other recent CMS initiatives related to Star Rating impacted your QI efforts?
A. For example, have you made efforts to improve ratings for specific high-performing contracts to obtain the special enrollment period for 5-star plans? [If yes:] What is the relative importance of this initiative compared to the demonstration? Why?
B. Have you made efforts to improve ratings for your contracts in order to have access to a higher percentage of the rebate? [If yes:] What is the relative importance of this compared to the demonstration? Why?
C. Have you made any efforts to improve ratings for high-performing contracts to obtain the high-performing plan designation on the Medicare Plan Finder? [If yes:] What is the relative importance of this initiative compared to the demonstration? Why?
Evaluation of the MA QBP Demonstration: MA Organization Case Studies HHSM-500-2011-00083C
29
D. Have you made any efforts to improve ratings for low-performing contracts that have received or may receive the low-performing designation on the Medicare Plan Finder? [If yes:] What is the relative importance of this initiative compared to the demonstration? Why?
E. Are there other CMS initiatives that have impacted the level of resources you devote to QI efforts or how those resources are allocated?
18. What, if any, other incentives would you suggest offering to high performing plans? Would this increase your QI efforts?
Assessment of the QBP Demonstration
19. What is your assessment of the QBP demonstration?
A. How effective, if at all, was it in helping you to improve quality? In what way? Why? B. What worked well? What could be improved?
Closing
Finally, do you have any questions or other comments to share with us?
Thank you for taking the time to meet with us and share your insights for this important study. Your input is greatly appreciated.
Evaluation of the MA QBP Demonstration: MA Organization Case Studies HHSM-500-2011-00083C
30
APPENDIX II: ANALYSIS OF STAR RATING FOR CASE STUDY MA ORGANIZATIONS
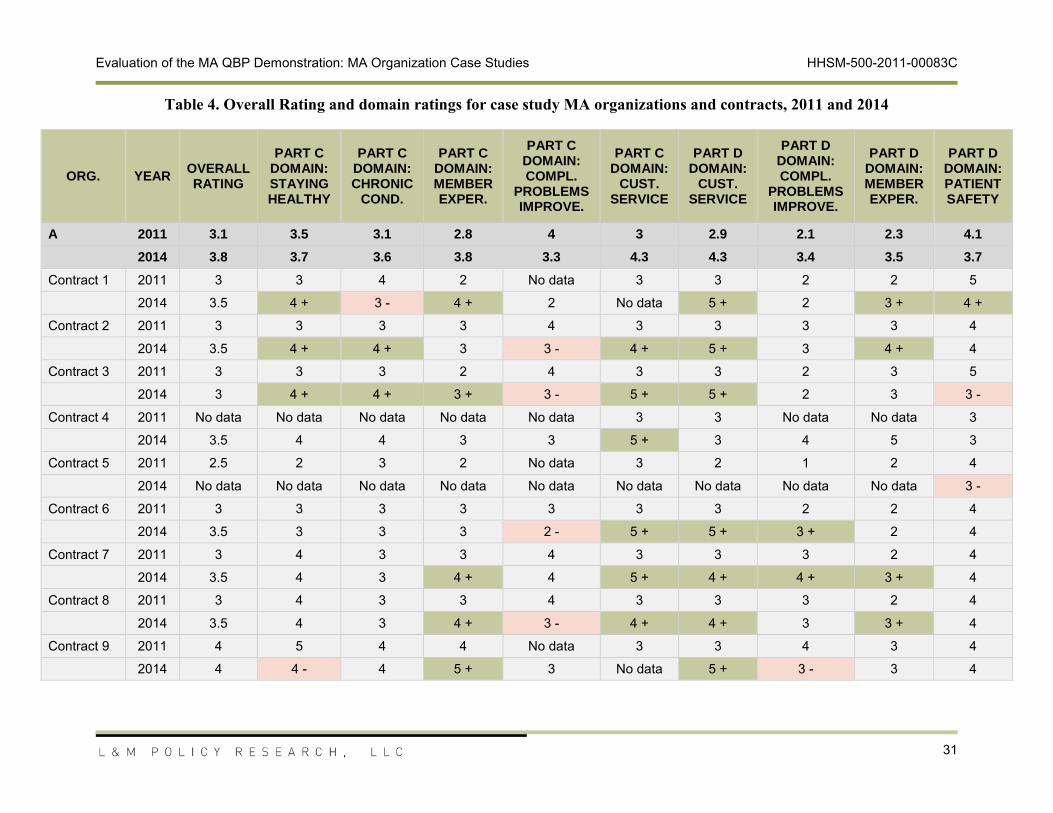
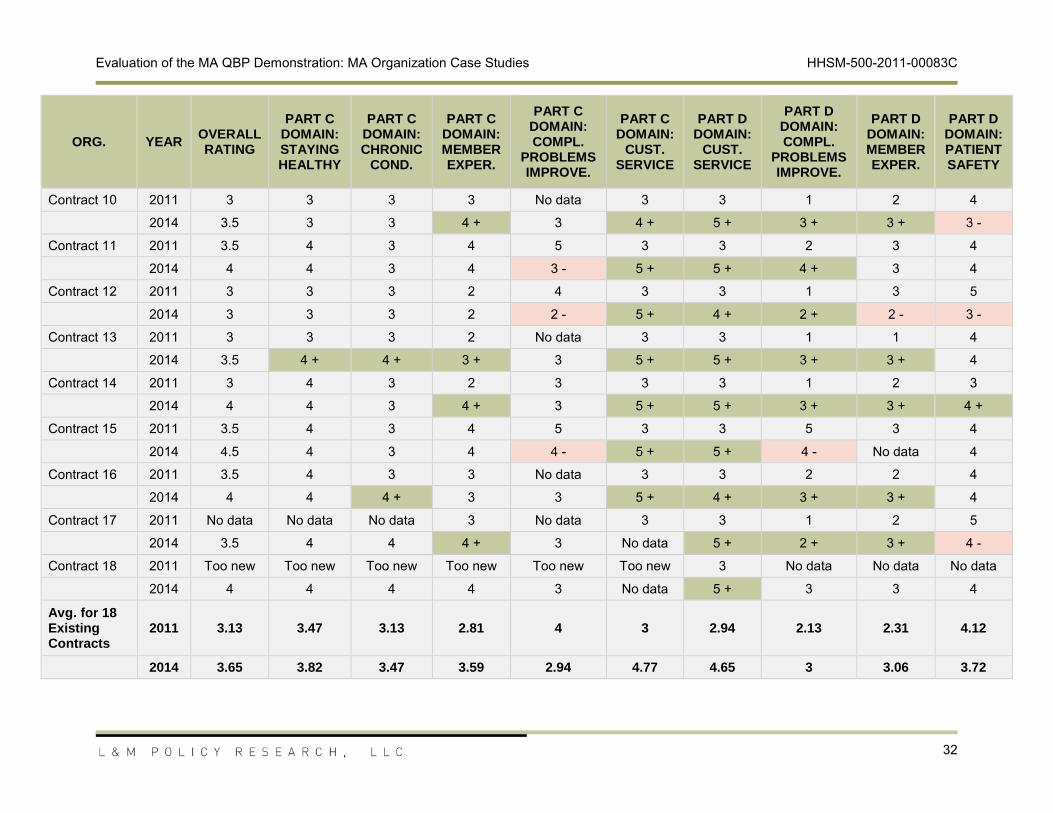
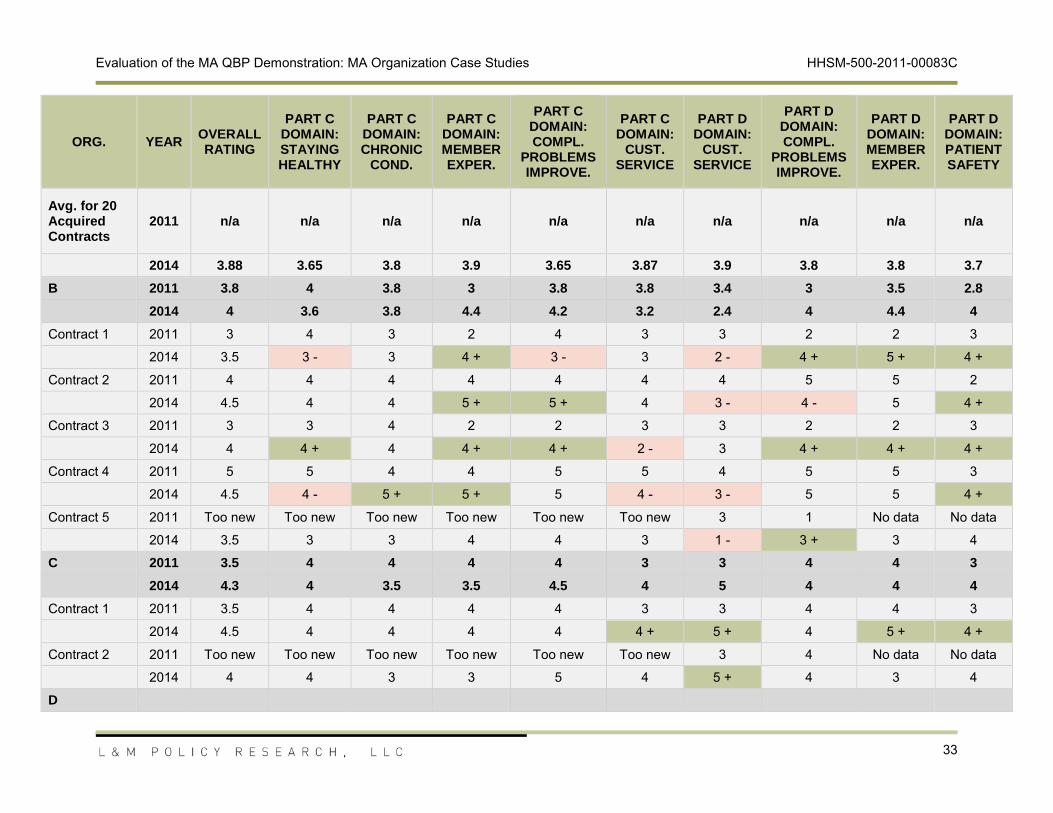
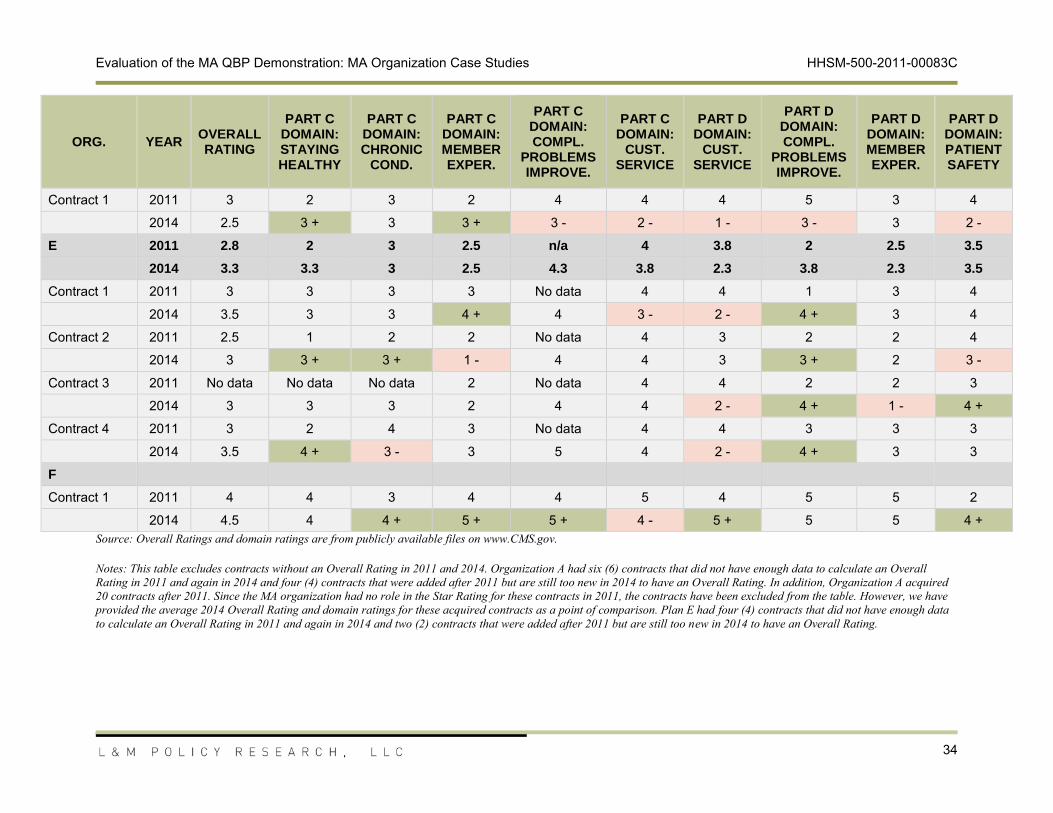
Table 4 shows the Overall Rating and domain ratings for 2011 and 2014 for each of the case study organizations’ contracts. When MA organizations have multiple contracts, we have also provided an average for the organization. When the contract had an improvement in the domain rating between 2011 and 2014, we have colored the cell green and included a “+” symbol; when the contract had a decline in performance between 2011 and 2014, we have colored the cell red and included a “-” symbol.
Evaluation of the MA QBP Demonstration: MA Organization Case Studies HHSM-500-2011-00083C
31
Table 4. Overall Rating and domain ratings for case study MA organizations and contracts, 2011 and 2014
ORG.
YEAROVERALL RATING
PART C DOMAIN: STAYING HEALTHY
PART C DOMAIN: CHRONIC
COND.
PART C DOMAIN: MEMBER EXPER.
PART C DOMAIN: COMPL.
PROBLEMS IMPROVE.
PART C DOMAIN:
CUST. SERVICE
PART D DOMAIN:
CUST. SERVICE
PART D DOMAIN: COMPL.
PROBLEMS IMPROVE.
PART D DOMAIN: MEMBER EXPER.
PART D DOMAIN: PATIENT SAFETY
A 2011 3.1 3.5 3.1 2.8 4 3 2.9 2.1 2.3 4.1
2014 3.8 3.7 3.6 3.8 3.3 4.3 4.3 3.4 3.5 3.7
Contract 1 2011 3 3 4 2 No data 3 3 2 2 5
2014 3.5 4 + 3 - 4 + 2 No data 5 + 2 3 + 4 +
Contract 2 2011
3 3 3 3 4 3 3 3 3 4
2014 3.5 4 + 4 + 3 3 - 4 + 5 + 3 4 + 4
Contract 3 2011 3 3 3 2 4 3 3 2 3 5
2014 3 4 + 4 + 3 + 3 - 5 + 5 + 2 3 3 -
Contract 4 2011 No data No data No data No data No data 3 3 No data No data 3
2014 3.5 4 4 3 3 5 + 3
4
5 3
Contract 5 2011 2.5 2 3 2 No data 3 2 1 2 4
2014 No data No data No data No data No data No data No data No data No data 3 -
Contract 6 2011 3 3 3 3 3 3 3 2 2 4
2014 3.5 3 3 3 2 - 5
+ 5 + 3 + 2 4
Contract 7 2011 3 4 3 3 4 3 3 3 2 4
2014 3.5 4 3 4 + 4 5 + 4 + 4 + 3 + 4
Contract 8 2011 3 4 3 3 4 3 3 3 2 4
2014 3.5 4 3 4
+ 3 - 4 + 4 +
3 3 + 4
Contract 9 2011 4 5 4 4 No data 3 3 4 3 4
2014 4 4 - 4 5 + 3 No data 5 + 3 - 3 4
Evaluation of the MA QBP Demonstration: MA Organization Case Studies HHSM-500-2011-00083C
32
ORG.
YEAROVERALL RATING
PART C DOMAIN: STAYING HEALTHY
PART C DOMAIN: CHRONIC
COND.
PART C DOMAIN: MEMBER EXPER.
PART C DOMAIN: COMPL.
PROBLEMS IMPROVE.
PART C DOMAIN:
CUST. SERVICE
PART D DOMAIN:
CUST. SERVICE
PART D DOMAIN: COMPL.
PROBLEMS IMPROVE.
PART D DOMAIN: MEMBER EXPER.
PART D DOMAIN: PATIENT SAFETY
Contract 10 2011 3 3 3 3 No data 3 3 1 2 4
2014 3.5 3 3 4 + 3 4 + 5 + 3 + 3 + 3 -
Contract 11 2011 3.5 4 3 4 5 3 3 2 3 4
2014 4 4 3 4 3 - 5 + 5 + 4 + 3 4
Contract 12 2011 3 3 3 2
4 3 3 1 3 5
2014 3 3 3 2 2 - 5 + 4 + 2 + 2 - 3 -
Contract 13 2011 3 3 3 2 No data 3 3 1 1 4
2014 3.5 4 + 4 + 3 + 3 5 +
5 + 3 + 3 + 4
Contract 14 2011 3 4 3 2 3 3 3 1 2 3
2014 4 4 3 4 + 3 5 + 5 + 3 + 3 + 4 +
Contract 15 2011 3.5 4 3 4 5 3 3 5 3 4
2014 4.5 4 3
4 4 - 5 + 5 + 4 - No data 4
Contract 16 2011 3.5 4 3 3 No data 3 3 2 2 4
2014 4 4 4 + 3 3 5 + 4 + 3 + 3 + 4
Contract 17 2011 No data No data No data 3 No data 3 3 1 2 5
2014
3.5 4 4 4 + 3 No data 5 + 2 + 3 + 4 -
Contract 18 2011 Too new Too new Too new Too new Too new Too new 3 No data No data No data
Evaluation of the MA QBP Demonstration: MA Organization Case Studies HHSM-500-2011-00083C
33
ORG.
YEAROVERALL RATING
PART C DOMAIN: STAYING HEALTHY
PART C DOMAIN: CHRONIC
COND.
PART C DOMAIN: MEMBER EXPER.
PART C DOMAIN: COMPL.
PROBLEMS IMPROVE.
PART C DOMAIN:
CUST. SERVICE
PART D DOMAIN:
CUST. SERVICE
PART D DOMAIN: COMPL.
PROBLEMS IMPROVE.
PART D DOMAIN: MEMBER EXPER.
PART D DOMAIN: PATIENT SAFETY
Avg. for 20 Acquired Contracts
2011 n/a n/a
n/a n/a n/a n/a n/a n/a n/a n/a
2014 3.88 3.65 3.8 3.9 3.65 3.87 3.9 3.8 3.8 3.7
B 2011 3.8 4 3.8 3 3.8 3.8 3.4 3 3.5 2.8
2014 4 3.6 3.8 4.4 4.2 3.2 2.4 4 4.4 4
Contract 1 2011 3 4 3 2 4 3 3 2 2 3
2014 3.5 3 - 3 4 + 3 - 3 2 - 4 + 5 + 4 +
Contract 2 2011 4 4 4 4 4 4 4 5 5 2
2014
4.5 4 4 5 + 5 + 4 3 - 4 - 5 4 +
Contract 3 2011 3 3 4 2 2 3 3 2 2 3
2014 4 4 + 4 4 + 4 + 2 - 3 4 + 4 + 4 +
Contract 4 2011 5 5 4 4 5 5 4 5 5 3
2014 4.5 4 - 5 + 5 + 5 4 - 3 - 5 5 4 +
Contract 5 2011 Too new Too new Too new Too new Too new Too new 3 1 No data No data
2014 3.5 3 3 4 4
3 1 - 3 + 3 4
C 2011 3.5 4 4 4 4 3 3 4 4 3
2014 4.3 4 3.5 3.5 4.5 4 5 4 4 4
Contract 1 2011 3.5 4 4 4 4 3 3 4 4 3
2014 4.5 4 4 4 4 4 + 5 + 4 5 + 4 +
Contract 2 2011 Too new Too new Too new Too new Too new Too new 3 4 No data No data
2014 4 4 3 3 5 4 5 + 4 3 4
D
Evaluation of the MA QBP Demonstration: MA Organization Case Studies HHSM-500-2011-00083C
34
ORG.
YEAROVERALL RATING
PART C DOMAIN: STAYING HEALTHY
PART C DOMAIN: CHRONIC
COND.
PART C DOMAIN: MEMBER EXPER.
PART C DOMAIN: COMPL.
PROBLEMS IMPROVE.
PART C DOMAIN:
CUST. SERVICE
PART D DOMAIN:
CUST. SERVICE
PART D DOMAIN: COMPL.
PROBLEMS IMPROVE.
PART D DOMAIN: MEMBER EXPER.
PART D DOMAIN: PATIENT SAFETY
Contract 1 2011 3 2 3 2 4 4 4 5 3 4
2014 2.5 3 + 3 3 + 3 - 2 - 1 - 3 - 3 2 -
E 2011 2.8 2 3 2.5 n/a 4 3.8 2 2.5 3.5
2014 3.3 3.3 3 2.5 4.3 3.8 2.3 3.8 2.3 3.5
Contract 1 2011
3 3 3 3 No data 4 4 1 3 4
2014 3.5 3 3 4 + 4 3 - 2 - 4 + 3 4
Contract 2 2011 2.5 1 2 2 No data 4 3 2 2 4
2014 3 3 + 3 + 1 - 4 4 3 3 + 2 3 -
Contract 3 2011 No data No data No data 2 No data 4 4 2 2 3
2014 3 3 3 2 4 4 2 - 4 + 1 - 4 +
Contract 4 2011 3 2 4
3 No data 4 4 3 3 3
2014 3.5 4 + 3 - 3 5 4 2 - 4 + 3 3
F
Contract 1 2011 4 4 3 4 4 5 4 5 5 2
2014 4.5 4 4 + 5 + 5 + 4 - 5 + 5 5 4 +Source: Overall Ratings and domain ratings are from publicly available files on www.CMS.gov.
Notes: This table excludes contracts without an Overall Rating in 2011 and 2014. Organization A had six (6) contracts that did not have enough data to calculate an Overall Rating in 2011 and again in 2014 and four (4) contracts that were added after 2011 but are still too new in 2014 to have an Overall Rating. In addition, Organization A acquired 20 contracts after 2011. Since the MA organization had no role in the Star Rating for these contracts in 2011, the contracts have been excluded from the table. However, we have provided the average 2014 Overall Rating and domain ratings for these acquired contracts as a point of comparison. Plan E had four (4) contracts that did not have enough data to calculate an Overall Rating in 2011 and again in 2014 and two (2) contracts that were added after 2011 but are still too new in 2014 to have an Overall Rating.
Evaluation of the MA QBP Demonstration: MA Organization Case Studies HHSM-500-2011-00083C
35
Table 5 summarizes the number of case study MA organizations and case study contracts with an improvement or decline in performance for each domain.
Table 5. Number of case study MA organizations and contracts with a change in domain rating between 2011 and 2014
Notes: MA organizations were considered to show an improvement or decline in performance if their average domain rating for all contracts changed by at least half a star. Contracts that did not have a domain rating in either 2011 or in 2014 have been excluded from the table. While all domains had at least a few contracts excluded because they lacked a domain rating for either 2011 or 2014, approximately half of the contracts were excluded from the Part C Complaints domain for this reason.