Page 1
EVALUATION OF THE PERFORMANCE OF STEEL
FIBER REINFORCED CONCRETE PIPES
PRODUCED BY PACKERHEAD
METHOD
by
ABDELAZIZ MOHSEN
Presented to the Faculty of the Graduate School of
The University of Texas at Arlington in Partial Fulfillment
of the Requirements
for the Degree of
MASTER OF SCIENCE IN CIVIL ENGINEERING
THE UNIVERSITY OF TEXAS AT ARLINGTON
MAY 2014
Page 2
ii
Copyright © by Abdelaziz Mohsen 2014
All Rights Reserved
Page 3
iii
Acknowledgements
I’d like to express my thanks and appreciation to my research adviser and
supporter, Prof. Dr. Ali Abolmaali, who granted me the opportunity to gain a unique
diverse experimental research experience while providing advice and guidance. Also, I’d
like to express my thanks to my committee, Dr. Shih-Ho Chao and Dr Park Yenho for
their unique academic impact and guidance.
I’d like also to thank Hanson Pipe and Precast for their contribution and
cooperation.
I’d like to express my gratitude to my example and motivation who showed me
that knowledge is power, the one who motivated me to pursue this degree, my dad, may
he rest in peace.
April 21, 2014
Page 4
iv
Abstract
EVALUATION OF THE PERFORMANCE OF STEEL
FIBER REINFORCED CONCRETE PIPES
PRODUCED BY PACKERHEAD
METHOD
Abdelaziz Mohsen, M.S.
The University of Texas at Arlington, 2014
Supervising Professor: Ali Abolmaali
This research aimed at evaluating the use of Dramix RC 65/35 CN steel fiber as
an alternative to the conventional reinforcement in concrete pipes. The performance of
steel fiber reinforced concrete pipes produced by Packerhead pipe production machine
was evaluated through an experimental testing of steel fiber reinforced concrete pipes
with diameters from 18 to 36 in. and different steel fiber dosages. Three-edge bearing
tests were carried out according to the ASTM C497 to determine the strength class of
each case of pipes. For more detailed image of the tested pipes’ performance, load-
deflection data were acquired and plots were made to determine the residual strength of
the tested pipes after reaching the peak strength. Material evaluation was done through
experimental testing of compressive cylinder and flexural beam specimens casted using
the same concrete batch and at the same time of the production of steel fiber reinforced
concrete pipes. Material testing was done according to the ASTM C39 and ASTM C1609.
The three-edge bearing test results and data showed that the steel fiber is
considered a proper alternative to the conventional steel reinforcement in concrete pipes.
Page 5
v
Most of the tested cases passed the ASTM C76 class III ultimate strength requirements,
as well as, the significant post ultimate strength residual strength when increasing the
steel fiber dosage.
Page 6
vi
Table of Contents
Acknowledgements .............................................................................................................iii
Abstract .............................................................................................................................. iv
List of Illustrations ............................................................................................................. viii
List of Tables ...................................................................................................................... xi
Introduction and Literature Review .................................................................... 1 Chapter 1
Introduction ..................................................................................................................... 1
Literature Review ............................................................................................................ 5
Production of Pipes......................................................................................................... 9
Steel Fiber Used ........................................................................................................... 10
Goals and Objectives.................................................................................................... 11
Material Experimental Testing .......................................................................... 12 Chapter 2
Introduction ................................................................................................................... 12
Concrete mix ................................................................................................................. 13
Flexural Beam Test....................................................................................................... 14
The Testing Machine ................................................................................................ 17
The Measuring Devices ............................................................................................ 18
Test Results .............................................................................................................. 22
Compressive Cylinder Strength Test ............................................................................ 28
The Testing Machine ................................................................................................ 31
Test Results .............................................................................................................. 32
Pipes’ Structural Testing .................................................................................. 37 Chapter 3
Introduction ................................................................................................................... 37
Three Edge Bearing Test ............................................................................................. 40
The Testing Machine .................................................................................................... 41
Page 7
vii
Measuring devices ........................................................................................................ 44
Test Results .................................................................................................................. 46
Summary, Conclusion, and Recommendations ............................................... 62 Chapter 4
Summary ...................................................................................................................... 62
Conclusion .................................................................................................................... 62
Recommendations ........................................................................................................ 65
Appendix A Flexural Beam Test Plots .............................................................................. 67
Appendix B Three-Edge Bearing Test Load-Deflection Plots ........................................... 78
Appendix C Compressive Cylinders Strength Results ...................................................... 93
References ........................................................................................................................ 95
Biographical Information ................................................................................................... 97
Page 8
viii
List of Illustrations
Figure 1-1 Earth Load on a Buried Pipe ............................................................................. 2
Figure 1-2 Steel Cage ......................................................................................................... 3
Figure 1-3 Steel Cage Load Carrying ................................................................................. 4
Figure 1-4 Packerhead Machine Rotors ............................................................................. 9
Figure 2-1 Dry Mix Harsh Looking .................................................................................... 13
Figure 2-2 Load-Deflection Plot Showing the First-Peak Load, Peak Load and Toughness
.......................................................................................................................................... 15
Figure 2-3 Beam and Cylinder Mold on the Vibrating Table ............................................. 15
Figure 2-4 Solidified Dry Mix ............................................................................................. 16
Figure 2-5 Beam Testing Machine (a) MTS Machine (b) Controlling Computer. ............. 17
Figure 2-6 Support and Loading Steel Pads Arrangement ............................................... 18
Figure 2-7 Linear Displacement Sensor (LVDT) ............................................................... 19
Figure 2-8 LVDT Fixation Frame ...................................................................................... 19
Figure 2-9 Data Acquisition System .................................................................................. 20
Figure 2-10 Sensors Connections to the Data Acquisition System .................................. 20
Figure 2-11 Beam Flexural Test Displacement Rate ........................................................ 21
Figure 2-12 Load Deflection Plot of 5 lb/yd3 Beam Showing the Brittle Behavior ........... 24
Figure 2-13 Brittle Failure of 5 lb/yd3 steel fiber beam ..................................................... 24
Figure 2-14 Load-Deflection Plot of beams with 16 lb/yd3 of fiber ................................... 24
Figure 2-15 Load-Deflection Plots of 44 lb/yd3 beams corresponding to pipes with
diameters of: (a) 24 in. (b) 33 in. (c) 36 in. ........................................................................ 25
Figure 2-16 Peak Strength of Flexural Beam Specimens ................................................. 26
Figure 2-17 Post Fist-Peak Load Residual Strength ........................................................ 27
Page 9
ix
Figure 2-18 Layers of Concrete in a Compressive Cylinder Test Specimen due to Dry Mix
.......................................................................................................................................... 28
Figure 2-19 Capping Fixture ............................................................................................. 30
Figure 2-20 One Side Failure due to Poor Capping ......................................................... 30
Figure 2-21 Compression Testing Machine ...................................................................... 31
Figure 2-22 Load Display and Control Valve .................................................................... 32
Figure 2-23 Segregation due to Dry Mix and High Frequency Vibration Consolidation ... 34
Figure 2-24 Crushing Failure ............................................................................................ 34
Figure 2-25 Typical Crack Patterns for (a) 16 lb/yd3 (b) 44 lb/yd
3 ................................... 35
Figure 2-26 Ultimate Compressive Strength of Concrete Cylinders ................................. 36
Figure 2-27 Average Ultimate Compressive Strength of Concrete Cylinders .................. 36
Figure 3-1 Load-Deflection Curve of Low fiber dosage Pipes (24”- 16 lb/yd3 ) ................ 39
Figure 3-2 Load-Deflection Curve of High fiber dosage Pipes (24”- 44 lb/yd3 ) ............... 39
Figure 3-3 Load Deflection Plot Showing First Post Ultimate Strength ............................ 40
Figure 3-4 Three-Edge Bearing Test ................................................................................ 41
Figure 3-5 Three-Edge Bearing Test Machine ................................................................. 42
Figure 3-6 Lower Bearing Adjustment .............................................................................. 43
Figure 3-7 Plot of constant vertical deflection rate ............................................................ 43
Figure 3-8 Cable Displacement Sensors (CDS) Positioning ............................................ 45
Figure 3-9 Hydraulic Pump, Control Valve, and Pressure Load Cell ................................ 45
Figure 3-10 Ultimate Dload Strength ................................................................................ 48
Figure 3-11 First Post Ultimate Dload Strength ................................................................ 49
Figure 3-12 Effect of Increasing Fiber Dosage in Post Peak Strength ............................. 50
Figure 3-13 Crack Propagation through the Separation Line ........................................... 52
Figure 3-14 Diagonal Crack .............................................................................................. 53
Page 10
x
Figure 3-15 Diagonal Crack End ....................................................................................... 53
Figure 3-16 Dload-Deflection Plot of 24 in. Diameter Pipes ............................................. 54
Figure 3-17 Crack Initiation and Propagation through the Separation Line...................... 55
Figure 3-18 Secondary Crack Development ..................................................................... 55
Figure 3-19 Dload-Deflection Plot of 30 in. Diameter Pipes ............................................. 56
Figure 3-20 Dlaod History Showing Strength Recovery ................................................... 56
Figure 3-21 Dload-Deflection Plot of 33 in. Diameter Pipes ............................................. 57
Figure 3-22 Multi Crack Development .............................................................................. 58
Figure 3-23 Multi Crack Development .............................................................................. 58
Figure 3-24 Dload-Deflection Plot of 36 in. Diameter Pipes ............................................. 59
Figure 3-25 Crack Propagation Through the Separation Line .......................................... 60
Figure 3-26 Cross Sectional Crack Profile for: (a) 18 in. (b) 24 in. (c) 33 in. (d) 36 in. .... 61
Page 11
xi
List of Tables
Table 2-1 Flexural Beam Test Cases ............................................................................... 22
Table 2-2 Compressive Cylinder Strength Test Specimens ............................................. 33
Table 3-1 Pipes Produces Details ..................................................................................... 46
Table 3-2 Ultimate Load, Ultimate Dload, Strength Class, and First Post Ultimate Dload47
Page 12
1
Chapter 1
Introduction and Literature Review
Introduction
Concrete pipes have been used to convey sewage water and storm water as a
gravity flow conduits and to convey low pressure irrigation water since 1800s. Before
concrete pipes were introduced to the competition, clay pipes and steel pipes were been
used for sewage water transport.
In 1980s, flexible plastic pipes, mainly Poly Vinyl Chloride PVC and High Density
Poly Ethylene HDPE, were introduced to the sewage water pipes market as a cheaper
alternative to precast concrete pipes. However, price has never been the unique pivotal
factor when other factors that have a direct effect on the performance of a product are
involved in comparison like strength, durability, constructability, dependability, and etc.
When concrete pipe strength is mentioned, it doesn’t only mean that it is
stronger, but it is designed and plant tested to resist the load by itself with a minimal
reliance on the installation conditions, unlike flexible pipe that relies mainly on the
installation conditions to support load. Being a rigid pipe system, concrete pipe strength is
more than 85% dependent on the pipe itself and only 15% on the burying soil developed
strength. The self-strength of concrete pipe enables it of withstanding construction flaws
and higher fill heights. On the other hand, flexible pipe is at least 95% dependent on the
surrounding soil’s support; hence, a backfill should be done as a pre-engineered process
with continuous measurements and monitoring to assure high compaction levels required
to provide the designed strength. In addition, when the soil properties aren’t achieving the
required design strength, imported backfill should be used. The difference in backfilling
process while installing flexible and concrete pipes not only increases the installation
costs, but extending the installation duration.
Page 13
2
Beside the self-gaining strength and the ease of constructability, concrete pipe is
distinguished by durability that exceeds, in most cases, a design life time of 70-100
years. Local availability of concrete pipes, non-flammability, design flexibility, hydraulic
efficiency, and sustainability are among the features that distinguish the concrete pipes
from flexible pipes.
Hence, various research has been carried out regarding improving the
performance of concrete pipes, as well as, lowering the cost of concrete pipes to add
another competing factor that expands the pipe concrete market more. Improving the
performance of concrete pipes involves the enhancing of the used concrete properties,
the reinforcement steel, and the geometry of the pipes.
The concrete pipe system uses the gravity flow to convey the sewage and storm
water; hence, there is no pressure force acting on the internal surface of the pipes unlike
other pressurized pipe systems. Being buried in almost all of cases, concrete pipes
experience earth loads due to both the weight of the soil and the masses over the pipe,
as well, as the live loads due to the moving masses over the earth surface, Figure 1-1.
Figure 1-1 Earth Load on a Buried Pipe
Page 14
3
Earth Load on a Buried Pipe
The load acting on a buried pipe generates a combination of flexural and shear
stresses in the pipe walls. Plain concrete pipes have been used for long time mainly with
small pipe sizes. Due to the concern with non-reinforced pipe not having any reserve
deformation capacity after it cracks, its use has declined in recent years. Concrete pipes
steel reinforcement is a circumferential helix shaped steel wire cage, Figure 1-2, that is
put and aligned inside the pipe’s casting form then concrete is casted over the
reinforcement. The steel cage is fabricated using steel wire rolls by special machine that
forms the steel wire to the required size in a helical path while welding it to the
longitudinal steel wires that provide a uniform spacing. For small diameter pipes, it’s
almost impossible to reinforce them with steel cage properly since adjusting steel cage
reinforcement at the middle of the wall becomes a precise operation. A small
displacement of the designed position of the reinforcement in the wall during casting
leads to a significant decrease in the ultimate strength of the pipe.
Figure 1-2 Steel Cage
As shown in Figure 1-3, the steel cage reinforcement mainly resists flexural loads
and slightly shear forces. When the load on a concrete pipe is high or not uniformly
Page 15
4
distributed along the surface of the pipe, the shear load portion increases, hence, the
increase of the steel cage reinforcement is not a proper solution and an additional shear
stirrups are required to resist the shear forces, which becomes a more sophisticated
process that consumes time, labor and material leading to an increase in the cost of
producing the pipe. Another factor, that was expected from previous research and
observed during this research, which leads to the domination of the shear failure, is the
pipe diameter. The larger the diameter of the pipe, the higher the loads to be carried and
the more the shear failure dominates.
Figure 1-3 Steel Cage Load Carrying
Concrete pipes reinforced using conventional steel reinforcement, either only
circumferential reinforcement or with shear reinforcement, has been used and showed a
capability of standing high imposed loads, in addition to the availability of standard
specifications and design guidelines. However, the production process of conventional
reinforcement concrete pipes is time, labor, and material consuming. Time is consumed
during the fabrication of the steel cages and a steel cage fabricating machine with an
assigned operator is required and any problem with the machine leads to the delay of the
whole production process and affecting the production rate.
Using steel fibers in the concrete mix used to produce concrete pipes provides
an alternative to the conventional steel cage reinforced pipes with a comparable strength
Page 16
5
and enhanced properties. Steel fiber network in the concrete mix provides a higher load
transfer than using conventional steel reinforcement. This load transfer mechanism
provides higher shear resistance than conventional reinforced concrete. In addition, steel
fiber reinforcement improves the crack resistance and increases the crack surface,
thereby improves the watertightness and durability of the pipe. Also, steel fibers in
concrete pipes don’t need any position adjustment unlike the conventional steel
reinforcement that needs precise position adjustment within the pipe walls to get the
designed strength.
In addition, using steel fiber for concrete pipes reinforcement improves the
production rates by excluding the steel cage fabrication from the production process and
incorporating the fibers into automated batching process used for concrete mixing.
Recently, automated reinforcement fiber dosing equipment have been available in the
market which provide accurate dosing and uniform distribution of steel fibers in the
concrete mix, reducing the labor cost and increasing the dosing and mixing quality.
Literature Review
Steel fiber reinforced concrete pipes have been used in Europe for over two
decades now. Performance-based guidelines have been developed allowing an efficient
design and use of steel fiber reinforced concrete pipes as competing alternative to the
conventional reinforced concrete pipes. The current European Standard Specifications
are mainly based upon the EN 1916:2002 “Concrete pipes and fittings, unreinforced,
steel fibre and reinforced”. Some of the European Standards that deals with fiber
reinforced concrete pipes are the French NF P16-345-2:2003, Belgium NBN –B21-
106:2004, Italian UNI EN 1916:2004, Netherlands NEN 7126:2004, Spain UNE
127916:2004, and the Turkish TS-821-EN-1916. A recent American Standard
Page 17
6
Specification, ASTM C1765 – 13 “Standard Specification for Steel Fiber Reinforced
Concrete Culvert, Storm Drain, and Sewer Pipe”, that establishes the requirements for
steel fiber reinforced pipes of internal diameters from 12 to 48 in. to be used in the
conveyance of sewage and storm water as well as industrial wastes.
Research studying the performance of steel fiber concrete in general and steel
fiber reinforced concrete pipes specifically have been carried out in the last decades.
An intensive experimental research was carried out by Mikhaylova (2013) to
evaluate the performance of steel fiber reinforced concrete pipes. A total of 116 pipes of
sizes from 15 in. to 48 in. diameters and with fiber dosages from 0.17% to 0.83% by
volume were tested according to ASTM C497 using three-edge bearing test. Steel fiber
reinforced concrete pipes showed adequate ultimate strength, residual strength,
toughness and watertightness. A significant crack size control was observed, were a
hairline crack was maintained till the ultimate load. Optimum fiber dosages of 0.25% and
0.5% by volume were recommended for 24 in. and 36 in. diameter pipes respectively.
Haktanir et al. (2007) investigated the performance of steel fiber reinforced
concrete pipes compared to those of plain concrete and conventionally reinforced pipes
under three-edge-bearing test. Dramix RC-80/60-BN of 2.36 in. (60 mm) length and ZP
308 with 1.18 in. (30 mm) length steel fibers were used in this study with dosages of 42
lb/yd3 and 67 lb/yd
3 for each type of fibers. The study showed that the three-edge-
bearing strength of RC-80/60-BN steel fiber reinforced concrete pipes was 82% greater
than the plain concrete pipes and 6% greater than the conventionally reinforced pipes.
Also, the crack size was 47% smaller than the plain concrete pipes and 15% smaller than
conventionally reinforced pipes. In addition, the pipes with dosage of 67 lb/yd3
didn’t
show a significant excess strength than the 42 lb/yd3 when taking into consideration the
60% increase in steel fiber dosage in the case of the 67 lb/yd3 .
Page 18
7
A study carried out by Thomas and Ramaswamy investigating the mechanical
properties of steel fiber reinforced concrete through 60 tests with varying the concrete
strength and the steel fiber dosage. The concrete strengths used were 35, 65, and 85
MPa with steel fiber volume fractions of 0, 0.5, 1.0, and 1.5% (approximately: 0, 66, 132,
and 198 lb/yd3). The average increase in the 1.5% volume fraction steel fibers
compression cube specimens’ strength due to the addition of steel fibers was significantly
low and didn’t exceed 3.65%. The average increase in the cylinder compressive strength
was slightly higher than that of the cube compressive strength and ranged from 4.6 to
8.33%. On the other hand, the addition of steel fibers significantly increased the split
tensile strength with an average of 40%, the modulus of fracture by an average of 42%.
The increase in the split tensile strength and the modulus of rupture was explained to be
due to the fibers across the cracks in the concrete matrix that carried higher loads after
crack than the strength of the matrix. The study showed an increase in the stiffness due
to the addition of steel fibers where the modulus of elasticity increased by an average of
8.6%.
Even though adding steel fibers doesn’t have a significant effect on the
compressive strength of concrete, it has a significant effect on the impact resistance of
the concrete. Impact resistance of steel fiber reinforced concrete has been studied by
many researchers. Nataraja et al. (2005) carried out an experimental study to investigate
the behavior of the steel fiber reinforced concrete under impact loads. Drop weight tests
performed on specimens with steel fiber dosages volume fractions of 0, 0.5, 1.0, and
1.5% (approximately: 0, 66, 132, and 198 lb/yd3 ) showed a significant increase the
impact resistance which increased by 25 times compared to the plain concrete. In
addition, a study by Bindiganavile and Banthia using a contoured double cantilevered
Page 19
8
beam showed that the steel fiber reinforced concrete showed greater crack growth
resistance under impact loading than polypropylene fiber reinforced concrete.
The watertightness of concrete plays a crucial rule in the durability of precast
concrete products. The effect of adding steel fiber to the concrete water permeability was
studied by Singh and Singhal (2011). An extensive experimental investigation using steel
fibers with various weight fractions of 1, 2, and 4% and with different aspect ratios of 65,
85, and 105 was carried out. The decrease in the water permeability of concrete after
adding steel fibers was significant and had an average of 75% less than the plain
concrete.
Page 20
9
Production of Pipes
Production of pipes was carried out in Hanson Pipe & Precast Inc. production
plant in Grand Prairie, Texas. The plant produces different types of precast products
including precast concrete pipes, culverts, manholes, junction boxes, and other precast
products as well as large diameter steel pipes. The pipes were produced using
Packerhead machine that utilized the spinning technique for concrete consolidation. The
Packerhead casting machine, shown in Figure 1-4, involved a main rotor with the
required pipe internal diameter and a group of small rotors with their axes fixed to the
main rotor that were rotating with high speeds. The rotors utilized the centrifugal force
generated as concrete was being poured over to perform the consolidation. Steel forms
of required pipe outside diameter were placed in the Packerhead and the rotor started
moving inside the forms from the base of the pipe upward while the concrete was been
poured from the top to form the pipe internal diameter.
Figure 1-4 Packerhead Machine Rotors
Page 21
10
The steel fiber was added to the concrete mix and mixed well before being
poured into the form over the rotor. Extra water was added during the casting directly
over the rotor with an amount decided by the machine operator based upon his
experience while avoiding extra water that might lead to the pipe failure after removing
the steel form. The steel form having the recently casted was then moved to the curing
zone where the steel form was removed. Plastic curtains enclosing the curing zone were
then moved down and steam nozzles were switched on provided saturated air with
almost 100% humidity. The pipes were left for curing till the next day before they were
moved to the storing zone outside the production plant.
Steel Fiber Used
Dramix RC 65/35 CN steel fiber was used throughout this research as the
concrete pipes reinforcement. It’s a cold drawn steel wire fiber with hooked ends to
ensure optimum anchorage. Dramix steel fiber was manufactured by Bekaert, a global
leader in fiber reinforced concrete products. The steel fibers are 35mm [1.4 in.] in length
with a 0.55 mm [0.022 in] diameter. The tensile strength of the steel fibers is 1,345
N/mm2 [195 ksi] while the Young’s Modulus is 210,000 N/mm
2 [30.5 x 10
3 ksi]. The
Dramix RC65/35BN conforms to the ASTM A820.
Page 22
11
Goals and Objectives
The aim of this research is to continue the evaluation of the performance of
Bekaert Dramix RC 65/35 CN steel fibers in various dosages as an alternative to the
conventional steel reinforcement in dry-cast concrete pipes with diameters from 18 to 36
in. produced using Packerhead pipe production machine. The performance is evaluated
based upon the three-edge bearing test results involving the determination of the ultimate
capacity of the pipes and the load-deflection plots. The results are to be compared to the
ASTM C76 “Standard Specification for Reinforced Concrete Culvert, Storm Drain, and
Sewer Pipe” to determine the corresponding ultimate strength class. Also, the material
properties of concrete with different dosages of steel fiber reinforcement are to be
determined including the flexural behavior and the ultimate compressive strength.
Page 23
12
Chapter 2
Material Experimental Testing
Introduction
Material testing description and results of the steel fiber reinforced concrete, used in
producing the pipes for this research, are presented in this chapter. The material tests
performed during this research were flexural beam test, compressive cylinder strength
test and direct tension test. The flexural beam tests were performed in accordance with
the ASTM C1609 “Standard Test Method for Flexural Performance of Fiber-Reinforced
Concrete (Using Beam with Third-Point Loading)”, the compressive cylinder tests were
done according to the ASTM C36 “Standard Test Method for Compressive Strength of
Cylinder Concrete Specimens” and the direct tension tests were performed according to
the ASTM. The specimens were casted with dimensions according to the ASTM C31
“Standard Practice for Making and Curing Test Specimens in the Field”. The specimens
were casted using the same mix used for producing each case of pipes at the same time
of the pipes’ production. The specimens then were left at the same curing spot of the
corresponding produced pipes at the production plant.
Dry cast concrete production method was used in producing the tested pipes. In
practice, either dry cast concrete or wet cast concrete production can be used in pre-cast
concrete products. The dry cast concrete mixes, known as no-slump mixes, use low
water to cement ratio to produce a zero slump concrete mix. The main advantage of
using dry cast production is the ability of the removal of the casting form immediately
after casting since the dry cast mix allows the pre-casted product to stand by itself
allowing the use of the same form in producing more than one pipe daily which
significantly increases production volume and lower both tools and labor costs. The
presence of a steel cage reinforcement in the traditional pipes helps the recently casted
Page 24
13
pipes to stand after removing the forms which allows some increase in the water to
cement ratio, however, the pipes produced for this research used steel fiber as a full
alternative to the traditional cage reinforcement which required the an even lower water
to cement ratio.
The use of the low water to cement ratio results in a harsh hardly workable mixes shown
in Figure 2-1. However, the dry cast mixes become usable through using specialized
consolidation techniques including heavy-duty vibration, packing, pressing and spinning.
In the case of this research, where Packerhead method was used, spinning was
consolidation technique used in casting the pipes as discussed in chapter 1.
Figure 2-1 Dry Mix Harsh Looking
Concrete mix
In addition to the low workability of the dry mix used, the low water to cement
ration significantly affects the strength of the matrix. The water to cement effect becomes
more significant when the pipe production is done during hot weather days. Every pipe
production plant has its own mixes that have been developed based upon their practice
and experience to satisfy the required strength of different types of pipes. In this
research, the concrete mix kept the same for all of the pipes produced which was the mix
that is used by Hanson for producing class III pipes. However, the water to cement ratio
varied based upon the size of the pipe to a ratio that keeps pipes standing after removing
the forms.
Page 25
14
Flexural Beam Test
Flexural beam test, known as “Third-Point Loading Test”, was performed to
evaluate the flexural performance of the steel fiber-reinforced concrete, used in producing
the research tested pipes, through using some parameters from the load deflection
curves obtained during the test. The tests were carried on according to the ASTM C1609
“Standard Test Method for Flexural Performance of Fiber-Reinforced Concrete (Using
Beam with Third-Point Loading)”. This test determines the first-peak and peak load and
their corresponding stresses using the modulus of rupture formula shown below . It also
determines the residual loads at a specified deflection which can be used to determine
the residual strength at this deflection. The area under the load-deflection curve can be
used to determine the toughness of the tested specimen which is an indication of the
energy absorption capability of the specimen shown in Figure 2-2.
where:
ƒ = the strength, psi [MPa]
P = the load, lbf [N]
L = the span length, in. [mm]
b = the average width of the specimen at the fracture, in. [mm]
d = the average depth of the specimen at the fracture, in. [mm]
Page 26
15
Figure 2-2 Load-Deflection Plot Showing the First-Peak Load, Peak Load and Toughness
The beam specimens tested were casted in the pipe production plant at the
same time of the casting of each group of pipes using the same steel fiber reinforced
concrete mix. Steel molds with a standard size of 6 by 6 by 20 in. according to the ASTM
C1609 and ASTM C31 were used for casting the specimens. The casting involved using
a vibration table on which each mold was put and even thickness layers of concrete were
added and compacted. Due to the low workability of the dry mix, the vibrating table didn’t
provide enough compaction, hence, an additional compaction was done using a tamping
rod providing high amplitude impact and pressing compaction Figure 2-3.
Figure 2-3 Beam and Cylinder Mold on the Vibrating Table
0
1000
2000
3000
4000
5000
6000
7000
8000
0 0.02 0.04 0.06 0.08 0.1 0.12
Load
(lb
f)
Deflection (in.)
Beam Load-Deflection Curve
Toghness at deflection of 0.12 in.
First-peak Peak load
Page 27
16
After fully casting the molds, they were put in the curing zone with the
corresponding pipes to experience the same conditions of the pipes. A practical
observation while casting the beam specimens was the effect of the temperature on the
workability of the mix to be used to cast the molds. During high temperature days, the mix
to be used for casting the beam specimens started solidification in a short period of less
than an hour after mixing the concrete mix, as shown in Figure 2-4, and hence, a limited
number of specimens could be casted for each concrete batch.
Figure 2-4 Solidified Dry Mix
Page 28
17
The Testing Machine
The MTS 100 kips machine was used to perform this test, Figure 2-5. It is a
displacement control testing machine used to provide both tensile and compressive loads
through a hydraulic cylinder powered by a set of hydraulic pumps. The machine is
controlled by a computer that has testing software that allows specifying a displacement
rate to be applied for the test. A support and loading attachments were used to provide a
simple beam support and loading case were the supporting steel pads, as well as, the
loading steel pads were free to rotate around their axes, Figure 2-6.
Figure 2-5 Beam Testing Machine (a) MTS Machine (b) Controlling Computer.
(a) (b)
Page 29
18
The beams were placed on the supports and their positions were adjusted to an
18 in. span between the two supports and a distance of 6 in. between the two loading
points with the center of the loading points coinciding the center of the beam. A beam
surface full contact with the supports and the loading pads should be satisfied to avoid a
non-uniform distributed load along the line of contact which would generate a very high
stresses on one side of the beam leading to an early crack development and lower
measured strength of the beam.
Figure 2-6 Support and Loading Steel Pads Arrangement
The Measuring Devices
The main output of this test was the load-deflection curves for different fiber
dosages concrete beams. The MTS machine is equipped by a load cell that gives the
total load exerted by the hydraulic cylinder. The load cell is connected to the MTS
machine scanner from which the load cell data was acquired by connecting this scanner
to the data acquisition system used that is discussed in the next sections. The beam
deflection was measured using a Linear Displacement Sensor, known as Linear Variable
Differential Transformer (LVDT), with an accuracy of ± 1.75 x 10⁻³
in. and a displacement
Page 30
19
range of 0.5 in, Figure 2-7. Two LVDTs were used in both sides of the tested beam to get
more reliable data and observe any abnormal behavior or noise during the test. An
arrangement similar to the one shown in the ASTM C1609 was used where the LVDTs
were fixed on an aluminum frame that was fixed to the tested beam surface at the
horizontal centerline of the beam, 3 in. from the top and the bottom of the 6 in. beam as
shown in Figure 2-8.
Figure 2-7 Linear Displacement Sensor (LVDT)
Figure 2-8 LVDT Fixation Frame
Page 31
20
The MTS machine load cell connection and the hydraulic cylinder displacement
from the MTS scanner, as well as, the LVDTs were connected to a data acquisition
system consisted of a scanner connected to a portable computer equipped with data
acquisition software Figure 2-9. The data acquisition rate was adjusted to 10 readings per
seconds, which was pretty enough to get smooth load-deflection curves.
Figure 2-9 Data Acquisition System
Figure 2-10 Sensors Connections to the Data Acquisition System
Page 32
21
According to the ASTM C1609, the displacement rate for a 6 by 6 by 20 in. beam
specimen up to a net deflection of L/900 (0.02 in.) should be from 0.0015 to 0.004 in./min
and from 0.002 to 0.012 in./min for a net deflection beyond L/900. Also, the data
acquisition of load and deflection should be carried out till a net deflection of at least
L/150 (0.12 in.). The displacement rate was defined in the MTS machine software to be
applied as a predefined testing procedure every time a test was carried out. FIG shows a
typical displacement history acquired from one of the tests performed.
Figure 2-11 Beam Flexural Test Displacement Rate
-0.02
0
0.02
0.04
0.06
0.08
0.1
0.12
0.14
0.16
0.18
0 500 1000 1500 2000 2500
Dsp
lace
me
nt
(in
.)
Time (s)
Page 33
22
Test Results
During the research, a total of 29 steel fiber reinforced concrete beams were
casted at the pipe production plant and tested at the UT Arlington civil engineering lab at
least seven days after the production date. Table shows the details of the different beams
produced, the steel fiber dosage and the corresponding pipe group that was produced
using the same concrete mix. Knowing the corresponding pipe group helps to relate the
flexural beam test results to the corresponding pipe three edge bearing test results
highlighting the effect of the water to cement ratio that differs from one pipe size than the
other, the effect of the weather temperature, and the human driven machine variation
effect.
Table 2-1 Flexural Beam Test Cases
Pipe Diameter (in.)
Steel Fiber Amount lb/yd
3 (% Vol.)
Number of Beams Produced
18 in.
5 (0.04) 2
11 (0.08) 2
16 (0.12) 2
22 (0.17) 2
18 in. (with steel cage)
5 (0.04) 1
11 (0.08) 1
16 (0.12) 1
24 in.
11 (0.08) 2
16 (0.12) 2
22 (0.17) 2
44 (0.33) 1
66 (0.5) 1
16 (0.12) 1
22 (0.17) 1
30 in. 33 (0.25) 1
33 in. 44 (0.33) 2
66 (0.5) 2
36 in. 44 (0.33) 1
88 (0.67) 2
Page 34
23
Flexural beam test results led to some important observations. There was a
significant variation in the results of the test of beams with same steel fiber dosages and
even those that were casted using the same concrete batch. Variation in results of beams
casted from using the same concrete batch is mainly due to two main reasons; first, the
consolidation level, which depended on the person performing the consolidation, and the
second reason was the time of casting the beams, which became a significant factor
during high temperature multi-dosage casting days during which the concrete to be used
to cast the late beam start solidification quickly during casting other beams. The effect of
casting time appeared significantly in the results of the beams corresponding to the 18 in.
pipes which were produced during summer where the 5 lb/yd3 beams were casted first
then the 11 and 16 lb/yd3 which showed a significant low ultimate strength.
The very low steel fiber dosage beams of 5 and 11 lb/yd3 showed a pure brittle
behavior as it experienced total failure as soon as the peak load was reached and crack
occurred as shown in Figures 2-12 and 2-13. Beams of 16 and 22 lb/yd3 showed a
significant drop in strength after the peak load but kept a low residual strength of about
10% of the peak strength that prevented sudden collapse of beams as shown in Figure 2-
14. Higher steel fiber dosages of 33 lb/yd3 and higher showed a significant post ultimate
residual strength. A hypothesis of the relation between the steel fiber dosage and the
post ultimate residual strength couldn’t be proved to be true due to the significant
variation in the results due to the lake of homogeneity of the dry mix when casted in
beam molds, an example of this variation is shown in Figure 2-15.
Page 35
24
Figure 2-12 Load Deflection Plot of 5 lb/yd3 Beam Showing the Brittle Behavior
Figure 2-13 Brittle Failure of 5 lb/yd3 steel fiber beam
Figure 2-14 Load-Deflection Plot of beams with 16 lb/yd3 of fiber
0
2
4
6
8
10
0 0.002 0.004 0.006
Load
(lb
f)
Tho
usa
nd
s
Deflection (in.)
Beam Load-Deflection Curve
0
2000
4000
6000
8000
10000
12000
-0.02 0 0.02 0.04 0.06 0.08 0.1 0.12
Load
(lb
f)
Deflection (in.)
Beam Load-Deflection Curve
LVDT 1
Page 36
25
Figure 2-15 Load-Deflection Plots of 44 lb/yd3 beams corresponding to pipes with
diameters of: (a) 24 in. (b) 33 in. (c) 36 in.
0
1000
2000
3000
4000
5000
6000
7000
8000
0 0.05 0.1
Load
(lb
f)
Deflection (in.)
Beam Load-Deflection Curve
0
1000
2000
3000
4000
5000
6000
7000
8000
0 0.05 0.1
Load
(lb
f)
Deflection (in.)
Beam Load-Deflection Curve
0
1000
2000
3000
4000
5000
6000
7000
8000
9000
0 0.02 0.04 0.06 0.08 0.1 0.12
Load
(lb
f)
Deflection (in.)
Beam Load-Deflection Curve
(a) (b)
(c)
Page 37
26
Figure 2-16 Peak Strength of Flexural Beam Specimens
Figure 2-16 shows the peak strength of the tested beams for different steel fiber
dosages. The variation in the test results for the same fiber dosage specimens was
obvious; however, there were some close results in some cases. For the 11 and 16 lb/yd3
, the beams corresponding to the 24 in. pipes showed close results, the upper two results
for each case, and were significantly higher than those for the beams corresponding to
the 18 in. pipes, the lower two results for each case. Also, the 44 lb/yd3 beams
corresponding to different pipes showed a significant close peak loads. The average
peak load for the whole group of beams was 7580 lbf which is corresponding to peak
strength of 630 psi.
0
200
400
600
800
1000
Pe
ak S
tre
ngt
h (
psi
)
Steel Fiber Dosage (lb/yd³)
5 11 16 33 44 66 88
Page 38
27
Figure 2-17 Post Fist-Peak Load Residual Strength
Figure 2-17 shows the toughness of flexural beams with different fiber dosages. Beams
with low steel fiber dosages of 5, 11 and 16 lb/yd³ showed a significantly low toughness.
Beams with fiber dosage of 33 lb/yd³ and higher showed a significantly higher toughnes
with an average of 50 ft-lbf.
0
10
20
30
40
50
60
70
80
Tou
ghn
ess
(ft
-lb
f)
Steel Fiber Dosage (lb/yd³)
5 11 16 33 44 66 88
Page 39
28
Compressive Cylinder Strength Test
Steel fiber reinforced concrete cylinders were casted at the production plant for
compressive strength testing. Specimens were casted using the same concrete mix used
in producing each group of pipes at the same time of pipes production. The cylinders
were made according to the ASTM C31 “Standard Practice for Making and Curing
Concrete Test Specimens in the Field”. Standard size plastic cylinders of 4 in. diameter 8
in. height were used as casting molds in making the cylindrical specimens. The casting
involved using a vibrating table, as well as, a tamping rod for consolidation. Then the
cylinders were filled with even layers with approximately equal depth of concrete and
compaction using the tamping rod was done for each layer. According to the ASTM C31,
two layers of concrete and 25 roddings per layer are recommended, but due to the low
workability of the dry mix, from 3 to 4 layers were put to assure well consolidation. After
casting, the cylinders were put at the curing zone with the corresponding pipes. In some
cases when the mix was significantly dry, the different layers of the casted cylinder were
so obvious, shown in Figure 2-18. Lack of fiber interference between two adjacent layers
would be expected due to the compaction of each layer before putting the next layer.
Figure 2-18 Layers of Concrete in a Compressive Cylinder Test Specimen due to Dry Mix
Page 40
29
After curing, the cylinders were prepared and tested according to the ASTM C36
“Standard Test Method for Compressive Strength of Cylinder Concrete Specimens” at the
UT Arlington civil engineering lab. The test involved applying compressive axial load to
the concrete cylinders at a specified loading rate range till failure. It was used to
determine the ultimate compressive strength of different steel fiber concrete cases. The
values obtained from this test were expected to have significant variation since those
values depends upon the mixing procedures, methods of sampling, molding,
consolidation, temperature and other factors. For the dry mix case in this research,
consolidation level and temperature during casting varied significantly from one specimen
to the other. However, the test was done to get an averaged image of the compressive
behavior of different dosage concrete mixes, as well as, to find a link between the pipe
behavior under three edge bearing test, discussed in chapter 3, and the compressive
behavior of the compression cylinders, as well as the flexural behavior, in case of an
unusual three edge bearing behavior to decide if the problem was a material problem or a
production problem.
After de-molding the specimens, the concrete cylinders were capped with a
capping compound that meets the ASTM C617 providing a uniform distribution of load
and ensuring that neither end of the tested cylinder was inclined to the perpendicular to
the cylinder axis with more than 0.5° according to the ASTM C39. The capping material
was melt and poured in a capping fixture that provided capped surfaces perpendicular to
the axis of the cylinder shown in Figure 2-19. The capping quality was a crucial factor that
affected the test results. A slightly inclined surface results in a side failure of cylinder at a
significant lower load than the expected ultimate load, shown in Figure 2-20. Hard rubber
pads were been allowed to use instead of capping, but according to previous experience,
rubber pads caused damage to the testing machine when used.
Page 41
30
Figure 2-19 Capping Fixture
Figure 2-20 One Side Failure due to Poor Capping
Page 42
31
The Testing Machine
The testing machine used was a 500 kips compression machine, Figure 2-21, in
which the load was applied through a hydraulic cylinder powered by a hydraulic pump.
The testing machine complied with the ASTM C39. The hydraulic cylinder allowed a
continuous applying of load without shock at a specified loading rate that can be
controlled using a hydraulic valve attached to the oil supply line after the pump shown in
Figure 2-22. The testing machine was equipped by a hardened face steel upper
spherically seated bearing block, which provided a tolerance for very low inclinations of
the capped surfaces, and a lower cylinder bearing. The testing machine had a built-in
load cell to measure the instant load, as well as, the loading rate which were displayed on
the equipped display.
Figure 2-21 Compression Testing Machine
Page 43
32
Figure 2-22 Load Display and Control Valve
The loading rate was increased gradually, using the control valve, to avoid the
occurrence of a shock and then kept within 440 ± 90 lb/s during the test, which
corresponded to 35 ± 7 psi/s stress rate specified by the ASTM C39, until failure
occurred.
Test Results
During this research, a total of 35 steel fiber reinforced concrete
cylinders with different steel fiber dosages were tested. Tests were carried out at 3, 7 and
28 days after casting. In some cases, the 28 day specimen was tested later in about 90
days. In cases of 2 or 1 cylinders only, the cylinders were tested after 27 days of casting.
Table 2-2 shows the detailed numbers of cylinders tested.
Page 44
33
Table 2-2 Compressive Cylinder Strength Test Specimens
Pipe Diameter (in.)
Steel Fiber Amount lb/yd
3 (% Vol.)
Number of Cylinders Tested
18 in.
5 (0.04) 3
11 (0.08) 3
16 (0.12) 3
22 (0.17) 3
24 in.
11 (0.08) 3
16 (0.12) 3
22 (0.17) 3
44 (0.33) 3
66 (0.5) 3
30 in. 33 (0.25) 4
33 in. 44 (0.33) 2
66 (0.5) 2
36 in. 44 (0.33) 1
88 (0.67) 1
Various crack pattern appeared when the cylinder specimens where tested. The
crack pattern mainly depended on the steel fiber dosage, the appropriate consolidations,
and the water to cement ratio that had a significant effect. The low water to cement ratio
lead to a dry mix which became drier during casting the cylinders. The very dry caused
segregation of concrete when vibrated for consolidation, consequently, decreased the
cylinder expected strength. Figure 2-23 shows a case of concrete segregation. In few
cases, crack pattern appeared to be a cross-sectional crushing, as shown in Figure 2-24.
Typical crack patterns are shown in Figure 2-25.
Page 45
34
Figure 2-23 Segregation due to Dry Mix and High Frequency Vibration Consolidation
Figure 2-24 Crushing Failure
Page 46
35
Figure 2-25 Typical Crack Patterns for (a) 16 lb/yd3 (b) 44 lb/yd
3
(a) (b)
Page 47
36
Test results showed a significant variation in the strength of tested cylinders. This
variation was due to the variation in sampling and casting times, the lack of a proper
compaction due the low workability of the dry mix and the human factor which depended
on the person performing the compaction. A relation between the amount of steel fibers
in the concrete and the ultimate compressive strength couldn’t be observed.
Figure 2-26 Ultimate Compressive Strength of Concrete Cylinders
Figure 2-26 shows a plot of the compressive strength of cylinders with different
steel fiber dosages. The overall average of the concrete cylinders strength was found to
be 3,900 psi. The average compressive strength for each steel fiber dosage group of
cylinders was plotted in Figure 2-27
Figure 2-27 Average Ultimate Compressive Strength of Concrete Cylinders
5 11 16 22 44 66 88 0
1000
2000
3000
4000
5000
6000
7000
Co
mp
ress
ive
Str
en
ght
(psi
)
Steel Fiber Dosage (lb/yd³)
3-Days
7-Days
28+ Days
Average Strengths:
3-days : 2910 psi 7-days : 4140 psi 28-days : 4490
0
1000
2000
3000
4000
5000
6000
5 11 16 22 44 66 88
Ave
rag
e C
yly
nd
er
Co
mp
res
siv
e S
tren
gth
(p
si)
Steel Fiber Dosage (lb/yd3)
Page 48
37
Chapter 3
Pipes’ Structural Testing
Introduction
Pipes’ structural testing description and results are presented in this chapter.
Several types of concrete pipes’ structural tests are specified per international standard
specifications such as BS EN 1916:2002 “Concrete Pipes And Fittings, Unreinforced,
Steel Fibre And Reinforced” that specifies the performance requirements and describes
the test procedures for both steel reinforced concrete pipes and steel fiber reinforced
concrete pipes. In this research, the ASTM C497 – 05 “Standard Test Methods for
Concrete Pipe, manhole Sections, or Tile” that describes various methods of concrete
pipes’ testing that are used in production quality control and design acceptance testing.
The ASTM C497 – 05 presents four main methods of testing the structural
strength and performance of concrete pipes through either concrete pipe’s loading tests
or material tests. Material tests include both Core Strength Test and Cylinder Strength
Test. Core Strength Tests are compressive crushing tests on concrete cores cut from the
concrete pipe’s wall. Concrete cylinders are casted from the same concrete mix used for
the pipes at the same day of pipe production and tested in accordance with ASTM C31
and ASTM C39 as described in the previous chapter. Concrete pipe’s loading tests
include Flat Slap Test, that is used to test the longitudinal strength of concrete pipes, and
External Load Crushing Strength Test by Three Edge Bearing Test Method, which is
known by the “Dload Test” and the Dload is defined as the test load in pounds-force per
linear foot of the pipe per foot of pipe diameter.
Page 49
38
The three edge bearing test method, which will be described in details in the next
sections, was used in this research, in addition to, the ASTM C76 – 10 “Standard
Specification for Reinforced Concrete Culvert, Storm Drain, and Sewer Pipe”. The ASTM
C76 – 10 classifies concrete pipes into five classes; Class I, Class II, Class III, Class IV
and Class V, as well as, defining the Dload strength test requirements, wall thicknesses
and design reinforcement required for traditional reinforced concrete pipes. Beside the
previous specifications stated by the ASTM C76 – 10, some permissible variations in the
physical dimensions of the produced pipes are defined as a tolerance limits not to be
violated during production which was checked every time before performing the Dload
test. The internal diameter variation of 12-in. to 24-in. pipes should not exceed 2% of the
design diameter of 12-in. pipe and 1.5% for 24-in. pipe with linear variations for
intermediate pipe sizes. For 27-in. pipes and larger, a maximum variation should not
exceed the greater of 1% of the design diameter and 3/8 in. The wall thickness variation
should not exceed the greater of 5% of the design diameter and 3/16 in. For pipes of
internal diameter up to 24-in., the variation in the length of two opposite sides of pipe
shouldn’t exceed ¼ in. and 1/8 in. for larger diameters with 5/8 in.
Even though ASTM C497 and ASTM C76 do not include mentioning to steel
fiber reinforced concrete pipes but traditional reinforcement concrete pipes, they were
used in this research so that to compare the performance of steel fiber reinforced
concrete pipes to the traditional reinforced concrete pipe of class III.
The D-Load test provided two main information; the ultimate load carried by the
pipe and the load-deflection plot. The ultimate load is used to get the D-Load value,
which is the load per linear foot of pipe per foot of diameter. The D-Load value is used to
eliminate the effect of pipe diameter and length to get a common base of comparing the
behavior of different sizes of pipes. The D-Load is considered as the criterion that shows
Page 50
39
if the pipe meets the C76-10 class specified capacity. While the load-deflection plot,
where values of vertical and horizontal deflection are plotted against the load, shows the
ductility and post crack capacity of the pipe when experiencing three edge bearing
loading as shown in Figure 3-3..
Figure 3-1 Load-Deflection Curve of Low fiber dosage Pipes (24”- 16 lb/yd3 )
Figure 3-2 Load-Deflection Curve of High fiber dosage Pipes (24”- 44 lb/yd3 )
-5000
0
5000
10000
15000
20000
25000
-0.1 0.1 0.3 0.5 0.7 0.9 1.1
Loa
d (
lbf)
Deflection (in)
Vertical Deflection
Horizontal Deflection
-5000
0
5000
10000
15000
20000
25000
-0.1 0.1 0.3 0.5 0.7 0.9 1.1
Loa
d (
lbf)
Deflection (in)
Vertical Deflection
Horizontal Deflection
Page 51
40
Figure 3-3 Load Deflection Plot Showing First Post Ultimate Strength
Three Edge Bearing Test
The three edge bearing test, which is known as Dload test, is a concrete pipe
testing method, described in ASTM C497 – 05, in which a crushing force is applied on the
plan parallel to the vertical axis of the pipe and extending along the length of the pipe.
The test is used for either quality control of the produced pipes by the manufacturer or as
a proof of design adequacy, which is the case in this research.
According to the ASTM C497, the machine used in the test should be of a
sufficient capacity that exceeds the ultimate load of the greatest strength of the pipes to
be tested. In addition, the machine should be capable of providing a way to control the
loading rate. Also, the machine should be rigid enough so that the load distribution is not
significantly affected by the deflection of any part of the machine. The pipe to be tested
should be supported by a lower bearing of two parallel strips while the load being applied
through an upper bearing strip and the three bearing strips should be parallel to the axis
of the tested pipe, as well as, having a length greater than or equal to that of the tested
pipe. The lower bearing strips should be made of either straight wooded strips, with a
0
500
1000
1500
2000
-0.05 0.15 0.35 0.55 0.75 0.95 1.15
DLo
ad
((l
bf/
in)/
in))
Vertical Deflection (in)
D-Load vs Vertical Deflection
24" 66 pcy
24" 16 pcyPost-First-Peak Strength
Ultimate DLoad
Ultimate DLoad
Post-First-Peak Strength
Page 52
41
cross section of width greater than or equal to 2 in. and a height within 1 in. and 1 ½ in.,
or rectangular hard rubber strips, with a width more than or equal to 2 in., a thickness
within 1 in. and 1 ½ in. and a round radius of ½ in. The lower bearing strips should be
fastened to a beam of either wood or steel or directly to the concrete base to provide
rigidity of bearings to avoid significant deflection of lower bearings. The two lower bearing
strips should be spaced apart by a distance not more than 1 in./ft of pipe diameter and
not less than 1 in. The upper bearing should be rigid straight beam made of wood with or
without a hard rubber strip attached to the contact face with the tested pipe. The
thickness of the hard rubber strip should have a minimum width of 2 in. and a thickness
from 1 to 1 ½ in. Figure 3-4 shows schematic drawing for the three-edge bearing test
arrangement.
Figure 3-4 Three-Edge Bearing Test
The Testing Machine
A three edge testing machine located in Hanson’s Grand Prairie production plant
was used to perform all of the pipes’ tests, Figure 3-5. The testing machine used in
Page 53
42
testing the pipes meets the C497 specifications. It is formed of a rigid steel frame with
variable height adjustment. The loading steel beam is driven by two hydraulic cylinders
with common inlet to assure equal loading in both cylinders. The cylinders are driven by a
hydraulic pump with a control valve that allows controlling the oil flow rate and hence
keeping the loading rate in the range specified by the ASTM C497. Beside controlling the
loading rate, controlling the oil flow rate and keeping it constant lead to constant
displacement rate loading, which is used as the loading type when the pipes are modeled
with finite element analysis software, Figure 3-7 shows a typical displacement history. A 6
in. x 6 in. hard wood beam is bolted to the loading steel beam forming the upper bearing
with a 1 in. thickness 6 in. width hard rubber strip fixed to the lower face to be in contact
with the tested pipe. The lower bearings are made of a 1 ½ in. hard rubber with round
corners and fixed on a rigid adjustable steel supports that allow adjusting the distance
between the two bearing according to the tested pipe diameter shown in Figure 3-6.
Figure 3-5 Three-Edge Bearing Test Machine
Page 54
43
Figure 3-6 Lower Bearing Adjustment
Figure 3-7 Plot of constant vertical deflection rate
-0.5
0
0.5
1
1.5
2
2.5
0 100 200 300 400 500 600
Dis
pla
cem
ent
(in
)
Time (Sec)
Page 55
44
Measuring devices
The instant load and deflection were measured during the test to get the
load-deflection curves. Two Cable-Extension Displacement Sensors (CDS) with an
accuracy of ± 0.015 in. and a measuring range of 10 in., which is enough for a deflection
of a maximum of 5% of the diameter of the largest pipe tested (i.e 36 in.), were used to
measure the vertical and the horizontal deflections. The two CDSs were fixed to the inner
surface of the pipe at a distance of a minimum of 7 in. from the pipe side and the CDS to
read the vertical deflection was fixed to the invert with the extended cable fixed to the
crown while the other CDS to measure the horizontal deflection was fixed to the
springline with the extended cable fixed to the opposite springline shown in Figure 3-8.
The instant load was measured through a hydraulic pressure load cell connected to the
oil line just after the control valve as shown in Figure 3-9. The control valve keeps the
flow rate nearly constant and hence the effect of dynamic pressure on the hydraulic load
cell minimized and the load cell reading can be calibrated to get the force applied by the
hydraulic cylinders on the tested pipe. The pressure load cell as well as the displacement
sensors were connected to data acquisition system consisted of a scanner connected to
a portable computer equipped with data acquisition software. The data acquisition rate
was from 2 to 5 readings per seconds, which was pretty enough to get smooth load-
deflection curves.
According to ASTM C497, the loading rate shouldn’t exceed 7500 lbf/linear foot
of pipe per minute till 75% of the designed strength of the pipe then a uniform load of 1/3
of the designed strength of the pipe should be applied.
Page 56
45
Figure 3-8 Cable Displacement Sensors (CDS) Positioning
Figure 3-9 Hydraulic Pump, Control Valve, and Pressure Load Cell
Page 57
46
Test Results
During this research, a total of 27 steel fiber reinforced concrete pipes with
different sizes and steel fiber dosages were produced and tested at the production plant
after at least seven days from the production date. Table 3-1 shows the details of the
different pipes sizes and dosages of steel fibers.
Table 3-1 Pipes Produces Details
Pipe Diameter (in.)
Steel Fiber Amount lb/yd
3 (% vol.)
Length of Pipe (ft.)
Number of Pipes Produced
18 in.
5 (0.04) 6 2
11 (0.08) 6 2
16 (0.12) 6 2
22 (0.17) 6 2
24 in.
5 (0.04) 6 2
11 (0.08) 6 2
16 (0.12) 6 2
11 (0.08) 6 2
16 (0.12) 6 2
30 in. 22 (0.17) 6 2
33 in. 44 (0.33) 8 2
66 (0.5) 8 2
36 in. 16 (0.12) 8 1
22 (0.17) 8 2
Before performing each test, the loading beam was approached towards the pipe
till the upper bearing rubber strip touched the surface of the pipe to avoid an impact or
dynamic loading. During this process, pre-test data acquisition was been performed to
monitor the contact moment and to record any sudden increase in loading that may affect
Page 58
47
the pipe’s performance during the test. The three edge bearing tests as well as the data
acquisition were performed continuously till the end of the test. To avoid a total and
sudden failure of the tested pipe which will cause damage to the measuring devices, a
limit of 5% of the tested pipe’s diameter was assigned as the maximum vertical deflection
at which the loading should be stopped when reached. This limit was proposed by
previous research performed on similar kind of pipes. An extra displacement beyond the
5% of vertical deflection was applied to some tested pipes with different fiber dosages
after removing the measuring devices to examine the behavior of those pipes with large
deflections as a safety indicator.
The ASTM C76-10 defines the class of the pipe by the ultimate Dload that can be
carried by the tested pipe. For class I, the minimum ultimate Dload is1200 lbf/ft/ft, and for
class II is 1500 lbf/ft/ft and for class III is 2000 lbf/ft/ft. The ultimate loads that were
carried by the tested pipes, as well as, the ultimate Dloads, the class that the tested pipe
passed and the post ultimate Dload strength are shown in Table 2-3. As shown in the
previous Table 3-1, two pipes of each dosage for each pipe size were produced and
tested to get more reliable results. The summary shown in the Table below considers the
average of the load values of each of the two pipes
Table 3-2 Ultimate Load, Ultimate Dload, Strength Class, and First Post Ultimate Dload
Pipe Size
Steel Fiber
lb/yd3
Ultimate Load (lbf)
Ultimate Dload
(lbf/ft/ft) Class
First Post Ultimate
Dload (lb/ft/ft)
18”
5 18810 2090 III 0
11 21681 2409 III 385
16 21483 2387 III 520
22 19899 2211 III 1110
24” 11 18744 1562 II 360
16 21120 1760 II 650
Page 59
48
22 24720 2060 III 1000
44 24420 2035 III 1700
66 24120 2010 III 1530
30” 33 32175 2145 III 1150
33” 44 32560 1480 I 1340
66 33880 1540 II 1420
36” 44 56280 2345 III 2345
88 65760 2740 III 2740
The ultimate Dload data in the previous table is plotted in the following chart to
give a better image of the strength of each group of pipes.
Figure 3-10 Ultimate Dload Strength
As seen in the above chart in Figure 3-10, the 36-in. pipes have the highest
ultimate Dload that significantly exceeded the ASTM C76-10 class III acceptance ultimate
Dload value, 2000 lbf/ft/ft. The 30-in. as well as all of the 18-in. pipes with different
dosages also passed the Dload strength required for class III pipes. In the 24-in. case,
0
500
1000
1500
2000
2500
3000
36" 33" 30" 24" 18" 15" 12"
DLo
ad (
lbf/
ft/f
t)
Pipe Diameter
Ultimate DLoad Strength
88pcy
66pcy
44pcy
33pcy
22pcy
16pcy
11pcy
5pcy
88
Table 3-2 - Continued
Page 60
49
higher steel fiber dosages pipes from 22 lb/yd3 and up slightly passed the class III limits,
while low steel fiber dosage pipes of 16 lb/yd3 and 11 lb/yd
3 didn’t show enough strength
and passed the class II limits but not class III. The 33-in. showed an unexpected low
strength that was hardly close to class II strength requirement that will be discussed in
detail in the following sections.
As discussed in the previous sections, the Dload-Deflection curves
plotted using the data acquired during the test is used to know the post failure (post
ultimate Dload) strength of each pipe that shows that amount of ductility that each pipe
carried. The post ultimate Dload data for different sizes and fiber dosages is plotted in the
following chart:
Figure 3-11 First Post Ultimate Dload Strength
The above chart, Figure 3-11, shows a significant increase in post ultimate Dload
strength with the increase of the steel fiber dosage which appears significantly in the
0
500
1000
1500
2000
2500
3000
36" 33" 30" 24" 18" 15" 12"
Po
st U
ltim
ate
Dlo
ad S
tre
ngt
h
(lb
f/ft
/ft)
Pipe Diameter (in)
88pcy
66pcy
44pcy
33pcy
22pcy
16pcy
11pcy
5pcy
5pcy
Page 61
50
smaller pipe sizes of 18-in. and 24-in. except for the 66 lb/yd3 24-in. that showed a lower
post ultimate Dload strength than the 44 lb/yd3 24-in. Also, pipes with same fiber
dosages tend to have close values of post ultimate Dload strength even with different
pipe sizes. Another observation is that the large size pipes of 36-in. didn’t show any
sudden drop in the Dload after the ultimate Dload strength neither for the high dosage of
88 lb/yd3 nor for the 44 lb/yd
3 pipes, instead, it had a smooth decrease in the Dload as
will be shown in the following sections. On the other hand, the very low dosage of 5 lb/yd3
18-in. pipes didn’t show any post ultimate load strength, instead, they totally failed after
reaching the ultimate load and collapsed after removing the CDS and while trying to take
it off the testing machine as shown in Figure 3-12.
In the following section, each group of pipes with same size will be discussed in
more detail to highlight important observations and notes for each case.
Figure 3-12 Effect of Increasing Fiber Dosage in Post Peak Strength
0
500
1000
1500
2000
2500
-0.05 0.15 0.35 0.55 0.75 0.95
DLo
ad (
lbf/
ft/f
t)
Vertical Deflection (in)
D-Load vs Vertical Deflection
18" 5 pcy
18" 11 pcy
18" 16 pcy
18" 22 pcy
Class I
Class II
Class III
Page 62
51
The above plot shows the Dload against the vertical deflection of the 18-in. pipes.
It’s obvious that even though the low fiber dosage pipes of 11 lb/yd3 and 16 lb/yd
3
showed a higher ultimate Dload than the higher fiber dosage of 22 lb/yd3 , the 22 lb/yd
3
pipes showed a significant higher post ultimate Dload strength, of about 50% of the
ultimate Dload, than those of lower fiber dosages that showed a low post ultimate Dload
of less than 20% of the ultimate value.
Another observation was that the very low fiber dosage pipes of 5 lb/yd3 didn’t
show any post ultimate strength, the strength suddenly vanished and the pipe totally
collapsed after removing the measuring devices and while moving the pipe off the testing
machine.
Another observation was the occurrence of the crack above the springline in one
side of both 11 lb/yd3 and 16 lb/yd
3 pipes as shown in Figure 3-13. The crack started at
the right side and propagated among the separation line between the two parts of the
casting form and extended higher than this separation line at the left side of the pipe
which arises a hypothesis of the significance effect of either the pipes surface finish or
the pipe production method used on the crack profile. The crack on the other side was a
regular crack that occurred around the other springline.
Page 63
52
Figure 3-13 Crack Propagation through the Separation Line
Page 64
53
Another observation was the diagonal crack, shown in Figure 3-14 and Figure 3-
15, that extended from the right side of the springline upward to the left side which was
observed on one side of the 22 lb/yd3 pipe. The other side showed a regular crack profile
around the springline.
Figure 3-14 Diagonal Crack
Figure 3-15 Diagonal Crack End
Page 65
54
Figure 3-16 Dload-Deflection Plot of 24 in. Diameter Pipes
The above chart, Figure 3-16, shows the Dload versus the vertical deflections of
different fiber dosages 24-in. pipes. All the fiber dosages pipes passed the class III
ultimate strength requirement except the low dosage pipes of 16 lb/yd3 and 11 lb/yd
3.
The high fiber dosage pipes showed a significantly high post ultimate Dload strength. The
44 lb/yd3 pipes showed the highest post ultimate Dload strength of 84% of the ultimate
strength, while the low dosage pipes of 16 lb/yd3 and 11 lb/yd
3 post ultimate strength was
only from 23% to 36% of the ultimate strengths which were already lower than the class-
III ultimate strength requirement. Also, the 44 lb/yd3 pipes’ ultimate Dload strength
exceeded that of the higher dosage of 66 lb/yd3 showing the unprofitability of using the 66
lb/yd3 for 24-in. pipes.
An observation that supports the hypothesis of the significance effect of either
the pipes surface finish or the pipe production method used on the crack profile was
0
500
1000
1500
2000
-0.05 0.45 0.95
DLo
ad (
(lb
f/in
)/in
))
Vertical Deflection (in)
D-Load vs Vertical Deflection 24" 66 pcy
24" 44 pcy
24" 22 pcy
24" 16 pcy
24" 11 pcy
Class III
Class II
Class I
Page 66
55
observed while testing one of the 44 lb/yd3 pipes where the crack initiation and a poor
compacted section were noticed at the casting forms separation line as shown in 3-17.
Figure 3-17 Crack Initiation and Propagation through the Separation Line
Another observation was a secondary crack that developed on one side of one of
the 22 lb/yd3 pipes shown in Figure 3-18.
Figure 3-18 Secondary Crack Development
Page 67
56
Figure 3-19 Dload-Deflection Plot of 30 in. Diameter Pipes
The Dload versus the vertical deflection of the 30-in. 33 lb/yd3 pipe were plotted
on the chart above. Besides exceeding the class III ultimate strength requirement, a
decrease in the Dload after the initial crack followed by a makeup increase in Dlaod can
be observed. Other than these observations, there was nothing significant and the crack
profiles were regular.
The Dload history was plotted below, Figure 3-20, shows the instant decrease
and makeup of the Dload.
Figure 3-20 Dlaod History Showing Strength Recovery
0
500
1000
1500
2000
2500
-0.05 0.45 0.95 1.45
DLo
ad (
lbf/
ft/f
t)
Vertical Deflection (in)
D-Load vs Vertical Deflection
30" 33 pcy
30" 33b pcy
Class III
Class II
Class I
-500
0
500
1000
1500
2000
2500
0 200 400 600 800 1000 1200
Dlo
ad (
lb/f
t/ft
)
Elapsed Time (sec.)
Page 68
57
Figure 3-21 Dload-Deflection Plot of 33 in. Diameter Pipes
Both of the 44 lb/yd3 and 66 lb/yd
3 33-in. pipes showed a significantly low
ultimate Dload strength that was hardly reached class II ultimate strength requirement.
The visual inspection of the tested pipes showed poor compacted regions with significant
voids and rough surface. In addition, the steel fibers were visible and highly dense in
some spots of the pipes inner part which shows a poor fiber-concrete mixing and
distribution. Also, testing this group of pipes showed multi-crack profile on both sides of
the 66 lb/yd3 pipes in which secondary cracks extended along the main crack between
the two ends of the pipes as shown in Figure 3-22.
At the beginning of the result analysis, an inadequate mix problem was expected
till performing the four point load material test, on the beams casted using the same mix
used to produce the pipes at the day of production, which showed an ultimate flexural
strength values within the average values for the rest of the tested beams (7000kip total
MTS load) as mentioned in the previous chapter. Hence, the problem appeared to be a
0
500
1000
1500
2000
-0.05 0.45 0.95 1.45
DLo
ad (
lbf/
ft/f
t)
Vertical Deflection (in)
D-Load vs Vertical Deflection
33" 44pcy
33" 66 pcy
Class III
Class II
Class I
Page 69
58
production problem related to the casting and compaction processes while producing
these specific pipes.
Figure 3-22 Multi Crack Development
Figure 3-23 Multi Crack Development
Page 70
59
Figure 3-24 Dload-Deflection Plot of 36 in. Diameter Pipes
The Dload versus the vertical deflection of the 36-in. pipes with different fiber
dosages was plot in the above chart. Besides exceeding the ultimate Dload strength
requirement of Class III, the pipes with both fiber dosages of 44 lb/yd3 and 88 lb/yd
3
didn’t show any sudden drop in the Dload after the ultimate Dload; instead they showed a
smooth decrease in the Dload unlike the rest of the pipes of smaller sizes with the same
fiber dosages that showed a sudden drop in the Dload after reaching the ultimate.
Another supporting observation that supports the hypothesis of the significance effect of
either the pipes surface finish or the pipe production method used on the crack profile
was observed that is showed in Figure 3-25 in which the crack extended below the
springline and followed the path of the casting mold separation line.
0
500
1000
1500
2000
2500
3000
-0.05 0.45 0.95 1.45
DLo
ad (
lbf/
ft/f
t)
Vertical Deflection (in)
D-Load vs Vertical Deflection
36" 44pcy
36" 88b pcy
Class III
Class II
Class I
Page 71
60
Figure 3-25 Crack Propagation Through the Separation Line
A final observation within the whole group of pipes is the pipes cross section
crack profiles shown in Figure 3-26. It was observed that the small diameter pipes
showed a flexural cross-section cracks except in the case at which the locations where
the crack extended significantly above or below the springline which showed a shear
crack. The 36 in. diameter pipes showed a significant shear cross-section cracks either at
the springlines, the crown or the invert within the inner and outer layers of the pipes. The
30 in. and 33 in. pipes showed combinations of flexural and shear cross-section cracks
where the shear cracks appeared to be at the outer layer of the pipe while the flexural
crack was at the inner layer of the pipes.
Page 72
61
Figure 3-26 Cross Sectional Crack Profile for: (a) 18 in. (b) 24 in. (c) 33 in. (d) 36 in.
(a) (b)
(c) (d)
Page 73
62
Chapter 4
Summary, Conclusion, and Recommendations
Summary
This research studied the performance of concrete pipes using steel fibers as an
alternative of conventional steel reinforcement. Twenty seven pipes with the same
concrete mix but with different sizes and different steel fiber dosages were produced
using Packerhead pipes producing machine. The pipes were tested according the ASTM
C497 three-edge bearing test and the ultimate Dload values were compared to the ASTM
C76 pipe’s ultimate Dload requirements for different strength classes. In addition, the
instant Dload and deflections were recorded using a data acquisition system then the
data was plotted to have a clear image of the post-first-peak strength load carrying ability
for different fiber dosages. Furthermore, material properties investigation was conducted
through the production and testing of flexural beam and compressive cylinder specimens
according to the ASTM C31, ASTM C1609, and ASTM C39.
Conclusion
Based upon the three-edge bearing tests of pipes, the following is concluded:
Steel fiber reinforced concrete pipe is an alternative to conventionally
steel reinforced pipes with comparable strengths and enhanced ductility
properties.
Steel fiber reinforcement provides an effective crack control agent that
eliminates the presence of multi micro cracks, instead, few relatively
small cracks were observed till the ultimate load reached.
Strength of small size pipes of 18 in. diameter meets the ASTM C76
class-III even with very low steel fiber dosages, as low as 11 lb/yd3, due
Page 74
63
to hoop stresses effect; however, steel fiber is recommended to be
added to provide post crack residual strength.
Low fiber dosages less than 22 lb/yd3 don’t have a significant effect on
neither the pipe’s ultimate strength nor the residual strength after the
peak ultimate strength, hence, using fiber dosages less than 22 lb/yd3 is
not recommended.
Fiber dosages from 44 lb/yd3 to 66 lb/yd
3 are the optimum dosage range
for pipes of diameters up to 36 in. Specific optimum fiber dosage of each
pipe size can be evaluated based upon the required performance of the
pipe.
High fiber dosage of 88 lb/yd3 is not recommended from the economical
point of view.
Poor distribution of steel fibers in the concrete mix leads to a significant
decrease in the pipe’s actual strength, however, the steel fibers used in
this research showed a significant mixing-ability in the concrete mix.
Based upon the flexural beam tests, the following is concluded:
Load deflection curves of steel fiber reinforced concrete beams with fiber
dosages up to 66 lb/yd3 showed only one peak load, while those of
beams with fiber dosages of 88 lb/yd3 showed two peak loads.
The increase of steel fiber dosage had a significant effect on increasing
the toughness and residual strength of beams after the peak load.
Very low fiber dosage beams with 5, 11, and 16 lb/yd3 showed a brittle
failure immediately as ultimate load reached.
Page 75
64
Brittle crack patterns of low fiber dosage beams were vertical cracks in
most cases, while an inclination in the crack was noticed for higher
dosages of steel fiber.
A relation between the fiber dosage and the ultimate strength wasn’t
observed.
Based upon the flexural beam tests, the following is concluded:
Sampling and casting time, as well as, consolidation procedures of low
workable dry cast mix appeared to be among the main factors that
affected the strength of the cylinder specimens.
Steel fiber dosage in the concrete mix didn’t appear to have a significant
effect on the compressive strength of the cylinder specimens; however, it
showed an effect on the crack pattern and distribution.
Page 76
65
Recommendations
The future research recommendations include;
Developing a standard specification for making steel fiber reinforced dry
cast zero slump concrete flexural beam and compressive cylinder test
specimens, avoiding the significant variation appeared due to the lack of
specimens’ making standards for dry cast concrete, and providing a
more expressive material properties specimens. The procedures may
include high amplitude low frequency compaction and a developed way
to ensure steel fiber overlap between successive compacted layers.
Another suggested approach is the use of the “Shotcrete” concept in
casting the specimens which gives a more simulation to the Packerhead
spinning production method.
Studying the effect of the steel fiber orientation on the flexural and
compressive behavior through the use of Computed Tomography (CT)
scan and fiber orientation visualization software along with more
experimental testing of the scanned specimens. This study can also be
used in evaluating the first proposed recommendation.
Evaluation of the durability of the steel fiber reinforced concrete pipes
through a long term testing that involves buried pipes with real earth load
along with water permeability investigation of the stressed buried pipes.
Evaluation of hybrid fiber reinforced concrete pipes using the advantage
of the high strength of steel fibers and the advantage of crack control of
synthetic fibers.
Page 77
66
Studying the behavior of steel fiber reinforced pipes under impact loading
which simulates high amplitude moving loads, as well as, ballast loads
over buried concrete pipes.
Page 78
67
Appendix A
Flexural Beam Test Plots
Page 79
68
Figure A- 1: Load Deflection Curve of 5 lb/yd3 Steel Fiber Beam – 18 in. pipe – I
Figure A- 2: Load Deflection Curve of 5 lb/yd3
Steel Fiber Beam – 18 in pipe – II
0
1000
2000
3000
4000
5000
6000
7000
8000
9000
10000
0 0.001 0.002 0.003 0.004 0.005
Load
(lb
f)
Deflection (in.)
Beam Load-Deflection Curve
0
1000
2000
3000
4000
5000
6000
7000
0 0.0005 0.001 0.0015 0.002 0.0025 0.003
Load
(lb
f)
Deflection (in.)
Beam Load-Deflection Curve
Page 80
69
Figure A- 3: Load Deflection Curve of 11 lb/yd3
Steel Fiber Beam – 18 in. pipe – I
0
500
1000
1500
2000
2500
3000
3500
4000
4500
5000
0 0.005 0.01 0.015 0.02 0.025 0.03
Load
(lb
f)
Deflection (in.)
Beam Load-Deflection Curve
Page 81
70
Figure A- 4: Load Deflection Curve of 16 lb/yd3 Steel Fiber Beam – 18 in. pipe – I
0
1000
2000
3000
4000
5000
6000
0 0.02 0.04 0.06 0.08 0.1 0.12
Load
(lb
f)
Deflection (in.)
Beam Load-Deflection Curve
Page 82
71
Figure A- 5: Load Deflection Curve of 11 lb/yd3 Steel Fiber Beam – 24 in. pipe – I
Figure A- 6: Load Deflection Curve of 11 lb/yd3 Steel Fiber Beam – 24 in. pipe – II
0
1000
2000
3000
4000
5000
6000
7000
8000
9000
10000
-0.02 0 0.02 0.04 0.06 0.08 0.1 0.12
Load
(lb
f)
Deflection (in.)
Beam Load-Deflection Curve
0
1000
2000
3000
4000
5000
6000
7000
8000
9000
10000
-0.02 0 0.02 0.04 0.06 0.08 0.1 0.12
Load
(lb
f)
Deflection (in.)
Beam Load-Deflection Curve
Page 83
72
Figure A- 7: Load Deflection Curve of 16 lb/yd3 Steel Fiber Beam – 24 in. pipe – I
0
2000
4000
6000
8000
10000
12000
-0.02 0 0.02 0.04 0.06 0.08 0.1 0.12
Load
(lb
f)
Deflection (in.)
Beam Load-Deflection Curve
Page 84
73
Figure A- 8: Load Deflection Curve of 44 lb/yd3 Steel Fiber Beam – 24 in. pipe
Figure A- 9: Load Deflection Curve of 66 lb/yd3 Steel Fiber Beam – 24 in. pipe
0
1000
2000
3000
4000
5000
6000
7000
8000
-0.02 0 0.02 0.04 0.06 0.08 0.1 0.12
Load
(lb
f)
Deflection (in.)
Beam Load-Deflection Curve
0
1000
2000
3000
4000
5000
6000
7000
8000
9000
-0.02 0 0.02 0.04 0.06 0.08 0.1 0.12
Load
(lb
f)
Deflection (in.)
Beam Load-Deflection Curve
Page 85
74
Figure A- 10: Load Deflection Curve of 33 lb/yd3 Steel Fiber Beam – 30 in. pipe
0
1000
2000
3000
4000
5000
6000
7000
8000
9000
-0.02 0 0.02 0.04 0.06 0.08 0.1 0.12
Load
(lb
f)
Deflection (in.)
Beam Load-Deflection Curve
Page 86
75
Figure A- 11: Load Deflection Curve of 44 lb/yd3 Steel Fiber Beam – 33 in. pipe – I
Figure A- 12: Load Deflection Curve of 44 lb/yd3 Steel Fiber Beam – 33 in. pipe – II
0
1000
2000
3000
4000
5000
6000
7000
8000
0 0.02 0.04 0.06 0.08 0.1 0.12
Load
(lb
f)
Deflection (in.)
Beam Load-Deflection Curve
0
1000
2000
3000
4000
5000
6000
7000
8000
0 0.02 0.04 0.06 0.08 0.1 0.12
Load
(lb
f)
Deflection (in.)
Beam Load-Deflection Curve
Page 87
76
Figure A- 13Load Deflection Curve of 66 lb/yd3 Steel Fiber Beam – 33 in. pipe – I
Figure A- 14Load Deflection Curve of 66 lb/yd3 Steel Fiber Beam – 33 in. pipe – II
0
1000
2000
3000
4000
5000
6000
7000
8000
9000
10000
0 0.02 0.04 0.06 0.08 0.1 0.12
Load
(lb
f)
Deflection (in.)
Beam Load-Deflection Curve
0
1000
2000
3000
4000
5000
6000
7000
8000
0 0.02 0.04 0.06 0.08 0.1 0.12
Load
(lb
f)
Deflection (in.)
Beam Load-Deflection Curve
Page 88
77
Figure A- 15: Load Deflection Curve of 44 lb/yd3 Steel Fiber Beam – 36 in. pipe – I
Figure A- 16: Load Deflection Curve of 88 lb/yd3 Steel Fiber Beam – 36 in. pipe – II
0
1000
2000
3000
4000
5000
6000
7000
8000
9000
0 0.02 0.04 0.06 0.08 0.1 0.12
Load
(lb
f)
Deflection (in.)
Beam Load-Deflection Curve
0
1000
2000
3000
4000
5000
6000
7000
8000
0 0.02 0.04 0.06 0.08 0.1 0.12
Load
(lb
f)
Deflection (in.)
Beam Load-Deflection Curve
Page 89
78
Appendix B
Three-Edge Bearing Test Load-Deflection Plots
Page 90
79
Figure B- 1: Load-Deflection Plot of 18 in. pipe – 5 lb/yd3 Steel Fiber – I
Figure B- 2: Load-Deflection Plot of 18 in. pipe – 5 lb/yd3 Steel Fiber – II
0
500
1000
1500
2000
2500
-0.2 0 0.2 0.4 0.6 0.8
Dlo
ad (
(lb
f/in
)/in
)
Deflection (in)
VerticalDeflection
HorizontalDeflection
-500
0
500
1000
1500
2000
2500
-0.2 0 0.2 0.4 0.6 0.8 1
Dlo
ad (
(lb
f/in
)/in
)
Deflection (in)
VerticalDeflection
HorizontalDeflection
Page 91
80
Figure B- 3: Load-Deflection Plot of 18 in. pipe – 11 lb/yd3 Steel Fiber – I
Figure B- 4: Load-Deflection Plot of 18 in. pipe – 11 lb/yd3 Steel Fiber – Ii
0
500
1000
1500
2000
2500
-0.2 0 0.2 0.4 0.6 0.8 1 1.2
Dlo
ad (
(lb
f/in
)/in
)
Deflection (in)
VerticalDeflection
HorizontalDeflection
0
500
1000
1500
2000
2500
-0.2 0 0.2 0.4 0.6 0.8 1
Dlo
ad (
(lb
f/in
)/in
)
Deflection (in)
VerticalDeflection
HorizontalDeflection
Page 92
81
Figure B- 5: Load-Deflection Plot of 18 in. pipe – 16 lb/yd3 Steel Fiber – I
Figure B- 6: Load-Deflection Plot of 18 in. pipe – 16 lb/yd3 Steel Fiber – II
0
500
1000
1500
2000
2500
3000
-0.2 0 0.2 0.4 0.6 0.8
Dlo
ad (
(lb
f/in
)/in
)
Deflection (in)
VerticalDeflection
HorizontalDeflection
0
500
1000
1500
2000
2500
-0.2 0 0.2 0.4 0.6 0.8
Dlo
ad (
(lb
f/in
)/in
)
Deflection (in)
VerticalDeflection
HorizontalDeflection
Page 93
82
Figure B- 7: Load-Deflection Plot of 18 in. pipe – 22 lb/yd3 Steel Fiber – I
0
500
1000
1500
2000
2500
-0.2 0 0.2 0.4 0.6 0.8 1
Dlo
ad (
(lb
f/in
)/in
)
Deflection (in)
VerticalDeflection
HorizontalDeflection
Page 94
83
Figure B- 8: Load-Deflection Plot of 24 in. pipe – 11 lb/yd3 Steel Fiber – I
Figure B- 9: Load-Deflection Plot of 24 in. pipe – 11 lb/yd3 Steel Fiber – II
0
200
400
600
800
1000
1200
1400
1600
1800
-0.2 0 0.2 0.4 0.6 0.8 1 1.2 1.4
Dlo
ad (
(lb
f/in
)/in
)
Deflection (in)
VerticalDeflection
HorizontalDeflection
0
200
400
600
800
1000
1200
1400
1600
1800
-0.5 0 0.5 1 1.5 2
Dlo
ad (
(lb
f/in
)/in
)
Deflection (in)
VerticalDeflection
HorizontalDeflection
Page 95
84
Figure B- 10: Load-Deflection Plot of 24 in. pipe – 16 lb/yd3 Steel Fiber – I
Figure B- 11: Load-Deflection Plot of 24 in. pipe – 16 lb/yd3 Steel Fiber – II
0
200
400
600
800
1000
1200
1400
1600
1800
-0.2 0 0.2 0.4 0.6 0.8 1 1.2
Dlo
ad (
(lb
f/in
)/in
)
Deflection (in)
VerticalDeflection
HorizontalDeflection
0
200
400
600
800
1000
1200
1400
1600
1800
2000
-0.2 0 0.2 0.4 0.6 0.8 1 1.2
Dlo
ad (
(lb
f/in
)/in
)
Deflection (in)
VerticalDeflection
HorizontalDeflection
Page 96
85
Figure B- 12: Load-Deflection Plot of 24 in. pipe – 22 lb/yd3 Steel Fiber – I
Figure B- 13: Load-Deflection Plot of 24 in. pipe – 22 lb/yd3 Steel Fiber – II
0
500
1000
1500
2000
2500
-0.2 0 0.2 0.4 0.6 0.8 1 1.2
Dlo
ad (
(lb
f/in
)/in
)
Deflection (in)
VerticalDeflection
HorizontalDeflection
0
500
1000
1500
2000
2500
-0.2 0 0.2 0.4 0.6 0.8 1
Dlo
ad (
(lb
f/in
)/in
)
Deflection (in)
VerticalDeflection
Page 97
86
Figure B- 14: Load-Deflection Plot of 24 in. pipe – 44 lb/yd3 Steel Fiber – I
Figure B- 15: Load-Deflection Plot of 24 in. pipe – 44 lb/yd3 Steel Fiber – II
0
500
1000
1500
2000
2500
-0.5 0 0.5 1 1.5 2 2.5 3
Dlo
ad (
(lb
f/in
)/in
)
Deflection (in)
VerticalDeflection
0
500
1000
1500
2000
2500
-0.2 0.3 0.8 1.3 1.8
Dlo
ad (
lbf/
in/i
n)
Deflection (in)
VerticalDeflection
HorizontalDeflection
Page 98
87
Figure B- 16: Load-Deflection Plot of 24 in. pipe – 66 lb/yd3 Steel Fiber – I
Figure B- 17: Load-Deflection Plot of 24 in. pipe – 66 lb/yd3 Steel Fiber – II
0
500
1000
1500
2000
2500
-0.5 0 0.5 1 1.5 2 2.5
Dlo
ad (
(lb
f/in
)/in
)
Deflection (in)
VerticalDeflection
0
500
1000
1500
2000
2500
-0.5 0 0.5 1 1.5 2 2.5
Dlo
ad (
(lb
f/in
)/in
)
Deflection (in)
VerticalDeflection
Page 99
88
Figure B- 18: Load-Deflection Plot of 30 in. pipe – 33 lb/yd3 Steel Fiber – I
Figure B- 19: Load-Deflection Plot of 30 in. pipe – 33 lb/yd3 Steel Fiber – II
0
500
1000
1500
2000
2500
-0.5 0 0.5 1 1.5 2
Dlo
ad (
(lb
f/in
)/in
)
Deflection (in)
VerticalDeflection
HorizontalDeflection
0
500
1000
1500
2000
2500
-0.5 0 0.5 1 1.5 2
Dlo
ad (
(lb
f/in
)/in
)
Deflection (in)
VerticalDeflection
HorizontalDeflection
Page 100
89
Figure B- 20: Load-Deflection Plot of 33 in. pipe – 44 lb/yd3 Steel Fiber – I
0
200
400
600
800
1000
1200
1400
1600
-0.2 0.3 0.8 1.3 1.8 2.3
Dlo
ad (
lbf/
in/i
n)
Deflection (in)
VerticalDeflection
Page 101
90
Figure B- 21: Load-Deflection Plot of 33 in. pipe – 66 lb/yd3 Steel Fiber – I
Figure B- 22: Load-Deflection Plot of 33 in. pipe – 66 lb/yd3 Steel Fiber – II
0
200
400
600
800
1000
1200
1400
1600
1800
-0.2 0.3 0.8 1.3 1.8 2.3
Dlo
ad (
lbf/
in/i
n)
Deflection(in)
0
200
400
600
800
1000
1200
1400
1600
-0.2 0.3 0.8 1.3
Dlo
ad (
(lb
f/in
)/in
)
Deflection (in)
VerticalDeflection
Page 102
91
Figure B- 23: Load-Deflection Plot of 36 in. pipe – 44 lb/yd3 Steel Fiber – I
0
500
1000
1500
2000
2500
-0.2 0.3 0.8 1.3 1.8
Dlo
ad (
(lb
f/in
)/in
)
Deflection (in)
VerticalDeflection
Page 103
92
Figure B- 24: Load-Deflection Plot of 36 in. pipe – 88 lb/yd3 Steel Fiber – I
Figure B- 25: Load-Deflection Plot of 36 in. pipe – 88 lb/yd3 Steel Fiber – II
0
500
1000
1500
2000
2500
3000
-0.5 0 0.5 1 1.5 2 2.5
Dlo
ad (
(lb
f/in
)/in
)
Deflection (in)
VerticalDeflection
0
500
1000
1500
2000
2500
3000
-0.5 0 0.5 1 1.5 2 2.5
Dlo
ad (
(lb
f/in
)/in
)
Deflection (in)
VerticalDeflection
Page 104
93
Appendix C
Compressive Cylinders Strength Results
Page 105
94
Compressive Strength (psi)
Test Days after Production
3 Days 7 Days 28+ Days
Steel Fiber
Dosage
(lb/yd3)
5 2780 3025 3340
11
3025 3180 4140
4600 5890 6050
16 1910 4290 -
1600 4300 4850
22 3025 5250 5650
4060 5540 5890
44
3340 3790 5410
- - 3980
- - 3260
66 1850 2530 3208
- 3580 4060
88 - - 4070
Table C- 1: Compressive Cylinders Strength
Page 106
95
References
1. ASTM Standard C31, 2012, " Standard Practice for Making and Curing Concrete
Test Specimens in the Field," ASTM International, West Conshohocken, PA,
2012, DOI: 10.1520/C0031_C0031M-12, www.astm.org
2. ASTM Standard C39, 2014, " Standard Test Method for Compressive Strength of
Cylindrical Concrete Specimens" ASTM International, West Conshohocken, PA,
2014, DOI: 10.1520/C0039_C0039M, www.astm.org
3. ASTM Standard C76, 2014, " Standard Specification for Reinforced Concrete
Culvert, Storm Drain, and Sewer Pipe," ASTM International, West
Conshohocken, PA, 2014, DOI: 10.1520/C0076, www.astm.org
4. ASTM Standard C497, 2013, "Standard Test Methods for Concrete Pipe,
Manhole Sections, or Tile," ASTM International, West Conshohocken, PA, 2013,
DOI: 10.1520/C0497-13, www.astm.org
5. ASTM Standard C1609, 2012, "Standard Test Method for Flexural Performance
of Fiber-Reinforced Concrete (Using Beam with Third-Point Loading)," ASTM
International, West Conshohocken, PA, 2012, DOI: 10.1520/C1609_C1609M-12,
www.astm.org
6. Banthia, N., Bindiganavile, V., Jones, J., & Novak, J. (2012). Fiber-reinforced
concrete in precast concrete applications: Research leads to innovative products.
PCI Journal, 57(3), 33-45.
Page 107
96
7. Haktanir, T., Ari, K., Altun, F., & Karahan, O. (2007). A comparative experimental
investigation of concrete, reinforced-concrete and steel-fibre concrete pipes
under three-edge-bearing test. Construction and Building Materials, 21(8), 1702–
1708.
8. Nataraja, M. C., Nagaraj, T. S., & Basavaraja, S. B. (2005). Reproportioning of
steel fibre reinforced concrete mixes and their impact resistance. Cement and
Concrete Research, 35(12), 2350-2359. doi:10.1016/j.cemconres.2005.06.011
9. Singh, A. P., & Singhal, D. (2011). Permeability of Steel Fibre Reinforced
Concrete Influence of Fibre Parameters. Procedia Engineering, 14, 2823-2829.
10. Thomas, J., & Ramaswamy, A. (2007). Mechanical Properties of Steel Fiber-
Reinforced Concrete. Journal of Materials in Civil Engineering, 16(5).
doi:10.1061/(ASCE)0899-1561(2007)19:5(385)
Page 108
97
Biographical Information
Abdelaziz received his Bachelor of Science Degree in Mechanical Engineering in
2008 from Ain Shams University, Cairo, Egypt. After graduation, he worked as a technical
support engineer for Komatsu earth moving heavy equipment before working in the
construction management field prior joining The University of Texas at Arlington to
pursue his masters in structural engineering.


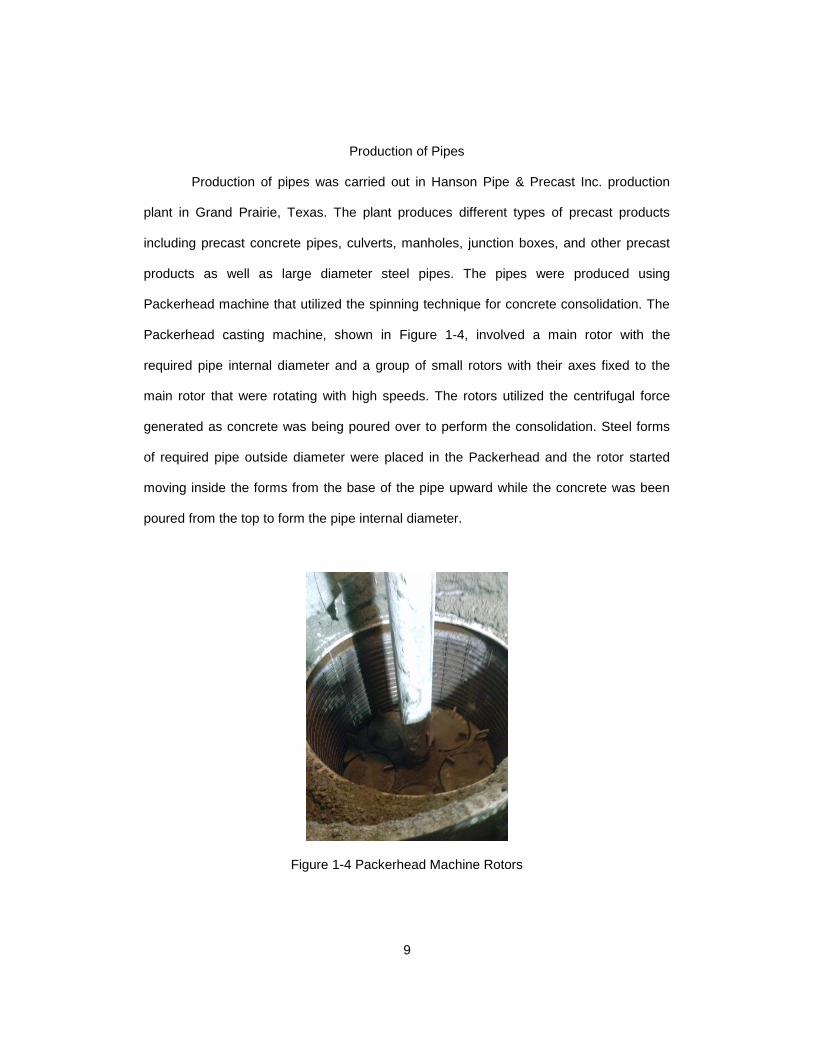


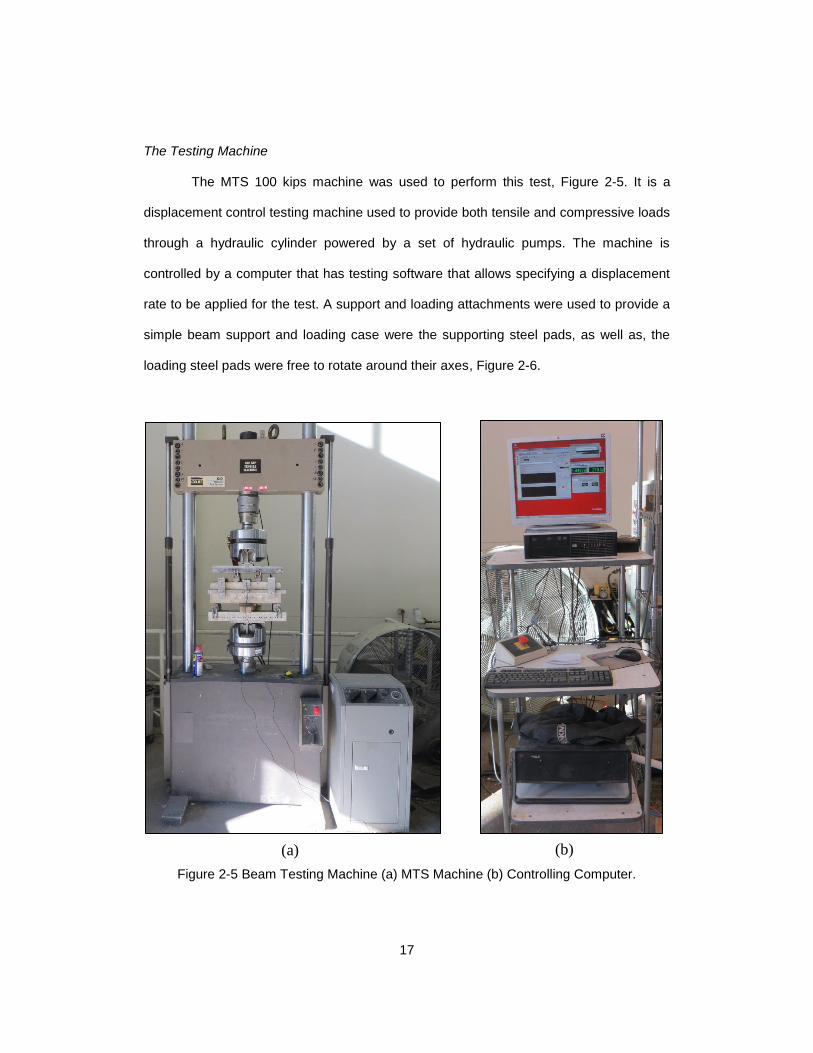


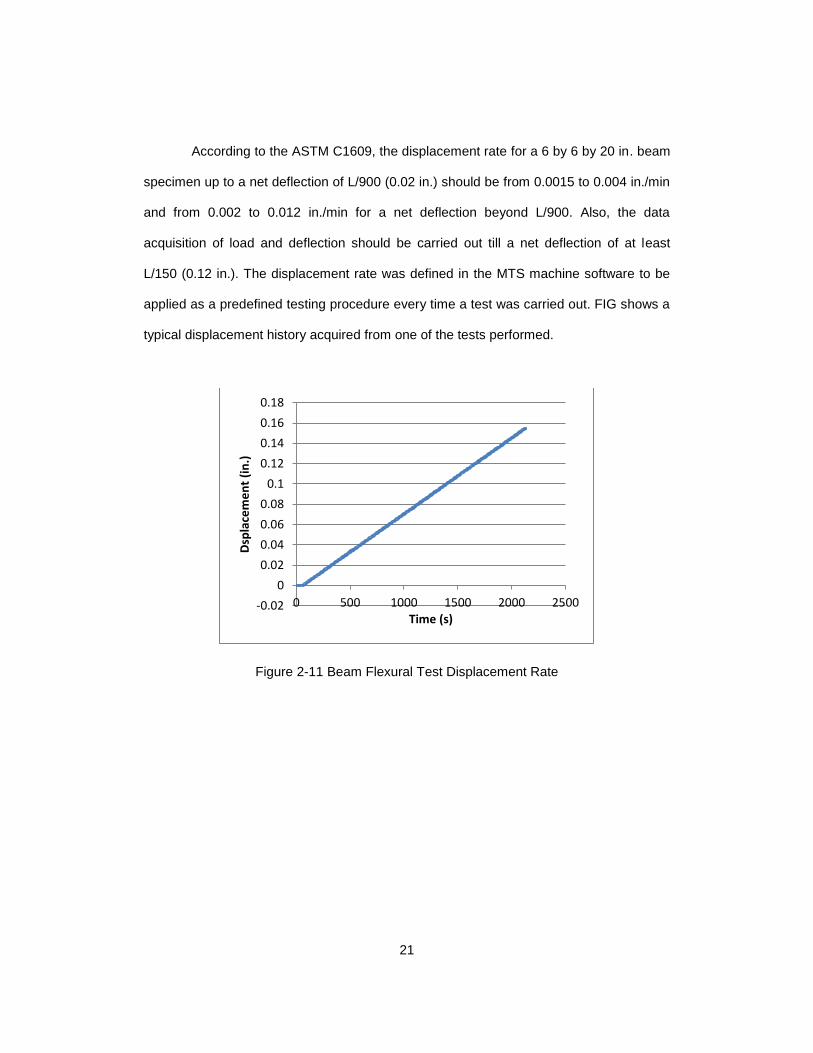


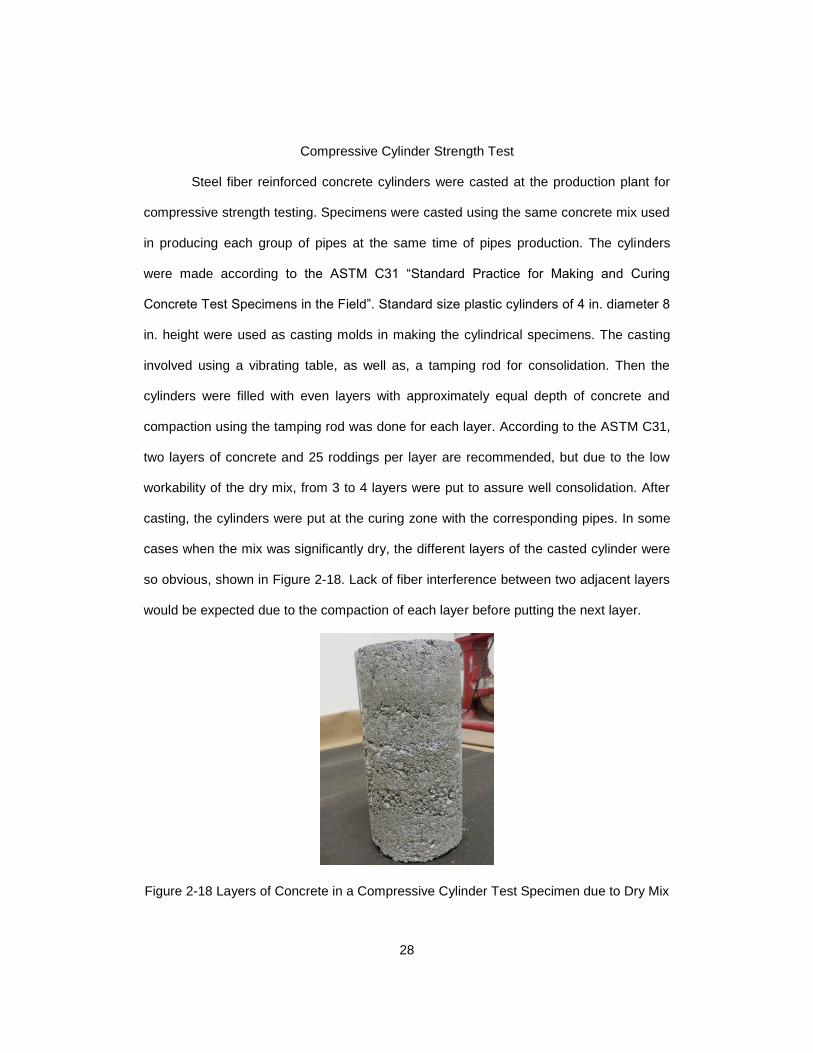
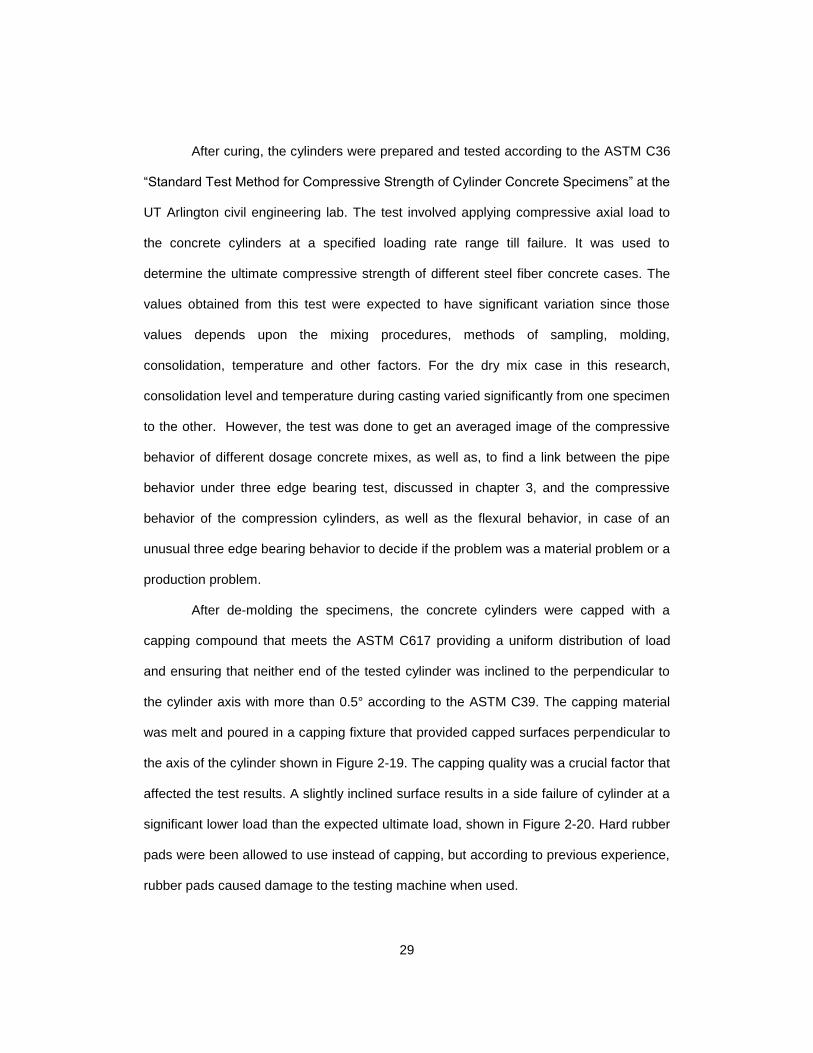


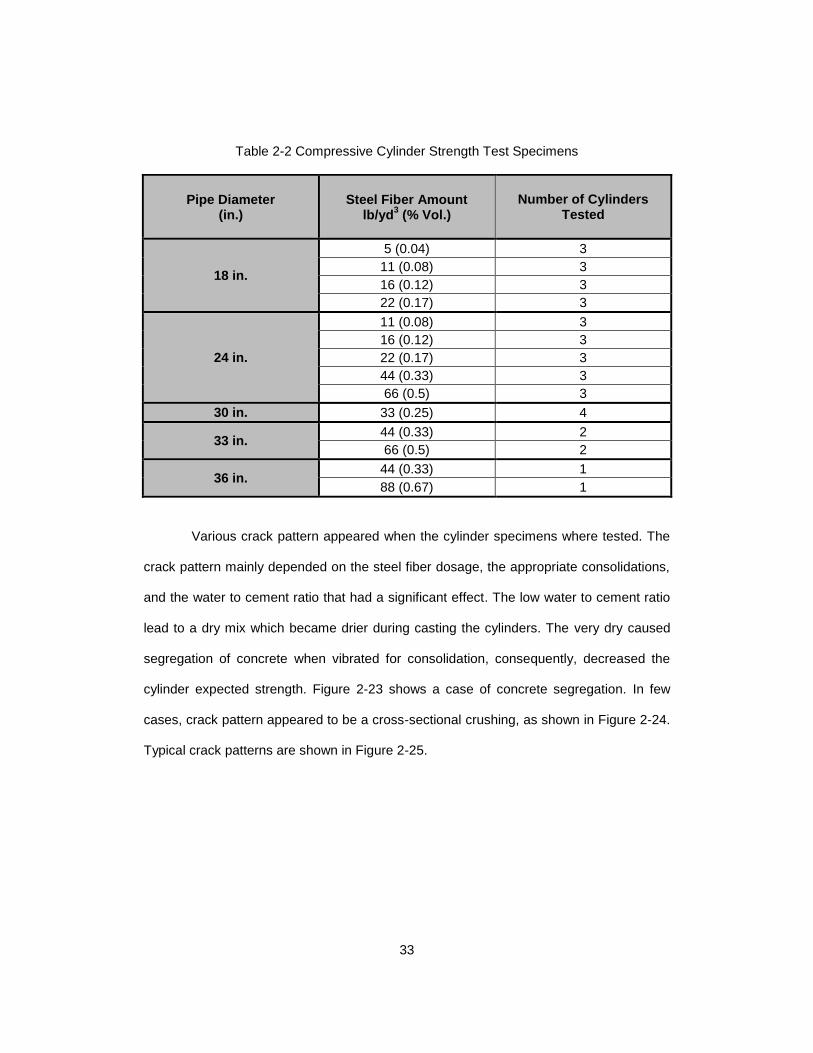


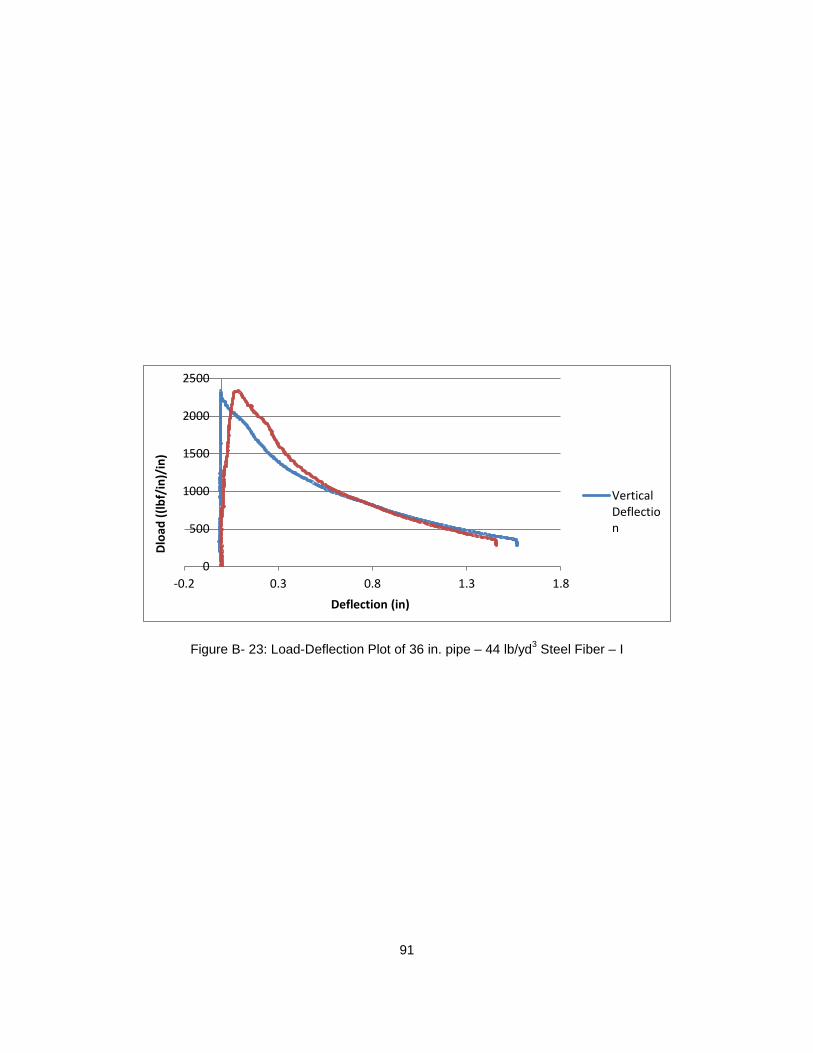


![[Abouzeid, Ola Abdelaziz.] a Comparative Study Bet(Bookfi.org)](https://static.documents.pub/doc/80x56/577c77b91a28abe0548d418e/abouzeid-ola-abdelaziz-a-comparative-study-betbookfiorg.jpg)


