IJST, Transactions of Civil Engineering, Vol. 39, No. C2+, pp 523-538
Printed in The Islamic Republic of Iran, 2015
© Shiraz University
EVALUATION OF THE RELATIONSHIPS BETWEEN THE STRENGTH
PROPERTIES OF HSC CONTAINING SF AND GP AT
A LOW WATER-BINDER RATIO*
M. SARIDEMİR1**, M. H. SEVERCAN2, M. ÇİFLİKLİ3 AND Ş. ACER4
1,2,4Dept. of Civil Engineering, Niğde University, 51240 Niğde, Turkey
Email: [email protected] 3Dept. of Geology Engineering, Niğde University, 51240 Niğde, Turkey
Abstract– In this paper, the effect of high strength concrete (HSC) manufactured with silica fume
(SF) and ground pumice (GP) is investigated. Portland cement was replaced with SF, GP and
combination of SF and GP up to 25%. 22 different concrete mixtures with these replacement
ratios were produced by using 0.25 water-binder ratio. The ultrasound pulse velocity, compressive,
splitting tensile and flexural strengths of these concretes were determined. The experimental
results show that producing HSC is feasible with SF and GP. Besides, the experimental results
indicate that SF and SF in combination with GP can enhance both the short-term and the long-term
properties of concrete, whereas GP needs a comparatively longer time to obtain a suitable effect.
The results are also supported by scanning electron microscope analysis. The optimum
replacement ratios of SF and GP are found to be 15% and 5% of cement, respectively. The
relationships between ultrasound pulse velocity, compressive, splitting tensile and flexural
strengths are investigated by considering the effects of SF and GP.
Keywords– Strength properties, high strength concrete, silica fume, ground pumice
1. INTRODUCTION
Recently, in civil engineering application areas, the high-performance concrete (HPC) and the high-
strength concrete (HSC) have increasingly been used, as they have the benefit of decreasing the sizes of
reinforced concrete frame systems that are to be used in skyscrapers. The concretes, which have
compressive strength (fc) higher than 41 MPa are generally described as HSC [1, 2] according to ACI
Committee 363 [3]. Generally, HSC is obtained by using high range water reducer to decrease the water–
binder ratio and by using mineral additives like metakaolin, silica fume (SF), ground granulated blast-
furnace slag (GBFS), rice husk ash or fly ash so as to produce extra strength by extra calcium silicate
hydrate gels formed with pozzolanic reaction [1, 4]. The developments of new chemical and mineral
admixtures and very powerful superplasticizers have allowed the production of HSC [5, 6]. The general
advantages of HSC improve the strength together with durability and service life of concrete constructions
[2].
HPC can be planned to have the higher workability, higher finishability, higher resistance to cracking
and scaling, lower permeability, higher mechanical properties and larger durability than those of
conventional concrete, although it is usually produced as conventional concrete with the same Portland
cement, aggregate and water in addition to chemical and/or mineral admixtures [7]. The reason for this is
that the components of HPC are chosen better than conventional concrete. The use of HPC in structures is
able to improve the placement without segregation between cement paste and grains of aggregate, short-
Received by the editors October 8, 2014; Accepted June 7, 2015. Corresponding author
M. Saridemir et al.
IJST, Transactions of Civil Engineering, Volume 39, Number C2+ December 2015
524
term and long-term mechanical properties, durability, volume stability, abrasion resistance, and service
life in adverse environmental conditions [8].
According to conventional concrete, HSC and HPC present many advantages. The high mechanical
properties of these concretes can be utilized beneficially in construction elements such as beams, columns,
precast units and shear-walls. In beams, columns and shear-walls, the decrease in the size spearheads to
decrease constant weight on a structure and afterwards to decrease total weight on the base structure.
These concretes can also be efficiently utilized in constructions like shell and plate. Besides, these
concretes, having a very compact microstructure, probably enhance long-period durability of construction
[9]. In addition, many of these concretes have been used for practices in which the adverse environmental
conditions and durability were the original consideration rather than strength. For example, large span
bridges, seagoing oil platforms, sea concrete constructions and submarine tunnels are such practices [10].
These concretes are also described by low porousness and revealed more uniform internal pore structure at
the cement paste and aggregate particles interface than conventional concrete. Powerful interface creations
increase the stiffness, strength and durability, though these concretes produced in this way generally reveal
more fragile behavior [2].
The effect of SF on concrete is explained by its effect on the pore size distribution and pore
construction of concrete besides its creating extra calcium silicate hydrate. SF improves the bond strength
between aggregate particles and cement paste by fulfilling the interface zone more densely because of
composition of ultra-fine particles. SF also performs a significant role in improvement of mechanical
properties of HSC due to having a pozzolonic activity. In the concrete mixtures, filling influence of SF has
a higher priority than its pozzolonic influence. The best-known influence of SF on concrete properties is
the evolvement on cement paste and aggregate particles interface that are the most vulnerable areas on the
concrete matrix. SF boosts the water requirement of concrete mixture when this mineral additive is used in
the concrete mixture. Therefore, SF is usually used in combination with a high range water reducer to
control the workability [11, 12].
In the conducted studies, pumice is usually utilized as porous aggregates. Nevertheless, very few
studies have been conducted on the performance of concrete containing GP and SF in combination with
GP. Demirel and Keleştemur [13] researched the influence of elevated temperature on the physical and
mechanical properties of concrete obtained by replacing cement with fine GP at ratios of 5%, 10%, 15%
and 20% by weight. Besides, they investigated the influence of SF (10% by weight of cement) additive on
the same properties of concrete made with fine GP. They determined the ultrasound pulse velocity (Upv), fc
and weight loss values on the specimens exposed to high temperature at various degrees. They reported
that the fc increased slightly up to heating at 400 oC and then slightly decreased between 400 and 600
oC.
They also stated that the unit weights and the Upv decreased with increasing temperature. In another study,
Keleştemur and Demirel [14] investigated the corrosion behaviour of reinforcing steel embedded in
concrete containing fine GP and SF on the same mixtures of their above-mentioned study. They reported
that a reduction in the strength of concrete and an expansion in the corrosion rate of the reinforcing steel
had occurred as a result of the fine GP. In the study of Binici et al. [15], the durability properties of
concrete pipes made with GBFS and basaltic GP as fine aggregates were investigated. They observed the
optimal contribution rate of pumice as 5% in the basaltic GP used at ratios of 5%, 10% and 15% by weight
in place of fine aggregate. The strength and durability of alkali activated ground granulated blast-furnace
slag (GGBFS) mortars with very fine GP at definite rates were investigated by Özodabaş and Yılmaz [16].
The sodium hydroxide and sodium silicate with silicate modules calculated as 0.5, 0.75 and 1.00 were
used as alkaline activators for this study. The GGBFS was utilized at ratios of 60% and 80% by weight in
place of cement, and in the second stage, GP was added at ratios of 5% and 10% by weight in place of
GGBFS for this study. The flexural strength (ffs) and fc values of the produced concrete at 7, 28 and 90
Evaluation of the relationships between the strength …
December 2015 IJST, Transactions of Civil Engineering, Volume 39, Number C2+
525
days were investigated in their study. The ffs and fc values of the GGBFS and GGBFS in combination with
very fine GP specimens were close to each other. Sarıdemir [17] researched the effect of SF and GP on the
fc and modulus of elasticity of HSC. Specifically, the study recommended that 15% weight of SF and 15%
weight of SF together with 5% weight of GP can be utilized as replacement of cement so as to obtain HSC
with good fc and modulus of elasticity. In addition, the study reported that the fc of concrete mixture
containing 10% GP was higher than the fc and modulus of elasticity of control concrete mixtures at 28
days. Binici et al. [18] investigated the mechanical and radioactivity shielding performances of mortars
produced with barite, colemanite, GP and GGBFS. They prepared five groups of mortar specimens for
experimental study. They reported that the later age ffs and fc of the mortars enhanced meaningfully by
using GGBFS. Besides, they reported that the ffs and fc were lower than the control mortar values for all
the specimens with different supplement rates of barite and pumice for all the test periods.
The main objective of this paper is to evaluate the effect of SF, GP and SF in combination with GP
on the long-term and short-term strength properties of HSC. There are three series of experiments in this
research. The effect of SF as artificial mineral admixture and GP as natural mineral admixture on the
properties of HSC was separately investigated in the first and second series while the combined effect of
these on the properties of HSC were investigated in the third series. The properties of HSC, in terms of
fresh concrete slump, ultrasound pulse velocity (Upv), compressive strength (fc), splitting tensile strength
(fsts), and flexural strength (ffs) values, were determined by using these series. In addition, the experimental
results were evaluated statistically through regression analyses. The linear and power regression models
were proposed to evaluate the Upv, fc, fsts and ffs.
2. EXPERIMENTAL PROGRAM
a) Materials
The CEM-I 42.5R ordinary Portland cement was utilized in the present paper. According to TS EN 197-1
[19], the mean fc of this cement is higher than 42.5 MPa at 28 days. Initial and final setting times of the
used cement were calculated as 130 and 215 minutes, respectively. SF and GP used in this study were
provided from Antalya Electro Metallurgy Enterprise and Nevşehir Mikromin in Turkey, respectively. The
chemical analysis and specific gravities of the Portland cement, SF and GP are given in Table 1. Both
natural river sand (NRS) and natural crushed limestone-I (CL-I) with particles ranging from 0-5 mm in
size were used as the fine aggregates. The natural crushed limestone-II (CL-II) and natural crushed
limestone-III (CL-III) with sizes 5-12 mm and 5-22 mm were used as the coarse aggregates. These
aggregates had specific gravities of 2.48, 2.54, 2.70 and 2.72, and mixing ratios of 25, 25, 10 and 40,
respectively. Polycarboxylate type superplasticizer (SP) called as Glenium 51 (BASF Construction
Chemicals Company) was used as chemical admixture. Glenium 51 is a new generation chemical
admixture of copolymer based on superplasticizers.
Table 1. Chemical composition of cement and mineral admixtures
Bulk oxide PC SF GP
SiO2 21.20 85.98 71.80
Al2O3 5.90 0.65 12.40
Fe2O3 2.10 0.32 1.05
CaO 62.10 0.70 1.10
MgO 2.30 4.91 0.34
SO3 3.40 0.63 0.08
K2O 0.80 - 4.51
Na2O 0.40 - 5.20
LOI* 1.80 2.66 3.52
Specific gravity 3.08 2.30 2.33
PC= Portland cement, SF= Silica fume, GP= Ground pumice, *LOI= Loss on ignition (%)
M. Saridemir et al.
IJST, Transactions of Civil Engineering, Volume 39, Number C2+ December 2015
526
ASTM C618 [20] exhibits the physical and chemical properties for natural pozzolans to replace
cement. There are two basic significant criteria for pozzolanic activity according to this standard. The first
criteria is the sum of chemical ingredients (SiO2+Fe2O3+Al2O3) and the second criteria is the strength
activity index, specified as the ratio of the fc for a mortar with 20% pozzolan to replace cement by mass to
the fc of the control mortar. As shown in Table 1, the fine SF and GP fulfill the requirements of ASTM
C618 [20].
b) Specimen preparation and curing
In the present paper, three series of concrete mixtures, which are separate from the control mixture,
were produced at the water-binder ratio of 0.25. The total cementitious ingredients and water used in these
mixtures were kept constant at 450 and 112.5 kg/m3, respectively. The mixture proportions of HSC
containing different percentages of SF, GP and SF in combination with GP are presented in Table 2. A
total of 22 HSC mixtures were tested in this study, including five mixtures (first series) containing SF
named as A5, A10, A15, A20 and A25, five mixtures (second series) containing GP named as N5, N10,
N15, N20 and N25, eleven mixtures (third series) containing SF in combination with GP named as
A2.5+N2.5, A5+N5, A5+N10, A5+N15, A5+N20, A10+N5, A10+N10, A10+N15, A15+N5, A15+N10
and A20+N5, and one control mixture (named as C) containing no supplementary cementitious material.
The specimen names and abbreviations are presented in Table 2. The concrete mixtures were produced to
have slump values of 140±20 mm for the ease of workability, pumpability and finishability. During
mixing process, a high range water reducing admixture was added to achieve the specified slump.
Table 2. Mixtures proportions for 1 m3 of concrete (kg/m
3)
Mixtures
No Meaning
Cement SF GP Sand CL-I
CL-II CL-III SP
% % (0-5 mm) (0-5mm) (5-12 mm) (5-22 mm) %
C Control concrete 450.0 0 450.37 461.26 196.13 790.32 4
A5 5% SF 427.5 5 448.83 459.69 195.46 787.62 4
A10 10% SF 405.0 10 447.29 458.12 194.79 784.93 3.5
A15 15% SF 382.5 15 445.76 456.54 194.12 782.23 3.5
A20 20% SF 360.0 20 444.22 454.97 193.45 779.54 3
A25 25% SF 337.5 25 442.69 453.40 192.78 776.84 3
N5 5% GP 427.5 5 448.83 459.69 195.46 787.62 4
N10 10% GP 405.0 10 447.29 458.12 194.79 784.93 4
N15 15% GP 382.5 15 445.76 456.54 194.12 782.23 4
N20 20% GP 360.0 20 444.22 454.97 193.45 779.54 3.5
N25 25% GP 337.5 25 442.69 453.40 192.78 776.84 3.5
A2.5+N2.5 2.5% SP and 2.5% GP 427.5 2.5 2.5 448.83 459.69 195.46 787.62 4
A5+N5 5% SP and 5% GP 405.0 5 5 447.29 458.12 194.79 784.93 4
A5+N10 5% SP and 10% GP 382.5 5 10 445.76 456.54 194.12 782.23 4
A5+N15 5% SP and 15% GP 360.0 5 15 444.22 454.97 193.45 779.54 3.5
A5+N20 5% SP and 20% GP 337.5 5 20 442.69 453.40 192.78 776.84 3.5
A10+N5 10% SP and 5% GP 382.5 10 5 445.76 456.54 194.12 782.23 3
A10+N10 10% SP and 10% GP 360.0 10 10 444.22 454.97 193.45 779.54 2.5
A10+N15 10% SP and 15% GP 337.5 10 15 442.69 453.40 192.78 776.84 2.5
A15+N5 15% SP and 5% GP 360.0 15 5 444.22 454.97 193.45 779.54 2.5
A15+N10 15% SP and 10% GP 337.5 15 10 442.69 453.40 192.78 776.84 2.5
A20+N5 20% SP and 5% GP 337.5 20 5 448.83 459.69 195.46 787.62 2.5
A=Silica fume, N=Ground pumice, A+N=Silica fume+Ground pumice, SP= Superplasticizer, CL=Crushed limestone
All of the materials used to produce concrete were admixed in accordance with ASTM C192 [21] in a
power driven turning pan-type mixer. For the prepared concrete mixtures, fifteen 100x100x100 mm cubes
fc and Upv at 7, 28, 56, 91 and 365 days, three 150x150x150 mm cubes fsts at 28 days, three 100x100x400
mm prisms ffs at 28 days were moulded and compacted by a vibrating table. After moulding and surface
Evaluation of the relationships between the strength …
December 2015 IJST, Transactions of Civil Engineering, Volume 39, Number C2+
527
finishing, all of the specimens were taken to laboratory for 24 hours. Afterwards, the concrete specimens
were demoulded and moved to saturated lime water at 23±2 oC for curing until the testing age. The
concrete specimens were cured according to ASTM C 192 [21].
c) Experiment procedure
After producing concrete, the workability of fresh concrete was determined in connection with slump.
The slump experiment was conducted according to TS EN 12350-2 [22] and ASTM C143 [23]. The Upv
values of concrete were measured on 100x100x100 mm cube specimens which were produced for
obtained fc values at the ages of 7, 28, 56, 91 and 365 days. The fc values of the concrete were determined
by crushing three 100x100x100 mm cube specimens at the ages of 7, 28, 56, 91 and 365 days for each
mixture. The fc experiment was carried out by a 3000-kN capacity testing machine according to TS EN
12390-3 [24] and ASTM C 39 [25]. The fsts and ffs values of the concrete were determined by crushing
three 150x150x150 mm cube specimens and three 100x100x400 mm prism specimens at the age of 28
days for each mixture, respectively. The fsts and ffs experiments were carried out according to TS EN
12390-6 [26] and TS EN 12390-5 [27].
The Upv experiment is carried out by a non-destructive ultrasound testing utility. The Upv is calculated
by using the following Eq. (1) depending on transition time from sample size of ultrasound waves.
pv
SU = ×10
t (1)
where, Upv is the ultrasound pulse velocity (km/s), S is the length of the straight wave path through the
example (cm) (10 cm in this paper), and t is the travel time of the ultrasonic pulse through S (s).
3. RESULTS AND DISCUSSION
a) Ultrasound pulse velocity
The ultrasound pulse velocity (Upv) experiment results fundamentally include the measurements of
electronic wave velocity through concrete specimen. The Upv experiment is used to determine the concrete
quality [28]. The obtained Upv values of HSC concrete containing SF, GP and SF in combination with GP
at the ages of 7, 28, 56, 91 and 365 days in this study are shown in Fig. 1. In the first series, it was proved
that concrete mixtures produced with SF exhibited higher Upv than control concrete at all ages as seen in
Fig. 1. In this series, it was observed that the best combination for improving Upv was the concrete mixture
with A10 and A15. This shows that the concrete with lower ingredient of SF (A5, A10 and A15) is denser
than the concrete with higher ingredient of SF (A20 and A25) at the same water-binder ratio. In the second
series, it can be shown from Fig. 1 that the Upv values of concrete containing GP (apart from concrete
containing N5) are lower than the Upv of corresponding control concrete at all ages. In this series, the
addition of N5 gives the best result when compared to other GP replacement levels. In the third series, SF
and GP combinations increased the Upv values at all ages according to the control mixture as seen in Fig.
1. It was observed that the best combination in this series for improving Upv was the mixture with
A15+N5. The highest Upv values of specimens were found in the concrete mixtures that included A15
according to the Upv value of all series. The increase in the Upv values with ingredients of SF and GP in
concrete reveals that the concrete quality in terms of density, uniformity and devoid of flaws is excellent.
M. Saridemir et al.
IJST, Transactions of Civil Engineering, Volume 39, Number C2+ December 2015
528
5.4
5.5
5.6
5.7
5.8
5.9
C
A5
A1
0
A1
5
A2
0
A2
5
N5
N1
0
N1
5
N2
0
N2
5
A2
.5+
N2.5
A5
+N
5
A5
+N
10
A5
+N
15
A5
+N
20
A1
0+
N5
A1
0+
N10
A1
0+
N15
A1
5+
N5
A1
5+
N10
A2
0+
N5
Ult
raso
un
d p
uls
e v
elo
city
, k
m/s
Specimens
7 days Upv 28 days Upv 56 days Upv 91 days Upv 365 days Upv
Fig. 1. The Upv values of HSC containing SF, GP and SF in combination with GP
b) Compressive strength
The compressive strength (fc) experiment results of HSC containing SF, GP and SF in combination
with GP are shown in Fig. 2, where each value was averaged from the results of three 100x100x100 mm
cube specimens at the ages of 7, 28, 56, 91 and 365 days. In addition, the fc values of HSC containing SF,
GP and SF in combination with GP, which are normalized according to control concrete specimens, are
given in Table 3. The effect of SF, GP and SF in combination with GP on fc values of concrete can
obviously be seen from this table and figure. The results of the first series indicate that the fc values
increased with the increasing SF ingredient according to control concretes at all ages. The concrete with
higher ingredient of SF (A20 and A25) revealed lower fc values compared to the concrete with lower
ingredient of SF (A10 and A15). In this series, the addition of A15 gave the best results when compared to
other SF replacement levels. Shannag [29] made similar observations, indicating that the fc of HSC
concrete containing SF increased with SF ingredient up to 15% and then decreased slowly. In the second
series, the fc values (apart from concrete containing N5) were observed to have been lower than the fc
values of control concretes at all ages. In this series, the addition of N5 gave the best results when
compared to the other GP replacement levels. The concrete mixtures of this series with replacement of
N20 and N25 gave the lowest fc values and were approximately between 73-90 MPa and 71-89 MPa at all
ages, respectively. The contribution of GP to fc values became more pronounced at later ages according to
the early ages, because of the lower activity of GP. In these series, the fc values were found to be between
81-122 MPa for the concretes containing SF, while the fc values were found approximately between 71-90
MPa for the concretes containing GP, at all ages. Binici et al. [15] observed that the fc of concrete
containing GP specimens was almost equal to the fc of the control concrete specimens. In the third series,
SF and GP combinations increased the fc values according to control concretes at all ages as seen in Fig. 2.
Among the combinations in this series, it was understood that the best combination for increasing fc values
was the mixture with A15+N5. For the best combination of this series, the fc values were found
approximately between 90-119 MPa, at all ages. This means that the increase ratio of fc values for this
series is about 26% compared to the control concretes at all ages. The results of the whole series indicate
that at the early ages, the SF contributed better to the fc development of high performance cement pastes
than the GP. This phenomenon was attributed to the higher rate of hydration in the concrete containing SF.
The results of this paper show that the concrete mixture containing A15, N5 and A15+N5 might be
considered as an optimum concrete mixture for manufacturing high to the HSC. The increase in the fc of
concretes containing SF and GP can be clarified in a way similar to the fc increase in the mortar mixtures.
Moreover, these pozzolanic materials play an important role in enhancing the cement paste and aggregate
Evaluation of the relationships between the strength …
December 2015 IJST, Transactions of Civil Engineering, Volume 39, Number C2+
529
particle bond through the formation of more calcium silicate hydrate (C-S-H) (CaO.SiO2.H2O) and the
density of the transition zone [29].
60
70
80
90
100
110
120
130C
A5
A10
A15
A20
A25
N5
N10
N15
N20
N25
A2.5
+N
2.5
A5+
N5
A5+
N10
A5+
N15
A5+
N20
A10+
N5
A10+
N10
A10+
N15
A15+
N5
A15+
N10
A20+
N5
Com
press
ive s
tren
gth
, M
Pa
Specimens
7 days fc 28 days fc 56 days fc 91days fc 365 days fc
Fig. 2. The fc values of HSC containing SF, GP and SF in combination with GP
Table 3. The normalized values of the fc, fsts and ffs of HSC
Mixtures
fc (MPa)
fsts (MPa)
ffs (MPa)
7 days 28 days 56 days 91 days 365 days 28 days 28 days
C
1.00 1.00 1.00 1.00 1.00 1.00 1.00
A5
1.02 1.16 1.19 1.21 1.19 1.08 1.12
A10
1.08 1.30 1.30 1.29 1.28 1.09 1.16
A15
1.15 1.32 1.31 1.32 1.30 1.11 1.17
A20
1.06 1.24 1.26 1.28 1.26 1.10 1.12
A25
0.99 1.16 1.20 1.23 1.22 1.04 1.06
N5
1.03 1.00 1.03 1.05 1.03 1.02 1.02
N10
0.98 0.98 1.00 1.00 0.99 1.00 1.00
N15
0.95 0.96 0.98 0.99 0.98 0.99 0.99
N20
0.92 0.94 0.96 0.98 0.96 0.97 0.98
N25
0.89 0.91 0.94 0.96 0.95 0.95 0.96
A2.5+N2.5
1.09 1.12 1.13 1.16 1.13 1.05 1.05
A5+N5
1.10 1.15 1.17 1.18 1.16 1.05 1.06
A5+N10
1.09 1.17 1.17 1.19 1.17 1.06 1.08
A5+N15
1.00 1.09 1.09 1.13 1.13 1.02 1.02
A5+N20
1.00 1.05 1.14 1.16 1.14 1.00 1.00
A10+N5 1.13 1.24 1.24 1.26 1.24 1.09 1.13
A10+N10 1.12 1.21 1.21 1.22 1.21 1.07 1.09
A10+N15 1.10 1.20 1.22 1.21 1.20 1.07 1.05
A15+N5 1.14 1.22 1.26 1.28 1.27 1.08 1.09
A15+N10 1.07 1.12 1.18 1.24 1.23 1.05 1.03
A20+N5 1.04 1.05 1.12 1.15 1.13 1.00 0.99
fc= Compressive strength, fsts= Splitting tensile strength, ffs= Flexural strength
c) Splitting tensile strength
The splitting tensile strength (fsts) experiment results of HSC containing SF, GP and SF in
combination with GP are shown in Fig. 3, where each value was averaged from the results of three
150x150x150 mm cube specimens at the age of 28 days. In addition, the fsts values of these concretes,
which are normalized according to the fsts value of control concrete, are given in Table 3. The variation of
fsts values for all specimens is similar to that of the fc. In the first series, it can be observed that the
concretes produced with SF show higher fsts than control concrete at 28 days as seen in Fig. 3. The
M. Saridemir et al.
IJST, Transactions of Civil Engineering, Volume 39, Number C2+ December 2015
530
increases in the fsts values according to control mixture for this series were determined as approximately
8%, 10%, 11%, 10% and 4% for A5, A10, A15, A20 and A25 ingredients, respectively. In this series, it
was observed that the best combination for improving fsts was the concrete mixture with A15. A similar
result was observed in the study by Güneyisi et al. [12] and Shannag [29]. Besides, Almusallam et al. [30]
and Bhanja and Sengupta [31] investigated the effect of SF on the fsts of HPC. They stated that the highest
fsts was observed in the 15% SF ingredient concretes followed by those produced with 10% SF ingredient.
In the second series, the fsts of concrete mixtures containing N5 and N10 were higher than the fsts of control
concrete at 28 days, while the fsts of concrete mixtures containing N15, N20 and N25 were lower than the
fsts of control concrete at 28 days. In this series, the increases in the fsts values according to control mixture
were determined as approximately 2% and 0.2% for N5 and N10 ingredients, respectively, while the
decreases were determined as approximately 1%, 3% and 5% for N15, N20 and N25 ingredients,
respectively. In this series, it is observed that GP ingredient was not so effective on the fsts values. In the
third series, SF and GP combinations increased the fsts values at 28 days according to control concrete. In
this series, it was observed that the best combination among these tried combinations for improving fsts
values was the mixture with A10+N5. The addition of more than 20% SF and GP replacement with
cement decreased the fsts values. The replacement of SF by weight of cement up to 20% (A5, A10, A15
and A20) in concretes containing GP up to 10% (N5 and N10) has enhanced the fsts of the concretes and
lifted them above that of the control concrete. In the literature, there are no studies on the fsts values of
concrete containing GP and SF in combination with GP.
3.0
3.5
4.0
4.5
5.0
5.5
6.0
5.0
6.0
7.0
8.0
9.0
10.0
C
A5
A1
0
A1
5
A2
0
A25
N5
N1
0
N1
5
N20
N25
A2
.5+
N2
.5
A5
+N
5
A5+
N10
A5+
N15
A5
+N
20
A1
0+
N5
A1
0+
N1
0
A10+
N15
A1
5+
N5
A1
5+
N1
0
A2
0+
N5
Sp
litt
ing t
en
sile
str
en
gth
, M
Pa
Fle
xu
ral
stren
gth
, M
Pa
Specimens
28 days ffs 28 days fsts
Fig. 3. The fsts and ffs values of HSC containing SF, GP and SF in combination with GP
d) Flexural strength
The experimental results of flexural strength (ffs) of HSC containing SF, GP and SF in combination
with GP at the age of 28 days are exhibited in Fig. 3. Each value in this figure represents the average ffs
values of three 100x100x400 mm prism specimens. Besides, the ffs values of these concretes, which are
normalized according to the ffs value of control concrete, are given in Table 3. In the first series, it can be
observed that concretes containing SF show higher ffs than control concrete at 28 days as seen in Fig. 3.
From the experimental results of this series, it can be seen that there is increase in ffs with replacement in
the range of A5, A10 and A15 of cement by SF; nevertheless, the rate of increase of ffs reduces with
replacement within the range of A20 and A25 of cement by SF. In this series, it was observed that the best
combination for improving ffs was the concrete mixture with 15% SF like other strength properties. Bhanja
and Sengupta [31] investigated the contribution of SF on the ffs of HPC. Studies carried out by various
researchers stated that the gains in fsts values were higher than the ffs values at lower replacement levels.
Evaluation of the relationships between the strength …
December 2015 IJST, Transactions of Civil Engineering, Volume 39, Number C2+
531
They found that the optimum replacement ratios of SF were about 15% to 25% of cement. In the second
series, the ffs values increase with replacement in the range of A5 of cement by GP, while the ffs values
decrease with replacement in the range of A10, A15, A20 and A25 of cement by GP. In this series, the
increase in the ffs value according to control mixture was determined as approximately 2% for A5
ingredients, while the decrease was determined as approximately 0.1%, 1%, 2% and 4% for A10, A15,
A20 and A25 ingredients, respectively. In the third series, SF and GP combinations increase the fsts at 28
days according to control concrete separate from concrete containing A20+N5, and A5+N20. In this
series, it was observed that the best combination among these investigated combinations for improving ffs
was the mixture with replacement in the range of A10 and N5. The study shows that the addition of more
than 20% of SF and GP combination replacement with cement decreases the ffs, similar to the fsts.
e) Microstructure analysis
Microstructure analysis was carried out by scanning electron microscopy (SEM) to identify the
porosity and morphology of the interface transition zone between the aggregate and cementitious
materials. The microstructure analysis was made with concrete specimens of the control concrete, the
concrete containing A15, the concrete containing N5 and the concrete containing A15+N5. The
morphology of interface transition zone was carried out on the small samples taken from the randomly
broken concrete specimens.
Figure 4 reveals the effect of SF, GP and SF in combination with GP on morphology of the interface
transition zone for the specimens obtained from the highest strength properties from all series. As shown
in Fig. 4, with addition of SF, GP and SF in combination with GP, the make-up of the interface transition
zone improves. Particularly, the C-S-H gels form the majority of the hydration products and the
component of calcium hydroxide reduces because of pozzolonic influences. As shown in Fig. 4, the
amount of hydration products obtained from the concrete containing A15 and A15+N5 is higher compared
to those of control concrete and the concrete containing N5. It can be deduced that strength of concrete
containing GP is comparatively low, since pozzolanic activity of GP is not as good as pozzolanic activity
of SF. This is one of the most significant factors on the strength increase. Moreover, the fineness of SF
and GP is a significant parameter with regard to filling gaps between aggregate and cement. Particularly,
the average particle size of SF used in the concrete mixtures is very small compared to that of cement and
GP. Therefore, the microfiller influence of SF may be as significant as the pozzolanic influence of SF at
the strength increase [14, 32].
4. ANALYSIS OF EXPERIMENTAL RESULTS
The regression analysis is modelled by linear and power regression equations for evaluating the
relationship between independent and dependent variables. The general forms of the linear and power
regression models can be defined as follows, respectively:
y= a+bx (2)
y= axb (3)
where y, a, b and x are the dependent variable, constant coefficients and the independent variable of the
problem dealt with, respectively.
In the present paper, the relationships between cube fc, Upv, fsts and ffs values of HSC containing SF,
GP and SF in combination with GP obtained from experimental study were investigated with linear and
power regression models.
M. Saridemir et al.
IJST, Transactions of Civil Engineering, Volume 39, Number C2+ December 2015
532
Fig. 4. SEM morphology of cementitious materials: a) The control concrete, b) The concrete containing A15,
c) The concrete containing N5 and d) The concrete containing A15+N5
a) Relationships between compressive strength and ultrasound pulse velocity
The relationship between the partial cement replacement, Upv and cube fc values at the ages of 7, 28,
56, 91 and 365 days obtained from experimental studies are given in Fig. 5a as three-dimensional. As seen
in this figure, if the Upv value is high, the fc value is high; and if the Upv value is low, the fc value is low. In
addition, both Upv and fc have higher values if the partial cement replacement values are between 40 and
90 kg (approximately 10% and 20%) according to Fig. 5a. The relationship between the Upv and cube fc
values at the ages of 7, 28, 56, 91 and 365 days obtained from experimental results of HSC containing SF,
GP and SF in combination with GP are evaluated by using power regression model as seen in Fig. 5b.
Also, the parameters and values of power regression model are given in Table 4. High correlation between
the Upv and cube fc values is determined as shown in Fig. 5b. This high correlation is clearly confirmed by
the standard error, R and R² values shown in Table 4. R² value obtained from the comparison is close to
one. This value shows that a very good relationship between the Upv and cube fc values, and also fc values
can be calculated from Upv values.
Table 4. Results of linear and power regression models
Regression type Equation Parameters Std Error R R2
Value Std Error Range (95% confidence)
Power fc=a×(Upv)b a 4×10⁻⁵ 0.00001 0.00001 to 0.00007 3.013 0.971 0.936
b 8.5 0.21005 8.07324 to 8.90595
Power fsts=a×(fc)b a 0.77 0.08236 0.5991 to 0.9427 0.045 0.963 0.940
b 0.37 0.02320 0.3227 to 0.4195
Linear ffs=a+b×(fc) a 4.25 0.38910 3.4354 to 5.0587 0.177 0.925 0.894
b 0.042 0.00388 0.0342 to 0.0504
Power ffs=a×(fsts)b a 1.22 0.15632 0.8954 to 1.5475 0.132 0.959 0.926
b 1.34 0.08824 1.1540 to 1.5221
Aggregate Aggregate
Aggregate
Aggregate Matrix
Matrix
Matrix
Matrix
a b
c d
Evaluation of the relationships between the strength …
December 2015 IJST, Transactions of Civil Engineering, Volume 39, Number C2+
533
a) b)
Fig. 5. a) Effect of partial cement replacement on the Upv and fc, b) the relationship between the Upv with fc
The experimental fc values are compared with fc values obtained by using power regression model as
seen in Fig. 6. The comparison shows that these values are close to each other. This situation is verified by
R2 values given on Fig. 6.
y = 0.956x+11.719
R² = 0.936
65
70
75
80
85
90
95
100
105
110
115
120
125
130
65 70 75 80 85 90 95 100 105 110 115 120 125 130
Ca
lcu
late
d c
om
press
ive s
tren
gth
, M
Pa
Experimental compressive strength, MPa
fc results
Fig. 6. Comparison of fc values obtained from experimental studies and by using Upv
b) Relationships of compressive strength with splitting tensile and flexural strengths
The relationships of partial cement replacement and cube fc values at the age of 28 days obtained
from experimental studies with the fsts and ffs values are given in Fig. 7a and 8a as three dimensional,
respectively. As seen in these figures, if the partial cement replacement values are between 40 and 90 kg
(approximately 10% and 20%) and the fc value are high, the fsts and ffs values are high. But the increase in
the fsts and ffs values is not more then the increase at the fc values. The relationships between the fsts-fc and
the ffs-fc values at the age of 28 days obtained from experimental results of HSC containing SF, GP and SF
in combination with GP are obtained by using linear and power regression model as seen in Fig. 7b and
8b. The values obtained by using these regression models show that there is a significant relationship of
the fsts-fc and the ffs-fc values. This situation is clearly shown by the statistical parameters given in Table 4.
The experimental fsts and ffs values are compared with the fsts and ffs values obtained by using linear
and power regression models for the fc values as seen in Fig. 9 and 10, respectively. The comparison
shows that these values are close to each one. The equations given in Table 4 and obtained by linear and
power regression models are used for calculating the fsts and ffs values from the fc values.
Power fc=a×(Upv)
b
a=0.0004
b=8.50
M. Saridemir et al.
IJST, Transactions of Civil Engineering, Volume 39, Number C2+ December 2015
534
a) b)
Fig. 7. a) Effect of partial cement replacement on the fsts and fc, b) the relationship between the fsts with fc
a) b)
Fig. 8. a) Effect of partial cement replacement on the ffs and fc, b) the relationship between the ffs with fc
y = 0.888x+0.452
R² = 0.94
3.8
3.9
4.0
4.1
4.2
4.3
4.4
4.5
4.6
3.8 3.9 4.0 4.1 4.2 4.3 4.4 4.5 4.6
Ca
lcu
late
d s
pli
ttin
g t
en
sile
str
en
gth
, M
Pa
Experimental splitting tensile strength, MPa
fsts results
Fig. 9. Comparison of fsts values obtained from experimental studies and by using fc
Power fsts=a×(fc)
b
a=0.77
b=0.37
Linear ffs=a+b×(fc)
a=4.25
b=0.042
Evaluation of the relationships between the strength …
December 2015 IJST, Transactions of Civil Engineering, Volume 39, Number C2+
535
y = 0.88x+1.041
R² = 0.894
7.5
8.0
8.5
9.0
9.5
7.5 8.0 8.5 9.0 9.5
Calc
ula
ted
fle
xu
ral
stren
gth
, M
Pa
Experimental flexural strength, MPa
ffs results
Fig. 10. Comparison of ffs values obtained from experimental studies and by using fc
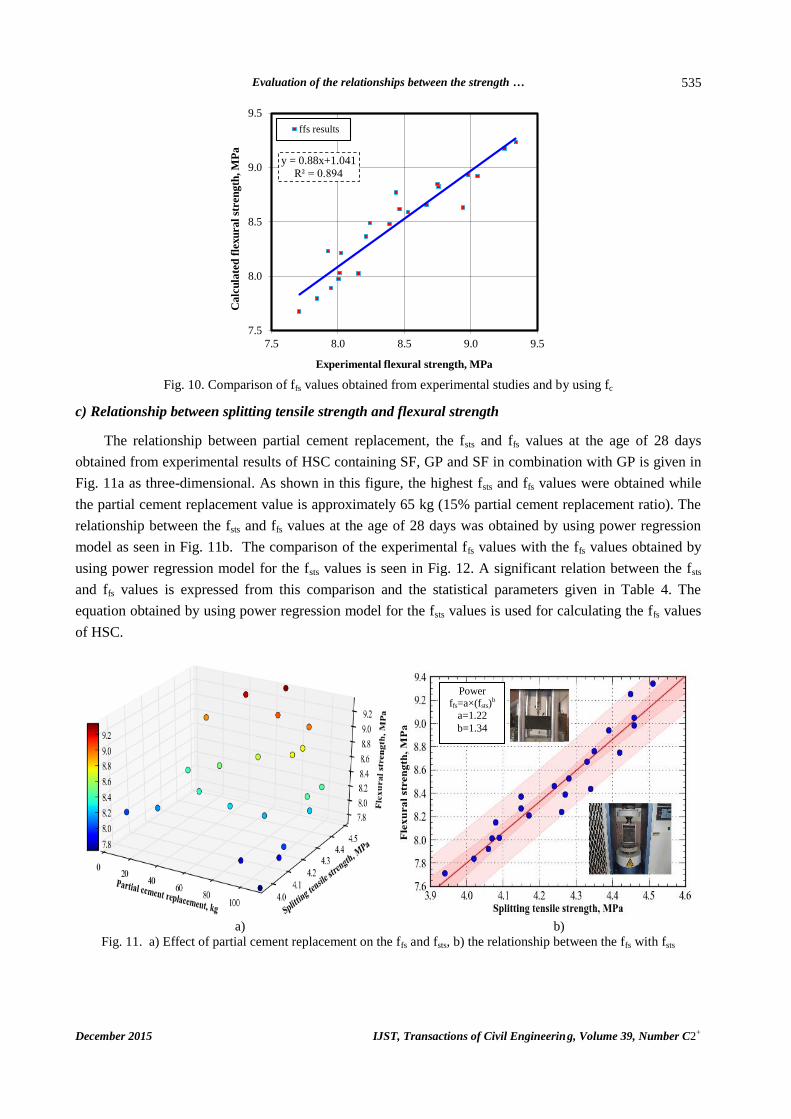
c) Relationship between splitting tensile strength and flexural strength
The relationship between partial cement replacement, the fsts and ffs values at the age of 28 days
obtained from experimental results of HSC containing SF, GP and SF in combination with GP is given in
Fig. 11a as three-dimensional. As shown in this figure, the highest fsts and ffs values were obtained while
the partial cement replacement value is approximately 65 kg (15% partial cement replacement ratio). The
relationship between the fsts and ffs values at the age of 28 days was obtained by using power regression
model as seen in Fig. 11b. The comparison of the experimental ffs values with the ffs values obtained by
using power regression model for the fsts values is seen in Fig. 12. A significant relation between the fsts
and ffs values is expressed from this comparison and the statistical parameters given in Table 4. The
equation obtained by using power regression model for the fsts values is used for calculating the ffs values
of HSC.
a) b)
Fig. 11. a) Effect of partial cement replacement on the ffs and fsts, b) the relationship between the ffs with fsts
Power ffs=a×(fsts)
b
a=1.22
b=1.34
M. Saridemir et al.
IJST, Transactions of Civil Engineering, Volume 39, Number C2+ December 2015
536
y = 0.90x+0.84
R² = 0.92
7.5
8.0
8.5
9.0
9.5
7.5 8.0 8.5 9.0 9.5
Ca
lcu
late
d f
lexu
ra
l st
ren
gth
, M
Pa
Experimental flexural strength, MPa
ffs results
Fig. 12. Comparison of ffs values obtained from experimental studies and by using fsts
5. CONCLUSION
The aim of the present paper is to evaluate the effect of SF, GP and SF in combination with GP
admixtures on the strength properties of HSC. Therefore, the Upv, fc, fsts, and ffs values of the control
concrete and the concretes containing SF, GP and SF in combination with GP were determined by
experimental study with the water-binder ratio of 0.25. Based on the results and discussion, the following
conclusions can be drawn from this paper.
The use of SF to replace cement by weight increases the Upv, fc, fsts, and ffs values according to
control mixture. In particular, the use of A15 to replace cement by weight provides the highest Upv,
fc, fsts, and ffs values.
The use of N5 to replace cement by weight increases the Upv, fc, fsts, and ffs values according to
control mixture at all ages while the other use of GP decreases the Upv, fc, fsts, and ffs values. The
highest Upv, fc, fsts, and ffs values were obtained from the concrete mixture containing N5.
The use of SF in combination with GP to replace cement by weight increases the Upv and fc values
according to control mixture at all ages. The highest Upv and fc values are obtained from the
concrete mixture containing A15+N5.
The use of SF in combination with GP to replace cement by weight increases the fsts and ffs values
according to control mixture. The highest fsts and ffs values were obtained from the concrete mixture
containing A10+N5.
The contribution of SF on the fc values becomes more pronounced at early ages according to later
ages, while the contribution of GP on the fc values becomes more pronounced at later ages
according to early ages.
The results of equations obtained by regression analysis models are in good agreement with the
experimental results for the Upv, fc, fsts, and ffs values. These equations can be used for determining
the fc from Upv, fsts and ffs from fc and ffs from fsts values for HSC.
The experimental results indicate that, HSC can be obtained with SF, GP and SF combination with GP. In
particular, it is recommended that 15% by weight of SF can be utilized as a replacement for cement to
obtain HSC with excellent properties.
Evaluation of the relationships between the strength …
December 2015 IJST, Transactions of Civil Engineering, Volume 39, Number C2+
537
REFERENCES
1. Jaturapitakkul, C., Kiattikomol, K., Sata, V. & Leekeeratikul, T. (2004). Use of ground coarse fly ash as a
replacement of condensed silica fume in producing high-strength concrete. Cement and Concrete Research, Vol.
34, No. 4, pp. 549-555.
2. Giaccio, G., de Sensale, G. R. & Zerbino, R. (2007) Failure mechanism of normal and high-strength concrete
with rice-husk ash. Cement and Concrete Composites, Vol. 29, No.7, pp. 566-574.
3. ACI Committee 363. (2000). State of the art report on high-strength concrete. ACI 363R-92, ACI Manual of
Concrete Practice: Part I. American Concrete Institute, Detroit.
4. Kockal, N. U. (2013). Effects of elevated temperature and re-curing on the properties of mortars containing
industrial waste materials. Iranian Journal of Science & Technology, Transactions of Civil Engineering, Vol. 37,
No. C1, pp. 67-76.
5. Thirumurugan, A. & Sivaraja, M. (2015). Strength and fracture properties of hybrıd fibre reinforced concrete.
Iranian Journal of Science & Technology, Transactions of Civil Engineering, Vol. 39, No. C1, pp. 93-102.
6. Kim, J., Han, S., Park, Y. & Noh, J. (1998). Material properties of self-flowing concrete. Journal of Materials in
Civil Engineering, Vol. 10, No. 4, pp. 244–249.
7. Al-Jabri, K. S., Hisada, M., Al-Oraimi, S. K. & Al-Saidy, A. H. (2009). Copper slag as sand replacement for
high performance concrete. Cement and Concrete Composites, Vol. 31, No. 7, pp. 483-488.
8. Hamblin, C. H. (2004). Development of high performance concrete for use on Tennessee bridge decks and
overlays. Master’s Thesis, University of Tennessee, pp. 1-82.
9. Rashid, M. A., Mansur, M. A. & Paramasivam, P. (2002). Correlations between mechanical properties of high-
strength concrete. Journal of Materials in Civil Engineering, Vol. 14, No. 3, pp. 203-238.
10. Mehta P. K. (1999). Advancements in concrete technology. Concrete Institute; Vol. 96, No. 4, pp. 69-76.
11. Köksal, F., Altun, F., Yiğit, İ. & Şahin, Y. (2008). Combined effect of silica fume and steel fiber on the
mechanical properties of high strength concretes. Construction and Building Materials, Vol. 22, No. 8, pp.
1874-1880.
12. Güneyisi, E., Gesoğlu, M., Karaoğlu, S. & Mermerdaş, K. (2012). Strength, permeability and shrinkage cracking
of silica fume and metakaolin concretes. Construction and Building Materials, Vol. 34, pp. 120-130.
13. Demirel, B. & Keleştemur, O. (2010). Effect of elevated temperature on the mechanical properties of concrete
produced with finely ground pumice and silica fume. Fire Safety Journal, Vol. 45, No. 6–8, pp. 385-391.
14. Keleştemur, O. & Demirel, B. (2010). Corrosion behavior of reinforcing steel embedded in concrete produced
with finely ground pumice and silica fume. Construction and Building Materials, Vol. 24, No. 10, pp. 1898-
1905.
15. Bı nı ci, H., Durgun, M. Y., Rızaoğlu, T. & Koluçolak, M. (2012). Investigation of durability properties of
concrete pipes incorporating blast furnace slag and ground basaltic pumice as fine aggregates. Scientia Iranica,
Vol. 19, No. 3, pp. 366-372.
16. Özodabaş, A. & Yılmaz, K. (2013). Improvement of the performance of alkali activated blast furnace slag
mortars with very finely ground pumice. Construction and Building Materials, Vol. 48, pp. 26-34.
17. Sarıdemir, M. (2013). Effect of silica fume and ground pumice on compressive strength and modulus of
elasticity of high strength concrete. Construction and Building Materials, Vol. 49, pp. 484–489.
18. Binici, H., Aksogan, O., Sevinc, A. H. & Kucukonder, A. (2014). Mechanical and radioactivity shielding
performances of mortars made with colemanite, barite, ground basaltic pumice and ground blast furnace slag.
Construction and Building Materials, Vol. 50, pp. 177-183.
19. TS EN-197-1. (2004). Cements-Part 1: Compositions and conformity criteria for common cements. Turkish
Standards Institute, TSE, Turkey.
M. Saridemir et al.
IJST, Transactions of Civil Engineering, Volume 39, Number C2+ December 2015
538
20. ASTM C618. (2003). Standard specification for coal fly ash and raw or calcined natural pozzolan for use in
concrete. American society for testing and materials. West Conshohocken, PA, USA: ASTM International.
21. ASTM C 192. (2000). Standard practice for making and curing concrete test specimens in the laboratory. Annual
Book of ASTM Standards, Vol.04.02.
22. TS EN 12350-2. (2010). Testing fresh concrete – part 2: slump test. TSE, Turkey.
23. ASTM C 143. (1988). Standard test method for slump of hydraulic cement concrete. Annual Book of ASTM
Standards, Vol. 04.02.
24. TS EN 12390-3. (2010). Testing hardened concrete - part 3: compressive strength of test specimens. TSE,
Turkey.
25. ASTM C 39/C 39M-12. (2012). Standard test method for compressive strength of cylindrical concrete
specimens. ASTM Vol.04.02. West Conshohocken, PA.
26. TS EN 12390-6. (2010). Testing hardened concrete - part 6: tensile splitting strength of test specimens. TSE,
Turkey.
27. TS EN 12390-5. (2010). Testing hardened concrete - part 5: flexural strength of test specimens. TSE, Turkey.
28. Singh, G. & Siddique, R. (2012). Effect of waste foundry sand (WFS) as partial replacement of sand on the
strength, ultrasonic pulse velocity and permeability of concrete. Construction and Building Materials, Vol. 26,
pp. 416–422.
29. Shannag, M. J. (2000). High strength concrete containing natural pozzolan and silica fume. Cement and
Concrete Composites, Vol. 22, pp. 399-406.
30. Almusallam, A. A., Beshr, H., Maslehuddin, M. & Al-Amoudi, O. S. B. (2004). Effect of silica fume on the
mechanical properties of low quality coarse aggregate concrete. Cement and Concrete Composites, Vol. 26, No.
7, pp. 891-900.
31. Bhanja, S. & Sengupta, B. (2005). Influence of silica fume on the tensile strength of concrete. Cement and
Concrete Research, Vol. 35, No. 4, pp. 743-747.
32. Goldman, A. & Bentur, A. (1993). The influence of micro fillers on enhancement of concrete strength. Cement
and Concrete Research, Vol. 23, pp. 962–972.


![STUDY ON THE EFFECT OF SPACERS ON THE ULTIMATE …ijstc.shirazu.ac.ir/article_1863_e16fc189512fa66834b0670038afaa2d… · walled lipped-channel section columns. Kwon and Hancock [4]](https://static.documents.pub/doc/80x56/60178eb02e825c04db3655b8/study-on-the-effect-of-spacers-on-the-ultimate-ijstc-walled-lipped-channel-section.jpg)