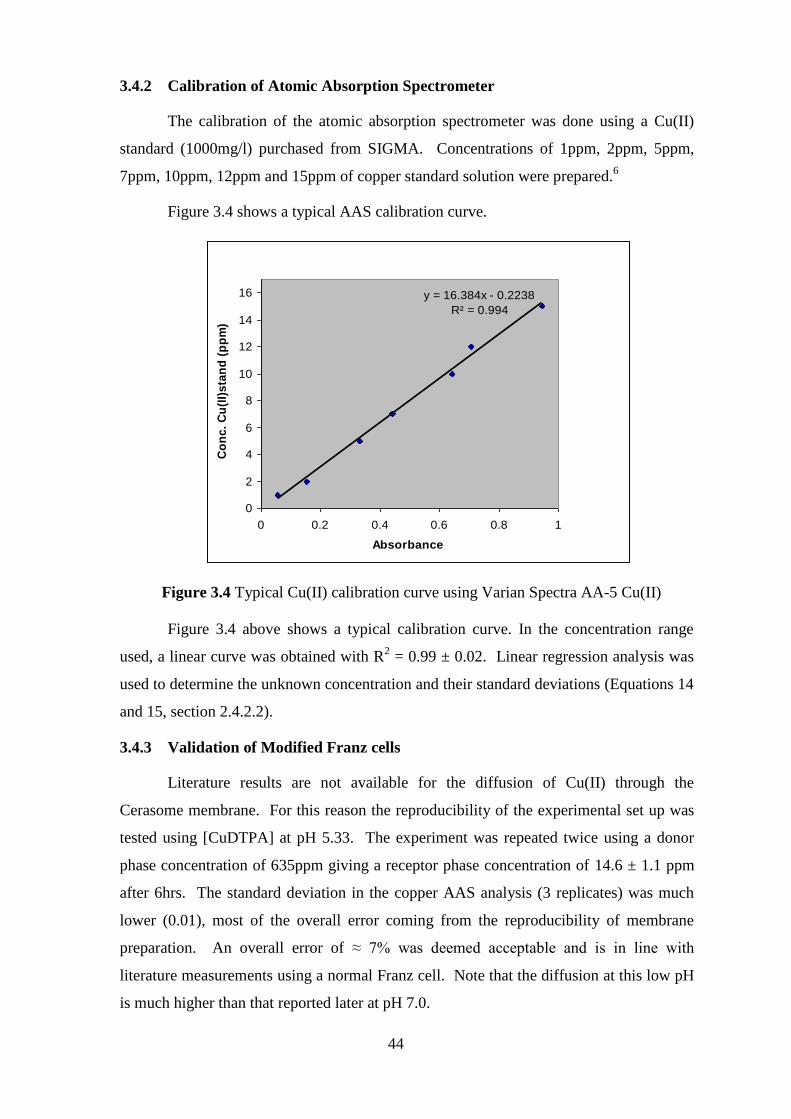
Page 1
Evaluation of Tissue Permeability of novel Copper
based Anti-arthritic Drugs
A dissertation submitted to the
University of Cape Town
In fulfilment of the requirements for the degree of
MASTER OF SCIENCE
By
Evariste Umba Tsumbu
B.Sc (Hons) University of Kinshasa/DRC
Supervisor:
Prof. Graham E. Jackson
Department of Chemistry
University of Cape Town
Rondebosch
7701
South Africa August 2010
Page 2
ii
Your rewards in life are determined by the kinds of problems you
are willing to solve for others (Dr. Mike Murdock).
Page 3
iii
Dedication
I dedicate this entire dissertation to my mother (Georgette
Tsumbu), Father (Umba Makaba), Aunt (Fidelise Ngoma) for their
love and support during my study at University of Cape Town, and
to everyone suffering with Rheumatoid Arthritis.
Page 4
iv
Acknowledgements
I would like to express my sincere gratitude to the following:
Above all, to our Father-God in heaven, for supplying us everything we need in
Jesus’ name.
My supervisor, Professor Graham Jackson, for accepting me in his research group,
his willingness, guidance, endless patience and support throughout the course of
this study.
My colleagues in research group for their support.
The members of Chemistry Department (UCT) for supplying us laboratories,
chemicals and equipments.
Eric Abraham Foundation through IAPO (UCT) and The National Research
Foundation (NRF) for funding this research.
Lipoid GmbH Company (Germany) for supplying us with Cerasome 9005.
My family and friends for their continued support and encouragement.
Page 5
v
Publication
Inorg2009, Programme Abstracts Delegates, Poster abstract 77, page 135.
Conferences
Parts of this thesis have been presented at the following conferences:
1. South African Chemical Institute (SACI): Conference on Inorganic Chemistry,
INORG2009, University of Free State and Bains Game Lodge, Bloemfontein.
13-17 September 2009, Poster presentation.
2. Democratic Republic of Congo, University of Kinshasa, Seminar on
Rheumatoid Arthritis, 04-05 May 2010, Talk.
Page 6
vi
Abstract
The present study has been designed to investigate the effect of different ligands
on the dermal absorption of copper.
Eight copper chelating agents, ethylenediaminetetraacetate (EDTA), glycine and
alanine, diethylenetriaminepentaacetic acid (DTPA), homopiperazine, N,N’-di
(aminoethylene)-2,6-pyridine-dicarbonylamine (PrDH), N-[2-(2-aminoethylamino) ethyl]
picolinamide (H(555)-N) and N,N’-bis[aminoethyl] propanediamide (6UH) were selected
and permeability coefficient Kp of copper complexes at room temperature through a
Cerasome 9005 measured using a modified Franz cell. The order of permeability
coefficient was found to be Gly > H(555-N) > EDTA > 6UH > Homop. > Alan. > PrDH
> DTPA > *CuCl2.2H2O (Copper(II) Chloride Dihydrate)
The permeability coefficient (Kp) values of complexes with amino-acids were
comparable to those found in the literature. All the ligands were found to enhance the
diffusion of copper when compared to CuCl2, with enhancement factors ranging from 1.6
to 6.1.
In order to explain the diffusion enhancement, octanol/water partition coefficients
(log Ko/w) of seven complexes at pH 7.00 were measured. The order of lipohilicity of the
copper complex was found to be Gly > CuH(555-N) > 6UH > EDTA > PrDH > Homop >
DTPA. However, the complexes were still lipophilic with log Ko/w = -3.
Linear regression of the measured log Kp, with both MW and log Ko/w failed.
However, non-linear regression analysis of log Kp, log Ko/w and MW was successful.
Page 7
vii
Table of contents
Dedication .................................................................................................................... iii
Acknowledgements ....................................................................................................... iv
Abstract ......................................................................................................................... vi
Table of contents……………………………………………………………………..vii
Abbreviations ................................................................................................................. x
Symbols........................................................................................................................ xii
Structural formulae of ligands discussed in this work ............................................... xiii
List of Figures ............................................................................................................. xiv
List of Tables .............................................................................................................. xvi
CHAPTER ONE: INTRODUCTION ............................................................................ 1
1.1 Inflammatory Disease .................................................................................... 2
1.2 Rheumatoid Arthritis ..................................................................................... 2
1.3 Immune System Response ............................................................................. 3
1.4 Treatment of Symptoms associated with RA................................................. 4
1.4.1 NSAIDs ........................................................................................................ 4
1.4.2 DMARDs ..................................................................................................... 6
1.4.3 Glucocorticosteroids .................................................................................... 8
1.5 Motivation for study ...................................................................................... 9
1.5.1 Copper and Rheumatoid Arthritis ................................................................ 9
1.5.2 The Anti-inflammatory role of copper ....................................................... 12
1.6 Aims and Objectives of the research ........................................................... 13
References .................................................................................................................... 14
CHAPTER TWO: TISSUE PERMEABILITY OF COPPER COMPLEXES ............ 17
2.1 Dermal Absorption study ............................................................................. 18
2.1.1 Skin……………………………………………………………………….18
2.1.2 Selection of model system for permeability study ..................................... 20
2.1.2.1 Biological membrane ...................................................................... 20
Page 8
viii
2.1.2.2 Artificial membrane ........................................................................ 20
2.1.2.3 Difference of both model membranes............................................. 21
2.1.2.4 Selection of model membrane ........................................................ 21
2.1.3 Diffusion .................................................................................................... 21
2.1.4 Partition Coefficient ................................................................................... 23
2.2 Methods and Equipments ............................................................................. 24
2.2.1 Franz Diffusion Cells ................................................................................. 24
2.2.2 Parallel Artificial Membrane Permeability Assay (PAMPA) .................... 25
2.2.3 Choice of Method and Equipment ............................................................. 25
2.2.4 Modified Franz Diffusion Cell .................................................................. 26
2.3 Selection of Ligands for permeability study ................................................ 27
2.3.1 Introduction ................................................................................................ 27
2.3.2 Complexation of ligands with Copper at physiological pH ........................ 28
2.3.3 ESTA (Equilibrium Simulation for Titration Analysis) software .............. 28
2.4 Determination of Copper concentration ....................................................... 31
2.4.1 Atomic Absorption Spectroscopy .............................................................. 31
2.4.1.1 Introduction ...................................................................................... 31
2.4.1.2 Principles and Instruments .............................................................. 32
2.4.2 Linear Regression Analysis ........................................................................ 33
2.4.2.1 Analysis aspects for linear calibration ............................................. 33
2.4.2.2 Estimation of unknown concentration X ......................................... 33
2.4.2.3 Uncertainty in Measurement: Standard Deviation ........................... 35
References .................................................................................................................... 36
CHAPTER THREE: EXPERIMENTAL ..................................................................... 38
3.1 Preparation of Copper Complexes ............................................................... 39
3.2 Modified Franz Diffusion Cells ................................................................... 39
3.3 Partition Coefficient ..................................................................................... 42
3.4 Atomic Absorption Spectroscopy ................................................................ 43
3.4.1 Working conditions……………………………………………………….44
3.4.2 Calibration of Atomic Absorption Spectrometer…………………………45
Page 9
ix
References .................................................................................................................... 45
CHAPTER FOUR: RESULTS AND DISCUSSION .................................................. 46
4.0 Dermal Absorption............................................................................................ 47
4.1 Diffusion in Franz cells ..................................................................................... 47
4.1.1 Effect of time on diffusion ............................................................................ 47
4.1.2 Flux (J) and permeability coefficient (Kp) calculations ................................ 50
4.2 Partition coefficient ........................................................................................... 53
4.3 Data Analysis .................................................................................................... 54
4.3.1 Copper speciation in the presence of different ligands................................55
4.3.2 Relationship between logarithm of permeability coefficient (Log Kp) and
molecular weight (MW) of copper complexes…………….......................55
4.3.3 Relationship between permeability coefficient (Kp) and octanol/water
partition coefficient of copper complexes………….…...........…………..57
4.3.4 Relationship between permeability coefficient (Log Kp), octanol/water
partition coefficient (Log Ko/w) and molecular weight (MW) of copper
complexes .................................................................................................. 57
References .................................................................................................................... 63
CHAPTER FIVE: CONCLUSION AND SUGGESTIONS…………………………66
References…………………………………………………………………………....70
Page 10
x
Abbreviations
AAS Atomic Absorption Spectroscopy
CAT Enzymes catalase
CuEDTA Copper(II)-Ethylenediaminetetraacetate
CuDTPA Copper(II)-Diethylenetriaminepentaacetic acid
CuGlyc Copper(II)-Glycine
CuAlan Copper(II)-Alanine
CuBIDPAP Copper(II)-1,15-bis(N,N-dimethyl)-5,11-dioxo-8-(N-benzyl)-
1,4,8,12,15-pentaazapentadecane
CuPrDH Copper(II)-N,N’-di (aminoethylene)-2,6-pyridine-dicarbonylamine
CuAcet. Copper(II)-Acetylsalicylate
CuHomop. Copper(II)-Homopiperazine or 2H-1,4-Diazepane
CuPrDPr Copper(II)-N,N’-bis[2-(2-pyridyl)-methyl]pyridine-2,6-
dicarboxamide
Cu[555-N] Copper(II)-N1-(2-aminoethyl)-N
2-(pyridin-2-ylmethyl) ethane-1,2-
diamine
Cu[H(555)-N] Copper(II)-N-[2-(2-aminoethylamino) ethyl] picolinamide
Cu[H2(555)-N] Copper(II)-N,N’-[2,2’-azanediylbis (ethane-2,1-dyil)]
dipicolinamide
Cu(6UH) Copper(II)-N,N’-bis [aminoethyl] propanediamide
CuDMDM Copper(II)-N,N’ bis [2-(dimethylamino) ethyl] propanediamide
DMARDs Disease Modifying Antirheumatic Drugs
ESTA Equilibrium Simulation for Titration Analysis
GSSH Glutathione-peroxidase
HSA Human Serum Albumin
Page 11
xi
HCL Hollow-cathode lamp
H-1 Hydroxide ion (OH-)
ML Metal-ligand
ML2 1 Metal coordinated to 2 ligands
MQ-water Milli-Q water
NSAIDs Non-Steroidal Anti-Inflammatory Drugs
PAMPA Parallel Artificial Membrane Permeability Assay
PBS Phosphate buffered saline
PDMS Poly (demethylsiloxane)
PMT Photomultiplier tube
QSARs Quantitative structure-activity relationships
RA Rheumatoid Arthritis
SAAS Slow-acting anti-arthritic drugs
SOD Superoxide dismutase
SA Serum Albumin
Page 12
xii
Symbols
J Flux in g/cm2s
Kp Permeability coefficient in cm/s
Ko/w Octanol/water partition coefficient
∆P Hydrostatic pressure in Pa
∆h Height fluid in m
φ Fluid density in Kg/m3
g Acceleration due to gravity in m/s2
βpqr Formation constant of complex
Io Incident light
It Transmitted light
SE Standard Error
SD Standard Deviation
R2 Coefficient of correlation
MW Molecular weight in g/mol
D0 The diffusivity of hypothetical molecule having zero molecular weight
h The membrane thickness
f Constant which accounts for the difference between the partitioning domain presented
by octanol and that presented by the membrane lipids
β’ Constant which includes a conversion factor for the substitution of molecular weight
for molecular volume.
Km Membrane/donor vehicle partition coefficient of the drug
Hb Hydrogen bonding
Page 13
xiii
Structural formulae of ligands discussed in this work
DTPA
NNN
O
OH
O
OH
OOH O
OH
O
OH
NH2NH2
N
O
NH
O
NH
PrDH
NN
O
OH
O
OH
O
OH
O
OH
EDTA
6UH
NH2
O
OH
Gly
O
NH2
NHNH
N
[H(555)-N]
HN
NH
Homop
NH2 O
OH
Alanine
Page 14
xiv
List of Figures
Figures Page
Figure 1.1: Normal and Arthritis joint………………………………………………….3
Figure 1.2: Progressive degeneration of the joint……………………………………....3
Figure 1.3: Copper binding site in HSA…………………………………………….....11
Figure 1.4: Biochemical mechanism of Rheumatoid Arthritis………………………....11
Figure 2.1: Diagram of skin layers..................................................................................18
Figure 2.2: Diagram of epidermis layers.........................................................................18
Figure 2.3: Diagram of stratum corneum........................................................................19
Figure 2.4: Normal Franz cell apparatus.........................................................................24
Figure 2.5: Parallel Artificial Membrane Permeability Assay apparatus........................25
Figure 2.6: Modified Franz cell apparatus......................................................................26
Figures 2.7: Complexes species percentage distribution curves of copper-ligands
systems as function of pH.............................................................................29
Figure 2.8: Atomic Absorption radiation diagram..........................................................31
Figure 3.2: Process of measurement of partition coefficient of copper complex.............41
Figure 3.3: Atomic Absorption Spectrometer (Spectra AA-5 Varian).............................43
Figure 3.4: Typical Cu(II) calibration curve using Varian Spectra AA-5.........................44
Figure 4.1: Copper diffusion of CuHomop. and CuAlan. through Cerasome 9005
membrane at pH 7.00.....................................................................................48
Figure 4.2: Variation of copper conc. of complexes vs. time through Cerasome 9005
membrane at pH 7.00.....................................................................................49
Figure 4.3: Effect of different ligands on the flux of diffusion of copper through
Cerasome 9005 membrane in modified Franz cell from 8-24hrs at pH 7.0...51
Figure 4.4: Influence of ligands to the permeability of copper complexes
through Cerasome 9005 membrane at pH 7.00.............................................52
Page 15
xv
Figure 4.5: Logarithm of partition coefficient (-Log Ko/w) in 1-octanol/water
mixtures of copper with different ligands.....................................................53
Figure 4.6: Logarithm of permeability coefficient (-Log Kp) plotted against molecular
weight (MW) of 7 copper complexes............................................................57
Figure 4.7: Logarithm of permeability coefficient Log Kp plotted vs. logarithm
partition coefficient (Log Ko/w) of 7 copper complexes..................................58
Figure 4.8: Residuals plot of permeability coefficient (Log Kp) measured vs. Log Kp
predicted.........................................................................................................60
Page 16
xvi
List of Tables
Tables Page
Table 1.1 Non steroidal anti-inflammatory drugs….……………………………..……….5
Table 1.2 Disease modifying anti-rheumatic drugs……….………………….…………...6
Table 1.3 Copper concentrations in various biological fluids and daily
excretion in humans….……….……………………….........…………..…….10
Table 3.1 Ratio of different copper complexes……………………………………….....39
Table 3.2 AAS working conditions………………………………………………….......43
Table 4.1 Diffusion of Cu(II) in the presence of Alanine and Homopiperazine through
Cerasome 9005 membrane for 36hrs at pH 7.00...............................................47
Table 4.2 Concentration (ppm) of Cu(II) in receiver phase in the presence of different
ligands at pH 7.00 vs. time................................................................................48
Table 4.3 Enhancement factor of copper diffusion through Cerasome membrane by
ligands after 24 hrs............................................................................................50
Table 4.4 Flux of diffusion J (10-9
g/cm2s) and permeability
coefficient Kp (10-6
cm/s) of 8 copper complexes through
Cerasome 9005 membrane………………………….........................……..…..51
Table 4.5 Logarithm of partition coefficient - Log Ko/w (mean ± SD) of Cu(II) in the
presence of different ligands in octanol/water mixtures…………............…...53
Table 4.6 Copper speciation in the presence of different ligands at pH 7.0....................55
Table 4.7 Permeability Coefficient (Log Kp), Molecular Weight (MW) and % distribution
of Cu(II) in copper-ligands species for 7 Copper
complexes……………….…….....................................................................58
Table 4.8 Relationship between permeability coefficient Log Kp, partition coefficient
Log Ko/w and molecular weight (MW) of copper complexes……...............…59
Page 17
1
CHAPTER ONE
INTRODUCTION
Page 18
2
1.1 Inflammatory Disease
An inflammation is a protective response elicited by injury (or destruction of
tissues) and is characterised by increasing blood supply, activation of defence
mechanisms, pain (dolor), heat (calor), redness (rubor), swelling (tumour) and loss of
function (arthritis). The beginning of the tissue repair process is required to re-establish
normal function but if the inflammation persists, the result will be a lack of normal
function which is recognised as “chronic inflammation” (e.g. Rheumatoid Arthritis).
The inflammatory response can be provoked by physical, chemical and biological
agents, including exposure to excessive amounts of sunlight, x-rays and radioactive
materials, corrosive chemicals, extremes of heat and cold and infectious agents such as
bacteria, viruses and other pathogenic microorganisms.1
1.2 Rheumatoid Arthritis
The first written reference to arthritis sounds very similar to what is known now as
rheumatoid arthritis. In 123 AD, a text from India called Caraka Samhita describes a
disease where swollen, painful joints initially strike the hands and feet, then spread to the
body, causing loss of appetite, and occasionally fever. Year 1939 brought the first
autoimmune theory into the picture. Sr. McFarlane Burnet (head of Research Institute of
Melbourne, Australia) proposed that autoimmunity, the process by which the body's
defence system malfunctions and attacks its own tissues, causes many arthritis conditions.
This theory holds true today.2
Rheumatoid arthritis (RA) is therefore defined as a chronic inflammation,
systemic autoimmune disorder that causes the immune system to attack the joints, tissues
around joints and other organs in the body as well, where it causes inflammation
(arthritis) and destruction. The concept “arthritis” means joint disorder featuring by
inflammation (a basic way in which the body reacts to infection, irritation or other injury)
and Rheumatoid (from Rheumatic: pains caused by rheumatism which is any of several
pathological conditions of the muscles, tendons, joints, bones, or nerves, characterized by
discomfort and disability). It’s a progressive inflammatory disease that has the potential
to cause joint destruction, functional disability and can lead to substantial loss of
mobility. It has long been suspected that an infection, various bacteria and/or viruses
(antigen) may be the cause of the disease process but there is no evidence for this.3
Page 19
3
RA affects approximately 5% of the World’s population, with women being
affected two to three times more often than men. Its can occur at any age but is more
common between 40-60 years old. There’s no cure.4
1.3 Immune System Response
The immune system response is a normal and essential response of the body to a
harmful stimulus (antigen, bacteria…) characterized by painful inflammation of synovial
joints which along with angiogenesis leads to the formation of a tissue called the
“pannus”.4-7 The development of pannus causes erosion of cartilage and bone as shown in
Figure 1.1.
Figure 1.1 Normal and Arthritis joint8
The development of bone and cartilage erosion will be followed by swelling,
stiffness and loss of joint function (destruction of connective tissue). Progressive
degeneration of the joint appears as a result of unrestrained inflammation until the joint
becomes deformed9 as shown in Figure 1.2.
10
Figure 1.2.1
Early stage
Figure 1.2.2
Later stage
Figure 1.2.3
Chronic stage
Page 20
4
1.4 Treatment of Symptoms associated with RA
The medical approach to the treatment of any disease requires the removal of the
causal agent(s), interruption of pathological mechanism and alleviation of symptoms or
remission of disease. Since the cause of RA still unknown, the primary requirement is
not included in therapeutic strategy but the second and third requirements are included by
alleviation of symptoms through anti-inflammatory agents.4
The following are some of the most important agents currently used by most
rheumatologists according to a recent review by Sanz and Alboukrek.11
1. Non-Steroidal anti-inflammatory drugs (NSAIDs)
2. Disease modifying anti-rheumatic drugs (DMARDs)
3. Glucocorticoids.
1.4.1 NSAIDs
NSAIDs are the most commonly used because they are well tolerated by patients
and decrease the inflammation resulting from disease or injury. They include salicylates
such as aspirin (acetylsalicylic acid), the first commercially available NSAID introduced
into medicine by Frederick Bayer and Company in 1889.12
It is the most useful drug for
treating RA. If taken in high dosage it can suppress the inflammation1 but has a complex
dosing schedule and dangerous side effects (e.g. gastropathy, renal toxicity and renal
insufficiency) if overdoses are taken.12-13
There are also a series of non-salicylates which
are generally weak carboxylic or enolic acid derivatives.9 Ibuprofen and acetaminophen
are widely used for their ability to decrease inflammation and pain. NSAIDs have also
analgesic and antipyretic properties but cannot prevent progression of joint destruction or
organ damage.1
In 1971, J. R. Vane proposed the hypothesis that the anti-inflammatory effects of
NSAIDs were due to their ability to inhibit cyclooxygenese (COX) enzymes pathway of
prostaglandin (PG) synthesis.1 A mechanism was proposed by McCarthy D.J (1989) and
validated by Weismann M.H (1995) enouncing that: a variety of free radicals derived
from molecular oxygen, including superoxide, hydroxyl and perhydroxyl radicals are
involved in biosynthesis of prostaglandins and provoke cell injury. The NSAIDs may act
as free radical foragers (antioxidants) by preventing the activity of various facilitators of
inflammation such as bradykinins, prostaglandins and oxygen radicals.14-15
Page 21
5
Examples of NSAIDs are shown in Table 1.1 below.
Table 1.1 Non steroidal anti-inflammatory drugs 1
ACTION
Anti-inflammatory,
Analgesic,
Antipyretic
Anti-inflammatory,
Analgesic
Anti-inflammatory
Analgesic
Aspirin Diflunisal Choline-Mg-
Trisilicate
Fenoprofen
Salsate Azapropazone Piroxicam Isoxicam
Phenylbutazone Tolmetin Orgotein Etodolac
Indomethacin Fenbufen
Mefenamic acid Tiaprofenic
Diclofenac Meclofenamate
Sodium
Suprofen Flufenamic acid
Tenoxicam
Ibuprofen
Naproxen
Ketoprofen
Flurbiprofen
ACTION
Page 22
6
1.4.2 DMARDs
Diseases modifying anti-rheumatic drugs (DMARDs) are known to have some
effect on changing progression of RA. However, they are toxic and patients need to be
re-evaluated by their physicians. They are also slow-acting drugs and have been
classified as slow-acting anti-arthritis drugs (SAARDs). Therefore, they must be
administered over a long period of time (4 – 6 months) before a therapeutic benefit can be
achieved.1,9,15-19
Their dosage, assimilation, side effects and toxicity are given in Table
1.2
Table 1.2 Disease modifying anti-rheumatic drugs1
Drug
Dosage Assimilation Side effects Toxicity
Gold salt:
Sodium auriothio-
maleate
(Autm or Myochrysine)
Sodium aurothio-
sulphate
(Auts or Solganal)
50 mg.
1x Week
Injected into
muscles and
excreted in urine
and faeces
Skin rash,
proteinuria and
blood dyscrasia
Inhibit the oxida-
tive burst of
polymorpho-
nuclear leukocytes
(PMN) by about
30% at concen-
tration above
5µM.
Mild toxicity
include
stomatitis,
pruritis and
local rash.
Serious toxicity
include bone
marrow
suppression,
thrombocyto-
penia and
leucopoenia
Penicillamine 125 - 250
mg per day
Orally
administered,
well absorbed in the
stomach.
Low marrow,
cell count,
dermatitis,
nausea and
anaemia
Retinal toxicity
up to 60%
Page 23
7
Sulfasalazine Fatal conditions
Such as haemolytic
anaemia, aplastic
anaemia and
leucopoenia
Retinal toxicity
up to 20%
Gastrointesti-
nal intolerance
and musculo-
cutaneous
toxicity
Azathioprine 100mg/day
In 3 doses.
150mg/day
if response
is slow
Orally
Administered
And excreted in
Urine and faeces
Less toxic than
other
Immunosup-
pressive agents.
Anti-malarial:
Chloroquine and
Hydroxychloroquine
Adults:
200-250 mg
/day ChlQ.
400-600 mg
/day HChlQ
Children:
3mg/dayChlQ
5 mg/day
HChlQ
Orally
administered,
absorbed in the
stomach
and excreted in
the urine.
Visual
impairment
due to retinal
damage
Cutaneous (rash,
Change in pig-
mentation),
cramps,
abdominal
distension,
nausea and
diarrheal
There is also another series of drugs called “synthetic corticosteroids” which
occur naturally in the body and take part in many physiological chemical reactions. An
example of such drugs in relevance to RA is glucocorticosteroids.20
Page 24
8
1.4.3 Glucocorticosteroids
The glucocorticosteroids are considered to be potent, fast-acting anti-
inflammatory agents such as cortisone, prednisone and dexamethasone. They act to
reduce heat, swelling and tenderness at the inflamed joint and have proved to be the best
for combating inflammation. However, their mode of anti-inflammatory action is
unclear. They are neither antiviral nor antibacterial.1,9,21
The corticosteroids on the other side are not considered to have disease-remitting
potential, although this has been reported recently to protect against joint erosion but the
mode of action has not yet been determined.11
The glucocorticosteroids can be administered orally, intra-articularly or at peri-
articular sites of local inflammation and their side effects on patients can be dramatic
depending on dose and duration of use. Side effects on patients are gastritis, ulceration
and severe myopathy. Other complications including effect on bone, gastrointestinal
tract, glucose intolerance, increased susceptibility to infections and impaired wound
healing. It is also difficult to stop their use once patients have developed a steroid-
dependence.8,15-19,22-24
It was said previously that the treatment of disease requires: removal of the causal
agent(s), interruption of pathological mechanism and alleviation of symptoms or remission
of disease. Unfortunately none of the current drugs (NSAIDs, DMARDs and
glucocorticosteroids) have managed to treat the disease efficiently but they have tried to
interrupt the pathology mechanism, alleviate symptoms and stop the side effects:
Gastropathy, Renal toxicity and Renal insufficiency (NSAIDs)
Skin rash, proteinuria and blood dyscrasia (DMARDs)
Dermatitis, nausea, anaemia, aplastic anaemia and leucopoenia (DMARDs)
Cramps, abdominal distension and diarrhea (DMARDs)
Suppression of the pituitary-adrenal axis, gastritis, ulceration and severe
myopathy (glucocorticosteroids).
Gastrointestinal tract, glucose intolerance, increased susceptibility to
infections and impaired wound healing (glucocorticosteroids).
Page 25
9
This inefficiency of current drugs against arthritis has challenged scientists to
develop an anti-inflammatory drug having very few side effects. In 1960, Bonta showed
that copper compounds possess anti-inflammatory activities in animals with lower
toxicity and Sorenson confirmed this findings.1,9,25-27
Therefore, copper compounds have
been proposed for further research as potential anti-arthritic agents.
1.5 Motivation for study
1.5.1 Copper and Rheumatoid Arthritis
Copper occurs as the metal in oxidation states (0), (I), (II) and unstable (III).
Copper occurs as Cu(II) ion in aqueous solution.9
Copper is an essential trace element that acts as a cofactor for a variety of
enzymes by virtue of its ability to accept and donate electrons under physiologic
conditions.2 It is an essential component of the following enzymes;
4,9,28
1. The free radical scavenger- superoxide dismutase (SOD) – required for the
destruction of superoxide radicals.
2. Cytochrome c oxidase – involved in oxidative metabolism, brain functioning,
haem and phospholipids synthesis.
3. Tyrosine – for the synthesis of dihydroxyphenyl-alanine which is subsequently
transformed to melanin which is required for pigmentation.
4. Lysyl oxidase - required for connective tissue in the lungs and bones.
Copper is one of the most abundant metallic elements in the human body
following iron, calcium, potassium, magnesium and sodium. The body of a healthy male
(70 kg) contains 110 mg of copper, much as skeleton (46 mg), skeletal muscle (26 mg),
liver (10 mg), brain (8.8 mg) and blood (6 mg). The normal human body contains 80-120
mg of copper compared to Fe 4-5 mg and Zn 1.4-2.3 mg. Metabolic balance studies
show that people with daily intakes of 2-5 mg of copper absorb 0.6 - 1.6 mg (32%).9
Page 26
10
The richest dietary sources of copper are animal liver, crustacean, shell fish, dried
fruits, nuts and chocolate. Dietary copper is generally absorbed in the stomach and small
intestine, from where it is transported to the liver by the blood as a serum albumin
complex. It is in the liver that copper is processed and stored as a metallothionein
complex or converted into ceuroplasmin which is released into the blood to meet normal
metabolic needs.7,9,29
Table 1.3 shows normal human copper concentrations in various biological media
and daily excretion levels.30
Table 1.3 Copper concentrations in various biological fluids and daily excretion
in humans31
Tissue Humans Daily excretion (μg)
Whole body 800 - 1300 μg L-1
Serum/plasma 800 - 1750 μg L-1
Urine 12 - 80 μg L-1
30 – 70
Bile 4.0 μg L-1
2500
Duodenal fluid 0.17 μg L-1
400 – 2200
Synovial fluid 0.2 – 0.5 μg L-1
Most of the ingested copper is excreted via the bile, the major excretory route,
thus preventing tissue toxicity. Trace amounts of copper are excreted via urine except in
cases of copper overload. Excess copper in the tissue leads to the production of
damaging free radicals and subsequent DNA cleavage.28
In blood plasma, at least 90% of copper is irreversibly bound to ceruloplasmin in
a non-exchangeable form, while about 10% is reversibly bound to serum albumin and
less than 1% is distributed amongst low molecular weight (l.m.w) complexes,
predominantly [Cu(histidinate)(cystinate)] as the exchangeable copper fraction in the
blood.31-32
Serum albumin (SA) has been considered to facilitate the transport of trace metals
between tissues and blood and it is a major metal binding protein in the body, with about
40 μg of copper able to bind to the albumin contained in 1ml of human plasma. Albumin
appears to be the primary copper carrier protein in the body.33-34
Page 27
11
The proposed structure of major Cu(II) binding site in HSA is shown in Figure
1.3. The metal ion is bound to the α-NH2 nitrogen, two peptide nitrogens and the
imidazole nitrogen of the N-terminal Asp-Ala-His residue.35
Figure 1.3 Copper binding sites in Human Serum Albumin (HSA).
It has been observed that serum levels of copper are significantly increased during
acute phases of RA inflammation, returning to normal with remission. This rise in
serum copper is due to an increase in ceruloplasmin concentration and represents a
physiological response to inflammation. It has however been shown that ceruloplasmin
is a powerful antioxidant and could thus provide protection against cellular destruction,
which may be the reason for its increased synthesis. This would however bring about
decrease in the concentration of serum albumin copper, as well as of the labile low
molecular weight copper complexes.9
The mechanism of development of Rheumatoid Arthritis disease can be summarized
by the following Figure 1.4.
Figure 1.4 Biochemical mechanism of Rheumatoid Arthritis
Inflammation
associated with
RA
Increase of
Serum levels of
copper in the
blood
Increase of concentration in
ceruloplasmin: protein which
binds copper irreversibly
Decrease in the concentration
of serum albumin copper and
low molecular weight copper
complexes
Page 28
12
Therefore, two ways have been proposed by which copper concentration can be
adjusted; either from serum albumin by direct complexation using a powerful ligand or
from ceruloplasmin using destructive chelators (e.g. penicillamine).
1.5.2 The Anti-inflammatory role of copper
Historically copper has been used therapeutically for over 300 years, and the
copper bracelet specifically has long been used as a folk remedy for the treatment of
arthritis. Cupriphores from sweat solubilises and promotes copper dermal absorption into
the blood stream.36-37
Sorenson25
and Jackson et al.32-33
have shown that Cu(II) complexes are effective
in reducing the inflammation associated with RA, enhancing bio-availability of copper
and reducing their toxicity.38-39
The beneficial role of copper in minimizing inflammation has been attributed to
its redox activity, particularly the ability of copper in such enzymes as SOD to remove the
highly pro-inflammatory superoxide radical anion O2-. The superoxide radical O2
- has
been implicated in the promotion of arthritis due to its ability to degrade hyaluronic acid
(HA) which is an important component of the synovial fluid maintaining internal joint
connection by acting as lubricant.9
The dismutation of O2- by copper in SOD is summarized as follows;
Cu(II) + O2- Cu(I) + O2 (1.1)
Cu(I) + O2- + 2H
+ Cu(II) + H2O2 (1.2)
Net: 2O2- + 2H
+ H2O2 + O2 (1.3)
Equations 1.1, 1.2 and 1.3 explain the antioxidant role of copper in SOD by
reducing the radical O2- to hydrogen peroxide (H2O2) which in cells will be converted to
water by the enzymes catalase (CAT) and glutathione-peroxidase (GSSH).40
Page 29
13
1.6 Aims and Objectives of the research
Cu(II) complexes can be administered orally or by intravenous injection. Although
these two methods are easy drug administration routes injection is painful and orally the
complex would have to tolerate the harsh conditions in the stomach. Therefore, dermal
absorption is proposed as the best route of administration because it is slow (no acute
response), tolerable and painless. However, the efficacy of this route depends on the
ability of the drug to pass through the skin.9
The aim of this study then was to investigate
the effect of different ligands on the dermal absorption of copper. This was done using
the following steps:
Selecting model systems whereby the permeability of copper can be studied, either by
an artificial or biological membrane.
Building and testing an appropriate apparatus to measure dermal flux (Franz Cell).
Selecting a membrane.
Measuring passive transport through the membrane as a function of time.
Calculating permeability coefficient.
Measuring octanol/water partition coefficient.
Studying correlation between permeability coefficient and partition coefficient.
Page 30
14
References
1. N. P. V. Nama, (2003), MSc Thesis, University of Cape Town.
2. http://arthritisinsight.com/medical/disease/ra/history.html (accessed: 10-07-2008)
3. H.R.J. Schumacher, (1993), Arthritis Foundation, 10th
ed., Atlanta. Georgia.
4. A. Voye, (1993), PhD Thesis, University of Cape Town.
5. M. Feldman, F.M. Brennan, R.N. Maini, (1996), Cell, 85, 307-310.
6. A.E. Koch, (1998), Arthritis Rheumatoid, 41, 951-962.
7. S. Odisitse, (2006), PhD Thesis, University of Cape Town.
8. http://www.brighthub.com/health/arthritis/articles/84262.aspx?image=105492
(accessed: 17-07-2008)
9. J.N. Zvimba, (2005), PhD Thesis, University of Cape Town.
10. http://www.disabled-world.com/health/autoimmunediseases/arthritis (accessed: 24-
07-2008)
11. I. Sanz, D. Alboukrek, (1991) In: Rheumatoid Arthritis. M. Fischbach (ed.), Churchil
Livingstone, New York Edinburgh.
12. L.S. Goodman, A. Gilman, (1975), The Pharmacological Basis of Therapeutics,
McMillan, New York, 5th
ed, 1704.
13. T. H. Nomkoko, (2002), PhD Thesis, University of Cape Town.
14. D.J. McCarthy, (1989), Arthritis and Allied conditions, a text book of Rheumatology,
11th
ed., 507,622.
15. M.H. Weismann, M.E. Weinblatt, (1995), Treatment of the Rheumatic Diseases,
Companion to the Textbook of Rheumatology, W.B. Saunders Company, USA, 31-
51.
16. M.A. Quinn, P.G. Conaghan, P. Emery, (2001), Rheumatology, 40, 1211.
Page 31
15
17. RF Laan , TL Jansen , PL van Riel (1999), Rheumatology (Oxford), 38, 6-12.
18. J.J. Canoso, (1997), Rheumatology in Primary Care, 52, S4-12.
19. J.R. O’Dell, K.W. Blakely, J.A. Mallek, P. James-Eckhoff, R.D. Leff, S.J. Wees,
K.M. Sems, A.M. Fernandez, W.R. Palmer, L.W. Klassen, G.A. Paulsen, C.E. Haire,
G.F. Moore, (2001), Arthritis Rheumatoid, 44, 2235-2241.
20. Y. Motozato, T. Nishihara, C. Hirayama, Y. Furuya, Y. Kosugi, (1982), Canadian
Journal of Chemistry, 60, 1959 -1961.
21. C.M. Pearson, (1975), Immunosuppressive Drugs in Clinics in Rheumatic Diseases, 1,
2, 225-243.
22. J. Garcia, R.D. Altman, (1997), Semi Arthritis Rheumatoid, 27, 1-16.
23. D.L. Conn, (2001), Arthritis Care Res., 45, 462 - 467.
24. K.G. Saag, (2001), Arthritis Care Res., 45, 468 - 471.
25. J. Sorenson, (1976), Journal of Medicinal Chemistry, 19, 135 - 148.
26. RJ Gryglewski, (1997), Agents Actions Suppl, 3, 17 - 23.
27. A. Omoto, Y. Kawahito, I. Prudovsky, Y. Tubouchi, M. Kimura, H. Ishino, M. Wada,
M. Yoshinda, M. Kohno, R. Yoshimura, T. Yoshikawa, H. Sano, (2005), Arthritis
Res. Ther., 7, 1174 – 1182.
28. D.W. Cox, (1999), British Medical Bulletin, 55,544-555.
29. H.T. Delves, (1980), Biological role of copper, Ciba Foundation Symposium 79,
Excerpta Medical, Amsterdam, 23 - 48.
30. J.E. Weder, C.T. Dillon, T.W. Hambley, B.J. Kennedy, P.A. Lay, J.R. Biffin, H.L.
Regtop, N.M. Davies, (2002), Coordination Chemistry Reviews, 232, 105-107.
31. M.C. Linder, M. Hazegh-Azam, (1996), American Journal of Clinical Nutrition, 63, S
797-S811.
32. G. E. Jackson, P.M. May, D.R. Williams, (1978), Journal of Inorganic and Nuclear
Chemistry, 40, 1227-1234.
Page 32
16
33. G.E. Jackson, J.N. Zvimba, (2007), Journal of Inorganic Biochemistry, 101, 148-158.
34. T.P.A. Kruck, B.Sarkar, (1975), Inorganic Chemistry, 14, 2383 - 2388.
35. P.Gizzi, B. Henry, P.Rubini, S. Giroux, E. Wenger, Journal Inorganic Biochemistry,
(2005), 99, 1182-1192.
36. W.R. Walker, D.M. Keats, (1976), Agents Action, 6, 454 - 459.
37. M. Pasqualicchio, R. Gasperini, G. P. Velo, M. E. Davies, (1996), Mediators of
Inflammation, 5, 95 - 99.
38. W.R. Walker, R.P. Reeves, (1977), Bioinorganic. Chemistry, 7, 271-276.
39. J.E. Trevor, T.W. Hambley, B.J. Kennedy, (1999), Inorganic Chemistry, 38, 1736 -
1744.
40. O.I. Aruoma, (1998), Journal of the American Oil Chemist's Society, 75, 199-212.
Page 33
17
CHAPTER TWO
TISSUE PERMEABILITY OF COPPER COMPLEXES
Page 34
18
2.1 Dermal Absorption study
2.1.1 Skin1-4
The skin is the outermost tissue and the largest organ of the body. Its major
function is to act as a barrier to the exterior environment (bacteria, harmful chemicals,
ultraviolet light and temperature). It also prevents water loss and regulates body
temperature.
The skin is essentially composed of three layers: epidermis, dermis and hypodermis
(or Subcutis) as shown in Figure 2.1.
Figure 2.1 Diagram of skin layers5
The epidermis contains 5 layers named respectively from top to bottom: stratum
corneum, stratum licidum, stratum granulosum, stratum spinosum and stratum basale as
shown in Figure 2.2
Figure 2.2 Diagram of Epidermis layers6
Page 35
19
The stratum corneum (in Latin "stratum" = "layer" and "corneum" = "horny" so
stratum corneum = horny layer) is essentially composed of 15 to 20 cells layers thick
(keratin, protein), water and intercellular lipids as shown in Figure 2.3:
Figure 2.3 Diagram of Stratum corneum7
The lipids consist of neutral lipids (60-80%) and sphingolipids (15-35%). The
neutral lipids are composed of free sterols, free fatty acids, triglycerides, n-alkanes of C19 to
C34 and squalene. Sphingolipids are composed of 80% ceramides and 20% of
glycosphingolipids. The presence of an important mass of lipids gives the stratum corneum
its lipophilic nature. This top layer of the skin is extremely important for the skin barrier
function.
In terms of the passage of chemicals through skin, the stratum corneum is
essentially a lipidic layer, which interfaces with an aqueous medium beneath it. The
transport of lipophilic chemicals is through the stratum corneum, and as these compounds
must transfer directly into an aqueous medium, a highly lipophilic compound will remain
in the stratum corneum.8
Thus, for the development of QSARs (Quantitative structure-activity relationships),
descriptors of hydrophobicity are likely to be highly influential. However, descriptors for
molecular size and hydrogen bonding (which may describe non-covalent interactions with
skin proteins) may affect its passage through stratum corneum.9
Page 36
20
2.1.2 Selection of model system for permeability study
The in vitro study of copper(II) absorption through the skin is generally studied by
measuring passive transport through, either a biological membrane or an artificial
membrane. An excellent membrane selected for permeability studies must allow the
diffusion of the metal, be obtained and conserved easily, not limited to species (age, sex,
weight, colour, size…) and give results close to the reality of diffusion through human
skin
Two types of membranes have been studied, biological and artificial membranes.
2.1.2.1 Biological membrane10-15
Samples of biological membranes are generally obtained from human or animal
skins and are characterised by age, sex, site targeted and origin. They are stored in a
freezer or frozen in liquid nitrogen.
The tape-stripping technique of human stratum corneum is widely used as
method for studying the kinetics and penetration depth of drugs. Its consists of stripping
off most of the horny layer (corneocytes) of stratum corneum from adhesive tape.14
Note that hairs and all fatty material must be removed before skin extraction and after
being frozen, the skin membrane must be thawed at room temperature before the
experiment.
2.1.2.2 Artificial membrane
A variety of polymers have been selected as artificial membrane such as poly
(dimethylsiloxane) PDMS, liposome (modelled stratum corneum) which is composed of
horny layer lipids (liquid crystalline system), silastic (silicone), phospholipids and
hydrophobic filter material (phosphatidylcholine in dodecane) coupled with
phospholipids.16-18
Page 37
21
2.1.2.3 Difference between model membranes
A biological membrane is dependent on the time they were obtained, the
conditions of conservation and treatment. The age, sex and weight have to be specified
for a biological membrane. These considerations are necessary for artificial membranes.
2.1.2.4 Selection of model membrane
Because of the reasons above, an artificial membrane was selected for the
permeability study.
The artificial membrane used in this study was “Cerasome 9005”. This
membrane is a lipid solution which mimics human stratum corneum. Cerasome 9005
was purchased from Germany (Lipoid GmbH, Frigenstr.4, D-67065 Ludwigshafen, 2008)
and possess the following characteristics: Consistency (aqueous, transparent to opaque
dispersion), colour (off-white), solid matter (10%), Phosphorus (0.11%), pH (7.1) and
mean particle size (200 nm).
2.1.3 Diffusion
A drug can across a membrane either by passive or active diffusion. Passive
diffusion occurs from a region of high concentration to a region of low concentration and
does not require an external energy source while active diffusion occurs from a region of
low concentration to a region of high concentration and requires energy and a
biochemical carrier to ferry the drug across the membrane.
For passive molecular diffusion, Fick’s law of diffusion states that; the amount of
material (M) flowing through a unit cross-section (S) of a barrier in unit time (t), is
known as the flux (J) and can be described by the following equation19-20
:
dtS
dMJ
. (1)
J= flux in g/cm2s; S= cross section of barrier in cm
2; dM/dt = rate of diffusion in g/s; (M=
mass in g; t = time in sec)
The flux is also proportional to the concentration gradient dC/dx, which is
described in Equation 2:
Page 38
22
dX
dCDJ (2)
D=diffusion coefficient of a drug in cm2/s; C=concentration of drug in g/cm
3;
X =distance in centimetres of movement perpendicular to the surface of the barrier.
The diffusion coefficient D is a physical property of the drug molecule which is
dependent on temperature, pressure, solvent properties, and chemical nature of the
diffusant (drug).
The theoretical relation existing between the flow of diffusion (J), the
permeability coefficient (Kp) and the partition coefficient (Ko/w) can be demonstrated
from Fick’s law giving the flow of diffusion of a solute through a membrane:
C i
'
C i
''
0 J > 0 h x
dX
dCDJ m (3)
This equation can be integrated (considering the membrane as a thin and homogeneous
layer):
mdCDdXJ
CC mmh
DJ
"' (4)
As the relation between the concentrations of solute in membrane (Cm) and in aqueous
solution (Ci) is given by the equation:
Cm = Ko/w Ci (5)
Cm
'
Cm
"
Donor solution Membrane Acceptor solution
Page 39
23
Assuming that the partition equilibrium of the complexes at each membrane interface is
faster that its diffusion through the membrane (that means K’ow = K”ow= Ko/w):
CCCC iiowmmK
h
D
h
DJ
"'"' (6)
Where
h
DKK
ow
p (7)
Then,
CC iipKJ"'
(8)
Considering the initial concentration only, the relation between permeability coefficient
(Kp, cm/s) and steady-state flux is given by the equation:
C i
p
JK
' (9)
Whereby C i
' is the initial permeate concentration in donor solution of drug and J is its
mass passing through a unit area S of the membrane in unit time t.
2.1.4 Partition Coefficient
Partition coefficient is a measures hydrophobicity of a compound. The measure
of hydrophobicity can be expressed as the logarithm of partition coefficient between 1-
octanol and an aqueous phase.21-22, 27
For Cu(II)-complex, this may be given as;
Log Poct/wat.= Log (10)
[Cu2+]wat
Where [Cu2+]org and [Cu2+
]wat represent respectively the total concentrations of Cu(II) in
1-octanol and aqueous phases.
[Cu2+]oct.
Page 40
24
2.2 Method and Equipment
Amongst the most widely used methods for studying in vitro permeation are the
Franz diffusion cell and PAMPA method.
2.2.1 Franz Diffusion Cells
The Franz diffusion cell is the common method used in permeation study. It is
based on vertical diffusion between donor and acceptor phase. The following figure
(Figure 2.4) shows a typical Franz diffusion cell.23
Figure 2.4 Normal Franz cell apparatus
A = donor compartment; B = acceptor compartment; C = membrane; D = O-ring;
E = water jacket; F = stirring bar; G = sampling port.
Note that the membrane is generally mounted between the cell compartments; an O-ring
is used to position and seal the membrane and the clamp serves to hold together the two
cell compartments. The receiver phase is thermostated at 37°C by circulating water
through an external water jacket and the diffusion is done vertically under the influence
of gravity.
A. Advantages
Industry standard, acceptor phase can be stirred and thermostated.
Can use artificial or natural membranes and is reusable.
B. Disadvantages
Much larger so need more sample and only one sample at a time.
Page 41
25
2.2.2 Parallel Artificial Membrane Permeability Assay (PAMPA)
The Parallel Artificial Membrane Permeability Assay (PAMPA) is a rapid
technique for studying many compounds at once.24
The method consists of a 96-well filter plate placed in a receiver plate (used as
permeation acceptor) and pre-coated with a lipid membrane (used as permeation donor).
The two wells are coupled together, incubated for 5 hours at room temperature,
separated afterwards and the concentrations of compounds from both compartments
measured. Figure 2.5 shows an example of PAMPA apparatus25
:
Figure 2.5 Parallel Artificial Membrane Permeability Assay apparatus
A. Advantages
Fast, 96 samples concentrated at a time, can use lipid as artificial membrane.
Small, can use small amounts of sample, cheap and dispensable equipment.
B. Disadvantages
Cannot stir receiver phase and cannot thermostat only one phase.
Cannot use biomembranes.
2.2.3 Choice of Method and Equipment
After analysing both methods the Franz diffusion cell was chosen because it is
cheap and 17 compounds were planned to be analysed in this study. Also the solution
needed for AAS analysis meant that a larger receiver phase was needed. However, the
method is still slow and only one compound or concentration could be studied at a time.
Page 42
26
2.2.4 Modified Franz Diffusion Cell
One of the problems with the Franz cell is that it is difficult to make, however it is
commercially available. Also because of the vertical arrangement, care has to be taken
so as not to trap air between the two phases. For this reason a modified Franz diffusion
cell was designed and built.
Again to simplify construction the water jacket around the receiving vessel was
eliminated. The horizontal design meant that assembly was easy and no air pockets
formed. It was also possible to stir both cells. The whole system could be thermostated
in a temperature controlled environment, but it was not possible to thermostat only the
receiver phase.
Figure 2.6 below shows details of the modified Franz diffusion cell made in our
laboratory.
Figure 2.6 Modified Franz cell apparatus
The modified Franz diffusion cell is based on Pascal's law or the Principle of
transmission of fluid-pressure which states that "pressure exerted anywhere in a confined
fluid is transmitted equally in all directions throughout the fluid.26
∆P = φ g (∆ h) (11)
Where:
Page 43
27
ΔP is the hydrostatic pressure given in Pascal in the International System of Units (SI
system), or the difference in pressure at two points within a fluid column, due to the
weight of the fluid;
φ is the fluid density (in kilograms per cubic meter in the SI system);
g is acceleration due to gravity (normally using the sea level acceleration due to Earth's
gravity in meters per second squared);
Δh is the height of fluid above the point of measurement, or the difference in elevation
between the two points within the fluid column (in meters in SI).
In addition to Pascal’s law,
∆P donor = ∆Preceptor, means ∆h donor = ∆h receptor (12)
Note that the difference of height between acceptor and donor phase will affect the
“Steady state of diffusion”. Therefore, it’s recommended to keep the level on the two
cylinders constant.
2.3 Selection of Ligands for permeability study
2.3.1 Introduction
A series of anti-inflammatory drugs found on the market, some common ligands
and synthetic ligands have been studied which are listed as follows:
- Anti-inflammatory drugs: diclofenac sodium salt, propionic acid, acetylsalicylic
acid and salicylic acid.
- Some common ligands: ethylenediaminetetraacetate (EDTA), glycine and alanine
(Amino-acids), diethylenetriaminepentaacetic acid (DTPA) and homopiperazine.
- Synthetic ligands: N,N’-di(aminoethylene)-2,6-pyridine-dicarbonylamine (PrDH),
1,15-bis(N,N-dimethyl)-5,11-dioxo-8-(N-benzyl)-1,4,8,12,15-pentaazapentadecane
(BIDPAP), N,N’-bis[2-(2-pyridyl)-methyl]pyridine-2,6-dicarboxamide (PrDPr),
N1-(2-aminoethyl)-N
2-(pyridin-2-ylmethyl) ethane-1,2-diamine [555-N], N-[2-(2-
aminoethylamino)ethyl]picolinamide [H(555)-N], N,N’-[2,2’-azanediylbis(ethane-
2,1-dyil)]dipicolinamide [H2(555)-N], N,N’-bis[amino ethyl] propanediamide
(6UH) and N,N’-bis[2-(dimethylamino)ethyl] propanediamide (DMDM).
Page 44
28
2.3.2 Complexation of ligands with Copper at pH 7.00
The selection was based on complexation of ligands with Cu(II) at pH 7.00.
Several ligands were rejected after screening because the copper precipitated as Cu(OH)2
after their pH was adjusted to 7.00. These ligands were too weak to keep the copper in
solution.
From all previous compounds cited above, only eight compounds did not form a
precipitate, so they were selected. The ligands which were selected and studied in dermal
absorption are presented as follows:
1. Ethylenediaminetetraacetate (EDTA)
2. Glycine and alanine
3. Diethylenetriaminepentaacetic acid (DTPA)
4. Homopiperazine (Homop)
5. N,N’-di(aminoethylene)-2,6-pyridine-dicarbonylamine (PrDH)
6. N-[2-(2-aminoethylamino) ethyl] picolinamide [H(555)-N]
7. N,N’-bis[aminoethyl] propanediamide (6UH).
2.3.3 ESTA (Equilibrium Simulation for Titration Analysis) software
The program ESTA calculates the distribution of species present in an equilibrium
system as a function of the pH of the solution.27
ESTA software requires:
- Stability Constant or formation constant βpqr: constant for the formation of a
complex from reagents at specific temperature and ionic strength. Refers to the
equilibrium below, where p, q and r are the stoichiometric coefficients of the
components in the complex
pM + qL + rH MpLqHr (13)
βpqr = (14)
- Ratio or concentrations of metal and ligand.
- The temperature and ionic strength are generally fixed.
[MpLqHr]
[M]p[L]
q[H]
r
Page 45
29
The distributions of copper complexes were determined in the pH range 2-11 by
using the ESTA library of computer speciation programs at 298K and an ionic strength of
0.15M (NaCl). Figure 2.7 shows speciation curves for the ligands studied in the pH
range 2-12.
0
10
20
30
40
50
60
70
80
90
100
2 4 6 8 10 12
Cu+2
MLML2
pH
%
D
I
s
t
r
I
b
u
t
I
o
n
0
10
20
30
40
50
60
70
80
90
100
2 6 10 14
Cu+2
MLH-1
ML
pH
%
D
i
s
t
r
I
b
u
t
I
o
n
0
10
20
30
40
50
60
70
80
90
100
2 4 6 8 10 12
Cu+2
MLH
ML
MLH-1
MLH-2
pH
%
D
I
s
t
r
I
b
u
t
I
o
n
0
20
40
60
80
100
3 8
ML
pH
%
D
I
s
t
r
I
b
u
t
I
o
n
(b) % Distribution of H(555-N)-copper
system (1:2 ratio) as function of pH
(a) % Distribution of Glycine-copper system
(1:2 ratio) as function of pH
(c) % Distribution of PrDH-copper system
(1:1 ratio) as function of pH
(d) % Distribution of EDTA-copper system
(1:2 ratio) as function of pH
Page 46
30
0
10
20
30
40
50
60
70
80
90
100
1 3 5 7 9 11 13
MLMHL
MH2L
M2L
pH
%
D
I
s
t
r
I
b
u
t
I
o
n
Figures 2.7 shows that calculated speciation of Cu(II)-glycine (a), Cu(II)-H(555-
N) (b), Cu(II)-PrDH (c), Cu(II)-EDTA (d), Cu(II)-DTPA (e), Cu(II)-Homop (f), Cu(II)-
(6UH) (g) and Cu(II)-Alan.(h) systems as a function of pH. The normal convention of
MpLqHr has been used to indicate the stoichiometry of the different species. Water of
coordination is not specified.
0
10
20
30
40
50
60
70
80
90
100
3 5 7 9 11 13
Cu +2 ML ML2
MLH-1
pH
% D i s t r i b u t i o n
(e) % Distribution of DTPA-copper system
(1:1 ratio) as function of pH
(f) % Distribution of Homop.-copper system
(1:2 ratio) as function of pH
(g) % Distribution of 6UH.-copper system
(1:2 ratio) as function of pH
(h) % Distribution of Alan.-copper system
(1:2 ratio) as function of pH
Page 47
31
2.4 Determination of Copper concentration
2.4.1 Atomic Absorption Spectroscopy28-29
2.4.1.1 Introduction
Spectroscopy is considered to have started in 1666, with Newton’s discovery of
the solar spectrum. Wollaston repeated Newton’s experiment in 1802 and reported that
the Sun’s spectrum was intersected by a number of dark lines. Fraunhofer investigated
these lines and in 1823 was able to measure their wavelengths. Kirchhoff (1859) and
Fraunhofer were observing Atomic Absorption and Emission.
Atomic Absorption Spectroscopy (AAS) is the term used when the radiation
absorbed by atoms is measured. The application of AAS to analytical problems was
delayed because of the apparent need for very high resolution to make quantitative
measurements. In 1953, Walsh overcame the obstacle by use of a line source which was
pursued further and published by Alkemade in 1955.
Atomic Absorption Spectroscopy is summarized diagrammatically in Figure 2.8.
AAS Absorption radiation
νjo=
Figure 2.8 Atomic Absorption radiation diagram
Where;
- The horizontal lines represent different energy levels in an atom
- Eo is the term used for lowest energy level (ground state)
- Ej represents greater energy (higher) than Eo
- A solid vertical line refers to a transition involving the absorption of energy as
radiation.
The energy of the radiation absorbed or emitted is quantized according to
Planck’s equation (equation 15),
E = hν (15)
Ej – Eo
h
Page 48
32
Where;
- h is Plank’s constant
- ν is the frequency of the radiation
- E is the energy difference between the two energy levels in the atom.
The frequency is related to wavelength by following formula,
λ = C/ν (16)
Where, λ is the wavelength and C as speed of light.
2.4.1.2 Principles and Instruments
AAS is a technique for determining the concentration of a particular metal
element in a sample. Based on Beer-Lambert law of absorption of UV or visible light by
gaseous atoms which states that the absorbance “A” is equal to the logarithm of the
intensity of the incident light (Io) over the intensity of the transmitted light(It) or is
proportional to the thickness “l” through which the light is transmitted and to the
concentration “c” of the absorbing substance. It’s expressed by following equation 17
lckI
ILogA
t
o .. (17)
Where, A is the absorbance
Io is the incident light and It the transmitted light
k is the absorption coefficient or molar absorptive (quantity of light absorbs by 1cm of a
1 molar solution).
l is the thickness or path length measured generally in centimetre.
c is the concentration of the substance or element (metal).
Atomic Absorption Spectroscopy operates with following steps:
- The liquid sample is evaporated and atomized by injection into a flame
- Atomization of atoms in Flames: the emission spectrum of the element under study
produced in the light source is passed through an “absorption cell”. The important
function of this absorption cell is to produce metal atoms in the ground state from the
ions or molecules present in the sample.
Page 49
33
- This is the most difficult and critical process within the whole AA procedure, the
success or failure of an analysis is virtually dependent upon the effectiveness of the
atomization.
- The Hollow-cathode lamp (HCL) considered as source of light is used to determine
the contained element, provide the analytical light line for the element of interest and a
constant yet intense beam of the analytical line.
- The nebulizer sprays the sample into the flame and sucks up liquid sample at a
controlled rate, create a fine aerosol for introduction into the flame and mix of aerosol,
fuel (acetylene) and oxidant (compress air) thoroughly for introduction into flame.
- The Monochromator isolates analytical lines, photons passing through the flame and
removes scattered light of other wavelength from the flame. In doing this, only a
narrow spectral line impinges on the PMT.
- Photomultiplier tube (PMT) as a detector, PMT determines the intensity of the
analytical line exiting the monochromator.
- Detection Limit is defined generally as the smallest concentration (in µg/l) or amount
(in g) of the element to be determined that can be detected with 95% probability.
2.4.2 Linear Regression Analysis30
The aim of Linear Regression Analysis is to compare a linear equation of
absorbance in terms of concentration for a particular analyst with the known reference
equation.
2.4.2.1 Analysis aspects for linear calibration
It aims to determine the calibration curve and check its statistical significance
with such required to be significant (p ‹ 0.05) though highly significant (p ‹ 0.01) is
preferred.
2.4.2.2 Estimation of unknown concentration X
By re-expressing the fitted linear equation or calibration line Y= a + bx, the
unknown X value can be estimated as
X =(Y – a)/b (18)
Page 50
34
Where Y is the average of all absorbance (Y) in calibration and X is the unknown
concentration.
An estimate of the error associated with the predicted X value is called Standard
Error SE(X) and given by:
SE(X)= Sy/x √1/m + 1/n + (Y – Y) (19)
b b2 Sxx
Where;
Sy/x is the regression standard deviation
m is the number of replicate response measurements made on the unknown test material
or number of readings
n is the number of data pairs in the calibration experiment
Y is the mean of the experimental responses.
Y is the average of all absorbance (Y) in calibration
Sxx is the correct sum of squares for X from equation 18
a is the intercept
b is the least squares estimate of (slope parameter) and it’s given by equation 20
n
i
i
n
i
i
n
i
ii yxyx111
n
b = = (20)
2)^()^2(11
n
i
i
n
i
i xx
n
n
i
i
n
i
i xby11
a = (21)
n
Sxy
Sxx
Page 51
35
2.4.2.3 Uncertainty in Measurement: Standard Deviation31
The broad aims of performing measurements in science are to increase our
knowledge about some physical quantity, which is referred to as the measurand. We
indicate this incomplete state of knowledge of measurand by a quantity known as the
uncertainty. A measurement result in science is meaningless without a quantitative
statement of the uncertainty associated with it.
One of the goals of measurement is to minimise the uncertainty associated with
the measurand, this can be achieved by good experimental design as well as by collecting
as much data as possible. Many books use the term “error” but there’s a big difference
between “error” and “uncertainty.”
Error is an idealized concept that denotes the difference between the measured
value and “a true value” of that quantity. Since the “true value” is never known, neither
is the error. Uncertainty on the other hand is a well-defined term that can be calculated
meaningfully.
The uncertainty associated with the spread in repeated measurements is referred
to as the standard deviation of the mean, S, and is calculated using the equation 22
below:
S = 1
2
N
d i (22)
Where Σ means “the sum of”
Xi = a particular value of the measurement
X = the mean value
di = Xi – X
N = the number of the measurements.
Therefore, the final answer will be given by equation 23 below:
X ± S (23)
Page 52
36
References
1. T. Igarashi, K. Nishino, S. K. Nayar, (2005), Technical Report CUCS-024-05,
Department of Computer Science, Columbia University, NY, USA, 10027.
2. A.V. Rawlings, (2004), Dermatologic Therapy, 17, 43-48.
3. M.A. Lampe, A.L. Burlingame, J. Whitney, M.L. Williams, B.E. Brown, E. Roitman,
P.M. Elias, (1983), Journal of Lipid Research, 24, 120-130.
4. J.A. Bouwstra, P.L. Honeywell-Nguyen, G.S. Gooris, M. Ponec, (2003), Progress in
Lipid Research, 42, 1-36.
5. http://www.nlm.nih.gov/medlineplus/ency/imagepages/8912.htm(accessed:20-08-
2008)
6. http://commons.wikimedia.org/wiki/File:Skinlayers.png (accessed:20-08-2008)
7. http://www.netwellness.org/healthtopics/skincare/introduction.cfm(accessed:27-08-
2008)
8. R.L. Bronaugh, H.I. Maibach, (1985), Journal of Investigative Dermatology, 84, 180-
183.
9. G.P. Moss, J.C. Dearden, H. Patel, M.T.D. Cronin, (2002), Toxicology in Vitro, 16,
299-317.
10. S.W. Frantz, B.W. Kemppainen, W.G. Reifenrath, (1990), Chemical Rubber
Company Press, Florida, 35-59.
11. K. Tojo, Y.W. Chien, (1987), Marcel Dekker, New York, 127-158.
12. B.W. Barry, (1983), Marcel Dekker, New York, 234-295.
13. G. Adami, F. Larese, M. Venier, P. Barbieri, F. Lo Coco, E. Reisenhofer, (2006),
Toxicology in Vitro, 20, 1321-1330.
14. R.G. van der Molen, F. Spies, J.M. van’t Noordende, E. Boelsma, A.M. Mommaas,
H.K. Koerten, (1997), Archives of Dermatological Research, 289, 514-518.
15. K. Tojo, C. Lee, (2001), A Method for Predicting Steady-state Rate of Skin
Penetration in Vivo, Rutgers University, College of Pharmacy, U.S.A.
Page 53
37
16. Y. Frum, G. M. Eccleston, V. M. Meidan, (2007), European Journal of Pharmaceutics
and Biopharmaceutics, 67, 434-439.
17. S. Huang, A. Yeo, S. D. Li, (2007), ASSAY and Drug Development Technologies, 5,
663-672.
18. E.W. Smith, J.M. Haigh, (1992), Acta Pharmaceutica Nordica, 4, 171-178.
19. L. Mazurowska, M. Mojski, (2007), Talanta, 72, 650-654.
20. www.uthsc.edu/pharmacy/pharmsci/faculty/MahatoNAPLEX05.PDF(accessed:22-
12-2008)
21. X.Q. Kong, D. Shea, W.A. Gebreyes, X. X. Rui, (2005), Analytical Chemistry, 77,
1275-1281.
22. A. Leo, C. Hansch, D. Elkins, (1971), Chemical Reviews, 71, 525–616.
23. K.R. Brain, V.J. James, K.A. Walters, (1993), Sales Taxes Support Publishing, 3b,
558-567.
24. M. Kansy, F. Senner, Gubernator, (1998), Journal of Medicinal Chemistry, 41, 1007-
1010.
25. X. K. Chen, A. Murawski, L. Hladik, C. L. Crespi, (2008), Pharmaceutical Research,
25, 1511-1520.
26. Bloomfield, Louis, J. Wiley & Sons, (2006), The Physics of Everyday Life (3rd
Ed.),
153.
27. S. Odisitse, (2006), PhD Thesis, University of Cape Town.
28. L. Ebdon, (1982), An Introduction to Atomic Absorption Spectroscopy, A self-
teaching approach, Heyden, London.
29. www.shsu.edu/chemistry/primers/AAS.html (accessed:11-12-2008)
30. W. P. Gardiner, (1997), Statistical analysis methods for chemists, The Royal Society
of Chemistry, 168-195.
31. Practical Manual, (2009), CEM 1000W, Appendix 1, Chemistry Department,
University of Cape Town.
Page 54
38
CHAPTER THREE
EXPERIMENTAL
Page 55
39
3.1 Preparation of Copper Complexes
10mM or 5mM of copper complexes were prepared from CuCl2.2H2O (purchased
from Merck) and the different ligand in MilliQ-water (MQ-water). The pH of the
solutions was adjusting to 7.00 using concentrated NaOH or HCl.
Different metal/ligand ratios were used depending on the ligand so as to avoid
formation of a precipitate. Table 3.1 lists the copper-ligand ratios used.
Table 3.1 Ratio of different Copper Complexes
Copper-Ligand Ratio (M:L)
Cu(II)-PrDH 1:1
Cu(II)-DTPA 1:1
Cu(II)-Glyc. 1:2
Cu(II)-H(555-N) 1:2
Cu(II)-EDTA 1:2
Cu(II)-6UH 1:2
Cu(II)-Homop. 1:2
Cu(II)-Alan. 1:2
Ligands PrDH, H(555-N) and 6UH were synthesized in our laboratory.1-3
Glycine
and EDTA were purchased from Merck. Alanine, DTPA and Homopiperazine were
purchased from SIGMA-ALDRICH.
3.2 Modified Franz Diffusion Cells
A modified Franz cells was designed based on a normal Franz cell.4 Three
modified Franz cells were made in which two had 50cm3 of volume cylinders and one
had 25cm3 cylinders on both sides.
Page 56
40
Figure 3.1 shows the apparatus used to study diffusion of copper complexes.
Figure 3.1 Modified Franz cells apparatus
Where;
1. Donor phase filled either with 25ml or 50ml of Copper complex
2. Acceptor phase filled with blank solution (MQ-water)
3. 0.0131g of artificial membrane.
4. Passive diffusion direction
5. Clamp
6. Stirrer bar
7. Magnetic Stirrer
8. Burette Stand with clamp.
The artificial membrane was made using filter paper (Macherey-Nagel) of 3.14
cm2 discs and thickness 0.12cm. The filter paper was submerged in a Cerasome 9005
lipid solution purchased from Lipoid GmbH (Germany), dried for a few minutes at room
temperature and then weighed. The amount of lipid absorbed was determined by mass
difference and was typically 0.0131g.
The experiments were performed at room temperature with samples being
collected at different times.
Note that PBS was not used to stabilize the pH as is normally done in biological
measurements. This is because it coordinates to the copper(II) and hence disturbs the
equilibrium being studied. Speciation calculation using ESTA and experiments using
buffers confirmed that this interference was taking place.
Page 57
41
1ml of aqueous phase
(Aq.Ph)
3.3 Partition Coefficient
The shake flask method was used to measure partition coefficients where the
organic phase was 1-octanol pre-saturated with water.5 Figure 3.2 shows the different
steps used to measure the partition coefficient of Cu(II).
Step1
40ml of 1-octanol
Add 10ml of copper complex,
shake for 5min and stand
Step2
Step3 A B
Add 7ml of HNO3 5%
shake and stand
Step4 A B
Aqueous phase ready
for copper measurement
by Atom. Absorption
Step5 Aq. Ph considered as
Org. Ph in copper measurement
ready for Atom. absorption
Figure 3.2 Process of measurement of partition coefficient of copper complex
Aq. Ph.
Org. Ph.
Aq. Ph
Aq. Ph
for AA
Org. Ph
for AA
Add HNO3 5%
38ml of organic
Phase (Org. Ph)
Waste of
Org. Ph
Page 58
42
Different steps present in Figure 3.2 are explained as follows: 40ml of 1-octanol,
pre-saturated with water, were mixed with 10 ml of the aqueous complex solution and
shaken for 5 min. After shaking, the bottle was allowed to stand for 5 min so that the two
layers could separate. 1 ml of the aqueous layer and 38 ml of the organic layer were
removed using micropipettes.
The aqueous layer was diluted to 10 ml using 5% v/v HNO3. The organic layer could not
be analysed directly using AAS and so the copper first had to be back extracted into an
aqueous phase. This was done using 7 ml of 5% v/v HNO3 solution. The concentrations
of copper in the two layers were then measured using AAS.
Because of the very different concentrations of copper found in the two layers (1-octanol
and water) after AAS analysis of different samples, the experiments were performed
using different volumes until reasonable concentrations were obtained for AAS analysis.
These volume differences were of course taken into account when calculating the
partition coefficients.
Note that the AAS method used does not determine the concentration of the complexes
species, but the total concentration of Cu(II) in each phase. Therefore, the calculation of
partition coefficient is based on total concentration rather than concentration of any
individual species. Where one species predominates under the conditions used, it is
reasonable to assume that the partition coefficient of its species will be measured.
Page 59
43
3.4 Atomic Absorption Spectroscopy
3.4.1 Working Conditions
Figure 3.3 is a picture of the Spectra AA-5 Varian used.
Table 3.2 gives details of working conditions used.6
Table 3.2 Working Conditions
Copper Lamp 3mA
Fuel Acetylene 1.5units/70pka
Support Compress air 350pka
Wavelength 324.7nm
Time 2sec
Abs. exp. Factor 1
Slit Width 1nm
Spectral Band Pass(Abs.) 50
Detection limit 0.03-10μg/ml
Figure 3.3 Atomic Absorption Spectrometer (Spectra AA-5 Varian)
Page 60
44
3.4.2 Calibration of Atomic Absorption Spectrometer
The calibration of the atomic absorption spectrometer was done using a Cu(II)
standard (1000mg/l) purchased from SIGMA. Concentrations of 1ppm, 2ppm, 5ppm,
7ppm, 10ppm, 12ppm and 15ppm of copper standard solution were prepared.6
Figure 3.4 shows a typical AAS calibration curve.
y = 16.384x - 0.2238
R² = 0.994
0
2
4
6
8
10
12
14
16
0 0.2 0.4 0.6 0.8 1
Absorbance
Co
nc
. C
u(I
I)s
tan
d (
pp
m)
Figure 3.4 above shows a typical calibration curve. In the concentration range
used, a linear curve was obtained with R2 = 0.99 ± 0.02. Linear regression analysis was
used to determine the unknown concentration and their standard deviations (Equations 14
and 15, section 2.4.2.2).
3.4.3 Validation of Modified Franz cells
Literature results are not available for the diffusion of Cu(II) through the
Cerasome membrane. For this reason the reproducibility of the experimental set up was
tested using [CuDTPA] at pH 5.33. The experiment was repeated twice using a donor
phase concentration of 635ppm giving a receptor phase concentration of 14.6 ± 1.1 ppm
after 6hrs. The standard deviation in the copper AAS analysis (3 replicates) was much
lower (0.01), most of the overall error coming from the reproducibility of membrane
preparation. An overall error of ≈ 7% was deemed acceptable and is in line with
literature measurements using a normal Franz cell. Note that the diffusion at this low pH
is much higher than that reported later at pH 7.0.
Figure 3.4 Typical Cu(II) calibration curve using Varian Spectra AA-5 Cu(II)
standard
Page 61
45
References
1. S. Odisitse, (2006), PhD Thesis, University of Cape Town.
2. J.N. Zvimba, (2005), PhD Thesis, University of Cape Town.
3. A. Voye’, (1993), PhD Thesis, University of Cape Town.
4. K.R. Brain, V.J. James, K.A. Walters, (1993), Sales Taxes Support Publishing, 3b,
558-567
5. OECD, (1981), Test Guideline 107, Decision of the Council C (81), 30 final, Paris.
6. Spectra AA-5 Operation Manual, Varian Instruments at Work, No.AA-38.
Page 62
46
CHAPTER FOUR
RESULTS AND DISCUSSION
Page 63
47
One of the objectives of this work was to establish if different ligands were able to
promote the dermal absorption of Cu(II). This was done by measuring the effect of the
ligands on the rate of diffusion of Cu(II) through a Cerasome membrane as a model for
skin and comparing these results with partition coefficient determined in 1-octanol. The
results are given below.
4.0 Dermal absorption
4.1 Diffusion in Franz cells
4.1.1 Effect of time on diffusion
The effect of time on the amount of copper diffusing through the membrane was
studied using alanine and homopiperazine. The effect of these two ligands on the
diffusion of Cu(II) was studied for 36hrs. The results are presented in Table 4.1 and
Figure 4.1. From this it can be seen that there is a slow induction period of ~8hrs during
which time an equilibrium is set up between the donor phase and the membrane.
Thereafter, there is a steady state flux of copper into the receiver phase. This is shown by
the straight line from 12hrs to 36hrs.
Table 4.1 Diffusion of Cu(II) in the presence of Alanine and Homopiperazine
through Cerasome 9005 membrane for 36hrs at pH 7.00
Cu(II) conc.(ppm)
Time (h) Homopiperazine Alanine
2 0.03 ± 0.64 0.03 ± 0.65
4 0.5 ± 0.6 1.0 ± 0.6
6 2.1 ± 0.6 2.8 ± 0.6
8 3.9 ± 0.5 5.8 ± 0.5
12 11.0 ± 0.5 15.6 ± 0.5
24 35.4 ± 1.2 57.6 ± 0.1
36 57.4 ± 1.5 98.6 ± 3.5
Page 64
48
0
20
40
60
80
100
120
0 10 20 30 40
T ime (h)
Cu
(II)
co
nc
.(p
pm
)
H om op.
Alan.
Figure 4.1 Copper diffusion of CuHomop and CuAlan through Cerasome 9005 membrane at pH 7.00
Having established that a steady-state flux was obtained between 8 and 36 hrs, the
diffusion of other copper complexes was studied for 24hrs. The results are shown in
Table 4.1 and Figure 4.2. Included in the Table 4.2 are results of CuCl2.2H2O without
any ligand added.
Table 4.2 Concentration (ppm) of Cu(II) in receiver phase in the presence of
different ligands at pH 7.00 vs. time
Time
(h)
H(555-N)
EDTA
6UH
Gly
Homop
PrDH
DTPA
Alan
*Cl-
0 0 0 0 0 0 0 0 0
0
2 1.2 ± 0.6 0.2 ± 0.6 0.1 ± 0.6 1. 2 ± 0.6 0.03 ± 0.65 0.3 ± 0.6 0.2 ± 0.6 0.03 ± 0.01
0.6 ± 0.6
4 2.6 ± 0.5 0. 8 ± 0.6 1.0 ± 0.6 5.8 ± 0.5 0. 5 ± 0.6 1.2 ± 0.6 0.5 ± 0.6 1.04 ± 0.01
1.2 ± 0.6
6 4.9 ± 0.5 3.3 ± 0.5 2.8 ± 0.5 10.8 ± 0.5 2.1 ± 0.6 2.7 ± 0.5 0.9 ± 0.6 2.82 ± 0.02
1.9 ± 0.6
8 8.5 ± 0.5 7.2 ± 0.5 4.6 ± 0.5 17.7 ± 0.8 3.9 ± 0.5 4.8 ± 0.5 1.8 ± 0.6 5.79 ± 0.01
2.5 ± 0.6
24 63.0 ± 3.4 53.8 ± 2.8 39.3 ±1.9 84.4 ± 4.7 36. 3 ± 1.8 31.0 ± 1.5 22.5 ±1.0 57. 6 ± 0.1
13.8 ± 0.7
*pH 4.23
Page 65
49
Note that the Varian spectra AA-5 was calibrated from 1ppm to 15ppm (ref. Fig.3.4),
therefore all concentrations values found either less or close to 1ppm possessed higher
standard error (detection limit equalled to 0.03-10μg/ml, Table 3.2).
-10
0
10
20
30
40
50
60
70
80
90
0 5 10 15 20 25 30
Time (h)
Cu
(II)
co
nc.(
pp
m)
H(555-N)
EDTA
6UH
Gly
Homop
PrDH
DTPA
Alan
Cl-
Figure 4.2 Variation of copper conc. of complexes vs. time through Cerasome
9005 membrane at pH 7.00
In Fig. 4.2 above, each complex has the same general trend. There’s a slow
induction period of 8h, where after there is a rapid increase in diffusion through the
Cerasome 9005 membrane.
The reason for the slow induction period of 8h is probably due to the
establishment of an equilibrium between the donor phase and the membrane.
Included in Table 4.2 and Fig.4.2 are the results for CuCl2.2H2O without any
coordinating ligand. At pH 7.00, at the concentration used, Cu(OH)2 would precipitate.
For this reason the pure CuCl2.2H2O was done at pH 4.23. From Fig.4.2 it is clear that
the ligands used are able to keep Cu(II) in solution at pH 7.00 and to promote the passage
of Copper through the membrane. This effect is shown in Table 4.3 where the
enhancement factor of the ligand after 24 hrs has been calculated. This ranges from 6.1
for Gly to 1.6 for DTPA.
Page 66
50
Table 4.3 Enhancement factor of copper diffusion through Cerasome 9005
membrane by ligands after 24 hrs
Ligands Factor
Gly 6.1
H(555-N) 4.6
Alan 4.1
EDTA 3.9
6UH 2.8
Homop 2.6
PrDH 2.2
DTPA 1.6
A better way of presenting the results is to calculate the flux and permeability
coefficient as shown below.
4.1.2 Flux (J) and permeability coefficient (Kp) calculations
The steady state flux and permeability coefficients were calculated from the
gradient of the curves1 in Fig. 4.2. The values obtained for 8 ligands + CuCl2.2H2O are
given in Table 4.4, Fig.4.3 and Fig.4.4 where flux is expressed by J 10-9
g/cm2s and
permeability coefficient Kp 10-6
cm/s. While the measurements were repeated 3 times,
effectively only 2 points are used (8hrs, 24hrs) to calculate the slope, hence calculations
of standard deviation are not really meaningful. Also, given the variability in membrane
preparation (≈ 7% error), too much emphasis should not be placed on the low analytical
standard deviation (<1%).
Page 67
51
Table 4.4 Flux of diffusion J (10-9
g/cm2s) and permeability coefficient Kp (10
-
6cm/s) of 8 copper complexes through Cerasome 9005 membrane
Complexes J 10-9
g/cm2s Kp 10
-6cm/s
CuH(555-N) 3.4 10.7
CuEDTA 2.9 9.2
CuAlan 2.0 6.3
Cu(6UH) 2.2 6.8
CuGly 4.2 13.1
CuHomop. 2.0 6.4
CuPrDH 1.6 5.2
CuDTPA 1.3 4.1
CuCl2.2H2O
*pH 4.23
0.7 1.1
0.7
1.293
1.64
2.0052.022.17
2.91
3.41
4.17
0
0.5
1
1.5
2
2.5
3
3.5
4
4.5
1 2 3 4 5 6 7 8 9
Flu
x J
10
-9g
cm
-2s
-1
DTPAHomop Gly PrDH6UHEDTAH(555-N) Alan C l-
Figure 4.3 Effect of different ligands on the flux of copper through Cerasome 9005
membrane in modified Franz cell from 8-24hrs at pH 7.00
Page 68
52
13.1
10.74
9.16
6.836.36 6.31
5.17
4.06
1.1
0
2
4
6
8
10
12
14
1 2 3 4 5 6 7 8 9
Kp 1
0-6
cm
s-1
Figure 4.4 Influence of ligands on the permeability of copper complexes through
Cerasome 9005 membrane at pH 7.00
Fig. 4.4 shows a decrease in permeability coefficient from Gly to Cl- detailed as
follows: Gly > H(555-N) > EDTA > 6UH > Homop > Alan. > PrDH > DTPA > Cl-.
The permeability coefficient (Kp) of Cu(II) with amino-acids [Alan (6.310 ±
0.002)10-6
cm/s and Gly (13.100± 0.002)10-6
cm/s] in Fig. 4.4 are comparable to those
found by Mazurowsky1 [Alan (1.90 ± 0.16) 10
-6cm/s, Gly [(1.62 ± 0.06)10
-6cm/s].
Mazurowsky measured diffusion through liposomes and the acceptor phase was buffered
with potassium phosphate (pH 7.4) which explains the slightly higher values obtained in
this study.
Having established that different ligands were able to enhance the passage of
Cu(II) through an artificial membrane, the question that has to be asked is why. In the
design of new ligands used to promote Cu(II) absorption, it is necessary to identify those
ligand factors which are important. Previous studies done by Potts and Guy have
established that for organic compounds, molecular weight and partition coefficient
(lipophilicity) are important.7 A correlation between these factors and the measured flux
was therefore investigated.
Gly H(555-N) EDTA 6UH Homop Alan PrDH DTPA Cl-
Page 69
53
4.2 Partition coefficient
The Shake-flask method was used in octanol/water mixtures to determine the
partition coefficient of the Cu(II) complexes.2
The octanol/water partition coefficient (Ko/w) is a quantitative measure of
lipophilicity of a substance and Table 4.5, along with Figure 4.5, summarize the partition
coefficients measured in 1-octanol/water mixtures.
Table 4.5 Logarithm of partition coefficient - Log Ko/w (mean ± SD) of Cu(II) in
the presence of different ligands in octanol/water mixtures
Order of lipophilicity ligand - Log Ko/w
1 Gly 2.66 ± 0.12
2 H(555-N) 3.00 ± 0.14
3 6UH 3.02 ± 0.14
4 EDTA 3.07 ± 0.12
5 PrDH 3.45 ± 0.12
6 Homop 3.49 ± 0.14
7 DTPA 3.62 ± 0.12
3.623.493.45
3.073.023
2.66
0
0.5
1
1.5
2
2.5
3
3.5
4
1 2 3 4 5 6 7
(-Log Kow)
DTPA6UH HomopGly H(555-N) EDTA PrDH
Figure 4.5 Logarithm of partition coefficient (- Log Ko/w) in 1-octanol/water mixtures
of copper with different ligands
Page 70
54
Table 4.5 and Figure 4.5 show the effect of different ligands on the partition
coefficients (log Ko/w) of Cu(II) determined at room temperature and pH 7.00.
The principle of like dissolves like (lipophile-lipophile) along with the lipophilic
nature of 1-octanol is the main cause of different partition coefficient values observed.
It was suggested that for a drug to be reasonably lipophilic its log Ko/w value must
be at least 0.6.4 Negative values of log Ko/w indicate that a drug is weakly lipophilic and
largely hydrophilic.3
The negative values of log Ko/w found in this study indicate that
these complexes are largely hydrophilic and CuGly and CuH(555-N) have higher
lipophilicity compared to the other 5 complexes. Similar values have also been found for
other copper(II) amino acid complexes.3,4
The results of Table 4.5 and Fig. 4.5 are very similar to those found in Fig. 4.4 of
permeability coefficient, where Gly and H(555-N) are higher and very close to each
other.
CuPrDH and CuH(555-N) have lower log Ko/w values [(-3.45± 0.12 and -3.00±
0.14) respectively] compared to those found by Odisitse and Zvimba at pH 7.4
[64
CuPrDH, log Ko/w = -2.35; 64
CuH(555-N), log Ko/w = -1.39]. This difference can be
explained by the higher pH used in their study. At pH 10, the partition coefficients are:
64CuPrDH, log Ko/w = -1.72;
64CuH(555-N), log Ko/w = -1.14.
Note that the main purpose of including CuAlan was to compare permeability values
found in this work with literature values (Mazurowsky1). CuAlan partition coefficients
were not determined.
4.3 Data Analysis
Potts and Guy analysed permeability data using a model which depends only upon
the size of the drug (MW) and its octanol/water partition coefficient.7 Therefore, the aim
of this analysis was to investigate if there was a correlation between permeability
coefficient (Kp), octanol/water partition coefficient (Ko/w) and molecular weight (MW) of
the copper complexes. So far the different parameters have been assigned to the ligand
but of course it is the copper complexes of the ligand that are diffusing through the
membrane or partitioning between octanol and water.
Page 71
55
For this reason the speciation of the copper, in the presence of the different ligands,
was calculated. This is done in the next section.
4.3.1 Copper speciation in the presence of different ligands
Table 4.6 gives a list of the speciation of copper in the presence of different ligands
at pH 7.0.
Table 4.6 Copper speciation in the presence of different ligands at pH 7.0
Ligand Predominant Species
formed
(pH 7.00)
% Cu(II)
DTPA [Cu(DTPA)]-3
100
PrDH [Cu(PrDH)H-1]+
[Cu(PrDH)]+2
70
30
Homop. [Cu(Homop)]+2
95
CuGly [Cu(Gly)2] 100
CuEDTA [Cu(EDTA)]-2
100
CuH(555-N) [CuH(555-N)H-1]+ 100
Cu(6UH) [Cu(6UH)H-1]+ 100
The results in Table 4.6 show that in most cases only one copper species is present
in solution and so it is reasonable to assume that the measured parameters refer to this
species. In the case of PrDH, two species predominate.
4.3.2 Relationship between logarithm of permeability coefficient (Log Kp) and
molecular weight (MW) of copper complexes
Table 4.6 and Fig.4.6 show the investigation of a possible correlation between
logarithm of permeability coefficient (log Kp) and molecular weight (MW) of the copper
complexes. One difficulty with this analysis is knowing which species are present in
solution. The copper speciation is dependent on the concentration of ligand used and the
pH of the solution. For this reason speciation calculation were done on all the systems,
using experimental conditions and literature equilibrium constants.
Page 72
56
The results are given in Table 4.6. A second difficulty is knowing the structure of
the species in solution. Thermodynamics will tell us the stoichiometry and equilibrium
constant of the different species but not their structure.
For this reason we have to either infer the structure form a knowledge of the ligand
and the complex stoichiometry or obtain the structure from the original publication where
these have been done. This is necessary because the waters of coordination are generally
not specified in the stochiometry but need to be inferred from the structure. This has
been done in Table 4.7. In some instances it was not possible to unambiguously decide
on the number of coordinated water molecules as the ligand my be bidentate or tridentate
and so two alternatives are given. In calculating, the molecular weight it is assumed that
the metal is octahedral (tetragonally distorted) with free coordination sites occupied by
water.
Table 4.7 Permeability Coefficient (Log Kp), Molecular Weight (MW) and %
distribution of Cu(II) in copper-ligands species for 7 Copper complexes
Complexes MW (g/mol) - Log Kp % Cu(II)
CuGly [Cu(Gly)2(H2O)2]
250 4.88 100
CuHomop [Cu(Homop)(H2O)4]
+2 236 5.2 95
Cu(6UH) [Cu(6UH)H-1(H2O)2]
+
[Cu(6UH)H-1(H2O)3]+
304
322
5.16 100
CuH(555-N) [Cu{H(555-N)H-1(H2O)2]
+
[CuH(555-N)H-1(H2O)3]+
324
342
4.97 100
CuPrDH [Cu{(PrDH)H-1(H2O)2]
+
[Cu{(PrDH)H-1(H2O)3]+
367
385
5.29 70
CuEDTA [Cu(EDTA)]
-2 356 5.19 100
CuDTPA [Cu(DTPA)]
-3
457 5.04 100
Page 73
57
y = 0.0005x + 4.9627
R2 = 0.0426
4.8
4.9
5
5.1
5.2
5.3
5.4
230 280 330 380 430 480
MW (g/mol)
-Log K
p
CuH(555-N)
CuEDTA
CuGly
CuHomop
CuPrDH
CuDTPA
Cu(6UH)
Figure 4.6 Logarithm of permeability coefficient (-Log Kp) plotted against molecular
weight (MW) of 7 copper complexes
The coefficient of correlation obtained from Fig.4.6 is R2 = 0.0426 ± 0.005,which
is far from 1 demonstrating that there is no correlation between logarithm of partition
coefficient and molecular weight (MW) of all 7 complexes. This conclude that logarithm
of permeability coefficient is independent of molecular weight (MW) of the copper
complexes
4.3.3 Relationship between permeability coefficient (Kp) and octanol/water partition
coefficient (Log Ko/w)
A correlation was investigated between permeability coefficient (Kp) and
octanol/water partition coefficient (Log Ko/w).
A plot of Log Kp against Log Ko/w of 7 copper complexes is shown in Figure 4.7.
Page 74
58
4.85
4.9
4.95
5
5.05
5.1
5.15
5.2
5.25
5.3
5.35
2.6 2.8 3 3.2 3.4 3.6
- Log Ko/w
- L
og
Kp (
cm
/s)
CuH(555-N)
Cu(6UH)
CuEDTA
CuPrDH
CuGly
CuHomop
CuDTPA
Figure 4.7 Logarithm of permeability coefficient Log Kp plotted against logarithm
partition coefficient (Log Ko/w) of 7 copper complexes
The coefficient of correlation obtained from Fig.4.10 is R2 = 0.32 ± 0.01, which is
again far from 1, demonstrating that there is no correlation between permeability
coefficient and partition coefficient of all complexes. This to conclude that permeability
coefficient does not linearly depend on octanol/water partition coefficient for all copper
complexes.
4.3.3 Relationship between permeability coefficient (Log Kp), octanol/water
partition coefficient (Log Ko/w) and molecular weight (MW) of copper complexes
Various models, based on Fick’s first law of diffusion, have been used to predict
the relationship between permeability coefficient and partition coefficient of drugs.4
As
said previously (section 4.3), Potts and Guy analysed permeability data using a model
which depends only upon the size of the drug (MW) and its octanol/water partition
coefficient7. The following equation was used to predict skin permeability
8:
Log Kp = Log (D0/h) + f Log Ko/w – β’ MW (24)
Where,
Page 75
59
Kp= the permeability coefficient; D0= the diffusivity of hypothetical molecule
having zero molecular weight; h = the membrane thickness; f = constant which accounts
for the difference between the partitioning domain presented by octanol and that
presented by the membrane lipids; Ko/w = the octanol/water partition coefficient; MW =
molecular weight, β’ = a constant which includes a conversion factor for the substitution
of molecular weight for molecular volume. The Cerasome 9005 membrane thickness
was (h=0.12cm)
Multiple linear regression analysis of log Kp upon log Ko/w and MW was used to
obtain values for β’, Log (D0/h) and f.
Table 4.8 Relationship between permeability coefficient Log Kp, partition coefficient
Log Ko/w(mean ± SD) and molecular weight (MW) of the copper complexes
Complex - Log Kp (cm/s) - Log Ko/w MW (g/mol)
CuGly [Cu(Gly)2(H2O)2] 4.88 2.66 ± 0.12 250
CuHomop [Cu(Homop)(H2O)4]
+2 5.2 3.49 ± 0.14 236
Cu(6UH) [Cu(6UH)H-1(H2O)2]
+
[Cu(6UH)H-1(H2O)3]+
5.16
3.02 ± 0.14
304
322
CuH(555-N) [Cu{H(555-N)H-1(H2O)2]
+
[CuH(555-N)H-1(H2O)3]+
4.97
3.00 ± 0.14
324
342
CuPrDH [Cu{(PrDH)H-1(H2O)2]
+
[Cu{(PrDH)H-1(H2O)3]+
5.29
3.45 ± 0.12
367
385
CuEDTA 5.19 3.07 ± 0.12 355.79
CuDTPA 5.04 3.62 ± 0.12 456.89
Page 76
60
The average of intercept Log (D0/h), slope (β’) and f found after considering
species solvated either with 2H2O or 3H2O for Cu(6UH), CuH(555-N) and CuPrDH
were: Log (D0/h) = -4.32 ± 0.03, β’ = - 0.00037 ± 0.00001 and f = 0.28 ± 0.01. Equation
25 can be written as follows:
Log Kp = - 4.32 + 0.28 Log Ko/w + 0.00037 MW (25)
-1
-0.8
-0.6
-0.4
-0.2
0
0.2
0.4
0.6
0.8
1
0 1 2 3 4 5 6 7 8
CuPrDH
CuGly
CuHomop
Cu(6UH)
CuH(555-N)
CuEDTA
CuDTPA
Residuals plot of Log Kp
Figure 4.8 Residuals plot of permeability coefficient (Log Kp) measured vs. Log Kp
predicted
Fig.4.8 shows a residuals plot of the multiple linear regression analysis. The
biggest error is 0.13 or ≈ 2.5% of the measured values of log Kp. This gives us
confidence that equation 25 is a good representation of copper diffusion through the
Cerasome 9005 membrane.
The values of Log Kp ≈ -5 of our copper-ligands systems are in agreement with
values of Log Kp = -5 predicted by Flynn5 (1990). Flynn used a number of algorithms to
predict skin permeability and proposed that if Log Ko/w < 0.5 and MW > 150,
consequently Log Kp = -5.
Page 77
61
The value of f = 0.28 is in agreement with literature which states that f values
should be greater than zero6. However, using human nail plates, Kobayashi et al
6 found f
to be - 0.160. Potts and Guy (1992) for a data range [18 < MW < 765; -3 < Log Ko/w <
6]7 found f to be 0.71. Yi-Bo Liou et al used f = 0.71 in their studies of diffusion through
the skin of nude mice (buffer solution, pH 7.4).9
The reason why our value of f is < 0.71 may be due to the range of Ko/w values
for our complexes [-3 < Log Ko/w < -2] as opposed to the literature range, and the
different membrane used.
The value of f says something about the lipophilic nature of a membrane via Km.
Km is the membrane/donor vehicle partition coefficient of the drug and is given by:
Km = [Ko/w]f (26)
Equation 26 shows that the lipophilic nature (Km) increases with an increase of f
value. A comparison of lipophilic nature of membranes was studied through f values and
equation 26: Km = human nail plates (f = -0.16) < Cerasome 9005 (f = 0.28) < human
skin (f = 0.71).
These results suggest that Cerasome 9005 behaves as a lipophilic partition
membrane and human nail plates as a hydrophilic gel membrane.
The values of Log (D0/h), β’ and f found by Flynn were respectively – 2.72,
0.0061 and 0.71 but our values were -4.32 for Log (D0/h), 0.00037 for β’ and 0.28 for f.
The difference can be due to the nature of membrane used. Flynn used human skin and
our study used a membrane mimic of human skin.
Lien and Gao (1995)10
analysed a subset of the Flynn data set. They
demonstrated that the number of hydrogen bonds that may be formed by a compound
(Hb), in addition to molecular weight and biphasic response to hydrophobicity, could
model skin permeability (unit cm/h) very well:
Log Kp = 0.84 log Ko/w – 0.07 (log Ko/w)2 – 0.27Hb – 1.84 log MW + 4.39 (28)
n = 22 and r2 = 0.96
Where, n is the number of compounds analysed and r2
coefficient of correlation.
Page 78
62
This model does emphasise the possible importance of hydrogen bonding. Our
study investigated the correlation between permeability coefficient, partition coefficient
and molecular weight only but did not study influence of hydrogen bonding. A further
investigation based on the Lien and Gao equation will be useful.
Page 79
63
References
1. L. Mazurowska, K. Nowak-Buciak, M. Mojski, (2007), Analytical and Bioanalytical
Chemistry, 388, 1157-1163.
2. A. Leo, C. Hansch, D. Elkins, (1971), Chemical Reviews, 71, 525-616.
3. J. N. Zvimba, (2005), PhD Thesis, University of Cape Town.
4. S. Odisitse, (2006), PhD Thesis, University of Cape Town.
5. S.W. Frantz, B.W. Kemppainen, W.G. Reifenrath, (1990), Chemical Rubber
Company Press, Florida, 35-59.
6. Y. Kobayashi, T. Komatsu, M. Sumi, S. Numajiri, M. Miyambo, D. Kobayashi, K.
Sugibayashi, Y. Morimoto, (2004), European Journal of Pharmaceutical Sciences, 21,
471-477.
7. R.O. Potts, R.H. Guy, (1992), Pharmaceutical Research, 9, 663–669.
8. I. J. Bosman, K. Ensing, R. A. Zeeuw, (1998), International Journal of Pharmaceutics,
169, 65-73
9. L. Yi-Bo, H. Hsiu-O, Y. Chun-jen, L. Ying-Ku, S. Ming-Thau, (2009), Journal of
Controlled Release, 138, 260-267
10. E.J. Lien, H. Gao, (1995), Pharmaceutical Research, 4, 583-587.
Page 80
64
CHAPTER FIVE
CONLUSION AND SUGGESTIONS
Page 81
65
Sorenson and Jackson et al. have shown that Cu(II) complexes are effective in reducing
the inflammation associated with RA1, enhancing bio-availability of copper and reducing
their toxicity.2-3
Several studies have been carried out to design stable Cu(II) complexes and evaluate their
dermal absorption through the octanol/water mixture partition coefficient.9,12
The
present study has been designed to investigate a new method of studying dermal
absorption and to compare these results with partition coefficient measurements.
The Franz diffusion cell was chosen and modified as a method of dermal absorption
study because it is cheap, reliable, easy, quick to diffuse samples, and there is no need to
analyse the composition of both phases but only receptor phase.
The initial concentration of copper(II) used in the donor phase of modifiez Franz cell was
constantly 317.5 ppm.
Cerasome 9005, purchased from Germany (Lipoid company), was chosen as an artificial
membrane because it mimics stratum corneum, gives reproducible results, is easy to
prepare and maintain. Using an artificial membrane does not require ethics permission.4
Ligands EDTA, glycine, alanine, DTPA, PrDH, H(555-N), 6UH and homopiperazine
were selected for permeability study after a screening of sixteen ligands at pH 7.00.
Atomic absorption spectroscopy and linear regression analysis software were used to
determine copper concentration.5-6
Fick’s law of diffusion for a steady-state flux (J) and octanol/water mixtures have been
used to determine the permeability coefficient (Kp) and partition coefficient (Ko/w).8
Potts and Guy data analysis was used to determine the constants which accounts for the
difference between the partitioning domain presented by octanol and that presented by
Cerasome 9005 membrane (f). This relationship includes a conversion factor for the
substitution of molecular weight for molecular volume (β’) and the diffusivity of
hypothetical molecule having zero molecular weight (D0).
7,9
Page 82
66
The diffusion of the copper complexes was studied for 24hrs after establishing a steady
state flux that was achieved after 8 hrs using alanine and homopiperazine as ligands.
This steady state validated the modified Franz cells used.
Phosphate buffered saline (PBS) in donor and acceptor phase of modified Franz cells was
replaced by water (MQ-water) because PBS would compete with the ligands and
affecting the steady state of flux.10
The permeability coefficient (Kp) values of complexes with amino-acids were
comparable to those found by Mazurowsky through nail-plates.11
This comparison again
validated the modified Franz cells used in this study.
It was observed that the ligand affects dermal absorption of copper complexes. In fact,
Gly and H(555-N) with Kp respectively equalled to 13.1 10-6
cm/s and 10.7 10-6
cm/s were
found to enhance the most copper diffusion through Cerasome 9005 membrane.
The lipophilicity of CuH(555-N) through its partition coefficient (Log Ko/w) = -3.00 was
found to be less than CuGly and higher than the rest of complexes. The negative values
of log Ko/w found in this study indicate that these complexes are largely hydrophilic.
In terms of correlation between parameters, no correlation was found between molecular
weight and logarithm of partition coefficient, permeability coefficient and molecular
weight, permeability coefficient and formation constant Log β110 and permeability
coefficient and % distribution of Cu(II) in copper-ligands systems.
Multiple linear regression analysis of log Kp upon log Ko/w and MW provided values of
slope β’= - 0.00037 ± 0.00001, intercept Log (D0/h) = - 4.32 ± 0.03 and f = 0.28 ± 0.01.
D0 and β’ were considered constant and the value of f = 0.28 was in agreement with
literature which states that f value should be greater than zero.6 A value of f = -0.16 was
found by Kobayashi et al13
using human nail plates and f = 0.71 was found by Potts and
Guy using human skin.8
Cerasome 9005 membrane used in this research was confirmed to be lipophilic through
positive value of f.
Page 83
67
Potts and Guy model did not study the influence of hydrogen bonding. Therefore, a
further investigation based on the equation of Lien and Gao14
will be useful.
The octanol/water partition coefficient makes a greater contribution to the permeability
coefficient than molecular weight. Permeability coefficient of the copper complexes
increases when partition coefficient increases, this was observed only for CuGly,
CuH(555-N), CuPrDH and CuHomop.
The ligand H(555-N) [N-2[2-(2-aminoethylamino)ethyl]picolinamide] will require
particular attention for further dermal absorption studies because of permeability
coefficient and partition coefficient values found in this research.
CuH(555-N) concentration value after 24 hrs (19.85 ± 0.22)% was found to be very close
to those found by Zvimba12
with 64
CuH(555-N) in vivo with white mice (albino) 24 hrs
post-injection in carcass (19.12 ± 3.44) %, 10.65 % less through urine (30.50 ± 2.30) and
19.31 % higher through blood organ. This difference can be explained in vitro study
done with artificial membrane Cerasome 9005 in this research.
The partition coefficient values with radioactive copper were found by Zvimba and
Odisitse to be a function of pH. Therefore, a further investigation on the effect of pH
upon partition coefficient of copper will be useful.
Speciation calculations show that the speciation is very dependent on pH. It would
therefore be interesting to see the effect of pH upon copper flux. By varying the pH it
may be possible to estimate Kp for individuals species at specific pH.
Page 84
68
References
1. A. Omoto, Y. Kawahito, I. Prudovsky, Y. Tubouchi, M. Kimura, H. Ishino, M. Wada,
M. Yoshinda, M. Kohno, R. Yoshimura, T. Yoshikawa, H. Sano, (2005), Arthritis
Research and Therapy, 7, 1174 – 1182.
2. W.R. Walker, D.M. Keats, (1976), Agents Actions, 6, 454 – 459.
3. J.E. Trevor, T.W. Hambley, B.J. Kennedy, (1999), Inorganic Chemistry, 38, 1736 -
1744.
4. Lipoid GmbH, (2008), Frigenstr.4. D-67065 Ludwigshafen.
5. www.shsu.edu/chemistry/primers/AAS.html(accessed:11-12-2008)
6. W. P. Gardiner, (1997), Statistical analysis methods for chemists, The Royal Society
of Chemistry, 168-195.
7. www.uthsc.edu/pharmacy/pharmsci/faculty/MahatoNAPLEX05.PDF(accessed:22-
12-2008)
8. R.O. Potts, R.H. Guy, (1992), Pharmaceutical Research, 9, 663–669
9. S. Odisitse, (2006), PhD Thesis, University of Cape Town.
10. S.W. Frantz, B.W. Kemppainen, W.G. Reifenrath, (1990), CRC Press, Florida, 35-59.
11. L. Mazurowska, K. Nowak-Buciak, M. Mojski, (2007), Analytical and Bioanalytical
Chemistry, 388, 1157-1163.
12. John Zvimba, (2005), PhD Thesis, University of Cape Town.
13. Y. Kobayashi, T. Komatsu, M. Sumi, S.Numajiri, M. Miyambo, D. Kobayashi, K.
Sugibayashi, Y. Morimoto, (2004), European Journal of Pharmaceutical Sciences, 21,
471-477.
14. E.J. Lien, H. Gao, (1995), Pharmaceutical Research, 4, 583-587.