Page 1
Evaluation of Wave-Adaptive Modular Vessel
Suspension Systems for Improved Dynamics
Andrea A. Shen
Thesis submitted to the Faculty of the Virginia Polytechnic Institute
and State University in partial fulfillment for the degree of
Masters of Science
in
Mechanical Engineering
Mehdi Ahmadian, Chair
Daniel J. Stilwell
Pablo A. Tarazaga
April 29, 2013
Blacksburg, Virginia
Keywords: Wave-Adaptive Modular Vessel, WAM-V,
suspension, shock mitigation, sea trial
Copyright © 2013, Andrea A. Shen
Page 2
Evaluation of Wave-Adaptive Modular Vessel
Suspension Systems for Improved Dynamics
Andrea A. Shen
Abstract
A study is conducted to test the dynamics of the 33ft Wave-Adaptive Modular Vessel (WAM-V)
when outfitted with different suspension systems. Instrumented with an array of sensors, the
vessel is tested with two different suspension arrangements to characterize how they affect
WAM-V dynamics, and to ultimately select a suspension that is most suitable for the 33ft WAM-
V and other vessels that are planned for the future.
Optimizing the suspension can reduce the magnitude of accelerations at the payload tray,
benefiting both the operator and the payload. Reduced accelerations can significantly improve
comfort and risk of injury to the operator, while also lessening the likelihood of any damage to
any sensitive cargo onboard. The stock suspension components are characterized through in-
house tests conducted at the Center for Vehicle Systems and Safety (CVeSS) at Virginia Tech
(VT). Based on the stock characterizations, new suspension components are chosen to better fit
the needs of the 33ft WAM-V.
Sea trials are conducted with both suspension systems at the Combatant Craft Division (CCD), a
division of the Naval Surface Warfare Center, Carderock Division (NSWCCD), in Norfolk, VA
to quantitatively and qualitatively determine the differences between the two suspensions. The
33ft WAM-V is instrumented with a series of accelerometers and potentiometers for measuring
accelerations and displacements. The data is analyzed for the sea trials conducted at CCD and
the results of the analysis indicate that the suspension selection can significantly affect the
transmission of shock and vibrations from the pontoons to the operator or payload tray. Both
suspensions are able to mitigate a significant amount of the shocks seen at the pontoons,
however, the results do not definitively show which suspension is the better of the two. This is
due to the fact that each suspension is not subjected to the exact same wave conditions, and
Page 3
iii
therefore the resulting suspension dynamics vary. For instance, during a 2-foot wave event, the
new suspension attenuates more shock than the stock suspension, 76% versus 71%. However,
during a 4-foot wave event, the stock suspension attenuates more shock than the new suspension,
66% versus 60%.
Additionally, the suspension selection can significantly influence the ride height. The stock
suspension provides a 70/30 ratio between extension and compression stroke, while the new
suspension provides a 50/50 ratio. The more balanced split between the extension and
compression strokes allow for better utilizing the total available stroke for the suspension in both
directions. This significantly reduces the resulting high-g impacts since the suspension does not
frequently bottom out when the vessel is subjected to a large wave.
It is recommended that the results of this study be extended through laboratory dynamic testing
that allows for more repeatable dynamic events than sea trials in order to better establish the
influence of each suspension parameter on the vessel dynamics. Such tests will also allow for a
better understanding of the dynamics of the vessel in response to various inputs at the pontoons,
both subjectively (visually) and objectively (through measurements).
Page 4
iv
Acknowledgements
I would first like to thank my entire family for supporting and encouraging me throughout my
education. I am very lucky to have parents who were willing to sit with me through high school
calculus and physics, helping me build the foundation that made my undergraduate and graduate
studies a success. Without their support I would not have gotten this far.
I am extremely grateful to Dr. Mehdi Ahmadian who started out as a wonderful professor and
gave me the opportunity to intern with the United States Navy through the Naval Research
Enterprise Internship Program for three summers, leading to being part of such a unique project.
Without his guidance and mentorship, I would never have discovered my interest in suspensions
and boats. I would additionally like to thank Dr. Daniel Stilwell and Dr. Pablo Tarazaga for
serving on my committee.
I would like to thank Michael Craft and Andrew Peterson for their guidance and mentorship that
has allowed me to learn a great deal during my time at CVeSS. They, along with everyone else
in the CVeSS family, have made lab life both educational and enjoyable.
I would like to thank the Office of Naval Research and Kelly Cooper for supporting this project
and giving CVeSS the chance to work on such an interesting concept.
I would like to express my thanks to those of Marine Advanced Research, Inc., Ugo and Isabella
Conti, Mark Gundersen, and William Burke, for developing the Wave-Adaptive Modular Vessel
technology, which provided this opportunity to begin with.
I would also like to thank all the people at the Combatant Craft Division of the Naval Surface
Warfare Center, Carderock Division for helping with testing efforts including, but definitely not
limited to, Charlie Weil, Bert Adamos, Ed Adamos, and Chelsea Shores. I also want to give
thanks to those of Seaward Services who provided additional testing support.
Lastly, to all those I have mentioned, and to those I have regretfully neglected to include, words
are not enough to express how grateful I am for all the support and encouragement you have
given, but hopefully these show a glimmer of my appreciation.
Page 5
v
Contents
Abstract ........................................................................................................................................... ii
Acknowledgements ........................................................................................................................ iv
Contents .......................................................................................................................................... v
List of Figures ............................................................................................................................... vii
List of Tables ............................................................................................................................... xiii
Chapter 1 Introduction ............................................................................................................... 1
1.1 Motivation ........................................................................................................................ 2
1.2 Objectives ......................................................................................................................... 3
1.3 Approach .......................................................................................................................... 3
1.4 Contribution ..................................................................................................................... 3
1.5 Thesis Organization.......................................................................................................... 4
Chapter 2 Background Information ........................................................................................... 5
2.1 Wave-Adaptive Modular Vessels..................................................................................... 5
2.1.1 First Generation: 100ft Proteus ................................................................................. 5
2.1.2 Second Generation: 12ft USV .................................................................................. 6
2.2 Third Generation: 33ft WAM-V ...................................................................................... 8
2.3 Conventional Road Vehicle Suspensions ....................................................................... 10
Chapter 3 Suspension Characteristics...................................................................................... 14
3.1 Stock Suspension Description ........................................................................................ 14
3.2 Stock Damper Characteristics ........................................................................................ 18
3.3 Stock Airspring Characterization ................................................................................... 20
3.4 33ft WAM-V Weight Calculations ................................................................................ 26
3.4.1 Sprung-Unsprung Mass (Weight) Ratio ................................................................. 26
3.4.2 Suspension Sprung Mass (Weight) ......................................................................... 31
Page 6
vi
3.5 New Suspension Selection and Characterization ........................................................... 32
Chapter 4 33ft WAM-V Testing Setup and Procedure............................................................ 40
4.1 Suspension Installation ................................................................................................... 40
4.1.1 Stock Suspension .................................................................................................... 40
4.1.2 New Suspension ...................................................................................................... 43
4.1.3 Suspension Lifting Tool .......................................................................................... 46
4.2 Suspension Sea Trial Setup ............................................................................................ 50
4.2.1 Instrumentation of the 33ft WAM-V ...................................................................... 50
4.2.2 Test Patterns ............................................................................................................ 59
4.2.3 Testing Procedure ................................................................................................... 60
Chapter 5 Suspension Testing and Performance Analysis ...................................................... 62
5.1 Testing Summary ........................................................................................................... 62
5.2 Sea State 1 Results ......................................................................................................... 63
5.3 Sea State 2 Results ......................................................................................................... 69
5.4 Individual Wave Event Analysis .................................................................................... 75
5.4.1 Two-Foot Wave Event Analysis ............................................................................. 76
5.4.2 Four-Foot Wave Event Analysis ............................................................................. 96
Chapter 6 Conclusions and Recommendations ..................................................................... 118
6.1 Conclusions .................................................................................................................. 118
6.2 Recommendations ........................................................................................................ 119
References ................................................................................................................................... 121
Page 7
vii
List of Figures
Figure 1-1: 33ft WAM-V ................................................................................................................ 1
Figure 2-1: First generation WAM-V, 100ft Proteus...................................................................... 5
Figure 2-2: 100ft Proteus suspension .............................................................................................. 6
Figure 2-3: Second generation WAM-V, 12ft USV ....................................................................... 7
Figure 2-4: 12ft USV suspension .................................................................................................... 7
Figure 2-5: Third generation WAM-V, 33ft WAM-V.................................................................... 8
Figure 2-6: 33ft WAM-V folded up on its trailer ........................................................................... 9
Figure 2-7: 33ft WAM-V suspension ........................................................................................... 10
Figure 2-8: Quarter car model representing conventional vehicle suspension system [7] ........... 11
Figure 2-9: Various damping ratios over time [3] ........................................................................ 12
Figure 3-1: 33ft WAM-V stock suspension .................................................................................. 14
Figure 3-2: 33ft WAM-V stock dampers ...................................................................................... 15
Figure 3-3: 33ft WAM-V stock airspring ..................................................................................... 15
Figure 3-4: Drawing of the measurements taken to determine motion ratios ............................... 16
Figure 3-5: Relationship between ball joint and stock airspring height ....................................... 17
Figure 3-6: Relationship between ball joint and stock damper height.......................................... 17
Figure 3-7: Roehrig dynamometer test rig .................................................................................... 18
Figure 3-8: Stock damper curves .................................................................................................. 19
Figure 3-9: Plot of one damping curve from the Roehrig tests ..................................................... 20
Figure 3-10: Data sheet for 33ft WAM-V stock airspring, Firestone 1T14C-3 [5] ...................... 21
Figure 3-11: 1T14C-3 airspring mounted in the MTS .................................................................. 22
Figure 3-12: Force versus airspring height of first test from 10 to 16 inches ............................... 23
Figure 3-13: Force versus airspring height of second test from 6 to 12 inches ............................ 23
Page 8
viii
Figure 3-14: Force versus spring height of both airspring tests with cubic trend......................... 25
Figure 3-15: Spring force and rate of stock airspring ................................................................... 25
Figure 3-16: Profile view showing sprung and unsprung portions of 33ft WAM-V ................... 26
Figure 3-17: 33ft WAM-V lifted onto scales ................................................................................ 27
Figure 3-18: Pontoon front (left) and rear (right) lifted onto scales ............................................. 27
Figure 3-19: Location of scales..................................................................................................... 28
Figure 3-20: Engine pod lifted onto scales ................................................................................... 29
Figure 3-21: Suspension sprung mass measured by placing scale under ball joint ...................... 31
Figure 3-22: Öhlins coil-over-spring suspension .......................................................................... 32
Figure 3-23: Ball joint travel with stock airspring and linear springs .......................................... 33
Figure 3-24: Compression travel available with stock and new suspensions ............................... 34
Figure 3-25: Equivalent spring rate at ball joint with stock and new suspensions ....................... 35
Figure 3-26: Damping ratios of stock and new suspensions......................................................... 36
Figure 3-27: Damping characteristics of stock and new dampers ................................................ 37
Figure 3-28: Relationship between ball joint and new damper height ......................................... 38
Figure 3-29: Coil-over suspension implemented into existing WAM-V structure....................... 39
Figure 4-1: Upper mounting bar of stock airspring ...................................................................... 41
Figure 4-2: Lower mount of airspring, dampers, and limit straps ................................................ 41
Figure 4-3: Upper mounting frame for stock dampers and extension limit straps ....................... 42
Figure 4-4: Underside of upper mounting frame .......................................................................... 43
Figure 4-5: Newly designed upper mounting frame for new suspension ..................................... 44
Figure 4-6: Upper mount of new damper ..................................................................................... 45
Figure 4-7: Lower mount for new damper .................................................................................... 45
Figure 4-8: Suspension lifting tool ............................................................................................... 46
Page 9
ix
Figure 4-9: Tool props suspension up (left) and flange keeps tool from rolling (right) ............... 47
Figure 4-10: Wheels of suspension lifting tool wedged under airspring platform ....................... 48
Figure 4-11: Suspension lifting tool does not lay flat on the WAM-V ski ................................... 48
Figure 4-12: Fully locked out suspension with suspension lifting tool and ratchet strap ............. 49
Figure 4-13: Diagram of sensor placement on 33ft WAM-V ....................................................... 50
Figure 4-14: Accelerometer box setup .......................................................................................... 51
Figure 4-15: Accelerometer located towards pontoon bow near suspension ............................... 52
Figure 4-16: Accelerometer located under rear joint .................................................................... 52
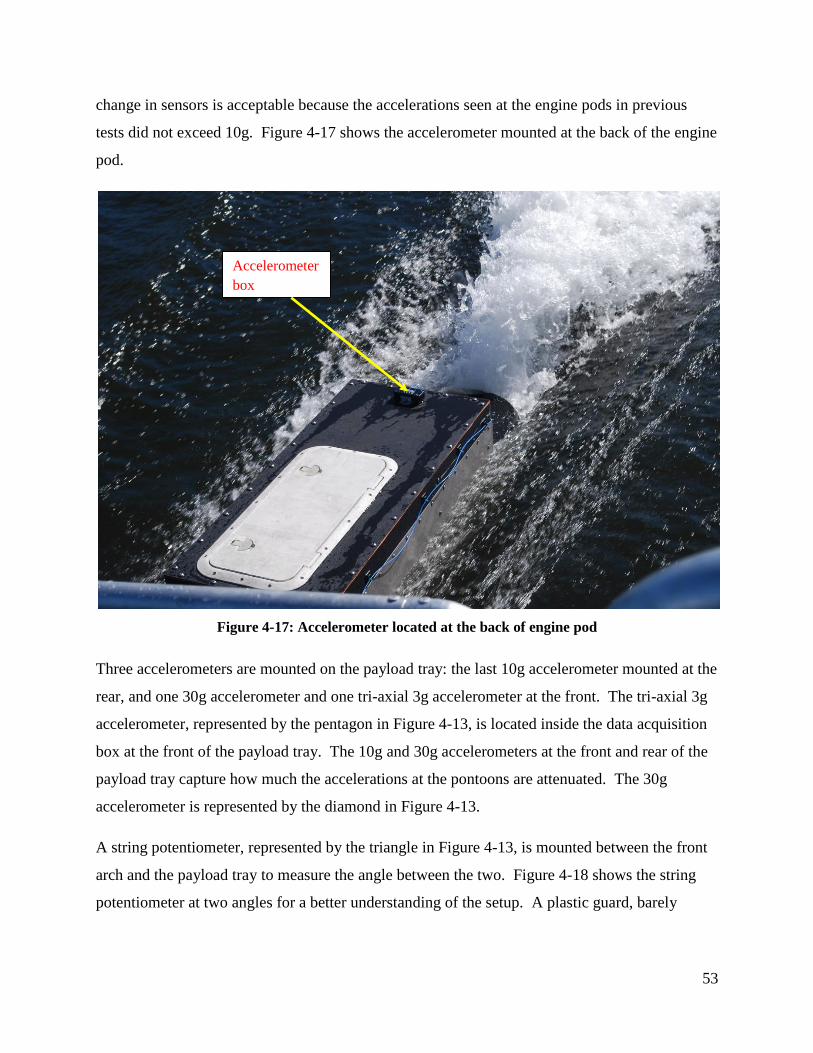
Figure 4-17: Accelerometer located at the back of engine pod .................................................... 53
Figure 4-18: String potentiometer between front arch and payload tray ...................................... 54
Figure 4-19: Potentiometer box setup ........................................................................................... 54
Figure 4-20: Potentiometer at suspension ..................................................................................... 55
Figure 4-21: Potentiometer at engine pod ..................................................................................... 55
Figure 4-22: GPS unit mounted on top of the data acquisition box.............................................. 56
Figure 4-23: DAQ box containing cRIO, tri-axial accelerometer, and DAQ battery ................... 57
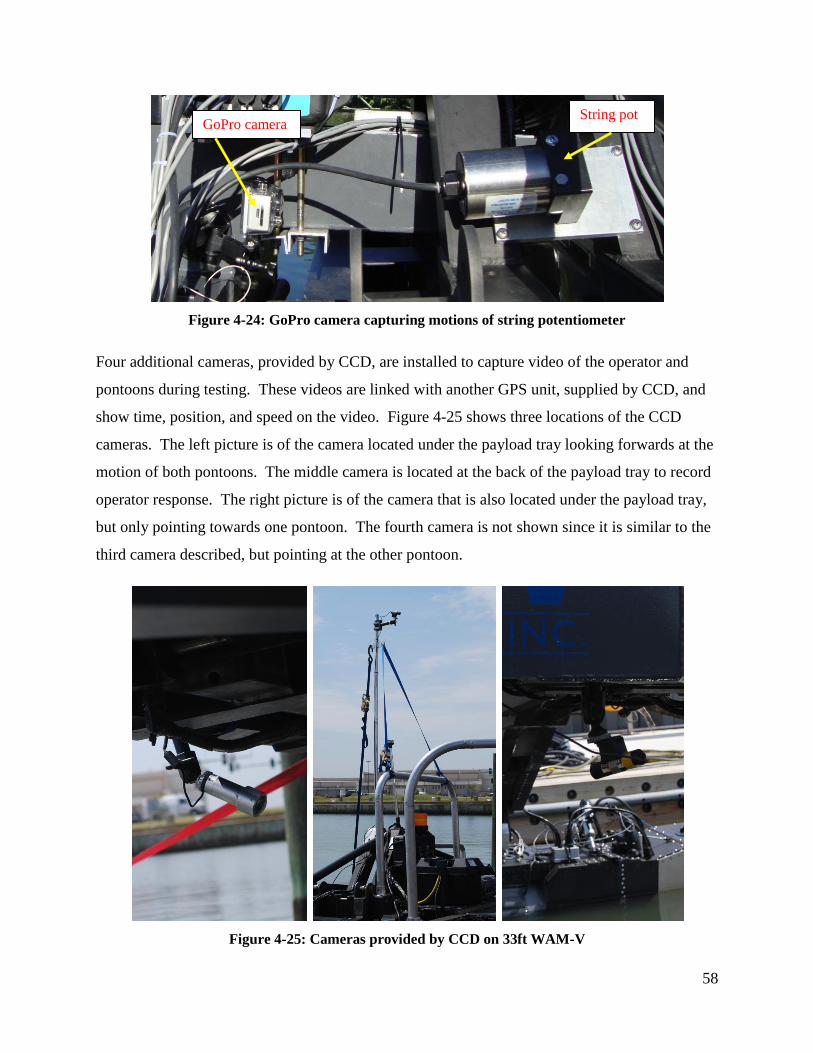
Figure 4-24: GoPro camera capturing motions of string potentiometer ....................................... 58
Figure 4-25: Cameras provided by CCD on 33ft WAM-V .......................................................... 58
Figure 4-26: Diagram of star pattern ............................................................................................ 59
Figure 4-27: Wave heights (left) and wind speed and direction (right) [10] ................................ 60
Figure 5-1: PDF of vertical accelerations during Run 1 ............................................................... 64
Figure 5-2: PDF of vertical accelerations during Run 2 ............................................................... 64
Figure 5-3: PDF of vertical accelerations during Run 3 ............................................................... 65
Figure 5-4: PDF of new damper percent compression during Run 1 ........................................... 66
Figure 5-5: PDF of new damper percent compression during Run 2 ........................................... 66
Page 10
x
Figure 5-6: PDF of new damper percent compression during Run 3 ........................................... 67
Figure 5-7: PDF of new suspension ball joint height of Run 2 .................................................... 68
Figure 5-8: PDF of vertical accelerations during stock suspension testing .................................. 70
Figure 5-9: PDF of vertical accelerations during new suspension testing .................................... 70
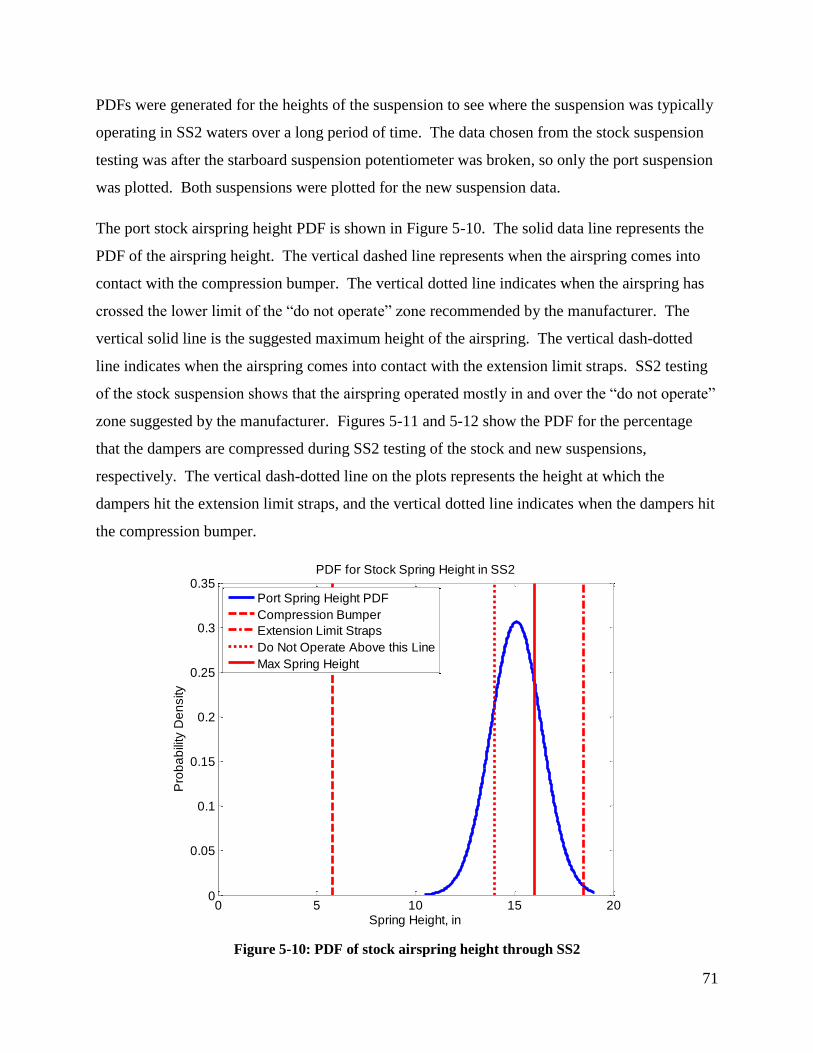
Figure 5-10: PDF of stock airspring height through SS2 ............................................................. 71
Figure 5-11: PDF of stock damper percent compression through SS2 ......................................... 72
Figure 5-12: PDF of new damper percent compression through SS2 .......................................... 72
Figure 5-13: PDF of stock suspension ball joint height through SS2 ........................................... 74
Figure 5-14: PDF of new suspension ball joint height through SS2............................................. 74
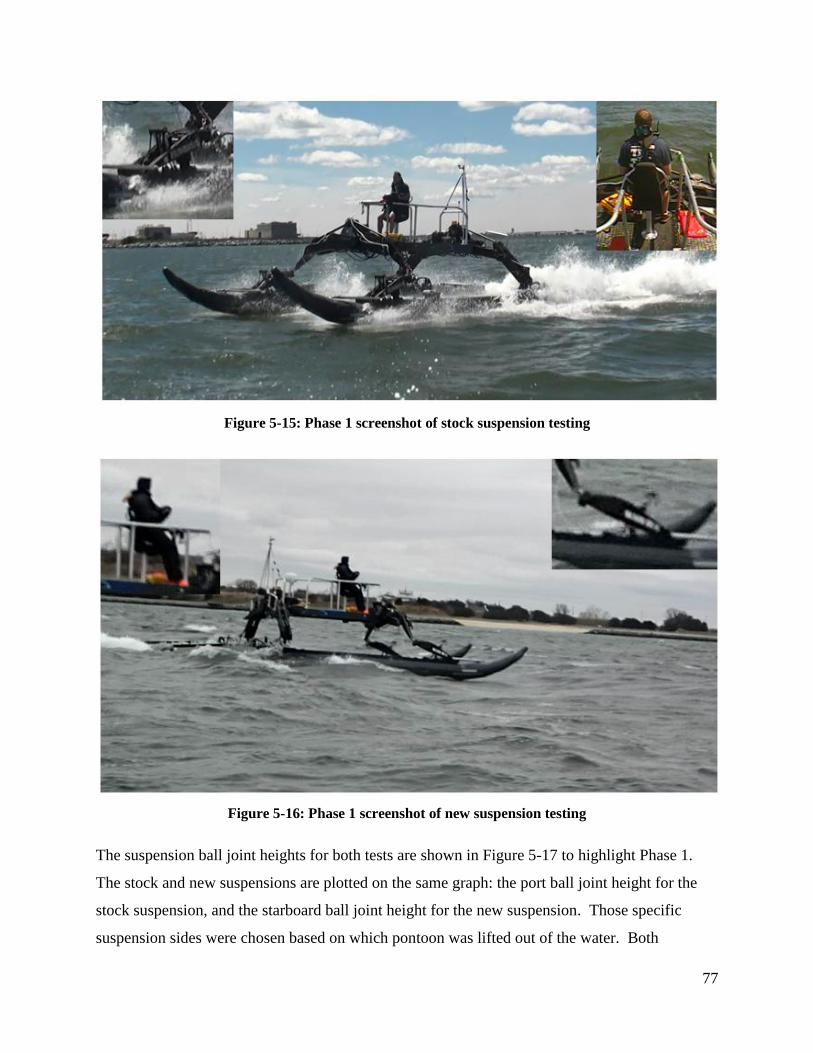
Figure 5-15: Phase 1 screenshot of stock suspension testing ....................................................... 77
Figure 5-16: Phase 1 screenshot of new suspension testing ......................................................... 77
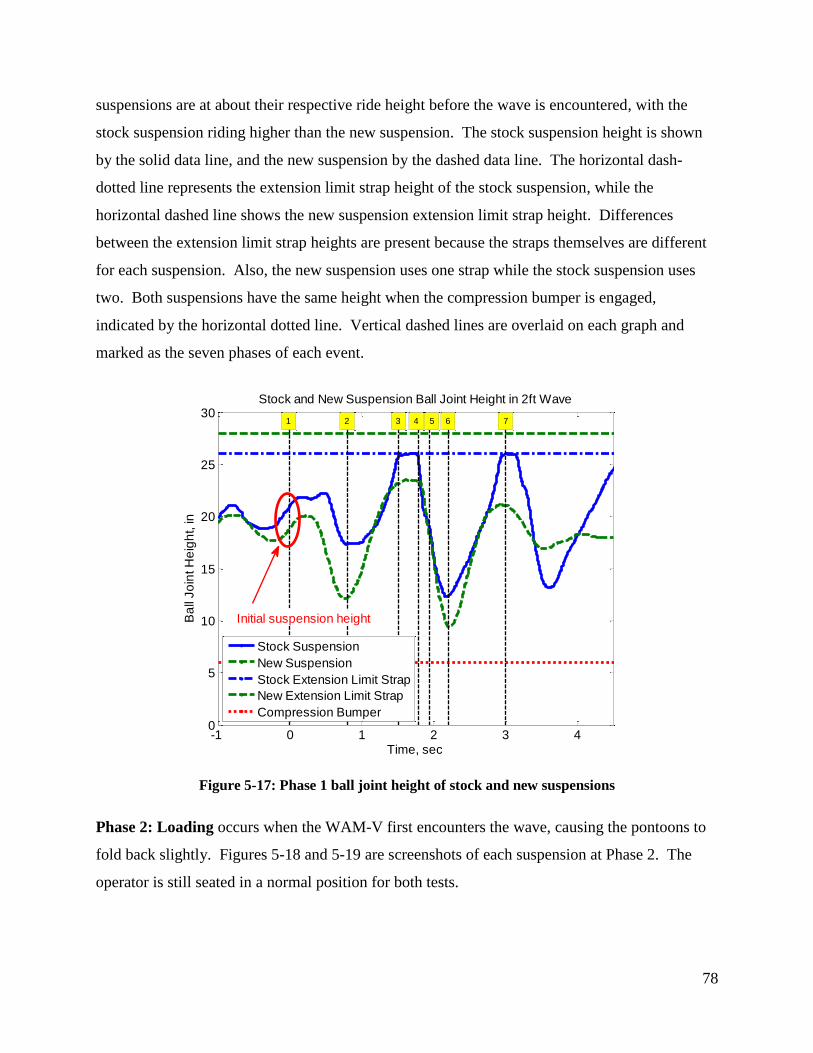
Figure 5-17: Phase 1 ball joint height of stock and new suspensions ........................................... 78
Figure 5-18: Phase 2 screenshot of stock suspension testing ....................................................... 79
Figure 5-19: Phase 2 screenshot of new suspension testing ......................................................... 79
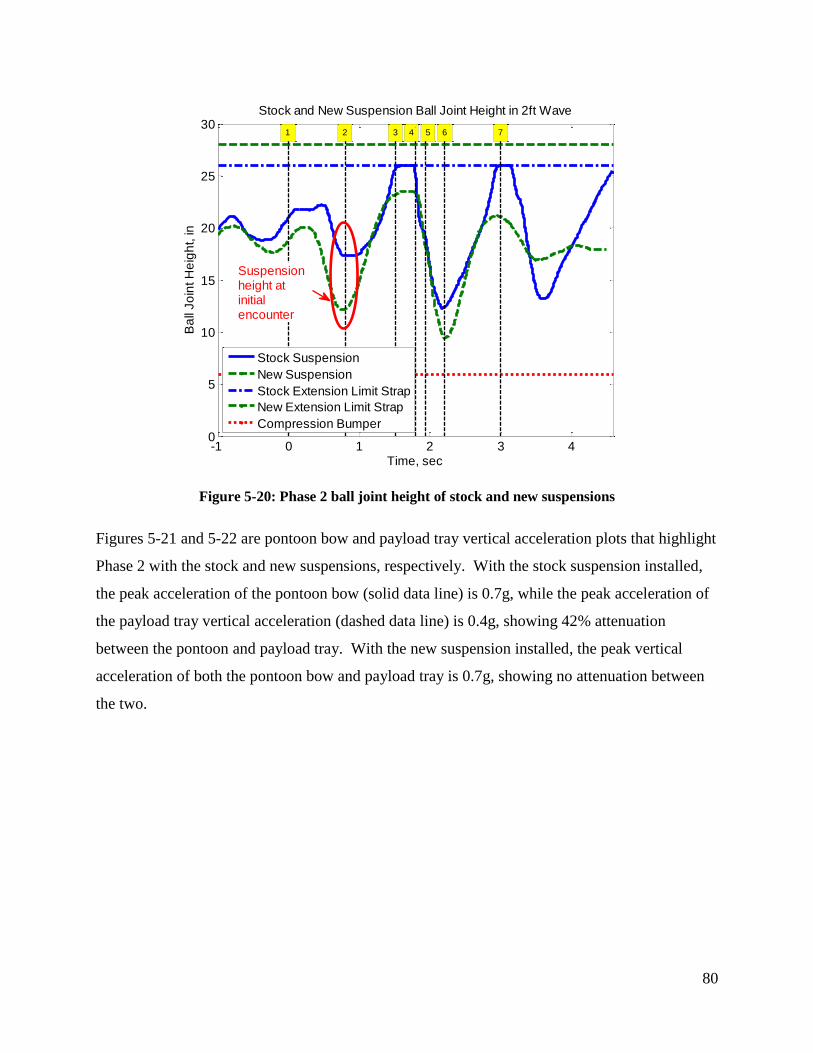
Figure 5-20: Phase 2 ball joint height of stock and new suspensions ........................................... 80
Figure 5-21: Phase 2 pontoon and payload vertical accelerations with stock suspension ............ 81
Figure 5-22: Phase 2 pontoon and payload vertical accelerations with new suspension.............. 81
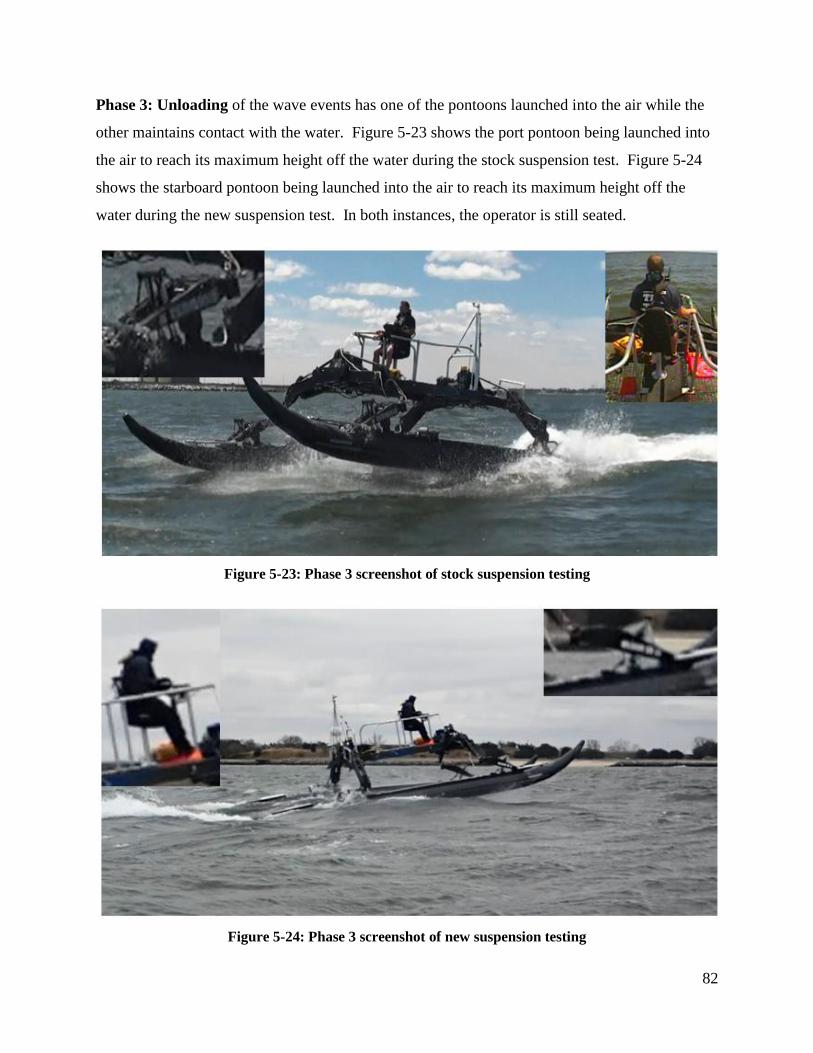
Figure 5-23: Phase 3 screenshot of stock suspension testing ....................................................... 82
Figure 5-24: Phase 3 screenshot of new suspension testing ......................................................... 82
Figure 5-25: Phase 3 ball joint height of stock and new suspensions ........................................... 83
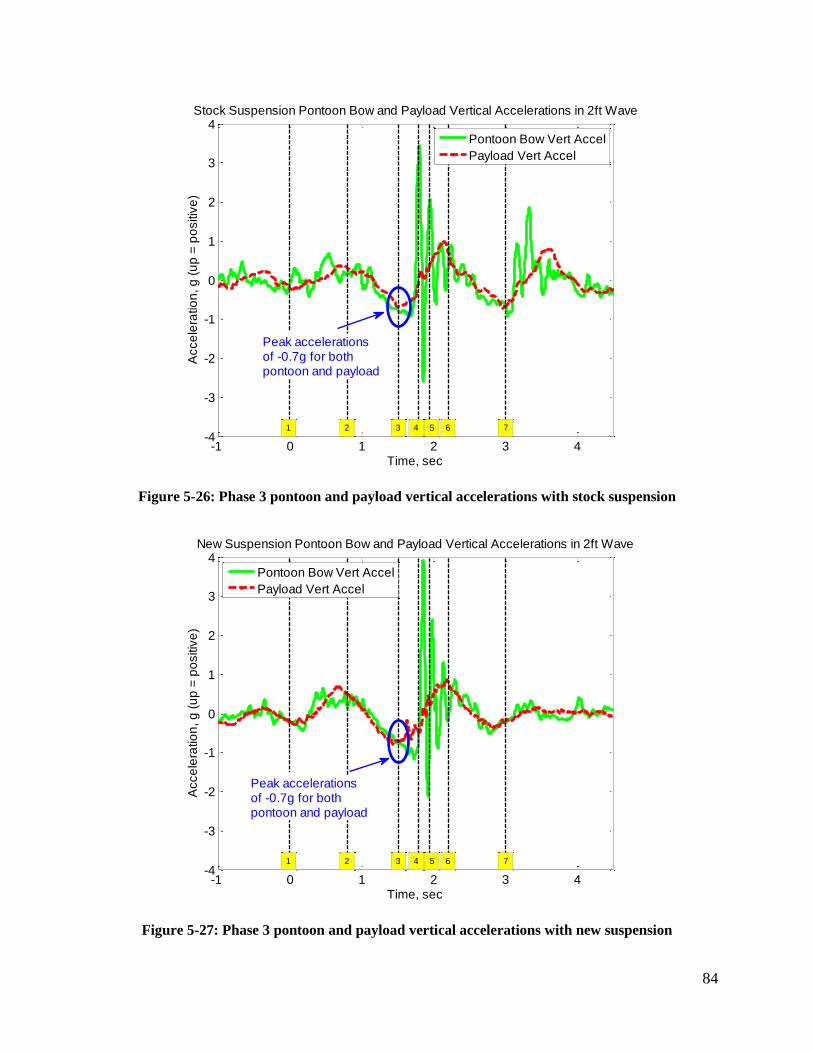
Figure 5-26: Phase 3 pontoon and payload vertical accelerations with stock suspension ............ 84
Figure 5-27: Phase 3 pontoon and payload vertical accelerations with new suspension.............. 84
Figure 5-28: Phase 4 screenshot of stock suspension testing ....................................................... 86
Figure 5-29: Phase 4 screenshot of new suspension testing ......................................................... 86
Page 11
xi
Figure 5-30: Phase 4 pontoon and payload vertical accelerations with stock suspension ............ 87
Figure 5-31: Phase 4 pontoon and payload vertical accelerations with new suspension.............. 87
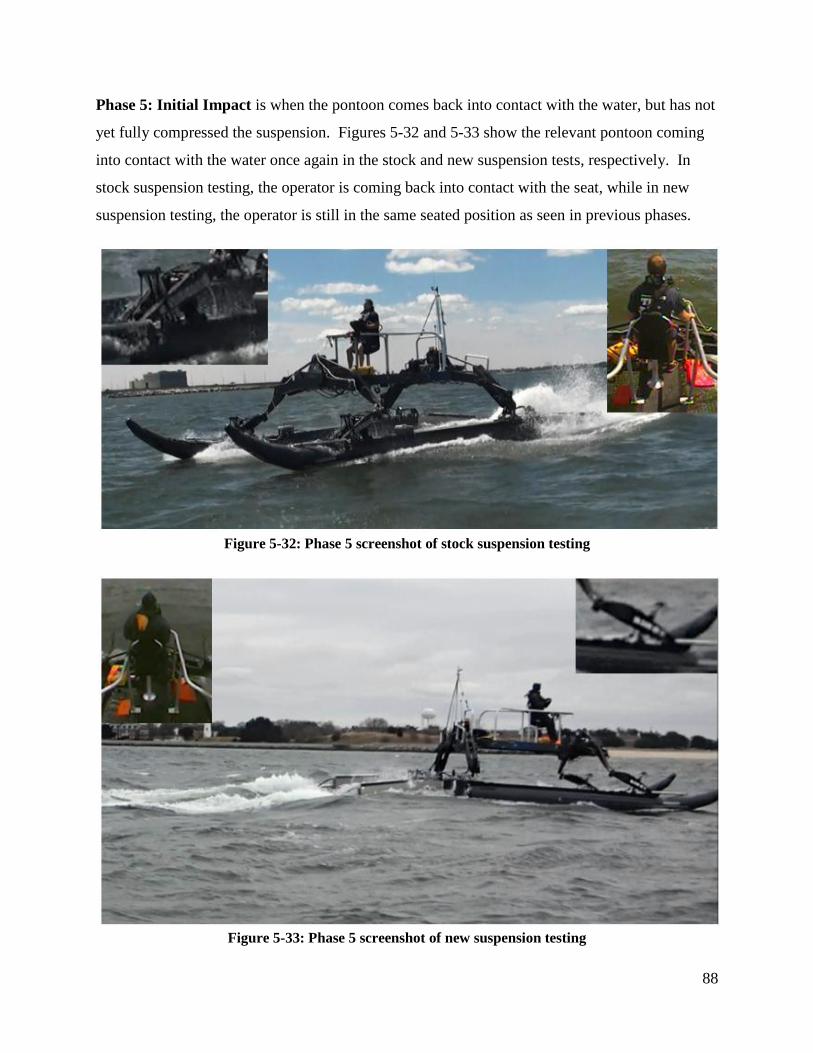
Figure 5-32: Phase 5 screenshot of stock suspension testing ....................................................... 88
Figure 5-33: Phase 5 screenshot of new suspension testing ......................................................... 88
Figure 5-34: Phase 5 pontoon bow and stern vertical accelerations with stock suspension ......... 90
Figure 5-35: Phase 5 pontoon bow and stern vertical accelerations with new suspension........... 90
Figure 5-36: Phase 5 pontoon and payload vertical accelerations with stock suspension ............ 91
Figure 5-37: Phase 5 pontoon and payload vertical accelerations with new suspension.............. 91
Figure 5-38: Phase 6 screenshot of stock suspension testing ....................................................... 92
Figure 5-39: Phase 6 screenshot of new suspension testing ......................................................... 92
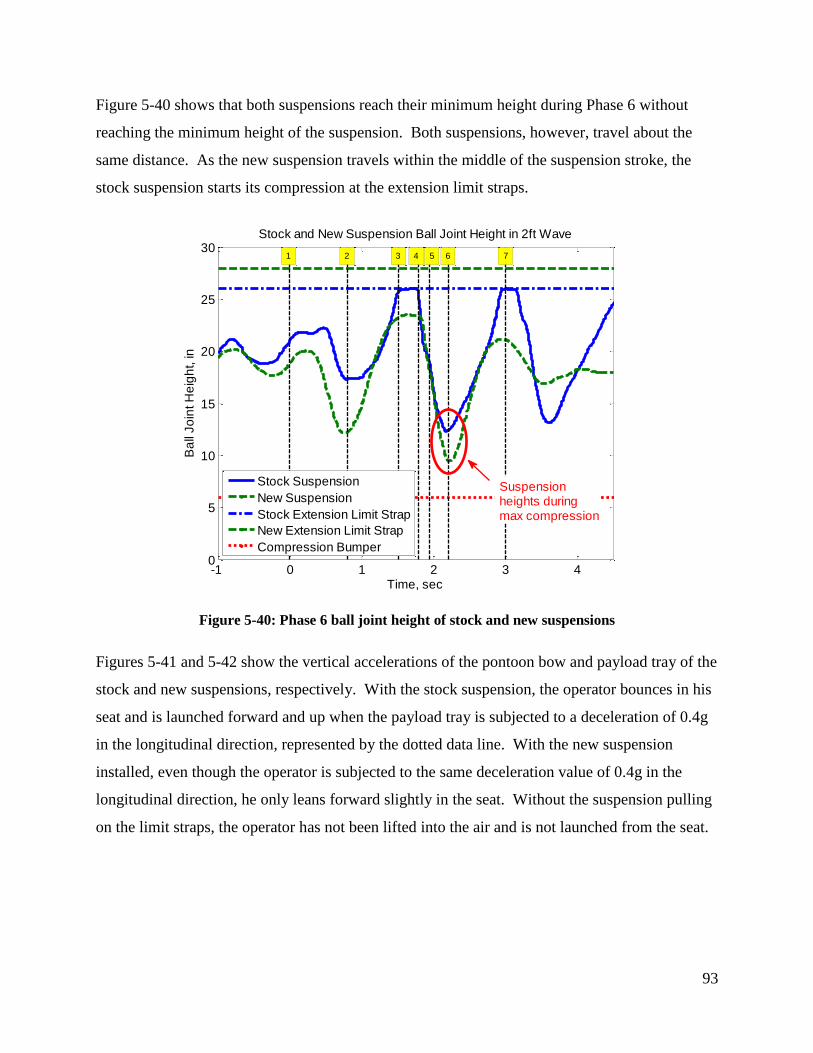
Figure 5-40: Phase 6 ball joint height of stock and new suspensions ........................................... 93
Figure 5-41: Phase 6 pontoon and payload accelerations with stock suspension ......................... 94
Figure 5-42: Phase 6 pontoon and payload accelerations with new suspension........................... 94
Figure 5-43: Phase 7 screenshot of stock suspension testing ....................................................... 95
Figure 5-44: Phase 7 screenshot of new suspension testing ......................................................... 95
Figure 5-45: Phase 1 screenshot of stock suspension testing ....................................................... 98
Figure 5-46: Phase 1 screenshot of new suspension testing ......................................................... 98
Figure 5-47: Phase 1 ball joint height of stock and new suspensions ........................................... 99
Figure 5-48: Phase 2 screenshot of stock suspension testing ..................................................... 100
Figure 5-49: Phase 2 screenshot of new suspension testing ....................................................... 100
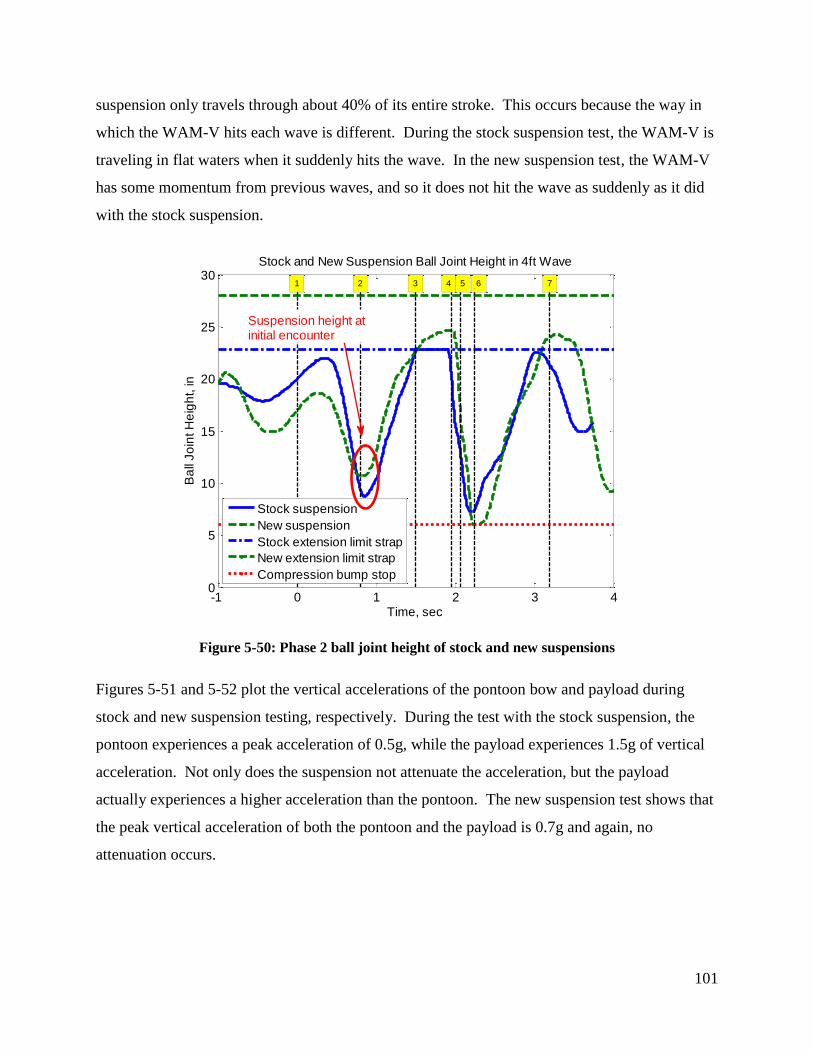
Figure 5-50: Phase 2 ball joint height of stock and new suspensions ......................................... 101
Figure 5-51: Phase 2 pontoon and payload vertical accelerations with stock suspension .......... 102
Figure 5-52: Phase 2 pontoon and payload vertical accelerations with new suspension............ 102
Figure 5-53: Phase 3 screenshot of stock suspension testing ..................................................... 103
Page 12
xii
Figure 5-54: Phase 3 screenshot of new suspension testing ....................................................... 103
Figure 5-55: Phase 3 ball joint height of stock and new suspensions ......................................... 104
Figure 5-56: Phase 3 pontoon and payload vertical accelerations with stock suspension .......... 105
Figure 5-57: Phase 3 pontoon and payload vertical accelerations with new suspension............ 105
Figure 5-58: Phase 4 screenshot of stock suspension testing ..................................................... 107
Figure 5-59: Phase 4 screenshot of new suspension testing ....................................................... 107
Figure 5-60: Phase 4 pontoon and payload vertical accelerations with stock suspension .......... 108
Figure 5-61: Phase 4 pontoon and payload vertical accelerations with new suspension............ 108
Figure 5-62: Phase 5 screenshot of stock suspension testing ..................................................... 109
Figure 5-63: Phase 5 screenshot of new suspension testing ....................................................... 109
Figure 5-64: Phase 5 pontoon bow and stern vertical accelerations with stock suspension ....... 111
Figure 5-65: Phase 5 pontoon bow and stern vertical accelerations with new suspension......... 111
Figure 5-66: Phase 5 pontoon and payload vertical accelerations with stock suspension .......... 112
Figure 5-67: Phase 5 pontoon and payload vertical accelerations with new suspension............ 112
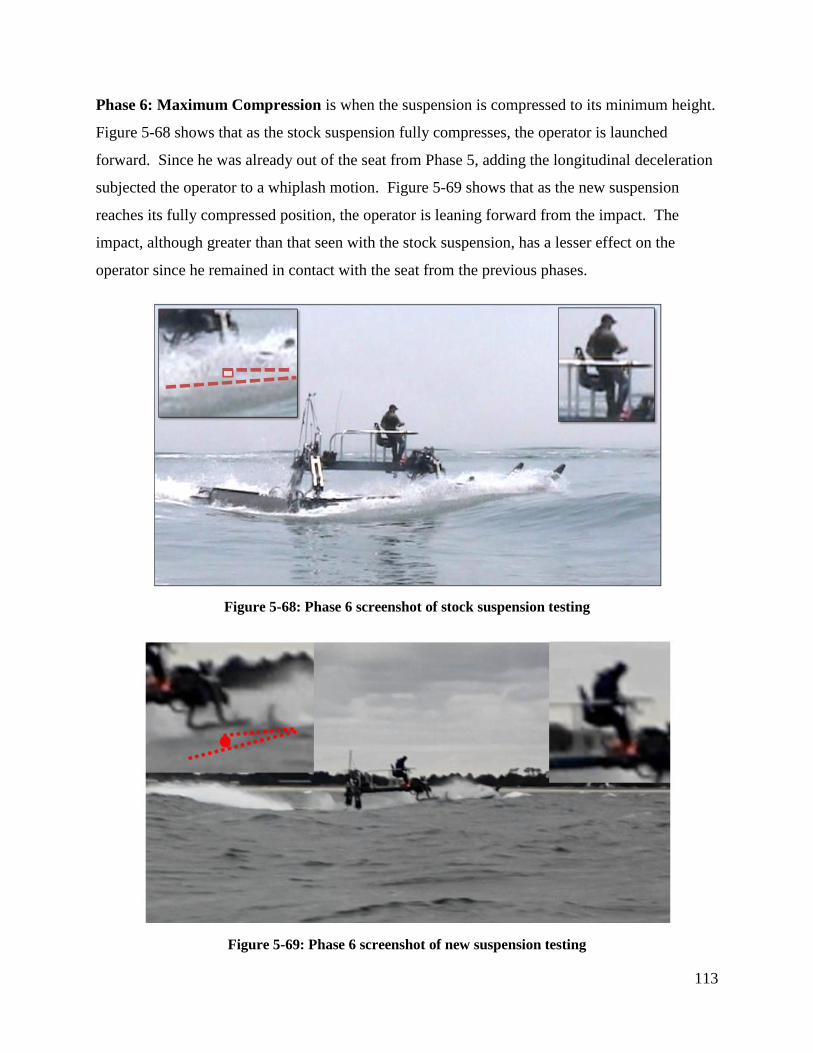
Figure 5-68: Phase 6 screenshot of stock suspension testing ..................................................... 113
Figure 5-69: Phase 6 screenshot of new suspension testing ....................................................... 113
Figure 5-70: Phase 6 ball joint height of stock and new suspensions ......................................... 114
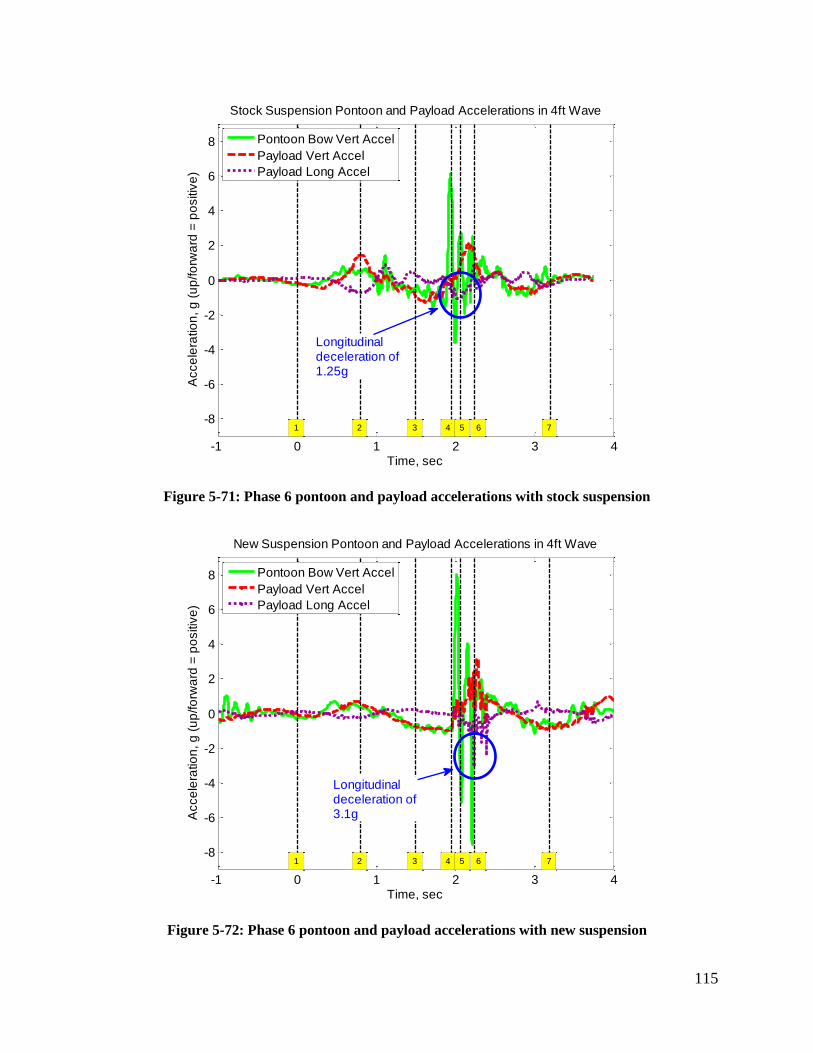
Figure 5-71: Phase 6 pontoon and payload accelerations with stock suspension ....................... 115
Figure 5-72: Phase 6 pontoon and payload accelerations with new suspension......................... 115
Figure 5-73: Phase 7 screenshot of stock suspension testing ..................................................... 116
Figure 5-74: Phase 7 screenshot of new suspension testing ....................................................... 116
Page 13
xiii
List of Tables
Table 3-1: Pressure and Force Readings between Airspring Tests ............................................... 24
Table 3-2: Corner Weights of Entire 33ft WAM-V in Pounds ..................................................... 28
Table 3-3: Weight Breakdown of 33ft WAM-V by Component .................................................. 30
Table 3-4: Suspension Sprung Weight in Pounds......................................................................... 32
Table 3-5: Minimum and Maximum Damping Ratios with a 525lb Load ................................... 36
Table 4-1: Legs of Star Pattern ..................................................................................................... 60
Table 5-1: Available Data from Testing ....................................................................................... 62
Table 5-2: Average, Minimum, and Maximum Percent of Damper Compression ....................... 67
Table 5-3: Testing Conditions in Sea State 2 Waters ................................................................... 69
Table 5-4: Pontoon Maximum and Minimum Accelerations ....................................................... 89
Table 5-5: Attenuation between Pontoon and Payload Tray ........................................................ 89
Table 5-6: Pontoon Maximum and Minimum Accelerations ..................................................... 110
Table 5-7: Attenuation between Pontoon and Payload Tray ...................................................... 110
Page 14
1
Chapter 1 Introduction
Wave-Adaptive Modular Vessel (WAM-V) technology was developed by Marine Advanced
Research, Inc. (M.A.R.) to use the advantages of catamarans in conjunction with suspension
systems typically found on road vehicles to increase stability of the vessel and reduce the
magnitude of the accelerations at the payload tray. The WAM-V concept uses a suspension with
ball joints located between the payload tray and front arch to mitigate the motions of the
pontoons, letting the front arch move independently from the payload tray. The suspension
systems also move independently of each other, letting one pontoon move without influence
from the other. The Center for Vehicle Systems and Safety (CVeSS) at Virginia Tech (VT) and
the Combatant Craft Division (CCD) of the Naval Surface Warfare Center, Carderock Division
(NSWCCD) are working together in testing efforts to capture the dynamics of the 33ft WAM-V.
Figure 1-1 shows the 33ft WAM-V, the third generation WAM-V design.
Figure 1-1: 33ft WAM-V
The United States Navy has a need for versatile vessels that can perform many different kinds of
mission objectives. With a relatively large payload tray given the size of the vessel, the WAM-V
is capable of transporting a number of items at one time. One such mission for the WAM-V is to
transport unmanned vehicles closer to their destination before the vehicles take off using their
own fuel supply, thus lengthening the mission time of the individual vehicles. In order to ensure
that the unmanned vehicles arrive at the destination in a condition to function properly, the
Page 15
2
WAM-V needs to be capable of mitigating the shocks from the ocean to the payload tray. Large
accelerations can easily be transmitted to the payload tray with an inadequate suspension system,
potentially damaging the unmanned vehicles onboard. The WAM-V is also capable of retrieving
such vehicles upon mission completion.
With a low draft and jet propulsion system, the later generations of WAM-V can act as a landing
craft. Landing crafts are used to transport personnel and supplies to areas where a larger ship
cannot dock [15]. Typically, they are crafts that are able to pull up to the land, then reverse and
return to open waters without getting stuck. WAM-Vs outfitted with jet propulsion systems will
be able to carry out landing craft missions, delivering supplies or unmanned ground vehicles to
the shore.
The WAM-V platform also has the capability of loitering for a prolonged period of time for
surveillance or data-collecting purposes. The WAM-V can be outfitted with a data acquisition
system to survey an area before personnel are deployed, or to simply collect wave data. These
data acquisition systems can be powered by a generator located on the payload tray or by using
energy harvesting technologies. Energy harvesting technologies are being developed at CVeSS
to utilize the movement seen in suspension systems to generate energy [9]. The movement of the
WAM-V suspension, even when standing still, can be used to generate the power to run auxiliary
systems.
1.1 Motivation
The motivation for this research is to optimize the suspension in order to reduce the shocks and
accelerations experienced at the payload tray and thereby improve payload and operator comfort.
With the possible objective of delivering unmanned vessels to their mission area, the WAM-V
must be capable of reaching the mission area with the vessels ready for deployment. Shock-
mitigating seats are used onboard high speed crafts to reduce the shocks to the personnel
(soldiers, Marines, etc.) during transport [8]. Just as the shock-mitigating seat reduces the
amount of shock to the personnel, the suspended payload tray reduces the shock transmission to
the payload.
Page 16
3
Regulations state that all prototype vessels that are undergoing testing, even those meant to be
unmanned, must have at least one personnel onboard the vessel. The suspension needs to be
optimized to provide the most attenuation between the pontoons and where the operator is
situated, the payload tray. The remote controls used to pilot the WAM-V require two hands,
such that the operator has to remove his hands from the remote controls to brace against impact.
The role of the suspension is to mitigate enough of the shock seen at the waves so the operator
has a relatively smooth ride while operating the WAM-V.
1.2 Objectives
The objectives of this project are to:
1) characterize the 33ft WAM-V stock suspension,
2) suggest and implement new suspension components based on characterization of the
stock suspension,
3) characterize the new suspension components,
4) conduct sea trials with both suspensions and compare the results, and
5) provide recommendations for future testing of the 33ft WAM-V.
1.3 Approach
In-house testing of the stock suspension system is conducted to characterize the stock suspension
of the 33ft WAM-V. Based on the characterization of the stock suspension, new suspension
components are selected to better fit the needs of the 33ft WAM-V. Testing of the WAM-V with
the stock suspension is conducted at sea, followed by testing of the new suspension. The tests
include running the WAM-V in Sea State 1 (SS1) and Sea State 2 (SS2) conditions. The data is
analyzed to compare the performance of the WAM-V with the two different suspensions. Based
on the analysis, recommendations are made for further studies of the 33ft WAM-V suspension.
1.4 Contribution
This study has contributed to the validation of a multi-body dynamics model of WAM-V
technology under development at CVeSS [1, 2, 12]. This model, which is not within the scope
of this thesis, is being designed to be scalable for various sizes of WAM-Vs. For example, with
Page 17
4
differing pontoon diameters, vessel length and beam, and suspension characteristics, the multi-
body dynamics model will be able to simulate the response of the WAM-V without having to
build and test an actual WAM-V with those characteristics.
By choosing suspension components that are better suited for the 33ft WAM-V, the performance
of the vessel can be greatly improved. Choosing suspension components that can be easily
changed and adjusted provides a large range of suspension characteristics that can contribute to
fully validating the WAM-V model.
1.5 Thesis Organization
This document includes six chapters. Chapter 2 discusses the background of the WAM-V
concept, as well as what is typically found in a conventional road vehicle suspension system.
Chapter 3 details the tests that were conducted to characterize the stock suspension and how the
new suspension components are chosen from the results of those tests. Chapter 4 describes the
test setup of the 33ft WAM-V, including details of the instrumentation, test patterns conducted,
and sea trial setup. Chapter 5 discusses the analysis of the data collected during testing, and
Chapter 6 summarizes the findings of the research and ends with recommendations for future
work towards improving future WAM-V designs.
Page 18
5
Chapter 2 Background Information
The purpose of this chapter is to provide background information on the three generations of the
WAM-V and on conventional suspension systems used in road vehicles.
2.1 Wave-Adaptive Modular Vessels
A WAM-V is a catamaran vessel outfitted with ball joints and suspension systems to mitigate the
shocks and accelerations experienced at the pontoons from being transmitted to the operator.
The suspension systems, like those typically found in road vehicles, absorb and dissipate the
shocks experienced due to sea conditions, thereby reducing the amount of shock and
accelerations experienced by the operator of the vessel. The third generation WAM-V design,
the 33ft WAM-V, is developed based on the analysis conducted from testing the first two WAM-
V generations, the 100ft Proteus and the 12ft unmanned surface vessel (USV).
2.1.1 First Generation: 100ft Proteus
The first generation WAM-V, shown in Figure 2-1, is the 100ft Proteus. Proteus is equipped
with two suspension points connecting each pontoon to two arches for a total of four suspension
points. Two arches, one in the front and one in the rear, connect the suspension points to the
payload tray and cabin. The main ball joint is situated between the front arch and the payload
tray and cabin.
Figure 2-1: First generation WAM-V, 100ft Proteus
Front arch Rear arch
Suspension
Suspension
Control room
Pontoon
Engine pod
Page 19
6
By having the front arch connected to the payload tray and cabin with a ball joint, the two
structures can move independently from each other, thus limiting the roll seen in the payload tray
and cabin. The engine pods at the rear of both pontoons are not rigidly connected to the
pontoons, but are hinged so that they can move independently from the pontoons. By having the
hinged connection, the engine pods can stay in contact with the water as Proteus travels through
the waves.
Each suspension point of Proteus consists of leaf springs to mitigate the shocks from the
pontoons to the payload tray and cabin. The suspension does not include a damper, as shown in
Figure 2-2.
Figure 2-2: 100ft Proteus suspension
Due to the softening of the suspension, the Proteus suspension is prone to bottoming out in
compression, causing large impact loads at the crew compartment [6]. Proteus has been
scrapped after serving its useful life.
2.1.2 Second Generation: 12ft USV
The second generation of the WAM-V concept is the 12ft USV, shown in Figure 2-3. This
vessel is significantly smaller than the first generation Proteus and is controlled via remote
control with the possibility of autonomous operation. The 12ft USV has almost the same
components as Proteus but with some changes based on what was learned from testing Proteus.
Suspension rocker arm
Leaf spring
Page 20
7
One thing determined from Proteus testing is that the two connection points at the rear should not
be suspended for better roll stability. Instead of having four suspension points, the 12ft USV
only has two suspension points at the front, and joints at the two rear points allowing rotation
about the transverse and vertical directions. The payload tray is still connected to the front arch
through a ball joint and rigidly connected to the rear arch.
Figure 2-3: Second generation WAM-V, 12ft USV
The suspension is also slightly altered from Proteus by adding an airspring, to increase the
amount of restoring force, in addition to a leaf spring. However, no damper is incorporated into
the 12ft USV suspension design. Another change to the USV suspension is the addition of a ball
joint between the front arch and suspension, allowing independent movement between the two
components [6]. Figure 2-4 shows the 12ft USV suspension system.
Figure 2-4: 12ft USV suspension
Suspension Payload tray
Pontoon
Engine pod
Rear arch
Front arch
Leaf spring
Suspension rocker arm
Airspring
Ball joint
Page 21
8
Since no damper is incorporated in the 12ft USV as well, analysis is done to approximate the
amount of damping seen that is generated by non-linear friction damping of the leaf spring and
airspring present. A linear rate of 30N-s/m is chosen as the baseline damping rate for the 12ft
USV, even though the damping present is non-linear [6]. The third generation WAM-V
suspension is modified to have one airspring and two dampers.
2.2 Third Generation: 33ft WAM-V
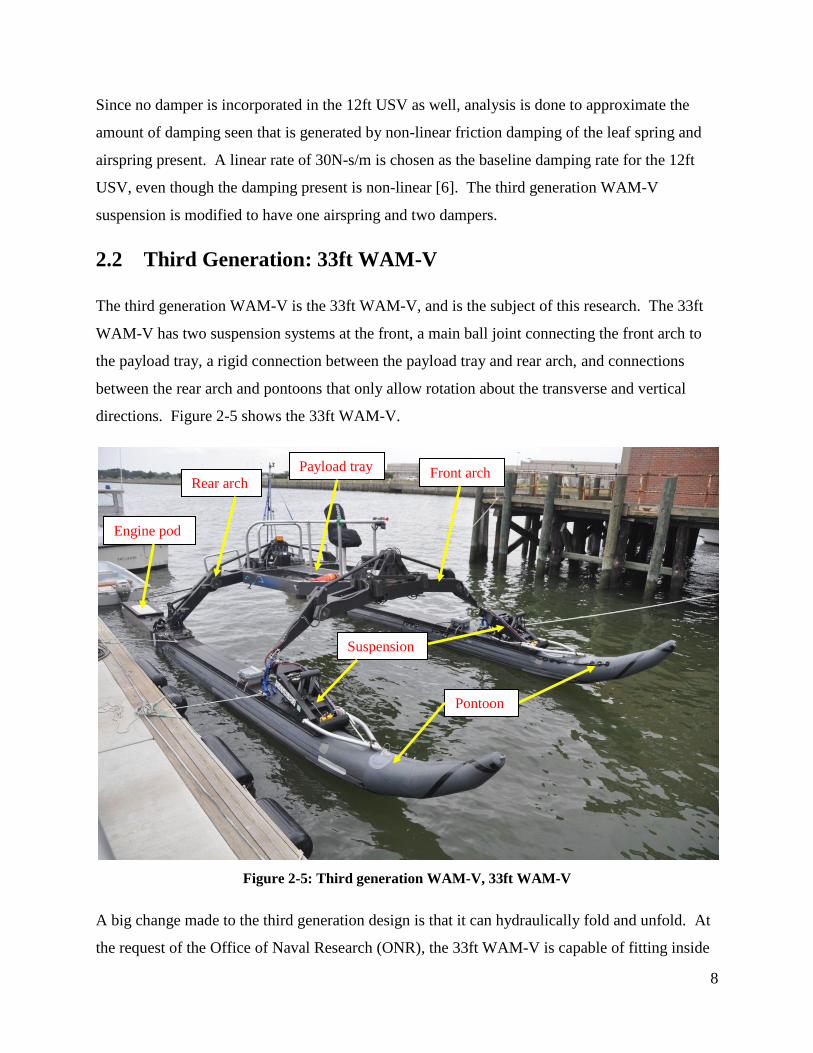
The third generation WAM-V is the 33ft WAM-V, and is the subject of this research. The 33ft
WAM-V has two suspension systems at the front, a main ball joint connecting the front arch to
the payload tray, a rigid connection between the payload tray and rear arch, and connections
between the rear arch and pontoons that only allow rotation about the transverse and vertical
directions. Figure 2-5 shows the 33ft WAM-V.
Figure 2-5: Third generation WAM-V, 33ft WAM-V
A big change made to the third generation design is that it can hydraulically fold and unfold. At
the request of the Office of Naval Research (ONR), the 33ft WAM-V is capable of fitting inside
Rear arch Front arch Payload tray
Engine pod
Suspension
Pontoon
Page 22
9
an 8 foot x 20 foot x 8 foot shipping container. With arches that can fold and unfold
hydraulically, the width of the 33ft WAM-V can be reduced from 16 feet to 8 feet. By deflating
the pontoon bows and rotating the engine pods underneath the payload tray, the length of the 33ft
WAM-V can be reduced from 33 feet to 19 feet. Figure 2-5 showed the WAM-V fully unfolded,
while Figure 2-6 shows the WAM-V on its trailer in the folded configuration; however, the
pontoon bows have not been deflated and folded back, so the WAM-V remains a little longer
than 19 feet.
Figure 2-6: 33ft WAM-V folded up on its trailer
Another big change made to the 33ft WAM-V is the suspension system. Instead of having leaf
springs and airsprings like the 12ft USV, the 33ft WAM-V uses one airspring and two dampers
for each suspension. Figure 2-7 shows the 33ft WAM-V suspension.
Page 23
10
Figure 2-7: 33ft WAM-V suspension
The remainder of this thesis is concentrated on the characterization and improvement of the 33ft
WAM-V suspension system.
2.3 Conventional Road Vehicle Suspensions
While conventional boats do not have suspension systems, the WAM-V concept attempts to use
them to their advantage. Since the suspension is quite similar to road vehicles, a similar
approach is taken to characterize the WAM-V suspension.
A conventional vehicle suspension is comprised of a spring and damper attached between the
sprung and unsprung weight of the vehicle. The sprung weight is usually comprised of all the
components above the suspension, while the unsprung weight is comprised of everything below
the suspension [7]. Figure 2-8 shows a schematic of a suspension system, which is represented
by a quarter car model.
Page 24
11
Figure 2-8: Quarter car model representing conventional vehicle suspension system [7]
In conventional road vehicle suspension systems, the spring and damper characteristics
determine the effectiveness of the suspension. Based on the amount of weight the suspension
must support at the suspension corner, a spring of the correct size can be chosen. The spring rate
is determined by the suspended weight and by how much travel is available [13]. Equation (2-1)
shows that the minimum spring rate is determined by those two factors:
max
max
minu
gMk
(2-1)
where mink is the minimum allowable spring rate in lb/ft, maxM is the maximum load on that
suspension corner in slugs, g is the acceleration due to gravity in ft/s2, and maxu is half the
maximum amount of travel allowed in feet. maxu is constrained this way to ensure that the
spring does not deflect more than half of the maximum value from the load alone [13].
A conventional road vehicle suspension typically has a higher damping value in extension than
in compression. A common compression/extension damping ratio is 30/70 for passenger cars,
but can also vary from 20/80 to 50/50. With motorcycles, the ratios are even more skewed
towards the extension side, with ratios of 20/80 to 5/95 [4].
Since there are typically two different values of damping with a conventional road vehicle
suspension, the average of the total damping is taken to determine the total damping of the
system. A typical passenger vehicle will have an average total damping ratio, , of 0.2 to 0.4,
Page 25
12
while competition cars will have higher values of 0.4 to 1.0 [4]. Damping ratio is determined by
Equation (2-2):
km
c
2 (2-2)
where is the damping ratio, c is the damping rate in lb-s/in, k is the spring rate in lb/in, and
m is the mass in slugs.
Figure 2-9 shows the effect of different damping ratios over time.
Figure 2-9: Various damping ratios over time [3]
Under-damped damping values, 10 , will cause the system to oscillate repeatedly before
finally settling down, with values close to zero oscillating more than values approaching 1. A
critically damped ratio, 1 , returns the system back to its original position in the shortest
amount of time without any oscillation or overshoot. A damping ratio of 2 is over-damped
and will return to the original position without overshoot; however, it will take a longer time to
do so than the critically damped case [3].
More damping in extension is usually desired due to the fact that during compression, energy is
stored in the spring of the suspension system. The damping value in extension is there to
dissipate the energy that has been stored in the spring. Too little damping in compression leads
Page 26
13
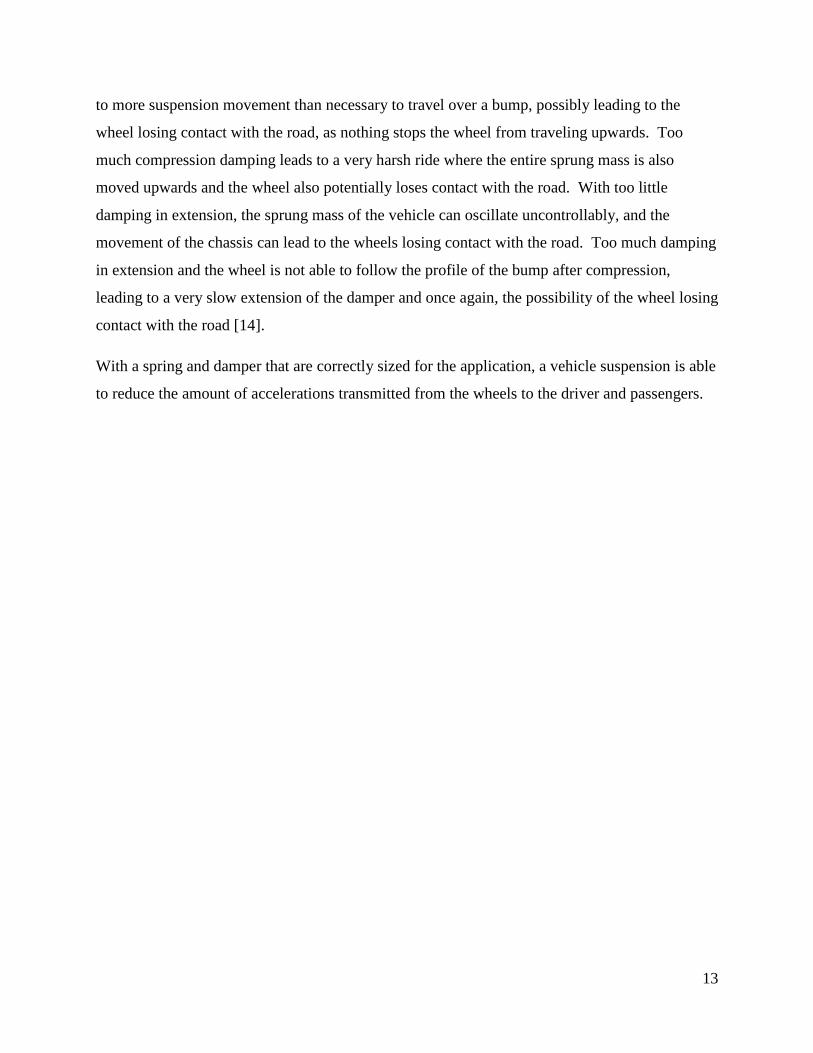
to more suspension movement than necessary to travel over a bump, possibly leading to the
wheel losing contact with the road, as nothing stops the wheel from traveling upwards. Too
much compression damping leads to a very harsh ride where the entire sprung mass is also
moved upwards and the wheel also potentially loses contact with the road. With too little
damping in extension, the sprung mass of the vehicle can oscillate uncontrollably, and the
movement of the chassis can lead to the wheels losing contact with the road. Too much damping
in extension and the wheel is not able to follow the profile of the bump after compression,
leading to a very slow extension of the damper and once again, the possibility of the wheel losing
contact with the road [14].
With a spring and damper that are correctly sized for the application, a vehicle suspension is able
to reduce the amount of accelerations transmitted from the wheels to the driver and passengers.
Page 27
14
Chapter 3 Suspension Characteristics
This chapter covers the characterization of the 33ft WAM-V suspension. The stock suspension
components are characterized, followed by describing in-house tests that were conducted to help
choose new suspension components better suited for the 33ft WAM-V. The chapter ends with
choosing and characterizing the new suspension components.
3.1 Stock Suspension Description
The 33ft WAM-V arrived at CVeSS with a suspension comprised of three components within a
suspension rocker arm: one airspring and two monotube dampers. The stock airspring is
manufactured by Firestone, and the stock dampers by Fox Racing Shox. In addition to the
suspension components, two limit straps are positioned in front of the dampers in order to keep
the suspension from extending too far upwards, which could potentially damage the suspension
components. The stock suspension setup is shown in Figure 3-1 with all its components. The
individual components, dampers and airspring, are shown in Figures 3-2 and 3-3, respectively.
Figure 3-1: 33ft WAM-V stock suspension
Compression
bumper
Ball joint
Suspension rocker arm Damper
Extension limit
strap Airspring
Page 28
15
Figure 3-2: 33ft WAM-V stock dampers
Figure 3-3: 33ft WAM-V stock airspring
The motion ratios between the suspension ball joint, airspring position, and stock damper
position are found by measuring the heights of each suspension component. Figure 3-4 shows a
drawing of the suspension. The ball joint height, B, is measured from the top of the ski to the
middle of the suspension ball joint. The airspring height, A, is measured from the base of the
airspring, an angled platform, to the top of the airspring. The damper height, D, is determined by
measuring the distance from the lower bump stop of the damper to the bottom of the damper
body.
Upper mount
Lower mount
Upper mount
Lower mount
Air bag
Page 29
16
Figure 3-4: Drawing of the measurements taken to determine motion ratios
The motion ratio between ball joint and airspring position is 0.515, which means that for every
inch the ball joint moves, the component at the airspring position moves 0.515 inches. The
motion ratio between ball joint and stock damper position is 0.359. Knowing these motion ratios
helped calculate the equivalent spring and damping rates at the ball joint, seen in the later
sections of this chapter.
Figures 3-5 and 3-6 show the linear relationships between ball joint height and airspring and
damper heights for the stock suspension, respectively. The equations shown on the figures are
used to calculate the equivalent spring rates and damping values at the suspension ball joint. The
suspension contacts the compression bumper at a ball joint height of 6 inches.
B A
D
Ball joint
Sprung mass
Airspring Damper
Page 30
17
Figure 3-5: Relationship between ball joint and stock airspring height
Figure 3-6: Relationship between ball joint and stock damper height
y = 0.5156x + 5.1563 R² = 1
0
2
4
6
8
10
12
14
16
18
0 5 10 15 20 25
Airspring P
ositio
n H
eig
ht, in
Ball Joint Height, in
Ball Joint - Stock Airspring Relationship
y = 0.3594x - 1.1563 R² = 1
0
1
2
3
4
5
6
7
8
0 5 10 15 20 25
Sto
ck D
am
per
Positio
n H
eig
ht, in
Ball Joint Height, in
Ball Joint - Stock Damper Relationship
Page 31
18
3.2 Stock Damper Characteristics
The stock dampers were not supplied with a data sheet detailing the damping curves. With no
way of identifying the stock dampers and their corresponding damping characteristics, the two
dampers on the starboard suspension were removed and tested in a Roehrig dynamometer
located at CVeSS. Figure 3-7 shows the Roehrig dynamometer.
Figure 3-7: Roehrig dynamometer test rig
The two dampers were tested independently of each other; one was marked with a “1” and the
other with a “2” to keep the test data organized. The spherical bearings at each end of the
damper were bolted to removable mounts, also shown in Figure 3-7, and mounted to the Roehrig.
Once the damper was set up, two tests were run to characterize each damper.
For the first test, the damper was set up near full compression. The Roehrig was programmed to
run a test that oscillated the damper through a total stroke of 1 inch. These runs were named
Frame
Load
cell
Mount
Page 32
19
“Stbd1 – Comp” and “Stbd2 – Comp,” with respect to the specific damper, signifying that the
damper was set up near full compression. The second test was the same as the first except that
the damper was set up near full extension. These tests were named “Stbd1 – Ext” and “Stbd2 –
Ext,” signifying near full extension. Running tests with the damper both compressed and
extended can determine whether the damping characteristics are consistent through the entire
stroke of the damper, with the total stroke of the stock dampers being 8 inches.
Figure 3-8 is a plot of all four tests. Within the figure, the solid line is the first damper being
tested near full compression; the dashed line is the first damper near full extension; the dash-
dotted line is the second damper tested near full compression; and the dotted line is the second
damper near full extension. The values in Quadrant I of the graph are the damping forces during
compression, and the values in Quadrant III are the damping forces during extension.
Figure 3-8: Stock damper curves
From this plot, the damping curves of both dampers at both extended and compressed setups are
very close to each other, confirming that 1) both dampers have consistent damping through their
entire stroke, and 2) the dampers are similar to one another.
-1400
-1200
-1000
-800
-600
-400
-200
0
200
400
600
-40 -20 0 20 40
Forc
e, lb
Velocity, in/sec
Stock Damper Curves
Stbd1 - Comp
Stbd1 - Ext
Stbd2 - Comp
Stbd2 - Ext
Page 33
20
By taking one damping curve and manipulating the values into Quadrant I of the graph, the ratio
between damping forces seen during extension and compression was easily determined. Figure
3-9 shows the modified damping curve plot. The solid line is the forces seen during extension,
and the dashed line is the forces seen during compression.
Figure 3-9: Plot of one damping curve from the Roehrig tests
The damping curve shows that the forces during extension are greater than the values during
compression at a ratio of approximately 4:1.
3.3 Stock Airspring Characterization
The stock airspring is a Firestone 1T14C-3. The 1T14C-3 is both an AirstrokeTM
actuator and an
AirmountTM
isolator, and can be used as an actuator or an industrial isolator, respectively [5].
The data sheet for the stock airspring is found in Firestone’s 2007 Engineering Manual & Design
Guide [5], shown in Figure 3-10.
0
200
400
600
800
1000
1200
1400
0 10 20 30 40
Absolu
te F
orc
e,
lb
Absolute Velocity, in/sec
Stock Damping Curve
Extension
Compression
Page 34
21
Figure 3-10: Data sheet for 33ft WAM-V stock airspring, Firestone 1T14C-3 [5]
The 1T14C-3 is a nonlinear airspring, shown by the flat section of the curves in the data sheet.
The flat sections indicate that there is no change in restoring force in response to the suspension
height. This can present itself as a hysteresis-like characteristic.
The manufacturer’s data sheet for the 1T14C-3 assumes that the airspring is kept at a constant
pressure, most likely by using an external reservoir. In-house tests were performed at CVeSS to
generate a dynamic curve that takes into account pressure changes that occur as the airspring
extends and compresses during WAM-V operation.
The tests to characterize the stock airspring were conducted on an MTS load frame at CVeSS.
Since the maximum stroke of the load frame is 6 inches, two tests were conducted to capture the
Page 35
22
full characteristics of the 1T14C-3, which has a total stroke of 10 inches. The test setup is shown
in Figure 3-11 with the airspring already mounted.
Figure 3-11: 1T14C-3 airspring mounted in the MTS
The first test conducted ran the airspring from a height of 10 inches to 16 inches. At a height of
15 inches, the pressure of the airspring was set to 25psi, which is the same ride height and
pressure used during sea trials. The test started at 14 inches, extended to 16 inches, compressed
to 10 inches, extended again to 16 inches, and returned to the starting height. Figure 3-12 shows
the force versus airspring height graph generated by this first test.
In the second test, the airspring deflected from 6 inches to 12 inches. The test started at a height
of 10 inches, extended to 12 inches, compressed to 6 inches, extended again to 12 inches, and
returned to the start height of 10 inches. Figure 3-13 shows the force versus airspring height
graph generated by the second test.
Crosshead
Force
transducer
Mount Airspring
Page 36
23
Figure 3-12: Force versus airspring height of first test from 10 to 16 inches
Figure 3-13: Force versus airspring height of second test from 6 to 12 inches
9 10 11 12 13 14 15 16600
800
1000
1200
1400
1600
1800
Spring Height, in
Fo
rce
, lb
Force vs Spring Height: 10 to 16 inches
6 7 8 9 10 11 12500
1000
1500
2000
2500
3000
3500
4000
Spring Height, in
Fo
rce
, lb
Force vs Spring Height: 6 to 12 inches
Page 37
24
The difference in force readings at specific airspring heights is the hysteresis-like behavior
previously mentioned: at a given height, the airspring can generate a range of forces, however, at
a given force value, the airspring can also be within a range of heights. Due to this behavior,
determining the ride height and restoring force was often inconsistent and difficult during testing.
In the transition between the first and second test, the pressure within the airspring was recorded
in 1-inch increments from 16 inches to 10 inches. The corresponding force values were also
recorded. No pressure readings were taken below 10 inches due to the high pressures and for
safety reasons. Table 3-1 shows the pressure and force readings from the airspring tests. The
change in pressure was significant as the spring was extended and compressed, proving that the
two tests were needed to correctly characterize the dynamic airspring behavior.
Table 3-1: Pressure and Force Readings between Airspring Tests
Spring Height
inches
Pressure
psi Force
lb
10 40 1436
11 36 1167
12 31 1020
13 29 902
14 26 786
15 23.5 700
16 21.5 600
To determine the relationship between force and airspring height, the data generated from the
two tests are used to determine Equation (3-1). The curves are plotted and shown in Figure 3-14.
The curve in the 10- to 16-inch range represents the first test, and the curve in the 6- to 12-inch
range represents the second test. A cubic trend of Equation (3-1), the dashed line, was fitted to
both curves to characterize the nonlinear behavior of the airspring.
18000373027702.7 23 xxxy (3-1)
where y is the force in pounds and x is the airspring height in inches.
The cubic trend found from Figure 3-14 was used to find the spring rate of the airspring. The
spring forces and rates are plotted in Figure 3-15. The spring rate is represented by the solid line,
the corresponding y-axis on the left, and the spring force by the dashed line, the corresponding y-
axis on the right.
Page 38
25
Figure 3-14: Force versus spring height of both airspring tests with cubic trend
Figure 3-15: Spring force and rate of stock airspring
6 8 10 12 14 16
500
1000
1500
2000
2500
3000
3500
4000
Spring Height, in
Fo
rce
, lb
Force vs Spring Height with cubic trend
10 to 16 inch
6 to 12 inch
cubic trend
0
1000
2000
3000
4000
5000
6000
0
100
200
300
400
500
600
700
800
900
1000
1100
1200
6 8 10 12 14 16
Forc
e, lb
Spring R
ate
, lb
/in
Spring Height, in
Spring Force and Rate
Spring Rate
Force
Page 39
26
The spring rate is very high when compressed, but softens as the suspension extends. At the
WAM-V ride height of 15 inches at the airspring, the airspring provides a spring rate of about
200lb/in. It should be noted that the airspring height of 15 inches falls within the “do not operate
zone” of the manufacturer’s data sheet.
3.4 33ft WAM-V Weight Calculations
Before selecting new suspension components, tests were conducted to find the weight of the 33ft
WAM-V. The weight of the vessel helped determine the correct sizes for the spring and damper
for the new suspension.
3.4.1 Sprung-Unsprung Mass (Weight) Ratio
When dealing with road vehicles, the sprung weight includes everything that is above the
suspension, while the unsprung weight is everything below. The same can be said when applied
to the 33ft WAM-V. The sprung weight of the 33ft WAM-V is everything above the suspension,
such as the front and rear arches and payload tray, and the unsprung weight is everything below,
such as the skis and pontoons. Figure 3-16 illustrates the sprung and unsprung portions of the
33ft WAM-V.
Figure 3-16: Profile view showing sprung and unsprung portions of 33ft WAM-V
The 33ft WAM-V was lifted and scales that are used to weigh automobiles were placed under the
pontoons, two at the front and two at the rear, to find its total weight. The engine pods were
disconnected for this test. Figure 3-17 shows the 33ft WAM-V lifted onto the scales.
Sprung
Unsprung
Page 40
27
Figure 3-17: 33ft WAM-V lifted onto scales
The entire boat, minus the engine pods which were unpinned, was weighed using a hoist to lift
the WAM-V onto four scales. Each pontoon had two scales under it: one up front near the
suspension, and one in the rear near the engine pod pivot, also called the can. Figure 3-18 shows
the scale under the front and rear of the pontoon, respectively. The scales were placed on blocks
to lift the WAM-V completely off the trailer.
Figure 3-18: Pontoon front (left) and rear (right) lifted onto scales
Out of the four scales available, only three were operational. To compensate for this, the WAM-
V was weighed three times, with the broken scale first under the rear of the starboard pontoon,
Hoist
Scale
Page 41
28
and then under the rear of the port pontoon. Table 3-2 shows the locations of the scales for each
test and the corresponding weights in pounds. The “X” in the table shows the location of the
broken scale. The locations of the scales are shown in Figure 3-19.
Table 3-2: Corner Weights of Entire 33ft WAM-V in Pounds
Scale Location Test 1 Test 2 Test 3
LF 591.5 618.5 624.5
RF 628.5 640.5 635.5
LR 610.5 X X
RR X 667.4 657.5
Figure 3-19: Location of scales
The weights were averaged, and corner weights for the front and rear of the 33ft WAM-V were
determined. Each front corner weighs approximately 620lb, and each rear corner weighs
Page 42
29
approximately 660lb, making the total weight of the boat, without engine pods and operator,
about 2600lb.
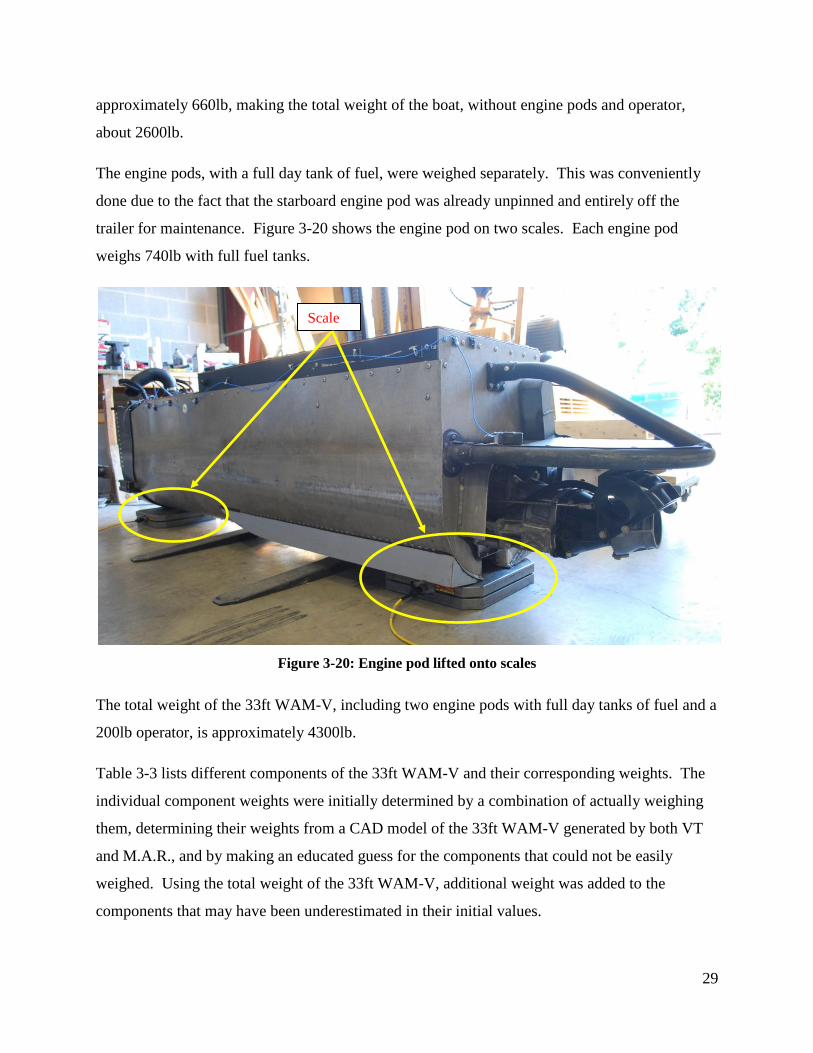
The engine pods, with a full day tank of fuel, were weighed separately. This was conveniently
done due to the fact that the starboard engine pod was already unpinned and entirely off the
trailer for maintenance. Figure 3-20 shows the engine pod on two scales. Each engine pod
weighs 740lb with full fuel tanks.
Figure 3-20: Engine pod lifted onto scales
The total weight of the 33ft WAM-V, including two engine pods with full day tanks of fuel and a
200lb operator, is approximately 4300lb.
Table 3-3 lists different components of the 33ft WAM-V and their corresponding weights. The
individual component weights were initially determined by a combination of actually weighing
them, determining their weights from a CAD model of the 33ft WAM-V generated by both VT
and M.A.R., and by making an educated guess for the components that could not be easily
weighed. Using the total weight of the 33ft WAM-V, additional weight was added to the
components that may have been underestimated in their initial values.
Scale
Page 43
30
Table 3-3: Weight Breakdown of 33ft WAM-V by Component
Item Initial
Weight, lb Quantity
Additional
Weight (each), lb
Total
Weight, lb
Pod Components
engine pods 640 2 0 1280
16 gallons of fuel 96 2 4 200
Platform Components
platform 266 1 159 425
battery 30 1 10 40
rails 50 1 10 60
Ski Components
skis 194 2 36 460
hull connector 30 2 10 80
pumps 10 2 0 20
pontoons 100 2 0 200
actuator assembly 15 2 0 30
Operator
seat 35 1 20 55
operator 200 1 0 200
radio 10 1 0 10
Front Arch Assembly
front arch 346 1 104 450
Rear Arch Assembly
rear arch 475 1 75 550
Suspension Assembly
airsprings 7.5 2 0 15
dampers 7.5 4 0 30
rockers 30 2 10 80
Data Acquisition Assembly
camera box + cameras 25 1 5 30
data acquisition box + sensors 40 1 10 50
TOTAL
WEIGHT, lb: 4265
Knowing that the unsprung weight is comprised primarily of the “Ski Components” section in
Table 3-3, the unsprung weight comes to about 800lb. With a total weight of 2600lb, without
engine pods and operator, the sprung-unsprung ratio is approximately 2:1.
Page 44
31
3.4.2 Suspension Sprung Mass (Weight)
After weighing the entire 33ft WAM-V, the value of the front corner sprung mass, which is the
portion that the suspension has to support, was determined. One scale was placed under the ball
joint of the front suspension, and was propped up by a number of blocks to reach the desired ball
joint height of 18 inches. The ball joint was raised to this height to correspond to a level payload
tray and vertical front arch. Figure 3-21 shows the setup to weigh the front corner sprung mass
of the 33ft WAM-V.
Figure 3-21: Suspension sprung mass measured by placing scale under ball joint
Three tests were conducted to determine the front corner sprung weight. All three tests were set
up with a ball joint height of 18 inches. Test 1 values were recorded after putting the scale under
the ball joint. Test 2 values were taken after shaking the payload tray to make sure no joints
were in a bind, which would have kept certain components from being considered on the scales.
For Test 3, a 50lb weight was placed on the operator seat to simulate an operator on board. From
Test 3, it was determined that about 60% of the operator’s weight acts on the front suspension.
The results from the three tests conducted can be seen in Table 3-4. The locations of the scales
are the same as before.
Ball joint
Scale placed here
Page 45
32
Table 3-4: Suspension Sprung Weight in Pounds
Scale Location Test 1 Test 2 Test 3
LF 419.5 420.5 435.5
RF 422.5 428.5 443.4
Taking an average of Tests 1 and 2, the front suspension sprung weight on one corner is
approximately 525lb with a 200lb operator on board.
3.5 New Suspension Selection and Characterization
By determining the amount of weight supported by the suspension and the sprung-unsprung
weight ratio of the WAM-V, the sizing of the spring and dampers could be more finely tuned to
the specific application of being on the 33ft WAM-V. Also, keeping in mind the geometry of the
current suspension system, components were chosen so major changes were not needed to install
a new suspension.
An Öhlins coil-over-spring suspension system was chosen as the new suspension for modularity
in the sizing of the components and ease of implementation. A coil-over-spring suspension is
comprised of one damper and a spring that wraps around the damper, shown in Figure 3-22. The
Öhlins coil-over-spring suspension has two adjustment knobs to adjust the damping values of the
damper. The fine adjustment knob is located on the external reservoir, and the main adjustment
knob is located at the bottom of the damper. The Öhlins damper has a total stroke of 9 inches.
Figure 3-22: Öhlins coil-over-spring suspension
Main
adjustment
knob
Upper mount Lower mount
Fine adjustment
knob
Damper Coil-over-spring
External reservoir
Page 46
33
Öhlins provides a large range of linear spring rates. Two springs, rated at 400lb/in and 500lb/in,
were chosen to be the possible replacements to accommodate the 525lb load on each suspended
corner.
Assuming the new coil-over-spring suspension would be placed at the stock damper position to
allow for more travel, Figure 3-23 shows the amount of travel that the ball joint of the suspension
would have with the stock airspring and each linear spring. The triangles indicate the ball joint
height from hitting the compression bumper with no load on the spring in place, with the proper
motion ratios applied. The squares indicate the ball joint height from hitting the compression
bumper with a 525lb load on the spring, with the proper motion ratios applied.
Figure 3-23: Ball joint travel with stock airspring and linear springs
Figure 3-23 showed that the stock airspring sits extremely close to full extension with a 525lb
load. With the replacement linear springs, the height of the spring is near mid-stroke with a
525lb load. Figure 3-24 shows the percentage of compression travel available with the stock
airspring and each linear spring, with 0% compression being contact with the compression
bumper.
17
20.8 20.5
15
10.7
12.3
0
5
10
15
20
25
Airspring 400lb/in 500lb/in
Ball
Join
t D
ista
nce f
rom
Com
pre
ssio
n B
um
per,
in
Spring Configuration (Original Airspring or Coil-Over Rating)
Suspension Ball Joint Rattlespace
Full Extension
Static Comp 525lb Load
Page 47
34
Figure 3-24: Compression travel available with stock and new suspensions
The stock suspension has an 88/12 compression-to-extension stroke ratio. With a 400lb/in and
500lb/in linear spring instead, the ratios are more equal with 50/50 and 60/40, respectively.
Equations (3-2) through (3-4) are used to calculate the values plotted in Figure 3-23:
mrpreloadtravelspringratedextensionfull (3-2)
where extensionfull is the maximum height of the suspension in inches, travelspringrated is
the amount the spring can travel in inches, preload is the amount of preload on the spring in
inches, and mr is the motion ratio between the ball joint and the location of the spring in
question. In all three cases, the preload is zero. The motion ratio is 0.515 with the stock
airspring, and 0.359 with the linear springs.
0%
10%
20%
30%
40%
50%
60%
70%
80%
90%
100%
Stock 400lb/in 500lb/in
Com
pre
ssio
n T
ravel A
vaila
ble
, %
Spring Configuration (Original Airspring or Coil-Over Rating)
Ride Height Comparison
Page 48
35
balljoint
balljoint**
k
preloadkmrloadmpressionstatic co
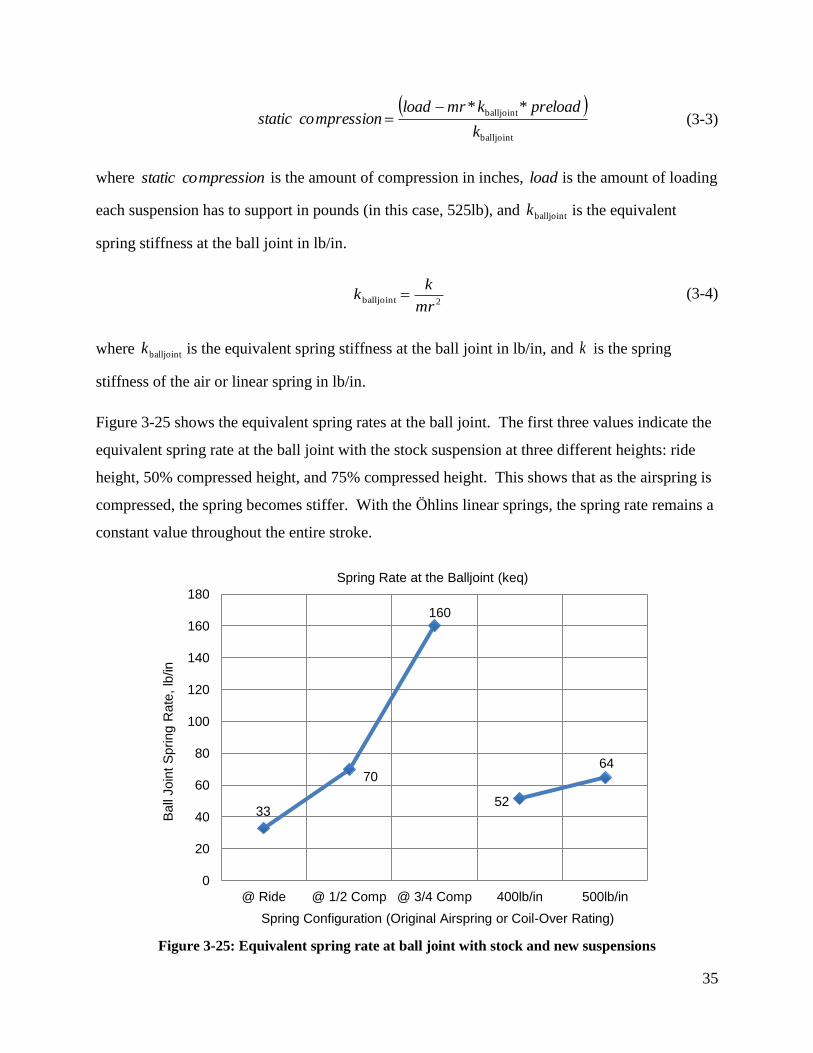
(3-3)
where mpressionstatic co is the amount of compression in inches, load is the amount of loading
each suspension has to support in pounds (in this case, 525lb), and balljointk is the equivalent
spring stiffness at the ball joint in lb/in.
2balljointmr
kk (3-4)
where balljointk is the equivalent spring stiffness at the ball joint in lb/in, and k is the spring
stiffness of the air or linear spring in lb/in.
Figure 3-25 shows the equivalent spring rates at the ball joint. The first three values indicate the
equivalent spring rate at the ball joint with the stock suspension at three different heights: ride
height, 50% compressed height, and 75% compressed height. This shows that as the airspring is
compressed, the spring becomes stiffer. With the Öhlins linear springs, the spring rate remains a
constant value throughout the entire stroke.
Figure 3-25: Equivalent spring rate at ball joint with stock and new suspensions
33
70
160
52
64
0
20
40
60
80
100
120
140
160
180
@ Ride @ 1/2 Comp @ 3/4 Comp 400lb/in 500lb/in
Ball
Join
t S
pring R
ate
, lb
/in
Spring Configuration (Original Airspring or Coil-Over Rating)
Spring Rate at the Balljoint (keq)
Page 49
36
The damping ratio of the suspension is important in determining whether there will be sufficient
damping present to reduce the oscillations of the vehicle or vessel. Figure 3-26 shows the
damping ratios of the stock suspension along with the damping ratios of the 400lb/in and
500lb/in linear springs. A damping ratio of 1 is critical damping.
Figure 3-26: Damping ratios of stock and new suspensions
Table 3-5 shows the damping values of the stock and new suspension. The “minimum damping”
values of the stock suspension are when only one stock damper is installed with the stock
airspring instead of the usual two stock dampers.
Table 3-5: Minimum and Maximum Damping Ratios with a 525lb Load
Minimum Damping Maximum Damping
Stock @ Ride 0.28 0.57
Stock @ 1/2 Comp 0.19 0.39
Stock @ 3/4 Comp 0.13 0.26
400 lb/in 0.11 0.96
500 lb/in 0.10 0.86
The stock suspension does not provide enough damping as the suspension is compressed,
supplying only 0.13 with each suspension at a 75% compressed height. Due to the adjustability
Two Original Dampers
Adjustable Damper Max
One Original Damper
Adjustable Damper Min
0.00
0.20
0.40
0.60
0.80
1.00
1.20
@ Ride @ 1/2 Comp @ 3/4 Comp 400lb/in 500lb/in
Dam
pin
g R
atio
Spring Configuration (Original Airspring or Coil-Over Rating)
Damping Ratio Comparison
525lb Load Maximum Damping
525lb Load Minimum Damping
Page 50
37
of the new suspension, a wide range of damping values is available that encompass the damping
values provided by the stock dampers.
Figure 3-27 shows a plot of the damper characteristics of the Öhlins damper. The solid and
dashed lines with circle markers indicate the stock damper extension and compression values,
respectively. The solid and dashed lines with square markers indicate the maximum extension
and compression values of the new damper, respectively. The solid and dashed lines with
triangle markers indicate the minimum extension and compression values of the new damper,
respectively.
Figure 3-27: Damping characteristics of stock and new dampers
The damping values during compression and extension of a damper is important in how the
suspension acts when encountering a bump in the road or, in the case of the 33ft WAM-V, a
wave. Since the stock dampers were made to be used in road vehicles, their extension-
compression damping ratio of 4:1 would typically be found in a road vehicle, where the sprung
weight is significantly heavier than the unsprung weight. The sprung-unsprung weight ratio of
the 33ft WAM-V, however, is closer at 2:1. With such similar values of sprung and unsprung
0
200
400
600
800
1000
1200
1400
0 10 20 30 40
Absolu
te D
am
pin
g F
orc
e, lb
Absolute Velocity, in/s
Damper Comparisons
Orig Shock Ext
Orig Shock Comp
Adjustable Ext, Max
Adjustable Comp, Max
Adjustable Ext, Min
Adjustable Comp, Min
Page 51
38
weight, the extension damping values do not need to be greater than the compression values.
The damping ratio of about 1:1 extension-compression provided by the Öhlins damper should be
sufficient for the 33ft WAM-V.
Since the new coil-over suspension is placed at the stock damper position, the motion ratio
between that position and the ball joint remains the same, 0.359. However, because the new
suspension has different geometry than the stock damper, the relationship between the ball joint
and new suspension height is slightly altered, shown in Figure 3-28.
Figure 3-28: Relationship between ball joint and new damper height
The coil-over setup provides both a wide range of damping values and spring rates, making it
easier to tune the suspension to the most optimal settings through testing. In addition, not only
does the coil-over fit into the existing structure, but it is also easily implemented. Figure 3-29
shows the new coil-over suspension system installed on the 33ft WAM-V. The original limit
straps are also replaced and repositioned to beside the coil-over setup, instead of in front, to
make room for the spring component of the coil-over. The new suspension only has one
y = 0.3594x - 1.5336 R² = 1
0
1
2
3
4
5
6
7
0 5 10 15 20 25
Dam
per
Positio
n H
eig
ht, in
Ball Joint Height, in
Ball Joint - New Damper Relationship
Page 52
39
extension limit strap, whereas the stock suspension has two. Details of the how each suspension
is installed are covered in Chapter 4.
Figure 3-29: Coil-over suspension implemented into existing WAM-V structure
Coil-over-spring
suspension
Extension limit
strap
Page 53
40
Chapter 4 33ft WAM-V Testing Setup and Procedure
This chapter discusses the sea trial setup and procedures followed for testing the 33ft WAM-V.
The chapter starts with an explanation on how the two suspension systems are installed and
changed during testing, followed by the instrumentation of the 33ft WAM-V in detail. The
chapter ends by describing the patterns conducted and procedures followed during sea trials.
4.1 Suspension Installation
Making changes to the suspension during sea trials was a necessity in order to test each
suspension in the same day in the hopes of collecting data for both suspensions operating in the
same sea state.
In order to change between the two suspension systems in a safe and timely manner during sea
trials, the new suspension system was designed to be installed easily without having to modify
the structure being used by the stock suspension system. The installation procedure of the new
suspension system was also designed to make changing between the new and stock suspension
components as simple as possible.
4.1.1 Stock Suspension
The stock suspension system was designed by M.A.R. to have an airspring and two dampers
sitting within a suspension rocker arm. The top of the airspring is mounted to the suspension
rocker arm by bolting it to a bar spanning the width of the opening in the suspension arm, shown
in Figure 4-1.
The bottom of the airspring is mounted on an angled platform to constrain the movement of the
airspring to the vertical direction, shown in Figure 4-2. Figure 4-2 also shows the lower mounts
for the stock dampers. Each damper uses two flanges mounted perpendicular from the pontoon
ski to secure the damper lower mount spherical bearing. Cylindrical spacers are used to fill the
space between the flanges and the bearing of the damper. The extension limit straps also use the
flanges as their lower mounting point.
Page 54
41
Figure 4-1: Upper mounting bar of stock airspring
Figure 4-2: Lower mount of airspring, dampers, and limit straps
Airspring
mounting bar Airspring
upper mount
Airspring
lower mount
platform
Damper
lower mount
Extension limit
strap lower mount
Page 55
42
The upper mounts of the dampers are secured in a raised frame to allow the dampers to travel
their full stroke. The raised frame is bolted to the WAM-V at four points, shown in Figure 4-3.
The upper mounts of the extension limit straps are also secured in this raised frame.
Figure 4-3: Upper mounting frame for stock dampers and extension limit straps
Figure 4-4 shows the underside of the frame. The top of the dampers are mounted like the
bottoms, however, instead of one bolt for each damper, one long bolt is used for both dampers
and limit straps. Again, cylindrical spacers are used to fill the space in between the flanges and
the mounting points of each component.
The spacers installed in the stock suspension allow the dampers to have some deadband. Due to
the raised frame around the damper upper mounting points, the spacers cannot be tightened to
keep the spherical bearings from rotating. While this was a good design for a compact
suspension system, the design for the installation of the new suspension allows the new damper
mounts to be tightened, constraining the motion of the dampers to be purely axial.
Upper
mounting
frame
Page 56
43
Figure 4-4: Underside of upper mounting frame
The stock dampers are installed and removed with a total of eight bolts: four holding the raised
frame to the suspension rocker arm, and four holding the lower mounts of the extension limit
straps and dampers. The stock airspring is installed and removed with a total of three bolts: two
bolts holding it to the suspension rocker arm, and one to the lower mount platform.
4.1.2 New Suspension
One parameter considered in choosing new suspension components included components that fit
into the existing suspension structure of the WAM-V. The new suspension is mounted at the
stock damper position to allow the new damper to travel its full stroke.
To accommodate the increased stroke of the new damper, a new raised frame was designed,
shown in Figure 4-5. The two sides of the frame are connected with a steel rectangular prism.
The external reservoir is secured to this rectangular prism with heavy duty zip ties, keeping it
Spacer
Damper
upper mount
Extension
limit strap
upper mount
Page 57
44
away from any moving parts that may damage it. The top mount of the extension limit strap is
mounted to one corner of the raised frame, barely visible in the figure.
Figure 4-5: Newly designed upper mounting frame for new suspension
Figure 4-6 shows the upper mounting point of the new damper. The spacers used for the new
suspension are better sized to fit the space in between the flanges and spherical bearing of the
new damper. To better rest against the bearing, one side of the cylindrical spacer is tapered.
With the new spacers, the bolt can be tightened to eliminate any deadband.
The lower mount for the damper uses the same principle as the upper mount, using spacers that
are tapered at one end to fit against the damper bearing. The new bottom spacers were machined
to be a tight fit, leaving the damper no deadband when the installation is complete. Additional
flanges are placed under the spacers around the bearing to add support for the bolt and keep it
from bending. The lower mount for the new damper is shown in Figure 4-7.
Top mounting
frame
Extension limit
strap top mount
External reservoir
Page 58
45
Figure 4-6: Upper mount of new damper
Figure 4-7: Lower mount for new damper
Tapered spacer
Damper
upper mount
Tapered spacer
Support flange
Spacer
Damper lower mount
Page 59
46
The new suspension is installed and removed with a total of six bolts: four holding the raised
frame to the suspension rocker arm, one holding the extension limit strap, and one holding the
lower mount for the damper.
4.1.3 Suspension Lifting Tool
In order to switch between the two suspensions during sea testing, a tool had to be constructed to
ensure the safety of the personnel. While on the water, the suspension rocker arm will be
moving up and down with the waves. A tool is needed to lock out the suspension while the
suspension components are being changed. A suspension lifting tool, shown in Figure 4-8, was
constructed at CVeSS for the purpose of keeping the suspension from compressing.
Figure 4-8: Suspension lifting tool
Lever arm
Wheel Flange
Page 60
47
The suspension lifting tool is comprised of a flange to fit into the space in the suspension rocker
arm, and a lever arm to push the tool in place. Wheels were installed on one end of the tool to
roll the tool into place. Figure 4-9 shows two pictures of the lifting tool in place. The picture on
the left shows the tool resting behind the airspring, propping up the suspension rocker arm. The
picture on the right shows the flange hooked in the space of the rocker arm, keeping the lifting
tool from being pulled out.
Figure 4-9: Tool props suspension up (left) and flange keeps tool from rolling (right)
Figure 4-10 shows the wheels on the bottom of the tool wedged under the lower mount platform
of the airspring, keeping the tool from rolling in either direction.
Since the wheels are wedged in place under the airspring platform, which has a height lower than
the wheel diameter, the lever arm does not lay flat on the WAM-V ski. The space that results
keeps fingers safe from being injured during placement, shown in Figure 4-11.
Page 61
48
Figure 4-10: Wheels of suspension lifting tool wedged under airspring platform
Figure 4-11: Suspension lifting tool does not lay flat on the WAM-V ski
Page 62
49
The suspension lifting tool is used to keep the suspension from compressing during a suspension
change. To keep the suspension from rising too high and possibly dislodging the lifting tool, a
ratchet strap is used, shown in Figure 4-12.
Figure 4-12: Fully locked out suspension with suspension lifting tool and ratchet strap
Once the suspension lifting tool is in place, the ratchet strap is attached to a ring on the
suspension and a cleat on the pontoon ski and then tightened. The result is a fully locked out
suspension.
Ratchet strap
Suspension
lifting tool
Locked out
suspension
Page 63
50
4.2 Suspension Sea Trial Setup
The 33ft WAM-V was instrumented with an array of sensors and was tested in two main sea
conditions while running predetermined test patterns.
4.2.1 Instrumentation of the 33ft WAM-V
In order to collect data to analyze the 33ft WAM-V dynamics, it is instrumented using
accelerometers and potentiometers, their placements shown in Figure 4-13. Accelerometers are
used to measure the accelerations at various locations, and potentiometers are used to measure
displacements.
Figure 4-13: Diagram of sensor placement on 33ft WAM-V
Page 64
51
The 10g and 30g accelerometers used are PCB Series 3741 MEMS DC Response
Accelerometers, manufactured by PCB Piezotronics. Due to a number of sensor failures
throughout the course of testing the 33ft WAM-V, each accelerometer is encased in a 4.7 inch x
2.6 inch x 1.6 inch polycarbonate waterproof box, manufactured by Hammond Manufacturing.
In addition to the waterproof box, desiccant packs are placed in each box to keep moisture from
ruining any sensors. The cable to each accelerometer is passed through a hole drilled into the
waterproof box and then through a cable clam to maintain the waterproof properties of the box.
The accelerometer box setup is shown in Figure 4-14.
Figure 4-14: Accelerometer box setup
Four of the seven 10g accelerometers, represented by the circles in Figure 4-13, are placed at the
four corners of the WAM-V: two at the front of the pontoon and two at the rear. The two
accelerometers at the front are placed near the suspensions, and the two at the rear are right under
the joints connecting the pontoons to the rear arch. Figures 4-15 and 4-16 show the
accelerometers at the front and rear, respectively. The accelerometers shown are housed in a
different box than described in Figure 4-14, but their location is the same.
Waterproof
box
Desiccant pack
Cable clam
Accelerometer
Page 65
52
Figure 4-15: Accelerometer located towards pontoon bow near suspension
Figure 4-16: Accelerometer located under rear joint
Two additional 10g accelerometers are installed on the back of each engine pod. Originally 30g
accelerometers, they were replaced by 10g accelerometers due to early sensor failure. This
Accelerometer
box
Accelerometer
box
Page 66
53
change in sensors is acceptable because the accelerations seen at the engine pods in previous
tests did not exceed 10g. Figure 4-17 shows the accelerometer mounted at the back of the engine
pod.
Figure 4-17: Accelerometer located at the back of engine pod
Three accelerometers are mounted on the payload tray: the last 10g accelerometer mounted at the
rear, and one 30g accelerometer and one tri-axial 3g accelerometer at the front. The tri-axial 3g
accelerometer, represented by the pentagon in Figure 4-13, is located inside the data acquisition
box at the front of the payload tray. The 10g and 30g accelerometers at the front and rear of the
payload tray capture how much the accelerations at the pontoons are attenuated. The 30g
accelerometer is represented by the diamond in Figure 4-13.
A string potentiometer, represented by the triangle in Figure 4-13, is mounted between the front
arch and the payload tray to measure the angle between the two. Figure 4-18 shows the string
potentiometer at two angles for a better understanding of the setup. A plastic guard, barely
Accelerometer
box
Page 67
54
visible in the figure, is located in front of the string to ensure that the string potentiometer
readings are not influenced by spray during testing.
Figure 4-18: String potentiometer between front arch and payload tray
In order to measure the suspension displacements at the front and the engine pod angles at the
back, rotary potentiometers, represented by the squares in Figure 4-13, are installed. Each
submarine-rated potentiometer is placed in a waterproof metal box along with two desiccant
packs. Figure 4-19 shows the potentiometer box setup.
Figure 4-19: Potentiometer box setup
String pot String mounting
point String pot
String mounting
point
Potentiometer
Waterproof
box
Page 68
55
To measure the displacement of the suspension, the potentiometer is mounted between the
suspension arm and the ski on top of the pontoon using a series of linkages. Figure 4-20 shows
the mounting of the potentiometer at the suspension.
Figure 4-20: Potentiometer at suspension
Rotary potentiometers are mounted between the engine pods and the pontoon skis to measure the
angles that are formed by the engine pods in the water. Figure 4-21 shows the mounting of the
potentiometer at the engine pod.
Figure 4-21: Potentiometer at engine pod
Potentiometer
box
Linkage
Mounting
point to ski
Potentiometer
box
Linkage Mounting point
to engine pod
Page 69
56
To track the 33ft WAM-V on the water, a GPS unit, which is represented by the star in Figure 4-
13, is mounted on top of the data acquisition (DAQ) box. The GPS unit, a Garmin 18x-5Hz,
transmits data at a rate of 5Hz. The Garmin GPS takes information such as time in Coordinated
Universal Time (UTC), longitude and latitude readings in degrees and minutes, speed in knots,
and heading in degrees. Figure 4-22 shows the Garmin GPS unit mounted on the lid of the data
acquisition box.
Figure 4-22: GPS unit mounted on top of the data acquisition box
To record all the data being obtained by the accelerometers, string and rotary potentiometers, and
GPS unit, a CompactRio data acquisition system is used. The CompactRio, or cRIO, is used
with LabVIEW, and both hardware and software are developed by National Instruments.
Recording at 500Hz, the cRIO takes data from eighteen sensor channels: eight single-axis
accelerometer readings, three accelerometer readings from the tri-axial accelerometer, four
readings from the rotary potentiometers, one from the spring potentiometer, one for a radio
trigger to mark important sections of data, and one for the battery voltage. The cRIO also
records time data, though that is a process computed within the cRIO.
GPS DAQ box
Page 70
57
The cRIO, data acquisition battery, and tri-axial 3g accelerometer are all mounted inside a
waterproof Pelican box shown in Figure 4-23. The cRIO and tri-axial accelerometer are under
the battery and are not visible in the figure.
Figure 4-23: DAQ box containing cRIO, tri-axial accelerometer, and DAQ battery
In addition to all the quantitative sensor data being obtained, video cameras are mounted at
various positions on the 33ft WAM-V to take qualitative data. Two GoPro cameras are
positioned at various locations on the 33ft WAM-V: these include placement near the suspension
to capture suspension motions, at the engine pods to capture engine pod motions, and at the
string potentiometer to capture the motion of the front arch. Figure 4-24 shows an instance
where the GoPro camera was used to capture front arch and string potentiometer motion during
testing.
DAQ battery
Page 71
58
Figure 4-24: GoPro camera capturing motions of string potentiometer
Four additional cameras, provided by CCD, are installed to capture video of the operator and
pontoons during testing. These videos are linked with another GPS unit, supplied by CCD, and
show time, position, and speed on the video. Figure 4-25 shows three locations of the CCD
cameras. The left picture is of the camera located under the payload tray looking forwards at the
motion of both pontoons. The middle camera is located at the back of the payload tray to record
operator response. The right picture is of the camera that is also located under the payload tray,
but only pointing towards one pontoon. The fourth camera is not shown since it is similar to the
third camera described, but pointing at the other pontoon.
Figure 4-25: Cameras provided by CCD on 33ft WAM-V
GoPro camera String pot
Page 72
59
For safety purposes, a chase boat is launched with the WAM-V for every test. The chase boat
provided by CCD was a 7M rigid inflatable boat (RIB), a standard monohull high speed boat
used by the United States Navy.
In order to compare dynamics between the two vessels, a set of video cameras and sensors are
implemented on the 7M RIB as well. A camera is stationed behind the pilot to capture the
motions seen at the payload deck. A data acquisition system is mounted near the center of mass
on the payload tray of the RIB to record data from an accelerometer and from a GPS unit.
4.2.2 Test Patterns
Two types of tests were attempted on the 33ft WAM-V through rough waters at the Naval
Station in Norfolk, VA: constant speed runs, and star patterns at constant speeds. The constant
speed runs were conducted in two directions, the first being the initial direction of travel, and the
second being its reciprocal to cancel out any motions influenced by the currents. The speeds
tested were 5 knots, 10 knots, 15 knots, and top speed, which varied with each test.
A star pattern is comprised of five legs: head, aft quartering, beam, bow quartering, and
following seas. With this test, the response of the 33ft WAM-V to different wave directions can
be evaluated. The legs of the star pattern are depicted in Figure 4-26 and are defined in Table 4-
1.
Figure 4-26: Diagram of star pattern
Page 73
60
Table 4-1: Legs of Star Pattern
Leg # Wave
1 Head Seas
2 Aft Quartering Seas
3 Beam Seas
4 Bow Quartering Seas
5 Following Seas
4.2.3 Testing Procedure
Tests were conducted on days that provided the desired sea conditions. Sea conditions were
determined by checking the National Digital Forecast Database produced by the National
Oceanic and Atmospheric Administration’s (NOAA) National Weather Service (NWS). The
service provides wave height, wind speed, and wind direction [10] that helped in determining
whether to put the WAM-V in the water. Figure 4-27 shows two screenshots of the information
provided around the Norfolk region. The screenshot on the left is of wave height, and the one on
the right is of wind speed and direction.
Figure 4-27: Wave heights (left) and wind speed and direction (right) [10]
Once it is decided to test, personnel start preparations for putting the 33ft WAM-V and chase
boat into the water. The WAM-V goes through a pre-launch checklist provided by M.A.R. [11].
Page 74
61
Items on the pre-launch list include checking that all hatches are secured, that electrical
connections are correctly plugged in, and that everything on the payload tray is secure. Another
pre-launch check is ensuring all the sensors are functioning, and that the cRIO is correctly taking
data.
Everyone involved with the tests was required to wear life jackets for safety. While only life
jackets were required in summer testing, during winter testing, dry suits, waterproof gloves,
balaclavas, and ski goggles were required in addition to the life jackets for protection against the
cold.
Waterproof handheld radios kept the WAM-V operator in constant communication with the
chase boat during summer testing. However, due to complications with spray and rough waters
in winter testing, the primary means of communication between vessels was replaced with
hands-free Piratecom headsets, but the handheld radios were kept as a backup.
During each test, everyone onboard both vessels had responsibilities to ensure safe testing. The
operator of the 33ft WAM-V communicated with the 7M RIB via radio to coordinate testing
patterns and speeds. A person on the chase boat watched the WAM-V and took notes on
anything significant that happened during testing, which included noting any observations seen
by the 33ft WAM-V operator that were relayed back to the chase boat. These notes were taken
in a waterproof notebook and usually included the observation and the time it occurred. A
second person on the chase boat was in charge of operating the safety radio, which cuts the
engines of the WAM-V if anything happens to the WAM-V operator causing loss of control. If
there were enough people on the RIB, a third person would be in charge of taking pictures and
video of the WAM-V for more qualitative data.
After testing, all observations and notes are put into a test report template for distribution and
future reference. The data is transferred off the cRIO and analyzed.
Page 75
62
Chapter 5 Suspension Testing and Performance Analysis
This chapter starts with an overview of the testing conducted on the 33ft WAM-V. Analysis of
the new suspension is performed in Sea State 1 (SS1), followed by comparison analysis between
the stock and new suspension in Sea State 2 (SS2). The chapter ends with a comparison between
the dynamics of the stock and new suspension during an encounter with a 2- and 4-foot wave.
5.1 Testing Summary
33ft WAM-V testing of the stock and new suspensions was conducted at the Naval Station in
Norfolk, VA during the summer of 2012 and again in the winter of 2012.
Summer 2012 testing of the WAM-V was conducted only on the stock suspension since the new
suspension components had not yet been chosen. Due to WAM-V reliability issues and lack of
desirable sea conditions, a limited amount of data is available with the stock suspension installed.
Winter 2012 testing of the WAM-V was originally meant to test both suspensions in higher sea
states. Due to WAM-V reliability issues and sea conditions being too rough, suspension changes
were not made during the tests, resulting in only the new suspension being tested in the winter.
Table 5-1 shows the available data from the tests conducted. Within the limited data, only
constant speed data are available, as they were conveniently run while heading towards and
returning from the testing area.
Table 5-1: Available Data from Testing
SS1 SS2 / 2-foot wave 4-foot wave
Stock Suspension n/a June 26, 2012 June 21, 2012
New Suspension December 14, 2012 December 11, 2012 December 11, 2012
Sea State 1 (SS1) testing of the stock suspension was conducted early in the summer, however,
due to problems with the data acquisition, no SS1 data exists for analysis. However, a brief
overview of suspension dynamics seen during winter testing of the new suspension is analyzed in
an SS1.
Data was collected for both suspensions operating in an SS2, and analysis of the differences seen
between the two is covered in this chapter. Analysis over a longer period of time, about 10
Page 76
63
minutes, was conducted to determine the differences in the ride heights of each suspension.
Each suspension was then analyzed in detail while traveling over a wave with a height of 2 feet
to evaluate the differences in dynamics.
Further analysis was done on the WAM-V when subjected to a wave with a height of about 4
feet. This was an “extreme” case where both pontoons were launched into the air and slammed
back down onto the water.
5.2 Sea State 1 Results
SS1 testing occurred during the summer of 2012 as well as during the winter. Due to unusable
data from summer testing, only data with the new suspension exists.
SS1 testing of the new suspension was conducted on December 14, 2012. The 500lb/in spring
was used and preloaded to raise the suspension ride height to 20.75 inches on the port side, and
20.375 inches on the starboard side. Three damper settings were tested in head and following
seas, totaling six runs. The tests were run at a test speed of 20 knots, the maximum speed of the
WAM-V, in an attempt to increase the motions seen by the suspension to generate better data.
Since the head sea runs were rougher than the following sea runs, only the head sea runs are
analyzed.
The damper settings were middle damping, maximum damping, and minimum damping. Run 1
was conducted with the dampers set at their middle setting: six clicks on the main adjustment
knob, and maximum damping on the fine adjustment knob. Run 2 was conducted with the
dampers at their maximum setting: maximum on both the main knob and the fine knob. Run 3
was conducted with the dampers at their minimum setting: minimum on both the main knob and
fine knob.
Probability density functions (PDFs) were generated for the vertical accelerations of the pontoon
bows and payload tray while operating through SS1. These plots show the range of accelerations
the WAM-V experiences at those locations. Figures 5-1 to 5-3 show the vertical acceleration
PDF for the port and starboard pontoon bow, and for the payload tray of Runs 1 through 3,
respectively. All the plots have been given the same scale to note the differences between the
three runs.
Page 77
64
Figure 5-1: PDF of vertical accelerations during Run 1
Figure 5-2: PDF of vertical accelerations during Run 2
-2 -1 0 1 2 3 40
1
2
Port Pontoon PDF
-2 -1 0 1 2 3 40
1
2
Pro
ba
bili
ty D
en
sity
Stbd Pontoon PDF
PDF of New Suspension Vertical Accelerations in SS1
-2 -1 0 1 2 3 40
2
4
Acceleration, g (up = positive)
Payload Vert PDF
-2 -1 0 1 2 3 40
1
2
Port Pontoon PDF
-2 -1 0 1 2 3 40
1
2
Pro
ba
bili
ty D
en
sity
Stbd Pontoon PDF
PDF of New Suspension Vertical Accelerations in SS1
-2 -1 0 1 2 3 40
1
2
Acceleration, g (up = positive)
Payload Vert PDF
Page 78
65
Figure 5-3: PDF of vertical accelerations during Run 3
The figures show that Run 2 was the roughest of the three runs, generating the largest range of
accelerations at the pontoons and payload tray, with the port pontoon reaching approximately
3.25g, the starboard pontoon reaching about 2.6g, and the payload tray reaching 1g. The
pontoons during Run 1 only reach 2g, while the payload tray reaches 0.8g. Run 3 recorded the
same payload acceleration as Run 2, even though the pontoon accelerations are lower during Run
3.
PDFs were also generated for the percent compression of the dampers to establish where the
suspension typically operated in SS1 waters during the course of each run. Figures 5-4 to 5-6
show the PDF for the percent the dampers are compressed during Runs 1 through 3, respectively.
A value of 0% means a fully extended damper, while 100% is fully compressed. The vertical
dotted line in each plot is the height when the damper comes into contact with the compression
bumper. The vertical dash-dotted line indicates when the damper contacts the extension limit
straps. The solid data line is the PDF of the port damper height, and the dashed data line is the
PDF of the starboard damper height.
-2 -1 0 1 2 3 40
1
2
Port Pontoon PDF
-2 -1 0 1 2 3 40
1
2
Pro
ba
bili
ty D
en
sity
Stbd Pontoon PDF
PDF of New Suspension Vertical Accelerations in SS1
-2 -1 0 1 2 3 40
1
2
Acceleration, g (up = positive)
Payload Vert PDF
Page 79
66
Figure 5-4: PDF of new damper percent compression during Run 1
Figure 5-5: PDF of new damper percent compression during Run 2
0 20 40 60 80 1000
0.01
0.02
0.03
0.04
0.05
0.06
0.07
Damper Percent Compressed, %
Pro
ba
bili
ty D
en
sity
PDF of New Suspension Damper Compression in SS1
Port Damper PDF
Stbd Damper PDF
Compression Bumper
Extension Limit Straps
0 20 40 60 80 1000
0.005
0.01
0.015
0.02
0.025
0.03
0.035
0.04
0.045
0.05
Damper Percent Compressed, %
Pro
ba
bili
ty D
en
sity
PDF of New Suspension Damper Compression in SS1
Port Damper PDF
Stbd Damper PDF
Compression Bumper
Extension Limit Straps
Page 80
67
Figure 5-6: PDF of new damper percent compression during Run 3
Throughout the course of SS1 testing of the new suspension, the seas varied slightly from test to
test. Table 5-2 shows the average and range that the dampers were compressed for each run, as
determined from Figures 5-4 to 5-6.
Table 5-2: Average, Minimum, and Maximum Percent of Damper Compression
Run # Damper Setting % Compression of Damper
Minimum Average Maximum
Run 1 Middle 18 35 63
Run 2 Maximum 13 35 70
Run 3 Minimum 10 35 80
According to Table 5-2, Run 2 was conducted in seas that were slightly rougher than during Run
1. Even with a higher damping rate, Run 2 has more suspension movement than Run 1, proving
that the seas during Run 2 were rougher. Video taken from SS1 testing shows that Run 2 was
conducted in rougher seas, confirming what is observed in the data.
0 20 40 60 80 1000
0.005
0.01
0.015
0.02
0.025
0.03
0.035
0.04
0.045
Damper Percent Compressed, %
Pro
ba
bili
ty D
en
sity
PDF of New Suspension Damper Compression in SS1
Port Damper PDF
Stbd Damper PDF
Compression Bumper
Extension Limit Straps
Page 81
68
Figure 5-7 shows the PDF of the suspension ball joint height of Run 2. Since the relationship
between ball joint and damper height is linear, the ball joint heights of Runs 1 and 3 follow the
trend of their respective PDFs and are not shown.
Figure 5-7: PDF of new suspension ball joint height of Run 2
Significant differences could not be determined between damper settings from the SS1 testing of
the suspension. Without significant waves to induce suspension movement, the operator was not
able to definitively determine which damper setting was optimal for the WAM-V in an SS1.
With preload on the spring, the suspension ride height was at a position that allowed for more
compression stroke than extension. The analysis on SS2 suspension testing in the following
section will show that the preload during SS1 testing would have been preferred had it been
possible. It should be noted that SS1 testing of the new suspension was conducted after SS2,
which is why the suspension was not preloaded during SS2 testing.
0 5 10 15 20 25 300
0.02
0.04
0.06
0.08
0.1
0.12
0.14
0.16
0.18
0.2
Ball Joint Height, in
Pro
ba
bili
ty D
en
sity
PDF of New Suspension Ball Joint Height in SS1
Port Ball Joint Height PDF
Stbd Ball Joint Height PDF
Compression Bumper
Extension Limit Straps
Page 82
69
5.3 Sea State 2 Results
Testing in SS2 waters was conducted at the Naval Station in Norfolk, VA on June 26, 2012 with
the stock suspension, and on December 11, 2012 with the new suspension. Both tests were
conducted in the Willoughby Bay/Thimble Shoals area near Norfolk, VA. The testing conditions
on each day are listed in Table 5-3.
Table 5-3: Testing Conditions in Sea State 2 Waters
Jun. 26, 2012 Dec. 11, 2012
Suspension Stock New
Sea state Hi2/Lo3 2
Wave heights n/a 2-3+ ft
Wind SW 10-15 kts 15-20 kts
Ambient temperature 99 degrees F 50 degrees F
Water temperature 75 degrees F 50 degrees F
The setup of the stock suspension during SS2 testing included the airspring at a pressure of
25psi. For SS2 testing of the new suspension, the 500lb/in spring was used with no preload,
resulting in a suspension ride height of approximately 19 inches on both sides. Due to the rough
sea conditions, a more precise measurement of the ride height could not be taken without risking
safety. The new dampers were adjusted to their middle setting: six clicks on the main adjustment
knob, and maximum on the fine adjustment knob.
Due to sensor issues during June testing of the stock suspension, only one-half hour of data from
that day is usable. The starboard suspension potentiometer slipped and became loose about 15
minutes into the test, and the port suspension potentiometer broke about 30 minutes into the test.
PDFs were generated for the pontoon bows and payload tray vertical accelerations seen
throughout both testing days. Figures 5-8 and 5-9 compare the acceleration ranges seen during
stock and new suspension testing in SS2, respectively. Approximately 15 minutes of data were
used from the stock suspension testing, while 10 minutes of data were used from the new
suspension testing. Even though both suspension tests were conducted in SS2, accelerations
seen during new suspension testing were about two times greater than accelerations during stock
suspension testing.
Page 83
70
Figure 5-8: PDF of vertical accelerations during stock suspension testing
Figure 5-9: PDF of vertical accelerations during new suspension testing
-10 -5 0 5 10 150
1
2
Port Pontoon PDF
-10 -5 0 5 10 150
1
2
Pro
ba
bili
ty D
en
sity
Stbd Pontoon PDF
PDF of Stock Suspension Vertical Accelerations in SS2
-10 -5 0 5 10 150
1
2
Acceleration, g (up = positive)
Payload Vert PDF
-10 -5 0 5 10 150
0.5
1
Port Pontoon PDF
-10 -5 0 5 10 150
0.5
1
Pro
ba
bili
ty D
en
sity
Stbd Pontoon PDF
PDF of New Suspension Vertical Accelerations in SS2
-10 -5 0 5 10 150
1
2
Acceleration, g (up = positive)
Payload Vert PDF
Page 84
71
PDFs were generated for the heights of the suspension to see where the suspension was typically
operating in SS2 waters over a long period of time. The data chosen from the stock suspension
testing was after the starboard suspension potentiometer was broken, so only the port suspension
was plotted. Both suspensions were plotted for the new suspension data.
The port stock airspring height PDF is shown in Figure 5-10. The solid data line represents the
PDF of the airspring height. The vertical dashed line represents when the airspring comes into
contact with the compression bumper. The vertical dotted line indicates when the airspring has
crossed the lower limit of the “do not operate” zone recommended by the manufacturer. The
vertical solid line is the suggested maximum height of the airspring. The vertical dash-dotted
line indicates when the airspring comes into contact with the extension limit straps. SS2 testing
of the stock suspension shows that the airspring operated mostly in and over the “do not operate”
zone suggested by the manufacturer. Figures 5-11 and 5-12 show the PDF for the percentage
that the dampers are compressed during SS2 testing of the stock and new suspensions,
respectively. The vertical dash-dotted line on the plots represents the height at which the
dampers hit the extension limit straps, and the vertical dotted line indicates when the dampers hit
the compression bumper.
Figure 5-10: PDF of stock airspring height through SS2
0 5 10 15 200
0.05
0.1
0.15
0.2
0.25
0.3
0.35
Spring Height, in
Pro
ba
bili
ty D
en
sity
PDF for Stock Spring Height in SS2
Port Spring Height PDF
Compression Bumper
Extension Limit Straps
Do Not Operate Above this Line
Max Spring Height
Page 85
72
Figure 5-11: PDF of stock damper percent compression through SS2
Figure 5-12: PDF of new damper percent compression through SS2
-20 0 20 40 60 80 1000
0.005
0.01
0.015
0.02
0.025
0.03
0.035
Damper Percent Compressed, %
Pro
ba
bili
ty D
en
sity
PDF of Stock Suspension Damper Compression in SS2
Port Damper PDF
Contact with Bump Stop
Straps Engaged
-20 0 20 40 60 80 1000
0.005
0.01
0.015
0.02
0.025
0.03
Damper Percent Compressed, %
Pro
ba
bili
ty D
en
sity
PDF of New Suspension Damper Compression in SS2
Port Damper PDF
Stbd Damper PDF
Compression Bumper
Extension Limit Straps
Page 86
73
It is easy to see that the dampers chosen for the new suspension are better suited for the 33ft
WAM-V. The majority of the test had the new damper at 50% compression whereas the stock
dampers were at about 35% compression. The stock dampers engage the extension limit straps
multiple times and even extend past its maximum height of 8 inches, which could have damaged
the dampers. The new dampers are far from extending to their full stroke of 9 inches. The new
dampers do compress to hit the compression bumper, but do not fully compress.
Figures 5-13 and 5-14 show the PDFs for the ball joint heights of the stock suspension and new
suspension, respectively, through SS2 testing. The vertical dash-dotted line represents the height
at which the ball joint heights contact the compression bumper, and the vertical dotted line
indicates when the ball joint heights hit the extension limit straps. The solid and dashed data
lines, if applicable, are the PDFs of the port and starboard ball joint heights, respectively.
Page 87
74
Figure 5-13: PDF of stock suspension ball joint height through SS2
Figure 5-14: PDF of new suspension ball joint height through SS2
0 5 10 15 20 25 300
0.02
0.04
0.06
0.08
0.1
0.12
0.14
0.16PDF of Stock Suspension Ball Joint Height in SS2
Ball Joint Height, in
Pro
ba
bili
ty D
en
sity
Port Ball Joint Height PDF
Compression Bumper
Extension Limit Straps
0 5 10 15 20 25 300
0.02
0.04
0.06
0.08
0.1
0.12
Ball Joint Height, in
Pro
ba
bili
ty D
en
sity
PDF of New Suspension Ball Joint Height in SS2
Port Ball Joint Height PDF
Stbd Ball Joint Height PDF
Compression Bumper
Extension Limit Straps
Page 88
75
The PDFs of the ball joint heights also show that the new suspension is better suited for the
WAM-V than the stock suspension, which makes sense because the relationship between ball
joint and damper height is linear. The new suspension travels in the middle of the stroke of the
ball joint, never engaging the extension limit strap, and only hitting the compression bumper
occasionally while never fully bottoming out. The stock suspension does not bottom out either,
but that is due to the fact that it rides so close to the fully extended height of the ball joint that it
causes it to instead engage the extension limit straps over and over.
The broad overview of the two suspensions shows that the new suspension is better suited for the
33ft WAM-V. The following analysis is of a shorter time period, indicating the performance of
the suspension over one wave event.
5.4 Individual Wave Event Analysis
For a more detailed analysis of the differences between each suspension, two wave events for
each suspension were utilized for comparison purposes. The first wave event was a 2-foot wave
extracted from SS2 testing of each suspension. The second wave event was a 4-foot wave
extracted from calm water testing for the stock suspension, and SS2 testing for the new
suspension. Detailed descriptions of each wave event are provided in the following sections to
explain why these waves are comparable to a certain degree. The 500lb/in spring was installed
without preload for the new suspension for both waves.
Each wave event has been broken down into seven phases to analyze the suspension. The seven
phases help analyze the dynamics of each suspension as the WAM-V makes its way over the
wave. The phases are as follows:
Phase 1: Initial Encounter
Phase 2: Loading
Phase 3: Unloading
Phase 4: Freefall
Phase 5: Initial Impact
Phase 6: Maximum Compression
Phase 7: End
Page 89
76
At each phase, both suspensions are discussed to show the differences. Screenshots at each
phase show the WAM-V from the chase boat. Zoomed-in pictures of the operator and
suspension are overlaid on the WAM-V picture to better identify those components.
Throughout the seven phases of analysis on each wave, certain plots are shown repeatedly. This
is done to specifically look at the dynamics during each phase of the wave event. The figures are
annotated for the specific phase to point out the key differences between the two suspensions.
5.4.1 Two-Foot Wave Event Analysis
Since the majority of the rougher waves in the June testing of the stock suspension were seen
after the two suspension potentiometers malfunctioned, the highest wave encountered in the
remaining usable data was about 2 feet. Fortunately, the test in December of the new
suspension, though rougher at times, also contained 2-foot waves. Looking through the video
footage, a 2-foot wave was found with each suspension that was comparable to each other.
During testing of the stock suspension, the 33ft WAM-V encountered a wave about 2 feet in
height while traveling at approximately 12 knots. This wave event caused the port pontoon to be
launched into the air while the starboard pontoon maintained contact with the water. In testing
of the new suspension, the WAM-V encountered a wave of about the same height while traveling
at 10 knots. This time the starboard pontoon was launched into the air as the port pontoon stayed
on the water.
For the stock suspension testing, the zoomed-in picture of the operator comes from the CCD
camera mounted at the back of the payload tray because the angle of the video from the chase
boat does not fully capture the response of the operator.
Phase 1: Initial Encounter occurs before the WAM-V has encountered the wave. Figures 5-15
and 5-16 are screenshots of the stock and new suspension wave event at Phase 1, respectively.
Without any waves, the operator is in a normal sitting position with his hands in the controller
pouch for both tests.
Page 90
77
Figure 5-15: Phase 1 screenshot of stock suspension testing
Figure 5-16: Phase 1 screenshot of new suspension testing
The suspension ball joint heights for both tests are shown in Figure 5-17 to highlight Phase 1.
The stock and new suspensions are plotted on the same graph: the port ball joint height for the
stock suspension, and the starboard ball joint height for the new suspension. Those specific
suspension sides were chosen based on which pontoon was lifted out of the water. Both
Page 91
78
suspensions are at about their respective ride height before the wave is encountered, with the
stock suspension riding higher than the new suspension. The stock suspension height is shown
by the solid data line, and the new suspension by the dashed data line. The horizontal dash-
dotted line represents the extension limit strap height of the stock suspension, while the
horizontal dashed line shows the new suspension extension limit strap height. Differences
between the extension limit strap heights are present because the straps themselves are different
for each suspension. Also, the new suspension uses one strap while the stock suspension uses
two. Both suspensions have the same height when the compression bumper is engaged,
indicated by the horizontal dotted line. Vertical dashed lines are overlaid on each graph and
marked as the seven phases of each event.
Figure 5-17: Phase 1 ball joint height of stock and new suspensions
Phase 2: Loading occurs when the WAM-V first encounters the wave, causing the pontoons to
fold back slightly. Figures 5-18 and 5-19 are screenshots of each suspension at Phase 2. The
operator is still seated in a normal position for both tests.
-1 0 1 2 3 40
5
10
15
20
25
30Stock and New Suspension Ball Joint Height in 2ft Wave
Time, sec
Ba
ll Jo
int H
eig
ht, in
Stock Suspension
New Suspension
Stock Extension Limit Strap
New Extension Limit Strap
Compression Bumper
Initial suspension height
1 2 6543 7
Page 92
79
Figure 5-18: Phase 2 screenshot of stock suspension testing
Figure 5-19: Phase 2 screenshot of new suspension testing
Figure 5-20 highlights the suspension ball joint heights of the stock and new suspensions. Both
suspensions compress by about 35% of their total stroke. The new suspension has a greater
change in height than the stock suspension but, due to its increased amount of total stroke, it
compresses about the same percentage of the total stroke as the stock suspension.
Page 93
80
Figure 5-20: Phase 2 ball joint height of stock and new suspensions
Figures 5-21 and 5-22 are pontoon bow and payload tray vertical acceleration plots that highlight
Phase 2 with the stock and new suspensions, respectively. With the stock suspension installed,
the peak acceleration of the pontoon bow (solid data line) is 0.7g, while the peak acceleration of
the payload tray vertical acceleration (dashed data line) is 0.4g, showing 42% attenuation
between the pontoon and payload tray. With the new suspension installed, the peak vertical
acceleration of both the pontoon bow and payload tray is 0.7g, showing no attenuation between
the two.
-1 0 1 2 3 40
5
10
15
20
25
30Stock and New Suspension Ball Joint Height in 2ft Wave
Time, sec
Ba
ll Jo
int H
eig
ht, in
Stock Suspension
New Suspension
Stock Extension Limit Strap
New Extension Limit Strap
Compression Bumper
3 4 5 6 71 2
Suspensionheight atinitialencounter
Page 94
81
Figure 5-21: Phase 2 pontoon and payload vertical accelerations with stock suspension
Figure 5-22: Phase 2 pontoon and payload vertical accelerations with new suspension
-1 0 1 2 3 4-4
-3
-2
-1
0
1
2
3
4Stock Suspension Pontoon Bow and Payload Vertical Accelerations in 2ft Wave
Time, sec
Acce
lera
tio
n, g
(u
p =
po
sitiv
e)
Pontoon Bow Vert Accel
Payload Vert Accel
1 2 3 4 5 6 7
Peak accelerationof 0.7g for pontoonand 0.4g for payload
-1 0 1 2 3 4-4
-3
-2
-1
0
1
2
3
4New Suspension Pontoon Bow and Payload Vertical Accelerations in 2ft Wave
Time, sec
Acce
lera
tio
n, g
(u
p =
po
sitiv
e)
Pontoon Bow Vert Accel
Payload Vert Accel
1 2 3 4 5 6 7
Peak accelerationsof 0.7g for bothpontoon and payload
Page 95
82
Phase 3: Unloading of the wave events has one of the pontoons launched into the air while the
other maintains contact with the water. Figure 5-23 shows the port pontoon being launched into
the air to reach its maximum height off the water during the stock suspension test. Figure 5-24
shows the starboard pontoon being launched into the air to reach its maximum height off the
water during the new suspension test. In both instances, the operator is still seated.
Figure 5-23: Phase 3 screenshot of stock suspension testing
Figure 5-24: Phase 3 screenshot of new suspension testing
Page 96
83
Figure 5-25 shows the suspension ball joint height of the stock and new suspensions. With the
stock suspension setup, the suspension hits its maximum height and pulls on the extension limit
straps. The height of the stock suspension extension limit strap is indicated by the horizontal
dash-dotted line. The new suspension also reaches its maximum height but does not engage the
extension limit straps. The height of the new suspension extension limit strap is indicated by the
horizontal dashed line.
Figure 5-25: Phase 3 ball joint height of stock and new suspensions
Figure 5-26 shows the vertical accelerations of the pontoon bow and payload tray during Phase 3
of the stock suspension test, while Figure 5-27 shows the same plot for the new suspension test.
During the stock suspension test, the suspension pulls on the limit straps due to the motion of the
WAM-V being launched and from the force generated by the airspring from Phase 2, causing
both the pontoon and payload tray to see a vertical acceleration of -0.7g. The new suspension,
without pulling on the limit straps, also sees a vertical acceleration of -0.7g at the pontoon and
payload tray.
-1 0 1 2 3 40
5
10
15
20
25
30Stock and New Suspension Ball Joint Height in 2ft Wave
Time, sec
Ba
ll Jo
int H
eig
ht, in
Stock Suspension
New Suspension
Stock Extension Limit Strap
New Extension Limit Strap
Compression Bumper
1 2 3 4 5 6 7
Suspensionreaching maxheight duringwave
Page 97
84
Figure 5-26: Phase 3 pontoon and payload vertical accelerations with stock suspension
Figure 5-27: Phase 3 pontoon and payload vertical accelerations with new suspension
-1 0 1 2 3 4-4
-3
-2
-1
0
1
2
3
4Stock Suspension Pontoon Bow and Payload Vertical Accelerations in 2ft Wave
Time, sec
Acce
lera
tio
n, g
(u
p =
po
sitiv
e)
Pontoon Bow Vert Accel
Payload Vert Accel
1 2 3 54 6 7
Peak accelerationsof -0.7g for bothpontoon and payload
-1 0 1 2 3 4-4
-3
-2
-1
0
1
2
3
4New Suspension Pontoon Bow and Payload Vertical Accelerations in 2ft Wave
Time, sec
Acce
lera
tio
n, g
(u
p =
po
sitiv
e)
Pontoon Bow Vert Accel
Payload Vert Accel
1 2 3 4 5 6 7
Peak accelerationsof -0.7g for bothpontoon and payload
Page 98
85
Phase 4: Freefall is when the pontoon is in freefall after traveling over the wave. In Figures 5-
28 and 5-29, the motion of the operator is captured for the stock and new suspension tests,
respectively. During stock suspension testing, the operator is lifted slightly out of the seat,
causing the operator to straighten his arm to keep hold of the railing. During the new suspension
testing, however, the operator is still seated normally as in previous phases.
Figures 5-30 and 5-31 show the vertical accelerations seen by the pontoon and the payload tray
during stock and new suspension testing, respectively. In stock suspension testing, as the WAM-
V goes from rising to falling, the suspension hits the extension limit straps and pulls the payload
tray down with it, causing spikes in the payload vertical acceleration. The operator is lifted into
the air due to the payload tray being pulled away from the operator. In the new suspension
testing, as the suspension reaches its maximum height, the payload tray starts to fall without the
suspension pulling it down via limit straps. The plot shows a smooth transition of the payload
tray from rising to falling. The operator is able to remain seated because the suspension does not
reach the extension limit straps.
Page 99
86
Figure 5-28: Phase 4 screenshot of stock suspension testing
Figure 5-29: Phase 4 screenshot of new suspension testing
Page 100
87
Figure 5-30: Phase 4 pontoon and payload vertical accelerations with stock suspension
Figure 5-31: Phase 4 pontoon and payload vertical accelerations with new suspension
-1 0 1 2 3 4-4
-3
-2
-1
0
1
2
3
4Stock Suspension Pontoon Bow and Payload Vertical Accelerations in 2ft Wave
Time, sec
Acce
lera
tio
n, g
(u
p =
po
sitiv
e)
Pontoon Bow Vert Accel
Payload Vert Accel
1 2 3 4 5 6 7
Payload deceleratesfrom suspension hittingextension limit straps
-1 0 1 2 3 4-4
-3
-2
-1
0
1
2
3
4New Suspension Pontoon Bow and Payload Vertical Accelerations in 2ft Wave
Time, sec
Acce
lera
tio
n, g
(u
p =
po
sitiv
e)
Pontoon Bow Vert Accel
Payload Vert Accel
1 2 3 4 5 6 7
Payload decelerateswithout influence fromsuspension pullingon extension limit straps
Page 101
88
Phase 5: Initial Impact is when the pontoon comes back into contact with the water, but has not
yet fully compressed the suspension. Figures 5-32 and 5-33 show the relevant pontoon coming
into contact with the water once again in the stock and new suspension tests, respectively. In
stock suspension testing, the operator is coming back into contact with the seat, while in new
suspension testing, the operator is still in the same seated position as seen in previous phases.
Figure 5-32: Phase 5 screenshot of stock suspension testing
Figure 5-33: Phase 5 screenshot of new suspension testing
Page 102
89
Figures 5-34 and 5-35 show the vertical accelerations seen by the pontoon bow and pontoon
stern for the stock and new suspension tests, respectively. The pontoon bow acceleration is
represented by the solid data line, and the stern acceleration by the dash-dotted data line. The
minimum and maximum accelerations seen at both ends of the pontoon are listed in Table 5-4.
Table 5-4: Pontoon Maximum and Minimum Accelerations
Pontoon Bow Acceleration, g Pontoon Stern Acceleration, g
Maximum Minimum Maximum Minimum
Stock Suspension 3.5 -2.6 0.7 -0.7
New Suspension 3.9 -2.1 0.6 -0.9
The impact of the pontoon stern occurs after the bow hits the water. The accelerations the stern
of the pontoon experiences are not as high as the bow because the pontoon stern does not come
out of the water as far.
Figures 5-36 and 5-37 show the degree to which the suspension attenuates the motion from
pontoon bow to payload tray during the stock and new suspension tests, respectively. The
pontoon bow and payload tray peak accelerations are shown in Table 5-5, along with the amount
of attenuation that is seen between the two. The new suspension is able to attenuate slightly
more than the stock suspension.
Table 5-5: Attenuation between Pontoon and Payload Tray
Pontoon Bow
Acceleration, g
Payload Tray
Acceleration, g Attenuation, %
Stock Suspension 3.5 1 71
New Suspension 3.9 0.9 76
Page 103
90
Figure 5-34: Phase 5 pontoon bow and stern vertical accelerations with stock suspension
Figure 5-35: Phase 5 pontoon bow and stern vertical accelerations with new suspension
-1 0 1 2 3 4-4
-3
-2
-1
0
1
2
3
4Stock Suspension Pontoon Bow and Stern Vertical Accelerations in 2ft Wave
Time, sec
Acce
lera
tio
n, g
(u
p =
po
sitiv
e)
Pontoon Bow Vert Accel
Pontoon Stern Vert Accel
Max and minfor pontoon bowaccelerations
1 2 3 4 5 6 7
Max and minfor pontoon sternaccelerations
-1 0 1 2 3 4-4
-3
-2
-1
0
1
2
3
4New Suspension Pontoon Bow and Stern Vertical Accelerations in 2ft Wave
Time, sec
Acce
lera
tio
n, g
(u
p =
po
sitiv
e)
Pontoon Bow Vert Accel
Pontoon Stern Vert Accel
1 2 3 4 5 6 7
Max and minfor pontoon bowaccelerations
Max and minfor pontoonsternaccelerations
Page 104
91
Figure 5-36: Phase 5 pontoon and payload vertical accelerations with stock suspension
Figure 5-37: Phase 5 pontoon and payload vertical accelerations with new suspension
-1 0 1 2 3 4-4
-3
-2
-1
0
1
2
3
4Stock Suspension Pontoon Bow and Payload Vertical Accelerations in 2ft Wave
Time, sec
Acce
lera
tio
n, g
(u
p =
po
sitiv
e)
Pontoon Bow Vert Accel
Payload Vert Accel
1 2 3 4 65 7
1g max
3.5g max
-1 0 1 2 3 4-4
-3
-2
-1
0
1
2
3
4New Suspension Pontoon Bow and Payload Vertical Accelerations in 2ft Wave
Time, sec
Acce
lera
tio
n, g
(u
p =
po
sitiv
e)
Pontoon Bow Vert Accel
Payload Vert Accel
1 2 3 4 5 6 7
0.9g max
3.9g max
Page 105
92
Phase 6: Maximum Compression is when the suspension compresses to its minimum height.
Figures 5-38 and 5-39 show the motion of the operator as the suspension is compressed during
the stock and new suspension tests, respectively. The operator is out of the seat and leaning
forward as the stock suspension is subjected to the maximum compression of the wave event.
With the new suspension setup, however, the operator remains seated and is slightly leaning
forward.
Figure 5-38: Phase 6 screenshot of stock suspension testing
Figure 5-39: Phase 6 screenshot of new suspension testing
Page 106
93
Figure 5-40 shows that both suspensions reach their minimum height during Phase 6 without
reaching the minimum height of the suspension. Both suspensions, however, travel about the
same distance. As the new suspension travels within the middle of the suspension stroke, the
stock suspension starts its compression at the extension limit straps.
Figure 5-40: Phase 6 ball joint height of stock and new suspensions
Figures 5-41 and 5-42 show the vertical accelerations of the pontoon bow and payload tray of the
stock and new suspensions, respectively. With the stock suspension, the operator bounces in his
seat and is launched forward and up when the payload tray is subjected to a deceleration of 0.4g
in the longitudinal direction, represented by the dotted data line. With the new suspension
installed, even though the operator is subjected to the same deceleration value of 0.4g in the
longitudinal direction, he only leans forward slightly in the seat. Without the suspension pulling
on the limit straps, the operator has not been lifted into the air and is not launched from the seat.
-1 0 1 2 3 40
5
10
15
20
25
30Stock and New Suspension Ball Joint Height in 2ft Wave
Time, sec
Ba
ll Jo
int H
eig
ht, in
Stock Suspension
New Suspension
Stock Extension Limit Strap
New Extension Limit Strap
Compression Bumper
1 2 3 4 5 6 7
Suspensionheights duringmax compression
Page 107
94
Figure 5-41: Phase 6 pontoon and payload accelerations with stock suspension
Figure 5-42: Phase 6 pontoon and payload accelerations with new suspension
-1 0 1 2 3 4-4
-3
-2
-1
0
1
2
3
4Stock Suspension Pontoon and Payload Accelerations in 2ft Wave
Time, sec
Acce
lera
tio
n, g
(u
p/fo
rwa
rd =
po
sitiv
e)
Pontoon Bow Vert Accel
Payload Vert Accel
Payload Long Accel
1 2 3 4 5 6 7
Longitudinaldeceleration of0.4g
-1 0 1 2 3 4-4
-3
-2
-1
0
1
2
3
4New Suspension Pontoon and Payload Accelerations in 2ft Wave
Time, sec
Acce
lera
tio
n, g
(u
p/fo
rwa
rd =
po
sitiv
e)
Pontoon Bow Vert Accel
Payload Vert Accel
Payload Long Accel
Longitudinaldeceleration of0.4g
1 2 3 4 5 6 7
Page 108
95
Phase 7: End is the end of the event. In both cases, the operator is back in the seat and
continues SS2 testing, as depicted in Figures 5-43 and 5-44, for the stock and new suspensions,
respectively.
Figure 5-43: Phase 7 screenshot of stock suspension testing
Figure 5-44: Phase 7 screenshot of new suspension testing
Page 109
96
Performance improved from switching the stock suspension to the new suspension. The stock
suspension sat too closely to the fully extended side, leaving a lot of room for compression but
not enough for extension. This caused the suspension to constantly hit the limit straps on the
extension side. The new suspension had a more equal amount of compression and extension
stroke, leading to the suspension never hitting the extension limit straps. The new suspension
did contact the compression bumper several times during SS2 testing due to the ride height being
lower than desired, which allowed for slightly more extension stroke than compression. The
following statement is the WAM-V operator’s observations on the new suspension:
“Suspension operation was improved over the original setup. The linear spring and
damper performed well. It did not feel as though the suspension topped out at all. This
was the dominant perception of the original suspension.
Suspension did bottom out once or twice in compression; the bottoming out was not
severe and was due to not setting the ride height at the optimal point.
Slight bottoming out was not as detrimental as I thought it would be.
There was no hard crashing sensation at any time on the WAM-V.”
If possible, the new suspension would have been adjusted on the water to change the amount of
preload on the spring and damping values of the damper. However, due to the water being too
rough, it was not possible to make these changes on the water. More preload and a different
damping value for the new suspension could have improved WAM-V dynamic performance
even more.
5.4.2 Four-Foot Wave Event Analysis
Where the SS2 suspension comparison analyzed the differences between the stock and new
suspension systems over a 2-foot wave, the following analysis will look at the performance of
each suspension over a wave with a height of 4 feet. Analyzing this more extreme case can help
further compare the differences in the suspension systems.
During the first day of testing, on June 21, 2012 in Norfolk, VA, the WAM-V encountered a
stern wake of a freighter ship with the stock suspension installed. The ship produced a single
Page 110
97
wave with a height of approximately 4 feet. The WAM-V was piloted over this wave at a speed
of 10 knots. Traveling at 10 knots over a wave of 4 feet was enough to launch the WAM-V into
the air. Before the wake, the sea conditions were very calm and smooth, so the single wave was
isolated since no other waves were present. This event was later named the Single Wave Input.
Since the Single Wave Input was generated in a very special manner, it was very difficult to find
an instance like it in order to test the new suspension for comparison purposes. However, a wave
similar to the Single Wave Input in height was found during December 11, 2012 testing. The sea
conditions prior to and after the wave were relatively calm for an SS2 day, but nowhere near as
calm as during the Single Wave Input. The wave height was also approximately 4 feet, with the
WAM-V traveling at about 10 knots.
Similar to the SS2 wave breakdown, the Single Wave Input and its counterpart have been broken
down into seven phases for suspension analysis.
Phase 1: Initial Encounter is shown in Figures 5-45 and 5-46, capturing the screenshots of each
encounter before the WAM-V hits the wave. The test with the stock suspension, Figure 5-45,
shows the WAM-V traveling across very calm and flat waters. The test with the new suspension,
Figure 5-46, is relatively calm but rougher than the stock suspension test. In both tests the
operator is in a normal seated position.
Page 111
98
Figure 5-45: Phase 1 screenshot of stock suspension testing
Figure 5-46: Phase 1 screenshot of new suspension testing
Figure 5-47 shows the suspension height of each wave. The solid data line is the stock
suspension height, and the dashed data line is the new suspension height. The horizontal lines
represent the height of the extension limit strap with the stock suspension (dash-dotted) and new
suspension (dashed). The compression bumper contact height for both suspensions is the same,
Page 112
99
indicated by the horizontal dotted line. With the stock suspension installed, the suspension starts
off at a height very close to full extension. The new suspension test shows that the suspension
starts off closer to the mid-stroke of the suspension.
Figure 5-47: Phase 1 ball joint height of stock and new suspensions
Phase 2: Loading occurs as the WAM-V encounters the wave, which is shown in the
screenshots in Figures 5-48 and 5-49. Figure 5-48, with the stock suspension installed, shows
that the bows of the pontoons are bent backwards as the WAM-V encounters the wave. In
Figure 5-49, with the new suspension installed, the pontoons do not bend backwards. This can
be explained by the fact that the pontoons were set at different pressures between the two tests.
During the stock suspension test, the pontoons were filled to 4psi. Due to malfunction of the air
pumps, the pontoons were filled to a pressure closer to 5psi during the new suspension test.
However, in both cases, the operator is in a seated position.
-1 0 1 2 3 40
5
10
15
20
25
30Stock and New Suspension Ball Joint Height in 4ft Wave
Time, sec
Ba
ll Jo
int H
eig
ht, in
Stock suspension
New suspension
Stock extension limit strap
New extension limit strap
Compression bump stop
1 2 3 4 5 6 7
Initial suspension height
Page 113
100
Figure 5-48: Phase 2 screenshot of stock suspension testing
Figure 5-49: Phase 2 screenshot of new suspension testing
Figure 5-50 shows the suspension movement while highlighting Phase One. With the stock
suspension installed, the suspension travels through 85% of its entire stroke, while the new
Page 114
101
suspension only travels through about 40% of its entire stroke. This occurs because the way in
which the WAM-V hits each wave is different. During the stock suspension test, the WAM-V is
traveling in flat waters when it suddenly hits the wave. In the new suspension test, the WAM-V
has some momentum from previous waves, and so it does not hit the wave as suddenly as it did
with the stock suspension.
Figure 5-50: Phase 2 ball joint height of stock and new suspensions
Figures 5-51 and 5-52 plot the vertical accelerations of the pontoon bow and payload during
stock and new suspension testing, respectively. During the test with the stock suspension, the
pontoon experiences a peak acceleration of 0.5g, while the payload experiences 1.5g of vertical
acceleration. Not only does the suspension not attenuate the acceleration, but the payload
actually experiences a higher acceleration than the pontoon. The new suspension test shows that
the peak vertical acceleration of both the pontoon and the payload is 0.7g and again, no
attenuation occurs.
-1 0 1 2 3 40
5
10
15
20
25
30Stock and New Suspension Ball Joint Height in 4ft Wave
Time, sec
Ba
ll Jo
int H
eig
ht, in
Stock suspension
New suspension
Stock extension limit strap
New extension limit strap
Compression bump stop
1 2 3 4 5 6 7
Suspension height atinitial encounter
Page 115
102
Figure 5-51: Phase 2 pontoon and payload vertical accelerations with stock suspension
Figure 5-52: Phase 2 pontoon and payload vertical accelerations with new suspension
-1 0 1 2 3 4
-8
-6
-4
-2
0
2
4
6
8
Stock Suspension Pontoon Bow and Payload Vertical Accelerations in 4ft Wave
Time, sec
Acce
lera
tio
n, g
(u
p =
po
sitiv
e)
Pontoon Bow Vert Accel
Payload Vert Accel
1 2 3 4 5 6 7
Peak accelerationof 0.5g for pontoonand 1.5g for payload
-1 0 1 2 3 4
-8
-6
-4
-2
0
2
4
6
8
New Suspension Pontoon Bow and Payload Vertical Accelerations in 4ft Wave
Time, sec
Acce
lera
tio
n, g
(u
p =
po
sitiv
e)
Pontoon Bow Vert Accel
Payload Vert Accel
Peak accelerationof 0.7g for bothpontoon and payload
1 2 3 4 6 75
Page 116
103
Phase 3: Unloading occurs as the WAM-V is launched into the air and the suspension reaches
its maximum height. Figures 5-53 and 5-54 show the WAM-V being launched into the air
during stock and new suspension testing, respectively. The operator remains seated in both
cases. The pontoons during the new suspension test are launched slightly higher out of the water
due to the momentum generated from previous waves.
Figure 5-53: Phase 3 screenshot of stock suspension testing
Figure 5-54: Phase 3 screenshot of new suspension testing
Page 117
104
Figure 5-55 highlights the suspension ball joint heights of Phase 3 for each event. For the testing
of the stock suspension, the suspension reaches its maximum height, pulling on the extension
limit straps due to the forces seen by the momentum of the payload tray and the forces of the
airspring. The new suspension also reaches its maximum height, but does not engage the
extension limit strap.
Figure 5-55: Phase 3 ball joint height of stock and new suspensions
Figures 5-56 and 5-57 show the vertical acceleration of the pontoon bow and payload tray during
testing of the stock and new suspensions, respectively. With the stock suspension, both the
pontoon and payload tray are subjected to a vertical acceleration of -1g. During the new
suspension testing, the pontoon and payload tray are subjected to a vertical acceleration of -1g as
well.
-1 0 1 2 3 40
5
10
15
20
25
30Stock and New Suspension Ball Joint Height in 4ft Wave
Time, sec
Ba
ll Jo
int H
eig
ht, in
Stock suspension
New suspension
Stock extension limit strap
New extension limit strap
Compression bump stop
Suspension reachingmax height during wave
1 2 3 54 6 7
Page 118
105
Figure 5-56: Phase 3 pontoon and payload vertical accelerations with stock suspension
Figure 5-57: Phase 3 pontoon and payload vertical accelerations with new suspension
-1 0 1 2 3 4
-8
-6
-4
-2
0
2
4
6
8
Stock Suspension Pontoon Bow and Payload Vertical Accelerations in 4ft Wave
Time, sec
Acce
lera
tio
n, g
(u
p =
po
sitiv
e)
Pontoon Bow Vert Accel
Payload Vert Accel
1 2 3 4 5 6 7
Peak accelerationof -1g for bothpontoon and payload
-1 0 1 2 3 4
-8
-6
-4
-2
0
2
4
6
8
New Suspension Pontoon Bow and Payload Vertical Accelerations in 4ft Wave
Time, sec
Acce
lera
tio
n, g
(u
p =
po
sitiv
e)
Pontoon Bow Vert Accel
Payload Vert Accel
Peak accelerationof -1g for bothpontoon and payload
1 2 3 4 5 6 7
Page 119
106
Phase 4: Freefall takes place as the WAM-V has reached its maximum height off the water and
starts falling back down. Figures 5-58 and 5-59 show the WAM-V during freefall for both
events. With the stock suspension installed, shown in Figure 5-58, the payload tray is pulled
downwards while the operator’s momentum continues to carry him up, causing him to leave the
seat, similar to what was seen in the 2-foot wave analysis but more exaggerated. The test with
the new suspension installed, shown in Figure 5-59, shows that the operator remains in the seat.
The data from Figures 5-60 and 5-61 illustrate why the operator was lifted from the seat during
the stock suspension test while remained in the seat during the new suspension test. By plotting
the vertical accelerations of the pontoon and payload tray on the same plot, the interaction
between the two can be seen.
During the stock suspension test, Figure 5-60, the pontoon reaches a peak vertical acceleration of
-1.75g as the payload tray reaches -1.5g. By pulling on the limit straps, the suspension causes
the payload tray to fall faster than it naturally would. This causes the payload tray to fall down
while the operator continues to travel up, pulling the payload tray and seat away from the
operator. During the new suspension test, Figure 5-61, the vertical accelerations of the pontoon
and payload tray are very similar: both components travel at the same rate and follow the same
trend, reaching a vertical acceleration peak of -1g. Since there is no relative acceleration
between the pontoon and payload tray, the operator is not separated from the seat.
Page 120
107
Figure 5-58: Phase 4 screenshot of stock suspension testing
Figure 5-59: Phase 4 screenshot of new suspension testing
Page 121
108
Figure 5-60: Phase 4 pontoon and payload vertical accelerations with stock suspension
Figure 5-61: Phase 4 pontoon and payload vertical accelerations with new suspension
-1 0 1 2 3 4
-8
-6
-4
-2
0
2
4
6
8
Stock Suspension Pontoon Bow and Payload Vertical Accelerations in 4ft Wave
Time, sec
Acce
lera
tio
n, g
(u
p =
po
sitiv
e)
Pontoon Bow Vert Accel
Payload Vert Accel
1 2 3 4 5 6 7
Peak accelerationof -1.75g for pontoonand -1.5g for payload
-1 0 1 2 3 4
-8
-6
-4
-2
0
2
4
6
8
New Suspension Pontoon Bow and Payload Vertical Accelerations in 4ft Wave
Time, sec
Acce
lera
tio
n, g
(u
p =
po
sitiv
e)
Pontoon Bow Vert Accel
Payload Vert Accel
Both pontoon andpayload fall at samerate of -1g
1 2 3 54 6 7
Page 122
109
Phase 5: Initial Impact is when the pontoon bows contact the water, while the pontoon sterns
start to come out of the water. As the WAM-V contacts the water during the stock suspension
test, the operator is still out of the seat, shown in Figure 5-62. During the new suspension test,
Figure 5-63, the operator remains seated as in previous phases.
Figure 5-62: Phase 5 screenshot of stock suspension testing
Figure 5-63: Phase 5 screenshot of new suspension testing
Page 123
110
Figures 5-64 and 5-65 show the vertical accelerations of the bow and stern of the pontoon during
the impact of the stock and new suspensions, respectively. The minimum and maximum
accelerations of both ends of the pontoon are shown in Table 5-6.
Table 5-6: Pontoon Maximum and Minimum Accelerations
Pontoon Bow Acceleration, g Pontoon Stern Acceleration, g
Maximum Minimum Maximum Minimum
Stock Suspension 6 4 5.5 -2.5
New Suspension 8 -7.6 2.3 -2.2
Although the two waves are close to the same height, since the WAM-V was launched higher in
the air during Phase 3 of the new suspension test, the accelerations at the bow are higher than
those encountered during the stock suspension test.
Figures 5-66 and 5-67 show the amount of attenuation seen from the pontoon to the payload tray
during the stock and new suspension tests, respectively. The pontoon and payload tray peak
accelerations are listed in Table 5-7, along with the amount of attenuation between the two.
Table 5-7: Attenuation between Pontoon and Payload Tray
Pontoon Bow
Acceleration, g
Payload Tray
Acceleration, g Attenuation, %
Stock Suspension 6 2 66
New Suspension 8 3.2 60
The new suspension attenuates less than the stock suspension due to the fact that the new
suspension compresses to the point of contacting the compression bumper. The 3.2g at the
payload tray is a result of the impact between the compression bumper and the top of the
pontoon during the new suspension test.
Page 124
111
Figure 5-64: Phase 5 pontoon bow and stern vertical accelerations with stock suspension
Figure 5-65: Phase 5 pontoon bow and stern vertical accelerations with new suspension
-1 0 1 2 3 4
-8
-6
-4
-2
0
2
4
6
8
Stock Suspension Pontoon Bow and Stern Vertical Accelerations in 4ft Wave
Time, sec
Acce
lera
tio
n, g
(u
p =
po
sitiv
e)
Pontoon Bow Vert Accel
Pontoon Stern Vert Accel
Max and minfor pontoon bowaccelerations
Max and minfor pontoonsternaccelerations
3 4 5 6 71 2
-1 0 1 2 3 4
-8
-6
-4
-2
0
2
4
6
8
New Suspension Pontoon Bow and Stern Vertical Accelerations in 4ft Wave
Time, sec
Acce
lera
tio
n, g
(u
p =
po
sitiv
e)
Pontoon Bow Vert Accel
Pontoon Stern Vert Accel
Max and minfor pontoon bowaccelerations
3 4 5 6 7
Max and minfor pontoon sternaccelerations
1 2
Page 125
112
Figure 5-66: Phase 5 pontoon and payload vertical accelerations with stock suspension
Figure 5-67: Phase 5 pontoon and payload vertical accelerations with new suspension
-1 0 1 2 3 4
-8
-6
-4
-2
0
2
4
6
8
Stock Suspension Pontoon Bow and Payload Vertical Accelerations in 4ft Wave
Time, sec
Acce
lera
tio
n, g
(u
p =
po
sitiv
e)
Pontoon Bow Vert Accel
Payload Vert Accel
1 2 3 4 5 6 7
6g max
2g max
-1 0 1 2 3 4
-8
-6
-4
-2
0
2
4
6
8
New Suspension Pontoon Bow and Payload Vertical Accelerations in 4ft Wave
Time, sec
Acce
lera
tio
n, g
(u
p =
po
sitiv
e)
Pontoon Bow Vert Accel
Payload Vert Accel8g max
3.2g max
1 2 3 4 5 6 7
Page 126
113
Phase 6: Maximum Compression is when the suspension is compressed to its minimum height.
Figure 5-68 shows that as the stock suspension fully compresses, the operator is launched
forward. Since he was already out of the seat from Phase 5, adding the longitudinal deceleration
subjected the operator to a whiplash motion. Figure 5-69 shows that as the new suspension
reaches its fully compressed position, the operator is leaning forward from the impact. The
impact, although greater than that seen with the stock suspension, has a lesser effect on the
operator since he remained in contact with the seat from the previous phases.
Figure 5-68: Phase 6 screenshot of stock suspension testing
Figure 5-69: Phase 6 screenshot of new suspension testing
Page 127
114
Although a very hard impact occurred, Figure 5-70 shows that the stock suspension is not fully
compressed, whereas the new suspension contacts the compression bumper. The stock
suspension travels about 90% of its total stroke during the maximum compression phase, while
the new suspension travels about 80% of its total stroke. Because the new suspension can be
tuned for slightly more compression stroke, it can be less prone to bottoming out when the
WAM-V encounters a large wave.
Figure 5-70: Phase 6 ball joint height of stock and new suspensions
Figures 5-71 and 5-72 show why the operator was launched forward during the stock and new
suspension testing, respectively. As the WAM-V impacted the water to maximum compression,
a longitudinal deceleration of 1.25g was recorded for the stock suspension test. This
deceleration, paired with the fact that the operator was already out of the seat from previous
phases, caused the operator to be launched forward. Although the longitudinal deceleration for
the new suspension test was greater (3.1g), the operator was not launched from the seat because
he was properly seated through the previous phases.
-1 0 1 2 3 40
5
10
15
20
25
30Stock and New Suspension Ball Joint Height in 4ft Wave
Time, sec
Ba
ll Jo
int H
eig
ht, in
Stock suspension
New suspension
Stock extension limit strap
New extension limit strap
Compression bump stop
1 2 3 4 5 6 7
Suspensionheights duringmax compression
Page 128
115
Figure 5-71: Phase 6 pontoon and payload accelerations with stock suspension
Figure 5-72: Phase 6 pontoon and payload accelerations with new suspension
-1 0 1 2 3 4
-8
-6
-4
-2
0
2
4
6
8
Stock Suspension Pontoon and Payload Accelerations in 4ft Wave
Time, sec
Acce
lera
tio
n, g
(u
p/fo
rwa
rd =
po
sitiv
e)
Pontoon Bow Vert Accel
Payload Vert Accel
Payload Long Accel
1 2 3 4 5 6 7
Longitudinaldeceleration of1.25g
-1 0 1 2 3 4
-8
-6
-4
-2
0
2
4
6
8
New Suspension Pontoon and Payload Accelerations in 4ft Wave
Time, sec
Acce
lera
tio
n, g
(u
p/fo
rwa
rd =
po
sitiv
e)
Pontoon Bow Vert Accel
Payload Vert Accel
Payload Long Accel
Longitudinaldeceleration of3.1g
1 2 3 4 5 6 7
Page 129
116
Phase 7: End is the end of the event. The operator regains his seat during the stock suspension
test, Figure 5-73, while the operator sits up during the new suspension test, Figure 5-74.
Figure 5-73: Phase 7 screenshot of stock suspension testing
Figure 5-74: Phase 7 screenshot of new suspension testing
Page 130
117
Overall, performance is improved from switching the stock suspension to the new suspension.
Even though the stock suspension was able to attenuate more shock from the pontoon to the
payload tray, the new suspension provided an overall steadier ride for the operator, keeping him
in, rather than separating him, from the seat.
In this more extreme 4-foot wave case, it is easily seen that the operator would have been thrown
in and out of his seat during a test of higher sea state with the stock suspension installed. The
stock suspension simply rode too close to being fully extended. Preloading the spring, which
was done in SS1 testing on December 14, would have raised the ride height by 1.5 inches,
allowing more compression stroke. If SS1 testing had taken place before SS2 testing of the new
suspension, this preload would have been implemented.
Page 131
118
Chapter 6 Conclusions and Recommendations
This chapter discusses the findings of this research and provides recommendations for future
testing of the 33ft WAM-V.
6.1 Conclusions
By replacing the stock suspension of the 33ft WAM-V with a new suspension comprised of
components more suitable for the size of the vessel, the performance of the WAM-V was
improved. Improvements were demonstrated quantitatively in the dynamics of the suspension,
and qualitatively in the way the operator responded to the wave-induced impacts during testing.
The stock suspension components were not best suited for the characteristics of the 33ft WAM-
V. The stock airspring was intended for commercial buses and provided too much spring force,
causing the suspension ride height (21 inches) to be near its total stroke (23 inches). Such a high
ride height caused the suspension to frequently reach its extension limit straps, leading to large
acceleration peaks at the payload tray and a very harsh ride for the operator.
New suspension components were chosen from analyzing the stock suspension dynamics during
tests, and by determining weight values of the sprung and unsprung masses. As a result, a new
coil-over-spring suspension was chosen to replace the stock suspension. The new suspension
includes a more appropriately-sized spring rate for the weight of the WAM-V, and an adjustable
damper that provides a wide range of damping values.
Testing of each suspension in Sea State 2 (SS2) provided data that determined the effectiveness
of the new suspension. A comparison of the ride heights over a period of time while the vessel
was in SS2 conditions showed that the stock suspension had a 70/30 compression-to-extension
stroke ratio, while the new suspension has a more desirable 50/50 ratio.
Direct comparisons of the two suspension systems were made by evaluating similar occurrences
from different days of testing, in particular, for single wave events of nearly identical amplitudes.
The new suspension proved to be more appropriate than the stock suspension. The ride height of
the new suspension was closer to the mid-stroke of the suspension, while the stock suspension
was closer to the extension limit, often overextending the suspension and engaging the extension
Page 132
119
limit straps. When the extension limit straps are engaged, the suspension is disabled and the
impact at the pontoons passes through to the payload tray. During a 2-foot wave encounter, the
new suspension did not hit the compression bumper or the extension limit straps, allowing the
suspension to fully function and not jolting the operator out of his seat for the entire wave event.
The stock suspension, however, reached the extension limit straps multiple times, causing the
operator to be jolted out of the seat.
Each suspension system was also analyzed when the WAM-V encountered an extreme wave of 4
feet. While the stock suspension engaged the extension limit straps, the new suspension was
fully compressed and hit the compression bumper. The operator of the WAM-V during both
events stated that full compression of the new suspension was much less harsh than the full
extension of the stock suspension. The operator was lifted from his seat and jolted forward when
the suspension fully extended with the stock suspension, but remained in the seat during the
entire event with the new suspension.
The overall conclusion is that the new suspension design not only provides a better ride height
that utilizes the most of the total suspension stroke, it also provides a more stable response in
which the operator and the onboard payload are less likely to experience harsh impacts or be
jolted around.
6.2 Recommendations
Further testing of the WAM-V is needed to optimize the performance of the new suspension.
Tests under the same input conditions would provide the best comparisons between different
suspensions and settings.
A recommendation for future testing of the 33ft WAM-V is to conduct tests in a repeatable
situation. In the case of the SS2 analysis, finding waves of similar height and dynamic intensity
was quite difficult, particularly as the tests are often performed in different seasons and sea
conditions. The random sea conditions do not allow for repeatable tests that can be easily
compared with each other, making the task of evaluating different components nearly
impossible. Therefore, a repeatable and accessible test environment that can be used for design
of experiments in evaluating various WAM-V components is highly desirable.
Page 133
120
Due to the varying conditions during sea trails, the operator and data do not agree on which
suspension is the better of the two. The preferred suspension of the operator is the new
suspension, due to the fact that hitting the extension limit straps causes a much harsher response
than hitting the compression bumper. Rather than being pushed up and forward out of the seat,
which occurs when the extension limit straps are engaged, the operator remains in the seat, a
result of the suspension contacting the compression bumper.
Despite the operator’s preference, the data does not definitively show that the new suspension is
the better choice. When analyzing the suspension ride height, the new suspension provides a
better result. However, when analyzing the accelerations seen by the pontoons and payload tray,
the data is inconclusive. During the 2-foot individual wave event, the data shows the new
suspension being the better suspension, attenuating 76% of the acceleration from the pontoon to
the payload tray, while the stock suspension attenuated 71%. However, during the 4-foot
individual wave event, the data shows the stock suspension being the better suspension,
attenuating 66% of the acceleration from pontoon to payload tray, while the new suspension
attenuated 60%.
A two-post test rig would be beneficial by providing the ability to run multiple tests with the
same external inputs. In this way, more comparable suspension data can be generated with
identical external inputs to determine which suspension is better suited for the 33ft WAM-V.
The test rig can also significantly assist with tuning the suspensions for improved operator
comfort and boat stability.
The two-post rig that is under construction at CVeSS will be able to test WAM-V designs (both
existing and future) under the same input parameters repeatedly. A more accurate comparison of
the vessel’s components can be made with the boat undergoing the same external inputs. Tests
can be run to determine the response of the boat to various dynamic events, and the results can
be evaluated both objectively, through analyzing the test data, and subjectively, through riding
the boat while being shaken.
Page 134
121
References
[1] Ahmadian, M. and Peterson, A. “Simulation and Testing of Wave-adaptive Modular
Vessels.” Fast 2011 Conference. Honolulu, Hawaii, September.
[2] Ahmadian, M., Craft, M., Peterson, A., Shen, A. “Dynamic Evaluation of Controllable
Suspension Systems for Future Generation of Watercrafts.” Office of Naval Research
Annual Award Review, 2012.
[3] Dixon, J. Tires, Suspension, and Handling. 2nd ed. Warrendale, PA: Society of
Automotive Engineers, 1996. 215-22.
[4] Dixon, J. The Shock Absorber Handbook. Warrendale, PA: Society of Automotive
Engineers, 1999. 249-67.
[5] Engineering Manual & Design Guide. Firestone, 2007.
[6] Fratello, J. “Multi-body Dynamics Simulation and Analysis of Wave-adaptive Modular
Vessels.” Virginia Tech, Master’s Thesis, 2011.
[7] Gillespie, T. Fundamentals of Vehicle Dynamics. Warrendale, PA: Society of
Automotive Engineers, 1992. 147-57.
[8] Liam, C. “Testing and Modeling of Shock Mitigating Seats for High Speed Craft.”
Virginia Tech, Master’s Thesis, 2011.
[9] Nagode, C. “Electromechanical Suspension-based Energy Harvesting Systems for
Railroad Applications.” Virginia Tech, PhD Dissertation, 2013.
[10] National Oceanic and Atmospheric Administration National Weather Service. [Online].
http://graphical.weather.gov
[11] Owner’s Operation and Service Manual WAM-V USV 33. Marine Advanced Research,
Inc. 2011
[12] Peterson, A. “Progress Update for Research Wave Adaptive Designs.” NREIP Final
Report, 2010.
Page 135
122
[13] Rill, G. Road Vehicle Dynamics: Fundamentals and Modeling. Boca Raton, FL: CRC,
2012.
[14] Sport Rider Magazine. [Online]. http://www.sportrider.com/
[15] Wohlenhous, D., Abdelsalam, A., Luder III, A., Shen, A. “HLALC: Heavy Lift Army
Landing Craft.” NREIP Final Presentation. West Bethesda, Maryland, July 2010.