RESEARCH CIRCULAR 19 APRIL 1953 EVALUATION OF YELLOW SWEET CORN VARIETIES FOR PROCESSING WILBUR A. GOULD, F. E. JOHNSTONE, Jr., H. D. BROWN, F. A. KRANTZ, Jr., REES DAVIS, J.AMES MAVIS, E. A. CARROLL and NOEL COOPER Ohio Agricultural Experiment Station Wooster, Ohio
Transcript
RESEARCH CIRCULAR 19 APRIL 1953
EVALUATION OF YELLOW SWEET CORN
VARIETIES FOR PROCESSING
WILBUR A. GOULD, F. E. JOHNSTONE, Jr., H. D. BROWN,
ACKNOWLEDGMENT Credit is due to Dr. E. K. Alban, Ohio Agricultural Experi
ment Station, who supervised the planning and collection of field data for the 1948 tests.
EVALUATION OF YELLOW SWEET CORN VARIETIES FOR PROCESSING
WILBUR A. GOULD, F. E. JOHNSTONE, Jr., H. D. BROWN,
F. A. KRANTZ, Jr., REES DAVIS, JAMES MAVIS,
E. A. CARROLL and NOEL COOPER
INTRODUCTION
Many new varieties are being produced by breeders. However, all high yielding varieties are not always suitable for processing. The principal objective of this study has been to evaluate sweet corn hybrids and varieties for processing in terms of desirable plant characteristics, ear and kernel which make a variety desirable for processing, whole kernel (whole grain) yellow sweet corn.
Production of sweet corn in Ohio for processing is largely centered in the southeastern and west central part of the state (see map) . If one draws a broad oval with apexes in Hamilton and Franklin Counties it will include roughly two-thirds of the processing plants and approximately two-thirds of the acreage. The variety trials reported herein were conducted in the central part of Franklin County.
The average annual acreage of sweet corn grown in Ohio for processing for 1947 was 23,100 acres, 1948-20,400, 1949-17,700, 1950 -9,600 and 1951-17,300 with a 10-year (1938-47) average of 23,200 acres. The 10-year average yield per acre was 2.1 tons with a high of 3.0 tons in 1948. The 10-year average value of the crop was $660,000 with a high of $1,414,000, reported in 1948 (3).
Since the average production per acre for Ohio is less than the average of the lower yielding varieties reported herein and since it has been determined by inquiry and observation that many of the growers are using the same low yielding varieties tested and since the higher yielding varieties reported herein yield consistently two or more times the state average, it seems probable that the farm value of sweet com in this state can be considerably increased by simply using a better adapted variety.
3
Materials and Methods
A. Varieties and Seed Source Varieties selected for these tests were those known to be
used in Ohio for processing and the newer varieties submitted by the seed companies listed below. A number of varieties and experimental crosses were eliminated on the basis of 194 7 and 1948 preliminary and observational tests. The following companies and individuals generously contributed seed for these trials and are identified as the source of seed in the tables by the letter symbol preceding the company name.
As -Associated Seed Growers, Inc. C -Corneli Seed Company FM-Ferry-Morse Seed Company ML-Michael-Leonard Seed Company R -Robson Seed Farms W -F. H. Woodruff and Sons
An attempt was made to have the same source of seed, but not necessarily the same strain, from year to year in the trials. How-
Fig. 1.-This illustration shows one of the varieties of corn that was checked in this study on the evaluation of yellow sweet corn for processing.
4
ever, this was not always possible for various reasons, but since in only one case was there a statistically significant difference between different strains or stocks of the same variety in the same test that could not be accounted for by difference in stand, it is not believed that this is an important source of error.
B. Soils The plots were located on a Brookston silt loam grading
into a somewhat eroded Miami silt loam. No irrigation was used. Plots were adequately drained with four inch tile. The plots received ten tons of manure plus 1000 pounds per acre of a 5-10-10 plowed down prior to planting the corn in all four years.
C. Plot Design The field trials were arranged in randomized blocks 1/484,
1/286, and 1/208 and 1/145 acres in size for 1948, 1949, 1950, and 1951 respectively. There were four plots each in 1948 and five in 1949, 1950 and 1951. In 1949 most of the varieties were used to obtain data on the processed quality when harvested at different stages of maturity. Since in 1949 one replication was harvested at each of four stages and Since in 1949 one replication was harvested at each of four stages of maturity and the yields obtained are an average of these, the yield data do not lend themselves to statistical analyses. The planting plan was changed in 1950 so as to have two complete plantings adjacent to each other, one for yields and other field data, and the second for the evaluation of the varieties for processing quality.
All plots were in hills three feet apart in the row and thinned to three plants to a hill insofar as stand permitted. Planters were adjusted to plant rows 3~ feet apart but it was found by checking with a tape after emergence that this was not always achieved. Plot sizes in calculations for per acre yields were adjusted accordingly.
D. Field Data (1948, 1949, and 1950) Yield data were obtained by weighing and counting the
pulled ears from each plot for two harvests. Only ears with three inches or more of good com and otherwise usable were harvested. Shanks were included in ear weights if they were normally pulled with the ears. All yield data from replicated plots were analyzed by the analysis of variance method.
Days to 50% silking were obtained on each plot by daily sample counts. Days to main harvest for yield study were from date of planting. Dates of planting were June 5, May 16, May 9, and June 9 for 1948, 1949, 1950, and 1951 respectively. The objective was to
5
plant as soon after May 1 as weather and soil moisture conditions permitted.
Ear characteristics were obtained by taking at random five ears from each plot at time of harvest and obtaining all measurements from these, except that individual weights of unhusked ears were obtained by dividing the total weights by the total number of ears. Length of ear was from butt to end of good filled grains on the cob. Length of shank was measured from junction of shank with stalk to butt of cob. Diameter of butt and tip of ears were measured at points one-fourth of the distance from the butt and tip of cob respectively.
Plant characteristics were obtained on ten stalks taken at random from each plot at time of harvest. Height of stalk was measured from ground at base of stalk to tip of tassel. The height of first ears was taken from same stalks as those utilized for total height and was measured to the node of attachment of the shank of the first good ear. Number of marketable ears per stalk was obtained by dividing the number of ears by the stand. Stands did not include sucker~.
Insect damage was determined by classifying and counting the number of ears showing any damage to kernels from borers or earworms regardless of degree of damage and is expressed as a percentage of the total ears pulled. Smut and bacterial wilt were noted when present. No field data were taken in 1951.
E. Processing In the processing plots there were six replications and
samples for the different dates of maturity were obtained by harvesting one-fourth of each replication at each of four harvests or a total of five hills from each replication. The time to make the first harvest was determined by continuous checking of the plots. Immediately upon harvest each sample was taken to the Processing Laboratory and processed as follows: (see Flow Sheet No. 1 for a schematic diagram of the operations). Upon receipt of the sample the gross weight was taken, the sample hand husked and trimmed. The husked com was washed under a water spray and cleaned further in a soak tank with the aid of a brush to remove the majority of the silks. The corn was cut from the cob with a Food Machinery Corporation No. 2 whole grain single corn cutter. The cut corn was washed in a rotary high pressure spray washer and inspected on a continuous inspection belt. The inspected product was weighed and the percent cut-off was calculated by dividing this weight by the weight of the unhusked corn as received from the field. A two pound sample was removed after the inspection
6
for raw product analysis (discussed below under quality evaluation, also Flow Sheet No. 2) . The corn was placed in a wire mesh blanching basket and blanched in live steam for 4 minutes for the immature and optimum corn and 5 minutes for the mature corn. Immediately after blanching, the basket and contents were immersed in cold running water and held here for the same period of time as used for blanching the sample. The corn was then drained and divided into two equal lots, one-half for freezing and one-half for canning. The sample for
J.la.p No, l LCCATICN OF CORN CJ.N'.JING PUNTS IN OHIO by counties
WILLIAMS FULTON
SUTL.ER
•
• - One canning factory.
7
Flow Sheet 1. Freezing and canning of whole grain corn.
freezing was immediately put into 1 pound cellophane bags, which were heat sealed, and placed in cardboard cartons and the cartons coded. The filled cartons were placed in a single contact plate freezer at -20° F. for 6 hours, removed to 0° F. storage room and held for 6 months.
The sample for canning was filled into No. 2 'C' enamel cans, 13.5 ounces each, covered with boiling water, and exhausted for four minutes. The cans were sealed, coded, processed for 25 minutes at 250° F ., water cooled to l 00° F ., and stored at room temperature for six months. In addition to the above sample for canning, in 1950 and
Flow Sheet 2. Schematic diagram of quality evaluation methods.
Canned Produot
AIS Content ( FDA. Method )
Perioarp Content (Gould Method )
8ucoulence (Kramer Method)
Subjective Evaluation
Representative Sample by
Variety, Harvest and Year
Raw Product
AIS Content ( FDA Method )
Pericarp Content (Gould Method)
Mo1eture Content (Oven & Steinlite)
Succulence (Ira.mer Method)
Soluble Solids (Refractive Inde~)
navor
Tenderness
Color-Unitormit & Bri ht
9
J'rozen Product
AIS Content FDA Method )
Pericarp Content (Gould Method)
Suooulenoe (Iramer Method)
Subjective Evaluation
,,
1951 a separate series of samples at each stage of maturity were processed exactly the same, except that a one and one-half percent salt solution was used as a brine in order to be able to evaluate the flavor of the samples with brine added.
F. Evaluation of Quality The alcohol insoluble solids content ( 1) (Food and Drug
Administration modified method) of the fresh, frozen and canned samples was determined to ascertain the stage of maturity of the corn. The alcohol insoluble solids content is a measure of the crude starch content plus a small amount of other insoluble materials. This was determined by taking duplicate representative 10 gram samples, macerating in a Waring Blendor for 3 minutes with 150 cc. of 80% alcohol, washing into a 600 cc. beaker with another 150 cc. of 80% alcohol and simmering for exactly 30 minutes. The sample was then filtered onto a previously dried and weighed filter paper, washed with 80 percent alcohol until clear and colorless, dried in an electric oven at 100° C. for two hours, cooled in a desiccator and reweighed. The difference in weight multiplied by 10 gives the percent alcohol insoluble the different harvests for the raw, frozen and canned samples was classified into one of the three stages of maturity as shown in Table 1.
Table 1 was calculated from a regression line of percent alcohol insoluble solids of the raw sample on percent alcohol insoluble solids of the canned and frozen samples. A correlation coefficient of 0.956 was found between the alcohol insoluble solids content of the raw and canned product and 0.958 between the raw and frozen product. The Food and Drug Administration has established a tolerance of 27% alcohol insoluble solids content on the canned product; however, 25% was considered in this study to be the maximum limit for mature corn. Since the Food and Drug Administration has established this tolerance and since the alcohol insoluble solids values of raw and canned, and raw and frozen gave the highest correlation; the alcohol insoluble solids con-
TABLE 1 .-Percent Alcohol Insoluble Solids Content as a Standard in Determining Stage of Maturity of Raw, Frozen and Canned Sweet Corn
Producf Young Immature Optimum Mature Overmature
Raw under 10 10 to 15.9 16 to 21.9 22 to 28.0 over 28 Frozen under 10 10 to 15.4 15.5 to 20.9 21 to 27.0 over 27 Canned under 10 10 to 14.4 14.5 to 18.9 19 to 25.0 over 25
10
TABLE 2.-Correlation Coefficients of Objective and Subjective Measures of Quality for 15 Varieties of Raw, Frozen and Canned Yellow Sweet
Corn Hybrids with Maturity (1948, 1949, and 1950 Data)
Product Between Correlation Coefficients "r" Values
Raw <j, AIS and % Soluble Solids 0.742
Raw '/< AIS and Succulence -0.620
Raw '/< AIS and '/o Pericarp 0.823
Raw '/oAIS and % Moisture -0.970
Raw vs. Canned '/< AIS and <fo AIS 0.956
Raw vs. Frozen '/oAIS and <j,, AIS 0.958
Canned Tenderness and <j,, Peri carp -0.897
Canned '/< AIS and Tenderness -0.811
Canned '/< AIS and Succulence -0.879
Canned '/r·AIS and Flavor -0.305
Frozen '/cAIS and Tenderness -0.384
Frozen '/c AIS and Succulence -0.831
Frozen '/c AIS and Flavor 0.089*
•Nol significant. All others significant at 1 'lo level.
tent was thus used as the standard for all other quality measurements. These quality measurements were correlated with the alcohol insoluble solids ( AIS) content as shown in Table 2.
The pericarp content was determined to measure the tenderness of the corn objectively, that is, a measure of the toughness of the kernels ( 8). The pericarp content was determined by macerating duplicate 25 gram samples with 200 cc. of water in a Waring Blendor for exactly three minutes. The slurry was washed on a previously weighed 30-mesh monel screen. This was dried in an electric oven at 100° C. for two hours. The sample and screen were cooled in a desiccator, reweighed and the percent pericarp content was calculated by the difference in weight multiplied by four. The pericarp content was not determined on the 1948 samples.
The moisture content was determined by drying duplicate 100 gram samples in a vacuum oven for two hours under 26 inches of vacuum, cooling the sample for 30 minutes in a desiccator and then weighing. The weight of the sample was then subtracted from 100 and reported as the moisture content. This was determined only on the samples of the last two harvests in 1948 and 1949. In 1950 and 1951, the moisture content was determined with a wet-cell Steinlite Moisture Meter (3a).
11
The succulence was determined on duplicate 100 gram samples using the Succulometer in accordance with the method of Kramer and Smith ( 13). The soluble solids content was determined from the liquid expressed from the Succulometer with a Spencer Refractometer in 1948, 1949, and 1950. In 1951 an Abbe '56 Refractometer was used. The reading was corrected for temperature to 26° C. and then reported as percent soluble solids.
The subjective quality measures were determined by a selected panel of seven judges. The judges were trained on samples previously discussed by the panel to point out distinct differences using Golden Cross Bantam as the standard of quality. This does not mean that Golden Cross Bantam at all stages of maturity was perfect, but it served as a basis to orient the panel. Each sample was scored by each judge individually for uniformity and brightness of color, tenderness
TABLE 3.-Yields, Percent Stan~s and Average Rank of Yellow Sweet Corn Varieties 1948-50
tAll stands in 1948 and 1949 were good. Percents not calculated. :j:Not in same blocks with others in the column but adjacent thereto.
12
1950
4.77 3.55 5.98 4.82
4.10 4.50 4.11 6.28 4.20 5.23 6.55 5.47 7.01
.72
Ave. 1949 1950
2.88
4.56
3.47 3.50 3.59 5.47 4.58 4.25 5.08 4.78
and flavor. Each factor was scored separately from 0 to 10 with 0 being unsatisfactory and 10 being perfect. The scores assigned to each sample by all judges were averaged and reported as such. In 1948 the panel judged the samples only for color and :flavor.
Discussion of Results
The field data are presented in summarized form in Tables 3, 4, and 5 and in detail in the tables in the appendix.
Yields
It was thought at the start of these trials that there were considerable differences in yielding ability of different strains of the same variety. However, using different sources (same strains when indicated on seed tag) of Golden Cross Bantam and Joana, in only one case was there a significant difference that could not be attributed to differences in stand.
Since most of the strains could be considered equal in yielding ability, all data in cases where there were more than one strain or source were averaged in presenting the data in Table 3. For this reason source of seed is not given in this table.
In Table 3 it will be noted that all varieties are not included each year. This is due to the inclusion into the test of new varieties each year and the elimination of those which were clearly inferior. Also, some varieties were omitted because of the failure to obtain sufficient seed in time. In one case at least, one variety was left out of 1949 and 1950 tests because of generally inferior performance but is included in the table because the authors have learned that it is popular with certain groups of growers.
Carmelcross and Seneca Chief are included in the tables only as a tie-in with the later varieties. They probably have no place as processing vanet1es. Golden Cross Bantam is used as a standard of comparison. Since it is difficult to average or rank data of this kind to show all entries comparatively, it is perhaps best to compare each variety individually with Golden Cross Bantam or with some other variety with which the reader is familiar, and which is included in these tests.
The significant characteristic of the yield data seems to be the consistency with which certain newer varieties have outyielded Golden Cross Bantam and Tendermost which have been widely used in Ohio. Golden Security, Flagship, Huron, Oto and Aristogold Bantam Evergreen have consistently appeared among the top three or four varieties,
13
TABLE 4.-Ear and Stalk Characteristics and Insect Damage of Yellow Sweet Corn Varieties in Franklin County, 1950
Ear Characteristics Stalk Characteristics
"Cl .. .. ... :; ~ "Cl 0
~ a :t .. .. - ~= ii "Cl .. ..c: "Cl ... " .. ... u:: c .. c ... c .. .a .. 0 .. ... Ci : § " 0 " :t .. ..c: ....c: -.. .... O; ..c: = .. ii 0 .c .. " .. " o_l II .C .. l Variety - :; i - c -c - .. -" .. ·~ r e_.. 'f: ..c: "f !I !I .. c -..c: ..11- ..c: c .c " .a . - E .. Ill"' m,. ·~·i E ·- me E '"II .. E
C IS ~-5 ·-"Cl :!J .. II)
a- g z II C ; ii c .. ] "I " IS IS '"IS c .. ..! c ~ " .. .c 'ii ii :a Ci ..C:.>< c :! II E z "Cl
m• :-: ll>"'CI e-1 ll>"'CI ll>"'CI m'ln m'ln mo 11) ... IS'" a D. IS_.. !! l IS I> 2 .. s~ !! c !! c !! c IS u 0 .. :e ; .. .. .. c .. II) ..... .. ... .. " - .. .. .. m IS ~; ...... .... .. .... .. .. .. ·- .. ·- ...... .. .. > IS > ..c: > G > " > IS > ..
> " > IS > IS ~z ~Ci ~j *Z c( .. c( .. <- < .. c( ..c: < .. <l < .c < E <E
whereas Golden Cross Bantam and Tendermost have been consistently near the bottom. (see Table 3).
Varieties are arranged in tables in approximate order of maturity as determined by days to 50% silking and days from planting to main harvest. Plant Characteristics
Although no experiments have been conducted to determine the type of plant most desirable from the standpoint of mechanical harvesting, it is believed that the collection and summation of the data on height of plant, height of lower ears, length of shank and number of suckers (Table 4) can be of help in evaluating the worth of the different varieties from this standpoint. It is assumed that exceptionally tall varieties or those that sucker excessively, and also those with the first ears very low or very high would be undesirable from the standpoint of machine harvesting. The average length of shanks added to the height of the first ear node indicates the approximate height above ground of the butt of the ear.
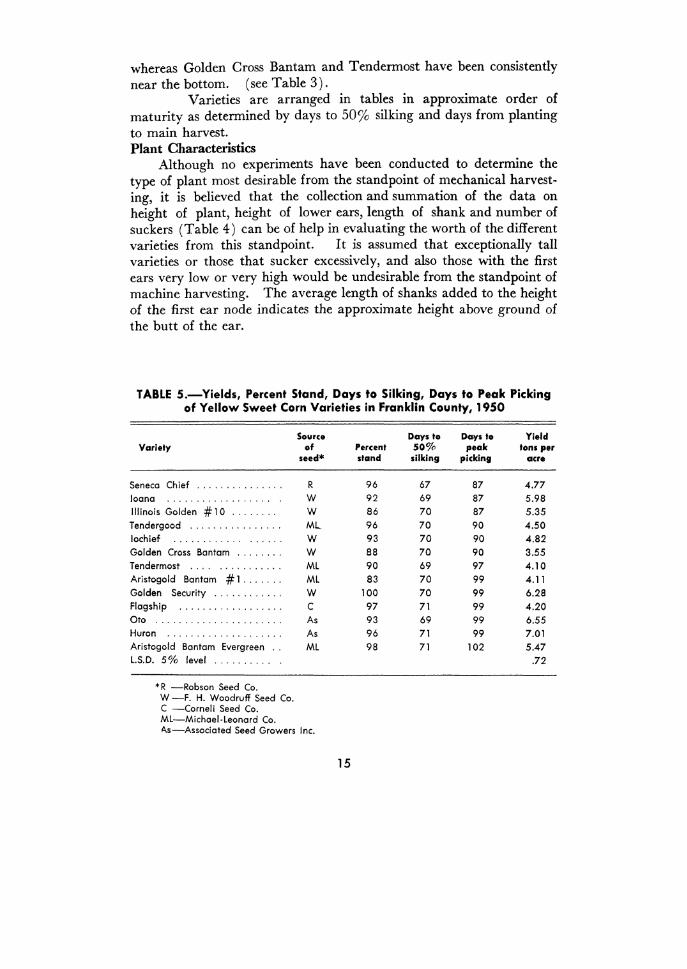
TABLE 5.-Yields, Percent Stand, Days to Silking, Days to Peak Picking of Yellow Sweet Corn Varieties in Franklin County, 1950
Source Days to Days to Yield Variety of Percent 50% peak tons per
seed* stand silking picking ocre
Seneca Chief ....... ' ...... ' R 96 67 87 4.77 loan a .................. w 92 69 87 5.98 Illinois Golden #10 ........ w 86 70 87 5.35 Tendergood ................ Ml_ 96 70 90 4.50 lochlef ............ . . . . . . w 93 70 90 4.82 Golden Cross Bantam ........ w 88 70 90 3.55 Tendermost . . . . ........... ML 90 69 97 4.10 Aristogold Bantam #1 ....... ML 83 70 99 4.11 Golden Security ............ w 100 70 99 6.28 Flagship .................. c 97 71 99 4.20 Oto ...................... As 93 69 99 6.55 Huron .................... As 96 71 99 7.01 Aristogold Bantam Evergreen .. ML 98 71 102 5.47 L.S.D. 5% level .......... .72
*R -Robson Seed Co. W -F. H. Woodruff Seed Co. C -Corneli Seed Co. ML-Michael-Leonard Co. l\s-Associated Seed Growers Inc.
15
Ear Characteristics
Length, diameter of tip, and diameter of butt measurements (Table 4) are attempts to describe the shucked ear irt mathematical terms. The selection of points one-fourth of the distance from each end was made, after observing typical ears from a number of varieties, for measurement of tip and butt diameters. It is believed that except for unusual types the average ear of a variety can be fairly accurately drawn to scale using length and diameter measurements as given, and that the variations to be found from year to year or location to location are fairly accurately represented. These ears may not always represent closely the ideal shape as pictured by salesmen of the variety in question, but present fairly closely the average shape in these tests especially with respect to slope which is of importance to the canner.
Growing Days and Maturity
Total number of growing days i~ perhaps thr olde~t yardstick of drtermining when to harvest any single variety. It is subject to tremendous variation within the different locations of the corn growing section because the seedsmen have assigned an average total number of growing days based on observation within each area of production over the .different years. It was found in this study that growing days is a good measure of degree of maturity after one can determine when to make the first harvest. However, days to the first harvest varied as mudh as from 8 to 11 days during the four years. In 1948, 1949 and in 1951 ac.tual growing days were about the same for the varieties but in 1950 approximately 9 more days were required to mature the corn to the same stage of maturity. At first, this was thought to be due to variations in planting dates among the four years but the 1948 and 1951 corn was planted about the same time and nearly three weeks later than the 1949 and 1950 corn which was planted one week apart. Thus it should be seen that the processor relying entirely on growing days might have standard grade corn wht"n it was actually thought to be in the fancy stage for maturity.
Growing days are important when evaluating varieties as to number of days the corn can be allowed to stand in the field from the time the corn reaches the fancy or grade A stage of maturity to the standard or grade C stage of maturity. Some varieties studied were at a usable maturity for two weeks though others were overmature after only one week. Golden Security was found to be the longest standing variety while Golden Cross Bantam and Toana were found to be the shortest. Usable maturity of most of the other varieties varied from 9
16
TABLE 6.-Relationship of Growing Days, Growth Degree Days, Percent Soluble Solids Content and Percent Peri-carp Content for 12 Varieties of Sweet Corn at Three Stages of Maturity. Average for 4 Years (most varieties).
(Varieties with Only 1 Year Trial Are Not lncluded--see Appendix Tables.)
I st Harvest 2nd Harvest 3rd Harvest
Ill t'a1111 c e-Ill ..c t:- .. !It - e- Ill -!;: GI Cit c e-• E ~ i .... c :ii,, . : ..,.. ~f~ ;:g:!! c a c .. .; QJ"' c :a,,
Variety ~ a e >- G> ~ ·- .. e ~ >- .. u ·~ ~ ~ e >- GJ :Ji·- .. e e,, o 111 a ~ -o ~ "i: f .g oi:rt.g ::!oO ~ ·.:: e,, 0 Ill 0 to"§ ~ "i:: ..... ,, .. 0 .. .... .. .. ... .. ,, .... Cl C>,, ..... ...... C> \;.; :.lftVI ... 0. C> C>,, ... .. ... ...
Average ............. 6.6t 1.21 10.4t 1.54 12.8t 2.05
-*Considered tough. t'48-'49-'50 data only.
to 12 days. The above data were the averages for the four years and with one or two exceptions they were found to be in very close agreement for any variety during the four years for this one factor. These data are summarized in Table 6, and given in detail in Appendix II.
Growth Degree Days and Maturity
The use of the growth degree day or heat unit system is the newest technique employed by several processors to determine when to plant and harvest sweet corn. Growth degree days are determined daily by subtracting the base temperature from the mean temperature for that day. A growth degree unit is one temperature degree above the base growing temperature for the crop. With sweet corn the base temperature has been established as 50° F. ( 4a), thus a mean temperature of 51° F. yields one growth degree day for that day. By knowing the required total number of growth degree days for any variety, a processor can determine how many acres the grower should plant daily in the spring of the year so that he does not have an excess of corn maturing at any time in August and September. That is, if in August the daily average growth degree days ( G.D.D.) was 35 ( G.D.D.) and a variety required 1900 ( G.D.D.) to develop to the desired stage of maturity for the quality contemplated and the packing and the processors' factory had a production capacity of 10 tons per hour for a lO hour day and a particular variety had an average yield of 2.5 tons to the acre, the processor would specify to his growers a maximum of 40 acres planted on the 15th of May and then 40 acres after the accumulation of 35 G.D.D. from each planting until all his acreage has been planted. Thus, the processor is able to project his harvest dates with some systematic i>cheme and prevent all his corn from maturing at one time.
The average growth degree days are given in Table 6 and by years in the Appendix at the three different stages of maturity for each variety. From Table 6, it can be seen that the minimum number of growth degree days is 1801 and a maximum number of 2218. It should be pointed out, however, that these figures are averages for any one variety over the four year period. With a growing season as experienced in 1950 and 1951, one might find considerably less growth degree days than this average for any one stage of maturity. The growth degree days in 1950 were approximately 150 units less than for the previous two years but it required approximately 10 more days to mature the corn to the same stages of maturity. In 1951, the corn required approximately 6 days less than the 4 year average and the corn also
18
required approximately 150 G.D.D. units less than the 4 year average. This can be explained in part by the dry growing season in 1951.
Relationship of Yields and Percent Cut-off
This relationship is perhaps the most important single objective measurement made in this study. In Table 7 the yield data, as taken at the optimum harvest, the percent cut-off and calculated cases per acre and cases per ton packed are given. These data show that a high yield does not necessarily mean that a high total of cases per acre will be packed. In other words, yield data must take into account the amount of waste (husks, cobs, shanks, undeveloped kernels, etc.) and the percentage of cut-off corn. There are two ways of analyzing this data ( 1) from the growers standpoint, that is, cases per acre or ( 2) from the processors standpoint, that is, cases per ton. All the varieties used in this study vary somewhat in yield and cut-off. From the grower's standpoint the varieties with the highest yield in Franklin County were Iochief (5.90 tons/acre, Golden Security (5.47 tons/acre), Victory Golden (5.42 tons/acre), Oto (5.08) and Aristogold Bantam Evergreen (4.78) while Tendergood (3.50), Aristogold Bantam No. 1 (3.59), Tendermost (4.08), Illinois Gold No. 10 (4.25) and Golden Cross Bantam (4.49) were the lowest in yields per acre (Table 3).
TABLE 7.-Relationship of Yield and Percent Cut-off to Quality of Corn Packed per Acre and per Ton (Yield Data From
Optimum Maturity Only). Averages for 4 Years
Yield per Percent Packed corn Oa:ses* Variety Years acre in cut-off per acre per
From a percent cut-off standpoint, Illinois Gold No. 10 (34%), Iochief ( 34%), Aristogold Bantam No. 1 ( 33 % ) and Tendermost (32%) were the highest while Golden Cross Bantam (25%), Oto (26%), Flagship (27%), Victory Golden (27%), and Golden Security ( 28%) were the lowest. In maximum number of cases packed per acre, lochief ( 198.2 cases), Golden Security ( 151.5), Aristogold Bantam Evergreen ( 146.3), and Victory Golden ( 144.7) were the superior varieties while Tendergood ( 103.6 cases), Golden Cross Bantam ( 110.9 cases) and Aristogold Bantam No. 1 (116.7 cases) were the poorest.
In maximum cases packed per ton, Illinois Gold No. 10 (33.6), lochief (33.6), Aristogold Bantam No. 1 (32.5 cases) and Tendermost ( 31.6) were the top varieties; while Golden Cross Bantam ( 24. 7), Oto ( 25. 7 cases), Flagship ( 26. 7 cases) and Victory Golden ( 26. 7) were the poorest.
The above means more when the price per ton and f.o.b. price per case are a.'isociated with any particular variety. As an example, figuring $20.00 per ton for raw corn and the farmer using a low yielding variety, he would receive approximately $60.00 per acre for his corn whereas with the high yielding varieties he would receive approximately $100.00 per acre. The processor on the other hand m:;ing a variety with a low percentage cut-off as contrasted to one with a high percentage cut-off would be able to pack 10 more cases from a given ton of corn. Using a price of $2.00 per case the processor could pay the farmer for the original raw ton of corn from the extra cases packed from a high percentage cut-off corn. Of course, the raw product cost is only a part of the total cost in processing a case of corn and these other costs, such as cans, labor, cartons, etc. must be considered in figuring the cost of producing a case of corn.
In Table 8 the above data are presented for harvest<; at three stages of maturity as determined by measuring the alcohol insoluble solids content. At the first harvest, there is a difference in yields per acre of 3.4 tons with F. M. Cross the best yielding variety while Tendergood and Aristogold Bantam Evergreen were the poorest; in percent cut-off there is a difference of 15% with Tendermost (1951) the best and Victory Golden the poorest; in cases packed per acre there is a difference of over 100 cases per acre with Aristogold Bantam Evergreen tops and Aristogold Bantam No. 1 the poorest; and in cases packed from a ton there is a difference of 15 cases with Tendermost the highest and Victory Golden the poorest.
20
TABLE 8.-'Relationship of Maturity to Y·ield and Percent Cut-off to· Quantity of Packed Corn per Acre and per Ton at Three
Cases-basis 24/ #2 cans per case 113.5 oz. corn per can or 20.25 pounds corn per case.)
At the second harvest there is an average increase for all varieties to 0.46 tons in yield per acre over the previous harvest with Normandie the highest yielder and Aristogold Bantam No. 1 poorest (a difference of 3 .9 tons per acre) ; there was an average increase of 9 .3 % in the Aristogold Bantam Evergreen the highest and F. M. Cross the poorest (a difference of 15.7%); in cases per acre, Aristogold Bantam Evergreen the highest and F. M. Cross the poorest with a difference of 114 cases packed per acre; and in cases packed per ton Aristogold Bantam Evergreen is highest and F. M. Cross is the poorest with a difference of 14.2 cases per ton packed.
At the third harvest, there is an average increase in yield from the second harvest of 0.51 tons per acre for all varieties with F. M. Cross the highest and Tendermost and Aristogold Bantam No. 1 the poorest (a difference of 4.4 tons per acre) ; there was an average increase of 9.2% in the percent cut-off corn with Tendergood, Aristogold Bantam
22
No. 1 and Golden Security the highest while F. M. Cross and Normandie were the poorest (a difference of 18.9%) ; in cases packed from an acre, Golden Security and Iochief are the highest while Tendermost and Golden Cross Bantam are the poorest with a difference of 144 cases per acre; and in cases packed per ton Tendergood is the highest and F. M. Cross and Normandie the poorest with a difference of 10.8 cases.
By averaging the cases per acre packed for the different varieties at the three stages of maturity in the 1950 and 1951 seasons, it appears that Nonnandie (234.8 cases), Golden Security (233.4 cases), Aristogold Bantam Evergreen ( 223.2 cases) and lochief ( 209.9 cases) were the best varieties with Aristogold Bantam No. 1 ( 136.8 cases), Tendergood (157.1 cases) and Tendermost (164.4 cases) the poorer varieties. In the cases packed from a given ton, Aristogold Bantam Evergreen ( 35.4 cases) Golden Security ( 35.1 cases) and Tendermost ( 33.3 cases) were the best varieties with F. M. Cross, Oto and Normandie (24.6 cases) the poorest varieties.
The above data do not fully agree with the optimum harvest data as previously discussed, but the trends are somewhat the same. The difference between the optimum harvest data and the mean of the three harvests data are probably due to ( 1) one year's data for some varieties and not an average of two to four years as the optimum harvest data, and/ or ( 2) not always three stages of maturity harvested when the corn was classified on the alcohol insoluble solids basis (in particular Golden Cross Bantam and Victory Golden).
Quality Evaluation
Quality measurements for raw products data are presented in Table 6, those for the canned product in Table 11 and the frozen product in Table 12, while the detailed data by years and harvests are to be found in the Appendix. It should be mentioned again as pointed out in the experimental procedure that maturity was determined for each harvest classification by determining the alcohol insoluble solids content as shown in Table 1. The alcohol insoluble solids content was thus the means of classifying the corn into the three stages of maturity. In some cases two or more harvests might be averaged if they fell within any one AIS range, thus the reason for lack of data in some places.
Pericarp Content
The pericarp content was determined on the raw, canned and frozen product; but the frozen and canned values agreed within the
23
limits of experimental error to those of the raw values, thus only the raw values are given in Table 6. The pericarp content increased from an average of 1.21 % at the first harvest to 1.54% at the second harvest and up to an average for all varieties of 2.05% at the third harvest. There was a significant difference between harvests. For evaluating varieties we have set a maximum of 2.00% as a limit of acceptability for any variety at any stage of maturity. No attempt was made to evaluate the difference in tenderness between varieties at the immature or first harvest and the optimum or second harvest unless a variety exceeded this value of 2.00%. Thus, a variety exceeding this value at any stage of maturity would be considered high in pericarp content and not highly recommended for processing.
In Table 6 the only variety to exceed this value of 2.00% at the second harvest was Aristogold Bantam Evergreen. At the third harvest Aristogold Bantam Evergreen and Oto were found to contain the highest pericarp content followed by Golden Security, lochief, Illinois Gold No. 10, Victory Golden and Aristogold Bantam No. 1. All of these above varieties were over the proposed 2.00% tolerance. The varieties with the lowest percent pericarp content and those which would be considered highly acceptable to the processors at all stages of maturity are Golden Cross Bantam, Tendermost, Flagship, Joana and Tendcrgood. All of these were below 2.00% at all stages of maturity.
It should be pointed out that the values in 1950 were found to be an average of 0.16% higher than in 1949. This was in accord with the opinions of many corn specialists that the corn seemed to be tougher than normal when evaluated subjectively. However, pericarp value& are averages for the different years and except for Joana and Tendergood which exceeded the 2.00% tolerance in 1950 and Victory Golden in 1951, the above recommendation of the varieties holds true.
Percent Soluble Solids Content as a Means of Determining Maturity
For the raw product, the percent soluble solids as determined by a refractometer is one of the quickest, most reliable methods of determining maturity of yellow sweet corn. The average value for all varieties was 6.6% at the first harvest, 10.4% at the second havest and 12.8% at the third harvest for 1948, 1949, and 1950. The 1951 data is not included since the readings were taken on the Abbe '56 refractometer and the values were considerably higher. Golden Cross Bantam values at the first and third harvests were found to be considerably higher than the averages. All the other varieties were very close to the average for all varieties at any one harvest except Flagship at the first stage of
24
maturity and Tendergood and Tendermost at the third stage of maturity. This method is not a good means for evaluating variety difference as the differences are due to maturity and not due to variety. The differences between years were greater than for variety differences, as in the 1949 season all varieties were found to have much lower values at all stages of maturity than during the 1948 and 1950 seasons. The data for the latter two years were in rather close agreement for the different varieties at the different stages of maturity. After the processor has selected his varieties, he can then set up soluble solids tables to determine the maturity for any one particular variety.
The soluble solids data for the frozen and canned product are not given as the blanching and canning operations leach out considerable quantities of the soluble solids and the differences between varieties and maturity are too small to distinguish differences in maturity or variety on the processed products.
Succulometer Values as a Means of Determining Maturity
The succulence as measured by the Succulometer for each variety at each stage of maturity for the raw, frozen and canned product are given in the Appendix. These values cannot be used to measure varietal differences nor are they entirely reliable as a measure of maturity on the raw product. However, the succulometer values for the canned and frozen products do measure the differences in maturity. Table 9 gives the averages for each stage of maturity for the raw, frozen and canned products.
TABLE 9.-Average Succulometer Values for Three Stages of Maturity of Raw, Frozen and Canned Sweet Corn
*In 1948 the succulometer values were recorded as 25 plus only as the original method indicated that values beyond this were too immature. Consequently how far beyond 25 is unknown_.:_probably at least an average of 2 or 3, making this value about 28.
25
Moisture Content as a Means of Determining Maturity
The moisture content was determined only for the latter stages of maturity in 1949 and for all stages of maturity in 1950 for the raw product only. Consequently great reliance cannot be placed on these data as an inspection of the data in the Appendix shows the moisture values vary tremendously with the season. The latter part of these statements could apply to the succulence measurements as both determinations measure somewhat the same thing and they both tend to fluctuate with the season. Furthermore this measurement is not a means of evaluating varietal differences, but is a means of determining the maturity rather rapidly. Table 10 gives the average moisture content and the range for each stage of maturity on the raw product as determined in 1949 and 1950.
Subjective Evaluation of Varieties for Quality
The subjective evaluation of the varieties for quality was made by a panel of 7 judges. Each judge scored the frozen and canned product for color, flavor and tenderness from 0 to 10 with 0 being considered very poor (or off) and 10 being considered perfect. The varieties were evaluated for these three factors at each stage of maturity (two stages of maturity for the frozen product and three stages of maturity for the canned product). A total score was assigned each variety at each stage of maturity and then a grand total score for all three stages of maturity. These data are presented in Table 11 for the canned product and Table 12 for the frozen product. In most cases, if a variety was rated high at one or more stages of maturity it followed through with a high rating at all stages of maturity.
The varieties were ranked according to high total score with the following varieties considered best for the canned product: Golden Cross Bantam and Victory Golden first, with Aristogold Bantam No. 1
TABLE 10.--Moisture Content (average and range) for Three Stages of Maturity of Yellow Sweet Corn-Raw Product Values Only
TABLE 11.-Four Years Average Score for Color, Flavor and Tenderness at Three Stages of Maturity for Canned Whole Grain Sweet Corn (most varieties)
1st Harvest 2nd Harvest 3rd Harvest
.. .!. .. .!. ~
.!. .,, _ .. 0 .. .. .. 0 .... .. .... ca "" Variety 0 > -a .. l 0 > -a .. ii 0 > -a .. l c .. c .. c .. a- c 0 a 11 C 0 a 11 C l 0 a 11 C .. 0 :I u ii: ... J! u ii: ... u ii: ... J! " ... Joana ........................ 6.0 6.1 10.0 22.l 6.0 6.3 9.5 21.8 8.0 6.3 5.5 19.8 63.7 4
and Ioana next. Oto, Aristogold Bantam Evergreen, Tendergood, and Illinois Golden No. 10 were considered the poorest for canned quality and probably would be rated unacceptable.
In the frozen product, Iochief, Aristogold Bantam No. 1 and Tendergood were rated the best while Oto, Illinois Golden No. 10 and Golden Cross Bantam were considered the poorest. The rating of Golden Cross Bantam the poorest for the frozen product is not in accord with most varietal evaluation tests, but here it was found to be lacking in color and flavor at the second harvest (optimum maturity) thus .rated at the bottom whereas at the mature stage (3rd harvest) it was rated :;i.t the top of the list. Since Golden Cross Bantam received the highest score on tenderness at even the mature stage (3rd harvest) it would be considered one of the best varieties except at the immature and optimum stages of maturity due to lack of color and flavor.
SUMMARY
In variety evaluation work for processing, joint studies emphasize the relationships between yields, percent cut-off and quality. In this work varieties with high yields, large percent cut-offs and best qualities in the frozen and canned products would be considered the best varieties to recommend for processing. An attempt has been made to point out which varieties arc outstanding and which ones arc the poorest for each measurement made. All characteristics for any one variety have not been listed together, therefore, it is believed that the best way to summarize this work would be to mention the outstanding characteristics of the varieties and indicate those considered best for processing. It should be emphasized again that with some varieties it was not always possible to harvest the corn at all three stages of maturity; consequently, in fairness to all varieties, the optimum maturity as determined by AIS content is used in the yield studies.
Victory Golden would be rated on~' of the best . varieties of the group when considering all characteristics studied. It w;:i.s ranked 3rd in yield in tons per acre for the date of optimum maturity, but near the bottom for percent cut-off. However, it was 4th in cases packed per acre but rather low in cases packed from a given ton of corn. It was second only to Golden Cross Bantam in canned quality and ranked fourth in frozen quality. It was also found to be low in pericarp content, except at the mature harvest in 1951.
29
Golden Cross Bantam would be rated one of the best varieties from the processing standpoint. It was poorest in yield per acre, about middle in percent cut-off, poorest in cases packed per acre but about middle in cases packed per ton. However, it was the most tender corn as determined by the pericarp content and it was ranked at the top of the list in canned quality. Finally it ranked at the top of the list at the mature stage of maturity for quality in the frozen product, and at the middle of the list of varieties at the optimum stage of maturity in the frozen product.
Tendermost would be rated one of the better varieties of the group studied. It was one of the lowest in per acre yield but one of the highest in percent cut-off, thus giving somewhat less than the average number of cases packed from a given acre but one of the highest yields in cases packed from a given ton of raw corn. It was ranked fairly high on canned quality at all stages of maturity and fairly high for the frozen product. Furthermore it was ranked next to Golden Cross Bantam on the percent of pericarp content.
Ioana and Tendergood would be rated about equal, although each variety may have outstanding characteristics; Joana was 5th in percent cut-off and 5th in cases packed per ton, and 4th of the group for canned quality. Tendergood was a poor yielder, about average in percent cut-off and cases packed per ton and, also, 2nd in frozen product quality, but one of the poorest in canned quality.
Flagship should be rated next although it was found to be low in yield and poor in percent cut-off. It was rated 3rd in frozen product quality and 5th in canned product quality.
Illinois Golden No. 10 and Aristogold Bantam No. 1 would be rated next and probably might be questionable at the mature stage of maturity for tenderness as measured by the percent pericarp content. Both varieties have been used in the past and they both have certain desired characteristics; for example, Illinois Golden No. 10 was a fairly high yielder and was the highest in percent cut-off corn, thus making it rather high in cases packed per acre and at the top of the list in cases packed per ton. On the other hand, it was one of the poorest in quality of the canned or frozen product. Aristogold Bantam No. 1 was a poor yielder, but 3rd in percent cut-off, thus making it below average in cases packed per acre, but high in cases packed per ton. It was ranked 3rd in canned quality and 2nd in frozen quality.
30
Golden Security and lochief should be ranked together. Golden Security and Iochief arc the best in yield per acre and in cases packed per acre. Golden Security was very low in percent cut-off while Iochief was the same as Illinois Golden No. 10. Both varieties produced the greatest number of cases packed per acre. Iochief was also at the top of the list in cases per ton while Golden Security was one of the poorest. Both varieties were high in pericarp content at the mature stage of maturity and were ranked rather low in quality in the canned product. Golden Security was ranked low in both frozen and canned quality.
The last two varieties, Aristogold Bantam Evergreen and Oto would be both definitely considered unsatisfactory varieties for processing. They were high in yields per acre. Aristogold Bantam Evergreen was 5th in percent cut-off corn, thus giving it third in cases per acre packed and about middle on cases per ton. Oto had the lowest percent cut-off corn and the poorest in cases packed from a given ton and below the average in cases packed per acre. Aristogold Bantam Evergreen was the only variety with over 2.00% pericarp content at the optimum harvest and way over this tolerance at the mature harvest as was Oto. They were both ranked at the bottom of the list in canned quality, with Oto ranked bottom in frozen quality and Aristogold Bantam Evergreen 8th in the frozen product.
Several other varieties have been in the trials for one year. Those considered outstanding are being contained while those low in yields, cut-off and/ or quality are being eliminated.
CONCLUSION
In conclusion it should be pointed out that, for the varieties studied, there is a rough inverse relationship between per acre yield in Ohio and some of the other characteristics which make a variety desirable for processing. Breeders should strive to combine these factors within the same variety.
Additional tabular material on the results of this project are available upon request. This is the material referred to as the appendix. Requests for this material should be sent to Wilbur A. Gould, Ohio State University, Columbus 10, Ohio.
31
REFERENCES AND SELECTED BIBLIO.GRAPHY
1. Annon. Canned corn; definition and standards of identity, quality and fill of con-
tainer. Federal Register, pp. 2060-2066. April 12, 1950.