Evaluation Report for “Integrated forecasting system for mitigating adverse space weather effects on the Northern American high-voltage power transmission system” NASA Goddard Space Flight Center in partnership with the Electric Power Research Institute
Transcript
Evaluation Report for “Integrated forecasting system for mitigating adverse space weather effects on the Northern
American high-voltage power transmission system”
NASA Goddard Space Flight Center in partnership with the Electric Power Research Institute
Evaluation Report for Solar Shield
iii
Acknowledgments
This work was supported by the NASA Science Mission Directorate, Earth System Division under the Applied Sciences Program, Energy Management program element.
Solar Shield Project Team Michael Hesse– Principle Investigator
NASA/GSFC Antti Pulkkinen Maria Kuznetsova Shahid Habib Fritz Policelli
EPRI David Fugate Luke Van der Zel Ben Damsky William Jacobs
The Solar Shield1 project responds to the NASA Strategic Goal 3, Sub-goal 3A: “Study Earth from space to advance scientific understanding and meet societal needs” as described in the 2006 NASA Strategic Plan. The project is funded by the NASA Applied Sciences Program, which has the objective to expand and accelerate the economic and societal benefits from Earth science, information, and technology. The project is managed within the NASA Applied Sciences Program’s “Energy Management” program element.
In this project, an enhancement to the Electrical Power Research Institute’s (EPRI) SUNBURST decision support tool used by the U.S. electric power industry is developed by prototyping a Geomagnetically Induced Current (GIC) forecasting system for the effects of solar activity on the North American power grid. The forecasting system will consist of a chain of state-of-the-art space physics models describing the coupled Sun-Earth system. Predictions of GIC flowing in the power transmission system are derived from the model chain output and are used to create products for the end-user making decisions about possible GIC mitigation actions.
Models employed by the forecasting system are resident at the Community Coordinated Modeling Center (CCMC) located at the NASA Goddard Space Flight Center in Greenbelt, Maryland. These models, which have been developed using NASA resources by the space research community, have been provided to the CCMC for research simulation and evaluation of space weather applications, such as the one discussed in this document.
The model chain will be driven by solar data from NASA missions such as SOHO, or from ground-based observatories. Additionally, NASA’s ACE spacecraft, which is located upstream from the Earth, will provide a second source of driver data for the magnetosphere/ionosphere component of the model chain.
In this document detailed requirements for the GIC forecasting system are developed. The requirements are designed to take into account both the basic physics behind GIC and possible mitigation actions available for power transmission system operators. It will be shown that the model collection at CCMC together with data feeds generated by NASA missions can be used to develop a forecasting system meeting the challenging system requirements. More specifically, the models and the data feeds enable the required two-level GIC forecasts: Level 1 forecasts driven by Solar observations with 2-3 day lead time and Level 2 forecasts driven by L1 solar wind observations with 30-60 minute lead time.
Early advances in this project indicate that the Level 2 forecasts can be used for successful estimation of GIC during extreme space weather storms. Together with advances in cost-benefit analysis of large GIC events and preliminary design of user-relevant output from the system these advances indicate that the activity has potential for major impact on future space weather forecasting applications.
1 Throughout the text we will, for brevity, refer to the activity as “Solar Shield”
Evaluation Report for Solar Shield
01/10/2008 5
1.0 Introduction
The activity discussed in this document seeks to enhance the capabilities of the Electrical Power Research Institute’s (EPRI) SUNBURST decision support tool used by the U.S. electric power industry by prototyping a Geomagnetically Induced Current (GIC) forecasting system for the effects of solar activity on the North American power grid. The forecasting system will consist of a chain of models, which transmit plasma and magnetic fields and their dynamics from the solar surface and heliosphere, to the magnetosphere of the Earth, and then into the Earth’s ionosphere. GIC flowing in the power transmission system and the geoelectric field driving GIC will be derived from these ionospheric currents. By using real-time space-based observations (carried out by NASA) of near-space conditions and the developed model chain, GIC forecasts can be derived to individual sites of the North American power transmission system. These forecasts, together with other real-time information available via SUNBURST network can then be used by operators of the transmission system to mitigate the potentially harmful effects of solar activity on the North American grid.
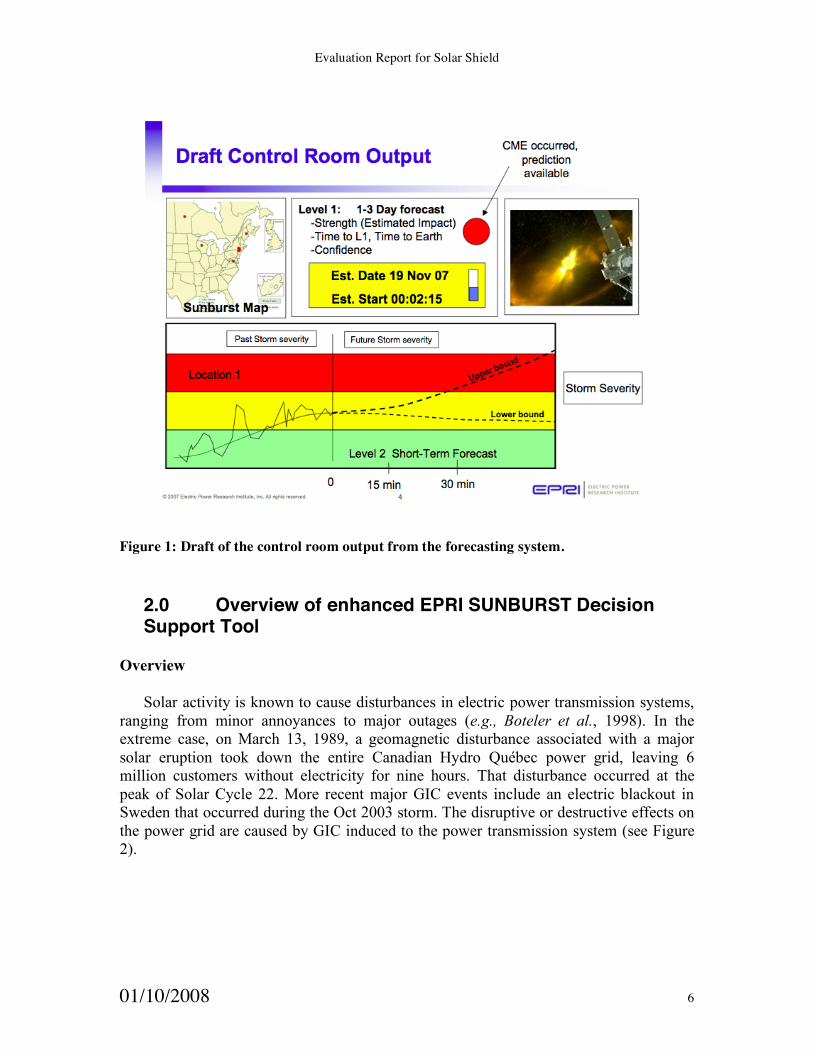
The Solar Shield team has made important advances early in the activity. More specifically, the coupling of the near-space models to geomagnetic induction and GIC models has been established (Pulkkinen et al., 2007a) and new tools for optimal usage of GIC observations in generating the forecasting system have been developed (Pulkkinen et al., 2007b). First draft versions of the forecasting system have been run for historical GIC events and the first results indicate that satisfactory forecasting accuracy is achievable (Pulkkinen et al., 2007a). EPRI members of the team have carried out analyses of economic impacts of large GIC events on transmission system and a draft user-relevant output from the forecasting system has been outlined (See Figure 1). EPRI is working with power utility representatives of the SUNBURST network to gain explicit end-user input to the work carried out in the activity so far.
Evaluation Report for Solar Shield
01/10/2008 6
Figure 1: Draft of the control room output from the forecasting system.
2.0 Overview of enhanced EPRI SUNBURST Decision Support Tool
Overview
Solar activity is known to cause disturbances in electric power transmission systems, ranging from minor annoyances to major outages (e.g., Boteler et al., 1998). In the extreme case, on March 13, 1989, a geomagnetic disturbance associated with a major solar eruption took down the entire Canadian Hydro Québec power grid, leaving 6 million customers without electricity for nine hours. That disturbance occurred at the peak of Solar Cycle 22. More recent major GIC events include an electric blackout in Sweden that occurred during the Oct 2003 storm. The disruptive or destructive effects on the power grid are caused by GIC induced to the power transmission system (see Figure 2).
Evaluation Report for Solar Shield
01/10/2008 7
Figure 2: Mechanism for GIC flow in power transmission system.
Societal Impacts
A severe GIC event could have the following consequences: 1. Grossly distorted current and voltage waveforms that result in poor or non-
operation of sensitive equipment. 2. Misoperation of protective relays resulting in system disturbances and possibly a
blackout. 3. Damage to transformers at several sites. This could range from loss of operating
life at only a few sites to destruction of a significant number. The Northeast Blackout of August 14, 2003 was an example of both the possibility of
a widespread outage and of the cost and consequences of a blackout to US society. The event was also a demonstration of the substantial linkages between the US and Canadian grids. Had the event commenced on Monday afternoon instead of Friday afternoon, the cost would have been considerably higher.
The most serious possibility by far is the case in which a number of power transformers are simultaneously damaged or destroyed in a GIC event. World production capacity for transformers at 345 KV and higher is estimated at 100 per year with little of the production in the US. A credible storm might damage as many as several hundred of these in the US and we could find ourselves vying with other nations also in urgent need of replacement transformers.
If a city is subjected to a period of several days without power, there will be severe consequences because of problems relating to several lifelines. Water supply and sewage systems are essential and are totally dependant on power. Telephone and other communication systems often have battery stand-by provisions, but these are seldom viable for days. Because such system-wide blackouts are possible, it obviously would be useful to be warned as far in advance as possible of solar disturbances likely to cause large GIC.
Evaluation Report for Solar Shield
01/10/2008 8
Decisions in response to GIC expectations/forecasts or GIC observations
If GICs are expected or observed on the grid, operators take the following steps: 1. Discontinue maintenance work and restore out of service lines to service. Avoid
any removal of long lines from service. 2. Be especially careful to maintain system voltage well within the acceptable range
since voltage swings may occur. 3. Adjust the flows on HVDC lines so they are between 40% and 90% of nominal
ratings. 4. Reduce the loading on any generators operating at full capacity in order to
provide reserve power and reactive capacity margins. 5. Consider the possibility that shunt capacitors connected to the grid and static
VAR compensators may be lost and prepare for such an eventuality. 6. Dispatch reserve generation to manage system voltage and tie line loadings to
distribute reserve generation. 7. Bring on line any equipment capable of synchronous condenser operation to
provide reactive power reserve. 8. Notify adjacent control areas of GIC problems.
The Solar Shield team seeks to extend the use of NASA Earth-Sun System data and models to enhance the SUNBURST Decision Support Tool (DST) owned and operated by EPRI. EPRI was established in 1973 as an independent, nonprofit center for public interest energy and environmental research. EPRI brings together member organizations, the Institute's scientists and engineers, and other leading experts to work collaboratively on solutions to the challenges of electric power. These solutions span nearly every area of power generation, delivery, and use, including health, safety, and environment. EPRI's members represent over 90% of the electricity generated in the United States. In addition to EPRI, end-users for this project include U.S. electrical power companies, which subscribe to the SUNBURST DST. Currently the SUNBURST DST provides “now-casting” of elevated GIC in the electric power grid, by measuring these currents in-situ (Fig. 3). The SUNBURST DST is used by subscribing electric power companies to provide an indication of when and where a potentially damaging GIC event has occurred. The Solar Shield team seeks to enhance the SUNBURST DST through the addition of a GIC predictive capability, which we believe will for the first time enable power utilities to take preventative action under certain circumstances.
Evaluation Report for Solar Shield
01/10/2008 9
Figure 3: Snapshot of the current SUNBURST DST.
System requirements
To enable the use of the developed forecasting system by the end-user, the Solar Shield team identified the following technical DST forecasting requirements to be met by the system:
a) The system should be able to give advance warnings at two different levels: Level 1 warnings providing lead time of 1-2 days and Level 2 warnings providing lead time of 30-60 minutes. Level 1 warnings are based on remote sensing information about solar activity whereas Level 2 warnings are based on in situ L1 observations. b) The system should be able to predict the start time of the GIC activity. Start times are given separately for Level 1 and Level 2 forecasts. c) The system should be able to predict the intensity of the GIC activity. Intensities are given separately for Level 1 and Level 2 forecasts. d) The system should be able to indicate the geographic regions or locations affected by the GIC activity. Affected geographic regions are given separately for Level 1 and Level 2 forecasts. e) The system should be able to predict the end of the GIC activity. End times are given separately for Level 1 and Level 2 forecasts.
Evaluation Report for Solar Shield
01/10/2008 10
f) The system should be able to give uncertainty of the prediction. Uncertainties are given separately for Level 1 and Level 2 forecasts. g) The system should be able to give the prediction of the GIC activity in a form usable for the decision-making process associated with possible GIC mitigation actions.
It is noted that the determination of the required minimum accuracy of both the Level 1 and Level 2 forecasts will be part of the output of the project and thus cannot be specified definitely at this point. The final accuracy requirement will be based, for example, on the cost-benefit analysis carried out by EPRI.
The requirements given above will provide the baseline for the system developed in the activity and the ultimate success of the project will be measured against the individual components of the list above.
3.0 Consideration of NASA inputs
In the last decade, space weather modeling has undergone a fundamental transition (see, e.g., The Sun to the Earth –and Beyond, A Decadal Research Strategy in Solar and Space Physics, 2003). Historically, modeling has been focused on purely science-driven purposes. Specifically, models and modelers attempted to reproduce spacecraft and ground-based observations in a qualitative fashion, with the goal of obtaining scientific explanations of an entire class of similar observations. There are many examples – representative cases are the successful attempt to explain the generation of current flows into and out of the Earth’s ionosphere from the magnetosphere (e.g., Hesse and Birn, 1991) or present research addressing the formation and acceleration of Coronal Mass Ejections (e.g., Antiochos et al., 1999). These modeling activities have contributed substantially to scientific progress, without attempting to reproduce exact details of actual spacecraft measurements.
Starting with the early 1990s, the growing recognition of the national and international importance of space weather effects changed this focus. Akin to terrestrial weather needs and requirements, systems and users affected by space weather processes have an economic need for precise forecasts and nowcasts of the space environment and its effects on their spheres of interest. With the need for precision also arose the necessity to measure precision through validation and metrics studies – a requirement recognized by the National Space Weather Program (NSWP, implementation plan, 2000) by the definition of a set of first line metrics procedures for space science models.
The new requirement to produce or reproduce the space environment not only qualitatively, but quantitatively as well, has led to considerable new model developments over the last ten years. This model development has been supported by multiple agencies (e.g., the National Science Foundation), but NASA has been the main supporter. A specific example for the NASA development support is the Living With a Star program, which has as one of its major elements the development of advanced space weather models. Accordingly, there is virtually no space science or space environment model in existence that is or has not been funded by NASA in its majority.
The activity will therefore employ a set of modern space research and space weather models (see Table 2). All models to be utilized in this endeavor are developed
Evaluation Report for Solar Shield
01/10/2008 11
exclusively through NASA investment, or, at a minimum, through substantial NASA support. Model descriptions can be found at http://ccmc.gsfc.nasa.gov. Data sources are obtained from NASA missions such as SOHO, STEREO, ACE, WIND, and GEOTAIL, in addition to ground-based solar observatories, such as Mount Wilson or Kitt Peak, who also receive NASA support.
The system requirements as outlined in Section 2.0 above are very challenging in terms of modeling capability and observational input needed to drive the models. Community Coordinated Modeling Center (CCMC) operated at NASA Goddard Space Flight Center with its model collection and computational resources provides an unique platform for carrying out extensive modeling from solar surface to the surface of the Earth (see Figure 4). This capability is unparalleled and it makes CCMC the only place in the world capable of producing modeling products required by the specified GIC forecasting system. CCMC also has extensive experience carrying out the computations in real-time (experimental) operational fashion. Further, as discussed below, NASA generates the data feeds required by real-time runs of the appropriate models. It follows that NASA data input and modeling capabilities do match the system requirements. The overall quality of the GIC forecasts is a matter of our present understanding of the Sun-Earth connection and will be evaluated in detail in the activity.
Although several NASA missions contribute to the activity in terms of improved general modeling capability via increased understanding of the near-space phenomena, a more limited list of missions and models playing central role in the real-time operations of the forecasting tool can be identified. Tables 1 and 2 provide detailed information about these missions and models. It is noted that real-time SOHO MDI and LASCO observations can be replaced, in principle, by ground-based solar observations and/or by other space-based missions such as STEREO. However, continuous real-time observations at L1 are at the moment dependent solely on ACE. From the Level 2 GIC forecast viewpoint this is a single point of failure in the forecasting system that may need to be addressed later in the activity.
Evaluation Report for Solar Shield
01/10/2008 12
Figure 4: Sun-GIC modeling chain. The figure illustrates how solar data (1) are transmitted through the solar atmosphere, heliosphere, and magnetosphere of the Earth to the Earth’s ionosphere. A geomagnetic induction module generates surface electric fields driving GIC.
Table 1. NASA data products considered for inputs to enhanced SUNBURST DST.
Satellite Sensors System Operator Product Use in the forecasting system
ACE MAG, SWEPAM
NASA Plasma and magnetic field observations at L1.
To drive magnetospheric MHD models used for Level 2 GIC forecasts.
SOHO MDI, LASCO NASA/ESA Solar magnetograms, CME observations.
To drive heliospheric MHD models used for Level 1 GIC forecasts.
Evaluation Report for Solar Shield
01/10/2008 13
Table 2. NASA model products considered for inputs to enhanced SUNBURST DST.
Model Input Product Use in the forecasting system
WSA, potential/empirical model of the inner heliosphere.
Solar magnetograms. Plasma parameters and the magnetic field in the inner heliosphere.
Input to heliospheric MHD model used for Level 1 GIC forecasts.
ENLIL, MHD model of the heliosphere.
Plasma parameters and the magnetic field in the inner heliosphere.
Plasma parameters and the magnetic field in the heliosphere.
Input to magnetospheric MHD models used for Level 1 GIC forecasts.
BATSRUS, MHD model of the magnetosphere-ionosphere system.
Plasma parameters and the magnetic field in the vicinity of the solar wind-magnetosphere boundary.
Plasma parameters and the magnetic field in the magnetosphere. Electrodynamic parameters in the ionosphere.
Input to the geomagnetic induction and GIC computations at high latitudes. Used for both Level 1 and Level 2 GIC forecasts.
OpenGGCM, MHD model of the magnetosphere-ionosphere system.
Plasma parameters and the magnetic field in the vicinity of the solar wind-magnetosphere boundary.
Plasma parameters and the magnetic field in the magnetosphere. Electrodynamic parameters in the ionosphere.
Input to the geomagnetic induction and GIC computations at high latitudes. Used for both Level 1 and Level 2 GIC forecasts.
CRCM, kinetic model of the inner magnetosphere.
Plasma parameters and the electric field at the outer boundary of the inner magnetosphere. Magnetic field in the inner magnetosphere.
Plasma conditions in the inner magnetosphere. Electrodynamic parameters in the ionosphere.
Input to the geomagnetic induction and GIC computations at low latitudes. Used for both Level 1 and Level 2 GIC forecasts.
4.0 Gaps in meeting DST needs
No gaps in meeting the DST requirements have been identified so far. However, it is emphasized again that continuous real-time observations at L1 are at the moment dependent solely on the NASA’s ACE spacecraft. From the Level 2 GIC forecast viewpoint this is a single point of failure in the forecasting system that may need to be addressed later in the activity.
5.0 Conclusions and recommendations
In this activity, an enhancement to the Electrical Power Research Institute’s SUNBURST decision support tool used by the U.S. electric power industry is developed by prototyping a Geomagnetically Induced Current (GIC) forecasting system for the effects of solar activity on the North American power grid. The forecasting system will consist of a chain of models, which transmit plasma and magnetic fields and their dynamics from the solar surface and heliosphere, to the magnetosphere of the Earth, and then into the Earth’s ionosphere. GIC flowing in the power transmission system and the geoelectric field driving GIC will be derived from these ionospheric currents. By using
Evaluation Report for Solar Shield
01/10/2008 14
real-time space-based observations of near-space conditions and the developed model chain, GIC forecasts can be derived to individual sites of the North American power transmission system. These forecasts, together with other real-time information available via SUNBURST network can then be used by operators of the transmission system to mitigate the potentially harmful effects of solar activity on the North American grid.
Space-based observations carried out by NASA together with state-of-the-art space physics models hosted at the Community Coordinated Modeling Center operated at NASA Goddard Space Flight Center provide an unparalleled platform for the establishment of next generation GIC forecasting system. Importantly, the challenging system requirements established above can be met by the considered NASA data and model input. Further, the early work carried out by the Solar Shield team indicates that the NASA-based platform can be used for successful generation of GIC forecasts and it is reasonable to expect that the activity will have major impact on future strategies used to mitigate the adverse effects of GIC. The design of the forecasting system developed in the activity, in �collaboration with end-users, will not only optimize the GIC modeling �process but will also provide tools for effectively conveying valuable GIC� forecast results to the people who operate the North American power � transmission system.
The work in the activity will continue as outlined in the Solar Shield proposal. As the central part of the work scheduled for year 1 of the activity has been carried out, the team will proceed with work scheduled for year 2. Important elements of the future work will include extension of the model chain used for forecasts, validation of the model output against the economic impact of GIC and more detailed design of the end-user output from the system. The team will also use power utility feedback to further streamline the forecasting system under development. The progress in the activity will continue to be reported in detail via scientific peer-reviewed publications and presentations in scientific conferences. The team will provide V&V and Benchmark reports to NASA as scheduled by the Applied Sciences Program.
6.0 References Antiochos, S. K., C. R. DeVore, and J. A. Klimchuk, A model for solar coronal mass ejections, Astrophys. J., 510, 485-493, 1999. Boteler, D.H., Pirjola, R.J., and Nevalinna, H. The Effects of Geomagnetic Disturbances on Electrical Systems at the Earth’s Surface, Advances in Space Research, Vol. 22, No. 1, 1998, pp. 17-27.
Hesse, M., and J. Birn, On dipolarization and its relation to the substorm current wedge, J. Geophys. Res., 96, 19417, 1991. Pulkkinen, A., M. Hesse, M. Kuznetsova and Lutz Rastätter, First-principles modeling of geomagnetically induced electromagnetic fields and currents from upstream solar wind to the surface of the Earth, Annales Geophysicae, 25, 881-893, 2007a. Pulkkinen, A., R. Pirjola, and A. Viljanen, Determination of ground conductivity and
Evaluation Report for Solar Shield
01/10/2008 15
system parameters for optimal modeling of geomagnetically induced current flow in technological systems”, Earth, Planets and Space, 99, 999-1006, 2007b. The Sun to the Earth –and Beyond, A Decadal Research Strategy in Solar and Space Physics, Solar and Space Physics Survey Committee, National Research Council, National Academy Press, Washington, DC, 2003. The National Space Weather Program, Implementation Program, 2nd Edition, Office of the Federal Coordinator for Meteorology, FCM-P31-2000, Washington, DC, 2000.