OPERATION EVALUATION Bangladesh Country Programme 200243 (2012-2016) evaluation of WFP’s operation at mid-term Evaluation Report August, 2015: Final Report Evaluation team: Jeanne Downen, Team Leader; Towfique Aziz, Survey Specialist; Loretta Byrnes, Evaluator; Tamsin Walters, Evaluator; Golam Kabir, Evaluator; Maryada Vallet, Research & Data Analyst; and Elizabeth Cuellar, Research Consultant Evaluation Manager: Monica Mueller Commissioned by the WFP Office of Evaluation Report number: OEV/2014/13 Measuring results, sharing lessons
Transcript
OPERATION EVALUATION
Bangladesh Country Programme 200243 (2012-2016) evaluation of WFP’s operation at mid-term
Evaluation Report
August, 2015: Final Report Evaluation team: Jeanne Downen, Team Leader; Towfique Aziz, Survey Specialist; Loretta Byrnes, Evaluator; Tamsin Walters, Evaluator; Golam Kabir, Evaluator; Maryada Vallet, Research & Data Analyst; and Elizabeth Cuellar, Research Consultant Evaluation Manager: Monica Mueller Commissioned by the
WFP Office of Evaluation Report number: OEV/2014/13
Mea
suri
ng
res
ult
s, s
ha
rin
g l
esso
ns
Acknowledgements
The evaluation team would like to acknowledge the valuable assistance received from the colleagues at the World Food Programme (WFP) in Bangladesh, particularly Christa Rader (Country Director) and Claire Conan (Deputy Director) for their time and thoughtful inputs, Jimi Richardson (former Head of Programme) as focal point through the inception and fieldwork preparation phase, Ezaz Nabi (Programme Officer, Output and Process Monitoring) as liaison for the outcome survey and fieldwork All extended their support and hospitality to the team and assisted us with our many requests. We would also like to thank all the Dhaka HQ and field staff for their time, logistical support, and thoughtful reflections on programme implementation. We would also like to thank Grace Igweta (Evaluation Officer, WFP) for her support and dedication as OEV focal point. Monica Mueller (Evaluation Manager, TANGO), Maryada Vallet (Research & Data Analyst, TANGO) and Elizabeth Cuellar (Research Consultant, TANGO) provided their invaluable support from the inception report to the completion of this evaluation. We would like to thank our field assistants, Apurba Kumar Roy, Al Masud Litu, and Nusrat Alam Nawmee, for their able interpretation and valuable observations during our field interviews. In addition, we extend our appreciation to the Government of the People’s Republic of Bangladesh officials, WFP’s cooperating partners and the donors, who all provided valuable input. We wish to acknowledge the generosity and hospitality of the district and upazila government staff who took their time to explain how they carry out their jobs and to share their perspectives on this programme. Finally, we wish to thank the communities and households who explained their lives and experiences with us. It is our sincere hope that the people with whom WFP and the government work will benefit from this evaluation and experience positive gains in their lives as a result of implementing its recommendations.
Disclaimer
The opinions expressed are those of the Evaluation Team, and do not necessarily reflect those of the World Food Programme. Responsibility for the opinions expressed in this report rests solely with the authors. Publication of this document does not imply endorsement by WFP of the opinions expressed. The designation employed and the presentation of material in the maps do not imply the expression of any opinion whatsoever on the part of WFP concerning the legal or constitutional status of any country, territory or sea area, or concerning the delimitation of frontiers.
List of supplementary annexes (attached document) Annex 8: List of persons and institutions interviewed Annex 9: Exit debrief participants Annex 10: Interview topical outlines Annex 11: Fieldwork schedule Annex 12: Evaluation matrix Annex 13: Team composition Annex 14: ER field visits observations
i
List of Tables Table 1: Summary of evaluation sample, by district ........................................................... 3 Table 2: National nutrition indicators, 2014 DHS .............................................................. 5 Table 3: MUAC levels in programme and control areas ..................................................... 9 Table 4: CP alignment with UNDAF .................................................................................. 17 Table 5: Attendance rate of boys and girls for grades one to five .................................... 27 Table 6: Proportion of male versus female ER actual beneficiaries by intervention type and year ............................................................................................................................. 32 Table 7: Sample size for IMCN and ER programme components, by region ................... 75 Table 8: Sample size (#households) for IMCN, ER and ER+IMCN, by district ............... 78 Table 9: Sample size (# schools) for SF survey, by district ............................................... 78 Table 10: CP alignment with government strategy and policy ......................................... 82 Table 11: Beneficiary numbers 2012, IMCN ...................................................................... 84 Table 12: Beneficiary numbers 2013, IMCN ..................................................................... 84 Table 13: Beneficiary numbers 2014, IMCN ..................................................................... 85 Table 14: Beneficiary numbers 2012-2014, SF .................................................................. 85 Table 15: Beneficiary numbers 2012-2014, ER ................................................................. 86 Table 16: Beneficiary numbers 2012-2014, SGSN ............................................................ 87 Table 17: Food distributions by component ...................................................................... 88 Table 18: FFA outputs 2012-2014 ..................................................................................... 89 Table 19: Food distributed, SMP ....................................................................................... 91 Table 20: IMCN original anthropometric indicators, by region ....................................... 92 Table 21: BMI and MUAC for PLW ................................................................................... 94 Table 22: IMCN original indicators for minimum acceptable and complimentary diets for children 6-23 months, by region ....................................................................................... 96 Table 23: Enrolment, retention, attendance and completion rates, by region and by WFP/Government feeding schools ................................................................................... 97 Table 24: Outcome survey 2014 indicator values and percent difference, by programme and control ......................................................................................................................... 99
ii
List of Figures Figure 1: Total CP beneficiaries by year ............................................................................ 18 Figure 2: Percentage of actual versus planned IMCN beneficiaries by intervention type and year ............................................................................................................................. 19 Figure 3: IMCN male v. female beneficiaries, by year ...................................................... 20 Figure 4: Supplementary feeding recovery, default, mortality and non-response rate ... 21 Figure 5: Percent of HHs following at least three basic nutrition, hygiene and sanitation practices ............................................................................................................................. 22 Figure 6: Proportion of infants 0-5 months who are fed exclusively with breast milk .... 22 Figure 7: Average annual rate of change in number of children enrolled in WFP-assisted primary schools ................................................................................................................. 28 Figure 8: Primary completion rate of WFP-assisted and control schools ........................ 29 Figure 9: SF NCI, by capacity dimensions and year ......................................................... 31 Figure 10: Percent of households with acceptable level of FCS ........................................ 33 Figure 11: Coping strategies average index ....................................................................... 34 Figure 12: Household average dietary diversity score ...................................................... 34 Figure 13: Percent of targeted communities with evidence of improved capacity to manage climatic shocks and risks ..................................................................................... 35 Figure 14: VGD NCI, by capacity dimensions and year .................................................... 39 Figure 15: Food distributions planned, actual and percent achieved by year and component ......................................................................................................................... 88 Figure 16: Food distributed, SMP ..................................................................................... 90 Figure 17: Percent of HHs following at least three or more basic nutrition practices (excluding WASH indicators) ............................................................................................ 95 Figure 18: Proportion of children 6-23 months of age who receive foods from four or more food groups ............................................................................................................... 95
iii
Acronyms
ACF Action Contre la Faim ANC Antenatal care AUEO Assistant upazila education officers BBS Bangladesh Bureau of Statistics BCC Behaviour change communication BDT Bangladesh Taka BMI Body mass index BRAC Bangladesh Rural Advancement Committee CAS Community asset score CDMP Comprehensive Disaster Management Programme CMAM Community management of acute malnutrition CNW/CNV Community nutrition worker/volunteer CO Country office CoE Centre of excellence (WFP) CP Country Programme CSI Coping strategies index DER LCG Disaster and Emergency Response Local Consultative Group DFID Department for International Development, United Kingdom DHS Demographic and health survey DMC Disaster management committee DPE Department of Primary Education DPP Development project proposal DRR Disaster risk reduction D/UWAO District and upazila women affairs officers DWA Department of Women Affairs EB Executive Board EFS Enhancing food security programme ELP Essential learning package EO Education officers ER Enhancing resilience to disasters and the effects of climate change ET Evaluation team FAO Food and Agriculture Organisation FFA/FFT Food/cash for assets/training FCFWT Food and cash for work and training FGD Focus group discussion FSUP Food security for the ultra-poor programme GAIN Global Alliance for Improved Nutrition GAM Global acute malnutrition GDP Gross domestic product GFD General food distribution HIES Household Income and Expenditure Survey HNPSDP Health Nutrition Population Sector Development Programme ICDDR,B International Centre for Diarrhoeal Disease Research, Bangladesh IDS Institute for Development Studies IFAD International Fund for Agricultural Development IFI International financial institution IFPRI International Food Policy Research Institute IGAs Income generating activities IMCN Improving maternal and child health and nutrition IPHN (Bangladesh) Institute of Public Health Nutrition IYCF Infant and young child feeding KII Key informant interviews LGED Local Government Engineering Department
4
LLP Local level planning MAM/SAM Moderate/severe acute malnutrition MDG Millennium Development Goal MIC Middle income country MoDMR Ministry of Disaster Management and Relief MoHFW Ministry of Health and Family Welfare MoPME Ministry of Primary and Mass Education MOU Memorandum of understanding MUAC Mid-upper arm circumference MWCA Ministry of Women and Children Affairs NCI National capacity index NGO Non-governmental organisation NNS National Nutrition Services NSAPR National Strategy for Accelerated Poverty Reduction NSSS National Social Security Strategy OECD Organisation for Economic Co-operation and Development OEV Office of Evaluation OpEv Operation evaluation PEDP Primary Education Development Programme PIU/PSU Project support/implementation unit PLW Pregnant and lactating women POW Programme of work RB Regional Bureau RDRS Rangpur Dinajpur Rural Service SF School feeding SGSN Strengthening government safety nets SMC School management committee SO Strategic objective SPR Standard Project Report SRF Strategic results framework SUN Scaling Up Nutrition
TANGO Technical Assistance to Non-Governmental Organizations International, Inc.
TdH Terre des Hommes TMRI Transfer modality research initiative
TOR Terms of reference
TSFP/BSFP Target and blanket supplemental feeding TUP-N Targeting ultra-poor-nutrition U5/U2 Under five years/under two years UNDAF United Nations Development Assistance Framework UNDP United Nations Development Programme UNICEF United Nations Children’s Fund UNO Upazila Nirbahi Officer VAM Vulnerability Analysis and Mapping VGD Vulnerable group development WFH Weight-for-height WFP World Food Programme WRA Women of reproductive age WSB+ Wheat soya blend plus
v
Operational Fact Sheet
OPERATION1
Type/number Bangladesh Country Programme 200243 (2012-2016) Approval November 2011 by the Executive Board (EB) Amendments
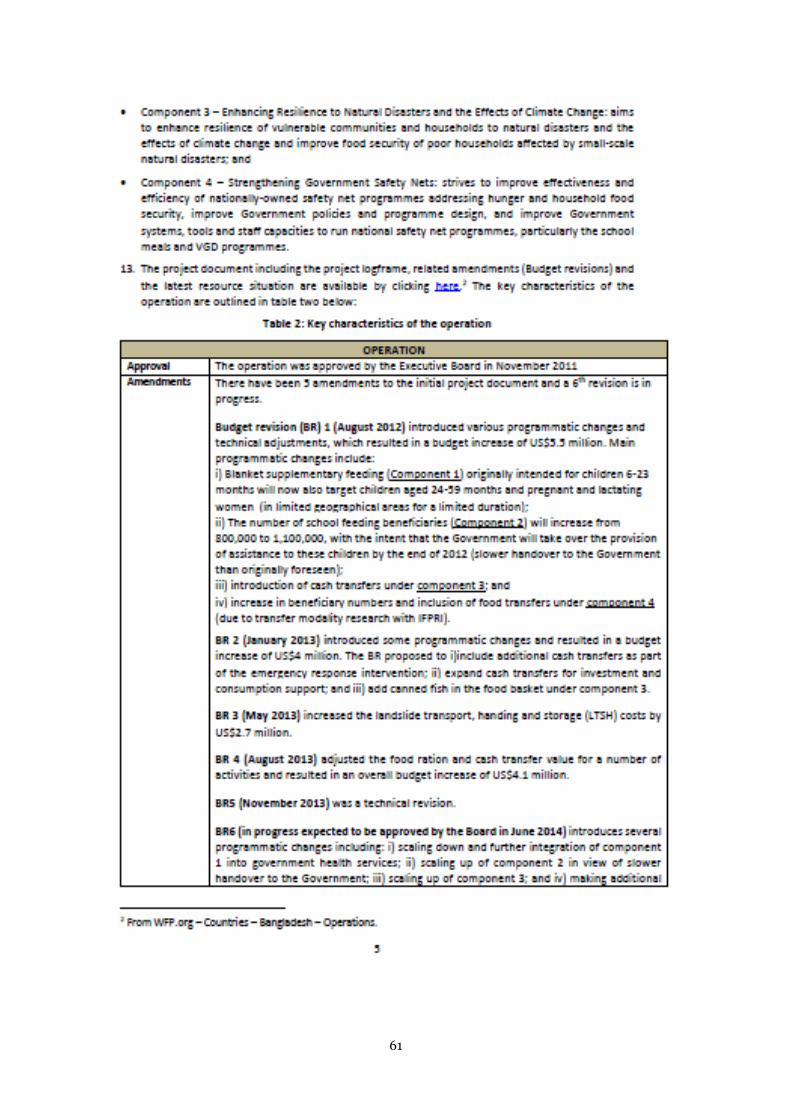
There have been seven amendments to the initial programme:
Budget revision (BR) 1 (August 2012) included various programmatic changes and technical adjustments, which resulted in a budget increase for food and all other related costs (except external transport). The main programmatic changes were: i) blanket supplementary feeding (Component 1) was extended beyond children aged 6-23 months to include children through 24-59 months and pregnant and lactating women (in limited geographical areas and duration); ii) the number of school feeding beneficiaries (Component 2) increased from 800,000 to 1,100,000, intending that the Government of the People’s Republic of Bangladesh will take over provisions to these children by the end of 2012 (slower handover to the government than originally foreseen); iii) introduction of cash transfers (Component 3); and iv) increased beneficiary numbers and inclusion of food transfers (Component 4), based on transfer modality research with International Food Policy Research Institute (IFPRI). Budget: increase of US$5,498,459 (US$2,510,499 of the commodity/cash value and US$2,987,960 of the associated costs); new budget of US$344,230,671 # beneficiaries: increase of 323,500 beneficiaries; new total 4,348,5002 Food/cash requirements: food increase of 2,645mt, new total 406,505mt; cash increase of US$3,877,050, new total US$13,992,0503
BR 2 (January 2013) introduced programmatic changes that resulted in a budget increase from food/cash interventions and associated costs. The BR: i) included additional cash transfers as part of the flood emergency response; ii) expanded cash transfers for investment and consumption support in 2013; and iii) added canned fish to the food basket (Component 3). Budget: increase of US$4,004,062; new total US$348,234,733 Food/cash requirements: food increase of 134mt, new total 406,639mt; cash increase of US$2,024,525, new total US$16,016,5754
BR 3 (May 2013) increased the landside transport, storage, and handing (LTSH) costs reflective of the new rate per mt and additional distribution sites particularly for school feeding; small increase in overhead indirect support costs (ISC). Budget: increase of US$2,745,285; new total US$350,980,0175
BR 4 (August 2013) adjusted the food ration and cash transfer value for a number of activities and resulted in an overall budget increase for all cost areas. Changes: i) sugar no longer required (Component 1); ii) in-kind distribution dates added for schools, food and cash added for school feeding in 2013, and the quantity of biscuits increased to serve more children (Component 2); iii) increased cash transfers for investment and consumption support (Component 3); and iv) Transfer modality research initiative extended for 12 months requiring additional commodity and cash (Component 4). Budget: increase of US$4,103,253; new total US$355,083,269 Food/cash requirements: food increase of 1,098mt, new total 407,737mt; cash increase of US$1,238,000, new total US$17,254,5756
BR 5 (November 2013) was a technical revision with no budgetary/beneficiary changes.
BR 6 (June 2014) was a substantial budget increase and introduced several programmatic changes: i) decrease of 138,000 total beneficiaries, and further integration of Component 1 into government health services; ii) continuing coverage for Component 2 in view of slower handover to the government; and iii) scaling up the cash-transfer-for-investment activity and government capacity development for Component 3 with an additional 2,000 households (10,000 beneficiaries). BR 6 also realigned the CP with the WFP Strategic Plan and Results Framework (SRF) for 2014-2017. Budget: increase of US$12,227,595; new total US$367,310,865 # beneficiaries: decrease to 4,210,500 Food/cash requirements: food decrease of 177mt, new total 407,560mt; cash increase of US$2,923,901, new total US$20,178,4767
BR 7 (November 2014) increased cash and voucher and DSC/ISC due to an emergency response to floods as part of Component 3. Budget: increase of US$2,597,403; new total US$369,908,268 # of beneficiaries: increase of 97,315, new total 4,305,3158 Food/cash requirements: Food - no change; cash increase of US$1,988,107, new total US$22,166,5839
Duration Initial: Five years (January 2012- 31 December 2016)
Revised: N/A
Planned beneficiaries
Initial: 4,025,000 (excludes beneficiary overlap)
Revised: 4,305,315 (BR 7)
Planned food requirements
Initial: In-kind food: 403,860mt Cash and vouchers: US$10,115,000
Revised: (BR 7) In-kind food: 407,560mt Cash and vouchers: US$22,166,583
6 WFP Bangladesh. 2013. Budget Revision No. 4 7 WFP Bangladesh. 2014. Budget Revision No. 6 8 Note that this new total does not agree with BR 6 revised beneficiary total of 4,210,500. 9 WFP Bangladesh. 2014. Budget Revision No. 7
vii
OBJECTIVES AND ACTIVITIES
WFP corporate strategic objectives and outcomes (revisions indicated in brackets)
Activities
MD
Gs
1-5
an
d U
ND
AF
2.
3,
4,5
, 7
SO # 4 Reduce undernutrition among women and children under 5 (Component 1)
Targeted and blanket supplementary feeding through community-management of acute malnutrition (CMAM) Behaviour change communication (BCC) Complementary food supplement trial (strategically under CP, supported by Trust Funds) School feeding (biscuit-based) Hot school meals pilot Food/cash for assets (FFA) Food/cash for training (FFT) ER Plus: cash transfer for investment (new in 2013) Emergency relief responses Resilience research and various pilots (strategically included in CP, supported by Trust Funds) Capacity for safety net design and management with government Food security for the ultra-poor (FSUP)(2012 only) Enhancing food security (EFS) Transfer modality research initiative (TMRI) Targeting the ultra-poor – nutrition (TUP-N) Vulnerable group development (VGD), Bangladesh Bureau of Statistics collaboration, and rice fortification (strategically included in CP, supported by Trust Funds)
Outcome 1: Improved nutritional status of children aged 6-59 months and pregnant and lactating women (PLW) [Reduced undernutrition, including micronutrient deficiencies among children aged 6-59 months, PLW and school-aged children] Outcome 2: Improved nutrition and hygiene behaviours and practices of caregivers, adolescent girls and other key household members in the targeted communities [Ownership and capacity strengthened to reduce undernutrition and increase access to education at regional, national and community levels]
Increase children’s access to pre-primary and primary education (Component 2) Outcome 3: Increased access to primary and pre-primary education for children in areas of high food insecurity [Increased equitable access to and utilization of education] [Ownership and capacity strengthened to reduce undernutrition and increase access to education at regional, national and community levels]
SO # 2 [new
SO#3]
Enhance the resilience of vulnerable communities and households to natural disasters and the effect of climate change (Component 3) Outcome 4: Hazard risk reduced at community level in targeted communities [Improved access to livelihood assets has contributed to enhanced resilience and reduced risks from disaster and adverse effects of climate change faced by targeted food-insecure communities and households] Outcome 5: Adequate food consumption over assistance period for family members in targeted households [Risk reduction capacity of countries, communities and institutions strengthened]
SO # 5 [new
SO#4]
Enhance nationally owned safety-net programmes addressing hunger and household food insecurity (Component 4) Outcome 6: Progress made towards effective, nationally owned safety nets addressing hunger and household food insecurity [Ownership and capacity strengthened to reduce undernutrition and increase access to education at regional, national and community levels]
Cross-cutting
Gender
Protection and accountability to affected populations Partnership (explained below)
viii
OBJECTIVES AND ACTIVITIES (continued)
Realignment of CP objectives with WFP Strategic Plan and SRF (2014-2017):
Components 1, 2 and 4 realign with (new) SO #4. Component 3 realigns with SO #3. In the revised logframe, Component 4 activities related to strengthening government safety nets are integrated to fit within the other components, which aligns with the new SOs that all include goals for capacity building. Capacity-strengthening activities that are not component- or project-specific, including learning and innovation activities continue under Component 4.10
The revision also included the following cross-cutting results:
Gender: Gender equality and empowerment improved;
Protection and accountability to affected populations: WFP assistance delivered and utilized in safe, accountable and dignified conditions; and
Partnership: Food assistance interventions coordinated and partnerships developed and maintained.
PARTNERS
Government Economic Relations Division of the Ministry of Finance (primary counterpart), Ministry of Health and Family Welfare, Ministry of Primary and Mass Education, Ministry of Women and Children Affairs, Ministry of Local Government, Rural Development and Cooperatives, Ministry of Disaster Management and Relief, Ministry of Food
United Nations Main partners: Food and Agriculture Organisation, United Nations Development Programme (with funding from Dutch government for Component 3) and United Nations Children’s Fund WFP: WFP Centre of Excellence
There have been collaborations with United Nations Educational, Scientific and Cultural Organization, International Labour Organisation and the Renewed Efforts Against Child Hunger and Undernutrition (REACH) initiative
Non-Governmental Organisations (NGO)
National: 17 NGOs to-date International: Six (Action Contre la Faim, Bangladesh Rural Advancement Committee, Helen Keller International, Muslim Aid, Save the Children, Terre des Hommes)
Other (e.g., research institutions)
IFPRI, Institute of Development Studies, Massey University in New Zealand, International Centre for Diarrhoeal Disease Research, Bangladesh (ICDDR,B), Johns Hopkins University School of Public Health, Global Alliance for Improved Nutrition (GAIN)
10 WFP Bangladesh. 2014. Budget Revision No. 6
ix
RESOURCES (INPUTS)
Contribution received (by Dec. 2014): 11 US$177,611,926
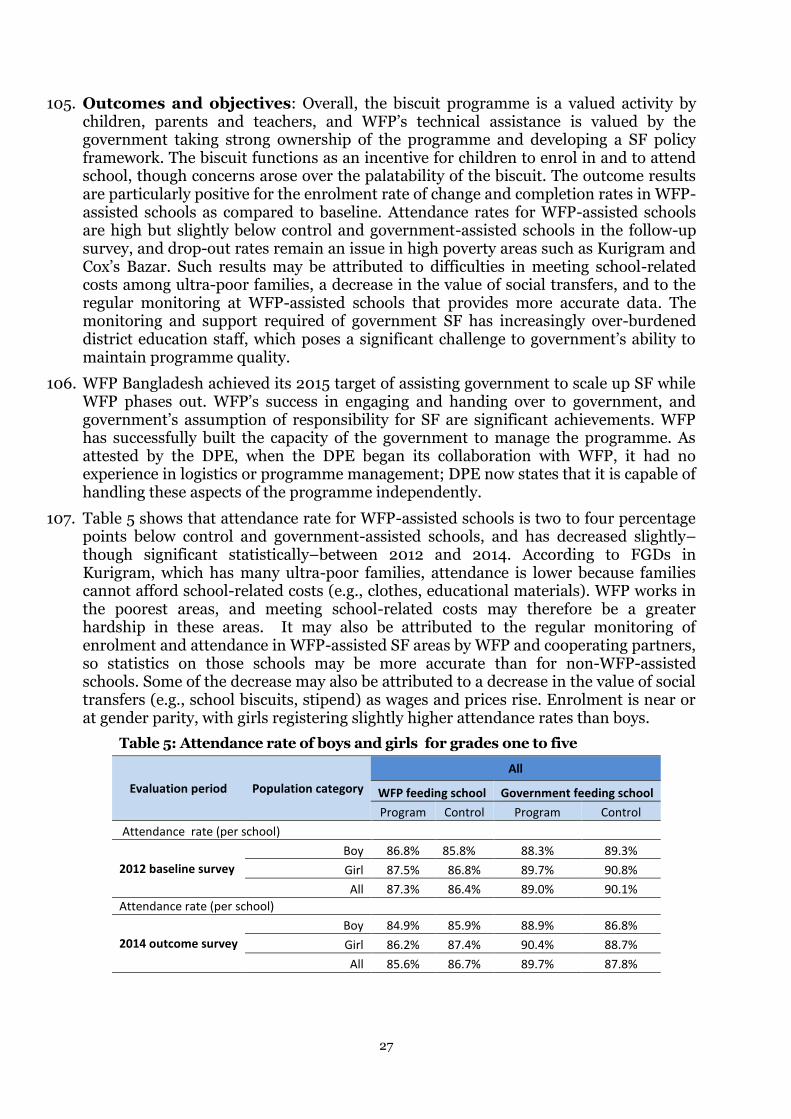
Percent against total requirements: 48 percent (see first chart below)
Top five donors: USA, multilaterals, Japan, European Commission (EC), Australia
Percent funded of mid-term requirement: 66 percent12
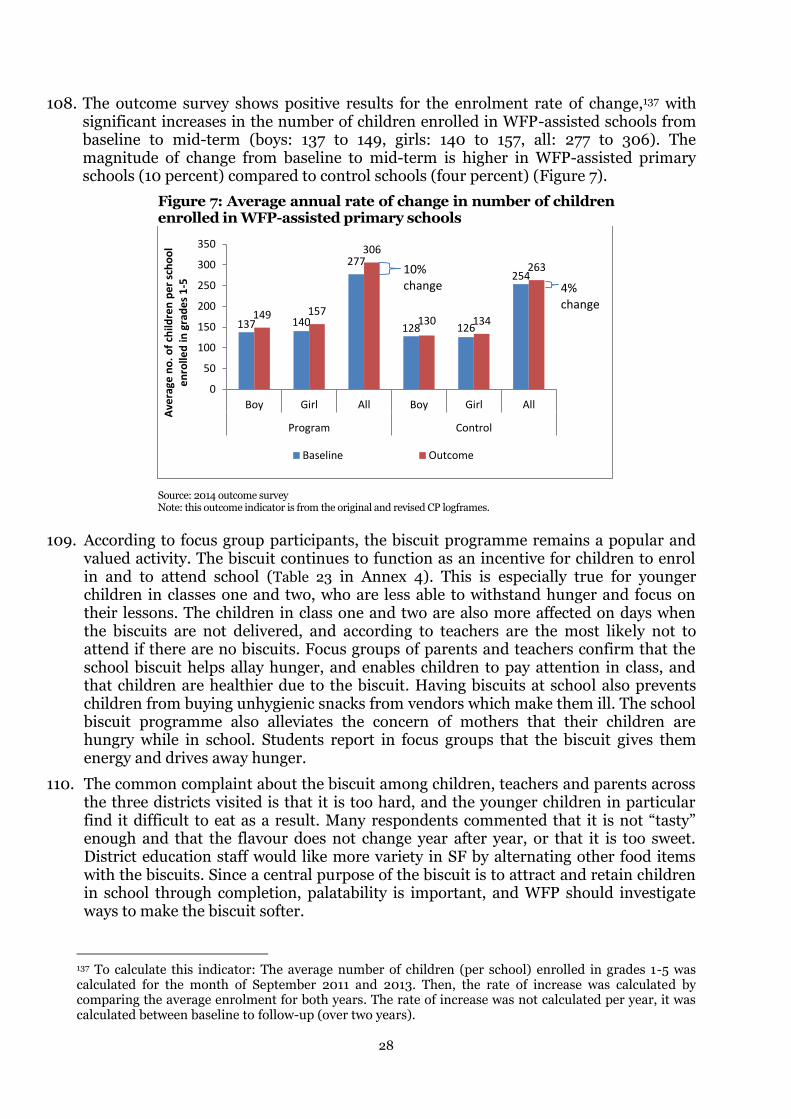
Source: Email from CO (6 June 2015) compiling data as per WINGS with all BRs for “amount required” and as per the approved financial SPR for 2012-2014 for “amount funded”.
11 WFP Bangladesh. 2014. Resource Situation 21 December 2014. Note: End of 2014 marks the end of the period under evaluation. 12 Calculation by TANGO: total contribution received (21 December 2014), excluding US$25 million for 2015-2016, against approved requirement for 2012-2014 (US$230,746,213).
Component key: Component 1-Improving maternal and child nutrition (IMCN); Component 2-School feeding (SF); Component 3-Enhancing resilience to disasters and the effects of climate change (ER); Component 4-Strengthening government safety nets (SGSN)
Planned14 Actual15
13 Output charts use data from SPRs 2012-2014, indicating any differences between the programme of work (POW) matrices. 14 WFP Bangladesh. 2011. Project Document; Calculation based on total beneficiaries including overlap. 15 WFP Bangladesh. 2014. SPR.
41%
23%
31%
5%
IMCN
SF
ER
SGSN
5%
60%
33%
2%
IMCN
SF
ER
SGSN
% of direct beneficiaries by component at design and to-date (2014), as proportion of total direct beneficiaries
xi
OUTPUTS (continued)
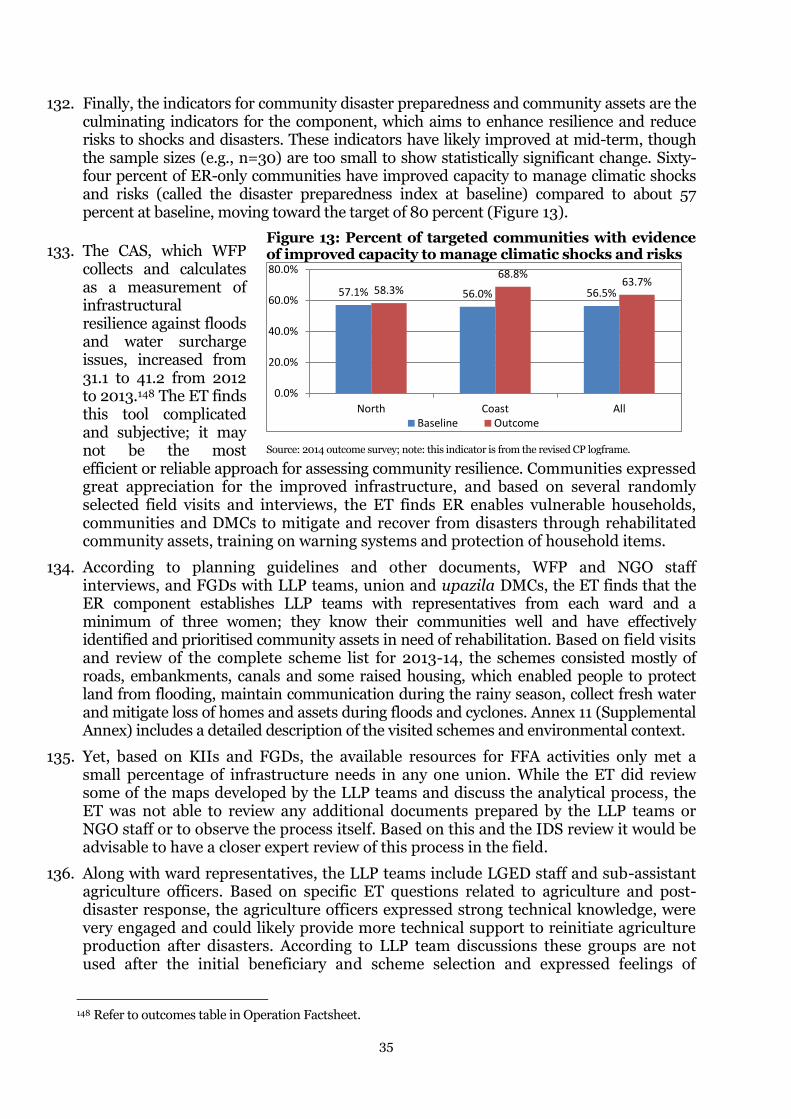
60%51% 51% 51% 54%
40%49% 49% 49% 46%
0%
10%
20%
30%
40%
50%
60%
70%
80%
90%
100%
IMCN SF ER SGSN Total
men/boys
women/girls 77%
51% 51% 51% 53%
23%
49% 49% 49% 47%
0%
10%
20%
30%
40%
50%
60%
70%
80%
90%
100%
IMCN SF ER SGSN Total
men/boys
women/girls
13%
48%
39%IMCN
SF
ER
SGSN*
8%
55%
36%
2%
IMCT
SF
ER
SGSN*
% of total planned food requirements by component (2012) *Component 4 is cash only: US$10,115,000
% of women/girls versus men/boys by component at design (planned) and to-date (actual, 2014)
% of actual mt of food distributed by component (2014) *TMRI
xii
OUTPUTS (continued)
% of actual versus planned beneficiaries by component and year
Key observations (and noted differences across data sources): Meeting the IMCN planned target in 2014 is a result of the scale-down and revision of the planned beneficiary figure from 363,000 in 2012-2013 to 68,064 in 2014. This change was made partly to comply with new CMAM protocols for admission/discharge criteria, which reduced the number of MAM cases. The actuals in 2012-2013 were low due to resource shortfalls and limited local capacity for implementation.
While SF targets for the number of beneficiaries receiving school feeding were largely met or exceeded, the number of feeding days (e.g., 77 percent of target in 2013) was affected by delays in biscuit production and political crises.
ER data from the programme of work (POW) matrix differ from those reported in the SPR.16 POW data show about 103 percent for 2012 (versus 117 percent in SPR) and 99 percent in 2013 (versus 96 percent in SPR).
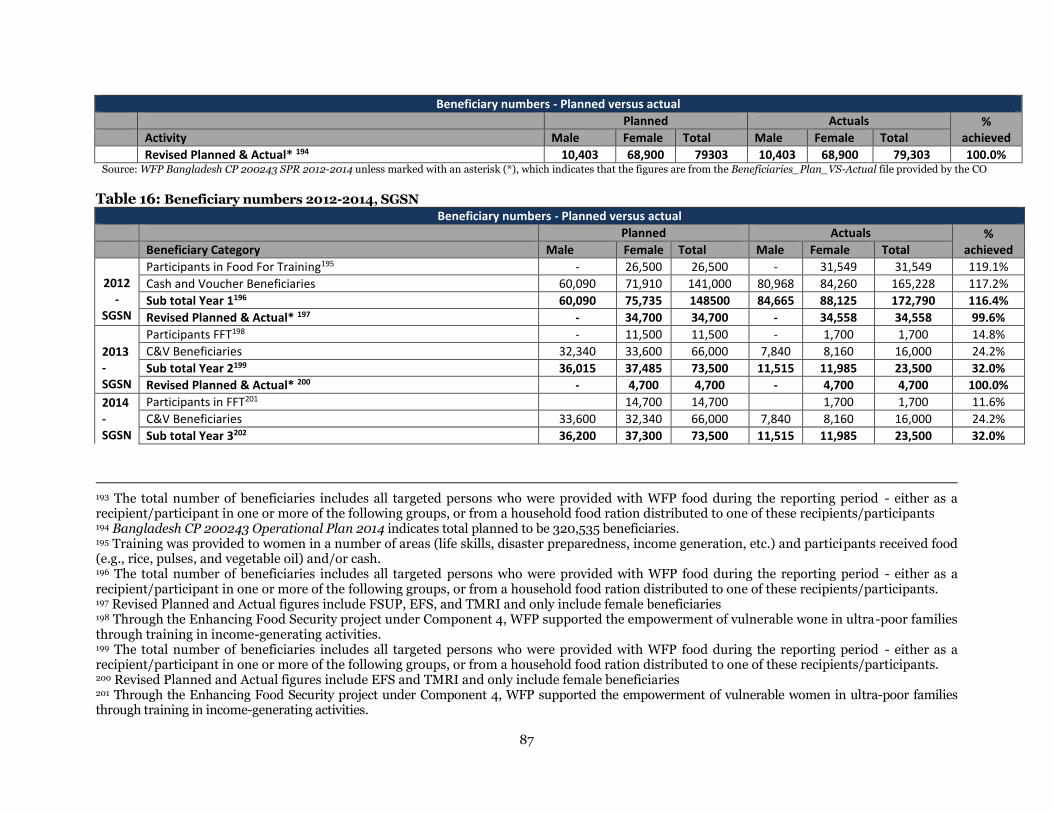
SGSN appears to under-achieve in 2013-2014; however this is not the true case: the actual values are compared to original plans that included FSUP, but FSUP was not funded for those years. Based on the POW revised plan excluding FSUP (4,700 planned) for both 2013 and 2014, 100 percent of targeted beneficiaries were reached in those years.
16 This difference in planned values is because the POW is based on revised planning figures, while the SPR is based on original plans. The (small) difference between actual values may be attributed to the POW being based on January to December actuals, while the SPRs are based on January to November actuals with estimates for December, as explained by the CO.
37%
99%
117% 116%
92%
36%
114%
96%
32%
70%
58%
92% 92%
32%
69%
IMCN SF ER SGSN Total
2012
2013
2014
xiii
OUTPUTS (continued)
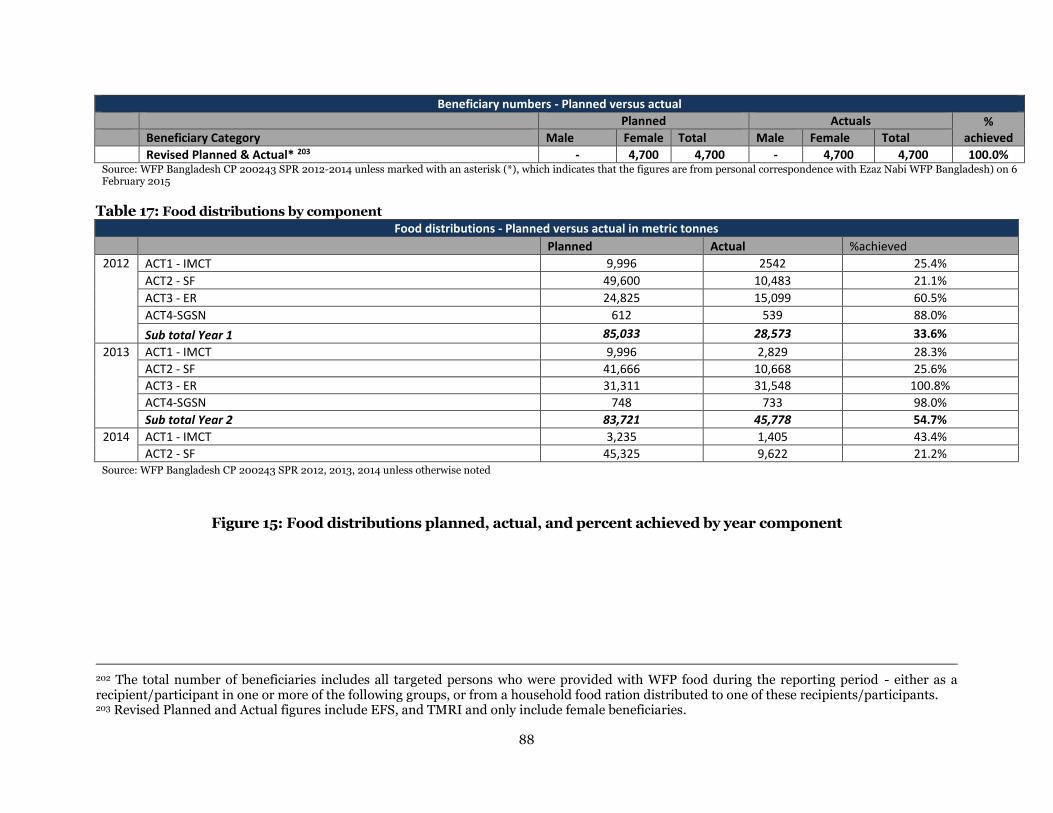
% of actual versus planned food tonnage distributed by component and year
% of actual value of cash distributions versus planned by year
Key observations (and noted differences across data sources): The SF cash was distributed to schools starting in 2013 as part of the hot schools meals pilot initiative that locally purchased and served meals of lentils, vegetable oil, fortified rice and vegetables.
In 2012, the POW17 reduced the planned food tonnage for every component except ER, which increased to include the emergency response efforts.
17 WFP Bangladesh. 2014. Actual and Planned Tonnage by Activity by Year.
25%
21%
61%
88%
34%28% 26%
101% 98%
55%
43%
21%20%
120%
22%
IMCN SF ER SGSN Total
2012
2013
2014
97%
49%
66%
0%
20%
40%
60%
80%
100%
120%
-
1,000,000
2,000,000
3,000,000
4,000,000
5,000,000
6,000,000
7,000,000
2012 2013 2014
Planned US$ Actual US$
xiv
OUTCOMES18
Colour-coding key:
Indicator column: Points of measurement columns: Original logframe only (2012-14)19 Attained Revised logframe only (2014-16)20 Not attained
Original & revised logframe21 Not measured
Refer to the Annex 4 for additional analysis from the 2014 outcome survey.
SRF SO Indicator Target22 Baseline
(BL) 2012 2013
Mid-term
follow up23
SO#4 Component 1: IMCN July 2012 Dec Dec Nov/Dec 2014
Prevalence of stunting among targeted children under two years (U2)
5% reduction/year 35.6%
32.2%
(-9% change)
Prevalence of underweight among targeted children under five (CU5)
10% reduction/year 39.9%
34.6%
(-13% change)
Prevalence of wasting among targeted CU5 1% reduction/year 20.5%
12.9%
(-37% change)
Prevalence of iron deficiency anaemia in PLW/ CU5 10% reduction/year
64.5%/35.5% N/A: not in revised logframe
18 Outcome indicators are from the original and revised logframes, as the evaluation assesses progress since baseline towards targets to be reached by December 2016. 19 Original logframe achievements are reported as these are within most of the period under assessment. 20 Note that indicator values from baseline and monitoring data are retroactively reported where available for the new indicators of the revised logframe. 21 Note that targets changed from “per year” to a two-year timeframe (baseline to mid-term, and mid-term to endline) for original logframe indicators that remained in the revised logframe. 22 Note for interpretation of percent change targets: For the first indicator as an example (stunting) and others with targets represented as an annual percent change, more than two years have passed from baseline to mid-term, which is used by the ET to determine attainment status of the percent change over that time period. For this indicator, the percentage point change from 35.6o to 32.24 is 3.36 points, but 3.4 of 35.6 is a 9.44 percent change (reduction) to 32.2 in two years, which just misses the target of five percent reduction each year. 23 The follow-up outcome survey at mid-term preceded the evaluation qualitative fieldwork. Baseline and follow-up outcome survey values reported for programme areas only (not control). Follow-up also includes WFP monitoring data for some indicators, marked with an asterisk (*).
xv
Incidence of low birth weight (LBW) 10% reduction/year24
Proportion of eligible population who participate in programme (coverage)
>50% rural; >70% urban25
92.1% *
Proportion of target population who participate in an adequate number of distributions
>66% 96.7% *
% of mothers exclusively breastfeeding infants 0-5 months
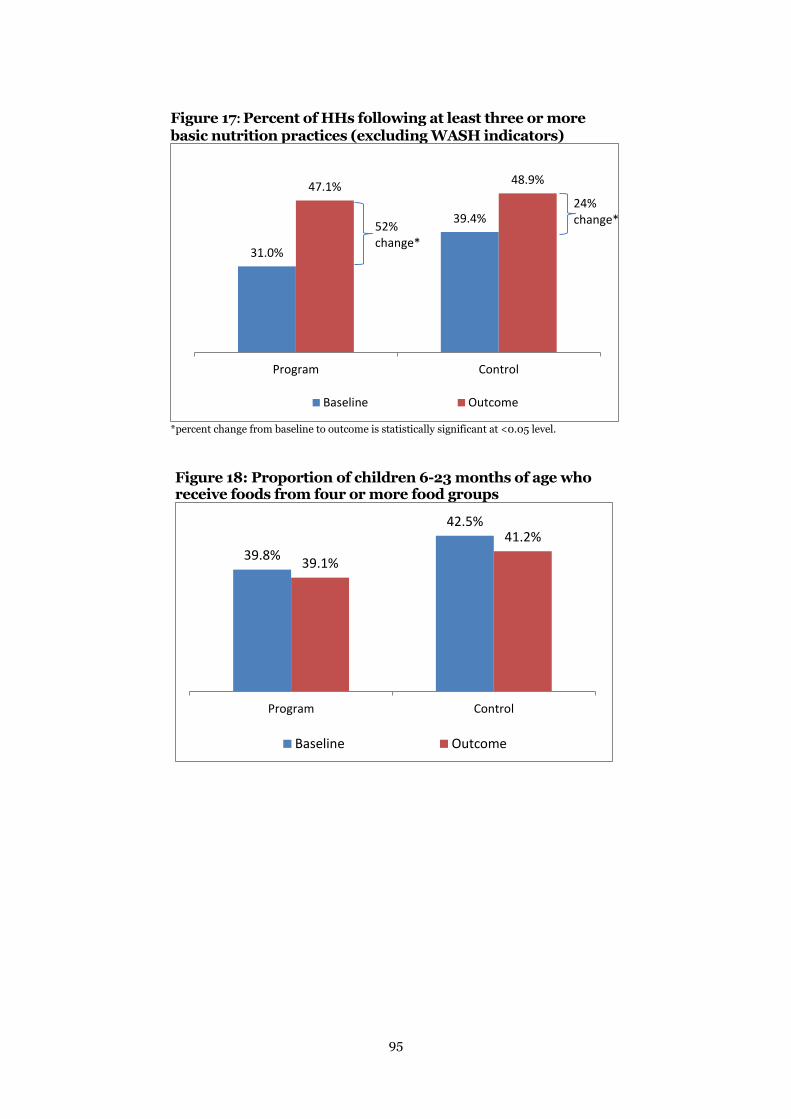
10% increase from BL
47.6% 64.1%26
(+35% change)
27 % of caregivers providing minimum acceptable complementary diet to children aged 6-23 months
10% increase/year
29.3% 24.8%
(-15% change)
% of targeted HH accessing public health services when required, at least one
10% increase from BL
65.0% 46.9%
(-28% change)
% of children aged 6-23 months receiving foods from four or more food groups
10% increase from BL
39.8% 39.1%
(-2% change)
% of breastfed and non-breastfed children aged 6-23 months receiving solid, semi-solid or soft foods (incl. milk feeds) minimum number of times or more
10% increase/year
62.6% 62.2%
(-1% change)
% of targeted HH following three or more nutrition/hygiene practices including WASH
10% increase from BL
58.4% 74.2%
(+27% change)
NCI: Nutrition programmes National Capacity Index >12 N/A: not in baseline
Data not available
24 LBW data should be collected within 72 hours of birth. The BL and outcome survey data are based on mother’s recall and may not be accurate, and the surveys did not ask whether the child’s weight was taken within 72 hours of birth. The indicator is reported but is not in the revised logframe. 25 WFP SRF 2014-17 includes additional details for this target: >90 camps; >70 MAM prevention. 26 SPR 2014 reports the value of 63.5 percent because preliminary analysis was utilised. 27 According to CO, while a new SRF indicator this is not included in revised logframe via guidance from WFP COMET system.
xvi
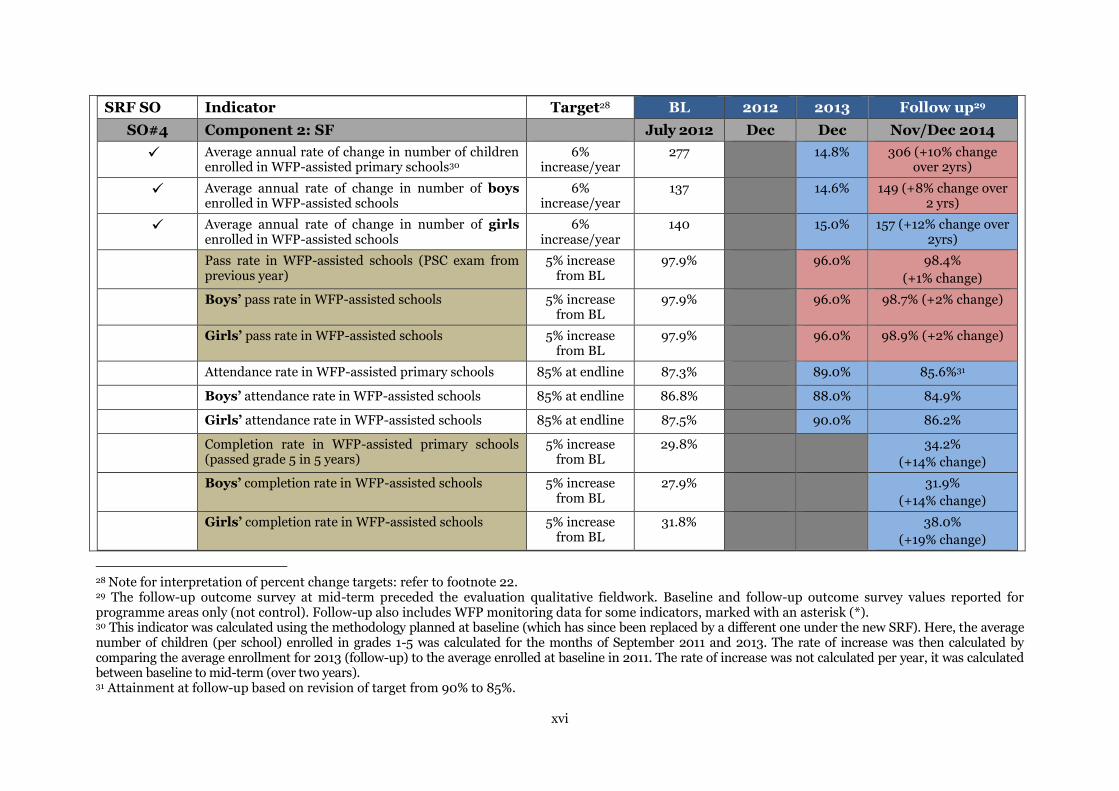
SRF SO Indicator Target28 BL 2012 2013 Follow up29
SO#4 Component 2: SF July 2012 Dec Dec Nov/Dec 2014
Average annual rate of change in number of children enrolled in WFP-assisted primary schools30
6% increase/year
277 14.8% 306 (+10% change over 2yrs)
Average annual rate of change in number of boys enrolled in WFP-assisted schools
6% increase/year
137 14.6% 149 (+8% change over 2 yrs)
Average annual rate of change in number of girls enrolled in WFP-assisted schools
6% increase/year
140 15.0% 157 (+12% change over 2yrs)
Pass rate in WFP-assisted schools (PSC exam from previous year)
5% increase from BL
97.9% 96.0% 98.4%
(+1% change)
Boys’ pass rate in WFP-assisted schools 5% increase from BL
97.9% 96.0% 98.7% (+2% change)
Girls’ pass rate in WFP-assisted schools 5% increase from BL
97.9% 96.0% 98.9% (+2% change)
Attendance rate in WFP-assisted primary schools 85% at endline 87.3% 89.0% 85.6%31
Boys’ attendance rate in WFP-assisted schools 85% at endline 86.8% 88.0% 84.9%
Girls’ attendance rate in WFP-assisted schools 85% at endline 87.5% 90.0% 86.2%
Completion rate in WFP-assisted primary schools (passed grade 5 in 5 years)
5% increase from BL
29.8% 34.2%
(+14% change)
Boys’ completion rate in WFP-assisted schools 5% increase from BL
27.9% 31.9%
(+14% change)
Girls’ completion rate in WFP-assisted schools 5% increase from BL
31.8% 38.0%
(+19% change)
28 Note for interpretation of percent change targets: refer to footnote 22. 29 The follow-up outcome survey at mid-term preceded the evaluation qualitative fieldwork. Baseline and follow-up outcome survey values reported for programme areas only (not control). Follow-up also includes WFP monitoring data for some indicators, marked with an asterisk (*). 30 This indicator was calculated using the methodology planned at baseline (which has since been replaced by a different one under the new SRF). Here, the average number of children (per school) enrolled in grades 1-5 was calculated for the months of September 2011 and 2013. The rate of increase was then calculated by comparing the average enrollment for 2013 (follow-up) to the average enrolled at baseline in 2011. The rate of increase was not calculated per year, it was calculated between baseline to mid-term (over two years). 31 Attainment at follow-up based on revision of target from 90% to 85%.
xvii
Retention rate in WFP-assisted schools (2013 data) 85% at endline N/A: not in baseline logframe
92.9%32
Boys’ retention rate in WFP-assisted schools 85% at endline 92.2%33
Girls’ retention rate in WFP-assisted schools 85% at endline 93.5%34
NCI: School Feeding NCI >14 35 6.7 10.7 11.7 *
SRF SO Indicator Target36 BL 2012 2013 Follow up37
SO#2 (new SO#3) Component 3: ER
July 2012 Dec Dec
Nov/Dec
2014
Percentage of communities with an increased community asset score (CAS) over BL
80% Data not available
99.0% 100% 100% *38
CAS average 15% increase from BL
31.1 41.2 (+33%)
51.1
(64% increase)
Prevalence of moderate acute undernutrition, by MUAC, among U5 children in targeted HH
<15% Data not available
N/A: not in revised logframe
Percentage of HH with acceptable food consumption score (FCS) for: overall programme HH
80% at endline (ER-only areas)
35.6% 55.4%
% female-headed HH with acceptable FCS 27.8% 43.5%
% male-headed HH with acceptable FCS 37.5% 59.0%
Percentage of HH that consume average of at least four food groups per day (diet diversity) for: overall programme HH
80% at endline (ER-only areas)
39
94.6% 93.2%
32 The CO requested that TANGO estimate the retention rate per WFP corporate guidelines: by counting all children who ultimately left school during the year irrespective of the reasons for drop-out or move to other schools. It should be noted that the outcome survey encountered difficulties collecting the actual drop-out figure from schools as the information is not uniformly collected by schools. 33 SPR 2014 reports the value of 92.9 percent because preliminary analysis was utilised. 34 SPR 2014 reports the value of 92.9 percent because preliminary analysis was utilised. 35 The CO notes that while this target is not attained at mid-term, the CO has set the target higher than the WFP corporate standard. 36 Note for interpretation of percent change targets: refer to footnote 22. 37 The follow-up outcome survey at mid-term preceded the evaluation qualitative fieldwork. Baseline and follow-up outcome survey values reported for programme areas only (not control). Follow-up also includes WFP monitoring data for some indicators, marked with an asterisk (*). 38 The CAS is based on the 30 sample communities, with data collection and analysis by WFP. 39 DDS score for programme households in ER-only areas is 5.0 at baseline and 5.0 at mid-term.
xviii
% female-headed HH with acceptable diet diversity 93.3% 89.0%
% male-headed HH with acceptable diet diversity 95.0% 93.8%
Coping strategies index (CSI) average score40 for: overall programme HH female-headed HH male-headed HH
target reduction not specified (ER-
only areas)
27.3 18.7
28.5 23.6
27.0 17.2
Resilience programmes NCI >10 Data not available
Proportion of targeted communities with evidence of improved capacity to manage climatic shocks and risks supported by WFP41
80% at endline 56.5
(ER-only areas, n=30)
63.7
(ER-only areas, n=29)
SRF SO Indicator Target42 BL 2012 2013 Follow up43
SO#5 (new SO#4)
Component 4: SGSN July 2012 Dec Dec Nov/Dec 2014
Targeting error in major safety-net programmes, in particular for VGD
reduced by 20% from BL
Baseline data not available
N/A: not in revised logframe
Handover agreements implemented (VGD and school feeding)
4 No data
No. of safety nets modified on basis of lessons learned and knowledge transferred from WFP pilot projects and monitoring and evaluation systems
40 The revised logframe states the following indicator: Percentage of targeted HH with reduced/ stabilized CSI (target: 100% at endline). CSI scores are presented as agreed with the CO. 41 Indicator is called “community disaster preparedness index” in original logframe. 42 Note for interpretation of percent change targets: refer to footnote 22. 43 The follow-up outcome survey at mid-term preceded the evaluation qualitative fieldwork. Baseline and follow-up outcome survey values reported for programme areas only (not control). Follow-up also includes WFP monitoring data for some indicators, marked with an asterisk (*). 44 The RB notes that while this target is not attained at mid-term, the CO had set the target higher than the WFP corporate standard.
xix
Map
Source: C. Conan, Inception Planning Call: Email 13 November 2014.
xx
Executive Summary
1. Overview of evaluation, purpose and objectives. The independent operation evaluation of Bangladesh Country Programme (CP) 200243 was commissioned by the World Food Programme (WFP) Office of Evaluation (OEV) to address WFP’s renewed corporate emphasis on providing accountability and learning. TANGO International conducted the evaluation. The CP was selected for evaluation based on utility and risk criteria.45 It has four components: improving maternal and child nutrition (IMCN), school feeding (SF), enhancing resilience to disasters and the effects of climate change (ER) and strengthening government safety nets (SGSN). The evaluation objectives are to assess and report on CP performance and mid-term results, and to provide evidence-based findings to inform future decisions on implementation, design and strategy. The scope is all activities and processes related to CP formation (2010), implementation (starting January 2012), resourcing, monitoring and reporting through December 2014. As an evaluation at mid-term, the scope does not include final conclusions on impact: it discusses progress toward targets at midline based on the original and revised CP outcomes and objectives.
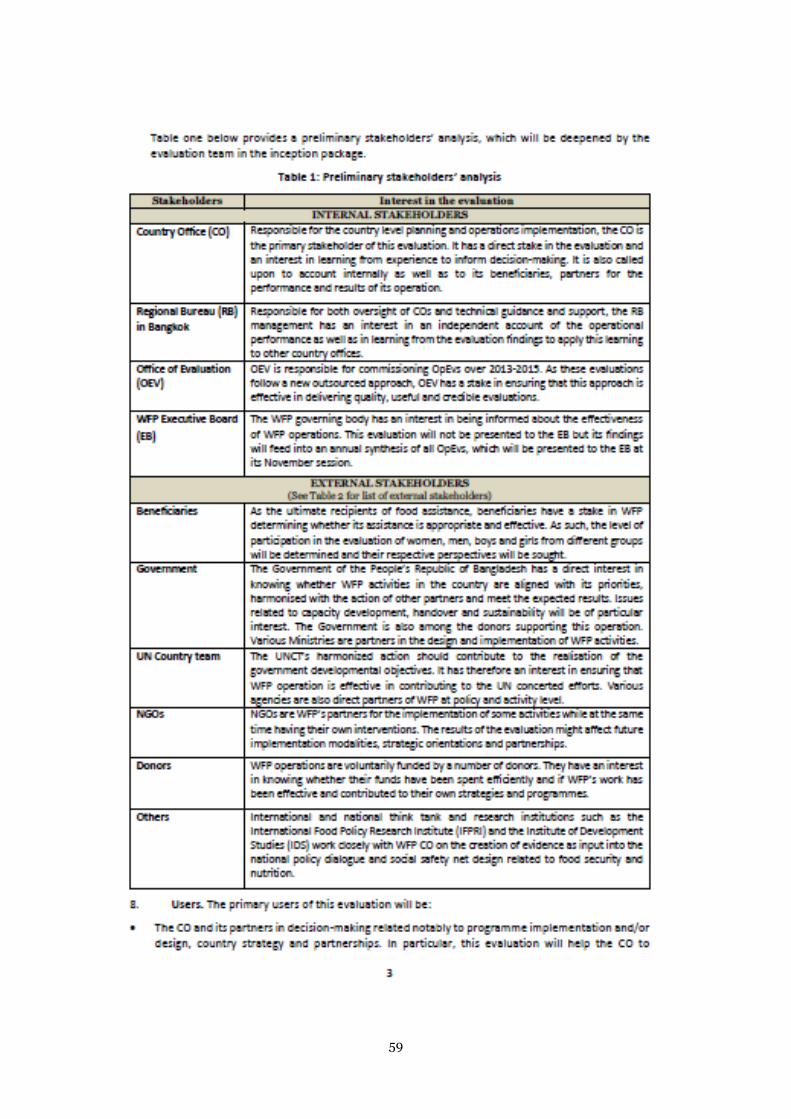
2. Intended audience and users. The primary audience and users of the evaluation are internal stakeholders: Country Office (CO) and sub-office staff, to directly operationalise this information; Regional Bureau (RB), to use for strategic guidance and oversight; and OEV, to refine evaluation processes and feed results into an annual synthesis for the WFP Executive Board. The external stakeholders include: beneficiaries, as changes affect their lives; cooperating partners, donors, research institutions and Government of the People’s Republic of Bangladesh46 counterparts, to inform their strategies and programmes.
3. Context. Bangladesh has made important economic and social gains in recent years. Yet, even as it heads toward middle-income country (MIC) status, poverty, inequality and food insecurity remain major challenges, as do climatic shocks and hazards. It one of the world’s most densely populated nations, and one-quarter of the population resides in urban areas.47 Despite steady economic growth, one-third (32 percent) of the population live in poverty and 18 percent in extreme poverty.48 Bangladesh is on track to meet millennium development goal (MDG) targets in reducing maternal and child mortality.49 While stunting and underweight prevalence have steadily decreased, they remain high in 2015, and wasting rates have remained in the 14-17 percent range since 2004. Strengthening caregivers’ hygiene and infant and young child feeding practices (IYCF) are key areas for contributing to improved nutrition.50 Overall access to primary education for girls is high and at parity with that of boys, meeting the MDG. Bangladesh has low-lying terrain and one of the world’s wettest climates, which makes it vulnerable to natural disasters and to the effects of climate change and environmental degradation. Prior to the January 2014 national elections and following the first anniversary of these elections, the country saw four months of violence, blockades and strikes.
4. Methodology. The evaluation questions are: 1) how appropriate is the operation; 2) what are the results of the operation; and 3) what factors affected the results? The ET’s rationale for a mixed-methods approach was to ensure triangulation across different types
45 Per TOR: The utility considered timeliness given the operation’s cycle and the coverage of recent/planned evaluations. Risk criteria were based on a classification and risk ranking for a wide range of risk factors, including operational and external factors as well as internal controls and self-assessments. 46 Referred to as Government of Bangladesh in this executive summary. 47 Sabina, N. 2014. 48 BBS and World Bank. 2011. HIES 2010. (Based on upper/lower poverty line of poverty headcount rate). 49 World Bank, news. 2013. 50 NIPORT, Mitra and Associates, and ICF International. 2015. DHS 2014.
xxi
of data sources. The ET employed desk review, observation, and a qualitative study, which built on a CO-supported quantitative outcome survey conducted prior to the qualitative work. This approach increased the ET’s ability to verify findings across varied data sources, and allowed the qualitative study to draw on findings from preliminary quantitative results.
5. The outcome survey (Oct/Nov. 2014) was a follow up to the baseline and utilised the same methodology as baseline. During the qualitative field mission (April/May 2015), the team observed activities at schools, community clinics and resilience activity sites. The team used in-depth structured and semi-structured key informant interviews with 140 people including WFP, government, partner staff and donors, and conducted 90 focus group discussions. The ET selected four of 17 active programme areas to assess progress: Kurigram (north), Cox’s Bazar (coast), Satkhira (southwest) and Dhaka. Field sites were selected in consultation with the CO based on baseline criteria agreed by the ET and CO.
6. To understand the dynamics of gender equity and to verify the nature and extent of women’s participation, the qualitative team interviewed women in groups and individually. Data collection processes observed ethical principles for evaluators such as informed consent, systematic inquiry and respect for people. There were no limitations to data quality. The challenge of political volatility caused delays for data collection, but both the quantitative and qualitative work could be adjusted to deliver a timely evaluation.
Key findings: 7. Appropriateness of the operation. The CP’s objectives and design are appropriate to the country context; that is, it is responsive to a changing context and coherent with the policies and strategies of external stakeholders, to the needs of the target population of the poor and ultra-poor in remote areas and urban slums, and to addressing the need to strengthen government capacity and national safety nets. The programme originally aligned with the WFP Corporate Strategic Objectives 2, 4 and 5 and was realigned with WFP Strategic Plan 2014-2017, and with WFP policies on nutrition, SF, disaster risk reduction and management, humanitarian protection and gender.
8. Results: Outputs and outcomes. At mid-term the CP reached beneficiary targets at an annual attainment rate ranging from 87-98 percent. IMCN targets for beneficiaries were scaled down to 19 percent of the original target in 2014, partly to comply with new CMAM protocols and also due to resource shortfalls and limited local capacity for implementation. The targeted supplemental feeding programme (TSFP) faced no pipeline breaks. SF beneficiary targets were largely met or exceeded, though the number of feeding days was affected by delays in biscuit production and political crises. The ER component exceeded targets each year for the proportion of female participants, and when donor contributions declined in 2014 the government provided the cash equivalent of rations. For SGSN, based on the revised programme of work, 100 percent of target beneficiaries were reached in 2013 and 2014.
9. Among notable outcome results, the TSFP achieved recovery rates well above Sphere Standards and showed significant reductions in wasting among children 6-23 months as compared to the control group. Beneficiaries have learnt new knowledge and skills through behaviour change communication (BCC) but BCC effectiveness is limited by the inability of young mothers to apply their new knowledge and influence household practices. The follow-up survey showed positive results for the enrolment and completion rates in WFP-assisted schools as compared to baseline. Attendance rates for WFP-assisted schools are high but slightly below control and government-assisted schools, which can be attributed to the fact that WFP-assisted schools are in the poorest and most remote areas, to a decrease in the value of social transfers as wages and prices
xxii
rise, and to more accurate monitoring data collected at WFP-assisted schools. ER support has enabled women and their families to increase household food consumption, reduce coping strategies and invest in productive assets. Nearly two-thirds of ER-only communities have improved capacity to manage climatic shocks and risks. ER Plus has provided an excellent opportunity for women to earn and manage their own cash, which has improved their status and empowerment within their households and community.
10. Factors affecting results. The main internal factors that limited the effectiveness of the programme were: the lack of synergy between components, though pilots and research initiatives offer more synergies such as the integration of school feeding and nutrition with livelihood activities in the Enhancing Food Security (EFS) pilot; the need to strengthen partner staff capacity; and the funding approach, which the ET finds is not meeting the CO’s need to respond to the changing donor and development context and the concomitant changes this requires in WFP’s role. The main external factors that have supported positive CP results overall are WFP’s standing as a valued partner of government, government ownership of programmes, and strong, trusted external relationships. There is a need for more female NGO staff to interact with female ER participants on topics like women’s empowerment, and for recruitment of male nutrition worker/volunteer staff to mobilise youth and religious/community leaders.
Conclusions 11. Relevance: The CP was relevant at the time of design. Yet, in a rapidly changing context, donor priorities have shifted from traditional CP designs, and resource levels have declined. WFP’s future relevance in Bangladesh will in part depend upon its ability to test innovative approaches, to provide support to policy decisions and to build government capacity to implement existing programmes more efficiently. The CO has demonstrated its willingness to test approaches of interest to government and donors, such as the transfer modality research initiative (TMRI) and food security for the ultra-poor
programme (FSUP). Inclusion of urban areas was highly relevant; scale-up should incorporate deeper context analysis and greater synergy between its own activity streams.
12. Efficiency: WFP is trusted by the government and other stakeholders, who feel that it is transparent in its communications, which helps ensure accountability in programmes. The CP is somewhat unique in that the government provides financial or material support to some interventions, which has enabled WFP to continue to serve beneficiaries. WFP support to government and private sector efforts to locally produce fortified products used in IMCN and vulnerable group development (VGD) will help increase overall cost-effectiveness of these interventions. The staff time required to obtain support for short-term programmes and to test innovative approaches increases the workload, and could be addressed more efficiently with internal programme development funds.
13. Effectiveness: The CP has been effective in achieving the changes sought in line with WFP corporate objectives, with nuances as noted in the results section above. An important aspect of WFP’s effectiveness has been its accountability practices, which are recognized and valued by the government and donors. Going forward, more comprehensive outcome measurement is needed to provide evidence of the efficacy of new approaches and capture progress of WFP’s efforts in government capacity building.
14. Impact: While WFP’s direct coverage has contracted considerably, its collaborative design and implementation of new concepts and approaches with government and other stakeholders is highly valued, and WFP is able to leverage its experience and skills into policy influence at ministry level and a longer-term capacity-building role with government. The pilots, research and capacity building WFP undertakes are helping
xxiii
government to improve how resources are channelled to the poor, such as the evidence generated through the TMRI research on which transfer modalities work best for the ultra-poor. There is scope for a stronger WFP voice to push forward the multi-sectoral nutrition agenda and to link its successful results on rice fortification, TMRI, nutrition-sensitive safety net support and effective BCC models to the broader agenda.
15. Sustainability: Many of WFP’s contributions are sustainable as they are part of or closely connected to the government‘s own programmes, and some are financially supported in part by government. WFP’s capacity building with ministries supports sustainability by strengthening national and local capacity to manage development programmes. Government key informants see more scope for WFP capacity building support, particularly in safety nets and disaster response.
16. Gender: The CP has integrated gender considerations by primarily targeting women and, in school feeding, by promoting equal access to education; the ER and SGSN pilots have focused on empowerment of ultra-poor women. Evidence of successful gender-sensitive programming includes school enrolment at or near gender parity and increased mobility, and in the WFS pilot, a stronger role for women in household decision-making, and more engagement by husbands in domestic tasks. However the IMCN and ER components, and EFS within SGSN, demonstrate a need for more gender-specific approaches, including better targeting and greater inclusion of men for BCC messages, and stronger gender-sensitive staffing for trainings for women and awareness-raising activities for men.
Recommendations: Operational recommendations
1: Consolidate IMCN activities in the current targeted focus areas and further develop the capacity of government and community clinics to manage the programme in Kurigram and Satkhira. There is an opportunity for greater collaboration with the health ministry and reinforcement of nutrition mainstreaming at the field level. (CO, short-term)
2: Reassess the duration of ER activities and the quality of trainings to enhance sustainability and synergy. WFP should engage with government to ensure adequate support and monitoring to ER Plus participants, facilitate a higher-quality mapping exercise of ER, and review training messages. (CO, medium-term)
3: Strengthen CO staff technical expertise and funding development capacity, and invest in capacity building for field staff, which requires headquarters and regional assistance. (CO, RB and HQ, medium term)
4: Continue technical support and policy guidance to the government to support the timely and effective institutionalisation of SF, including development of hot meals, adequate district support, and biscuit palatability to retain students. (CO, short and medium term)
5: Take action with Department of Women Affairs partners to improve systems for community participation, ownership and monitoring of VGD. (CO, medium to long term)
6: Continue to build evidence for future programming, including revising the M&E system and improving CO capacity to perform robust outcome measurement. Promote the learning from select research projects to focus on scaling up. (CO, medium-term)
Strategic recommendations
7: Develop a clear strategy and role for WFP in supporting nutritional outcomes through a comprehensive multi-sectoral/synergistic approach, done in collaboration with key partners. (CO, medium to long term)
xxiv
8: Enhance the BCC strategy to address undernutrition of children under two years and the barriers to changes in practice by integrating new approaches, involving the whole community and learning from TMRI and pilots. (CO, short and medium-term)
9: Examine effective approaches and options for urban programming and develop a clear strategy in collaboration with community and other stakeholders to address the high rates of undernutrition and school drop-outs amongst the urban poor. Engage non-traditional actors and the private sector to explore workplace-based programmes. (CO, medium-term)
10: HQ should review instruments and consider providing a funding mechanism that invests in research, design and proposal development. The RB should provide leadership to the CO to better understand the donor landscape, analysing donor opportunities and positioning WFP for future funding in the MIC context. (WFP HQ and RB, medium to long term)
1
Introduction
1.1. Evaluation Features
1. Purpose. This independent operation evaluation, commissioned by the World Food Programme (WFP) Office of Evaluation (OEV), addresses WFP’s renewed corporate emphasis on providing accountability and evidence for results. The Bangladesh County Programme (CP 200243) was selected for evaluation based on utility and risk criteria.51 Technical Assistance to Non-Governmental Organizations (TANGO) International conducted the evaluation. The timing at the CP midline ensures that findings can inform future decisions on programme implementation and design.
2. Objectives and scope. The evaluation’s mutually reinforcing objectives are accountability and learning, specifically to assess and report the performance and mid-term results of the CP, and to provide evidence-based findings and lessons learned to inform operational and strategic decision-making. The evaluation period is from CP development in 2010 to when the evaluation began at the end of 2014. The evaluation scope is all components, activities and processes related to CP formation, its implementation, resourcing, monitoring and reporting. As an evaluation at mid-term the scope does not include final conclusions on programme impact, but discusses progress toward targets based on both the original and revised CP outcomes and objectives as aligned with the corporate strategic results framework (SRF).52 The key evaluation questions are: 1) How appropriate is the operation? 2) What are the results of the operation? 3) Why and how has the operation produced the observed results?53
3. Stakeholders and users. The primary internal stakeholders and intended audience are: WFP Bangladesh Country Office (CO) and sub-office, which will operationalise this information for strategic positioning in a rapidly-changing context; WFP Regional Bureau (RB), which will use the findings for strategic guidance and oversight; and WFP OEV, to continue to improve evaluation processes and to compile the findings into an annual synthesis for the Executive Board (EB), which contributes to corporate learning across operations addressing the same strategic objectives, including challenges and successes. The primary external stakeholders are beneficiaries – who have an interest in the results because programme changes will affect their lives, and cooperating partners (CP), bilateral donors, research institutions and Government of the People’s Republic of Bangladesh54 counterparts – whose strategies and programmes the evaluation will inform.55,56,57
4. Methods. The evaluation team (ET) applied Organisation for Economic Co-operation and Development (OECD) principles58 in the methodological design and as appropriate to answer the evaluation questions, incorporating the main standards of relevance,
51 Per TOR: The utility considered timeliness given the operation’s cycle and the coverage of recent/planned evaluations. The risk criteria were based on a classification and risk ranking for a wide range of risk factors, including operational and external factors as well as internal controls and self-assessments. 52 This evaluation, per agreement with the CO, evaluates CP performance against the original and revised logframes. The original logframe (2012-2014), which aligned with WFP Strategic Plan and SRF (2008-2013), covers most of the evaluation time period. The CP logframe was realigned to the WFP Strategic Plan and SRF (2014-2018) in 2014 to adjust, remove and add CP objectives/outcomes to align with the new corporate strategic objectives and outcome indicators. See the outcome indicator table in the factsheet for original and revised outcomes. 53 See WFP. 2014 TOR for CO questions and Supplementary Annex 9 evaluation matrix sub-questions. 54 Referred to as Government of Bangladesh in this report. 55 WFP. 2014. TOR. 56 TANGO International. 2015. Inception Report. 57 See Operation Factsheet for a listing of the main partners. 58 OECD. 1991. DAC Principles.
2
effectiveness, efficiency, impact and sustainability.59 The ET used a mixed-methods approach including desk review, observation, and a qualitative study to ensure triangulation across quantitative and qualitative data60 and secondary data sources. This evaluation was unique because the standard methods were preceded by a quantitative outcome survey supported through the CO as a follow-up to the 2012 baseline survey. This approach increased the team’s ability to determine coherence across data sources, and allowed the qualitative study to draw on findings from preliminary quantitative results.
5. The quantitative study followed the same methodology as the baseline. The study surveyed a random sample of 2600 programme and 2600 control households to measure changes in Components 1 and 3 outcome indicators since baseline. It surveyed 310 WFP-assisted and 312 government-assisted schools across programme zones to gather data for Component 2 outcome indicators. During the qualitative field mission, the team observed activities at schools, community clinics and resilience activity sites. The team used in-depth structured and semi-structured key informant interviews (KII) with 140 people, including WFP, government, partner staff and donors, and conducted 90 focus group discussions (FGD) with 634 people (227 male/407 female).61 In addition, the desk review began in the inception phase: the team reviewed over 150 documents relevant to national strategies and policies, external reports, and WFP corporate guidance.
6. To understand the dynamics of gender equity and to verify the nature and extent of women’s participation in the CP, the qualitative team interviewed women in focus groups and as individual key informants. Additionally, the tools integrated gender considerations to allow understanding of levels of gender equity, gender discrimination and power relations between males and females. The quantitative survey ensured inclusion of female participants by requiring that at least one of the respondents be female, even if not household head. The ET ensured the inclusion of marginalised groups by visiting project sites in remote areas and interviewing women and men from the poorest households.
7. Both quantitative and qualitative processes observed ethical principles for evaluators of competence, integrity/honesty, informed consent, systematic inquiry, respect for people and responsibilities for public welfare.62 It was determined that there were no political or cultural considerations that necessitated extra sensitivities for the interviews.
8. The outcome survey fieldwork took place 27 October-27 November 2014, and qualitative data collection was 19 April-8 May 2015. The ET selected four of 17 active programme districts63 (including Dhaka urban activities) to assess progress of components: Kurigram in the north, Cox’s Bazar on the coast, Satkhira in the southwest and Dhaka.64 Table 1 shows a summary of the evaluation sample. Field sites were selected in consultation with the CO, based on criteria from the baseline agreed by the ET and CO. The fieldwork ended with presentations of initial findings with the CO, donors and government stakeholders.65 Annex 2 contains a full description of the sampling methodology, justification for field site selection and fieldwork timeline, limitations and how the evaluation considered gender and ethical safeguards.
59 See Annex 2 for more information on “DAC” criteria, and Section 3.1 for how these applied in this CP. 60 See Annex 2 for the sampling frame and full description of the primary data collection methodology. 61 See Supplementary Annex 8 for interview lists and Supplementary Annex 10 for topical outlines. 62 American Evaluation Association. 2004. Guiding Principles for Evaluators. 63 Two districts, Rangpur and Pirojpur, are part of the TMRI pilot only and thus were not sampled. 64 See Operation Map and Supplementary Annex 11: fieldwork schedule. 65 See Supplementary Annex 9: debrief participants.
3
Table 1: Summary of evaluation sample, by district
Sample zone
District Components
implemented*
Components included in outcome survey
(beneficiary sample)
In qualitative study?
North Bogra IMCN, ER, SGSN1 ER Gaibandha IMCN, SF, ER IMCN, IMCN+ER, SF Jamalpur SF, ER ER Kurigram IMCN, SF, ER, SGSN2 IMCN, IMCN+ER, SF, ER yes Pabna ER, SGSN1 Rangpur SGSN2 (SF Govt.) Sirajganj IMCN, ER, SGSN1 IMCN, ER
Coastal (South and Cox’s Bazar)
Bagerhat SF, ER, SGSN2 ER Barguna IMCN, SF, ER SF, ER Bhola IMCN, SF, ER, SGSN2 ER Cox’s Bazar IMCN, SF, SGSN3 IMCN yes Khulna ER, SGSN2 ER Patuakhali SF, ER, SGSN2 ER Pirojpur SGSN2 Satkhira IMCN, SF, ER IMCN, IMCN+ER, SF, ER yes
Chittagong Hill Tracts (CHT)
Bandarban SF, ER (2012 only) SF Khagrachari SF, ER (2012 only) Rangamati SF, ER (2012 only)
Urban Dhaka IMCN, SF, SGSN4 SF yes * Component acronyms: C1-improving maternal and child nutrition (IMCN); C2-school feeding (SF); C3-enhancing resilience (ER); C4-strengthening government safety nets (SGSN, which is countrywide with direct work with central government in Dhaka) 1 Food security for the ultra-poor programme (FSUP) in 2012 only, built upon by initiatives under ER and SGSN components. 2 Transfer modality research initiative (TMRI) 3 Enhancing food security programme (EFS) 4 Government offices located in the capital
9. Expertise and quality assurance. The field team was comprised of five TANGO consultants, one for quantitative and four for qualitative fieldwork, with extensive experience in Bangladesh and WFP, and with expertise in food security, nutrition, SF, safety nets, government capacity building, disaster risk reduction (DRR), and resilience.66 The evaluation followed the OEV evaluation and quality assurance system standards. The ET maintained impartiality and transparency during data collection. To ensure quality, the ET analysed the data regularly, implementing systematic checks on accuracy, consistency, reliability, and validity of the data through regular communication with WFP.67 The three international team members were assisted during fieldwork by interpreters who were vetted by the ET based on their relevant experience and ability to provide quality services.
10. Limitations. There were no notable limitations to the quality of the qualitative or quantitative data despite the limitations and challenges that arose.
11. The ET faced a few challenges in following the original schedule. Political volatility caused delays in data collection: this delayed the outcome survey by one day but it was still completed on schedule, and the qualitative fieldwork, originally planned for February 2015, was postponed to April-May. Given the rapidly evolving context and WFP’s extensive capacity development work with government, the CO requested that the ET spend additional days in Dhaka; the ET agreed to the request and divided its time in country almost equally between field and open-office days in Dhaka. The ET was not able to visit the hot school meal pilot due to time and logistic constraints. Some interviews in Dhaka were not held due to non-availability of stakeholders, and intra-city travel time.
66 See Supplementary Annex 13: team composition. 67 WFP. 2014. TOR.
4
12. The main challenge for the quantitative survey related to locating the households and schools from the baseline. Mitra, the local firm contracted to conduct the outcome survey, also had extensive experience with panel surveys to address this common challenge. The sample was still adequate and the data quality was not affected. The data were not tested for significant differences across zones for various reasons, e.g., in some cases sample sizes are too small, particularly for IMCN/ER. Another point on analysis worth clarifying is that the methodology for computing some indicators changed under the new SRF, such as rate of change in school enrolment; such changes are noted in the text where applicable.
1.2. Country Context
13. In recent years, Bangladesh has made important social gains in health, education and population growth. Life expectancy, for instance, has significantly improved for both men and women increasing from 65 years in 2000 to nearly 71 (male 69.9/female 71.5) in 2013.68 However, as a low-income country heading toward middle-income country (MIC) status, poverty, inequality and food insecurity remain major challenges, as well as climatic shocks and hazards.69
14. Population overview. Recent estimates indicate the population of Bangladesh to be 158.5 million people (2014), making it one of the most densely populated nations in the world. Although the population increased by 15 percent from 2001-2011, population growth is expected to slow in coming decades due to a decline in the rate of natural increase. 70 It is estimated that one quarter of the population reside in urban areas.71
15. Bangladesh faces the challenge of absorbing large numbers of refugees and people fleeing persecution within the region. The government estimates that between 300,000 to 500,000 Rohingyas from Myanmar reside in Bangladesh.72
16. Economy and poverty. As Bangladesh heads toward MIC status it is undergoing significant change including the reform of social protection systems and job creation through significant private sector investments.73 While Gross Domestic Product (GDP) growth rates fluctuated in recent years, overall GDP steadily increased over the past decade to US$150 billion (2013 estimate).74 Despite this growth, 32 percent of the population live in poverty, based on the upper poverty line of the poverty headcount rate, and 18 percent are considered the extreme poor (lower poverty line).75
17. Health, food security and nutrition. The Bangladesh Health Nutrition Population Sector Development Programme (HNPSDP) and development partners achieved progress in coverage of and access to basic health services including a reduction in maternal mortality (40 percent reduction from 2001-2010) and under-five (U5) child mortality (26 percent reduction from 2004-2010). The HNPSDP 2011-2016 is the follow-up programme, which aims to strengthen the health sector. The HNPSDP has a particular focus on emergency obstetric and newborn care and on the nutritional status of expectant mothers and their children, which will help Bangladesh stay on track to meet the millennium development goal (MDG) targets in reducing maternal and child
68 UNDP. 2013. 69 BBC. 2014. 70 World Bank. 2014. 71 Sabina, N. 2014. 72 UNHCR. 2014. 73 BBC. 2014. 74 World Bank. 2014. 75 BBS and World Bank. 2011. HIES 2010.
5
mortality. 76,77 While stunting and underweight prevalence have steadily declined since the 2004 and 2007 DHS, they remain high in 2015 and wasting rates have remained at the 14-17 percent level since 2004. Hygiene behaviour alongside infant and young child feeding practices (IYCF) are key areas for improvement to address malnutrition. While access to an improved drinking water source is near universal (99 percent urban, 98 percent rural), there is significantly less access to an improved sanitation facility (65 percent urban, 48 percent rural) and hand-washing station (93 percent urban, 84 percent rural).78 Table 2 provides key national nutrition indicators.
18. Education. Bangladesh has made considerable improvements in universal education with a focus on female education, meeting the MDG for gender parity in primary school (gender parity index: 1.05) and secondary school (1.10). School attendance for all age groups between 6-24 years increased from 2007-2011. In 2011, the net attendance ratio79 at primary level was 73 percent for boys and 77 percent for girls, and at the secondary level, 36 percent for boys and 40 percent for girls. However, incomplete primary education due to drop-out is a critical issue particularly for poor and ultra-poor households.80
19. Gender. Improvements could be made in order to contribute to gender parity in Bangladesh in most sectors. For instance, the female to male labour-force participation rate is estimated at 68 percent.81 These data are consistent with gender inequality index (GII) values for Bangladesh, which show gender inequality for reproductive health, empowerment and economic activity.82
20. Environment. Bangladesh has low-lying terrain and one of the world’s wettest climates, which makes it increasingly vulnerable to natural disasters such as flooding, tidal surges and associated tropical cyclones, and erosion as sea levels rise with climate change. Environmental degradation and deforestation combined with poor infrastructure also contribute to disaster risk such as landslides and challenge the ability of households to build resilience. Since 2000, Bangladesh experienced 107 natural disasters such as storms, floods and landslides, resulting in over 10,200 deaths, 85 million people affected and US$59 million in damages.83 While the country has made progress in DRR based on the Hyogo Framework, the risk of high mortality from disasters remains high.84
21. Government, politics and security. Bangladesh is a relatively young country, established in 1971 following a Liberation War and a separation from Pakistan. After 15
76 See MDG Fund: http://www.mdgfund.org/node/999 77 See World Bank news: http://tinyurl.com/m54xne8 78 NIPORT, Mitra and Associates, and The DHS Program. 2015. DHS 2014. 79 According to DHS 2011: “The net attendance ratio (NAR) indicates participation in primary schooling for the population age 6-10 and participation in secondary schooling for the population age 11-17.” 80 NIPORT, Mitra and Associates, and ICF International. 2013. DHS 2011: P.11, 23-25 81 World Bank. 2014. 82 UNDP. 2013. 83 EM-DAT. 2014. 84 World Bank. 2014.
Table 2: National nutrition indicators, 2014 DHS Stunting among U5 children: 36 percent (37 percent male, 35 percent female) Wasting among U5 children: 14 percent (15 percent male, 14 percent female) Underweight among U5 children: 33 percent (32 percent male, 33 percent female) Exclusive breastfeeding of children under six months: 55 percent Non-breastfed children 6-23 months fed with three IYCF practices: 20 percent
(14 percent male, 26 percent female) Source: NIPORT, Mitra and Associates, and ICF International. 2015. DHS: key indicators 2014.
6
years of military rule, democracy was restored in 1990 and two political parties established: the Awami League and Bangladesh Nationalist Party (BNP).
22. Prior to the January 2014 national elections and following the first anniversary of these elections, violent acts erupted in crowded public areas, leaving hundreds injured or dead. From January 2015, Bangladesh faced almost four months of countrywide road-rail-waterway blockades and a near continual general strike (hartal) called by the BNP-led 20-party political alliance. Violence increased pressure on hospitals and public services, disrupted the educational system and caused economic loss. The international community held discussions with the government and opposition representatives for solving the political crisis, echoing calls from the Bangladesh Civil Society and Business Forums for a solution.
1.3. Operation Overview
23. CP 200243 (2012-2016) was approved in November 2011 by the EB. The duration is January 2012 to 31 December 2016. The CP aims to enhance national safety-net programmes and provide support to improve pre-primary and primary education outcomes, to reduce undernutrition among women and children, and to strengthen resilience to shocks at the household and community levels. The resource requirement at design was US$338.7 million; there have been seven budget revisions (BR) during the evaluation period. The budget is funded at 48 percent against total requirements and 66 percent against mid-term requirements,85 with support from 18 donors, carryover, miscellaneous income and multilateral funding.86 However, funding for the CP has declined precipitously from 2012 to 2015, and in 2015 the CP has 24 percent of its programme funded87 and an anticipated shortfall in the range of 50-69 percent.88
24. The CP has four components: improving maternal and child nutrition (IMCN), school feeding (SF), enhancing resilience to disasters and the effects of climate change (ER) and strengthening government safety nets (SGSN). The main activities have expanded beyond the original Project Document to include pilots, research initiatives and other innovations that fall under the CP strategically:89,90
IMCN: targeted supplementary feeding programme (TSFP)91 through community management of acute malnutrition (CMAM), behaviour change communication (BCC), and complementary food supplement trial*
SF: school feeding through a biscuit-based programme, hot school meals pilot, and capacity building/policy work with the Department of Primary Education (DPE) of the Ministry of Primary and Mass Education (MoPME)92
ER: food for assets (FFA) and food for training (FFT) also known as food and cash for work and training (FCFWT) implemented in two-year ER programme cycles
85 Calculation by TANGO: total contribution received (21 December 2014), excluding US$25 million for 2015-2016, against approved requirement for 2012-2014 (US$230,746,213). 86 WFP Bangladesh. 2014. Resource Situation 21 December. 87 US$34 million total funds available for approved budget for 2015 and 2016 of US$142 million. 88 WFP Bangladesh. 2015. Bangladesh CP evaluation, CO Presentation and Self-Reflection. Powerpoint. 89 WFP Bangladesh. 2011. Project Document. 90 WFP Bangladesh. 2015. CP Activities. Presentation by CO to ET during fieldwork, April. 91 Blanket supplementary feeding (BSFP) was included in Project Document but not implemented as planned due to resource constraints and the need for pilot testing. SPRs 2012-2013 list this activity under IMCN, as this involved an EU-funded FSUP-N project targeting children 6-24 months with seasonal BSFP for six months of the year in 2012 and 2013. 92 Relocated from Component 4 to Component 2 following the realignment of the CP to the new country strategic results framework 2014-17.
7
with the Local Government Engineering Department (LGED), ER plus - cash grants for investment (new in 2013), emergency responses, Satkhira pilot (waterlogging), KOICA pilot (Saemaul Undong), and resilience research* such as climate change study by the Institute for Development Studies (IDS)93
SGSN: Food security for the ultra-poor programme (FSUP) ( 2012 only, but proof of concept for subsequent projects), transfer modality research initiative (TMRI),94 enhancing food security (EFS) in Cox’s Bazar, and Targeting the Ultra-Poor – Nutrition (TUP-N) starting late 2014/early 2015. Activities strategically under CP: vulnerable group development (VGD),* collaboration with the Bangladesh Bureau of Statistics (BBS),* and rice fortification initiative*
*Strategically part of the CP, but administered and funded through Trust Funds
Evaluation Findings
2.1 Appropriateness of the Operation
25. This section provides evaluation findings related to the first evaluation question, “How appropriate is the operation?” It addresses the appropriateness of operation objectives and design to population needs and gender analysis, including the appropriateness of the activities, transfer modality, and geographic targeting by component. This is followed by discussion of the internal and external coherence of the programme.
26. Overview: Overall, the CP’s objectives and design are appropriate to the country context that is moving toward middle-income status, to the needs of the target population of poor and ultra-poor in remote areas and urban slums of Dhaka, and to address the need to strengthen government capacity and national safety nets. The programme originally aligned with the WFP Corporate Strategic Objectives 2, 4 and 5 and was realigned with WFP Strategic Plan 2014-2017.
Appropriateness to needs
Component 1: Reduce undernutrition among women and children U5
27. Design and objectives: WFP initially aimed to target 1,860,000 beneficiaries in 14 districts. However, at the time there was limited government commitment to the treatment of moderate acute malnutrition (MAM) despite high prevalence rates; only later in the CP was WFP able to sign a memorandum of understanding (MOU) with the Secretary of the Ministry of Health and Family Welfare (MoHFW) and start working more closely with the Institute of Public Health Nutrition (IPHN) in implementation. The design appropriately addressed the vulnerabilities of young mothers in particular by including pregnant and lactating women (PLW) in the programme.
28. The Government of Bangladesh is firmly promoting BCC in its approach to combat undernutrition. WFP’s BCC activities support the government’s approach and respond appropriately to analyses by MOHFW and the nutrition community in Bangladesh suggesting that deficiencies in IYCF and hygiene practices, and care and nutrition of PLW, are key underlying issues exacerbating the high rates of undernutrition. WFP and its partners have also considered the high prevalence of early marriage and adolescent pregnancies, combined with lack of access to antenatal care (ANC) and health services,
93 Béné, C. 2014. IDS. 94 Note: this pilot is listed under SGSN but also evaluated under IMCN because SGSN has changed over the course of the CP from being an activity in itself to a cross-cutting approach to capacity development in all activities. Nutrition has also increasingly been integrated across activities in line with WFP’s commitment to the global SUN movement and renewed focus on nutrition-sensitive programming.
8
and attempted to address these through BCC.95 However, despite acknowledgement of the need to engage men and community leaders more comprehensively in changing cultural practices and addressing underlying factors of undernutrition, the design has predominantly focused on women and did not include specific activities to target men. However, male integration in these activities has been slowly evolving over the CP.
29. Activities, transfer modalities and geographic targeting: IMCN activities include treatment of MAM in children U5 and in PLW through the TSFP, combined with BCC, which also has a preventative element. While the CP initially intended to pilot test BSFP for children aged six to 23 months over the lean season, this activity was inadequately formulated and planned. It has not been implemented due to resource constraints and to the later consideration that it might not be appropriate or achievable in the current context. This appears to be the right decision, considering the lack of government commitment to such a programme, the questionable appropriateness of BSFP in the context, the targeting challenges and the probable difficulty of exiting.
30. WFP has provided wheat soya blend plus (WSB+) pre-mixed with oil to PLWs and WSB++ to children U5 enrolled in TSFP. These commodities are appropriate according to WFP’s technical guidelines and beneficiaries expressed satisfaction with them. Beyond the CP, WFP aimed to develop and test a locally produced complementary food supplement. This project is currently being assessed, but could be a relevant approach to provision of a locally produced appropriate supplementary or complementary food which has greater similarities to the normal diet if it is effective and could be procured at a competitive price.
31. Geographic targeting was based on the poverty maps (discussed under ER) and United Nations Development Assistance Framework (UNDAF) priority areas. Geographic targeting, therefore, was not specifically based on prevalence of acute malnutrition, but tailored toward areas of high food insecurity and poverty under the assumption that these areas would also have high rates of undernutrition. District-level data on undernutrition were not widely available at the time, so the CP used the best available evidence to target poor communities. Since programme start, WFP has worked with BBS and Massey University of New Zealand, funded by the International Fund for Agricultural Development (IFAD), to produce statistically valid upazila-level undernutrition maps for the country. These focus on stunting and underweight, but do not include GAM prevalence, which limits their use in targeting IMCN interventions in acute malnutrition; however, noting the links between wasting and stunting, they offer useful information on areas of high undernutrition. The maps confirm that food insecurity and poverty are not always closely associated with stunting and underweight and that undernutrition cuts across all wealth quintiles of the population. Moving forward, it will be important for WFP to develop a more nuanced understanding of what this means for targeting IMCN within their focus areas and ensure that they are working in areas of greatest need.
32. In terms of geographical coverage, IMCN activities have increasingly been concentrated in upazilas of districts where WFP has secured funding, which often follows donor priorities rather than impartial WFP needs analysis. In 2014 59 upazilas were targeted for IMCN, but only 19 (sub-districts) were funded. It was beyond the scope of this evaluation for the ET to examine the districts and upazilas where WFP has not been able to work, but, as elaborated in section 2.2, the ET found that the upazilas selected were appropriate in terms of high GAM rates and exacerbating food insecurity conditions.
33. Prior to implementation of the planned IMCN activities, the national CMAM guideline was released. This required WFP to adapt its targeting criteria from weight-for-height
95 WFP Bangladesh. 2011. CP Project Document.
9
(WFH) to measuring mid-upper arm circumference (MUAC) and had significant implications in terms of large reductions in the number of eligible programme beneficiaries. It also made it harder for WFP to address high WFH GAM rates, when not specifically targeting the children with high WFH.96 At the same time, WFP struggled to gain sufficient funding for its IMCN activities and has not been able to cover the 14 target districts as foreseen. At the time of the evaluation, WFP had reduced its IMCN programme to selected upazilas of three districts (Kurigram, Satkhira and Cox’s Bazar) and the Dhaka slums. The decision to focus in those three districts was largely guided by donor priorities as well as humanitarian response to shocks and stresses in those districts (e.g., flooding in Kurigram and waterlogging in Satkhira) and the political context of Cox’s Bazar.
34. Baseline MUAC data are not available for the geographic locations selected by WFP, however the 2014 outcome survey reveals high rates of acute malnutrition, as measured by MUAC: above eight percent in all programme and control areas. Thus, this further substantiates WFP’s decision to treat and prevent MAM in these locations (Table 3).
Table 3: MUAC levels in programme and control areas
Population category
2014 Outcome Survey
North Coastal All
Program Control Program Control Program Control
Percent of children U5 with MUAC<12.5 (GAM by MUAC)
Boy 6.9% 6.6% 6.0% 6.7% 6.5% 6.6%
n 436 455 267 268 703 723
Girl 10.0% 9.9% 12.2% 9.7% 10.8% 9.8%
n 479 436 254 289 733 725
All 8.5% 8.2% 9.0% 8.3% 8.7% 8.2%
n 915 891 521 557 1436 1448
35. The programme design did not originally include support to urban areas, but this component was added for IMCN based on the high level of need: undernutrition is extremely high in urban slums with prevalence of 49.6 percent stunting and 18.5 percent wasting.97 Moreover, the level of services provided in slums is much lower than in rural areas. Therefore it is highly relevant for the CP to include urban areas as zones for intervention, particularly with small-scale interventions to start, until the scale up can incorporate deeper analyses of the urban context, including gender, and greater joined up thinking and synergy between its own activity streams (e.g., rice fortification with garment factory industries, social protection, IMCN and SF).
36. See Annex 5 for further elaboration of the relevance of targeting these locations.
Component 2: Increase children’s access to pre-primary and primary education
37. Design and objectives: The design and objectives of the SF component are an appropriate response to support the government’s goal to achieve the MDG of universal primary education by 2015. At the time of design, an estimated 19 percent of primary school-age children were out of school, and 51 percent of children were not reaching class five. Attendance in slums was 65 percent compared to 81 percent in rural areas.
96 This is a global challenge of using the two different measures in CMAM programming and in assessing the nutritional situation, and is not specific to WFP or Bangladesh. However, in Bangladesh there is a very large disparity between prevalence of acute malnutrition measured by MUAC and that measured by WFH. The two indicators often select different children. 97 NIPORT, MEASURE Evaluation, University of North Caroline-Chapel Hill and icddr,b. 2013. Bangladesh Urban Health Survey 2013.
10
Appropriate in this context, the role of SF is to help increase enrolment, attendance and reduce drop-out rates and provide an essential learning package (ELP) of complementary services to schools and communities. The design also takes into account the nutritional status of primary school children, a group that is usually not served by other nutrition interventions. SF functions as a nutritional safety net (by providing 67 percent of the required nutrient intake of common vitamins and minerals for a school-age child) and is an incentive to parents to send children to school.98
38. In addition to serving a variety of registered government and non-government pre-primary and primary schools, the design targets non-formal schools of local NGOs and madrasas (religious schools) that follow the government curriculum. This targeting decision is appropriate as these schools have few resources, are often located in remote areas and urban slums, and serve the ultra-poor and drop-outs.
39. The design effectively incorporates plans for WFP technical assistance to government to scale up its programme of SF in poverty-prone areas. This is highly appropriate as there is great commitment in the government, up to its highest levels, to the expansion and institutionalization of a nationally funded and managed school feeding programme. WFP’s plan envisions WFP scaling down its SF activities from 2012 to 2016 and handing over SF activities to the government while the government scales up its coverage.99 In line with WFP’s experience in supporting the national institutionalization of SF programmes, WFP’s technical assistance appropriately includes capacity building in management and logistics, and support to development of a national policy framework for SF.
40. Activities, transfer modalities and geographic targeting: WFP has laid the groundwork for handover since 2009, and there has been a gradual shift in ownership WFP to government since 2011. The government started the biscuit programme with 55,000 children in one upazila, while WFP supported 1.26 million schoolchildren. Government scaled up its involvement rapidly and in 2015 is providing school feeding to three million schoolchildren while WFP supports 500,000. Schools and implementing NGOs in the three districts visited say that the school biscuit programme is running well. In some upazilas of Satkhira and Kurigram, WFP has handed the programme over to the government; many stakeholders commented that it is too early to assess the impact of the handover to government. In Cox’s Bazar, WFP still oversees the school biscuit programme directly.
41. In some upazilas of Satkhira and Kurigram districts the handover of the school biscuit programme from WFP to the government in government-assisted schools was completed in December 2014. Stakeholders in such upazilas of Satkhira reported a two-month gap in biscuit delivery while the revised authorizing project document was approved, and biscuit delivery began in mid-March 2015. At the time of the evaluation, school management committees (SMCs), teachers and head teachers said that it was too early to say whether the handover has affected programme performance.
42. The fortified biscuit is an appropriate transfer modality for Bangladesh. It is a low-cost, logistically efficient means of providing millions of school children with a standardised, nutritious calorie supplement. Targeting for SF is based on poverty and low educational attainment, guided by poverty maps developed by the BBS and World Bank, mapped by WFP and funded by IFAD. ET field interviews with local education officials, teachers and parents confirm that WFP is working in the poorest upazilas, which is appropriate to the goal of bringing all children, especially the poorest, into
school. In Cox’s Bazar, eight government-endorsed madrasas are included in SF, but most of the madrasas are not endorsed for inclusion in the programme. The cooperating partner, Muslim Aid, notes that madrasas have higher pass rates, more parental involvement and no teacher shortage, though attendance rates are lower as they often teach the poorest students who would benefit from the biscuit programme.
43. A small urban SF programme is underway, serving over 92,000 ultra-poor children in 114 government primary schools and 459 NGO schools in slum areas of Dhaka. In the urban slums in Bangladesh, children are two and a half times more likely to be excluded from school than the national average.100 The ET finds that, given the need to attract children to school, the rates of undernutrition and wasting, and the high urban population rates, providing a school biscuit to schoolchildren in urban slums is appropriate and should be expanded in the future. The appropriateness of expanding SF in serving urban slums was underlined during a visit by the ET, where few of the 20 children had breakfast that morning and the biscuit was their first food of the day.
44. The CO is also piloting a hot school meals initiative in 91 schools in Barguna and Jamalpur districts since 2013, funded by AusAid. The cooked/hot school meals initiative provides hot meals prepared by community volunteers using fortified rice, pulses, fortified oil, and local vegetables, supplemented by local fruits when they are available. This in in response to government interest in providing locally-sourced hot school meals; the ET endorses WFP’s approach to include this activity in the CP as a means of generating evidence that will enable government and donors to assess the costs and benefits of an alternative SF modality.
45. At the central government level, WFP’s support to DPE to improve its capacity to implement SF and to the MoPME to institutionalise SF within government is appropriate. The government began to implement SF in 2011, and has rapidly scaled up its activities in line with its goal of a nationally-owned SF programme. WFP’s analysis has shown that having a national policy framework, policy guidelines and adequate capacity to manage SF is as critical to the sustainability of government-managed SF programmes as is financing. WFP’s experience shows that the transition to national ownership is a lengthy and complex one that takes extensive planning. WFP has appropriately brought in organisational expertise from the centre of excellence (CoE) in Brazil to assist government in this process.101
46. In terms of geographic targeting, WFP works in the poorest districts, where poor families face greater barriers to school access, particularly in the north.
Component 3: Enhancing resilience (ER) to disasters and climate change effects
47. Design and objectives: WFP implements ER activities in partnership with LGED and in alignment with LGED objectives.102 ER consists of the following separate but interdependent interventions: 1) income generation and asset creation for the ultra-poor through FFA/ FFT activities; 2) the creation or rehabilitation of community infrastructure using ultra-poor participants as a labour source; 3) training on disaster preparedness and response, life skills and income generating activities (IGA); and 4) cash grants for productive investments. Local level planning (LLP) teams are formed to guide the interventions. In addition, the component includes emergency response. Due to the complexity of the resilience activities, which are relatively new to WFP, and WFP’s interest in ER, the ET focused the evaluation more on the resilience than the relief interventions.
100 UNICEF. 2014. All Children in School by 2015. 101 World Bank, 2009. 102 Ministry of Local Government, Rural Development (LGRD) and Cooperatives. 2012.
12
48. Although these are all important to improving household livelihoods, and are complementary of one another as intended, the ET finds that the component’s design lacks clarity on how to achieve the greatest impact for target communities. The capacity to respond to and absorb the effects of disasters is addressed primarily through the trainings on DRR along with increasing economic capacity through cash income and grants, yet the majority of the effort and resources are spent on mitigating disasters through improved infrastructure. According to the IDS Strategic Review, resilience involves building capacities to absorb, adapt, and transform in the face of shocks: “These activities would be essentially (software) activities involving training, planning, individual and institutional capacities….In addition to these software activities, complementary hardware activities can also be envisaged such as embankment or dike building, canal excavation, etc…” As suggested by IDS, it may be due to a lack of a clear theory of change, logframe, and M&E framework, but the impact of these linked-interventions in building absorptive, adaptive or transformative capacity is not easily or clearly measurable.103
49. The ER design is relevant to the need for income opportunities among the ultra-poor and improved infrastructure for the communities, but there is a greater need for more in-depth analysis of the factors affecting the need (e.g., climate change, salinization, waterlogging, etc.), and the design for community infrastructure such as sufficient research or problem analysis to determine if the greater need in communities is software or hardware. The tool for measuring the community asset score (CAS)104 is very complex. If the greater need is for quality approaches (improved software) to identify and manage infrastructure issues, this has to be known, addressed and more effectively measured. The IDS document105 correctly states the need for improved resilience analysis at the local level and greater empowerment of women in the process. The report was completed in late 2014, but it is not clear how the CP plans to use the extensive and relevant recommendations. At union-level ER works through LLP teams that primarily identify infrastructure needs and conduct community-level risk analysis, which is presented at upazila level, but these are not linked to a higher-level district and regional analysis.
50. In partnership with Food and Agriculture Organisation (FAO) and United Nations Development Programme (UNDP) and with funding from Department for International Development (DFID) and ECHO,106 WFP initiated a new programme called Adaptive Early Recovery in Waterlogged Areas of South-Western Bangladesh (January 2015–June 2016). Based on discussions with the three donors and a review of the proposal and analysis, this programme is an opportunity for WFP and the other agencies to demonstrate that they can work together to address complex issues sustainably. The proposal is well written but is still compartmentalised with respect to the roles and responsibilities of WFP, FAO and UNDP. If any one of these agencies fails to fulfil its role or to align with the other agencies, the programme will likely fail. For example, the proposal states, “In September 2014 FAO presented a report of the mapping study which clearly identified a set of strategies to reduce the impact of
103 Béné, C. and N. Hossain. 2014. IDS. 104 The CAS measures the status of resilience-based community infrastructure or assets that enable communities and households to better cope and be less affected by shocks. The asset score for a union represents the level of disaster resilience for the associated communities. The baseline CAS for a particular union is computed based on data collected through a Community Risk Assessment (CRA) exercise. The CRA process generates information on i) disaster related risk factors of the targeted Unions, ii) extent of loss, iii) availability and functionality of the related resilience-based assets in the community and iv) degree of benefits from the assets. 105 Béné, C. and N. Hossain. 2014. IDS. 106 European Commission's Humanitarian aid and Civil Protection Department
13
waterlogging and enhance the capacity of local communities to cope with the effects of this phenomenon.” This report has not yet been finalised and with only 18 months for implementation these “strategies” need to be transformed into an operational plan.
51. Activities, transfer modalities and geographic targeting: The dual targeting of ER’s design is noted in WFP’s standard project report (SPR) 2013, which refers to one focus on households and another focus on community infrastructure and disaster mitigation.107 The SPR refers to the 2013 WFP FFA impact evaluation that recommends both targeting ultra-poor households with cash transfers for investments and better integration with government disaster management for the maintenance of community assets.
52. ER operated in 12 disaster-prone districts until December 2014, at which time ER districts were reduced to five, including emergency response areas, due to resource constraints. Ongoing resilience activities were operational in Sirajgang, Kurigram and Satkhira at the time of the evaluation, and all are appropriate geographic areas for this component: per the WFP Bangladesh poverty maps,108 37 to 46 percent of the population in Satkhira and Sirajgang, and over 47 percent in Kurigram are poor. Kurigram has the highest rate of extreme poor (>35 percent). Satkhira is highly vulnerable to cyclones, major storms, flooding, waterlogging, river erosion and salinization, while Kurigram suffers from annual flooding, flash floods and river erosion. ER is in the most remote and vulnerable locations within these districts.109 WFP’s primary response to disaster under this component is to provide fortified biscuits available from the SF programme, and unconditional cash transfers.
53. The ET found that ER established good mechanisms for LLP to identify relevant structural (i.e., earthworks) and non-structural interventions that help communities to mitigate seasonal water flows, floods and storms/cyclones and to maintain communication. Other infrastructural needs such as flood-resistant seed varieties are referred to the agriculture department. Beneficiaries and other stakeholders (i.e., ward, union and upazila disaster management committees (DMC)) received training on disaster preparation and response, which looked quite thorough based on the visual materials. Showing the relevance of the training to community needs for information, most stakeholders could provide to the ET specific examples of how they were using this information to more effectively communicate impending floods and storms and to help people in need. Based on LLP and participant FGDs, the risk and resilience analyses of ER tend to focus on “earth work opportunities.” As pointed out in the IDS review, the resilience analysis would ideally be more inclusive of other forms of shocks and stressors within the community and/or household.
54. During the six-month rainy season beneficiaries receive three hours of training every week (approximately 25 sessions) on a wide variety of topics such as disaster preparedness and response, nutrition, women’s empowerment, livestock and IGAs for which they expressed their enthusiasm and appropriateness to the ET.
107 SPR 2013: “The 2013 WFP Impact Evaluation of FFA acknowledged that the inclusion of a "cash transfer for investment" component had the potential to enable targeted ultra-poor households to achieve a sustained graduation out of ultra-poverty. It also recommended greater integration with the government's Comprehensive Disaster Management Programme (CDMP) with a view to ensuring maintenance of the community assets created. Based on this recommendation, WFP began exploring potential entry points with CDMP.” 108 Poverty Maps of Bangladesh 2010: Key Findings. 109 Annex 11 provides more detail on the environmental context, infrastructure schemes and risks faced in the sites visited.
14
55. In terms of transfer modalities, beneficiaries were paid with both food and Bangladesh Taka (BDT), which was deposited into a group account. All participant FGDs reported that the food was especially appropriate (e.g., rice, lentils and oil). The rationale for the amount of FFA cash and food transfers provided to each participant is not discussed in CP design documents. Although participants and most stakeholders interviewed felt that the wages were too low, the women have a limited understanding or memory of how many hours and days they worked and how much they were paid per day or hour.110 Even if participants agreed to a wage they felt was low, their limited capacity to assess their earnings against their hours worked makes it difficult for participants–as well as the ET–to reflect on whether their pay is appropriate. This also raises questions about the extent to which the payment and payment implementation process truly empower women. WFP should ensure that participants are fully aware of the wage rate, expected hours of work, take-home amount and its computation. This knowledge would also empower participants to monitor and enforce accountability for fund management: each account serves over 100 workers and is “managed” by three group leaders. Funds are collected every one to three months by account managers, who have minimal literacy, and by one NGO staff. While all groups interviewed were comfortable with this transfer arrangement, and the ET found no indication of fund mismanagement, this is nevertheless a risk area. Therefore, the ET recommends the processes for ensuring accountability and transparency of fund management–including participant education on wages and hours–be reviewed and monitored more closely.
56. Design and objectives: Realigned with the strategic objective, SO #4 (new), the CP objective for the SGSN component is to, “Enhance nationally owned safety-net programmes addressing hunger and household food insecurity.” The component is aligned with national priorities and supports the government in reforming social safety nets that address hunger and household food security. WFP is evolving its approach from direct implementation to strengthening government ownership, capacity and accountability while ensuring that hunger, food security and nutrition feature prominently on national agendas. WFP’s technical assistance contributes to the government’s reformation of ongoing safety nets and to exploring implementation modalities for effective and sustainable safety net interventions. Under the SGSN component the strategic approaches of WFP include: enhancing nationally-owned safety nets; using promising models and innovations; and promoting private sector engagement in social safety nets in different ways such as by innovative cash transfer and building capacity of social entrepreneurs. The ET finds these to be appropriate responses to supporting government to strengthen social safety nets and to provide evidence-based research on innovative approaches to development.
57. The ET finds SGSN targeting appropriate: the primary beneficiaries of safety net activities are destitute rural women who are malnourished and food insecure. In the case of rice fortification, WFP appropriately targets low-income rural women in the VGD programme who are malnourished and suffer from micronutrient deficiencies. WFP is working with garment manufacturers to advocate for the distribution of fortified rice among ready-made garment factories in urban areas.
110 The transfer is 2 kg rice, 200 gm pulses/lentils and 100 gm vegetable oil, plus BDT 58 (US$.75) cash per day (average four-hour workday), though participants reported some instances of working longer. Without commodities, the wage is now BDT 145/ four-hour work day. The standard wage for a full day of labour in Bangladesh is approximately BDT 250-300 for men and BDT 150-200 for women.
15
58. Activities, transfer modalities and geographic targeting: WFP continues to support the government to strengthen the VGD programme after management was handed over to the Department of Women Affairs in 2010. This is an appropriate role for WFP as the VGD programme is one of the largest social safety net programmes in Bangladesh, protecting 750,000 destitute rural women from chronic food insecurity and creating income-generating opportunities.
59. Promising models and innovations: This approach includes a number of operational pilots and research projects that contribute evidence to social protection policy dialogue, development of innovative food products, and more effective approaches to assisting the ultra-poor. This includes the TMRI, rice fortification, and EFS in Cox’s Bazar. The ET finds that these pilots and research are a strategic use of CP resources. They provide evidence and proof of concept on the viability of more effective safety net approaches that can be adopted by government or large NGOs (e.g., TUP-N by BRAC) in new and existing food security and nutrition safety nets.
60. TMRI: TMRI was new research conducted from 2012-2014 by the International Food Policy Research Institute (IFPRI) and implemented by WFP and a local NGO, the Eco-Social Development Organisation (ESDO). Its purpose was to identify the best modalities for social safety net transfers depending on the objectives (e.g., household income, household food security, child nutrition). This is appropriate research for WFP, as government social safety nets comprise about 12 percent of the national budget, and the need to improve their effectiveness is recognised.
61. Innovative products: Low dietary diversity and micronutrient deficiencies are common problems among the ultra-poor beneficiaries of government safety nets such as VGD. To help improve nutrition in safety net programmes, WFP supported the government to introduce fortified rice as part of the monthly VGD transfer. WFP is also extending technical assistance to a garment factory for a six-month pilot to promote fortified rice at a subsidized rate to female garment workers, another nutritionally at-risk group. The ET finds these activities appropriate to improving the nutritional status in the most vulnerable groups, especially women.
62. Promoting private sector engagement in social safety nets: Rice fortification relies partly on imported rice kernels. WFP provides technical assistance to a private company to develop local capacity to produce fortified rice blends and is exploring private sector interest in producing fortified rice kernels locally and marketing fortified rice blends. Successful local production of fortified rice kernels will help to create a business case which can be presented to bigger platforms such as Scaling-up Nutrition (SUN). WFP will work with Global Alliance for Improved Nutrition (GAIN) on quality control of the locally-produced fortified kernel. The ET finds WFP support to be an appropriate action to help address widespread nutritional deficiencies in Bangladesh.
63. Poverty and undernutrition maps: In 2013-2014 WFP, in collaboration with the BBS (and World Bank for poverty maps) and with funding from IFAD, produced the third generation of sub-district poverty maps and the first-ever statistically valid sub-district undernutrition maps. The ET finds the mapping highly appropriate to improving the targeting of social safety nets by government based on poverty and undernutrition data.
Internal coherence with WFP corporate strategy/strategic objectives
64. The CP is originally based on three corporate SOs (#2, 4, 5) from the WFP Strategic Plan 2008-2013. The CP objectives were realigned to the WFP Strategic Plan and SRF (2014-2018) during 2014. In the revised logframe, each component includes cross-cutting results for gender, protection/accountability to affected populations and
16
partnerships; in addition, Component 4 activities related to SGSN are integrated to fit within the other components, which aligns with the new SRF SOs that each include aims for capacity building. As elaborated below, the CP design is internally coherent with corporate strategy.
SO#2: Prevent acute hunger and invest in disaster preparedness and mitigation measures is supported by CP Component 3: ER (Outcomes 4-5), addressing the need for enhanced food security and resilience among communities and households facing disasters and the effects of climate change. ER is aligned with WFP corporate strategy on DRM to build resilience and capacity among disaster-affected populations,111 and ER is consistent with WFP policies on humanitarian protection112 and gender, as they relate to reducing vulnerability, promoting gender equality and gender sensitive approaches for participants beyond simply output measures.113 In the revised logframe, ER falls under the new SO#3.114
SO#4: Reduce chronic hunger and malnutrition is supported by CP Component 1: IMCN (Outcomes 1-2), and Component 2: SF (Outcome 3), which address the nutritional needs of women and children U5, and access to education for the pre-primary and primary levels in food insecure areas. The activities for PLW, children under five and school-children are operating per WFP standard procedure and corporate guidance on gender, nutrition115 and SF,116 as well as with national CMAM and SF guidance. Overall, IMCN is well aligned with the WFP nutrition policy and is spearheading some innovative activities in terms of nutrition sensitive interventions.117 In the revised logframe, IMCN and SF remain under SO#4.118
SO #5: Strengthen the capacities of countries to reduce hunger is supported by Component 4: SGSN (Outcome 6) aiming to build capacity for nationally-owned safety net programmes. In the revised logframe, SGSN also falls under the new SO#4 and as the capacity building element included across all components.
External coherence
65. Government policies, strategies and programmes: The Government of Bangladesh has initiated several key policy reforms for addressing hunger and poverty, for instance, the National Strategy for Accelerated Poverty Reduction (NSAPR II), the new National Social Security Strategy (NSSS) and the Sixth Five-Year Plan (2011-2015). The CP is largely aligned with national level policies and strategies; see Table 10, Annex 3 for a listing and description. The further discussion of coherence with government that discusses key policies and strategies by CP component see Annex 6.
66. United Nations agencies: The overarching goal of the United Nations system in Bangladesh is to support the government in reaching the MDGs. The UNDAF was developed based on government assessments of poverty and development trends and
111 WFP. 2011. WFP Policy on Disaster Risk Reduction and Management. 112 WFP. 2012. WFP Humanitarian Protection Policy. 113 WFP. 2009. Gender Policy. 114 To reduce risk and enable people, communities and countries to meet their own food and nutrition needs. 115 WFP. 2012. Nutrition Policy. 116 WFP. 2009. School Feeding Policy, revised November 2013. 117 IMCN activities are aligned with WFP nutrition policy's focus on the five pillars of prevention of acute and chronic undernutrition, alongside treatment, micronutrients and nutrition sensitive approaches. The CO appears to the ET to be ahead of the policy in experimenting with innovative approaches, particularly in nutrition-sensitive programming. The programme is less aligned with the policy's focus on the use of products, largely due to the resistance to over-reliance on specialised nutrition products in Bangladesh. 118 To reduce undernutrition and break the intergenerational cycle of hunger.
17
gaps in reaching the MDGs.119 The CP seeks to “leverage the expertise of United Nations agencies, NGOs and research institutions; it is the lead agency for the food security and nutrition pillar of the 2012–2016 UNDAF, which is the basis for partnerships with FAO and UNICEF, and is also represented in other pillars.” This focuses CP activities, “thematically and geographically in 15 of the 20 priority UNDAF districts.”120 In addition, the Bangladesh UNDAF Action Plan is aligned with the WFP CO programme cycles. The ET finds the CP components to be aligned with UNDAF pillars 2,3,4,5 and 7, as shown in Table 4.
Table 4: CP alignment with UNDAF Pillar 2: Pro-Poor Economic Growth with Equity
CP aligns with Outcome 2.1, to extend opportunities to rural and urban poor and protect vulnerable households from shocks, through ER and urban programming with IMCN and SF.
Pillar 3: Social Services for Human Development
CP IMCN and SF support Outcome 3.1, to target women, children and youth for increased and more equitable utilization of quality health services and education.
Pillar 4: Food Security and Nutrition
WFP as the lead agency the CP aligns with all outcomes. WFP also partners through REACH (renewed efforts against child hunger and undernutrition).121
Pillar 5: Climate Change, Environment, DRR
WFP coordinates with UNDP in alignment through ER (see more discussion below).
Pillar 7: Gender Equality This pillar is supported by the CP as a cross-cutting result.
67. The WFP country strategy mentions the need for improved collaboration within the United Nations. Although the new Adaptive Early Recovery in Waterlogged Areas of South-Western Bangladesh project is an effort to address this concern, it will require greater intentionality and leadership to do this effectively. Both DFID and ECHO are looking closely at this programme to see if WFP, FAO, and UNDP can work together to address these kinds of complex environmental challenges. The proposal is well written and the draft analysis completed to date is well informed, but with only 18 months to demonstrate results there is, as yet, no clear plan for addressing these complex issues in specific locations. The ET finds it is imperative that WFP, FAO and the UNDP hold one other accountable for high-quality analysis at the local and regional levels and for interventions that are aligned with one another.
68. Donors: The ET’s consultations with a range of donors indicate support for WFP operations. However, overall multilateral support to WFP is declining as Bangladesh grows more able to finance its development needs through its own resources and soft loans from international financial institutions. In addition, rather than supporting the CP as a whole, the in-country donor representatives have specific interests to fund only certain components or sub-components of the CP, or certain geographic areas. This leads to some components or areas being better funded than others. Key donors commented that they would like the CO to be better prepared to quickly respond to emergencies with programme proposals, in addition to food assistance. Related to this they would also like to see more effective collaboration with other United Nations agencies. This requires that the CO have programme development funds and expert staff as well as good information on the donor landscape. The CO’s ability to access donor funds, support government to design proposals for multilateral institutions and capitalise on its own innovative research and pilots is limited through the Trust Fund mechanism. It
119 United Nations Resident Coordinator’s Office. 2011. UNDAF for Bangladesh 2012-2016. 120 WFP Bangladesh. 2011. Project Document. 121 REACH was established by FAO, UNICEF, WFP and WHO, and later joined by IFAD, to assist governments of countries with high child and maternal undernutrition to accelerate the scale-up of food and nutrition actions. See: www.reachpartnership.org
18
is suggested that WFP headquarters (HQ) review its current funding structure to find ways to provide more support for programme design and innovation.
69. NGOs and private sector: International and local NGOs are important CP partners. WFP has chosen well-known local NGOs to implement programmes that have aligned missions to address poverty, undernutrition and food insecurity. Many of WFP’s local NGO partners have worked with WFP in more than one CP and tend to retain their staff for many years. The government has demonstrated the same faith in these local NGOs, and in WFP’s selection, by contracting them to continue activities handed over by WFP, such as SF. All ER activities at mid-term were implemented by local NGOs. WFP’s partnerships with GAIN to support the government school feeding strategy and policy, and in the rice fortification programme, are synergistic, bringing together WFP’s implementation experience and GAIN nutrition programming expertise to enhance nutrition. WFP is partnering with private sector garment manufacturers to support their corporate social responsibility strategies, and is working to attract funding from “big brand” manufacturers that are willing to support workers in their supplier factories. In all, the ET found that both WFP’s cooperating partners and programme participants see high relevance of activities in the targeted communities.
2.2 Results of the Operation
70. This section discusses findings related to the second evaluation question, “What are the results of the operation?” It presents general findings on the attainment of planned outputs and discusses each component in turn. The analysis includes the extent to which assistance was provided to the “right” beneficiaries, discussion of beneficiary selection and gender, and whether the assistance was timely and of sufficient quantity and quality. It then assesses mid-term progress toward achieving outcomes and objectives, unintended outcomes, and the programme’s contribution to higher-level development results. This section contains selected tables and figures from the 2014 outcome survey; additional outcome data are in Annex 4.
71. Overview. At mid-term the CP reached 87 percent of planned beneficiaries in 2014 (1,525,637/ 1,755,316 beneficiaries), 92 percent in 2013 (1,804,301/ 1,966,500 beneficiaries) and 98 percent in 2012 (1,908,403/ 1,951,500)122 (Figure 1) (also refer to Tables 11-16 in Annex 3).
72. As shown in the Operation Factsheet output charts, for overall food distribution in 2014, the CP distributed 22 percent of planned food metric tonnage (17,650/ 80,647 mt), 55 percent in 2013 (45,778/ 83,721 mt) and 34 percent (28,573/ 85,033 mt) in 2012 (also refer to Table 17 and Figure 15 in Annex 3). The tonnage targets were not met due to limited available funding and some restricted movement at the end of 2013, and were not met again in
122 As noted in SPR: “The total number of beneficiaries includes all targeted persons who were provided with WFP food during the reporting period - either as a recipient/participant in one or more of the following groups, or from a household food ration distributed to one of these recipients/participants.”
Figure 1: Total CP beneficiaries by year
Source: WFP Bangladesh. 2014 SPR.
98%
92%
87%
80%82%84%86%88%90%92%94%96%98%100%
0
500,000
1,000,000
1,500,000
2,000,000
2,500,000
2012 2013 2014
Planned Actual % Achieved
19
late 2014 due to political unrest.123 The attainment of cash distribution targets varied by year: 97 percent of target in 2012, 49 percent in 2013 and 66 percent in 2014. The following sections, organized by component, assess output results.
Component 1: IMCN
73. Outputs: Beneficiary selection and targets: IMCN fell short of targets following the release of the national CMAM guideline, which specified that screening and admission to TSFP should be by MUAC rather than WFH, and subsequent identification of far fewer MAM cases. Funding shortfalls resulting in abrupt programme closures in some areas also contributed to low achievement of beneficiary numbers.
74. Beneficiary numbers for 2012 and 2013 were low (37 percent and 36 percent, respectively) reportedly due to resource shortfalls and limited local capacity for implementation.124 In 2013 the programme operated in only 18 of the 58 planned sub-districts. In 2014, IMCN achieved an improved 58 percent of the planned target as a result of the downward revision of the planned beneficiary figure from 363,000 in 2012 and 2013 to 137,000. Nevertheless lack of funding caused programme phase-out in a number of locations and not scaling up in other areas as planned, leading to non-achievement of targets.
75. A breakdown by age group reveals that greater numbers of children aged 6-23 months were reached with MAM treatment from 2012-2014, but far fewer children aged 24-59 months due to MUAC’s inherent selection bias towards younger children (Figure 2). According to the 2014 SPR there was also higher numbers of acutely malnourished girls, the reasons for which merit further investigation. This may again result in part from the MUAC tool tending to identify more girls than boys, but the finding is most apparent in 2014 and not for the preceding years, as shown in Figure 3, which suggests there are additional reasons behind it. Discussions with key informants and beneficiaries did not uncover a likely reason for this disparity and there is no significant gender difference in prevalence of acute malnutrition by MUAC in the outcome survey, though the phenomenon of slightly higher prevalence amongst girls persists.
Figure 2: Percentage of actual versus planned IMCN beneficiaries by intervention type and year
Source: WFP Bangladesh. 2012-2014. SPR. *Listed in SPRs 2012-2013 under IMCN, this involved an EU-funded FSUP-N project targeting children 6-24 months for six months of the year in 2012 and 2013.
123 WFP Bangladesh. 2014. SPR. 124 Refer to output chart in Operation Factsheet.
36%
38%
92%
24%
26%
32%
49%
27%
0%
39%
57%
75%
37%
111%
58%
0% 20% 40% 60% 80% 100% 120%
2012
2013
2014
Participants receivemessages/training (BCC)
MAM treatment PLW (TSFP)
Prevention 6 to 23 months(BSFP emergency response)*
MAM treatment 24 to 59months (TSFP)
MAM treatment 6 to 23months (TSFP)
20
76. For IMCN, the activities were planned for girls and women to comprise 60 percent in 2012-2013 and 66 percent in 2014; this goal was exceeded, reaching 77 percent girls/women and 23 percent boys of IMCN beneficiaries in 2014 (Figure 3).125
77. Related to outputs on BCC messaging dissemination, to date 58 percent (actual/target: 79,224/ 137,000) of IMCN caregivers received messages or training on health and nutrition, 100 percent of planned health sites were assisted (502 sites), 88 percent of targeted caregivers received three key messages through WFP-supported messaging and counselling (63/72 caregivers) and 100 percent of targeted women received nutrition counselling (90/90 women).126
78. Timeliness, frequency, duration and quality of outputs: Supply of commodities for TSFP has reportedly been adequate throughout its duration, with no major pipeline breaks or shortfalls mentioned by partners or beneficiaries. There was general satisfaction with quality of the products. Staff interviewed had all received training from WFP, Action Contre la Faim (ACF) and/or cooperating partners on their role in the programme, implementation modalities and BCC topics. Some food storage concerns were raised by cooperating partners, as the community-based model has meant that, in some parts of Cox’s Bazar, where there are no close and functional community clinics, volunteers have had to store products in their homes prior to distribution. These conditions are not ideal.
79. Cross-cutting. WFP is using its BCC sessions in IMCN to discuss issues of care of women in pregnancy and protection of the complementary feeding period, which involves discussion with mothers-in-law and men in the household about roles of family members and ways to share the workload to enable women to rest in pregnancy, attend clinics for antenatal care and free up their time for infant and young child feeding. Deeper cultural issues, such as child marriage, are being broached in these sessions. Increasingly, WFP and its partners are examining ways to further engage men in BCC to enable discussion of gender roles and responsibilities around care of pregnant women and children. In addition, 82 percent of the women reported they did not experience safety problems travelling to/from the IMCN sites (target: 90 percent). The goals for IMCN partnership were also reached such as the number of organisations providing complementary inputs and services (target: 9, actual: 11) and the proportion of activities implemented with the engagement of complementary partners (100 percent).
80. Outcomes and objectives: Overall, the IMCN intervention is well accepted by communities in which it is implemented, has achieved impressive cure rates through TSFP for children U5 and has contributed to a reduction in acute malnutrition, particularly among children aged 6-23 months in its areas of implementation. Success has been achieved in improvement of basic household nutrition, hygiene and sanitation practices; though despite messages being well received, infant feeding practices have not improved. Target beneficiary numbers and locations have been significantly reduced from
125 Refer to output chart in Operation Factsheet. 126 WFP Bangladesh. 2014. SPR.
Figure 3: IMCN male v. female beneficiaries, by year
Source: WFP Bangladesh. 2012-2014. SPR. Note: Percentages in a column may not add to 100 due to rounding.
60% 69% 77%
40% 31% 24%
2012 2013 2014
males
females
21
the original CP plan due to lack of CO funding and changes in the national CMAM protocol. However WFP has made progress in engaging MOHFW in IMCN, though much remains to be done if government ownership is to be successfully achieved.
81. The TSFP has achieved above-target recovery rates of over 75 percent each year from 2012-2014, and recovery rates in excess of 86 percent in all districts in 2013 and 2014, which are well above Sphere Standards.127 The targets for Sphere Standards were achieved for all supplementary feeding indicators (Figure 4). In Cox’s Bazar, partners and WFP staff spoke to the ET of issues with defaulters due to migration and seasonal factors (e.g., monsoon and inaccessibility of communities), but there is a mixed picture in the reporting statistics, with defaulter rates reaching a maximum of just three percent of children U5 in 2013/2014, but nine percent for PLWs in 2014 and 12 percent in 2013. This raises the question of how well these issues are being captured, analysed and responded to. In Satkhira, WFP’s cooperating partners confirmed that they experience very few defaulters as the programme is well established and much appreciated by beneficiaries.
82. The outcome survey found a significant reduction in the wasting indicator in programme areas: from 21.3 to 13.6 percent in children 6-59 months. Yet, a similar significant reduction was also seen in control areas (from 23.7 to 16.1 percent), which suggests that the improvement cannot be attributed solely to WFP activities. However, significant reduction in wasting in children 6-23 months was seen in programme areas from 20.2 to 13.3 percent, whereas no significant change was seen in this age group in control areas (see Table 24 in Annex 4). This is an important positive finding, as much of WFP’s TSFP and BCC are targeted towards this age group. There was no significant change in the prevalence of stunting in either the beneficiary communities or the non-beneficiary communities. See Table 20 in Annex 4 for outcome survey data by region on wasting, stunting, underweight and low birth weight, all indicators reported from the original logframe only.
83. No significant changes were found in the prevalence of low MUAC (<21 cm) in PLW, which remained at approximately eight percent in the follow-up outcome survey. FGD respondents noted that the programme has been of great benefit to those enrolled, but newly pregnant and lactating women need to benefit from the IMCN activities as the BCC messages have not yet reached them. Disaggregation of programme performance data also reveals high rates of PLW defaulters in Kurigram (22 percent in 2013 and 23 percent in 2014), which may have limited achievement of programme outcomes. See Table 21 in Annex 4 for outcome survey data on MUAC and BMI for PLW.
127 District level IMCN monitoring data shared with ET during fieldwork.
Figure 4: Supplementary feeding recovery, default, mortality and non-response rate
Source: WFP Bangladesh. 2014 SPR. Note: these outcome indicators are from the revised CP logframe.
81.6%
97.5% 95.6%
75.0%
10.0%0.8% 2.0%
15.0%
0.0% 0.0%3.0%8.3% 1.6% 2.3%
15.0%
0.0%
20.0%
40.0%
60.0%
80.0%
100.0%
120.0%
2012 2013 2014 Target
Recovery rate
Default rate
Mortality rate
Non-responserate
22
84. The evaluation found that beneficiaries learnt new knowledge and skills through the BCC activities. Caregivers were well versed in procedures for preparing supplementary feeds and communicated good understanding of the hygiene, sanitation and nutritional messages that had been shared with them, as well as messages on care of infants, young children and PLW. In the majority of FGDs, beneficiaries requested more sessions on nutrition education and BCC topics.
85. The outcome survey found a significant increase from baseline to mid-term in prevalence of households reporting to follow basic nutrition, hygiene and sanitation practices (including WASH indicators) in both programme (58.4 to 74.2 percent) and control (63.9 to 75.4 percent) areas; however the magnitude of change was significantly higher in programme areas (27 percent change), than control areas (18 percent change)(Figure 5). A similar trend is seen for this indicator with nutrition practices only; see Figure 17 in Annex 4.
86. A significant increase from baseline was seen in infants 0-5 months who were exclusively breastfed in both programme (47.6 to 64.1 percent) and control (47.6 to 66.3 percent) areas, which therefore may not have been a direct result of the programme (Figure 6).
87. No significant changes were observed in complementary feeding practices for programme or control groups; values remain poor for the following indicators: proportion of children 6-23 months who receive foods from four or more food groups; prevalence of caretakers providing minimum acceptable complementary diet to children 6-23 months; and proportion of breastfed and non-breastfed children 6-23 months who receive solid, semi-solid, or soft foods minimum time or more (see Table 22 in Annex 4).
88. Sustainability: Since January 2015, WFP is making a more conscious effort to engage government in IMCN programming with a view to handing over activities. At the time of the evaluation, the team observed three different models/levels of support or degrees of handover for the IMCN activities: 1) in Satkhira, WFP recently handed over responsibility for implementing activities to community clinics (since January 2015); 2) in Kurigram, government-run community clinics were beginning to be fully engaged in activities, but continuing to receive support from WFP’s partners, Terre des Hommes (TdH) and
Figure 5: Percent of HHs following at least three basic nutrition, hygiene and sanitation practices
Source: 2014 outcome survey Note: this outcome indicator is from original and revised CP logframes.
Figure 6: Proportion of infants 0-5 months of age who are fed exclusively with breast milk
Source: 2014 outcome survey Note: this outcome indicator is from original and revised CP logframes.
58.4%63.9%
74.2% 75.4%
Program Control
Baseline Outcome
27% change
18%change
47.6% 47.6%
64.1% 66.3%
Program Control
Baseline Outcome
34%change
37%change
23
Rangpur Dinajpur Rural Service128 (RDRS); and 3) in Cox’s Bazar, the cooperating partner, SHED, was implementing activities with its team of 160 community nutrition workers/volunteers (CNW/CNVs) through engaging the community clinics and at a minimum using the facilities as distribution points, training the staff and engaging union and upazila staff in stakeholder meetings.
89. Ensuring government ownership of the programme and engaging government staff in activity implementation is a necessary and appropriate approach to ensure sustainability of the programme and to achieve long-term outcomes and improvements in undernutrition. However, these activities have just started (the majority since January 2015) and it was evident in all sites that capacity building, mentoring and supportive supervision are still required to assist government staff to take on the IMCN activities. Stakeholders consider that a process of several years, rather than months, is necessary to enable confident government ownership and management. While KIs at upazila and district level within the MoHFW expressed a strong interest in the programme and commitment to supporting it, advocacy at the ministry level will be essential to facilitate their ability to give the programme the attention it needs.
90. In Satkhira, a fairly abrupt handover took place according to FGDs and KIIs, with WFP pulling out its NGO partner over a short timeframe and prior to sufficient capacity development of community clinic staff. CNWs and CNVs combined numbered 219 between June 2012 and December 2013; they were cut to 144 in January 2014 and then to 32 (one per union) in August 2014. Set against this former high level of support, government staff at each community clinic is comprised of just a facility-based community healthcare provider (or CHCP), a health assistant (HA) and a family welfare assistant (FWA)129 who each spend three days at the clinic and three in the community. There remains a commitment to work with government staff to deliver more training and supervision; however, it was evident that the level of programme visibility (and with it, likely impact) had deteriorated rapidly. All beneficiaries consulted informed the ET that the programme was no longer running, as they did not receive the same level of BCC support, courtyard sessions, referral and attention through home visits at the community level; nobody the ET met was enrolled in TSFP. NGO partner staff and community clinic records confirmed that numbers in the programme had decreased as screening capacity had decreased. More training was proposed by cooperating partners and clinic staff as an effective way forward to capacitate community clinics to improve community screening.
91. In Kurigram, NGO partners Tdh and RDRS expressed similar concerns over access to beneficiaries and to the broader community to discuss nutrition topics and engage in BCC, as the programme was increasingly being implemented out of the community clinics rather than in the community. In some villages, community clinics are far from the houses of much of the population, which creates challenges of access and results in clinic-based BCC sessions only being attended by those referred to the clinic for TSFP or attending for other child health clinics. This presents a considerable challenge for WFP in terms of balancing the need to integrate activities within the government system, while also attempting to reach out to a wider population to spread BCC messages for the prevention of acute malnutrition and ensure adequate coverage for treatment.
92. One interesting finding in all three regions visited was mothers reporting that their children enjoyed the supplementary food (WSB++) so much that they had difficulty
128 Formerly the Bangladesh field programme of the Geneva-based Lutheran World Federation. RDRS became a national development organisation in 1997. See: www.rdrsbangla.net 129 Note: the primary focus of the FWA is family planning.
24
persuading their children to eat homemade foods once the child was discharged from the programme. This contributes to relapse and readmission three to six months after a child is cured. A further relevant factor in the latter may be that mothers simply are not able to prepare adequate complementary foods at home due to lack of access to appropriate foods, or lack of time to prepare them, which is reflected in the quantitative survey findings. This raises the issues of whether the supplementary food, contrary to programme intention, actually served as a substitute, rather than a supplement, to regular foods, and whether the products provided are too dissimilar from foods that mothers can prepare at the home. WFP’s work to produce a local complementary/supplementary food may prove valuable here if it can offer an appropriate food for TSFP that has greater similarity to homemade foods, while requiring little preparation.130 One suggestion by community elites131 was to extend the distribution time for TSFP so that a child could be gradually weaned off the supplementary food once cured. However, the majority of interviewees stressed the importance of the BCC element of the programme and the need for its continuation in order to bring about sustainable change in household practices.
93. Enhancing effectiveness of BCC: A major issue with effectiveness of BCC messages is the limited ability of young mothers to convert their new knowledge into practice and influence household practices and cultural norms. This is illustrated by the outcome survey and by deeper probing with beneficiary groups and community clinic staff. Despite mothers initially saying they adhere to the advised practices, discussions that delved deeper found that ultimately women with young children are not usually the decision-makers in their households and their intense engagement in domestic chores for the entire household, in addition to assisting with seasonal harvest/labour requirements, often make it impossible for them to have time to feed and care for their infants and young children adequately. It will thus require a change in broader community attitudes before other household members will take some of those allocated responsibilities off a young mother to allow her the time necessary to care for newborn and young children, or for herself during pregnancy. In addition, child marriage was raised by the majority of KII in all districts visited by the ET as a major factor affecting maternal and child undernutrition. Such cultural practices are being challenged throughout the country, but greater efforts in advocacy alongside enforcement of legislation are required to address these issues.
94. The programme has already made some attempts in places to engage mothers-in-law, fathers, fathers-in-law and local elites in BCC, but it would appear that much more needs to be done to specifically target these groups and to target them at appropriate times and places. Field staff, beneficiaries, and key informants strongly suggested that these groups be approached separately, rather than tagged on opportunistically to courtyard sessions, and that specific messages be adapted that resonate with the priorities and roles of different sections of the community. In Cox’s Bazar and Kurigram, men and community elites requested separate BCC/education sessions for men. There is a clear consensus among stakeholders at the national level that there is a big opportunity for WFP to lead on BCC approaches. Currently “nobody is doing it the way it needs to be done,” commented one interviewee who summed up the views of several.
95. Although there is limited programme data available so far and WFP’s IMCN programme in urban areas is currently very small, stakeholder discussions confirm that greater
130 Note: The ET is aware that there is currently much debate on the use of commercial/industrialised products for nutrition programmes in Bangladesh. This comment refers to the theoretical potential of a local product for the treatment of acute malnutrition, but defers to the outcomes of the on-going study. 131 The CO uses this term to refer to community leaders and respected members, including imams, businessmen/women, landholders, community clinic management committee members, etc.
25
consideration needs to be given to how to appropriately provide services to urban slum residents. Partnering with BRAC’s Manoshi programme appears to be a good first step – to work with an established partner with credibility in the urban communities and knowledge of their beneficiaries and needs. However, challenges are arising of low numbers in the programme, high numbers of defaulters and potentially low coverage of targeted vulnerable groups, particularly as a result of urban patterns of work and daily labour, which frequently take women, as well as men, far from their homes to work long days. WFP has taken commendable steps to better understand the urban environment in which it is working through commissioning an Urban Food security Analysis and Strategic Planning Study.132 However, more could be done to join working groups (such as the LCG Working Group on Urban Sector) and engage with more potential partners to examine creative options for a way forward. For example, UNICEF is planning to expand its work in urban areas, while CARE is working on women’s empowerment in DBL Group factories133 where WFP has engaged for fortified rice provision. There is potential to explore collaborations and partnerships with these and other stakeholders.
96. Synergy: A major challenge for the IMCN activities is that the current MUAC targeting criteria (aligned with National CMAM guidelines) means the TSFP activities are reaching a very small number of beneficiaries. The cost of running a programme for such a small number in dispersed, often hard-to-reach communities is very high. Although the outcome survey shows some improvement in the wasting rates in programme areas, to more comprehensively address the high WFH GAM rates, targeting by WFH criteria would be more effective. However, in the absence of changes to the government protocol, if the TSFP can continue to be used as a community entry point to ensure effective BCC, alongside treatment of acutely malnourished children and PLW, the sum of these activities might support greater reductions in GAM rates. Further exploitation of synergies with WFP’s other activities, including ER, social safety nets, livelihoods (TUP-N) and SF, could also lead to improved outcomes.
97. IMCN provides an entry point for strengthened BCC approaches and synergistic programming with ER activities and other partners, making important links with community clinics and the health sector that can support many of the relevant underlying determinants of both stunting and wasting (e.g., childhood immunisations, health clinics). The design of the IMCN activities enabled the BCC component to have a broader reach than the TSFP, when it was conducted in communities through courtyard sessions and house-to-house visits, thus including all available community members and not solely the TSFP beneficiaries. However, the increasing move to hand over activities to government staff and base activities at the community clinic, while positive in aligning with government systems, may jeopardise the reach of the BCC component if effective and creative mechanisms are not put in place.
Component 2: SF
98. Outputs: Beneficiary selection and targets: SF beneficiary targets were largely met or exceeded, ranging 92 percent in 2014 to 114 percent in 2013 and 99 percent in 2012.134 The number of days biscuits were available – affected by delays in biscuit production and political unrest– was 77 percent of target in 2013. Attainment of target feeding days increased to 86 percent in 2014. In areas where WFP handed over SF to the government in December 2014, there was a gap in biscuit delivery from January to mid-March 2015.
132 Sabina, N. 2014. 133 Private company and of the largest producers of knit garments and textiles in Bangladesh. 134 Refer to output chart in Operation Factsheet.
26
99. Timeliness, frequency, duration and quality of outputs: WFP currently oversees the production and procurement of the eight factories that produce the school biscuits, helping to ensure timeliness, consistency, and efficiency.
100. The DPE stated WFP procurement of the biscuits is a tremendous help, as government bureaucratic procurement processes take much longer. The programme faces a future challenge to efficiency when government takes over procurement. Government must find efficient ways to manage procurement processes to ensure quality, and to deal with anticipated political pressure to select certain factories so that the procurement process is transparent. Several stakeholders in the field expressed similar concern about potential threats to transparency and efficiency. WFP plans to engage government to set up a multi-agency, high-level committee to build in safeguarding procedures into the procurement process.
101. The government of Bangladesh is a major donor to SF through its in-kind provision of approximately 10,000 metric tonnes of wheat; this supports half of the schoolchildren that WFP currently serves. This level of contribution by a government to a WFP programme is exceptional and an indication of government’s regard for school feeding. In relation to capacity building, WFP trained or assisted 96 percent (205/214) of target SF programme government/national staff to develop school feeding strategies or legislation.135
102. Delivery of the ELP is uneven. The most successful messages concern health, hygiene and sanitation. Focus groups of parents, children and SMC members were able to cite key messages and almost all schools were implementing these lessons within their capabilities. However, government’s ability to provide adequate water facilities and toilets to facilitate good practices at all schools is limited.
103. Cross-cutting. SF targets girls and boys equally to promote gender parity in primary education and also includes messages to parents and teachers on the importance of educating girls and avoiding early marriage for girls. To date, 43 percent of female SMC members have been trained, making progress toward the endline target of over 60 percent, and 42 percent of the women are in leadership positions on the committees (endline target: 50 percent).136 During field interviews, female SMC members were present and outspoken, indicating that selection and training of female members has had an effect. Training of other SMC members is uneven; NGO training events usually include only one or two SMC members (due to budget constraints) whose task it is to relay the information to other SMC members, but this happens imperfectly. In Satkhira district, one of the cooperating partners organizes community mobilization meetings which include messages on the ELP, while government officers deliver information on gardens, women’s empowerment, and health. However, government staff have little time or resources to organize sessions; an NGO partner in Kurigram reported that after government took over the SF programme, community mobilization and women leadership sessions stopped.
104. According to the 2014 SPR, the accountability/protection to affected populations indicator target was reached, with 100 percent of assisted people informed about the programme. The goals for partnership were also reached, for instance, related to the number organisations providing complementary inputs and services (target: 12, actual: 12) and the proportion of activities implemented with complementary partners (100 percent).
105. Outcomes and objectives: Overall, the biscuit programme is a valued activity by children, parents and teachers, and WFP’s technical assistance is valued by the government taking strong ownership of the programme and developing a SF policy framework. The biscuit functions as an incentive for children to enrol in and to attend school, though concerns arose over the palatability of the biscuit. The outcome results are particularly positive for the enrolment rate of change and completion rates in WFP-assisted schools as compared to baseline. Attendance rates for WFP-assisted schools are high but slightly below control and government-assisted schools in the follow-up survey, and drop-out rates remain an issue in high poverty areas such as Kurigram and Cox’s Bazar. Such results may be attributed to difficulties in meeting school-related costs among ultra-poor families, a decrease in the value of social transfers, and to the regular monitoring at WFP-assisted schools that provides more accurate data. The monitoring and support required of government SF has increasingly over-burdened district education staff, which poses a significant challenge to government’s ability to maintain programme quality.
106. WFP Bangladesh achieved its 2015 target of assisting government to scale up SF while WFP phases out. WFP’s success in engaging and handing over to government, and government’s assumption of responsibility for SF are significant achievements. WFP has successfully built the capacity of the government to manage the programme. As attested by the DPE, when the DPE began its collaboration with WFP, it had no experience in logistics or programme management; DPE now states that it is capable of handling these aspects of the programme independently.
107. Table 5 shows that attendance rate for WFP-assisted schools is two to four percentage points below control and government-assisted schools, and has decreased slightly–though significant statistically–between 2012 and 2014. According to FGDs in Kurigram, which has many ultra-poor families, attendance is lower because families cannot afford school-related costs (e.g., clothes, educational materials). WFP works in the poorest areas, and meeting school-related costs may therefore be a greater hardship in these areas. It may also be attributed to the regular monitoring of enrolment and attendance in WFP-assisted SF areas by WFP and cooperating partners, so statistics on those schools may be more accurate than for non-WFP-assisted schools. Some of the decrease may also be attributed to a decrease in the value of social transfers (e.g., school biscuits, stipend) as wages and prices rise. Enrolment is near or at gender parity, with girls registering slightly higher attendance rates than boys.
Table 5: Attendance rate of boys and girls for grades one to five
Evaluation period Population category
All
WFP feeding school Government feeding school
Program Control Program Control
Attendance rate (per school)
2012 baseline survey
Boy 86.8% 85.8% 88.3% 89.3%
Girl 87.5% 86.8% 89.7% 90.8%
All 87.3% 86.4% 89.0% 90.1%
Attendance rate (per school)
2014 outcome survey
Boy 84.9% 85.9% 88.9% 86.8%
Girl 86.2% 87.4% 90.4% 88.7%
All 85.6% 86.7% 89.7% 87.8%
28
108. The outcome survey shows positive results for the enrolment rate of change,137 with significant increases in the number of children enrolled in WFP-assisted schools from baseline to mid-term (boys: 137 to 149, girls: 140 to 157, all: 277 to 306). The magnitude of change from baseline to mid-term is higher in WFP-assisted primary schools (10 percent) compared to control schools (four percent) (Figure 7).
Figure 7: Average annual rate of change in number of children enrolled in WFP-assisted primary schools
Source: 2014 outcome survey Note: this outcome indicator is from the original and revised CP logframes.
109. According to focus group participants, the biscuit programme remains a popular and valued activity. The biscuit continues to function as an incentive for children to enrol in and to attend school (Table 23 in Annex 4). This is especially true for younger children in classes one and two, who are less able to withstand hunger and focus on their lessons. The children in class one and two are also more affected on days when the biscuits are not delivered, and according to teachers are the most likely not to attend if there are no biscuits. Focus groups of parents and teachers confirm that the school biscuit helps allay hunger, and enables children to pay attention in class, and that children are healthier due to the biscuit. Having biscuits at school also prevents children from buying unhygienic snacks from vendors which make them ill. The school biscuit programme also alleviates the concern of mothers that their children are hungry while in school. Students report in focus groups that the biscuit gives them energy and drives away hunger.
110. The common complaint about the biscuit among children, teachers and parents across the three districts visited is that it is too hard, and the younger children in particular find it difficult to eat as a result. Many respondents commented that it is not “tasty” enough and that the flavour does not change year after year, or that it is too sweet. District education staff would like more variety in SF by alternating other food items with the biscuits. Since a central purpose of the biscuit is to attract and retain children in school through completion, palatability is important, and WFP should investigate ways to make the biscuit softer.
137 To calculate this indicator: The average number of children (per school) enrolled in grades 1-5 was calculated for the month of September 2011 and 2013. Then, the rate of increase was calculated by comparing the average enrolment for both years. The rate of increase was not calculated per year, it was calculated between baseline to follow-up (over two years).
137 140
277
128 126
254
149 157
306
130 134
263
0
50
100
150
200
250
300
350
Boy Girl All Boy Girl All
Program Control
Ave
rage
no
. of
child
ren
pe
r sc
ho
ol
en
rolle
d in
gra
de
s 1
-5
Baseline Outcome
10%change 4%
change
29
111. The completion rate results from the outcome survey show statistically significant increases in the primary completion rate from baseline to mid-term for both WFP-assisted and control schools, for boys, girls and overall (Figure 8). Yet, control schools showed significantly higher amounts of change in completion rates from baseline to mid-term for boys, girls and overall compared to WFP-assisted schools. One explanation may be that while WFP targets the poorest upazilas, control areas outside the upazilas tend to be better-off, which favourably affects the completion rates. The retention rate indicator was added in the revised logframe; from the outcome survey WFP-assisted schools show a high retention rate of 93 percent.138
112. While the biscuit retains its attraction for children, teachers, and parents, the changing economics of Bangladesh has reduced its incentive effect. As wages for male labourers have risen to BDT 300 per day, the transfer value of the biscuit has decreased from around 10 to 20 percent of a poor household’s income in 2001 to about three percent of its income in 2015. This is particularly true in urban areas, where wages are higher. Key informants at the district level did observe that because children perceive the biscuit as a direct benefit, they want to go to school rather than work, as any money they earn goes to the household.
113. Drop-out rates remain high and completion rates low in high poverty areas such as Kurigram and Cox’s Bazar. Focus groups in Kurigram stated that even young schoolchildren (class one and two) are absent to help parents with household labour, particularly during harvest season. According to education officials and teachers in Kurigram, early marriage for girls remains high in that district, especially if the family is poor. Another factor in the north is periodic displacement due to river erosion. Key informants in Cox’s Bazar also cited overcrowded classrooms and inadequate attention from teachers as contributing to a high dropout rate. Boys tend to have higher dropout rates as they have more labour opportunities than girls and it is not socially acceptable for girls to work in shops or tea stalls as boys do. If children do not perform well in school, parents may decide to send a boy to work or keep a girl at home rather than continue to pay school costs. Parents also stated that if girls complete secondary school, there are more job opportunities for them than boys, usually as teachers.
114. Meeting the cost of education remains a challenge for children from poor families. Education itself is free, but school attendance requires materials, clothing and other items. A 2013 study by UNICEF reports that families spend BDT 4,788 (US$62 approx.) excluding snacks annually for a primary student of grade four and five.139 The study states that focus groups reported that the biscuit, along with the stipend, is an
138 See Operation Factsheet. 139 Directorate of Primary Education. 2013.
Figure 8: Primary completion rate of WFP-assisted and control schools
Source: 2014 outcome survey Note: this outcome indicator is from the original CP logframe.
28%32% 30%
26%29%
27%32%
38%34%
39%45%
41%
0%5%
10%15%20%25%30%35%40%45%50%
Boy Girl All Boy Girl All
Program ControlBaseline Outcome
30
important incentive to education. Parents stated that having the biscuit at school saves them five to BDT 10 per day. For families with children in classes one to two, who attend school 207 days a year, this can be as much as an additional BDT 2,070 (US$27) and BDT 2,300 for children in classes three to five (230 days per year), for a total of up to US$92. This is a significant expense for poor rural families.
115. In areas handed over to government by WFP, upazila education officers (EO) and assistant upazila education officers (AUEO) are now solely responsible for monitoring the school biscuit programme. These officers have a heavy workload and are already overseeing a broad set of education activities, including preparing monthly accounts for teachers’ salaries and administering the stipend scheme. For example, in Satkhira district, one AUEO at upazila level oversees three unions. In Tala Upazila, there are eight AUEOs and one EO to oversee 245 schools with biscuits and 330 schools in all. Few additional staff are being added at district level, potentially compromising the ability of district education staff to adequately monitor SF. Conversely, education officials in Cox’s Bazar welcome WFP monitoring as it reduces their workload.
116. With the handover from WFP to government, some cooperating partners report a significant change in monitoring, in that the DPE is monitoring their visits to schools very closely. NGO field monitors are required to call DPE when they visit schools and report on specific activities, which puts the field monitor in the position of reporting to DPE in addition to his or her own organization but has produced results. Teachers attend more regularly because they are being monitored, and DPE informs the district primary EO about problems directly, making it more likely that action will be taken. Field monitors stated that if they pass messages directly to AUEOs, they are not sure if action is taken and do not receive feedback, whereas with WFP they could pass a message to WFP and get action. One cooperating partner noted that the AUEOs also need some kind of mobile messaging system so that they can tighten their monitoring.
117. EOs and AUEOs are transferred frequently; the majority of those interviewed had been in their current posts less than one year. While the officers interviewed are knowledgeable about the SF programme, and stated that the biscuit modality is easy to manage, the continual changes in government staff pose a challenge to ensuring the quality and continuity of support, and new staff may not receive adequate training in programme monitoring. In the view of one implementing NGO, the EO and AUEOs need training on SF as they are directly involved with monitoring schools, and the school personnel listen to them as they are government employees. Realistically, unless the government transfer system changes, there must be regular training in order to maintain local level government capacity to monitor the programme.
118. Government will need to ensure adequate monitoring of the school biscuit programme by supporting the recruitment of additional staff at the district education office, ensuring that existing staff are trained in the programme, and allocating adequate funding to support the ELP activities. In Kaliganj Upazila in the south, where government took over SF two years ago, no community mobilization trainings have been carried out by the implementing NGO due to a lack of funds.
119. The hot meal pilot is scheduled to be evaluated in 2016. Experience to-date shows that there are a number of challenges to achieving a successful hot meal programme. This includes ensuring kitchen facilities are in place, cooks and community volunteers are trained, water supplies are adequate, proper hygiene is practiced, regular monitoring and accountability practices are in place, and the local supply of vegetables is reliable. This will require substantial involvement from the government, NGOs, WFP, school
31
personnel and community members. The estimated cost of hot meals is BDT 25, three times that of biscuits,140 though this does not account for other direct or indirect benefits.
120. The urban school feeding programme is very small and little outcome data are available. The ET’s visit to BRAC’s urban schools indicates that the biscuit fills a nutrition and food security gap for urban children. There is potential for an impact on school enrolment, attendance, and on completion, as BRAC urban schools focus on attracting dropouts back to school. WFP should continue its partnership with BRAC schools and explore programme options and outcomes for expanding the biscuit programme in urban slum settings in Dhaka and in secondary cities. The CO is aware that this initiative requires a closer look at what programme opportunities exist, particularly in secondary cities, to develop clear programme goals and design. This should begin with an analysis of existing data and in-depth qualitative study on people’s capacities and constraints.
121. The CO’s most significant advance in SF is its technical support to government to develop a policy framework to institutionalise SF as the government gradually makes a transition from external support to a nationally funded and managed SF programme. A global study notes that establishing a national policy and legal framework for SF is an important part of the institutionalization process. Out of 94 countries surveyed, only 18 percent of low-income countries were in the process of drafting a policy.141
122. From 2012 to 2014, modest gains were made in all dimensions. The strongest element is community participation and ownership, already a well-developed part of the programme. Overall progress in the development of a comprehensive policy framework to support school feeding is slow, and is the weakest dimension, registering at 1.5 on the four-point capacity achievement scale (Figure 9). The Primary Education Development Programme (PEDP-III) that currently supports SF ends in mid-2017; unless government is able to mainstream SF through a policy framework under the current authorization, developing and getting approval for a new programme to support school feeding is likely to result in considerable delay.
Figure 9: SF NCI, by capacity dimensions and year
Source: WFP Bangladesh 2015 (monitoring data) Note: this outcome indicator is from the revised CP logframe. Capacity dimensions: policy frameworks (PF), funding and budgeting (F&B), institutional capacity and coordination (IC&C), programme design and implementation (PD&I), and community participation and ownership (CP&O)
140 Report on GoB-WFP Joint Monitoring Visit to the School Feeding Programme in the Poverty Prone Areas. Barguna and Rangpur Districts, 22-25 March 2014. 141 WFP. 2013. State of School Feeding Worldwide.
1.0 1.5 1.2 1.6 2.0
7.3
1.5 2.0 2.0 2.5 2.7
10.7
1.52.5 2.2 2.5 3.0
11.7
0.0
2.0
4.0
6.0
8.0
10.0
12.0
14.0
PF F&B IC&C PD&I CP&O TOTAL
CAPACITY DIMENSIONS
2012
2013
2014
32
Component 3: ER
123. Outputs: Beneficiary selection and targets: The ER component fulfilled 92, 96 and 117 percent of its targets for direct beneficiaries in 2014, 2013 and 2012, respectively.142 One hundred percent of the commodities were distributed in 2013 compared to only 20 percent in 2014 due to a decline in donor contributions. The government contributed the cash equivalent of rice rations while WFP distributed pulses and oil enabling WFP to reach its target.143 Other reports (IDS and FSUP Lessons Learned) discuss the very extensive participant selection process and challenges. Based on individual home visits and FGDs, the ER component appropriately targeted the ultra-poor, those with less than 20 decimals (i.e., 0.08 hectares) of land and many of whom do not even own their own homestead.
124. As shown in Table 6, the proportion of female FFA/FFT participants exceeded the targets each year, ranging from 73 to 87 percent. The ER Plus component provides a BDT 15,000 cash grant for all ER participants in select communities. The grant goes to women only, and in the case of male ER participants, their wives receive the grant.
Table 6: Proportion of male versus female ER actual beneficiaries by intervention type and year 2012 2013 2014 male female male female male female
GFD,TFD/A1 (target: 50/50)
53% 47% 24% 76% 0% 0%
FFA/FFT (target: 40/60)2 27% 73% 13% 87% 14% 86%
Cash and vouchers (target: 49/51)
51% 49% 49% 51%3 49% 51%
1 GFD, TFD/A for ER as listed in the SPR refers to emergency response beneficiaries. 2 FFA/FFT planned proportion by gender was 30/70 (male/female) for 2014. 3 According to the CO, in 2013, cash grants for investment were provided to 18,000 women participants. Source: WFP Bangladesh. 2014. SPR.
125. By the end of 2014, WFP lacked funding for FFA/FFT except for its own staff. As a result, for the next phase (2015-2016) the target population was reduced from 80,000 to 42,500144 participants. As an indication of effective partnership and commitment to the programme, the government committed to funding the transfers in the next phase at the same wage but paying cash only, no commodities (BDT 145 per day). As this was finalized in late March, it was not yet feasible to observe the effect of this change.
126. Timeliness, frequency, duration and quality of outputs: The ET finds that the FFA scheme selection and approval process is long, as it starts with upazila DMCs’ selection of the target unions, then establishment of union-level LLP teams, and submission of the LLP report and map from the union level to Dhaka for review and final approval. The cooperating partner NGO coordinates and guides LLP implementation. Despite this lengthy process, interviewed participants were relatively satisfied with the lump sum payments, which came two weeks to a month after partial or full completion of the schemes, depending on their size. Two years of FFA/FFT provides a significant benefit to otherwise unemployed ultra-poor men and women and their families. According to the 2013-14 scheme list, on average each FFA participant had approximately 200 days of work over two years. In addition to the 2 kg of rice, 200
142 Refer to output charts in Operation Factsheet. 143 WFP Bangladesh. 2014. SPR. 144 Except for a small percentage who will continue with ER Plus support, WFP will no longer work with the 2013-14 beneficiaries. From 2015, WFP will work with a new group of beneficiaries.
33
gm of pulses/lentils and 100 gm of vegetable oil, they earned BDT 58 (US$.75) cash per day for average earnings of BDT 11,600 (US$149) and 12 months of FFT, at BDT 652.5 per month came to BDT 7830 (US$100, plus 270 kg of rice in that time period).
127. The ER component covers emergency response, including increasing food tonnage in the 2012 POW to respond to the waterlogging crisis, and BRs to provide assistance for flood-affected populations in January 2013 and November 2014. Based on interviews, WFP responds quickly with joint- and individual-level household assessments, biscuits and cash transfers to those in need. The ET advises disaggregation of relief and ER beneficiary data. Emergency response monitoring reports indicate tracking of rainfall and storm patterns, but it is unclear how this information is used in ongoing ER activities.
128. Cross-cutting. Per the 2014 SPR, 51 percent of ER beneficiary households report that females and males make decisions together about the use of the assistance, (endline target: 70 percent). To date, 76 percent of women ER participants hold leadership positions on project committees and 69 percent of female committee members were trained on modalities according to the SPR. The accountability/protection to affected populations indicator target (90 percent) was exceeded, with 97 percent of assisted women and men informed about the programme. Most (92 percent) of participating ER women reported they did not experience safety problems travelling to/from the sites (target: 100 percent). The ER goals for partnership were also met, such as the number of organisations providing complementary inputs and services (target: 9, actual: 13) and the proportion of activities implemented with partners (100 percent).
129. Outcomes and objectives: Overall, WFP Bangladesh has a very strong partnership with LGED and is highly regarded by the Ministry of Disaster Management and Relief (MoDMR). LGED is fully engaged with and committed to the programme and now paying all FFA wages. ER is building on its experience of LLP, FFAs and disaster mitigation to deal with more complex environmental issues and improve its collaboration with other United Nations agencies. The ER component includes outcome indicators for measuring resilience based on household food security145 and community preparedness. Among programme households in ER-only areas, the food security outcome data indicate positive impact on food consumption and in reducing coping strategies, while dietary diversity did not show statistically significant improvement but remains above target (see Table 24 in Annex 4), and all show a similar trend across gendered household type. The percentage of ER-only households with acceptable food consumption increased from 36 to 55 percent, moving toward the endline target (80) (Figure 10).
Figure 10: Percent of households with acceptable level of FCS
Source: 2014 outcome survey; note: this indicator is from the original and revised CP logframes.
145 Based on resilience measurement principles, improved resilience capacity affects the development outcomes (e.g., food security indicators) as they are influenced by shocks/disasters. Source: FSIN. 2014.
36%
52%60%
47%
39%
57%63%
50%55% 53%
69%
59%
44%
58%
70%
55%
0%
10%
20%
30%
40%
50%
60%
70%
80%
ER Only ER+IMCN IMCN Only All ER Only ER+IMCN IMCN Only All
Program ControlBaseline Outcome
34
130. The coping strategies index (CSI) decreased across household types with an average overall score decreasing from 27.3 to 18.7.146 Figure 11shows the average CSI with reductions in scores across programme and control areas. Overall, the percent change from baseline to mid-term is significantly greater for programme areas and for ER-only households in particular (see Table 24 in Annex 4).
Figure 11: Coping strategies average index
Source: 2014 outcome survey; note: this indicator is from the revised CP logframe. The CSI score is calibrated to 100.
131. The average diet diversity remained fairly static, even decreasing, in the percentage of households eating at least four food groups per day, from 95 to 93 percent, yet remaining above target (80 percent)147. For ER-only programme areas, the dietary diversity score (DDS) did not change from baseline to mid-term (5.0) but worsened in the control area (5.1 to 4.9) (Figure 12). The DDS is a proxy for understanding the economic status of households, showing that ER-only programme households may have experienced stabilised economic status (and thus diet diversity) since baseline, while the economic status of control households may have worsened. The lack of significant improvement overall may be due more to the sensitivity of the indicator than to the actual impact of the programme. Based on FGDs, the food and cash have enabled women and their families to increase household food consumption, and since the cash tended to come every few months the participants were able to invest these significant amounts into productive investments invests (e.g., poultry, goats, sewing machines and cows). The benefit also allowed families to have extra cash for school fees and materials and household items.
Figure 12: Household average dietary diversity score
Source: 2014 outcome survey; note: this indicator is from the revised CP logframe.
146 See outcomes table in Operation Factsheet. 147 Refer to Operation Factsheet.
27
22
17
2326
21
13
2119 18
11
1619
13
10
15
0
0.05
0.1
0.15
0.2
0.25
0.3
ER Only ER+IMCN IMCN Only All ER Only ER+IMCN IMCN Only All
Program ControlBaseline Outcome
5.05.7 5.8
5.4 5.15.9 5.7 5.4
5.0 4.9 5.3 5.1 4.9 5.15.5
5.1
0.0
1.0
2.0
3.0
4.0
5.0
6.0
7.0
ER Only ER+IMCN IMCN Only All ER Only ER+IMCN IMCN Only All
Program ControlBaseline Outcome
35
132. Finally, the indicators for community disaster preparedness and community assets are the culminating indicators for the component, which aims to enhance resilience and reduce risks to shocks and disasters. These indicators have likely improved at mid-term, though the sample sizes (e.g., n=30) are too small to show statistically significant change. Sixty-four percent of ER-only communities have improved capacity to manage climatic shocks and risks (called the disaster preparedness index at baseline) compared to about 57 percent at baseline, moving toward the target of 80 percent (Figure 13).
133. The CAS, which WFP collects and calculates as a measurement of infrastructural resilience against floods and water surcharge issues, increased from 31.1 to 41.2 from 2012 to 2013.148 The ET finds this tool complicated and subjective; it may not be the most efficient or reliable approach for assessing community resilience. Communities expressed great appreciation for the improved infrastructure, and based on several randomly selected field visits and interviews, the ET finds ER enables vulnerable households, communities and DMCs to mitigate and recover from disasters through rehabilitated community assets, training on warning systems and protection of household items.
134. According to planning guidelines and other documents, WFP and NGO staff interviews, and FGDs with LLP teams, union and upazila DMCs, the ET finds that the ER component establishes LLP teams with representatives from each ward and a minimum of three women; they know their communities well and have effectively identified and prioritised community assets in need of rehabilitation. Based on field visits and review of the complete scheme list for 2013-14, the schemes consisted mostly of roads, embankments, canals and some raised housing, which enabled people to protect land from flooding, maintain communication during the rainy season, collect fresh water and mitigate loss of homes and assets during floods and cyclones. Annex 11 (Supplemental Annex) includes a detailed description of the visited schemes and environmental context.
135. Yet, based on KIIs and FGDs, the available resources for FFA activities only met a small percentage of infrastructure needs in any one union. While the ET did review some of the maps developed by the LLP teams and discuss the analytical process, the ET was not able to review any additional documents prepared by the LLP teams or NGO staff or to observe the process itself. Based on this and the IDS review it would be advisable to have a closer expert review of this process in the field.
136. Along with ward representatives, the LLP teams include LGED staff and sub-assistant agriculture officers. Based on specific ET questions related to agriculture and post-disaster response, the agriculture officers expressed strong technical knowledge, were very engaged and could likely provide more technical support to reinitiate agriculture production after disasters. According to LLP team discussions these groups are not used after the initial beneficiary and scheme selection and expressed feelings of
148 Refer to outcomes table in Operation Factsheet.
Figure 13: Percent of targeted communities with evidence of improved capacity to manage climatic shocks and risks
Source: 2014 outcome survey; note: this indicator is from the revised CP logframe.
57.1% 56.0% 56.5%58.3%
68.8%63.7%
0.0%
20.0%
40.0%
60.0%
80.0%
North Coast AllBaseline Outcome
36
marginalisation by the programme, especially the women who were of similar status to participants. In one union where the programme returned after a two-year hiatus, they selected all new LLP team members rather than working with the original team, which could have been developed into a longer-term community resource for improved engagement. The female LLP members make up less than 25 percent of their groups. While all LLP members receive three days of training on LLP processes and cooperating partners ensure women’s voices are included in the LLP report, the female members are not provided any training or mentoring specifically on how to effectively communicate with men; neither do the men, including NGO staff, seem to have been provided direction on the importance of allowing women to speak.
137. Also related to protection and gender, FFA/FFT participants shared how ER labour opportunities provided favourable alternatives to more exploitive alternatives. Several of the men shared how they were no longer compelled to migrate to India for work. Women shared that they preferred this work to working for other people in their homes, which can be exploitive. ER has provided an excellent opportunity for women to earn and manage their own cash, which has improved their status and empowerment within their households and community. Their husbands are supportive of their work but also fill in for them when certain work is too onerous. The ET concludes that it is commendable that the programme allows for this kind of flexibility. Yet, based on FGDs with all stakeholders, two years is not enough to ensure significant community or household impact. The additional third year for ER Plus (discussed below) should help to sustain the progress made during the first two years.
138. WFP has initiated a new programme called ER Plus that consists of an additional year working with the participants during which they are provided a BDT 15,000 cash grant for investment. IFPRI prepared a draft report on the impact of this programme, especially on the added value of the third year.149 The ET finds WFP is maintaining good basic data on participants that could be used to more easily monitor and evaluate the impact of ER and ER Plus. For example, WFP could include data for key household indicators on the existing demographic spreadsheet such as total land holdings, number of cattle and goats, number of working adults and children, primary source of income, number of eligible children attending school, and primary IGA with the grant.
139. Finally, based on programme documents and discussions with donors, the ET finds the Adaptive Early Recovery initiative to be an excellent opportunity for WFP and partners to more effectively address environmental risk factors related to resilience. The hiring of an experienced, full-time coordinator is commendable; this role is important for engagement across agencies and follow-up, per project requirements. But there may still be a need for more internal agriculture and environmental management expertise in order to effectively engage with FAO and UNDP and to hold one another accountable. Based on its experience in LLP, FFA and women’s empowerment, WFP could advocate for a role in water and land management programmes in its operational areas. As a member of the LCG Climate Change and Environment sub-group, it is a good opportunity for WFP to engage more intensively on these issues.
Component 4: SGSN
140. Outputs: As shown in the Operation Factsheet outputs table, Component 4 met or exceeded beneficiary targets (attainment rates of 100-116 percent) if revised to exclude FSUP for 2013 and 2014. Various activities worked towards strengthening national capacities across components. Relating to the national food security programme, the 2014
149 IFPRI. 2014.
37
SPR reports that 97 percent of target government staff received technical assistance or training (1055 actual/1089 target), and 88 percent of target government counterparts received assistance for developing strategies or legislation (67 actual/76 target). With WFP technical assistance, the government has scaled up the distribution of fortified rice blends from two upazilas in 2013 to seven upazilas in 2014 for 12,000 VGD beneficiary households. In 2015, the government allocated US$1.25 million to scale up distribution of fortified rice to more than 30,000 VGD beneficiary households in 12 upazilas.
141. While there is no corresponding output indicator, WFP continues to support the government to strengthen and reform the VGD national safety net programme since its handover in 2010. WFP’s contribution to strengthen existing safety nets extended to engagement in the development of the first-ever social security strategy (NSSS).
142. Stakeholders, communities and participants interviewed recognize the value of WFP technical assistance. The ET finds there is need for continued WFP technical assistance at the regional, national, sub-national and community levels in capacity building for sustainable food security and nutrition programmes. This technical assistance should include, for instance, M&E and staff orientation until an effective M&E and reporting system for VGD is established at the field level.
143. Outcomes and objectives: WFP’s continued dialogue, evidence creation, capacity strengthening efforts and advocacy to strengthening government safety nets have resulted in reformation of ongoing safety nets and exploration of implementation modalities for effective and sustainable safety net interventions. WFP’s technical assistance has been found effective in the reformation of VGD that included: integration of investment component and scaling-up of fortified rice distribution the programme; capacity building of the DWA to manage VGD and BBS to produce the national poverty and undernutrition maps; and advocacy for the shift from the current protective safety net approach to a promotional safety net approach, and to mainstream nutrition into the VGD programme. TMRI conducted under the technical guidance of GOB interministerial committee has been found to be appropriate in generating new evidence on the effectiveness of different combinations of transfer modalities including cash, food and nutrition BCC on the three critical outcomes of household income, food security, and child nutrition. EFS, a pilot involving a combination of cash grant, monthly cash allowance and training on income generating skills and nutritional knowledge to improve food security and nutrition of vulnerable women beneficiary households, is a proven success of adaptation of TMRI findings.
144. VGD programme: In 2011 a staff capacity pool was created comprising the Project Support Unit (PSU) (involving WFP staff) and the Project Implementation Unit (PIU) (involving staff from the Ministry of Women and Children Affairs, Department of Women Affairs (MoWCA/DWA)). WFP’s capacity strengthening included technical assistance in strengthening the DWA in VGD implementation, and integration and scale-up of fortified rice distribution in VGD. WFP advocated for the shift from the current protective safety net approach to a promotional safety net approach and to mainstream nutrition into the VGD programme, facilitated workshops and study tours, and developed quality implementation directives. In January 2015, WFP received approval of a pilot investment component of VGD (IC-VGD), discussed below, with donor funding for 2,000 female participants for a two-year cycle. Due to WFP advocacy and facilitation, the pilot has received the government commitment of US$1 million for an additional 6,000 women’s households for IC-VGD at the beginning of the government’s fiscal year in July 2015.
38
145. A total of 248 local and national NGOs, selected centrally by the MoWCA/DWA, are engaged in VGD implementation in the field. The ET finds that the selection of NGOs does not sufficiently involve the MoWCA/DWA officials at district and upazila levels and needs to be more participatory to avoid the possibility of poor performance. The national capacity index (NCI) assessment, discussed below, was conducted by WFP and DWA in November 2013, reports on such governance issues. The recent government NSSS calls for engaging, and where necessary, deepening the partnership with NGOs in the area of delivering social security services. The strategy adds that NGOs can be engaged in piloting innovative ideas for possible scale-up; identifying potential participants, especially those that are hard to reach because they live in remote areas or belong to marginalized or vulnerable social groups; and helping redress grievances and disputes relating to the implementation of the NSSS. The ET advises the NGO selection process be more transparent and involve field participation.
146. The VGD working group, comprised of WFP, DWA and MoWCA, has developed an action plan for implementing nine priority focus areas identified by the capacity assessment: These are: 1) enhancing coordination between the policy and field levels; 2) strengthening staff motivation and accountability; 3) addressing governance failures; 4) strengthening the M&E system; 5) introducing flexibility in programme implementation; 6) redesign of the programme; 7) developing a comprehensive capacity-building strategy and programme; 8) re-branding VGD as a nutrition security programme; and 9) introducing community mobilization through encouraging community participation. The assessment also identified five challenges the programme faces: 1) implementation and accountability; 2) effectiveness of the assistance package; 3) use of NGOs; 4) strengthening household-level outcomes; and 5) institutional capacity for planning, monitoring and delivery. These will have to be kept in focus in addressing the priority areas.
147. The implementation of the action plan is reportedly slow. The ET found that DWA’s WFP-supported PIU is heavily engaged at the central government level. However, government has a valuable but under-utilised resource in its field personnel, and would benefit from more focus on enhancing their capacity. The district and upazila women affairs officers (D/UWAO) can be greater resources for training and monitoring of participants. Enhancing D/UWAO capacity requires that they be empowered to make decisions and take corrective actions in the field on critical activities, including selecting VGD women and supporting them to identify income-generating activities.
148. The SPR 2014 shows an aggregate score of five dimensions of the NCI at 13.3 in 2014 as compared to the baseline value of 10.9 in 2012, making progress towards the programme target of >14 for security programmes. While the overall score shows an improvement in capacity building, review of the five dimensions of NCI150 (Figure 14) shows no improvements in the community participation and ownership, which is consistent with the ET’s finding from FGDs and KIIs. A deeper review of the three elements of the CP&O dimension shows that the social accountability element is lagging behind the other two elements: participation in programme design and improvement, and participation in programme implementation.
150 policy frameworks (PF), funding and budgeting (F&B), institutional capacity and coordination (IC&C), programme design and implementation (PD&I), and community participation and ownership (CP&O)
39
Figure 14: VGD NCI, by capacity dimensions and year
Source: WFP Bangladesh 2015 (monitoring data) Note: this outcome indicator is from the revised CP logframe. Capacity dimensions: policy frameworks (PF), funding and budgeting (F&B), institutional capacity and coordination (IC&C), programme design and implementation (PD&I), and community participation and ownership (CP&O)
149. ICVGD: Research on per-beneficiary cost estimates under the existing programme show US$302 compared to US$565 under the new ICVGD programme. Although the per-beneficiary cost under ICVGD is about 87 percent higher than the existing programme, it is comparable to the average per-beneficiary cost of US$500 for extreme poverty programmes. The higher cost under the ICVGD package is due to a five percent premium for fortification of rice, a one-off cash grant of BDT 15,000 per participant, investment planned for improved training on micro-entrepreneurship for income and BCC for nutrition. The broad cost categories of ICVGD are food and cash for beneficiaries, and cash for programme administration including NGO support.
150. TMRI: TMRI generated new evidence on the effectiveness of different combinations of transfers on stunting prevention. The research focused on the impacts of five different combinations of transfer modalities including cash, food, and nutrition BCC on the three critical outcomes of household income, food security, and child nutrition. A government inter-ministerial technical committee led by the MoDMR provided oversight and technical guidance. The ground-breaking results show for the northwest that substantive cash transfers (BDT 1,500 per month, i.e., one-fifth to one-fourth of a poor household's income) over two years, combined with intensive and interactive BCC can have great impact on preventing child stunting. This combination reduced child stunting in the north by 7.3 percent over two years. Transfers combined with nutrition BCC also produced a significant increase in diet quality (26 percent in the north; 12 percent in the south), reduced self-assessed hunger scores by up to 10 percent, and increased monthly total consumption expenditures per capita by about 16 percent in the north and 8.5 percent in the south.151 TMRI findings have already resulted in adjustments by WFP, government and NGOs in their ongoing and new activities while awaiting the formal release of final research results in May 2015. Key findings of the research include: if the policy objective is to improve the diets of poor households, both cash and food transfers are effective; if the policy objective is to improve the nutritional status of poor children, transfers alone are inadequate. TMRI found that high-quality BCC together with transfers–especially cash transfers–can deliver large improvements in both inputs into pre-school child nutrition and anthropometric outcomes.
151. FSUP: The FSUP, a promotional safety net approach to support ultra-poor families, was a four-year, European Union-financed project with a 24-month cycle that began in 2009 with a target of reaching 30,000 ultra-poor households in eight disaster prone
151 Ahmed, A. et al (IFPRI). 2015. Transfer Modality Research Initiative: Highlights of Impacts.
2.5 3.01.8 1.9 1.7
10.9
2.5 3.01.8 1.8 1.7
10.8
3.5 3.52.5 2.1 1.7
13.3
0.0
2.0
4.0
6.0
8.0
10.0
12.0
14.0
PF F&B IC&C PD&I CP&O TOTAL
CAPACITY DIMENSIONS
2012
2013
2014
40
upazilas from Serajganj, Bogra and Pabna districts. The project provided individual asset grants of BDT 14,000 to enable the woman to start businesses; a monthly subsistence allowance of BDT 500 (doubled to BDT 1,000 for the lean season) for 24 months to support families while their assets grow; entrepreneurship development training to assist in changing the mind-set of ultra-poor women and their families and empowering them to develop a feasible business plan; training in income-generation activities; training in disaster risk reduction, nutrition and life skills; group support in social and financial issues, with local women’s groups undertaking activities together such as savings, investments and community mobilization; and support in reinvestment and diversification to protect against future shocks, promote sustainable food security and enhance household resilience.
152. WFP and its cooperating partner NGO report considerable results in improved food security and enhanced women’s empowerment. The beneficiary families have successes in IGA that enabled them to diversify their incomes, access nutritious diets and cope with unexpected shocks. Programme progress reported by WFP includes: all beneficiary household members now eat three meals a day; the average income of women’s beneficiary households increased fivefold; total household asset values have tripled; women participants experienced a rise in empowerment as they are now active in the community and household decisions (e.g., eight FSUP women were elected as union parishad members); a drop in the incidence of early marriage; average monthly income increased five-fold; and the quadrupling of women’s average voluntary savings. Thus, based on the FSUP outcome survey report,152 secondary sources to even include print media153 and WFP’s programme monitoring reports the ET concludes that FSUP was impactful for beneficiary households and effective in improving food security and women’s empowerment. These successes have been carried on by EFS, discussed next, which was designed adapting the lessons learned and best practices from FSUP.
153. Other interventions that are designed or modified to build from FSUP are WFP partnering with BRAC for TUP-N and using FSUP as the proof of concept for the investment component of VGD (ICVGD).
154. WFP is also in the process of launching a new pilot initiative in Satkhira, partnering with Bangladesh Rural Advancement Committee (BRAC), to provide services through BRAC’s TUP-N programme.154 This aims to offer BCC and TSFP to eligible beneficiaries within TUP-N. Although warmly welcomed in the district, key informants noted that wealth categories above the ultra-poor are also in need of receiving BCC, as nutritional knowledge remains poor across all socioeconomic groups within the district.
155. EFS: One of the most successful pilots is the EFS under the joint engagement of AusAID and WFP. Phase one of EFS was implemented in two upazilas in Cox’s Bazar district, Teknaf and Ukhiya. The two upazilas have a poverty prevalence of 38 percent compared to the national average of 32 percent, and an extreme poverty rate of 20 percent compared to the national average of 16 percent. By adapting the successes and lessons from FSUP and TMRI, the pilot reached 700 ultra-poor women and their families. The two-year pilot (2012-2014) provided each family with a one-time cash grant of BDT 14,000 (US$180) for investment in IGA, a monthly allowance of BDT
152 WFP Bangladesh. 2012. Food Security for the Ultra-Poor (FSUP) Outcome Survey Report. 153 The Daily Star. 2013. WFP project lifts 30,000 women out of extreme poverty. 26 April. 154 TUP-N is an initiative with BRAC to include nutrition in their existing TUP programme. This is just starting in Satkhira district and could not yet be observed. It aims to target families with children U3 in the TUP programme and to additional deliver intensive and interactive BCC; it offers TSFP in the area so that those children who nevertheless become undernourished receive the required treatment.
41
500 to protect the livelihoods in the initial investment phase and technical training on income-earning skills and nutritional knowledge. The monthly allowance was double during the lean season from September-October.
156. Based on the success of the pilot in improving food security and nutrition in vulnerable households in Teknaf and Ukhiya (EFS I), a third upazila, Moheshkhali (21 percent extreme poor and 40 percent poor), has been added for another round of EFS (EFS II) with target coverage of 9,600 ultra-poor women and their families in three upazilas.
157. The ET conducted FGD interviews with pilot activity participants and their families and communities. The ET found that women participants have received training in entrepreneurship skills and identification of livelihood options that has enabled them to increase income from the initial investment of BDT 14,000, building assets ranging between BDT 50,000 (US$643) to BDT 120,000 (US$1,544) over three to four cycles of investment during the pilot. The most common initial investment was livestock while subsequent investments included leasing land for crops. A few cases of failure were reportedly due to investment of the seed capital (cash grant of BDT 14,000) in activities other than income-earning businesses.
158. Women participants also received training and practice in intensive BCC to include infant and young child feeding, health and sanitation, and sources of locally available and affordable nutrient-dense diet products to improve children health, reduce diseases and illness. Training included raising awareness on social issues, personal hygiene, personal savings, and disaster preparedness to help reduce intra- and inter-household tensions and problems.
159. Interviews indicate that the women participants have developed empowerment and leadership skills through the training. The selection of EFS participants was initially focused on nutrition, enrolling women with acutely malnourished children; WFP later changed to poverty targeting. The EFS differs from FSUP in that it focuses on empowerment of ultra-poor women by giving them increased economic opportunities, access to group support, and the opportunity to share knowledge through training sessions. These interventions resulted in increased mobility and strengthened women's role in household decision-making. They also increased the participation of male family members. The husbands of participants engaged in child rearing and other domestic tasks in order to enable their wives to spend more time and effort in income-generation activities, including marketing of the products.
160. Capacity building with BBS: WFP and the Vulnerability Analysis and Mapping (VAM) unit have built the capacity of BBS to produce poverty and undernutrition maps down to upazila level for the entire country by training BBS staff in sampling and poverty issues. In 2014, with financial support from IFAD, WFP collaborated with BBS to produce a third generation of sub-district poverty maps and the first-ever statistically valid sub-district undernutrition maps. The maps are widely used by the government and other agencies, who find them useful to understand and identify the geographical variations and spatial inequities in poverty and undernutrition at lower administrative levels. According to BBS, there is a demand for the maps from line ministries. The Economic Relations Division of the Ministry of Finance noted that government offices are using them to allocate resources. MoWCA and DPE, both WFP partners, use the maps to help target VGD and SF programmes, though use in other departments and ministries is not as strong yet. The maps have also promoted discussion and greater understanding among government and other stakeholders at the district level of where the greatest needs are in the country. As the poverty mapping
42
exercise was based on the 2010 Household Income and Expenditure Survey (HIES) and 2011 population census, this is the best available tool to use for targeting food security and safety net programmes. BBS has expressed interest in continued WFP technical assistance in poverty and undernutrition mapping and to expand their analysis and survey capacities (e.g., panel data surveys).
161. In addition, WFP is building the capacity of BBS to revise data collection methods and information management of the government’s HIES to conduct panel surveys for the VGD programme. WFP sees a further need for training on data analysis and interpretation. Donors are interested in getting more data from BBS and other agencies are providing technical support to BBS; however, WFP is putting great emphasis specifically on strengthening BBS’s analytical capacity. WFP has added value as a partner and is viewed as such by BBS. However, frequent changes in high-level ministry/department personnel present a challenge in concluding a formal agreement.
162. Outside of BBS support, WFP is working with government to build capacity in M&E, and to improve M&E systems centrally and in field data collection. This is part of the capacity building process and is still in its early stages for some activities, such as support to VGD. WFP is providing inputs and systems but it takes time for those systems to be recognized for their value, fully adopted, and used.
Unintended outcomes
163. As discussed under IMCN outcomes, the TSFP food is sweet and very popular with the children, which has the unintended effect of making the transition to rice-based foods difficult when the TSFP food finishes. This suggests messages on using the WSB++ as a supplement alongside the normal diet need to be reinforced. Changes to the school biscuit have made its texture harder and less palatable to children, especially younger children. This is the only notable unintended outcome observed by the team.
Contribution to higher-level development goals in Bangladesh
164. For the national SF programme, one of the most significant contributions WFP is making to higher-level development goals is its assistance to MoPME to develop a national SF policy. Developing and supporting the adoption of a national policy is a long and complex process, one which will help ensure the institutionalisation and thus the sustainability of school feeding in Bangladesh.
165. School feeding has government support at the highest level from both of the major political parties, and is seen to contribute to the education goals of the country. The Prime Minister is committed to school feeding, and is trying to engage communities to undertake hot meal pilots. There remains a lot of interest in high levels of government in a hot, rice-based school meal. WFP’s hot school meals pilot is expected to provide useful data for assessing the benefits and costs of this approach.
166. WFP has collaborated with research organisations, NGOs and government to develop and test approaches in nutrition, school feeding, and safety nets that have contributed learning and new models. These are contributions to the overall development goals of the country and have the potential to be adopted and scaled up by WFP and other organisations.
167. WFP is a member of the United Nations Chittagong Hill Tracts Working Group (WG), which works to support the peace accord. WG representatives confirm that WFP is an active member. One of the activities being piloted with WFP is supporting local councils to manage programmes as a way to support good local governance. WFP is
43
appreciated for its ability to look beyond its own mandate and partner to implement its programme in a way that is appropriate and accepted by local communities.
2.3. Factors Affecting the Results
Internal factors 168. Synergies. Synergies between programme components are limited with little overlap of
beneficiary groups and locations served by different components. The pilots and research initiatives offer more synergies, e.g., integrating school feeding and nutrition with livelihood activities in EFS offers a range of services to participants and addresses underlying causes of food security and nutrition. Cooperating partner staff capacity has been a positive factor in achieving results as staff are generally quite experienced, though it is noted that NGOs would benefit from additional training and more gender balance.
169. IMCN: Communication and coordination between WFP and cooperating partners at mid- and high- CO levels are not as strong as they could be. This limits learning and sharing between the field and the national level, opportunities for advocacy at national level, and opportunities for improved programming. Additionally, WFP is trying to deliver an IMCN programme that needs a longer-term view using short-term partner and staff contracts, which results in high staff turnover and discontinuity in programming and partner and government relationships. This is particularly relevant given the IMCN aims of capacity development and handover to government, and of BCC messages that lead to sustainable change. WFP’s cooperating partners (TdH, RDRS, SHED and Shushilan) were engaged in additional health and nutrition programming in the districts, complementary to the IMCN activities (not necessarily in the same communities).
170. The biscuit component has good synergy with emergency response, as stocks of biscuits are pre-positioned to distribute to households in the event of a disaster. This was demonstrated in the 2014 floods in the north, and in the CO’s ability to send biscuits to countries with acute emergencies such as following Typhoon Haiyan in the Philippines in 2013 and the Nepal earthquake in 2015.
171. ER: The ER programme reaches more households at the village level than the other components. It could thus serve as an entry point for training on nutrition, education and other services, particularly health and birth control.
172. SGSN: WFP’s generation of an evidence base for research and pilots to provide stakeholders with better information for decisions is useful for promoting synergies within WFP and government programmes, and across broader interventions. TMRI is an example of how research on transfer modalities and BCC can be widely adopted in nutritional activities and social safety nets across the country.
173. Partner capacity: The ET finds the NGO staff competent and committed but for the most part they lack technical expertise in nutrition, participatory training, agriculture, and water and land management. The NGOs would appreciate more intensive training from WFP. Further, different NGOs are managing different components, which limits the opportunity for synergies.
174. SF: There is a positive and constructive relationship between WFP and the DPE in the MoPME. WFP has seconded staff to a Project Liaison Unit (PLU) within the DPE. The purpose of the PLU is to strengthen the technical capacity of DPE staff to implement the SF programme by providing input on management, procurement, quality control, logistics, M&E, and alternative modalities. The CO’s ongoing initiative to make
44
technical assistance from WFP’s CoE in Brazil available to MoPME staff on policy development has been an important element in moving that process along.
175. ER: According to LGED upazila engineers the ER programme is only one of 10 to 20 managed by their teams of three to five staff. There was not enough time for the ET to discuss all of these programmes with LGED, but several were discussed in Dhaka with representatives involved in these activities. A transparent discussion is advised on whether the LGED upazila staff have sufficient resources and staff to effectively implement all of these programmes, and if not, how to improve this situation.
176. Use of assessment to build capacity: Capacity building is guided by a WFP process designed to assist MoPME and DPE track their progress towards capacity building goals for the SF programme. Beginning in 2012, WFP and government have conducted an annual assessment that uses a four-point scale to analyse five dimensions of capacity development: strong policy frameworks, stable funding and budgeting; strong institutional capacity and coordination, sound programme design and implementation; and strong community participation and ownership. The annual exercise highlights progress in institutional capacity development and areas that need further strengthening.
177. Funding: The ET finds that WFP’s corporate funding approach is not meeting the CO’s need to respond to the changing donor and development context of Bangladesh and the concomitant changes this requires in WFP’s role. In the current approach, WFP works according to a CP approved by institutional donors who are members of the EB. Funding for the CP is raised by the same institutional donors at their central or CO level. In reality, the country-based donors do not necessarily buy into the CP strategy and, while they value WFP as a partner, have different funding priorities. This leaves CPs underfunded and requires COs to develop funding proposals for individual CP components and development-centred innovative pilots and research.
178. As WFP Bangladesh transitions from food assistance to technical assistance and capacity building, the adequacy of WFP corporate funding arrangements for COs in a development context needs to be examined. Bangladesh is on the road to becoming a lower MIC, and donor funding for traditional WFP programmes is waning. To remain a viable partner for government and donors, WFP Bangladesh needs to be able to capitalise on its expertise in safety nets and food and nutrition security and develop research and innovative approaches to addressing poverty, especially among the ultra-poor. This is an investment both in Bangladesh and in WFP’s ability to evolve and remain relevant in a changing development context. Remaining relevant will also require the CO to develop a new strategic approach in the next CP, one that leverages WFP’s partnership with government to strengthen efficiency and effectiveness in safety net programmes. The CO has demonstrated its ability to develop and implement relevant approaches, and requires adequate funding and technical support – as well as resources to build proof of concept for research and a solid evidence base that will allow WFP to advocate for improvements to government safety net programmes. This should be accompanied by a review of current staffing and a skill inventory to ensure that the CO either has or can obtain the requisite skills to meet the new challenges.
179. WFP headquarters should conduct a corporate review of funding instruments and consider providing a funding mechanism that invests in research into new approaches, designing programmes, and proposal development. There is also a potential role for WFP to act as a partner with government in preparing proposals to international financial institutions. Funding is needed to support dedicated technical staff to develop these new approaches. Presently, the CO has to dedicate a great deal of time to
45
engaging with donors on proposals; if staff and funding are available, it could prioritise resources to focus on working with donors and government on mutual priorities.
180. At RB level, leadership could be provided in supporting the CO to better understand the donor landscape, and supporting CO analysis of opportunities and positioning for funding. As an example: the RB recently provided a short-term consultant to advise the CO on EU funding, which proved to be a valuable input. This type of expert support is needed for all donors, and for exploring new donors and developing a resource strategy for the next CP that involves government, donors, and the private sector. This is currently beyond the resources and staff capacity of the CO.
active, regular and well-attended by WFP. In Kurigram the civil surgeon calls monthly meetings of all organisations working in nutrition.
182. WFP has been supportive of the joint partnership of REACH, and is noted as a champion and active voice for the multi-sectoral message on nutrition. However, collaboration with other United Nations actors and development partners is inconsistent. There is scope for stronger WFP advocacy of the nutrition agenda—clearly linking the rationale to prevent and treat acute malnutrition with the stunting discussion and advancing WFP’s successful results on rice fortification, TMRI, nutrition-sensitive safety net support and effective BCC models. WFP could do more from its position and in the REACH platform, LCGs and Nutrition Cluster to link its field successes to the broader agenda and enhance advocacy for its approaches.
183. Government leadership: IMCN: Nutrition leadership in Bangladesh is currently weak and there is an assumption that the nutrition situation will improve along with reductions in poverty and the improved economy. While there is some basis for this argument, undernutrition rates remain excessively high and WFP’s undernutrition maps, as well as DHS data (2011 and 2014), clearly illustrate that undernutrition is not simply associated with poverty but cuts across all socioeconomic groups. The lack of consensus on addressing undernutrition means that the widespread undernutrition that exists is not being adequately addressed. Yet, there are recent positive developments in the government’s interest in addressing acute malnutrition:
the IPHN of the MoHFW released national CMAM guidelines in 2012155 that, although not fully supportive of a national TSFP approach, include this model as an option in places to respond to high rates of GAM;
in 2013, WFP signed its first MOU with the MoHFW to confirm its partnership with the National Nutrition Service (NNS) to deliver services to treat and prevent MAM;
United Nations Children’s Fund (UNICEF) has been increasing engagement with MoHFW since 2013 in management of SAM and is currently expanding its support to equip facilities to treat SAM from less than five hospitals to 134 facilities such as district hospitals, medical colleges, upazila health complexes; 156 and
155 Ministry of Health and Family Welfare. 2011. 156 Though there is still no engagement of UNICEF at the community clinic level, which depends on NGO support and faces challenges with RUTF supply.
46
the health sector has committed itself in the HNPSDP157 to mainstreaming nutrition through the NNS, attested to by the deployment of 64 district nutrition officers in 2015, supported by UNICEF’s district nutrition support officers who have recently been posted to sit within the civil surgeon’s office in each district.
184. Development partners are advocating for a continued focus on nutrition and improved leadership but are largely concentrating the argument on stunting in alignment with the global push for a focus on stunting in the post-MDG agenda, the UN Secretary General's Zero Hunger Challenge, and on alignment with the SUN agenda. While this is an important and highly relevant approach in Bangladesh, the high GAM rates in the country seem to be left out of the discussion and are sidelined in the current advocacy initiatives around nutrition, leaving a critical nutrition problem unaddressed.
185. SF: The school feeding programme has strong ownership by government and has been included in phase three of the government Primary Education Development Programme (PEDP-III) by the MoPME.
186. WFP and GAIN were requested by the MoPME in 2013 to provide technical support to develop a National School Feeding policy and a related strategy to support institutional changes. To help guide this process, the MoPME has agreed in principle to establish a secretariat within the ministry to provide overall guidance on school feeding policy issues. Current plans are for WFP, GAIN, and CoE to facilitate consultations with ministries for the development of the draft policy. This will be followed by a high-level meeting with Ministers and other stakeholders in October 2015 to present the draft policy, and presentation of the policy to the Cabinet for approval by the end of 2015. Institutionalisation is important not only to achieve national goals, but to ensure that school feeding becomes sustainable. Otherwise, school feeding’s status as a multi-year project limits opportunities for long-term institutional changes.
187. As a positive factor, LGED has demonstrated its strong engagement with and commitment to the ER component, not only through its commitment of staff time but through its willingness to fund participant wages.
188. Partner capacity: IMCN: Challenges for full integration of TSFP at district and community clinic levels as government handover takes place include issues related to revising staff TORs and workloads, and the need for directorates to provide operationalisable directives to clinic staff to conduct TSFP activities. SF: The handover of school feeding from WFP to government has increased the monitoring and reporting responsibilities of district EOs and AUEOs, who already have a heavy workload. District education offices do not have adequate staff, time, training or transportation to monitor the programme as closely as WFP has done, which poses a potential risk to maintaining the programme quality.
189. Gender: The majority of ER beneficiaries are women and receive extensive training on a wide variety of topics. Yet, over 90 percent of NGO field staff are male, which likely limits their ability to provide quality training on women’s empowerment and birth control. Conversely, for IMCN the frontline workers who interact with the beneficiaries are predominantly young, female CNWs/CNVs. There has been discussion to encourage NGOs to recruit male CNWs/CNVs to mobilise and create awareness amongst male youth and religious/community leaders.
157 Health, Population and Nutrition Sector Development Programme 2011-16
47
190. Trusting relationships: WFP’s collaboration and good standing with partners has allowed for positive programme results and impact. According to WFP’s main government counterpart, the External Relations Division of the Ministry of Finance, the government views WFP as a trusted partner. This was confirmed by other government counterparts in interviews at the central and district levels. Donors share this view and note that WFP maintains good communication at all levels. One donor noted that WFP handles issues of leakage quickly and efficiently and is responsive to the donor’s initiatives on gender, protection and other priorities. The donor also noted that WFP is well-positioned and good at working in a complex environment. WFP approaches problems holistically but would benefit from drawing on the expertise of other UN agencies. Another advantage of working with WFP cited by a donor is that WFP is respected by government and has a long record of capacity building.
191. WFP is highly regarded in Bangladesh for its longstanding presence, coverage and programming. Its operational coverage has contracted considerably, to where it is smaller now than some of the major NGOs, yet it retains influence due to its history and the ongoing quality of its technical work. WFP is leveraging its reputation and technical skills into policy influence (e.g., VGD, school feeding) at Ministry level and a capacity-building role with Government, which positions it well for the future.
192. WFP’s capacity to respond to natural disasters is seen by government to be an important factor in sustaining development gains by addressing the most vulnerable.
Advancement toward MIC
193. The CP will need to be redesigned to prepare for Bangladesh as an MIC. The government is financially able to take over or support a significant portion of current CP activities but requires technical assistance and ongoing capacity building to ensure quality, efficiency, and continuous improvement. Continuing field operations in a few key areas such as Cox’s Bazar would provide an operational presence and a base for scaling up. These changes are likely to require fewer sub-offices and staff with different technical skills.
Conclusions and Recommendations
3.1 Overall Assessment
Relevance, Coherence and Appropriateness 194. The CP as designed is relevant to the needs of poor people, especially the ultra-poor,
vulnerable populations and those living in remote areas. It includes a small urban slum programme that provides IMCN services and school feeding. As the poor in urban slums are highly vulnerable and have less access to services than in rural areas, it is relevant for WFP to be providing services and exploring strategies and partners for future programming in slums that will consider analyses of gender and synergies between activity streams. While CP design for ER is relevant to the need for income opportunities among the ultra-poor and improved infrastructure for communities, its design lacks clarity on how to achieve the greatest impact in target communities. This should be based on more in-depth, regional analysis of the factors affecting need (i.e., climate change) and the most relevant design for meeting community infrastructure needs.
195. The design and objectives of the CP are an appropriate response to support the government’s development goals in line with UNDAF. WFP is working toward improved collaboration with FAO and UNDP and greater operational alignment with government partners at strategic and operational levels. The ET concludes that CP activities are highly relevant in target communities and found that they are also considered relevant by cooperating partners, programme participants and
48
stakeholders on the ground. The CP is internally coherent with the relevant WFP corporate policies on nutrition, SF, DRM, gender and humanitarian protection.
196. The policy and programme environment is changing as Bangladesh aims to become a MIC by 2021. The CO’s increasing focus on technical assistance and capacity building to improve policies, processes and the effectiveness of government safety nets is highly relevant to the policy and programme context. WFP’s support to the government goal to institutionalise a school feeding programme by providing technical support to develop a policy framework and guidelines is an example of this.
197. As a result of changes in the policy and programme context, donor priorities have shifted, resource levels have declined, and donors are less interested in funding traditional CP designs. WFP is in the position of having to strategize for long-term changes in the country with short-term funding and staff contracts. WFP’s future relevance in the next CP and in Bangladesh will in part depend upon its ability to test innovative approaches and to build government capacity to implement its safety net programmes more efficiently and effectively. Further, WFP can assist with reform, influence the design of new programmes using evidence generated by WFP pilots, and provide support to policy decisions. The CO has demonstrated its willingness and ability to test approaches of interest to government, such as the hot school meals pilot, in order to provide evidence-based research for government decision-making and donors’ funding decisions. The CO has also demonstrated its ability to initiate and promote valuable and relevant research and innovation; the activities under SGSN (TMRI, TUP-N, FSUP, FSUP-N) demonstrate opportunities for WFP Bangladesh to assist government to continue to address the needs of the poor and ultra-poor in an evolving national context. WFP’s partnerships to develop and test a locally produced complementary food supplement and to produce fortified rice locally are approaches relevant to Bangladesh’s needs and food production capacity.
198. In the future it is expected that government will be better able to access soft loans for development from international financial institutions (IFIs) but will still have limited capacity to improve the effectiveness and efficiency of its safety net programs. WFP will need to adapt its strategies to this changing funding environment to remain a partner of choice for government, where WFP can provide technical or implementation assistance to government programmes financed by loans from the IFIs. In order to continue to innovate, the CO needs more flexible funding support and technical expertise from WFP HQ and technical support from RB. This would be an investment both in Bangladesh and in WFP’s ability to evolve and remain relevant within a changing development context.
199. WFP has been laying the groundwork for the handover of SF since 2009. WFP brought in a consultant to look at ways to hand over biscuit production, but thus far, government management has encountered challenges with the government bureaucracy and DPE’s lack of authority to approve new processes. There is a continuing role for WFP technical support to help government realise the new policy directives for SF (once they are in place) and to improve programme management. If hot meals move forward, WFP should forge new partnerships with the Ministry of Agriculture, FAO and other stakeholders to support effective implementation.
Efficiency 200. CP targets for implementation were largely met, though components 1 and 4 required
that targets be scaled down due to WFP funding shortfalls and both corporate and government policy changes.
49
201. Geographic targeting is based on poverty maps that WFP helped to develop. Use of these maps has helped to ensure that WFP programmes are implemented in the poorest areas, though there is little synergy between components. IMCN has faced the most targeting challenges: geographical targeting was based on areas of high food insecurity and poverty rather than undernutrition, though the two are not necessarily coincidental; new national CMAM guidelines required WFP to target based on MUAC criteria, rather than the planned WFH criteria, greatly reducing the number of eligible participants, and reducing the capacity of the intervention to address the high GAM rates that are based on WFH. In addition, there is no discussion on addressing the high WFH GAM rates in the country. IMCN has increasingly been concentrated where WFP has secured funding, often based on donor geographic priorities rather than WFP needs analysis. Donor preferences for funding certain geographic areas or specific groups, rather than the CP as a whole, have posed a significant challenge to targeting and efficiency in the current CP.
202. The supply of commodities for TSFP has been adequate to date, with no major pipeline breaks. The school biscuit delivery reached or exceeded its beneficiary targets but did not achieve its target feeding days due to delays in biscuit production and political unrest across the country in late 2014 and early 2015 caused some disruptions or delays in the delivery of services.
203. The budget was funded at 66 percent to mid-term with support from 18 donors. However, as a result of the changing context, funding has declined precipitously from 2012: as of mid-2015 24 percent of the CP is funded and the anticipated shortfall is in the range of 50-69 percent for the remaining life of the CP.
204. In terms of cost-effectiveness, the CP is somewhat unique in that government is providing financial or material support to some interventions, and sharing costs on others. For example, the government is providing one-half of the wheat requirements for the WFP-supported school biscuit programme. WFP must raise donor funds for associated SF costs, including WFP and NGO staff, logistics and other needs. It is anticipated that the government will be able to contribute full cost recovery in the next few years. In the case of ER, WFP and the government jointly fund the programme. After WFP funding for ER was curtailed in 2014, the government expanded its contribution. As of 2015 WFP no longer funds the food, and wages are paid in cash by the government, though WFP must raise donor funds for associated costs in ER. Government expansion of its financial support of these programmes is a notable achievement and demonstrates government ownership of these programmes. Such effective partnerships with government and good relations with a variety of ministries have enabled WFP to continue to serve participants. In addition, WFP support to government and private sector efforts towards market-based solutions to locally produce fortified products used in IMCN and VGD programmes may increase overall cost-effectiveness of these interventions. While it is too early to assess any efficiency gains in the hot meals pilot and the new VGD package, any analysis should take any improvements to the health, well-being and productivity of participants into account. In addition, efficiency is enhanced with WFP considered a trusted partner by the government and other stakeholders, who feel that it is transparent in its communications and that its presence helps ensure accountability in programmes.
205. While donor HQs and EB members approve CP components, country-level offices of the same donors have different funding priorities for development projects. In order to access local donor funds, WFP must negotiate with individual donors, which often requires preparing programme proposals, a time-and staff-intensive activity. The
50
absence of funding and expert staff to develop new approaches, explore opportunities in conjunction with new partnerships, and prepare proposals for WFP as well as government leaves the CO development programmes reliant on local fundraising, which is for specific interventions and often short-term. It reduces overall efficiency of staff operations and does not support continuity or sustainability.
Effectiveness 206. The TSFP achieved recovery rates well above Sphere Standards and showed significant
reductions in wasting among children 6-23 months as compared to the control group. Participants have learnt new knowledge and skills through BCC and show a significant increase in basic household nutrition, hygiene and sanitation practices. BCC messages are received but their effectiveness is limited by the inability of young mothers to apply their new knowledge and influence household practices and cultural norms, as young mothers are not the decision-makers in the household. Attendance rates for WFP-assisted schools are high but slightly below control and government-assisted schools, and declined slightly between 2012 and 2014. Lower attendance can be attributed to difficulties in meeting school-related costs such as clothes and educational materials. Some of the decrease may also be attributed to a decrease in the value of social transfers (e.g., school biscuit, stipend) as wages and prices rise. ER Plus support has enabled women and their families to increase household food consumption and invest in productive assets. Nearly two-thirds of ER-only communities have improved capacity to manage climatic shocks and risks. The increased handover of WFP activities has created a significant challenge for government, with some impact on efficiency, as noted in the handover of IMCN activities in Satkhira.
207. Key informants in government and donor agencies stated that WFP provides accountability for programme funds and helps to ensure partner accountability. WFP can continue to play a role in providing technical assistance to government in the tracking and monitoring of transparent and effective disbursement of development grants and loans.
208. Stakeholder feedback to the ET indicated that more complex and comprehensive outcome measurement will be needed as WFP supports and scales up innovative approaches to programming. For example, one donor commented that WFP’s M&E has improved, but that WFP needs to improve its in-house M&E capacity, particularly in measuring outcomes. More comprehensive M&E will enable WFP to provide evidence of the efficacy of new approaches, helping to attract donors and partners. In addition, meaningful measurement of capacity building, a focus of WFP Bangladesh in the future, depends on good outcome measurement.
Impact 209. WFP is highly regarded in Bangladesh for its longstanding presence, coverage, and
technical expertise, and its partnership with the government. While its direct programme coverage has contracted considerably, in part due to funding challenges and due to its strategic repositioning as the country’s needs evolve, its technical expertise is valued by the government for programme guidance and capacity building. WFP is leveraging its experience and skills into policy influence (e.g., VGD, school feeding) at Ministry level and a longer-term capacity-building role with Government.
210. WFP also contributes to improving the effectiveness of programmes implemented by government and other stakeholders through its collaborative design and implementation of new concepts and approaches, and by providing evidence around new approaches that enable government and other stakeholders to weigh the costs and benefits when making their programme decisions.
51
211. High-level government officials told the ET that they see the pilots, research and capacity building undertaken by WFP as helping government to develop better ways through which resources can be channelled to the poor. Government is learning through WFP technical assistance about when and how to transfer resources using different modalities. Donors see WFP’s capacity building work with BBS as having the potential to have a great impact on Bangladesh, particularly if WFP raises the level of engagement with BBS even more. The TMRI research generated some of the most significant evidence to date on which transfer modalities work best for the ultra-poor.
212. WFP is an active voice advocating a multi-sectoral approach to nutrition. There is scope for a stronger WFP voice to push forward the nutrition agenda and to link its successful results on rice fortification, TMRI, nutrition sensitive safety net support and BCC models in the field, to the broader agenda, and to enhance advocacy for its work and approaches. To do so, collaboration with other development partners needs to be more consistent. In ER, WFP needs more internal agriculture and environmental management expertise in order to effectively engage with other stakeholders, which would provide opportunities to engage in various water and land management programmes in its operational areas that are so critical to ensuring the rights and well-being of the ultra-poor.
213. WFP can play an important role in Bangladesh’s future development by providing government with proven research and effective models of approaches that achieve results. WFP can be a partner to government in designing and implementing programmes that are focused, well-targeted, and accountable for results. This has been demonstrated with TMRI and EFS in Cox’s Bazar.
Sustainability and connectedness 214. WFP’s work with government at the central level is aimed at helping ensure the
sustainability of programmes. WFP’s capacity building with various ministries includes: transfer of training and skills to monitor and implement programmes; work with government ministries to institutionalise school feeding through a national policy framework; support to BBS; and engagement with government to test new approaches such as the hot school meals pilot and TMRI. All are examples of how WFP’s work supports sustainability through strengthening local capacity to manage development programmes. WFP and government are using the NCI tool effectively to highlight strengths and weaknesses, track progress and identify areas where progress is slow.
215. For IMCN, capacity building, mentoring and supportive supervision are required down to the community clinic level to assist government staff to take on the IMCN activities. Such activities will take several years to enable confident government ownership and management, and to address various challenges related to adequate staffing on the ground, clear directives and job descriptions. For SF, there is strong government ownership and engagement, with complete national ownership planned for the end of 2016. The monitoring and support of government SF programmes has increasingly become the responsibility of already over-burdened district education staff, which poses a significant challenge to government’s ability to maintain programme quality. Advocacy at the ministry level will be essential to support the IMCN and SF field staff to give the programmes the attention they require.
216. Many of WFP’s contributions are sustainable as they are part of or closely connected to government‘s own programmes, and some are financially supported in part by government. This reflects WFP’s focus on supporting government to strengthen its safety net programmes, which includes contributions to the development of the first NSSS and reform of the VGD programme.
52
217. Some donors endorse WFP’s approach to capacity building of local counterparts as a good approach to ensuring sustainability. Government key informants see more scope for WFP capacity building support in the future, particularly in the area of safety nets and responding to natural disasters.
Gender 218. Components 1, 3, and 4 primarily target poor and ultra-poor women as their participants.
Component 2 targets girls and boys equally to promote gender parity in primary school education and also includes messages to parents and teachers on the importance of educating girls and avoiding early marriage for girls. Enrolment is near or at gender parity, with girls registering slightly higher attendance rates than boys. Female SMC members were observed to participate and be outspoken, indicating that selection and training in the SF component has yielded results. Female participants comprised about three-quarters of the food distribution recipients in 2013. The ER Plus activity provides a cash grant to women only, or to the wives of male participants.
219. The EFS pilot focused on the empowerment of ultra-poor women through the provision of a cash grant for investment, other financial support, and training in a variety of topics. The result was increased mobility, a stronger role for women in household decision-making, and more engagement by husbands in domestic tasks. The success of the pilot paved the way for a much larger second phase of the programme.
220. The IMCN and ER components in particular, and EFS of SGSN component, demonstrate a need for more gender-specific approaches in their activities. This includes better targeting and greater inclusion of men for IMCN BCC messages. WFP has pioneered many gender-supportive inputs at work sites, including child care centres and separate latrines for women; however, in ER and EFS, there is a need to recruit more female NGO staff for training and activities that target women, and to provide training to women and men on how to more effectively communicate with one another. WFP has requested cooperating partners to recruit more female staff, and should follow up vigorously on this.
3.2. Recommendations
There are approximately one and a half years remaining in CP 200243. Therefore, short-term operational recommendations apply to the remainder of this CP (June 2015-December 2016), while medium-term recommendations can be viewed as looking forward to the next CP (to be established January 2017). Work on strategic recommendations should begin during the current CP and be incorporated, if appropriate, into the design of the next and beyond (medium- to long-term). The target group for each recommendation is named within each recommendation description. Operational recommendations
1: Consolidate IMCN activities in the current targeted focus areas (Kurigram, Satkhira, Cox’s Bazar and urban slums) and further develop the capacity of government and community clinics to manage the programme in Kurigram and Satkhira. (CO, short-term): There is an opportunity for greater collaboration with MoHFW and reinforcement of nutrition mainstreaming at the field level in the areas where WFP is currently working in Kurigram and Satkhira.
It is clear that there is a lack of central-level government commitment to a national TSFP and that there are areas of greater and lesser need and programme relevance. However, the government and donors are interested in supporting approaches that can be shown to work and that respond to a clear need. It is therefore recommended that WFP consolidate IMCN
53
activities in its current targeted focus areas with the aim of further developing the capacity of the government health system at district level (including DNOs) and community clinics to manage the programme, while advocating for support and ownership by government (i.e., IPHN) at central level. This response should be clearly articulated and based on evidence (e.g., GAM rates, analysis of underlying factors) that demonstrates need (in the absence of other relevant nutritional support) and local level government commitment. In addition, WFP should work to demonstrate the effectiveness of this approach by effectively using available M&E data for advocacy, or through a research study if necessary.
The remainder of the CP should be spent working to build government capacity to take over activities, to include them in the next health sector programme and NNS Operational Plan, and to demonstrate effectiveness of the approach. This will allow WFP to begin to scale back direct implementation in the next CP and assume a role providing supportive supervision to a government-led programme.
2: Reassess the duration of ER activities and the quality of trainings to enhance sustainability and synergy (CO, medium-term): ER has provided an excellent opportunity for women to earn and manage their own cash, which has improved their status within their households and community. Acting on evidence that two years is not enough to ensure significant impact on beneficiary households, in 2014 WFP and the government initiated ER Plus, which provides a third year of support for participants and a cash grant for investment. The aim of the third year for ER Plus beneficiaries is to help them to sustain the progress made during the first two years. WFP should engage with government to ensure adequate support to and monitoring of ER Plus participants, particularly by diversifying their sources of income, and, per IFPRI’s initial findings, by investing in nonfarm self-employment that can help them overcome poverty. As ER Plus is in its early stages, it is important to ensure that a good evidence base is generated on which to assess results and its potential contribution to more effective ways to build resilience among poor households.
Since the programme has worked in some upazilas for six years or more it should revisit these and facilitate a higher-quality mapping exercise to include the following: 1) what ER has accomplished; 2) similar work completed through other programmes by LGED and/or the Water Development Board; 3) the relative impact of the ER programme; 4) outstanding work that needs to be done to address the most critical ongoing challenges; and 5) the role of the ER component in these efforts. Based on this, the CO can have a discussion with Dhaka and upazila LGED staff to improve the site and activity selection process.
The training provided to ER beneficiaries should be reviewed with respect to the quality and delivery of the messages. As the ER component has the broadest reach, it could be seen as a primary entry point for other components in rural areas. For example, the nutrition training could discuss screening and treatment for acute malnutrition as well as the causes of malnutrition. The programme should facilitate higher-quality training so that communities and their leaders (at ward, union, and upazila level) can do more detailed land and water management analysis and mapping, and engage with other programmes that affect their environments and agricultural productivity.
3: Strengthen staff technical expertise, and invest in capacity building for field staff (CO, RB and HQ, medium term): As WFP Bangladesh’s role evolves to focus more on technical assistance, capacity building, policy guidance, and testing new approaches to improve the effectiveness and efficiency of government safety net programmes, it must ensure its internal capacity and specific technical expertise at the CO level through training and recruitment. Designing innovative approaches in nutrition,
54
income generation among the ultra-poor, or the work in urban slums requires specific conceptual and programme design skills, the ability to identify and work with good partners, and drawing on international expertise and experience. Where the CO does not already have these skills, it will need to acquire them. For example, for ER, WFP will need CO, HQ and regional staff with sufficient technical expertise and/or experience to better engage with LGED, FAO, the Department of Agriculture and other larger water and land management programmes. Some initial funding from donors or WFP HQ will be needed to provide the CO with sufficient capacity to develop new programmes for funding, and to assist government with developing proposals that include financing of WFP technical support. As WFP proceeds to transition from direct implementation to direct assistance, it will need to conduct a thorough risk analysis to identify potential problems linked to technical and staff capacity so that handover strategies include ways to mitigate critical risks to programmes.
As a complementary activity to strengthening WFP’s internal expertise, the SGSN government field staff also need capacity building and empowerment. There is a need for continuous training and orientation of government staff due to their frequent moves, and for adequate logistical and staff support to enable government staff to monitor their new programme responsibilities. While it is recognised that these require budget support, WFP can advocate with government to ensure that adequate staff and resources for ensuring quality control are priorities for sustainability.
4: Continue technical support and policy guidance to the government to support the institutionalisation of school feeding (CO, short and medium term):
The hot school meals pilot supported by WFP is of great interest to government and other stakeholders, and WFP has successfully engaged with several ministries and partners to implement the pilot. WFP is highly experienced in hot school meals and needs to ensure that the evidence on the costs and benefits of the hot meal approach is robust and well-documented so that the government, donors and other stakeholders are able to understand and evaluate school feeding and make an informed decision as to the design of future school feeding programmes. WFP’s engagement with the CoE in Brazil is a relevant resource and potential model for WFP Bangladesh, as it has made an important contribution to analysing the governance, institutional arrangements and financial arrangements needed to institutionalise school feeding with an eye to greater efficiency.
In conjunction with its continuing handover of schools to government, WFP should advocate for increased staff and material support to district education offices to ensure they have the resources to adequately monitor the programme and ensure the ongoing quality of operations. Finally, since a central purpose of the biscuit is to attract and retain children in school, palatability is important. WFP and government should explore options and costs related to enhancing the texture and varying the taste of the biscuit.
5: Take action with government partners to improve community participation and ownership (CO, medium to long term): WFP (with PSU) should support the DWA to develop a sustainable system of engaging VGD women in monitoring beneficiary entitlements, delivery of resources, NGO service delivery and beneficiary selection at the ward level under the leadership of the female ward members, and ensure regular reporting to the union VGD committee/UWAO. WFP, in partnership with the DWA, should continue to promote a formal mechanism for regularly reviewing and reporting the performance of the VGD at the DWA and its field offices.
55
6: Continue to build evidence for future programming, including revising the M&E system and promoting the learning from research projects (CO, medium-term): Based on a review of the 2014 outcome survey and the 2014 IFPRI report, “Enhancing Resilience to Natural Disasters and the Effects of Climate Change Program,” which assessed the impact of ER Plus, there is a need to simplify and improve the M&E system in order to build a strategic evidence base for future programming. WFP needs to focus on how it expects to impact people’s lives, limit data collection and analysis to those variables, and improve its capacity to do robust outcome measurement. WFP also has a role in promoting learning from research projects, such as by working with government partners to adapt the TMRI findings for the design of new and ongoing safety net programmes, and by undertaking pilots and research to further generate evidence for new approaches to support social protection policy. The CO should select the two or three most appropriate and successful pilots, ensure that strong outcome data are collected to build a good evidence base, and focus on scale-up.
Strategic recommendations
7: Develop clear strategy for supporting nutritional outcomes through a comprehensive multi-sectoral approach (CO, medium- to long-term): WFP should develop a clear strategic approach for nutrition as part of its next Country Strategy and in collaboration with key nutrition actors (e.g., UNICEF, REACH, government partners, donors), in line with the Common Narrative. This would clarify WFP’s role moving forward, better position WFP vis-a-vis government and donors, and provide an opportunity to incorporate greater programme synergies into the next CP. Partners see a clear role for WFP leadership in BCC and safety nets for mainstreaming the prevention of undernutrition. The CO will require technical and conceptual support to develop this strategic approach, which should include:
stronger articulation and advocacy for WFP’s support to the broader national and global agenda linking acute malnutrition and stunting (e.g., SUN, Sustainable Development Goals); elaboration of WFP’s role in nutrition-sensitive approaches; evidence to demonstrate the effectiveness of IMCN activities and how these fit within the broader agenda;
addressing underlying factors through continued integration of nutrition across all activities: in ER (especially considering the opportunity of the ready-made audience for BCC in the six months of FFT), work with MoWCA in social protection with increased focus on appropriate target groups and adding effective BCC or additional relevant support (e.g., exploring the current ideas around maternity allowance); and
collaboration with development partners and working groups, and strengthening WFP’s voice and contribution in innovative joint programming and advocacy, particularly in urban work, cash-based approaches, social protection, and BCC.
8: Enhance the BCC strategy to address undernutrition of children under two, integrating new approaches and learning from TMRI and pilots (CO, short and medium-term): There is a need for WFP to further develop its BCC model and adapt modules for men and community elites, as well as find innovative ways to deliver BCC, e.g., different venues and timing for men and for urban residents, and enhanced use of demonstration, theatre, and drama formats that are easily interpreted and understood by village communities. There is a need to work with the whole community: older people are influential mothers-in-law and fathers-in-law, and younger people will become parents and may be able to influence household hygiene and sanitation practices and nutritious
56
diets. The focus should be on addressing the barriers to changes in practice. This will require a dedicated staff member and BCC specialist.
The knowledge and experience from TMRI, TUP-N and EFS need to be harnessed in ongoing country programme activities, and opportunities should be examined to understand in which circumstances BCC can be used in safety net programmes. Stakeholders within Bangladesh see a distinct competitive advantage for WFP here based on the success of the TMRI, and WFP has a clear mandate as the UNDAF lead for BCC within Pillar 4. WFP’s ongoing pilots of BCC with cash and food should be added to the learning around what works in terms of BCC within IMCN, and BCC with ER, in order to build a body of evidence. BCC models will need effective monitoring; there is a need to design a robust monitoring system with appropriate process and outcome indicators that can demonstrate success. WFP’s BCC strategy should be linked with the MoHFW Nutrition Advocacy and Communication Strategy, supported by REACH (soon to be released), and developed in cooperation with UNICEF to make sure it capitalises on national campaigns and approaches.
9: Examine effective approaches and options for urban programming and develop a clear urban strategy to address the high rates of undernutrition and school drop-outs amongst the urban poor (CO, medium-term): Further in-depth discussions with urban slum residents, as well as extensive engagement in stakeholder forums, participation in learning groups, and exchanges with other countries, will be necessary to develop partnerships and a clear urban strategy for WFP. Activities should be designed in collaboration with the community, community organisations, UNICEF, UNDP and other key actors looking to expand that can offer complementary activities, entry points and access. The current school biscuit activity in collaboration with BRAC schools offers one such entry point and a means of engaging parents for discussion and collaboration while providing a service they value. In addition to the community-based work with BRAC, potential options to explore include workplace-based programming and targeting. There is also potential to further investigate options with non-traditional partners (e.g., workers unions where they exist, or the private sector). WFP’s work on rice fortification with the private sector partner DBL in the garment factories is one example of innovative programming that might offer an entry point to build on. It will be essential to consider the childcare environment and potential options in the urban environment (such as crèches, communal childcare). There is a need to pull together and capitalise on the existing strands of WFP’s work and consider WFP’s comparative advantage to adapt its experience in the urban context in partnership with others.
10: Review instruments used to fund the CO development portfolio (WFP HQ and RB, medium- to long-term). As WFP Bangladesh transitions from food assistance to technical assistance and capacity building, the adequacy of WFP corporate funding arrangements for COs in a development context needs to be examined. WFP headquarters should conduct a corporate review of funding instruments and consider the provision of a funding mechanism that invests in research into new approaches, programme design, and proposal development. The RB should provide leadership in supporting the CO to better understand the donor landscape, and support CO analysis of donor opportunities and positioning for future funding. Such funding also needs to support dedicated technical staff to develop these new approaches.
As Bangladesh becomes a MIC and new funding avenues open up for government through the IFIs, there is future scope for WFP to leverage its technical expertise to assist government to prepare funding proposals to the development banks for programmes that include WFP as a partner.
57
Annexes
Annex 1: TOR
58
59
60
61
62
63
64
65
66
67
68
69
70
71
72
Annex 2: Methodology
This annex expands on the methods discussion in Section 1.1 of the main report. It is organized as follows:
OECD criteria/principles
Gender considerations
Ethical safeguards
Timeline of key evaluation activities
Outcome survey: detailed methodology o Objectives o Methods o Sampling o Survey implementation and quality control o Analysis o Limitations and challenges
Qualitative study o Methods o Analysis and triangulation
OECD criteria/principles
The ET applied the OECD/DAC criteria158 of relevance, effectiveness, efficiency, impact and sustainability, defined as follows:
Relevance: The extent to which CP objectives and activities are suited to the priorities and policies of the target population, donors and other stakeholders. This principle is discussed primarily in section 2.1.
Effectiveness: A measure of the extent to which CP activities attain outcomes and objectives, and the major factors influencing achievements. This principle is discussed primarily in sections 2.2 and 2.3.
Efficiency: Efficiency refers to the use of inputs in relation to qualitative and quantitative outputs. It is also an economic term that signifies cost-efficiency of assistance. This generally requires comparing alternative approaches to achieving the same outputs. This principle is discussed primarily in sections 2.2 and 2.3.
Impact: This principle assesses the positive and negative changes produced by the CP – directly or indirectly, intended or unintended. This principle is discussed primarily in sections 2.2 and 2.3.
Sustainability: Sustainability measures whether the benefits of a CP activity are likely to continue after donor funding is withdrawn or the programme ends, and considers whether impacts are environmentally and financially sustainable. This principle is discussed primarily in sections 2.2 and 2.3.
Section 3.1 provides summary conclusions on CP performance in relation to these five criteria.
158 OECD. 1991.
73
Gender considerations
To understand the dynamics of gender equity and to verify the nature and extent of women’s participation in the CP, the qualitative team interviewed women in focus groups and as well as individual female key informants. The SF interviews were conducted with mixed gender groups but female participation was observed, and individual female SMC members and female teachers were interviewed as well. The ET ensured that marginalised groups were included by visiting project sites in remote areas and interviewing women and men from the poorest households. The tools integrated gender considerations, which allowed the ET to understand levels of gender equity, gender discrimination and power relations between males and females. The ET members also observed gender interactions and communication to ensure that women were not being discouraged from giving their opinions.
Gender balance was also addressed in the household survey, which entailed an interview with a knowledgeable household member (at least 18 years old): household head, ER beneficiary, household member responsible for decision making, and/or mothers/caregivers of U5 children. The survey ensured inclusion of female participants by requiring that at least one of the respondents be female, even if not household head. This requirement could often be satisfied with the second part of the questionnaire, which asked the child’s mother or caregiver for information on children’s health, feeding practices and anthropometric measurements (height, MUAC and weight) for U5 children and health information on women of reproductive age.159
Ethical safeguards
Both quantitative and qualitative data collection processes observed ethical principles for evaluators of competence, integrity/honesty, informed consent, systematic inquiry, and respect for people and responsibilities for public welfare. 160
Ethical safeguards for data quality and confidentiality were put in place in the quantitative survey through the quality control and monitoring system (described later in this annex). The processes for monitoring work quality, and the principle that all work was subject to quality review, were explained to all interviewers/ enumerators and supervisors before the fieldwork; this approach was successful in ensuring that survey staff worked diligently, competently and honestly to obtain data that accurately represented the information respondents provided. Confidentiality was protected for all data collected, and the evaluators and enumerators were trained to ensure that respondents were aware of their rights as human subjects such as the right to informed consent and the right to decline the interview. It was determined that there were no political or cultural considerations in the context that necessitated extra sensitivities for the interviews.
Because the stakeholders in WFP operations might have differing perspectives on the process of change and their respective roles in it, and differing levels of sensitivity in sharing their perspectives, it was anticipated that different people may respond to the same evaluation techniques in different ways. The ET thus sought to respect and faithfully represent the complete range of viewpoints, values, beliefs, needs and interests among the stakeholders. The ET tailored techniques as necessary to ensure ethical and systematic inquiry of the evidence, which reflects consideration of the principle of responsibility for public welfare.
159 WFP Bangladesh. 2014. Outcome Survey Manual. 160 American Evaluation Association. 2004. Guiding Principles for Evaluators.
74
Timeline of key evaluation activities
Quantitative Outcome Survey Date Remarks Household outcome survey: Data collectors training 13-23 Oct 2014 Field practice and problem discussion 20-21 Oct 2014 Data collection team movement 25 Oct 2014 Field work 27 Oct – 17 Dec
2014 Original plan 26 Oct. Changed to 27 Oct due to sudden political strike on 26 Oct
Data entry begins 18 Dec 2014 TANGO received raw dataset from Mitra 23 Jan 2015 Original plan 16 Jan 2015 TANGO received final dataset from Mitra 11 Feb 2015 TANGO found some data
entry errors and sent back dataset for corrections
Data analysis 12 Feb – 3 Mar 2015
School Feeding outcome survey: Data collectors training 20-21 Oct 2014 Field practice and problem discussion 25-26 Oct 2014 Original plan for field
practice 23 Oct. Changed due to school holiday 23 Oct and weekend 24 Oct
Data collection team movement 27 Oct 2014 Original plan 26 Oct. Changed due to school holiday on 23 Oct and sudden political strike on 26
Oct Field work 28 Oct – 17 Dec
2014 Original plan to start 27 Oct
Data entry 18 Dec 2014 TANGO received final dataset from Mitra 16 Jan 2015 Data analysis 17 Jan – 11 Feb
2015
Qualitative evaluation Inception package submitted 16 Mar 2015 Original due date 12 Jan
2015; changed in order to incorporate outcome survey initial findings
Fieldwork 19 Apr – 8 May 2015
Original plans for Feb 2015; rescheduled due to political insecurity
Data analysis, triangulation and report drafting 9 May – 28 June 2015
Draft evaluation report due 14 June 2015 Final evaluation report due 29 June 2015
Outcome survey: detailed methodology
Objectives: The outcome survey was designed to measure CP outcomes by comparing the pre-programme and current situation of targeted households, communities and institutions including primary schools. More specifically, the study gathered data to assess changes in food security, nutrition, livelihood, community resilience and primary school education since the baseline survey conducted in 2012. It also focused on the
75
household socio-economic profiles and overall context of the CP areas to sufficiently inform the evaluation. The outcome survey had the following specific objectives:
Generate mid-intervention outcome data for the individual CP components according to the indicators in the CP logframe (original and revised). The methods were also designed to understand any synergistic outcomes when more than one programme component was implemented in the same geographical location.
Generate required information/analysis to inform the evaluation, and to understand the CP’s contribution to achieving higher-level impacts including the UNDAF and MDG goals.
Provide information/analysis for different geographical regions – north, coastal and hilly regions/districts – and to identify the critical factors contributing to the differences between regions.
Highlight the socio-economic context and other associated factors (e.g., previous assistance) critical for achieving CP outcomes in different regions.
Methods: To estimate the actual contribution of the CP, the study design introduced double difference or difference-in-differences methods to compare intervention and control groups (first difference) before and after the intervention (second difference). The baseline survey conducted in 2012 identified the first difference and the follow-up outcome survey assessed the second difference from the same treatment/control groups.
Both a household survey and a primary school survey were conducted. The household survey was administered to programme and control areas to generate information on the current status of the households regarding food security, nutrition, livelihood, natural vulnerability and education. The baseline survey questionnaires remained almost unchanged for the current survey, and identical analysis techniques were followed for each outcome indicator. Anthropometric measurements of children U5 and PLW were taken to assess their nutritional status.
The outcome survey also entailed a panel survey for SF and ER. This allowed repeated observations (once at baseline, once at two and half years of programme implementation) on the same sample units (households, community, schools) in programme and control groups for a single set of outcome indicators.
Sampling: For ER and SF, outcome survey data were collected by surveying the same households and the same schools from the baseline study (i.e., by conducting a panel survey). For the IMCN and “convergence” areas (i.e., areas where both ER and IMCN are implemented), data were collected via a cross-sectional survey of households sampled from the same sampled clusters (communities) used in the baseline study. The sample design used in the baseline study is described below. Table 7 shows the sample size for IMCN and ER programme components by region; Table 8 shows this by district.
Table 7: Sample size for IMCN and ER programme components, by region Program Component
Region # Unions # Villages /Union
# HHs /Village
# HHs Ben Control Ben Control Total
ER only North Coast
10 10
10 10
3 3
20 20
600 600
600 600
1,200 1,200
ER + IMCN North Coast
5 1
5 1
5 5
20 20
500 100
500 100
1.000 200
IMCN only North Coast
10 10
10 10
2 2
20 20
400 400
400 400
800 800
Total 46 46 2,600 2,600 5,200
76
The total sample was designed to permit a statistically valid comparison across two geographic regions for households (North and Coast), and across four regions for schools (North, Coast, Hilly and Dhaka). For the household survey, the sample size computation was based on the anthropometric indicator of stunting. This provided a conservative estimate of the required household sample size. Considering that not all households have U5 children, the household sample size was inflated to ensure that a sufficient number of U5 children were measured.
Overall, the household survey is stratified across programme component, region, and comparison groups for 12 strata in total: the programme components are broken into three categories (ER-only, IMCN-only, and ER+IMCN), there are two regions (North and Coastal), and the survey design includes both a programme beneficiary household group and a comparison group that did not receive any ER or IMCN programming. The minimum required sample size for each stratum was computed to be able to detect a difference of 25 percent in the stunting rate161 (from the national rate of 41 percent) with 90 percent confidence and 80 percent power, assuming a design effect of 2.0.
The parameters for calculating sample size for SF were chosen to detect a change from 80 percent attendance162 to 90 percent (proposed target rate), with 95 percent confidence, 80 percent power, and a design effect of 2.0. The sample for each component was chosen in three stages: selection of unions, selection of villages, and selection of households. Each process is described below, in turn.
Selection of ER-only and control households
The same households from the same clusters selected for the baseline ER-only sample were interviewed for the outcome survey. For the baseline, WFP supplied the list of unions to receive the ER-only component. This list was split into two regions (North and Coast) to generate two sample frames. Ten unions were selected from the North sample frame, and ten unions were selected from the Coast sample frame, both using PPS sampling technique. Villages (clusters) were selected in the second stage of sampling. WFP supplied the list of participating households in the selected unions, identifying villages in which these households reside. From the list for each union, three villages were randomly selected with PPS based on the number of participating households in a village. In this way, 30 villages were selected for each of the North and Coast regions. Twenty households from a village were randomly selected from the village’s list of ER-only households. If a village had less than 20 households, additional households were selected from the adjacent village. In this way, 600 ER-only households were selected from the North and 600 from the Coast.
Ten control unions were selected using PPS for the 10 selected ER unions in a region. For each selected ER union, its neighbouring union was chosen as the control union. Three villages were then randomly selected from each of the selected control unions. Households from a control village were using random walk procedure: upon reaching a selected village, the interview team went to a central point in the village and spun a pen to randomly select the direction of travel. The interviewers visited every consecutive
161 Note: the sample size was estimated for the baseline. The national stunting rate 41% was considered as the base value for baseline sample size calculation. It was assumed that the project would be able to reduce the stunting rate by 25 percent at the endline. WFP decided to conduct the outcome survey in the same villages using the same sample size as the baseline. This is why we did not revise the sample size calculation for the outcome survey using the actual stunting rate that was obtained from the baseline. 162 WFP. 2013. State of School Feeding Worldwide.
77
household one after another along the selected path until they had interviewed 20 households. If the interviewers reached the border of the village before completing 20 interviews, they turned right and continued in that direction in the same fashion until they completed 20 interviews. To find 20 households in the control village that were comparable those interviewed in the ER union, every household visited in the control village completed an ER screening form. If the screening data indicated that the household met at least three of the eligibility criteria for ER beneficiaries, the household proceeded with the full survey questionnaire. In this fashion, total 600 households were selected from the North region and 600 from the Coast as control groups.
Selection of IMCN-only and control households
The same villages that were selected for IMCN-only components at baseline were also selected for the outcome survey. For the baseline, WFP supplied the list of unions to receive the IMCN-only component. This list was split into two regions (North and Coast) to generate two sample frames. Ten unions were selected from the North sample frame, and ten unions were selected from the Coast sample frame, both using PPS sampling technique. Two villages were then randomly selected from each of the selected IMCN-only unions. In this way, 20 villages were selected for each of the North and Coast regions. In consultation with the WFP, non-intervention upazilas were identified in the non-intervention districts. Ten control unions were selected for the IMCN-only component using the list of unions in the non-intervention upazilas. Villages in control unions were selected following the same procedure used for IMCN-only. Twenty households each from the intervention and control unions were selected by applying the random-walk method described in the previous section. Twenty households from each of the intervention and control households with pregnant/lactating mother/children U5 were selected for the IMCN component. In this way, 400 households from the North and 400 households from the Coast were selected for the IMCN-only sample. Similarly, 400 households from the North and 400 households from the Coast were selected for the control group.
Selection of ER+IMCN and control households
It is not possible to do a panel survey for an ER+IMCN sample, so the households for ER+IMCN were resampled from the ER beneficiary household list for the outcome survey using the same sample villages as baseline. At baseline, WFP identified six unions which are covered under IMCN and are also covered under the new round of ER implementation (starting in 2013). Of the six identified ER+IMCN unions, five were from the North region and one was from the Coast. For each intervention union, its nearest union (which is not under the programme) was chosen as a control union. In this way, six control unions were selected for the ER + IMCN sample. Five villages were selected randomly from each of the intervention and control unions. Twenty households from each of the selected intervention villages were selected randomly from the WFP-supplied list of ER beneficiary households that had pregnant/lactating mother/children U5. A new random sample of the households was selected from the ER beneficiary list for the ER+IMCN outcome survey. The 20 control households from each of the selected control villages were selected using the random-walk method and when the households met the additional criterion of ER beneficiary with pregnant/lactating mother/children U5. In this way, 500 intervention households in the North and 100 in the Coast were selected, as were 500 control households in the North and 100 from the Coast.
78
Table 8: Sample size (#households) for IMCN, ER and ER+IMCN, by district Programme Component
North Coast Total Programme Control Programme Control
For the school survey, the outcome survey revisited the same sample of 936 schools selected for the baseline. The data collection team was not able to collect information from two of the original 936 schools sampled at baseline because they were not functional at the time of mid-term outcome survey. See Table 9 for the sample size of schools by district.
Table 9: Sample size (# schools) for SF survey, by district Region WFP SF Control WFP Govt. SF Control Govt. Total
Programme Control Programme Control Coast 104 (Barguna,
Survey implementation and quality control: TANGO International, with extensive experience in implementing outcome and impact studies of food security, nutrition, education and livelihood programmes, provided the conceptual lead to finalise the survey design and tools and to ensure appropriate implementation. TANGO provided technical supervision to the WFP-contracted local survey agency, Mitra & Associates, to implement the field survey. TANGO had overall responsibility to monitor the quality of the data collector training and field work, analyse the survey data and write the evaluation report, integrating key findings from the outcome survey. WFP provided logistics and administrative support as required.
Quality control was conducted by four two-person teams (one male and one female member) for the household survey, and by six individuals for the school survey. Quality
79
control checks included physically verifying whether the interviewers completed the questionnaires and checking that the interview was conducted with the right respondent in the identified household, and that the applicable questions were administered. Quality control checking was undertaken both in the presence and absence of the interviewing teams.
The quality control officers also checked a sample of the non-response cases to see if these were reported as non-response for valid reasons. For any problems identified in the interviewing, the officer took appropriate measures to stop their recurrence. In addition to the quality control teams, senior staff from Mitra & Associates made field visits to monitor the fieldwork. The local firm generated field check tables during the fieldwork and on completion of the first phase to monitor and check quality. The quality control officer also prepared field check tables on some key variables selected by the Project Director. During briefing sessions in the field, the quality control officer discussed the results of the ‘key variables’ tables in detail, by team and by interviewer.
The TANGO Survey Specialist was present during the training session and closely observed the first week of data collection. He provided technical feedback in the training session as well as in the field during the data collection process.
Analysis: TANGO analysed household data using SPSS v20.0 and WHO Anthro-software, calculating secondary variables (asset indices, food consumption scores, coping strategy index) from primary variables where appropriate. Sampling weights were not adjusted because the sampling units were not distributed strictly following a stratified random sampling process. Every analysis was disaggregated by the two programme regions (North and Coast), WFP programme components (ER, IMCN, and IMCN+ER), and respondent type (beneficiary and control).
For each of the WFP indicators, variables that were calculated as a percentage, chi-square, and t-tests of significance were run between the beneficiary and control and the survey rounds. This tested for any significant difference between beneficiary and control groups at baseline and outcome survey. In the data presentation, the superscript “*” indicates a statistically significant difference between baseline and outcome and beneficiary and control. “**” indicates the difference is significant at 5%, and single “*” indicates significance at the 10% level. The difference-in-difference was also calculated for beneficiary and control groups based on the difference from the survey rounds.
The preliminary analysis was provided to the ET during the inception phase to inform the planning of the qualitative fieldwork component.
Limitations and challenges: There were no notable limitations to the data quality.
The main challenge of the quantitative data collection was related to finding the panel ER beneficiary households, and fortunately, this challenge did not affect data quality. The data collection team had to spend more time in the field than expected to find the ER sample households that were in the baseline sample list. To address this challenge, the data collection team made a plan prior to the day of the interview and communicated the plan to the implementing local NGOs in advance so that they could identify the panel households and respondents. Mitra, the local firm contracted to conduct the outcome survey, has extensive experience with panel surveys and they applied their practical experience to adjust to this common challenge.
In the follow-up it was also challenging to locate some schools of the SF sample from the baseline, as some were non-government-assisted schools. At the time of the outcome survey, two of these schools were not functioning, and were thus not included. Even
80
though the school sample size was smaller than baseline, the sample was adequate and the data quality was not affected.
Political volatility was another constraint that could have potentially interrupted the scheduled field work and team movement in the study areas. After the training was completed, data collection was delayed one day due to a sudden strike, but the data collection teams were still able to reach the survey areas one day later and data collection was completed on schedule.
Another challenge related to the training of the more than 100 enumerators. It was challenging to ensure consistent and equivalent delivery of the training lessons, which were conducted by different facilitators in two separate venues. The TANGO Survey Specialist overcame this difficulty by spending time in both of the venues and clarifying the same issues in the same way. Another training-related challenge was that WFP staff were not present in the training sessions to answer programme-related questions, and they were not in the field to observe data collection and monitoring. This did not compromise data quality, because Mitra staff who had been involved in the baseline survey were able to answer programmatic questions; moreover, most of the quantitative questions were generic and similar to the DHS or other national level surveys.
Qualitative study
Methods: The ET placed a strong emphasis on stakeholder participation during the collection of primary data. Data collection methods included: structured in-depth interviews, semi-structured interviews, FGDs, KIIs, direct observation, and interactive participatory tools. The tools, or topical outlines, developed for the qualitative study addressed a broad range of topics that helped to ensure the assessment, findings and recommendations were based on a comprehensive understanding of different perspectives, including gender.
The evaluation team and the CO agreed upon the following criteria to select visits at the district level:
Inclusion in the quantitative outcome survey sampling frame, and thus, determined by the ET as an area of interest for follow-up after consideration of the survey results;
Ability to view different components’ operations (and complementarity) in one district: Coverage of all CP components (IMCN, SF, ER and SGSN) within the district (though parts of the district may have one component (e.g., ER only) or two components combined (e.g., IMCN+SF). This gives the team the opportunity to observe the impact of differing levels of programme intensity and types of complementary outputs/activities.
Size of the operations: the sample focuses on sites with higher numbers of beneficiaries reached and tonnage distributed relative to other sites in the CP;
Sites visited during the final evaluation of the previous CP (this applies to Kurigram and Gaibandha, and gives the team some basis to determine what may have changed since the previous CP);
Number and importance of cooperating partners (by size of programme and number of different operations involved);
Duration of WFP assistance during evaluation period;
Accessibility: security, quality of infrastructure (roads/markets, etc.), good versus difficult access, including remote locations;
81
Geographic targeting and coverage of the operations over the time period of 2010-2014; and
Practical considerations for reaching sites within allotted days, e.g., accessible and within budget.
Using these criteria, the number of districts to sample during this evaluation was determined through iterative discussions with the CO. Finalization of district and site selection (upazila and union levels) was made based on consultations with the CO and field offices. Distance between sites determined how many sites the team was able to visit within each district. At the request of the CO, the ET allocated more days to interviews in Dhaka with central government officials, partners, donors, and other stakeholders, to ensure that the ET got input that reflects WFP’s current and future emphasis on capacity building at the central government level. Thus, days in country were balanced between field visits and interviews in Dhaka.
Given the purposive sampling strategy, the ET ensured that the most significant cooperating partners (local government representatives and district government officials, NGOs) were interviewed and that the team visited beneficiaries of all programme components. Based on analysis of internal and external stakeholders, the ET worked with the CO to prioritise meetings with those who were most critical to the delivery of CP activities. Within each of the sites visited, the ET conducted FGDs with beneficiaries and KIIs with government officials and others knowledgeable about programme activities. Upon the completion of fieldwork, the team conducted internal and external debriefing sessions to share the preliminary findings with WFP staff and external stakeholders for validation of the results. The evaluation team presented preliminary findings and insights in a way that the key audience could utilise.
Analysis and triangulation: The ET analysed the data collected on a regular basis and implemented systematic checks on accuracy, consistency, reliability, and validity of the collected data to ensure data quality. Data were analysed per component for consistency across sources, patterns or deviations in reported outcomes, and with the aim of triangulating data from different sources and capturing diverse stakeholder and beneficiary viewpoints. The triangulation of results with the quantitative data offered credible information about the appropriateness and effectiveness of the operation to targeted groups and provided results for particular groups of stakeholders. The primary qualitative data helped the evaluation team to explain why and how results were or were not achieved.
The final phase of the evaluation was dedicated to presenting findings and recommendations in an evaluation report that responds to the objectives and evaluation questions. The evaluation report underwent quality control by the TANGO evaluation manager before circulating to CO, the RB and OEV for review and comments.
82
Annex 3: Output analysis additional figures and tables
Table 10: CP alignment with government strategy and policy
Strategy/ policy Relevance to CP Time Key Objectives (Relevant to CP)
National Strategy for Accelerated Poverty Reduction II (NSAPR)163 and Bangladesh: Poverty Reduction Strategy Paper (PRSP)
All components Food security and nutrition Education Resilience to natural disasters Climate change adaptation Government safety net reforms for
the ultra-poor
2009-2011
Social protection is a pillar of the strategy and reforming safety nets for the ultra-poor, which is supported through CP Component 4.
Perspective Plan 2010-2021 (Making Vision 2021 a Reality) and Sixth Five-Year Plan164
Poverty and income Education Nutrition/health Gender equality and women’s
empowerment
2010-2021 & 2011-2015
The government’s long-term development strategy will be implemented through two medium-term development plans, the first of which is called the Sixth Five-Year Plan (sixth in the series of plans since 1973). Goal to reach MIC status by 2021.
Health Nutrition Population Sector Development Programme (HNPSDP)165
Component 1 Health Nutrition M&E Gender
2011-2016
The HNPSDP is relevant to the CP to mainstream nutrition services with regular health services.166 The priority is to improve access to and utilization of HNP services in order to reduce morbidity/mortality and population growth rate, and to improve nutritional status of women and children.
National Food Policy Plan of Action167 and Country Investment Plan (CIP)168
All components Food security Nutrition Agriculture Government action for food
availability
2008-2015
The Ministry of Food (MoF) is the convener of the multi-sectoral steering committee of 13 ministries to monitor the implementation of the National Food Policy Plan of Action and its investment arm, the CIP (2011 -2015), which is aligned with the food security content of the Sixth Five-Year Plan.169 The CIP outlines investments to increase and diversify food availability/access in a sustainable manner.
163 Ministry of Planning, General Economics Division. 2009; WFP Bangladesh. 2011. 164 Ministry of Planning, General Economics Division. 2012. 165 http://www.mohfw.gov.bd/index.php?option=com_content&view=article&id=166&Itemid=150&lang=en 166 WFP Bangladesh. 2011. Project Document 167 Ministry of Food and Disaster Management. 2006. 168 Ministry of Food and Disaster Management. 2011. 169 WFP Bangladesh. 2011. Project Document
83
Table 10: CP alignment with government strategy and policy
Strategy/ policy Relevance to CP Time Key Objectives (Relevant to CP)
The main objective of the National Agriculture Policy is to ensure food and nutrition security for all by creating employment opportunities through increased crop production and diversification of agriculture programs.
National Education Policy171 and Primary Education Development Programme (PEDP-III) under the MoPME
Component 2 Education Gender
Est. 2010
Component 2 contributes to the government’s goal of achieving universal primary education by 2015. Through Component 4, WFP will assist the Ministry of Primary and Mass Education with launching its school feeding programme in poverty-prone areas with the aim to hand over WFP sites and scale-up those of the government during the CP.172
Implemented by the Ministry of Disaster Management and Relief, the CDMP Phase II is a collaborative initiative to strengthen the national disaster management capacities, DRR and climate change adaptation, and to improve response and recovery through a comprehensive approach.
National Action Plan for the National Women Development Policy174
Component 4 and cross-cutting Gender equality
Est. 2011 As part of the VGD Programmes of CP Component 4, WFP will support the priorities of the Ministry of Women and Children Affairs175
Bangladesh Demographic and Health Survey (DHS)176
Components 1-3 Poverty Health Nutrition Gender equality
2011
Monitor the population and health situation and socioeconomic factors in Bangladesh including:
Household characteristics
Fertility, family planning, reproductive health
Maternal and child health, nutrition
Women’s empowerment
170 http://newsfrombangladesh.net/new/top-news/15340-cabinet-clears-national-agriculture-policy-13 171 Ministry of Education. 2010. 172 WFP Bangladesh. 2011. Project Document 173 Ministry of Disaster Management and Relief. 2010. 174 http://www.mowca.gov.bd/ 175 WFP Bangladesh. 2011. Project Document 176 NIPORT, Mitra and Associates, and ICF International. 2013.
84
Table 11: Beneficiary numbers 2012, IMCN Beneficiary numbers – Planned versus actual
Planned Actuals % achieved Beneficiary Category Male Female Total Male Female Total
2012 -IMCN
Children 6 to 23 months given food under TSFP 75,000 71,500 146,500 18,100 34,973 53,073 36.2%
Children 24 to 59 months given food under TSFP 75,000 71,500 146,500 18,175 17,600 35,775 24.4%
Children 6 to 23 months given food under BSFP 8,000 8,000 16,000 4,068 3,754 7,822 48.9%
Participants in FFT (Beneficiaries/caregivers who received messages/training on health and nutrition)177
N/A 363000 363000 N/A 133057 133057 36.7%
Sub total Year 1178 158,000 584,000 742,000 53757 79300 133,057 34.7%
Revised Planned and Actual 146,500 216500 363,000 53,757 79,300 133,057 36.7% Source: WFP Bangladesh CP 200243 SPR 2012 unless marked with an asterisk (*), which indicates that the figures are from the Beneficiaries_Plan_VS-Actual file provided by the CO
Table 12: Beneficiary numbers 2013, IMCN Beneficiary numbers - Planned versus actual 179
Planned Actuals % achieved Beneficiary Category Male Female Total Male Female Total
2013 -
IMCN
Children 6 to 23 months given food under TSFP 65,925 65,925 131,850 21,026 29,134 50,160 38.0%
Children 24 to 59 months given food under TSFP 58,600 58,600 117,200 13,911 16,150 30,061 25.6%
Children 6 to 23 months given food under BSFP 21,975 21,975 43,950 6302 5,640 11,942 27.2%
Source: WFP Bangladesh CP 200243 SPR 2013 unless marked with an asterisk (*), which indicates that the figures are from the Beneficiaries_Plan_VS-Actual file provided by the CO
177 Under this component, women received training on health and nutrition. 178 The total number of beneficiaries includes all targeted persons who were provided with WFP food during the reporting period - either as a recipient/participant in one or more of the following groups, or from a household food ration distributed to one of these recipients/participants 179 Programme of Work 2012-2013 indicates the total planned figure to be 166,010 beneficiaries (not disaggregated by sex) 180 Under this component, women received training on health and nutrition. 181 The total number of beneficiaries includes all targeted persons who were provided with WFP food during the reporting period - either as a recipient/participant in one or more of the following groups, or from a household food ration distributed to one of these recipients/participants 182 Programme of Work 2012-2013 indicates the total planned figure to be 166,010 beneficiaries (not disaggregated by sex)
85
Table 13: Beneficiary numbers 2014, IMCN
4 Beneficiary numbers - Planned versus actual
Planned Actuals % achieved Beneficiary Category Male Female Total Male Female Total
2014 - IMCN
Children 6 to 23 months given food under TSFP 17,200 17,200 34,400 12,208 19,282 31,490 91.5%
Children 24 to 59 months given food under TSFP 25,800 30,100 55,900 6,013 11,805 17,818 31.9%
Children 6 to 23 months given food under BSFP 3,800 4,200 8,000 - - - 0.0%
Source: WFP Bangladesh CP 200243 SPR 2014 unless marked with an asterisk (*), which indicates that the figures are from the Beneficiaries_Plan_VS-Actual file provided by the CO
Table 14: Beneficiary numbers 2012-2014, SF
Beneficiary numbers - Planned versus actual
Planned Actuals % achieved Male Female Total Male Female Total
2012 - SF
Children receiving SF 539,000 561,000 1,100,000 532,284 555,352 1,087,636 98.9%
Subtotal Year 1186 539000 561000 1100000 528873 558733 1087606 98.9%
Sub total Year 3188 490,000 510,000 1000000 448,199 472,284 920,483 92.0%
183 Under this component, women received training on health and nutrition. 184 The total number of beneficiaries includes all targeted persons who were provided with WFP food during the reporting period - either as a recipient/participant in one or more of the following groups, or from a household food ration distributed to one of these recipients/participants. 185 Bangladesh CP 200243 Operational Plan 2014 indicates planned total beneficiaries to be 71,324. 186 The total number of beneficiaries includes all targeted persons who were provided with WFP food during the reporting period - either as a recipient/participant in one or more of the following groups, or from a household food ration distributed to one of these recipients/participants. 187 Programme of Work 2012-2013 indicates planned total figure to be 807,177 beneficiaries.
86
Beneficiary numbers - Planned versus actual
Planned Actuals % achieved Male Female Total Male Female Total
Revised Planned and Actual* 449,497 456,489 905,986 444,674 470,501 915,175 101.0% Source: WFP Bangladesh CP 200243 SPR 2012-2014 unless marked with an asterisk (*), which indicates that the figures are from the Beneficiaries_Plan_VS-Actual file provided by the CO
Table 15: Beneficiary numbers 2012-2014, ER
Beneficiary numbers - Planned versus actual
Planned Actuals % achieved Activity Male Female Total Male Female Total
Sub total Year 3193 266,960 277,856 544,816 246,192 256,238 502,430 92.2%
188 The total number of beneficiaries includes all targeted persons who were provided with WFP food during the reporting period - either as a recipient/participant in one or more of the following groups, or from a household food ration distributed to one of these recipients/participants. 189 The total number of beneficiaries includes all targeted persons who were provided with WFP food during the reporting period - either as a recipient/participant in one or more of the following groups, or from a household food ration distributed to one of these recipients/participants. 190 Programme of Work 2012-2013 indicates planned total figure to be 84,500 beneficiaries. 191 In 2013, WFP introduced a new "cash transfer for investment" which provided 18,000 ER households either a cash grant or a monthly allowance in order to promote longer term resilience and food security. 192 The total number of beneficiaries includes all targeted persons who were provided with WFP food during the reporting period - either as a recipient/participant in one or more of the following groups, or from a household food ration distributed to one of these recipients/participants
87
Beneficiary numbers - Planned versus actual
Planned Actuals % achieved Activity Male Female Total Male Female Total
Revised Planned & Actual* 194 10,403 68,900 79303 10,403 68,900 79,303 100.0% Source: WFP Bangladesh CP 200243 SPR 2012-2014 unless marked with an asterisk (*), which indicates that the figures are from the Beneficiaries_Plan_VS-Actual file provided by the CO
Table 16: Beneficiary numbers 2012-2014, SGSN Beneficiary numbers - Planned versus actual
Planned Actuals % achieved Beneficiary Category Male Female Total Male Female Total
2012
- SGSN
Participants in Food For Training195 - 26,500 26,500 - 31,549 31,549 119.1%
Sub total Year 3202 36,200 37,300 73,500 11,515 11,985 23,500 32.0%
193 The total number of beneficiaries includes all targeted persons who were provided with WFP food during the reporting period - either as a recipient/participant in one or more of the following groups, or from a household food ration distributed to one of these recipients/participants 194 Bangladesh CP 200243 Operational Plan 2014 indicates total planned to be 320,535 beneficiaries. 195 Training was provided to women in a number of areas (life skills, disaster preparedness, income generation, etc.) and participants received food (e.g., rice, pulses, and vegetable oil) and/or cash. 196 The total number of beneficiaries includes all targeted persons who were provided with WFP food during the reporting period - either as a recipient/participant in one or more of the following groups, or from a household food ration distributed to one of these recipients/participants. 197 Revised Planned and Actual figures include FSUP, EFS, and TMRI and only include female beneficiaries 198 Through the Enhancing Food Security project under Component 4, WFP supported the empowerment of vulnerable wone in ultra-poor families through training in income-generating activities. 199 The total number of beneficiaries includes all targeted persons who were provided with WFP food during the reporting period - either as a recipient/participant in one or more of the following groups, or from a household food ration distributed to one of these recipients/participants. 200 Revised Planned and Actual figures include EFS and TMRI and only include female beneficiaries 201 Through the Enhancing Food Security project under Component 4, WFP supported the empowerment of vulnerable women in ultra-poor families through training in income-generating activities.
88
Beneficiary numbers - Planned versus actual
Planned Actuals % achieved Beneficiary Category Male Female Total Male Female Total
Revised Planned & Actual* 203 - 4,700 4,700 - 4,700 4,700 100.0% Source: WFP Bangladesh CP 200243 SPR 2012-2014 unless marked with an asterisk (*), which indicates that the figures are from personal correspondence with Ezaz Nabi WFP Bangladesh) on 6 February 2015
Table 17: Food distributions by component Food distributions - Planned versus actual in metric tonnes
Figure 15: Food distributions planned, actual, and percent achieved by year component
202 The total number of beneficiaries includes all targeted persons who were provided with WFP food during the reporting period - either as a recipient/participant in one or more of the following groups, or from a household food ration distributed to one of these recipients/participants. 203 Revised Planned and Actual figures include EFS, and TMRI and only include female beneficiaries.
*percent change from baseline to outcome is statistically significant at <0.05 level. **percent change from baseline to outcome is statistically significant at <0.10 level.
14.6%
20.0%
14.1%12.8%
Program Control
BMI (<18.5) of pregnant women
Baseline Outcome
-35.8% change*
33.1% 32.8%
29.7%
35.4%
Program Control
BMI (<18.5) of lactating women
Baseline Outcome
4.3%
8.3%8.2%
5.8%
Program Control
MUAC (<21cm of pregnant women
Baseline Outcome
6.4% 6.6%
8.4%
6.9%
Program Control
MUAC (<12cm) of lactating women
Baseline Outcome
95
Figure 18: Proportion of children 6-23 months of age who receive foods from four or more food groups
39.8%
42.5%
39.1%
41.2%
Program Control
Baseline Outcome
Figure 17: Percent of HHs following at least three or more basic nutrition practices (excluding WASH indicators)
*percent change from baseline to outcome is statistically significant at <0.05 level.
31.0%
39.4%
47.1%48.9%
Program Control
Baseline Outcome
52% change*
24% change*
96
Table 22: IMCN original indicators for minimum acceptable and complimentary diets for children 6-23 months, by region
Evaluation Period and Response
ER+IMCN IMCN Only All
North Coastal All North Coastal All North Coastal All
Program Control Program Control Program Control Program Control Program Control Program Control Program Control Program Control Program Control
Proportion of caretakers who provided minimum acceptable complementary diet to their 6-23 months children
Average monthly Per Capita Income: Income calculated based on the gross monthly income by the respondent directly (not available for baseline) (deflated)
ER only 1,140 1,140 1,025 1,025 115
ER+IMCN 1,070 1,070 1,286 1,286 (217)
IMCN only 1,637 1,637 1,710 1,710 (73)
All 1,277 1,277 1,296 1,296 (19)
Average monthly income (Tk) per HH: Income calculated based on the gross monthly income by the respondent directly (not available for baseline) (deflated)
ER only 4,654 4,654 4,139 4,139 515
ER+IMCN 5,467 5,467 5,781 5,781 (315)
IMCN only 7,580 7,580 8,165 8,165 (585)
All 5,742 5,742 5,757 5,757 (15)
Average monthly Per Capita Income: Income calculated based on the annual income from different livelihood activities (Baseline methodology) (deflated)
ER only 953 1,133 180 19% 0.000 1,029 1,014 (16) -2% 0.629 196 0.000
Average monthly income (Tk) per HH: Income calculated based on the annual income from different livelihood activities (Baseline methodology) (deflated)
ER only 3,756 4,191 435 12% 4,042 3,521 (521) -13% 956
Satkhira: A survey conducted in February 2014 (inter-harvest period) by international partner NGO, ACF,205 in four upazilas of Satkhira district found a serious prevalence of GAM at 13.8 percent206 in the areas where WFP, its partner Shushilan, and ACF are working to support government with prevention and treatment of acute malnutrition in response to the waterlogging for 2011. Prevalence of acute malnutrition using MUAC was 2.8 percent.207 ACF’s nutrition causal analysis noted that the households more at risk of acute malnutrition come from the lower quartile of income (impoverished households) and the predominant feature of these households is their reliance on daily labour and wages, which are unreliable and result in low household diet diversity. ACF recommended continuation of nutrition programming to address MAM/SAM in Satkhira. They also proposed advocacy for the change of admission criteria to include WFH in CMAM at the national level to ensure that children requiring treatment are admitted and that children, specifically boys and older children, are not excluded from treatment.208
Kurigram: A recent Integrated Food Security Phase Classification (IPC) assessment placed Kurigram in Phase 4 (emergency) with stunting levels in the district at 46.5 percent, GAM 13.5 percent and low birth weight (LBW) 26.5 percent in the MICS 2012/13.209
Cox’s Bazar: The MICS found levels of 49.5 percent stunting, 10.1 percent GAM and 32.3 percent LBW in Cox’s Bazar, and WFP plays a unique role in this district as one of the only agencies able to operate there amidst the complex issues pertaining to the refugee situation, in- and out-migration, and there is a clear rationale for support.
Urban: the urban context is considerably different from the rural one: urban mothers often work long hours outside the home in addition to their household labour requirements, therefore IYCF indicators (such as exclusive breastfeeding and regular complementary feeding) tend to be worse than in rural areas as mothers spend more time away from their infants and childcare issues are much more prominent when all family members are engaged in income generation outside the home; households rely on purchase for the majority of their food and have different coping mechanisms at their disposal in times of stress; community structures and support may also differ significantly. In order to implement IMCN more strategically in urban areas, WFP needs to undertake deeper analyses of the urban context, including investigation of livelihoods and the gendered roles and responsibilities of men and women around income-generation, household labour and childcare, and creatively develop an appropriate programming model. In the meantime, it is appropriate that WFP is currently approaching the urban environment with small-scale interventions; nevertheless, there is scope for greater joined up thinking and synergy between its own activity streams (e.g., rice fortification with garment factory industries, social protection, IMCN and SF).
205 The survey took place between 29 December 2013 and 3 February 2014. 206 Confidence interval: 10.8 - 17.3, 95 percent 207 Confidence interval: 1.6-4.8, 95 percent 208 ACF and Shushilan. 2014. Integrated Nutrition Survey in Four Upazila Satkhira District, supported by ECHO. January. 209 Pathey, Progotir. 2014. Multiple Indicator Cluster Survey 2012-2013, Key Findings. May.
114
Annex 6: Coherence with government, discussion by component
IMCN: The government is firmly promoting BCC in its approach to undernutrition, and such activities respond appropriately to analyses suggesting that deficiencies in IYCF and hygiene practices, as well as care and nutrition of PLW, are key underlying issues exacerbating the high rates of undernutrition. WFP alignment with the government’s BCC approach is strong, with WFP providing consistent messages on the NNS’ priority topics and reaching out beyond the health sector into the community. There is weaker alignment on TSFP, but with positive developments in this area. Despite the lack of prioritization for treatment of acute malnutrition at the national level, KIIs with senior health representatives at district and upazila level revealed strong local government commitment and engagement with the activities and a willingness to support and adopt the screening and BCC activities at the community clinic level.
It is important to note the disparity between the focus on stunting at the national level among the majority of development partners and expressed in the Common Narrative, versus WFP’s focus on MAM treatment, which has a low profile and is not well supported by donors, who see it as an emergency intervention that has limited space in a country moving towards MIC status. However, management of MAM is included in the NNS Operational Plan and National CMAM guidelines, albeit with a relatively low profile. Some emergency donors consider the number of children in the country who are acutely malnourished as a silent emergency that should not be ignored; meanwhile the country has experienced only small incremental improvements in nutrition, even with an improving economic profile. This is an opportunity for the CO to sustainably refine its role to address the continued needs of vulnerable populations in the future and MIC context.
SF: The SF programme is aligned with and well incorporated into the government’s priorities for pre-primary and primary education. SF is included in several key government documents, including phase three of the government’s PEDP-III under the MoPME, and was included in the NSAPR (2009-2011) and the National Education Policy (2010).
Despite the significant commitment of government to SF in national and sector policies, it has no SF policy and strategy. The SF activity is currently administered and funded as a project through the government’s annual development programme. Since 2012, WFP is, at government request, providing assistance to develop strategy and policy documents that will address sustainability, cost-effectiveness, coherence with other national frameworks, and institutionalise arrangements for implementation and monitoring. WFP’s CoE is providing technical support for this lengthy and complex process.
ER: WFP’s ER objectives are coherent with LGED’s operational guidelines, which outline three objectives for implementing ER activities in partnership with WFP:210
Build the resilience of households and communities vulnerable to extreme natural hazards and the effects of climate change.
Improve food and nutrition security of ultra-poor households in these communities.
Improve economic resilience in targeted ultra-poor household.
Although the ER component is aligned with the intent of the government’s vision for DRR and disaster response as set out in its Climate Change Strategy and Action Plan 210 Ministry of Local Government, Rural Development (LGRD) and Cooperatives. 2012.
115
2008, there seems to be little collaboration with the multitude of other climate change, disaster, land and water management programmes which have access to much greater resources, and most of which are implemented through LGED.211 Greater operational alignment is needed at the strategic level and operationally at district and upazila levels where LGED has other projects that could also align with ER strategic objectives to promote greater sustainability and impact. The community assets have limited sustainability due to a lack of resources for stabilisation and weak alignment with more extensive programmes.212
While WFP has had no significant relationship with the MoDMR since the early 1990s, the Ministry would welcome greater collaboration and capacity building. The MoDMR director views the CDMP213 as more policy-oriented and believes that WFP could have a role in supporting implementation capacity as it has more experience with women’s empowerment and VGD. WFP could pursue closer collaboration in its new role as co-chair of the Disaster and Emergency Response Local Consultative Group (DER LCG). As the training materials used by the government for the union and upazila DMCs, developed by CDMP, were consulted when ER developed its own materials, there may be greater alignment than was observable by the ET during the evaluation fieldwork.
SGSN: Social safety nets are a core area of the government’s poverty reduction strategy. Component 4, SGSN, directly supports government through technical assistance to strengthen safety net systems. This has been done through introducing appropriate interventions for improved food security and nutrition of the ultra-poor, such as integration of experiences gained from the WFP-implemented FSUP project into the government’s VGD programme.
TMRI findings are consistent with and reinforce the new NSSS. Quoting evidence from international experience the strategy highlights that cash transfers have significant advantages over food transfers in supporting food security through conventional social security schemes. The strategy groups VGD in the food security programmes that provide food as a benefit transfer while the government will in the long term consider converting all work-based food programmes into cash transfers.
211 Ministry of Environment and Forests. 2008. 212 Master Plan for Agricultural Development in the Southern Region; Bangladesh Delta Plan (BDB) 2100; Coastal Climate Resilient Infrastructure Project (CCRIP); Small scale Water Resource Program; UNDP Comprehensive Disaster Management Program; Blue Gold: Water Management for Development; Emergency Cyclone Recovery and Restoration project; World Fish 213 See: http://www.cdmp.org.bd/
116
Annex 7: Bibliography
ACF and Shushilan. 2014. Integrated Nutrition Survey in Four Upazila Satkhira District, supported by ECHO. January.
Ahmed, Akhter, John Hoddinott, Wahid Quabili, Shalini Roy and Esha Sraboni. 2015. Transfer Modality Research Initiative: Highlights of Impacts. IFPRI. 12 May. Dhaka, Bangladesh.
American Evaluation Association (AEA). 2004. Guiding Principles for Evaluators. Revised. Washington, D.C.
Bangladesh Bureau of Statistics (BBS) and World Bank. 2011. Household income and expenditure survey 2010: key findings and results, Dhaka. June.
Béné, Christophe and Naomi Hossain. 2014. Strategic review and reconceptualization of WFP’s disaster risk management and resilience portfolio in Bangladesh and its linkages to the efforts of government and other actors. IDS: University of Sussex, UK. November.
Directorate of Primary Education, Government of the People’s Republic of Bangladesh. 2013. Bangladesh Primary Education Stipends: A Qualitative Assessment. UNICEF and Power and Participation Research Centre. November.
EM-DAT, The International Disaster Database. 2014. Bangladesh Country Profile. Centre for Research on the Epidemiology of Disasters (CRED). Accessed at: www.emdat.be
Food Security Information Network, Resilience Measurement Technical Working Group. 2014. Technical Series No. 1: Resilience Measurement Principles. FAO and WFP. January.
GRID-Arendal. 2009. Impact of sea-level rise in Bangladesh. A centre collaborating with UNEP. Accessed at: http://www.grida.no/publications/vg/water2/page/3291.aspx
Hussain, Z. 2012. The Numbers Behind Bangladesh’s Goal of Middle Income Status by 2021. 19 December. Accessed at: http://blogs.worldbank.org/endpovertyinsouthasia/numbers-behind-bangladesh%E2%80%99s-goal-middle-income-status-2021
IFPRI. 2014. Enhancing Resilience to Natural Disasters and the Effects of Climate Change Program, IFPRI in collaboration with Data Analysis and Technical Assistance. 2 December (draft).
Karmalkar, A., C. McSweeney, M. New and G. Lizcano. 2010. UNDP Climate Change Country Profiles: Bangladesh. Accessed at: http://country-profiles.geog.ox.ac.uk/
Ministry of Disaster Management and Relief, Government of the People’s Republic of Bangladesh. 2010. Comprehensive Disaster Management Programme Phase II. Project Brief, Dhaka.
Ministry of Education, Government of the People’s Republic of Bangladesh. 2010. National Education Policy 2010, Dhaka.
Ministry of Environment and Forests, Government of the People’s Republic of Bangladesh. 2008. Bangladesh Climate Change Strategy And Action Plan 2008, Dhaka. September.
Ministry of Food and Disaster Management, Government of the People’s Republic of Bangladesh. 2011. Bangladesh Country Investment Plan, Dhaka. June.
———, Government of the People’s Republic of Bangladesh. 2006. National Food Policy and Plan of Action, Dhaka.
Ministry of Health and Family Welfare, Government of the People’s Republic of Bangladesh. 2011. National guidelines for community based management of acute malnutrition in Bangladesh. IPHN, Directorate General of Health Services, Dhaka. September.
Ministry of Local Government, Rural Development (LGRD) and Cooperatives, Local Government Division, Government of the People’s Republic of Bangladesh. 2012. Operational Guidelines for the Planning and Implementation of the World Food Programme-Assisted Enhancing Resilience (ER) to Disasters and the Effects of Climate Change of the WFP Country Programme Bangladesh 200243 (2012-2016), Dhaka.
Ministry of Planning, General Economics Division, Government of the People’s Republic of Bangladesh. 2012. Sixth Five Year Plan Fy2011-Fy2015. Part‐1: Strategic Directions and Policy Framework, Dhaka.
———, Government of the People’s Republic of Bangladesh. 2009. National Strategy for Accelerated Poverty Reduction II: FY 2009 – 11, Dhaka. December. [Note, also distributed by International Monetary Fund in 2012 as PRSP.]
National Institute of Population Research and Training (NIPORT), Mitra and Associates, and The DHS Program. 2015. Bangladesh Demographic and Health Survey 2014: key indicators. Dhaka, Bangladesh and Rockville, Maryland, USA. April.
NIPORT, Mitra and Associates, and ICF International. 2013. Bangladesh Demographic and Health Survey 2011. Dhaka, Bangladesh and Calverton, Maryland, USA. January.
NIPORT, MEASURE Evaluation, UNC-Chapel Hill and icddr,b. 2013. Bangladesh Urban Health Survey 2013. Preliminary Results. Funded by: US Agency for International Development (USAID) and Department for International Development (DFID).
OECD. 1991. Development Assistance Committee (DAC) Principles for Evaluation of Development Assistance.
Pathey, Progotir. 2014. Bangladesh Monitoring the situation of children and women: Multiple Indicator Cluster Survey 2012-2013, Key Findings. Government of the People’s Republic of Bangladesh, Bangladesh Bureau of Statistics (BBS) Statistics and Information Division (SID) of the Ministry of Planning, UNICEF. May.
Sabina, Nazme. 2014. Urban Food Security Analysis and Strategic Planning in Bangladesh.
Ullah, Akm Ahsan. 2011. Rohingya Refugees to Bangladesh: Historical Exclusions and Contemporary Marginalization, Journal of Immigrant & Refugee Studies, 9:2, 139-161, Routledge, London. DOI: 10.1080/15562948.2011.567149
United Nations Children’s Fund (UNICEF). 2014. All Children in School by 2015. Global Initiative on Out-of-School Children South Asia Regional Study.
United Nations Development Assistance Framework (UNDAF) Bangladesh. 2011. UNDAF Action Plan 2012-2016. United Nations Resident Coordinator’s Office, Dhaka.
United Nations Development Programme (UNDP). 2013. Human Development Reports.
United Nations Evaluation Group (UNEG). 2011. Integrating Human Rights and Gender Equality in Evaluation ‐Towards UNEG Guidance. Guidance Document, UNEG/G(2011)2.
United Nations High Commissioner for Refugees (UNHCR). 2014. Bangladesh: 2015 UNHCR Statistical Snapshot. Accessed at: http://www.unhcr.org/pages/49e487546.html#
World Bank. 2014. Bangladesh Data/ ASPIRE Key Indicators. Accessed at: http://data.worldbank.org/country/bangladesh#cp_wdi and http://datatopics.worldbank.org/aspire/country/bangladesh
World Bank, 2009. Rethinking School Feeding: Social Safety Nets, Child Development, and the Education Sector.