1
Evaluation the effects of stirrup spacing and buckling of steel reinforcing bars
on the capacity of RC columns
Seyed Shaker Hashemi1,*
, Mohammad Vaghefi2 and Mehdi Hemmat
3
1Assistant Professor, Civil Engineering Department., Persian Gulf University, Bushehr, Iran,
* Corresponding Author, Tel: + 98 77 31222150, Fax: + 98 77 31540376, Mobile: +98 912 710 0544
Shahid Mahini Street, P.O Box: 75169-13817, Bushehr, Iran
Email: [email protected]
2 Associated Professor, Civil Engineering Department., Persian Gulf University, Bushehr, Iran.
Shahid Mahini Street, P.O Box: 75169-13817, Bushehr, Iran
Tel: + 98 77 31222150, Fax: + 98 77 31540376, Mobile: +98 917 313 7609
Email: [email protected]
3Master of Civil Engineering, Civil Engineering Department., Persian Gulf University, Bushehr, Iran.
Shahid Mahini Street, P.O Box: 75169-13817, Bushehr, Iran
Tel: + 98 77 31222150, Fax: + 98 77 31540376, Mobile: +98 917 703 0340
Email: [email protected]
2
Abstract
The capacity of reinforced concrete sections highly depends on the interaction between reinforcing bars
and surrounding concrete. The buckling of longitudinal steel bars have an important role in the nonlinear
behavior of RC sections. In order to nonlinear analyzing of the bar’s buckling in RC columns, two types
of column and joint elements are modeled and separate degrees of freedom are used for the reinforcing
bars and concrete. Buckling effect is considered in the numerical modeling of bars and the ability and
reliability of the numerical method is assessed through the verification of numerical and experimental
results. The effect of stirrup spacing on the Axial-Force–Moment (P-M) interaction curve of the RC
column is calculated using the nonlinear model of bar's buckling and compared with the ACI criteria.
Results show that the numerical capacity in a RC section subject to pure axial compressive load and pure
bending moment, with bar's buckling effect, are only about 6% and 9% lower than those obtained without
buckling effect, respectively. Also, although ACI criteria does not takes bar's buckling effect into account
in the estimation of ultimate strength capacity of RC section, the ultimate capacity recommended by ACI
code is acceptable and conservatively enough.
Keywords: Buckling, Reinforced Concrete Column, Stirrup, Column Capacity, bond-slip effect.
1. Introduction
Various numerical and analytical methods are presented to estimate the capacity of RC sections. The
interaction between reinforcing steel bars and surrounding concrete should be considered appropriately
through the process of the capacity estimating. The reinforcing bars are usually subjected to tensile or
compressive forces in RC sections. Regarding to circumstances, the compressive longitudinal bars in
interaction with the concrete segment are prone to buckling. Currently, according to the methods which
are recommended by building codes, on one hand it is assumed that the probable buckling is prevented by
3
observing required provisions. Hence, the effect of steel bars buckling is not considered [1]. On the other
hand, building codes would prevent buckling by applying requirements for stirrups spacing, stirrups
diameter and concrete cover. If these requirements are not observed thoroughly in a RC member, the
buckling is likely to occur. A clear statement on the eventual capacity reduction compared with codes
requirements in this regard is needed. Many researches are conducted on the buckling of longitudinal
reinforcement bars. They are classified in two major categories containing the buckling action of bars and
the effect of buckling on the nonlinear behavior of RC sections. Various models based on the stress-strain
curve of steel bar are presented for numerical modeling of buckling behavior containing simple models
such as the Gomes and Appleton model in 1997[2] and the complicated models such as the models by
Berry and Eberhard in 2005 [3], Bae and Mises in 2005[4], Zong and Kunnath in 2008[5], Dhakal and
Maekawa in 2002 [6], Masonne and Moroder in 2009 [7], Kashani and Crewe in 2013[8]. The model
proposed by Appleton and Gomes (1997) is simple and consistent with the G-M-P stress-strain model by
Giuffre and Pinto in 1970[9]. The majority of the second group has studied the numerical investigation of
nonlinear behavior, in particular, post-yield zone and the effects of buckling on ductility in RC sections.
In addition, various experimental methods along with simple to micro modeling numerical methods for
instance, the models by Lukkunaparasit (2011) [10], Lopes (2012) [11] and Potger (2001) [12] have been
used by researchers.
Despite the extensive researches in the field of steel bar buckling in RC sections, the aim of this paper is
to study the effects of bar buckling on the capacity of RC sections and also, on the interaction curves of
axial load-bending moment capacity proposed by codes which were not fully considered in previous
studies. Based on the obtained results of this research, it is feasible to estimate the strength capacity of RC
sections regarding the possibility of steel bars buckling when the requirements for the stirrups spacing are
not provided properly. Moreover, an appropriate definition is existed on the capacity of RC members with
the probable buckling of compressive steel bars, which can lead engineers to a suitable process for the
seismic retrofitting design for existing old RC structures.
4
2. Theory of research
An exerted cyclic loading on RC sections might takes the compressive steel bar behavior to the nonlinear
zone. The buckling behavior of steel bars depends to the ratio of stirrups spacing (Ls) over bar’s diameter
(db) which is defined by slenderness ratio. The stress-strain relationship is presented for some slenderness
ratios in Figure 1. For low slenderness, the effect of buckling is not observed and cycles have shown an
expansion due to the effect of isotropic hardening but, for higher slenderness, cycles are more contracted
under the effect of buckling and the load gradient reduces in compression.
After buckling, the stiffness of bar element in compression is considered on the basis of bending behavior
[13]. Some researchers have recommended considering the buckling of the longitudinal bars based on the
distance between two consecutive stirrups. In this distance; longitudinal bar is modeled as a fixed-end
column [14]. Based on a number of experimental and theoretical results, compressive bars are vulnerable
to buckle in an equal length or longer distance between two consecutive stirrups [15]. Ideas have been
provided by many researchers about the definitions in which the bar buckling must be taken into
consideration .When some or all parts of surrounding concrete of the steel bars loses its strength and
crushed or the stress in stirrups reaches the yield limit, then the effect of bar buckling should be
investigated [16].
Currently, ACI code gives an estimate on the nominal strength capacity of RC sections by benefiting
simplifying assumptions such as linear strain distribution along the height of section, neglecting of shear
deformations and perfect bond assumption between longitudinal bars and concrete. Moreover, ACI
estimates the ultimate capacity by applying reduction coefficients to the nominal capacity. On the other
hand, ACI code gives some restrictive criteria on stirrups which show differences for different level of
ductility and different sections and positions for the member [17]. One of restrictive and determinant
factor is limiting the stirrup transverse spacing to at most 6 times of the main bars diameter. In the case of
5
buckling of a bar, the effect of this provision is directly considered in the stress-strain relationship of the
longitudinal bars as the increase in bar’s slenderness intensifies the buckling effect.
3. Numerical modeling
Two types of element have been used in order to numerical modeling of the examined column. The beam-
column element is basically used for modeling the column together with the joint element applied for
footing connection. In the method used on the basis of layered model, the assumption of perfect bond
between concrete and bar has been neglected and the possible effects of slip have been considered [18]. In
the joint element the effect of pull-out can be considered as the relative displacement between the steel
bar and surrounding concrete and bond stress is referred to as the shear stress acting parallel to an
embedded steel bar on the contact surface between the reinforcing bar and concrete. The number of
degrees of freedom in the side of the joint element is compatible with the degrees of freedom at the ends
of the column elements adjacent to joint element. Although it is feasible to model the pull-out effects, the
embedded length of steel bars has been considered sufficiently large to prevent interference of bar’s pull-
out from the foundation in the results of this research [19].
The free body diagram of an infinitesimal segment, dx, of a RC column with internal and external forces
is shown in Figure2. As the element consists of two major parts of concrete and steel bar, the equilibrium
relationships of internal forces have been written meanwhile discretization. The effect of bond force
between the concrete and each longitudinal bar has been taken into calculations.
The axial equilibrium in the concrete element and steel bar i is given by Equations 1 and 2:
(1)
n
i
bi
C xDdx
xdN
1
0)()(
(2) n,..,,i,)x(Ddx
)x(dNbi
i 210
Where:
Nc(x) is the axial force in the concrete segment,
Ni(x) is the axial force in the steel bar i,
6
n is the number of longitudinal bars
Dbi(x) is the bond force between the concrete segment and the bar i per unit length,
Equation 3 is provided based on the Euler–Bernoulli theory and the moment equilibrium about the z
axis of the cross section.
(3)
0)(
)()(
12
2
n
i
biiy
z
dx
xdDyxP
dx
xMd
Where:
py(x) is uniform external force on the element,
Mz(x) is bending moment,
yi is bar distance from reference axis,
The slip between the longitudinal bars and the surrounding concrete in each section for the
longitudinal position x of reinforced concrete elements can be defined by Equation 4.
dx
xduyxuxuxu C
iCibi
)()()()( 2
1 (4)
In this equation:
ui(x) is the longitudinal displacement in bar,
u1c(x) is the longitudinal displacement of concrete segment,
u2c(x) is the transverse displacement
of concrete segment in the y axis direction.
The weak form of displacement based finite element formulation is determined through the principle of
stationary potential energy. A computer program created in MATLAB software was used by the authors
[20]. More details about the calculation of element have previously been provided elsewhere [18, 19]. The
number of degrees of freedom in a reinforced concrete element depends on the number of longitudinal
bars. As an example, fourteen degrees of freedom is accrued to a reinforced concrete element with four
longitudinal bars. Six degrees is associated with the concrete segment and the others are for the bars.
7
The Newton-Raphson algorithm has been used to numerical nonlinear solving of equations. Each RC
column elements have been divided into elements with shorter length in order to consider the effects of
dependency to the length of element. Because the formulation is displacement based and the response
depends on element size. As a simple suggestion, the length of the column elements can be selected as
equal as or shorter than the average flexural crack spacing in the column. Therefore, in this study, the
flexural crack spacing is calculated based on the CEB (1978) and the column element is subdivided into a
suitable number of shorter elements [21]. In these cases, convergence of the calculated responses will be
achieved in the numerical process.
Yassin model is used to modeling the concrete stress-strain behavior (Figure 3). Tensile behavior has
been considered as bilinear and also the effect of the element size on the tensile hardening has been
considered [22].Furthermore, the interaction effect between steel bar and concrete has entered into
calculations as the bond stress- slip relationship based on the Eligehausen model (Figure 4). This model is
simple and has shown good accuracy in modeling effective parameters compared to the other models
[23]. In this model, the effect of many variables such as, spacing and height of lugs on the steel bar,
concrete compressive strength, thickness of concrete cover, steel bar diameter and end bars hook have
been considered.
4. The modeling of steel bar behavior and the effect of buckling
The Giuffre-Menegotto-Pinto (G-M-P) model (1970) has been used in order to represent the stress-strain
relationship of steel bars. The enveloping curve in Figure 5 presents a transform from a straight line with
a slope of E0 into another straight line with a slope of E1. In this figure, the Superscript "1" and "2",
respectively, indicate the direction of loading and unloading, and also, (𝑠0, 𝜎𝑠0) is the Coordinates of the
asymptote’s intersection point.
The model proposed by Gomes and Appleton has been employed to apply the effect of bar buckling
in G-M-P stress-strain relationship. Based on the theory of this model, the process of checking the
8
balance in a buckling bar between two stirrups has depicted in the Figure 6. Equation 5 shows the
stress-strain relationship of buckling bar in regard with details which has explained by Gomes and
Appleton (1997).
(5)
sbs A /))L/()M22(( sPb
Where:
Ab is cross section of the steel bar,
Ls is effective length in buckling which is considered equal to the distance between two
consecutive stirrups,
Mpb is steel bar’s plastic moment which is calculated based on the Equation 6 for a circular
cross section and without axial load.
(6)
y
3
yPb8
14240M bP d.Z
Where:
Zp is plastic modulus of circular cross section,
db is bar’s diameter.
In order to use the Equation 5 in stress- strain curve of the steel bars, the strain corresponding to the zero
stress (the intersection point of the strain axis) should be determined (Figure 5). This point (𝑆𝑄 ,0) is
assumed as the origin of the curve coordinate and the change of variable 𝑠𝑛= 𝑠- 𝑆𝑄 is performed in the
Equation 5. It is capable to consider the effect of axial force in buckling behavior of steel bars. The lack
of this consideration is significant in small amount of strains but not impressive in the nonlinear behavior
and larger amount of strain in which the inclusion of bending moment effects of steel bar is sufficient.
Hence, this study does not include the effect of interaction between axial force and bending moment to
avoid complicated calculations.
During the modeling of RC elements, the effect of buckling in each steel bar is considered after crushing
9
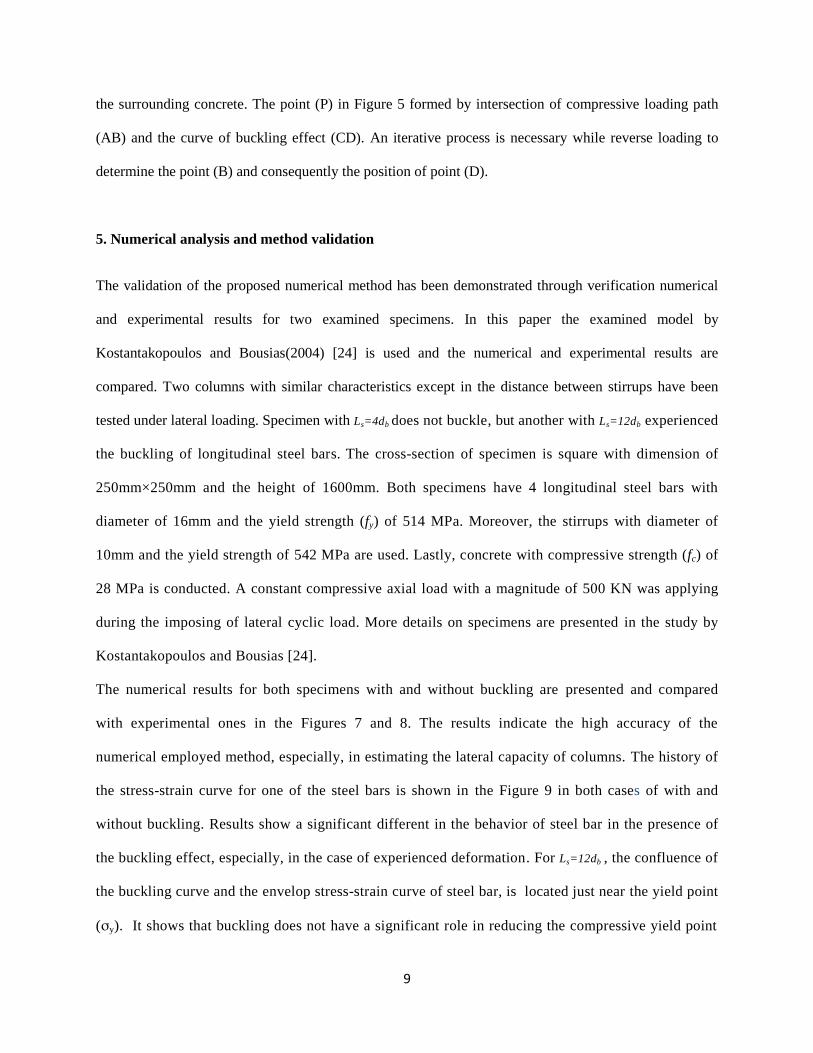
the surrounding concrete. The point (P) in Figure 5 formed by intersection of compressive loading path
(AB) and the curve of buckling effect (CD). An iterative process is necessary while reverse loading to
determine the point (B) and consequently the position of point (D).
5. Numerical analysis and method validation
The validation of the proposed numerical method has been demonstrated through verification numerical
and experimental results for two examined specimens. In this paper the examined model by
Kostantakopoulos and Bousias(2004) [24] is used and the numerical and experimental results are
compared. Two columns with similar characteristics except in the distance between stirrups have been
tested under lateral loading. Specimen with Ls=4db does not buckle, but another with Ls=12db experienced
the buckling of longitudinal steel bars. The cross-section of specimen is square with dimension of
250mm×250mm and the height of 1600mm. Both specimens have 4 longitudinal steel bars with
diameter of 16mm and the yield strength (fy) of 514 MPa. Moreover, the stirrups with diameter of
10mm and the yield strength of 542 MPa are used. Lastly, concrete with compressive strength (fc) of
28 MPa is conducted. A constant compressive axial load with a magnitude of 500 KN was applying
during the imposing of lateral cyclic load. More details on specimens are presented in the study by
Kostantakopoulos and Bousias [24].
The numerical results for both specimens with and without buckling are presented and compared
with experimental ones in the Figures 7 and 8. The results indicate the high accuracy of the
numerical employed method, especially, in estimating the lateral capacity of columns. The history of
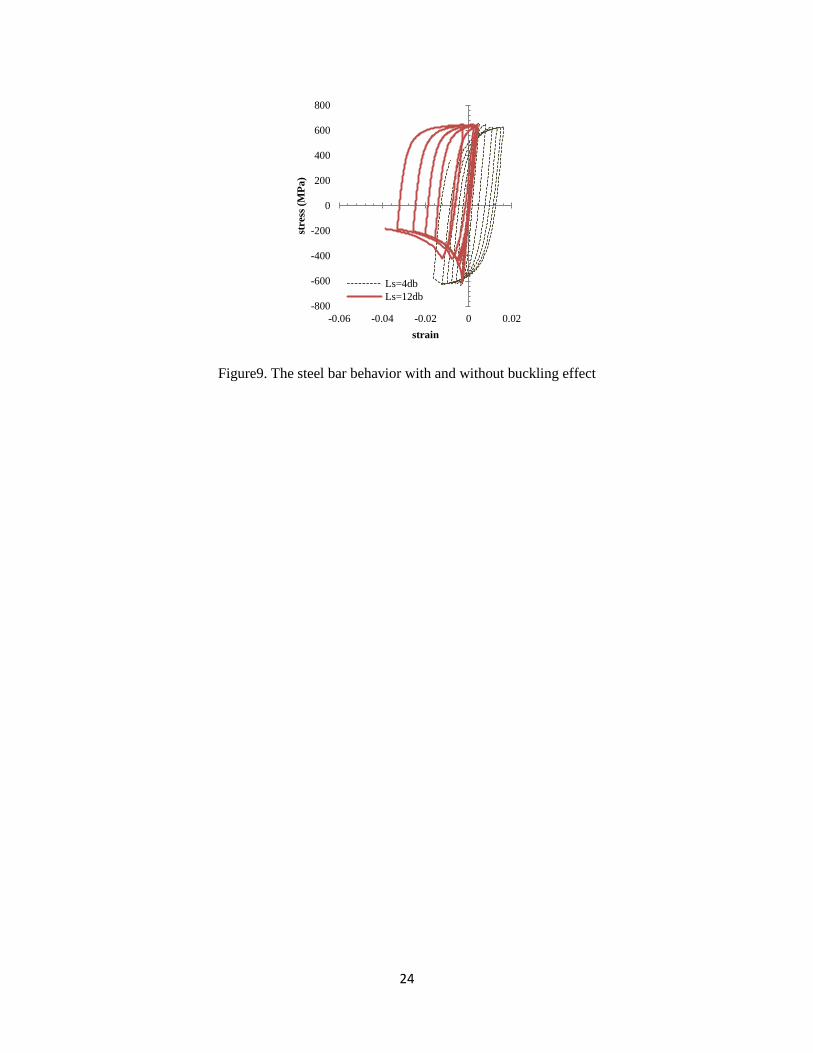
the stress-strain curve for one of the steel bars is shown in the Figure 9 in both cases of with and
without buckling. Results show a significant different in the behavior of steel bar in the presence of
the buckling effect, especially, in the case of experienced deformation. For Ls=12db , the confluence of
the buckling curve and the envelop stress-strain curve of steel bar, is located just near the yield point
(σy). It shows that buckling does not have a significant role in reducing the compressive yield point
10
of steel bar and is more effective on the post-yield range behavior. This is justified by investigating
the behavior of experimental and numerical specimens with and without buckling. In other words, the
ultimate strength capacity is almost identical in the both examined specimens and the little disparity
is due to the effect of Ls on the coefficient of confined concrete. But after yielding of the compressive
steel bar, nonlinear behavior of specimen shows the softening with high gradient as a result of
buckling effect. So, experimental behavior is well predicted by numerical analysis.
6. Numerical investigation
In order to investigate the capacity of RC columns, various samples of short column listed in Table 1 with
fixed and variable characteristics were modeled and analyzed. Thirty models have been investigated and
the obtained results were compared with the capacity curves of ACI code. Models of this study have been
selected based on the characteristics and geometry proposed by Qui et al. laboratory research [25]. The
case study column with 50mm stirrup spacing and 40 MPa compressive strength for concrete was tested
under a constant 350 KN axial load. Although, appropriate adoption has seen between the results of
numerical method with experimental one, but the results of this verification have not mentioned to avoid
the prolongation of the text.
Many researchers have conducted numerical analysis to investigate the effect of buckling by monotonic
and cyclic methods. Bae et al in 2005, Dhakal and Maekawa in 2002, Monti and Nuti in 1992 and Mander
et al. in 1994 [26] investigated the effect of buckling through both cyclic and monotonic analyses
together. On the other hand, Zong and Kunnath in 2008, Mander in 1983 [27] and Bai et al. in 2012 [28]
studied the buckling using monotonic analyses. Despite the fact that bar's buckling effects are more
obvious in cyclic behaviors and large deformations, the pushover analysis has been used in this paper
since the main objective is to investigate the effect of buckling on the ultimate capacity. Therefore, there
is no explicit and specific statement in regard of the ductility, post-buckling and post-yield of the bars.
11
The resulted axial force-bending moment interaction curves (P-M) are presented in Figure10 along with
the curves obtained from ACI code. The ACI P-M interaction curves has plotted with and without
capacity reduction factor () (the ultimate and nominal capacity) in order to make a better comparison.
Quantitative investigations are performed in three cases of pure bending, maximum bending capacity
affected by the axial force-bending moment interaction and finally pure axial force. Results are presented
in Table2. It is noted that results for the specimen with Ls=5db in which buckling does not occur have
chosen as a criterion and the relative percent of disparity are presented for other specimen per increase in
the stirrup spacing (Table2).
7. Discussion and interpretation of results
Increasing the 𝐿𝑠 factor has two significant effects on numerical responses. One of them is the reduction
of confinement of the core concrete and the other one is exacerbating the buckling potential of
longitudinal bars. The effect of 𝐿𝑠 on the compressive strength of confined concrete applied in estimating
the capacity as the confined coefficient factor however, this factor is neglected in assessing the strength of
concrete in codes as a conservative approach. By putting the equation of buckling path equal to the steel
stress-strain envelope curve, an intersection point will be achieved that shows condition in which the
buckling point (b) and the yield point of curve (so) are identical as it is shown in Figure 11 and Equation
7.
(7)
bss d.L
2
1
060
Where db is the bar diameter. This equation will be equal to 12.5𝑑𝑏 for the cases under study. For
greater amount of 𝐿𝑠, the buckling path and the separation from the envelope curve is considered
before the theoretical yield point of the bar (σy). On the other hand, if 𝐿𝑠 assumed to be shorter than
12.5𝑑𝑏, the separation from the envelope curve is after the yield point. The effect of the second status
is normally negligible in capacity and substantially will reflect in ductility as well as post-yield
12
behavior.
The first status (𝐿𝑠 >12.5𝑑𝑏) depending on 𝐿𝑠 amount can decrease the yield point and compressive
bar capacity and consequently reduce the whole capacity of the section. Obviously, this can be true
provided that the conditions for buckling of bars are available. Even with large amounts of 𝐿𝑠, the
buckling of longitudinal bars may not occur because the surrounding concrete of steel bar act as
lateral support. In other words, when the surrounding concrete of compressive steel bars loses
strength and being crushed, the buckling needs to be investigated. Generally, it can be claimed that
conditions for the buckling of compressive steel bars depend on amount of 𝐿𝑠 , the yield strengths of
steel bars and their surrounding concrete. Therefore, a prerequisite for the initiation of possible
buckling of longitudinal steel bars is that the surrounding concrete loses their resistance. By
respectively defining the c0 as the strain corresponding with compressive strength of concrete and b
as the intersection point between the buckling path and the envelope curve of the stress-strain steel
bar, one of the following statuses would govern:
A) When b˃ S0 and b˃ C0: This occurs for 𝐿𝑠˂ 0.6 𝑆0−0.5 𝑑𝑏 . The buckling path starts after the yield
point of steel bar (Fig. 12-a). Models with 𝐿𝑠 = 5𝑑𝑏 & 10𝑑𝑏 were in this situation. Due to the post-
yield buckling, 𝐿𝑠 will just effect on the confinement effectiveness factor and consequently
discrepancy will be observed in capacity values.
B) When b≤S0 and b˃ C0: This occurs for 0.6 𝑆0−0.5 𝑑𝑏 ≤ 𝐿𝑠≤ 0.6 𝑆0 𝐶0
−1.5𝑑𝑏. The buckling path starts
before the yield point of the steel bar and finally, concrete cover is crushed prior to buckling (Fig.
12-b). This state rarely occurs because of the typical values of S0 and C0. The usual value for C0
is more than 0.002. What’s more, for steel bar with the yield point in a range of 400 to 500 MPa,
S0 will change between 0.002 and 0.0025. If 𝐿𝑠 provides the conditions for the occurrence of this
state, drop in the resistance of steel bar is negligible.
C) When b≤S0 and b˂ C0: This occurs for 𝐿𝑠˃ 0.6 𝑆0−0.5 𝑑𝑏. Conditions are available in order to
enter the buckling path which starts before the yield point of steel bar but, the strength and
13
stability of surrounding concrete does not permit to enter the buckling path. In this status, steel
bars tend to return to the buckling path by loading progress and after crushing the cover concrete.
Hence, remarkable decline in resistance can be observed (Fig. 12-c). Models with 𝐿𝑠 = 20𝑑𝑏 &
30𝑑𝑏 & 50𝑑𝑏 show this situation. By increasing values of 𝐿𝑠 , the buckling of steel bars is more
likely to take place, however, it will happen after crushing the concrete cover and so the strength
limit of compressive steel bars are similar for different values of 𝐿𝑠 . Although, their behavior
would be different after crushing concrete since by increasing 𝐿𝑠 , the degradation of resistance
and prolapse of curve behavior after initiation of buckling is more. Slight difference due to the
confining effect is not significant (Fig. 13).
D) When b≤S0 ˂ C0: This occurs for 𝐿𝑠˃ 0.6 𝑆0−0.5 𝑑𝑏 . Here, conditions are available to enter the
buckling path which starts before the yield point of steel bars but because of the strength of
surrounding concrete, buckling does not happen before the crushing of concrete cover (Fig. 12-d).
On the other hand, as S0 ˂ C0, compressive steel bar is being yielded before initiation of concrete
crushing. Crushing of concrete cover in this situation will lead to a sharp drop in resistance. The
behavior is non-ductile but, steel bar has passed the yield stage and logically buckling does not
interfere in the strength capacity of section although effects on ductility. This situation is widely
common for steel bar with low yield point. With regard to usual values for strain corresponding to
yield point of concrete and steel bar, this situation is likely to happen when the yield point of steel
bar is lower than 400 MPa.
E) When S0 ˂ b ˂ C0: This status is fusion of (A) and (D) (Fig. 12-e) and widely overshadows
ductility. Slight impact on the strength capacity of section is due to the confinement of concrete
rather than buckling.
8. Conclusions
The effect of increasing 𝐿𝑠 on flexural capacity of RC sections under pure bending is not
14
significant. Changes of 𝐿𝑠 between 5𝑑𝑏 to 50𝑑𝑏, has resulted in reduction changes from zero to
9% in flexural capacity of section. By increasing ρ and fy/fc, the compressive steel bar has a
more significant role in the strength capacity of section and consequently, the effect of buckling
in capacity would be remarkable. However, by considering the effect of buckling, the value of
ultimate strength capacity recommended by ACI code is highly acceptable which estimates
flexural capacity conservatively 17.5% less than numerical value.
The effect of buckling is more significant in estimating the maximum flexural capacity which is
achieved in the presence of axial compressive load. On the other hand, reduction in the capacity
due to the increase of 𝐿𝑠 is low because of the necessary prerequisite for buckling which is
crushing the surrounding concrete of the steel bars. Among the examined specimens, changes of
𝐿𝑠 from 5𝑑𝑏 to 50𝑑𝑏, lead to reduction changes from zero to 21% in flexural capacity and also the
difference is greater by increasing ρ and fy/fc. In the presence of buckling effect, the ultimate
strength capacity proposed by code is conservatively acceptable and approximately estimates the
flexural capacity of section at least 20.9% less than the numerical capacity.
In the presence of pure axial force, the section is completely under pressure and the required
condition for buckling is available, provided that the surrounding concrete is being crushed.
This conditions will be achieved when the strain in concrete cover exceeds the C0=0.002. This
situation means that axial force is well tolerated and is away from the possibility of buckling
before this strain. If 𝐿𝑠 is increased, the bar experiences this amount of strain before buckling
even if b is too lower than aforementioned value. Changes of 𝐿𝑠 between 5𝑑𝑏 to 50𝑑𝑏, has
resulted in reduction changes from zero to 6% in axial capacity. By increasing ρ and fy/fc,
differences will be less and more, respectively. The values of nominal and ultimate strength
capacity estimated by the code are conservative and respectively at least 26% and 56% less than
the numerical values estimated with the effect of buckling.
Although deterrent restrictions in ACI code for the occurrence of buckling effect is sufficient,
15
if 𝐿𝑠 considered to be exceeded, the reduction effects of this factor on ultimate strength capacity
is not significant and the estimated capacity with the effect of buckling will not be less than
ultimate strength capacity achieved by the method of ACI code. In other words, ultimate
strength capacity with the effect of buckling gained by the ACI code has sufficient factor of
safety. But, this factor of safety can just confirm the bearing capacity. Ductility and behavior
of column section after crossing the ultimate strength capacity is significantly related to 𝐿𝑠
which can intensify the possibility of brittle fracture as well as resistance drop ratio.
9. Acknowledgments
This research was supported by the grant with the code PGU/FE/1-4/1390/1565 of the office of vice
president for research, Persian Gulf University. The authors hereby gratefully thank them for
financial aid.
References
[1] American Concrete Institute, "ACI 318-11 Building code requirements for structural concrete and
commentary", ACI 318R-11, Farmington Hill, MI, USA. (2011)
[2] Gomes, A. and Appleton, J. "Nonlinear cyclic stress-strain relationship of reinforcing bars including
buckling", Engineering Structures, 19(10), pp.822–826 (1997), DOI: 10.1016/s0141-0296(97)00166-1.
[3] Berry, M.P. and Eberhard, M.O., "Practical performance model for bar buckling", Structural Engineering,
131(7), pp.1060-1070 (2005), DOI: 10.1061/(ASCE)0733-9445(2005)131:7(1060).
[4] Bae, S., Mieses, A., Bayrak, O. "Inelastic buckling of reinforcing bars", Structural Engineering, 131(2), pp.
314-321 (2005), DOI: 10.1061/(ASCE)0733-9445(2005)131:2(314).
[5] Zong, Z. and Kunnath. “Buckling of reinforcing bars in concrete structures under seismic loads”, The 14th
World Conference on Earthquake Engineering. Beijing, China, October 12-17, (2008).
[6] Dhakal, R.P. and Maekawa, K. “Path-dependent cyclic stress–strain relationship of reinforcing bar
including buckling”, Engineering Structures, 24(11), pp.1383-1396 (2002), DOI: 10.1016/SO141-
16
0296(02)00080-9.
[7] Massone, L.M. and Moroder, D. “Buckling modeling of reinforcing bars with imperfections”, Engineering
Structures, 31(3), pp.758-767 (2009), DOI: 10.1016/j.engstruct.2008.11.019.
[8] Kashani, M.M., Crewe, A.J. and Alexander, N.A. “Nonlinear stress–strain behavior of corrosion-damaged
reinforcing bars including inelastic buckling”, Engineering Structures, 48, pp. 417-429 (2013) , DOI:
10.1016/j.engstruct.2012.09.034.
[9] Giuffre, A. and Pinto, P.E. “Il Comportamento del cemento armato per sollecitazzioni cicliche di
forte intensita”, Giornale del genio civile, Maggio. (1970) (In Italian)
[10] Lukkunaprasit, P., Tangbunchoo, T. and Rodsin, K., “Enhancement of se ismic performance of reinforced
concrete columns with buckling-restrained reinforcement”, Engineering Structures, 33(12), pp.3311-
3316 (2011), DOI: 10.1016/j.engstruct.2011.08.019.
[11] Lopes, A.V., Lopes, S.M.R. and Do Carmo, R.M.F. “Effects of the compressive reinforcement buckling
on the ductility of RC beams in bending”, Engineering Structures, 37, pp.17-23 (2012).
[12] Potger, G.M., Kawano, A., Griffith, M.C. and Warner, R.F. “Dynamic analysis of RC frames including
buckling of longitudinal steel reinforcement”, Paper No. 4.12.01, NZSEE 2001 conference. (2001)
[13] Monti, G. and Nuti, C. "Nonlinear cyclic behavior of reinforcing bars including buckling", Structural
Engineering,ASCE,118(12),pp.3268-3284 (1992), DOI:10.1061/(ASCE)0733-9445(1992)118:12(3268).
[14] Watson, S., Zahn, F.A. and Park, R."Confining reinforcement for concrete columns", Structural
Engineering, ASCE, 120(6), pp. 1798-1824 (1994), DOI:10.1061/(ASCE)0733-9445(1994)120:6(1798).
[15] Sheikh, S.A. and Yeh, C.C. "Tied concrete columns under axial load and flexure", Structural Engineering,
ASCE, 116(10), pp. 2780-2800 (1990) , DOI: 10.1590/S1679-78252014000700010.
[16] Papia, M. and Russo, G. "Compressive concrete strain at buckling of longitudinal reinforcements",
StructuralEngineering,ASCE,115(2),pp.382397(1989),DOI:10.1061/(ASCE)07339445(1989)115:2(382)
[17] Moehle, J.P., Hooper, J.D. and Lubke, C.D. "Seismic design of reinforced concrete special moment
frames: a guide for practicing engineers", NEHRP Seismic Design Technical Brief No.1. (2008)
[18] Hashemi, S.SH., Tasnimi, A.A. and Soltani, M., "Nonlinear cyclic analysis of reinforced concrete frames,
utilizing new joint element", Scientia Iranica, Transaction A,16(6), pp. 490-501 (2009).
[19] Hashemi, S.SH. and Vaghefi, M. "Investigation of the effect of a bar’s inadequate embedded length on the
17
P-M interaction curve of reinforced concrete columns with rectangular sections", Turkish Journal of
Engineering and Environmental Sciences, 36, pp.109-119 (2012).
[20] MathWorks, MATLAB. "The language of technical computing", Version 7.11.0. (R2010a). (2010)
[21] Comite Euro International du Beton. "CEB-FIP model code for concrete structures", Paris. (1978)
[22] Yassin, M.H.M. "Nonlinear analysis of pre-stressed concrete structures under monotonic and cyclic
loads", PhD Thesis, University of California, Berkeley, California. (1994)
[23] Gan, Y. “Bond stress and slip modeling in nonlinear finite element analysis of reinforced concrete
structures”, A Thesis Submitted for Degree of Master of Applied Science Graduate, Department of Civil
Engineering, University of Toronto. (2000)
[24] Kostantakopoulos, G. and Bousias, S. "Experimental study of the effect of reinforcement stability on the
capacity of reinforced concrete columns", Paper No 770, 13th World Conference on Earthquake
Engineering Vancouver, B.C., Canada, August 1-6. (2004)
[25] Qiu, F., Li, W. Pan, P. and Qian, J. "Experimental tests on reinforced concrete columns under biaxial
quasi-static loading", Engineering Structures,24, pp.419-428(2002),DOI:10.1016/s0141-0296(01)00108.
[26] Mander, J.B., Panthaki, F.D., Kasalanati, A. “Low-cycle fatigue behavior of reinforcing steel” Journal of
Materials in Civil Engineering, 6(4), pp.453-468(1994),DOI:10.1061/(ASCE)0899-1561(1994)6:4(453).
[27] Mander, J.B. “Seismic design of bridge piers” PhD Thesis, University of Canterbury Christchu rch, New
Zealand, (1983)
[28] Bai, Y.L., Dai, J.G., Teng, J.G. “Experimental study on the buckling behavior of reinforcing bars in FRP -
confined RC columns” The 15th World Conference on Earthquake Engineering, Lisbon, Portugal.
(2012)
18
Table1. Fixed and variable properties of the Specimens
Dimension of Models 200 mm*200mm
Stirrup Diameter 6mm
Yield Stress of Longitudinal Bars 460MPa
Yield Stress of Stirrup 420MPa
Thickness of Concrete Cover 21mm
Variety in Distances between Stirrups (5&10&20&30&50) ×db
Specimen ID Stirrups Spacing (mm) Longitudinal
Bars Percentage of Bars r 𝒇𝒄 (MPa)
S1-1 50&100&200&300&500 8f10 mm 1.57%
30
S1-2 40
S2-1 60&120&240&360&600 8f12 mm 2.26%
30
S2-2 40
S3-1 60&120&240&360&600 12f12 mm 3.39%
30
S3-2 40
Table2. Capacity evaluation of the Specimens
Pure Bending The Point with Maximum Flexural
Capacity Pure Axial Force
fc=30
MPa
fc=40
MPa fc=30 MPa fc=40 MPa
fc=30
MPa
fc=40
MPa
Mz(kN.m) Mz(kN.m) Mz(kN.m) P(kN) Mz(kN.m) P(kN) P(kN) P(kN)
r=1.57%
Ls=5db Value 26.8 27.6 43.0 360.0 50.1 720.0 1600.0 1997.6
Ls=10db *% -0.1% 0.0% -8.8% 50.0% -2.0% 0.0% -3.6% -2.8%
Ls=20db % -0.2% 0.0% -9.2% 50.0% -3.4% 0.0% -5.3% -4.2%
Ls=30db % -0.3% 0.0% -9.8% 50.0% -3.7% 8.3% -5.9% -4.6%
Ls=50db % -0.3% 0.0% -10.3% 50.0% -4.0% 8.3% -6.3% -4.9%
ACI318-11
Without
Reduction % 9.4% 8.6% -0.6% -0.2% -1.4% -38.5% -31.7% -31.9%
19
Factor φ
ACI318-11 With
Reduction Factor φ
% -19.7% -20.6% -24.1% -44.2% -25.7% -64.6% -58.0% -57.6%
r=2.26%
Ls=5db Value 36.9 37.3 49.1 360.0 56.0 420.0 1707.4 2105.6
Ls=10db *% -0.5% -0.2% -13.7% 66.7% -8.2% 57.1% -2.8% -2.2%
Ls=20db % -2.6% -0.7% -15.3% 66.7% -8.9% 57.1% -4.1% -3.2%
Ls=30db % -4.7% -1.5% -15.8% 66.7% -9.1% 57.1% -4.5% -3.6%
Ls=50db % -5.7% -2.1% -16.2% 66.7% -9.3% 57.1% -4.8% -3.8%
ACI318-11 Without
Reduction Factor φ
% 11.3% 12.6% 3.6% -4.5% 2.7% 1.6% -28.9% -29.7%
ACI318-11 With
Reduction Factor φ
% -18.1% -17.5% -20.9% -51.0% -22.5% -45.3% -57.0% -56.9%
r=3.39%
Ls=5db Value 51.6 52.9 61.2 420.0 67.9 420.0 1915.5 2313.7
Ls=10db *% -1.3% -0.9% -9.0% -42.9% -9.9% -28.6% -2.5% -2.0%
Ls=20db % -7.1% -5.0% -16.6% -57.1% -18.1% 71.4% -3.6% -2.9%
Ls=30db % -8.5% -6.8% -20.3% -71.4% -18.3% 71.4% -4.2% -3.3%
Ls=50db % -8.8% -6.8% -20.5% -85.7% -18.5% 71.4% -4.3% -3.5%
ACI318-11 Without
Reduction Factor φ
% 7.2% 8.3% 0.8% -35.4% 0.6% -4.3% -26.3% -27.6%
ACI318-11 With
Reduction Factor φ
% -18.5% -17.7% -22.0% -70.6% -23.1% -58.2% -56.3% -56.5%
*The positive and negative percentage of differences are corresponded to higher and lower values per
Ls=5db ,respectively
Figures Captions:
Figure1.The effect of buckling on the stress-strain behavior of bars in different slenderness ratios [13]
Figur2. Free body diagram of infinitesimal segment of RC column
Figure3.The stress-strain behavior of concrete based on the Yassin model [22]
Figure4.The bond stress-bond slip behavior based on the Eligehausen model [23]
Figure5.The stress-strain behavior of steel bar without buckling effect based on the G-M-P model
Figure6. Free body diagram of buckling steel bar by Gomes and Appleton (1997)
Figure7. Experimental and numerical responses of specimen with Ls=4db [24]
Figure8. Experimental response of specimen with Ls=12db [24]
20
Figure9. The steel bar behavior with and without buckling effect
Figure10. P-M curves of the Specimens
Figure11. The behavior of compressive steel bar when εb=εS0
Figure12. The behavior of compressive steel bar in different conditions
Figure13. The moment-curvature curve of the specimen S3-2
List of Figures:
Figure1.The effect of buckling on the stress-strain behavior of bars in different slenderness ratios [13]
Figur2. Free body diagram of infinitesimal segment of RC column
21
Figure3.The stress-strain behavior of concrete based on the Yassin model [22]
Figure4.The bond stress-bond slip behavior based on the Eligehausen model [23]
22
Figure5.The stress-strain behavior of steel bar without buckling effect based on the G-M-P model
Figure6. Free body diagram of buckling steel bar by Gomes and Appleton (1997)
23
Figure7. Experimental and numerical responses of specimen with Ls=4db [24]
Figure8. Experimental response of specimen with Ls=12db [24]
24
Figure9. The steel bar behavior with and without buckling effect
-800
-600
-400
-200
0
200
400
600
800
-0.06 -0.04 -0.02 0 0.02
stress
(M
Pa
)
strain
Ls=4db
Ls=12db
25
Figure10. P-M curves of the Specimens
26
Figure11. The behavior of compressive steel bar when εb=εS0
Figure12. The behavior of compressive steel bar in different conditions
27
Figure13. The moment-curvature curve of the specimen S3-2
Biographies:
Seyed Shaker Hashemi was born in Kazeroun, Iran, in 1981. He earned a BS degree in Civil
Engineering from the Power and Water University of Technology (PWUT) in 2003, and MS and
PhD degrees in Earthquake and Structural Engineering from Tarbiat Modares University,
Tehran, Iran, in 2005and 2009, respectively. He is currently Assistant Professor in the
Department of Civil Engineering at the Persian Gulf University, Bushehr, Iran, and his research
interests are in the areas of structural and earthquake engineering, especially nonlinear numerical
analysis of reinforced concrete and the design of structures.
Mohammad Vaghefi was born in Shiraz, Iran, in1973. He earned BS and MS degrees in Civil
Engineering from Shiraz University, Iran, in 1997 and1999, respectively, and a PhD degree, in
2009, from Tarbiat Modares University, Tehran, Iran. He is currently Associate Professor of
Civil Engineering. He has published about 60 journal papers and presented about 200 papers at
national and international conferences.
Mehdi Hemmat was born in Shiraz, Iran, in 1988. He Earned BS Degree in Civil
Engineering from Islamic Azad University, Estahban Branch, Fars, Iran in 2011
and MS degree in Structural Engineering from Persian Gulf University, Bushehr,
Iran in 2013. Currently, he is a member of structural design firm in Shiraz and also,
he works as a lecturer of Civil Engineering courses at Apadana Educational
Institute, Shiraz, Iran.
0
10
20
30
40
50
60
70
80
0 10 20 30 40
Mz(k
N.m
)
Curvature (*10-5)
Ls=5db
Ls=10db
Ls=20db
Ls=30db
Ls=50db