May 24 th 2010 Eindhoven University of Technology Building Services Master project 3 Supervisors: Prof. ir. P.G.M. Rutten Dr. ir. M.G.L.C. Loomans Space cooling using a wet cooling tower EVAPORATIVE COOLING Rick van Pruissen
Transcript
May 24th 2010
Eindhoven University of Technology
Building Services Master project 3
Supervisors:
Prof. ir. P.G.M. Rutten Dr. ir. M.G.L.C. Loomans
Spac
e co
olin
g us
ing
a w
et co
olin
g to
wer
EVAP
ORA
TIVE
CO
OLI
NG
Rick
van
Pru
isse
n
Preface This document is the report of my 3rd master project of the master programme Building Services of the department Building Physics and Systems at Eindhoven University of Technology. This project is based on an assignment from ‘DWA installatie- en klimaatadvies’ [5]. This project could possibly be an introduction to my graduation project, this possibility will be re-evaluated during or after the project.
I would like to thank prof.ir. Paul Rutten and dr.ir. Marcel Loomans for their advice and patience during this project. I would also like to thank Martijn Menschaar from GEA Polacel for his elaborate introduction into the world of cooling towers.
Rick van Pruissen May 2010
Summary Cooling is getting increasingly important in buildings. This rise in cooling demand is commonly met with active cooling systems (chillers). Disadvantages of this method are: increased (fossil) energy usage, larger environmental impact (materials, refrigerant and emissions) and higher costs (investment and exploitation). In this report the application of a wet cooling tower is investigated for an office building in the Netherlands to cover the total cooling load without the use of a chiller.
From the working principle and physics of the different types of cooling towers follows that the type of cooling tower with the highest potential is a wet cooling tower operating in counterflow (henceforth ‘cooling tower’). From this analysis also follows that the performance of a certain cooling tower depends on the inlet temperature, the outlet temperature and the wet-bulb temperature. These temperatures are the limiting factors for the coefficient of performance (COP) of a cooling tower. The smaller the difference between WBT (wet-bulb temperature) and the inlet temperature, the lower the performance of the cooling tower. The outlet temperature follows from the WBT, inlet temperature and cooling tower design. For the application of a cooling tower the requirements for the building are: a low latent cooling load, the presence of a high temperature cooling dissipation system (concrete core conditioning or chilled ceilings) and high efficiency ventilation (e.g. displacement ventilation). The supply temperature of a high temperature cooling system should be 18oC maximum. A difference of at least 2K should exist between cooling tower outlet temperature and wet-bulb temperature making the maximum wet-bulb temperature 16oC.
Using data from a manufacturer the COP of an actual cooling tower was determined for a WBT of 16oC. This COP is approximately 35. Lower capacities at this WBT will increase the COP because the fan speed can be lowered. Lower WBT’s will also increase the COP.
An analysis of the Dutch climate proves that this temperature is exceeded for 546 hours per year on average over 20 years. In 1994, a commonly used Dutch reference year, this number was 476 of which 217 occurred during office hours. The duration of these excesses ranges from 1 hour to 3 days in 1994. From a coarse investigation of thermal storage techniques follows that a sensible buffer to bridge 1 day of excess would become very large (232.3m3) due to the small temperature difference over the cooling system. A latent (Paraffin) buffer to bridge 1 day would be approximately 10.6m3.
A coarse evaluation of the economic applicability of cooling towers in the Netherlands shows that the investment for the cooling tower investigated was 197 €/kW. The closest alternative sources in this capacity range (~100kW) are ventilation air and open air in combination with a heat pump, both with an investment of approximately 550 €/kW. Sensible buffering with water adds approximately 180 €/kW to the total, which is still considerably lower than direct alternatives. A latent buffer adds 725 €/kW to the total making the investment considerably larger than its direct alternatives.
Preceding findings imply that cooling towers are technically and economically feasible for application in the Netherlands as means of direct cooling. When applied as base cooling, cooling towers can be used constantly with a high COP (35 compared to typically 3-6 for a conventional chiller-dry-cooler). When used for full load cooling, flexible comfort boundaries must be applied. A buffer could lower the amount of exceeding hours. A buffer to avert the exceeding hours is technically (size) and economically unviable.
APPENDIX I: MOLLIER DIAGRAM ............................................................................................................................... 33 APPENDIX II: FREQUENCY OF OCCURRENCE OF WET-BULB TEMPERATURES ........................................................................ 35 APPENDIX III: TECHNICAL DATA GEA POLACEL ............................................................................................................ 36 APPENDIX IV: PART OF ASHRAE FUNDAMENTALS ABOUT THE HEAT BALANCE AND PERFORMANCE OF COOLING TOWERS .......... 38
Chap
ter 1
: Int
rodu
ctio
n
5
1 Introduction
1.1 General Cooling is getting increasingly important in buildings. In 2008, 71% of the office buildings in the Netherlands had a cooling system. [9] Multiple factors contribute to this trend [10]:
• Changing building styles: modern architectural styles poorly adapted to the prevailing climate often do not allow for efficient solar and thermal control e.g. fully glazed buildings.
• Increasing internal loads: increasing use of computers and related equipment leads to higher cooling loads as all supplied energy is converted into heat.
• Increase of ambient temperature: in densely built urban environments the ambient temperature rises above the temperature outside these areas. This phenomenon is called ‘heat island effect’ and causes a higher cooling load. The changing climate might also be contributing this effect.
• Increasing comfort requirements: as cooling is becoming more and more common the requirements of the building users also tend to be more demanding.
• Improved building insulation: The improvements in insulation (construction and glazing) of buildings cause the buildings to be better able to retain heat inside. In a winter situation this is an improvement because it reduces heat loss which means less heat has to be supplied to the building. In a summer situation the heat needs to be transported from inside to outside to cool the building, insulation impedes this process. However, insulation also impedes the energy flow from outside in. Whether the insulation is increasing or decreasing cooling load depends on the specific building characteristics.
A common way to meet this rise in cooling demand is to increase the capacity of the (active) cooling system. Disadvantages of this method are:
• Increased (fossil) energy usage. • Larger environmental impact (materials, refrigerant and emissions). • Higher costs (investment and exploitation).
To limit or avert the disadvantages of an active cooling system, passive cooling systems could be used. In this report ‘passive cooling system’ refers to a cooling system which uses considerably less energy than conventional systems or none at all. The relatively small amount of energy that some passive systems use could possibly be generated by means of sustainable energy sources i.e. photovoltaic, wind, etc. Photovoltaic seems the obvious choice as the highest gain occurs roughly when the highest cooling power is needed. A passive cooling system achieves this low energy usage by making optimal use of natural heat sinks and optimising heat exchange. The main principles of passive cooling are [11]:
• Evaporative cooling: lowering the temperature of air by adding water to it. In this process sensible heat from the air is transformed into latent heat.
• Aquifer: a (seasonal) buffer of water between layers of clay in the earth’s crust. This long-term energy storage makes it possible to use the heat of the summer in the winter and the
Chap
ter 1
: Int
rodu
ctio
n
6
cold from the winter in the summer. This type of passive cooling is particularly profitable if the usable floor area of the building(s) is over 6.000 m2. [9]
• Ventilation: o Diurnal ventilative cooling: directly using ambient air if its temperature is lower than
the indoor temperature. Often this is also a side-effect of the ventilation needed to guarantee indoor air quality.
o Nocturnal ventilative cooling: the ambient temperature during the night is lower than during the day. Nocturnal ventilative cooling uses this low temperature to cool down the building by ventilating it with this air, extracting heat from the building, using the building as a buffer for daytime heat load.
• Radiant cooling: using long wave radiant heat loss to the dark sky during the night. • Soil cooling: a few meters below the surface the soil has a constant temperature (10-12oC)
which in the Netherlands is lower than the required indoor air temperature. This lower temperature can be used as a heat sink for the heat extracted from the building.
1.2 Goal Following the general introduction it is interesting to know the (technical) feasibility of the implementation of passive cooling in a building in the Netherlands. The main focus will be evaporative cooling with cooling towers for office buildings.
The main research question of this project is: “Is passive cooling with cooling towers applicable and, technically and economically feasible in the Netherlands?”.
Sub-questions, derived from the main research question are:
1. What is the working principle of cooling towers? 2. What is the efficiency/potential of a cooling tower?
a. What are the limiting factors? b. How does potential change in time on daily and yearly basis?
3. What conditions need to be met for application in the Netherlands? 4. What are the main points of consideration for application in the Netherlands?
1.3 Method With a literature study on the topics of passive cooling, cooling towers and evaporative cooling, the working principle of cooling towers will be investigated. From this investigation the efficiency limiting factors and conditions for application will arise. These factors and conditions combined with basic physics will give an insight in the theoretical potential and applicability in the Netherlands.
Using manufacturer’s data combined with climate data, the practical applicability and feasibility of cooling towers in the Netherlands will be determined.
1.4 Report outline In chapter 2, the working principle of cooling towers is explained. First (§2.1) the general concept of a cooling tower is described and the different variants are introduced and compared with each other. Next (§2.2), the cooling potential of a cooling tower is investigated and important variables are identified. These variables, among others, define the conditions for application (§2.3). In the next
Chap
ter 1
: Int
rodu
ctio
n
7
paragraph (§2.4) the actual performance is determined using manufacturers data for an exemplar cooling tower.
Chapter 3 describes the actual applicability of cooling towers in the Netherlands. In the first paragraph of this chapter (§3.1) the influence of location on the applicability is explained. The next paragraph (§3.2) the factor time is investigated in relation to applicability. In §3.3, Dutch weather data is examined to determine the temporal patterns of performance and critical moments. In the last paragraph (§3.4), a coarse estimation is made on economic applicability in the Netherlands.
In chapter 4 a coarse investigation is made for the economic applicability of cooling towers for building cooling. Investment costs are estimated and together with the findings about the performance in chapter 3 a conclusion is drawn.
In the last chapter, chapter 5 the conclusions of this report are drawn. Also included in chapter 5 are recommendations for further research which have arose during this research.
Chap
ter 2
: The
wor
king
prin
cipl
e of
coo
ling
tow
ers
8
2 The working principle of cooling towers Cooling towers are devices which remove heat from a medium and reject this heat to the atmosphere. The most widely known type cooling tower is the hyperbolic cooling tower as they are common near power plants, refineries and chemical plants. Using a similar principle, cooling towers for HVAC purposes exist to reject the heat of the chiller (active) or to directly cool the cooling circuit (passive). The latter type will be the main focus of this report.
2.1 General In the following paragraphs the working principle of cooling towers will be explained. In appendix IV a part of ASHRAE fundamentals [6] on cooling towers is included which explains the heat balance and performance of cooling towers. The general working principle of a cooling tower is as follows:
1. Relatively cool ambient air and hot cooling water enter the tower. 2. (Water is evaporated to cool down the air) 3. The air is heated by the heat from the cooling water. 4. Relatively hot (and moist) air and cool cooling water leave the tower.
Two kinds of temperature are used in the following paragraphs, dry-bulb and wet-bulb temperature. The dry-bulb temperature is the actual measured temperature. The wet-bulb temperature is the temperature the air would reach if it would be moistened to its maximum vapour content (saturation pressure/temperature). Figure 2 illustrates the relation between dry- and wet-bulb temperature in a cut-out of the Mollier diagram. This diagram describes the relation between different properties of air e.g. temperature, humidity, enthalpy etc. The complete diagram can be found in appendix I.
Figure 2: Mollier diagram with dry- and wetbulb temperature [Source: http://w3.bwk.tue.nl/nl/unit_bps/]
Figure 1: Hyperbolic cooling towers (left) and a typical cooling tower for HVAC purposes (right) [Source: http://www.wordpress.com/]
Chap
ter 2
: The
wor
king
prin
cipl
e of
coo
ling
tow
ers
9
Figure 3: Cross-section of an open loop (top) and a closed loop (bottom) wet cooling tower. [Altered, original source: http://www.betterbricks.com/]
2.1.1 Heat transfer methods The heat transfer between cooling water and the ambient air can occur in three ways:
1. The air entering the tower can directly be used to cool down the cooling circuit. The lowest temperature that can be theoretically achieved is close to the dry-bulb temperature of the ambient air. This type of cooler is called a Dry Cooler. The cooling air is separated from the cooling circuit by a heat exchanger, usually a bundle of pipes with fins.
2. In an open loop wet cooling tower the cooling circuit is cooled to a temperature below the dry-bulb temperature, theoretically to a temperature near the wet-bulb temperature. To achieve this lower temperature water is evaporated. With this evaporation the sensible heat of the air is decreased and the latent heat increased. The coolant (water) itself is partially evaporated by injecting it in the flow of ambient air in the cooling tower. The amount of extra cooling power which can be achieved with evaporation depends on the humidity of the ambient air i.e. humid air can ‘absorb’ less moisture than dry air. Note that cooling water and transport medium are the same in this type of cooler.
3. A hybrid type of the two types above exists and is called a closed loop wet cooling tower. Two sub-types exist:
a. Internal exchanger: The coolant flows through a pipe bundle in the cooling tower which is covered in water. This way the coolant circuit is closed but evaporation does occur i.e. the benefits of both dry and wet cooling combined.
b. External heat exchanger: The coolant flows through a heat exchanger outside of the cooling tower which is cooled by the water coming from the cooling tower.
Of course due to the extra heat exchange step the performance of these types of coolers is a bit lower than that of a wet cooling tower. Because of this extra step this type is also called an indirect cooling tower.
All types use ‘fill’ in the cooling tower to increase the heat exchanging surface of the water with the airflow. It also increases the turbulence of the air and distributes the water, both increasing performance. Most modern cooling towers use plastic as fill material. The fill for a certain cooling tower must be chosen in such a way that it provides the highest exchanging surface (m2/m3) without clogging. This depends on the quality (amount of contamination) of the water which is used.
Figure 4: Plastic fill material [Source: http://www.spec-net.com/]
Chap
ter 2
: The
wor
king
prin
cipl
e of
coo
ling
tow
ers
10
2.1.2 Airflow To generate the required airflow, 3 principles exist:
• In a Natural draft cooling tower the airflow is created by using buoyancy. The density differences of a natural draft cooling tower occur because warm moist air has a lower density than relatively dry and cool air. To create a sufficient pressure difference the height of the cooling tower needs to be high enough.
• In a Mechanical draft cooling tower the airflow is created by a fan. Two subtypes exist: o Forced draft; in this type the air is forced through the cooling tower by a fan. This
method causes a relatively high entry velocity and a low exit velocity. o Induced draft; in this type the air is pulled through the cooling tower by the fan. This
method causes a low entry velocity and a high exit velocity. The high exit velocity reduces the risk of recirculation in comparison with a forced draft cooling tower.
• A hybrid type of the two types above exists and is called ‘Fan assisted natural draft’. As the name suggests the natural airflow is assisted by a fan with this type.
Counterflow and crossflow All these types can exist in counterflow, crossflow or intermediates. This describes the direction of the airflow compared to the flow of water. In general the counterflow type can achieve better efficiencies. The main advantages of crossflow types are a lower noise production and a smaller installation height. This means that the crossflow type is easier to install out of sight, making it more suitable for application for space cooling. In figure 5 these principles are illustrated.
The reason for the difference in performance between the two types is explained with basic heat exchanger theory. The air entering the counterflow cooling tower (Twb1) has the lowest wet-bulb temperature just after the intake and heats up along the height of the cooling tower to (Twb2). The water entering the counterflow cooling tower (Tw1), is the hottest near the top of the cooling tower and cools down along the height of the cooling tower to (Tw2). This means that the coolest air comes in contact with the coolest water, thereby achieving the lowest possible output water temperature (Tw2). In figure 6 on the next page this is illustrated in the left half.
Figure 5: Schematic view of mechanical draft cooling towers in counter (left) and cross flow (right) [8]
Chap
ter 2
: The
wor
king
prin
cipl
e of
coo
ling
tow
ers
11
In the right half of Figure 6, the principle of crossflow is depicted. In contrast to counterflow, the out flowing (Tw2) water does not come into contact with fresh air (Twb1) but with air which already has been moistened in other parts of the cooling tower. For example in Figure 6, the air flowing through part 18 of the fill has already passed part 16 and 17. This decreases the cooling potential of the air and thus the exit temperature. The effect of this is that there is a temperature gradient horizontally as well as vertically, causing the mixed exit temperature of the water to be higher than that of a comparable (volume and type of fill) counterflow cooling tower.
2.2 Cooling potential The cooling potential of a cooling tower depends on the climate in which it is used. In general the cooling potential of evaporative (wet and hybrid) cooling towers is higher than the potential of a dry cooler.
2.2.1 Dry cooler A dry cooler is an air to water heat exchanger. Heat flow from the water to the ambient air depends on the total heat exchanging surface (A), the total heat transfer coefficient (U) and the temperature difference between the water and the ambient air. A common formula to describe the heat transfer in a heat exchanger is as follows:
Both A and U are type specific i.e. depending on the model. Hence, the performance of a certain dry cooler is directly related to the ambient dry bulb temperature: the cooler the ambient air, the larger
Figure 6: Schematic representation of the fill in a cross- and counterflow cooling tower [4] (Twb = Wet-bulb temperature, Tw = water temperature)
Chap
ter 2
: The
wor
king
prin
cipl
e of
coo
ling
tow
ers
12
the cooling potential. Because there always has to be a temperature difference to exchange heat, the ambient temperature needs to be below the desired cooling water temperature. In turn, the cooling water temperature needs to be below the desired temperature of supply air of the building to be able to cool this air. These former statements imply that a dry cooler can only be used if the ambient air has a dry bulb temperature several degrees lower than the temperature of set point of the supply air.
2.2.2 Evaporative coolers As mentioned before, evaporative coolers use the principle of evaporation to increase the cooling capacity compared to a dry cooler. Because a hybrid cooler is basically a dry cooler in which water is evaporated, the potential of a hybrid cooler is at least as high as that of that of a comparable (same U and A) dry-cooler. According to Costelloe and Finn (2007), temperate and maritime European regions have a considerable unrealised potential for evaporative cooling with ‘high temperature’ building cooling systems like cooling ceilings and displacement ventilation [12].
The cooling potential of an evaporative cooling tower (wet and hybrid) depends on the wet-bulb temperature. The wet-bulb temperature depends on the relative humidity of the air i.e. the dryer the air, the lower the wet-bulb temperature for a given dry-bulb temperature. This makes the potential of an evaporative cooler directly related to the humidity of the ambient air. Because the temperature that can be achieved using evaporation is lower than the dry-bulb temperature, an evaporative cooling tower can be used at higher ambient temperatures compared to dry-coolers.
Although in theory both hybrid and wet cooling towers can achieve the same cooling water temperature there is a difference in practice. Because in a wet cooling tower the actual water from the cooling system is evaporated (partly), there is a very high contact area between the water and the air. This makes it relatively easy for the air to reach its wet-bulb temperature. The hybrid cooling tower on the other hand has another heat exchange step over which a temperature difference must exist. This means that the cooling water temperature will always be higher than the temperature of the moistened air, the wet-bulb temperature. In practice this temperature difference is around 2 to 3 Kelvin depending on the type (size) of heat exchanger and cooling tower [7, 10].
2.2.3 Technical comparison The main weakness for both dry and evaporative coolers in the Netherlands is the fact that when the building has a high cooling demand (in summer), the cooler has a relatively low cooling potential and vice versa. This means that for space cooling, only in spring and autumn a dry cooler could be used directly. In summer, when the cooling demand is high, the cooling potential of a dry cooler is too low. In the winter the cooling potential of a dry cooler is highest but the demand is (almost) zero. Of course dry-coolers could be used directly for purposes with a high cooling demand not in the summer like data centres. This type of application goes beyond the scope of this report. Because of the low cooling potential in the summer, the dry cooler will not be investigated any further in this report.
Using the principle of evaporation, the potential of a cooling tower increases and might be sufficient to be used for space conditioning. Because evaporative cooling is theoretically more efficient, the focus will be on evaporative cooling in this report.
Chap
ter 2
: The
wor
king
prin
cipl
e of
coo
ling
tow
ers
13
2.3 Conditions for application Traditionally office buildings are ventilated with an all-air ventilation system. In this setting all ventilation air is centrally conditioned i.e. heated, cooled and (de)humidified. Typically these systems require a cooling temperature between 8-12oC. These low temperatures make it possible to dehumidify using the central chiller. For the application of evaporative cooling towers a few conditions must be met:
• A low latent cooling load; • High temperature cooling; • Low ventilation rates.
In modern office buildings these conditions can be met. With the high insulation standard, low air leakage and high efficiency ventilation applied in modern office buildings, the cooling load is often dominated by the internally generated sensible load [7]. This sensible load can often be met with high temperature cooling devices. The latent load, if present, is met in the central air handling unit and will be left out of consideration in this report.
2.3.1 High temperature cooling (HTC) The applicability of evaporative cooling depends on two temperatures: the achievable temperature of the cooling water and the temperature of the cooling device at which enough heat is extracted from the indoor air i.e. the required temperature. Both temperatures are of course time dependent as is the climate. In the ideal case the cooling water temperature is always lower than the required temperature. As described before, the cooling water temperature depends on the climate. The required temperature depends on the type of cooling device used and the set point temperature of the room which is being cooled.
High temperature cooling devices such as chilled ceilings or concrete core conditioning, can achieve enough cooling power at smaller temperature differences between cooling water and room temperature in comparison with traditional less efficient techniques. This is mainly achieved by using a large heat exchanging surface. The usage of such high temperature cooling devices is essential for applying evaporative cooling during periods of high cooling demand [7]. Several studies show that chilled ceilings can maintain reasonable thermal comfort with a supply temperature maximum of 18oC [7, 13]. Facão et al state that even supply temperatures from 18-20oC are sufficient in some cases [13]. This depends on the requirements for the indoor climate i.e. the comfort boundaries.
2.3.2 Ventilation Traditionally, the ventilation air of a building serves two purposes: supply of clean air and transport of energy (heating and cooling). In combined air-water systems these two goals are separated to a great extend.
Air only systems In a traditional building the heating and cooling energy is transported by the ventilation air. The amount of transported energy is often normative for the ventilation rate i.e. the amount of air needed to transport the energy is higher than the amount needed to maintain a reasonable indoor air quality (IAQ). The main reason for this is that air is a poor energy transporting medium. The low heat capacity (cp = 1.000 [J/kg.K]) and low density (ρ = 1 [kg/m3]) of air imply a volumetric heat capacity of (cp*ρ) 1.000 [J/m3.K]. This low capacity causes the air temperature to change rapidly
Chap
ter 2
: The
wor
king
prin
cipl
e of
coo
ling
tow
ers
14
when heat is added or removed. For performance and comfort reasons the air supply temperature is bound to a certain bandwidth. This bandwidth combined with the low volumetric heat capacity of air causes a higher ventilation rate than needed for indoor air quality.
Air-water systems In air-water systems both water and air are supplied to condition the building spaces. This way, maintaining IAQ and energy transport are separated; the air is used to provide clean air and the water is used to transport the energy. The preference of water above air for this purpose follows from the volumetric heat capacity of water with a density of 1.000 [kg/m3] and a heat capacity of 4.200 [J/kg.K]: 4.200.000 [J/m3.K]. In comparison with air this capacity is 4.200 times higher.
With the use of high temperature cooling the ventilation rate can be lowered in many cases because the air is not needed as a transport medium for cooling (and heating) purposes. This reduction in ventilation airflow reduces the energy consumption for ventilation and the size of ventilation ductwork. [14]
Ventilation efficiency By increasing the ventilation efficiency the ventilation can be lowered, lowering the cooling load. An example of high efficiency ventilation is displacement ventilation. This principle eliminates the mixing caused by other ventilation strategies. In the ideal case of this principle the new air pushes the older air out of the ventilated space and relatively warm air pollutants from occupants etc. rise up due to buoyancy. This ensures that the air near the occupant is as fresh as possible and the extracted air has a relatively high pollutant concentration compared to mixed ventilation, making the ventilation more efficient.
Figure 7: Rough principle of displacement ventilation [Adapted, original source: http://www.aivc.org/]
Chap
ter 2
: The
wor
king
prin
cipl
e of
coo
ling
tow
ers
15
2.4 Performance of a cooling tower To be able to compare a cooling tower with other cooling techniques, the performance must be known for different circumstances. In this paragraph the coefficient of performance (COP) will be calculated for different wet-bulb temperatures. For these calculations, data from a cooling tower from GEA Polacel will be used. The cooling tower used is of the open type. The technical data for this cooling tower has been obtained from the GEA PolaSelections website [1]. Because a counterflow cooling tower has the highest efficiency, this type will be investigated.
2.4.1 Coefficient of performance In general sense, the energetic efficiency of any device can be determined by dividing the amount of useful energy delivered, by the energy used to generate it. The amount of useful energy of a cooling tower is its cooling power expressed in watt (W). This cooling power can be calculated with the following formula:
With: Pc.tower: Cooling power of the cooling tower [W] φv: Flow of water [m3/s] ρwater: Density of water [kg/m3] cwater: Specific heat capacity of water [J/kg.K] Tin: Temperature of the water entering the cooling tower [K] Tout: Temperature of the water leaving the cooling tower [K]
The energy used to generate this cooling power can be divided in two parts: the energy used to power fan and the energy used to power the water pump. The main contributor to the total is the energy to power the fan. To save energy, the fan speed is reduced when the maximum cooling power is not needed. Traditionally this was realised with a two-speed motor. Modern cooling towers use a frequency controller to reduce the speed which is needed to match the capacity to the heat load. The lowest achievable speed is about 40% of the maximum speed of the motor. In figure 8 the relation between power and fan speed is shown for a single-speed, two-speed and variable speed (frequency controlled) motor. The hatched parts indicate the power savings. Note that due to the parabolic curve, for example at 40% of the maximum fan speed the fan uses only 10% of the energy.
The rated power of the motor is type specific and can be found in the technical data of the assessed cooling tower. The second contributor to the energy usage of a cooling tower is the energy to power
Figure 8: Fan speed vs. fan power [6]
Chap
ter 2
: The
wor
king
prin
cipl
e of
coo
ling
tow
ers
16
the water pump. This pump is used to keep the fill wet by circulating the water through the cooling tower. The power needed for the water pump will be calculated with the following formula:
With: φv: Flow of water [m3/s] Δpnozzle: Pressure difference over the nozzles of the cooling tower [Pa] g: Gravitational constant [m/s2] h: Height from inlet to the base [m] ΔPpipe: Pressure difference over the pipe transporting the water [Pa]
from the base to the inlet ηpump: Total efficiency of the water pump [-]
The capacity of the water pump cannot be controlled like the fan because the water distribution nozzles are designed for a certain pressure. Lowering the water flow/pressure will cause the fill to be inefficiently wetted and it can cause ‘channelling’ i.e. the water is not distributed over the fill but the water flows in channels through the fill seriously lowering performance of the cooling tower.
One contributor to the total has been left out of consideration: the energy used to keep the water in the reservoir at the bottom ice-free. This contributor is ignored because the heating element in the water reservoir is only used in the winter to start-up the cooling tower. Once it is running is can keep itself ice-free. In addition to this, the cooling tower will probably not be used for space-cooling in the winter with exception of spaces with an exceptionally high internal heat load e.g. server rooms and theatres.
The three factors mentioned before combine into the formula which is used to calculate the overall COP of a cooling tower:
With: COP: Coefficient of performance of the cooling tower [-] Pfan: Power input of the fan [W] Ppump: Power input of the water pump [W]
This formula will be used in the following paragraphs to calculate the performance of a cooling tower for different wet-bulb temperatures.
2.4.2 Calculation As an example for a counter flow cooling tower the model CMC4-DL-90-PS3/3 of GEA Polacel will be used. According to the technical data, this model can deliver a cooling power of 81 kW with a water temperature entering at 20oC and exiting at 18oC at a wet-bulb temperature of 16oC. This model has an extra efficient electromotor for a 2% extra investment compared to the standard electromotor on this cooling tower. It is assumed that this extra investment will pay off.
The following table shows the performance of the cooling tower described before, at different web-bulb temperatures with a constant inlet temperature of 20oC and a constant air velocity in the cooling tower.
Chap
ter 2
: The
wor
king
prin
cipl
e of
coo
ling
tow
ers
17
Table 1: Performance of the cooling tower at hand with a constant inlet temperature, constant outlet temperature, constant air velocity and descending wet-bulb temperature [1] Wet bulb temp (°C)
The data shows that at design wet-bulb temperature the cooling capacity is 81 kW. With descending wet-bulb temperature, this capacity increases. Because the air velocity in the cooling tower is kept constant, the power for the fan is also constant at 1.6 kW [1]. For the calculation of the pump power, the height (h) is estimated to be 2.5 meters and the pump efficiency 65%. According to the documentation the water flow is 32 m3/h and the nozzle pressure must be between 14.3 and 48 kPa, a value of 30 kPa is used for the calculation.
Using the formula stated in the former paragraph, the power of the pump is estimated:
With this formula, the COP of the cooling tower can be defined per wet-bulb temperature with a constant air flow. Because the cooling power of the cooling tower increases with a lower WBT and the input energy remains the same, the COP of the cooling tower will also increase with a decreasing WBT. In the following table the calculated efficiency of the cooling tower at hand is given for a wet-bulb temperature between -2 and 16oC.
Chap
ter 2
: The
wor
king
prin
cipl
e of
coo
ling
tow
ers
18
Figure 9: Air velocity to meet design parameters with changing WBT [1]
Table 2: Efficiency of the cooling tower at full fan power WBT [oC] -2 -1 0 1 2 3 4 5 6 7 8 9 10 11 12 13 14 15 16
As mentioned before, the capacity of the cooling tower is lowered by reducing the fan speed when full power is not needed. The following graph from the manufacturer’s data shows the fan speed for different wet-bulb temperatures with the same conditions as before i.e. 81 kW, cooling from 20 to 18oC.
With the graphs in figure 8 and figure 9 the fan power can be obtained when the fan speed is reduced. In the following table the fan speed, fan power and COP per WBT for 81 kW cooling power at design temperatures.
Table 3: Performance of the cooling tower at hand with constant cooling capacity, constant outlet temperature and variable fan power WBT [oC]
* Actual fan power is 10% because of the 40% speed minimum of a frequency controlled fan
As stated before, the fan power cannot be lower than 10% of the maximum power. For this reason the fan power of the cases with a WBT lower than 11oC is 10%/160W. In these cases the tower can be switched off for an amount of time. To prevent damage to the cooling tower the heat capacity must be designed in such a way that the cooling tower is not switched on and off too often. The cooling tower could also be operated longer than needed, but care has to be taken to prevent condensation on the heat dissipation system (HTC).
Chap
ter 3
: App
licab
ility
of e
vapo
rativ
e co
olin
g
19
3 Applicability of evaporative cooling The applicability of evaporative cooling depends on several factors. In this chapter these factors will be discussed and from this discussion the applicability in the Netherlands will be determined.
3.1 Spatial variations Because the cooling potential of cooling towers depends mainly on the climate, the applicability of cooling towers depends on its geographical position.
A common way to measure applicability of evaporative cooling towers is to calculate the amount of degree hours of wet-bulb temperature depression (WBTD). The WBTD is the difference between dry- and wet-bulb temperature. As discussed before this difference is the cooling potential for evaporative cooling. The WBTD degree hours are calculated by integrating the wet-bulb temperature depression over time per hour. In figure 10 a graphical representation of the degree hours of WBTD are given for a summer period in Europe.
Although this is a common way to measure the potential, it should be used with care. For instance, the figure shows that the central part of Spain has a high potential for evaporative cooling. This is true but the temperatures are also high, making the cooling power less suitable for space cooling. This process is illustrated in a cut-out of the Mollier diagram in figure 11. In this figure it is shown that the resulting wet-bulb temperature is high although the wet-bulb temperature depression is also high (11K). Depending on comfort criteria additional cooling might still be required. Note that the actual cooling temperature is higher than the indicated 24oC (see paragraph 2.2.1).
Figure 11: Mollier diagram illustrating relation between WBTD and applicability [Source: http://w3.bwk.tue.nl/nl/unit_bps/]
Figure 10: Degree hours of wet-bulb temperature depression over the summer period in Europe [3]
The Netherlands
Chap
ter 3
: App
licab
ility
of e
vapo
rativ
e co
olin
g
20
3.2 Temporal variations The potential for evaporative cooling does not only vary with place but also in time. This potential is affected by numerous factors e.g. wind direction, humidity of the surrounding area, solar irradiation, radiation of the soil (net radiation), etc. The latter has a particular large effect on the temperature variation. The daily minimum and maximum wet-bulb temperatures typically coincide with the minimum and maximum dry-bulb temperatures. In general the daily range of the wet-bulb temperature is about one-third of that of the dry-bulb temperature. [10] This is a very coarse estimate and of course this difference is constantly fluctuating with factors described earlier.
To determine the applicability, these fluctuations must be known because the maximum indoor temperature may not be surpassed too often, depending on the comfort criteria. The lowest wet-bulb temperatures occur just before sunrise and the highest in the afternoon. [10]
The seasonal variations also have an effect on the potential for evaporative cooling. As mentioned before the seasonal cooling demand for space conditioning of a typical building varies inversely with the evaporative cooling potential during the year. This means that the peak cooling demand occurs when the evaporative cooling potential is the lowest in the seasonal pattern and vice versa.
Figure 12 shows the expected cooling water temperatures of an indirect cooling tower for Dublin and Milan with an assumed difference between WBT and outlet temperature of 3K during the day and in the months that a cooling demand could be expected, based on TMY (typical meteorological year) data. [7] These two cities were chosen as representatives for a Northern and Southern city. The results for all north-west European, temperate climates are expected to be somewhere between the results in this figure. [7]
3.3 Applicability in the Netherlands In the former paragraphs it is shown that the cooling potential for evaporative cooling towers depends on temporal and spatial variations. To be able to analyse the application of evaporative cooling with cooling towers, it must be known what the temporal variation in cooling availability is for a certain location. For this research, the applicability in the Netherlands will be investigated. As reference data for the Netherlands, data from the weather station in ‘de Bilt’ will be used.
3.3.1 Mean diurnal patterns The graph on the next page illustrates the mean diurnal wet-bulb temperature in the period 1981-2000 in ‘de Bilt’ in the summer.
Figure 12: Possible cooling water temperatures in Dublin (top) and Milan (bottom) from May to October with an assumed difference of 3K between cooling water and wet-bulb temperature derived from TRY-data
Figure 13: Diurnal patterns of the mean wet-bulb temperature in the period 1981 – 2000 in ‘de Bilt’ from May to October
Chap
ter 3
: App
licab
ility
of e
vapo
rativ
e co
olin
g
22
In line with the former paragraphs, the graph in figure 13 shows that July and August are the months in which the highest mean wet-bulb temperatures occur. This graph also shows that on average the peak of the wet-bulb temperature occurs in the morning. Especially in July and August the maximum of the mean wet-bulb temperature occurs early in the morning between 07:00 and 09:00 AM. This means that at constant supply temperature the potential of the cooling tower starts increasing from this point in time onwards.
This phenomenon is further illustrated in the next graph in which the mean DBT, WBT and the difference between these two are depicted for August.
The maximum value of the difference between mean wet- and dry-bulb temperature (DBT-WBT), indicating the potential of the cooling tower (WBTD), occurs around 02.00PM. This point in time coincides with the moment at which the dry-bulb temperature, a (very) coarse indicator for the cooling load, is highest. This graph also agrees roughly with the statement from (Santamouris, 2007) that the range of the WBT is about one third of the range of the DBT. The graph disagrees with the statement of (Santamouris, 2007) that the daily minimum and maximum wet-bulb temperatures typically coincide with respectively the minimum and maximum dry-bulb temperatures.
3.3.2 Wet-bulb temperature In the table below the frequency of occurrence of different wet-bulb temperatures in ‘de Bilt’ is given, averaged over 20 years (1981-2000). The complete table can be found in appendix II.
Table 4: Occurrence of wet-bulb temperatures in 'de Bilt' averaged over 20 years (1981-2000)[15] JAN FEB MAR APR MAY JUN JUL AUG SEP OCT NOV DEC TOT TOT CUMM CUMM
Figure 14: Diurnal patterns of the mean WBT, DBT and difference between these two for August in the period 1981-2000 in ‘de Bilt’ from May to October
Chap
ter 3
: App
licab
ility
of e
vapo
rativ
e co
olin
g
23
19 - 20 1 9 18 14 5 47 1% 88 1%
18 - 19 0 1 17 30 25 12 0 85 1% 173 2%
17 - 18 0 4 24 44 45 20 4 141 2% 313 4%
16 - 17 1 11 36 64 78 34 9 232 3% 546 6%
15 - 16 2 16 53 84 98 61 19 0 333 4% 878 10%
14 - 15 0 3 23 68 102 115 72 31 1 415 5% 1293 15%
From this table follows that on average the wet-bulb temperature exceeds 18oC (the desired cooling water temperature for HTC) for 173 hours per year. This means that it is not possible to rely completely on evaporative cooling directly without the use of buffering and/or flexible comfort boundaries.
As mentioned before, to be able to exchange heat a temperature difference must exist between cooling water and wet-bulb temperature. In the potential calculation in paragraph 2.4 a difference of 2K was used as example. If a temperature difference of 2K over the cooling tower is taken into account, the desired wet-bulb temperature would be 16oC for HTC and this temperature would be exceeded 546 hours per year with the most of these hours occurring in August (78).
It also follows from the table that throughout an average year the wet-bulb temperature is always lower than 24oC. July and August are the months in which the highest wet-bulb temperatures occur. This observation corresponds with the findings of Costelloe and Finn [7] for a Northern city.
3.3.3 Critical hours In the former paragraph the mean temperatures per hour were examined. This is useful information to get an insight in the average cooling potential and profiles. To be able to assess the applicability of cooling towers for full passive cooling of an office building it is also useful to know if, when and for how long the cooling power is insufficient.
In the Netherlands the climate data of 1994 is commonly used as a reference year for cooling power. [16] In the following graph the amount of hours is displayed the threshold of 16oC for the WBT is exceeded. The total amount of hours the WBT exceeded 16oC was 476 in 1994, 217 of these excesses occurred during office hours (08:00 – 18:00).
Figure 15: Frequency in hours at which the WBT exceeds 16oC during office-hours
Chap
ter 3
: App
licab
ility
of e
vapo
rativ
e co
olin
g
24
Figure 17: Excess of the threshold of 16oC between July 30th and August 1st 1994
As mentioned earlier not only the amount of hours the threshold of 16oC is exceeded is interesting but also the degree to which this occurs consecutively i.e. if the threshold is surpassed for several consecutive hours the thermal comfort could be jeopardised. The graph above (figure 16) illustrates the moments at which the 16oC threshold was exceeded during 1994. From this graph follows that the threshold of 16oC is exceeded several times and the duration of these excesses range from 1 hour to 51 hours. The excess of 51 consecutive hours, the longest that year, occurred during July 30th and August 1st. In figure 17 this period is displayed in more detail. It is clearly visible that the threshold is exceeded for almost 3 consecutive days. Note that it is not certain that the full power is needed during periods of excess i.e. a WBT slightly higher than 16oC could still be sufficient if the demand is lower than the maximum capacity of the cooling tower at 16oC.
3.4 Buffering The former paragraph illustrates the need for a cooling buffer, flexible comfort boundaries or a combination of both. Apart from the need for a buffer because it is needed lower the exceeding hours, a buffer has other advantages:
• Increase in performance; because the WBT is generally lower during the night, the overall performance of the cooling tower will increase when the buffer is loaded during the night.
• Size reduction; because of the increase in performance and the fact that the cooling tower has more time to cool down the water (18:00-08:00 compared to 08:00-18:00) the size of the cooling tower could be designed smaller, lowering the investment for the cooling tower.
• Night tariff; in the Netherlands (and many other countries) the electricity is cheaper during the night because the overall demand is lower. Loading the buffer during the night could be cheaper than using the cooling tower during the day, depending on the storage efficiency (the ratio between energy output and input).
Figure 16: Excess of the threshold in time during 1994
Chap
ter 3
: App
licab
ility
of e
vapo
rativ
e co
olin
g
25
In this paragraph the main principles of thermal energy storage will be investigated. These principles can be divided into sensible and latent storage. [17] To get an idea of the storage volume this will be calculated for one suitable material per principle. Storage efficiency is not taken into account in this rough estimation.
The buffer size will be calculated for the duration of 1 workday (08:00-18:00; 10 hours) and an equivalent energy storage of 2/3 of the maximum power of 81kW continuously.
With these assumptions the total energy to be stored for 1 day is equal to:
3.4.1 Sensible – water In sensible heat storage, thermal energy is stored by raising (or lowering) the temperature of a certain buffer material. Water appears to be the most suitable material for sensible heat storage for this purpose because it is de medium which is being used by the cooling tower and no additional heat exchange would have to take place. Apart from this, water has a high specific heat capacity and is inexpensive compared to its alternatives e.g. rock, concrete, oils, organic liquids, etc. [17] If the building is made of concrete this could also be used as a buffer, combining building structure and building services in one element.
To account for heat-loss during storage, the temperature of the stored water has to be lower than the required temperature for cooling. The dimensions of the water-buffer will be calculated with a storage temperature of 18oC, it is assumed that the actual temperature will be lower because of the higher performance during the night, accounting for the heat-loss.
The specific heat capacity of water at 18oC is approximately 4.183 kJ/kg.K and its density is approximately 998.3kg/m3 at this temperature. These figures combined with a temperature difference of 2K over the cooling system result in a volumetric heat capacity of the water buffer of 8,351.8 kJ/m3. The total volume of the buffer with this material would be (1.94*106 / 8,351.8≈) 232.3 m3.
3.4.2 Latent Latent heat storage is based on the fact that a material needs a relatively large amount of energy to undergo a phase-change. This change occurs at a the phase transition temperature, depending on the material. Above and below this temperature the material usually behaves as sensible heat storage.
Many materials exist which are suitable for latent heat storage at different temperatures ranging from 10oC to 150oC. These materials can be divided in organic materials (paraffins and non-paraffins), inorganic materials (salt-hydrates and metallics) and eutectics. As example a paraffin will be used with 16 carbon atoms. This paraffin has a melting point of 16.7oC, a latent heat of fusion of 237.1 kJ/kg and a density of 773 kg/m3. The volumetric heat capacity follows from these values and is 1.83*105kJ/m3. The total volume of the buffer with this material would be 10.6 m3.
Chap
ter 3
: App
licab
ility
of e
vapo
rativ
e co
olin
g
26
3.5 Discussion Looking at the wet-bulb temperature depression (WBTD) the Netherlands has a medium (350-450 hours of WBT depression) potential for evaporative cooling compared to other European countries 50-900 hours of WBT depression).
The wet-bulb temperature profiles derived from the climate data in ‘de Bilt’ between 1981 and 2000 correspond with the findings of Costelloe and Finn [7] for a Northern European city: the highest wet-bulb temperatures occur in July and August, the range of the WBT is roughly one-third of the range of the DBT, and the maximum of the averaged WBT is 14oC. This last finding implies that on average the WBT is sufficiently low to provide in the total cooling demand which requires a maximum temperature of 16oC to be able to extract the heat from the building.
Despite of the former statement there are moments during the year when the cooling temperature is not low enough i.e. greater than 16oC. It is assumed that these moments coincide with the moments on which the maximum (design) capacity is needed, causing overheating. On average, between 1981 and 2000, the maximum temperature is exceeded for 546 hours. In 1994, a commonly used reference year for cooling capacity, this number was 476 of which 217 were during office hours (08:00-18:00). A further assessment of the climate data of 1994 has revealed that the threshold of 16oC is exceeded several times during that year and the duration of these excesses range from 1 hour to 51 hours. This last statement illustrates the need for a cooling buffer, flexible comfort boundaries or a combination of both when applying cooling towers in the Netherlands.
A buffer to overcome the full period of 3 days excess is undesirable, mainly for economic reasons (see §4.1.1). This means that the solution to the excesses will always be flexible comfort boundaries, possibly combined with a cooling buffer. When a buffer would be used to bridge one day, its size would depend on the used principle: sensible storage volume would be approximately 232.3 m3 and latent storage volume would be 10.6 m3. These volumes are likely to be even greater because of a limited storage efficiency. Because the size of the buffer is inversely proportional to the temperature difference, the size could be lowered if a lower buffer temperature could be achieved. Due to the generally lower WBT during the night, it is possible that a smaller buffer is sufficient for 1 day.
Chap
ter 4
: Eco
nom
ic a
pplic
abili
ty
27
Table 5: Specific price of cooling sources for a heat pump [2] Source Specific price[€/kWth] 100 kW 500 kW Ventilation air 350 320 Aquifer (heating and cooling) 900 400 Groundwater 850 350 Surface water 400 400 Soil collector 500 500 Open air 350 320
4 Economic applicability In the former paragraphs the technical applicability of cooling towers has been discussed. Because cooling towers are technically at least applicable in the Netherlands for base-cooling of office buildings the economic side of this should also be reviewed. This determines the chances for cooling towers to be applied in practice. The following review is by no means intended as a full economic analysis but as an indication of the position of cooling towers in relation to other cooling principles. The costs associated with a cooling tower are the investment and exploitation costs.
4.1.1 Investment As example of the investment for a cooling tower, the tower from the counterflow example (§2.4.2) will be used to calculate the cost per kW capacity. This cooling tower costs € 16.000 and has a capacity of 81 kW at given conditions (20oC inlet, 18oC outlet and 16oC WBT). The specific price of a cooling tower in this range follows from these figures: approximately 197 €/kW. Additional investments would be needed to make the cooling system completely sustainable e.g. for photovoltaic electricity generation. In table 5 the specific prices are given for alternative cooling sources in combination with a heat pump.
The price of a heat pump is not included in the price and would be approximately 200 €/kW [2]. Heat pumps also need high temperature cooling and low temperature heating dissipation systems to run efficiently. This makes the comparison independent of the dissipation systems e.g. concrete core conditioning and chilled ceilings.
A sensible water buffer costs approximately 63.41 €/m3 (surface mounted, steel). [18] The total price for the sensible buffer as calculated in paragraph 3.4.1 would be 180 €/kW installed cooling power (1 euro = 1.25 dollar). A latent (paraffin) buffer system costs approximately 106.13-112.82 €/kWh. [19] The total price for the latent buffer as calculated in paragraph 3.4.2 would be between 706 and 750 euro per kW installed cooling power.
4.1.2 Exploitation The exploitation costs consist of the energy cost, the cost of the water which is used and the cost for maintenance. The energy cost is directly related to the performance of the cooling tower when comparing to alternatives. This performance, a COP of approximately 35, is considerably better than that of a heat pump with a cooling COP of 3-6. When a buffer is used which can be loaded during the night, this could be beneficial for the total energy cost because of the lower night tariff. This would also increase the overall investment.
The water costs increase the exploitation cost of a cooling tower compared to other cooling techniques. The counter flow cooling tower used as example in §2.4.2 uses approximately 0.1 m3/h on average due to evaporation loss. With a price of € 0.73 per m³ [www.brabantwater.nl, d.d. 28/03/10] and an assumed amount of operation hours of 2.000 the total price for suppletion water for evaporation on yearly basis is € 147. Additional water is needed to keep the water in the cooling tower clean as the concentration of minerals and contamination rises due to the evaporation losses.
Chap
ter 4
: Eco
nom
ic a
pplic
abili
ty
28
The cooling tower needs to be serviced once a year. During maintenance the cooling tower is cleaned to maintain performance and prevent corrosion, algae and chalk deposition. Also the oil needs to be replaced in the fan reducer and the fan is checked for imbalance. The actual cost of this yearly maintenance is not known. A conventional system with a dry-cooler/condenser also needs to be serviced every year [6].
4.1.3 Conclusion From table 5 follows that the investment for the cooling tower of 81 kW is considerably lower than alternatives in the same power range. When including a sensible buffer the investment will still be lower than direct alternatives (~380 €/kW). The application of a latent buffer makes the total (~925 €/kW) investment higher than direct alternatives. As mentioned earlier in this report (§1.1), an aquifer system is only economical for larger buildings (>6,000m2). This trend is also visible in table 5 as the specific price drops from 900 to 400 €/kWth,source when going from 100kW to 500kW cooling power. This price is still considerably larger than the price for a cooling tower but it can also be used for heating, making the comparison less obvious.
The cost of the water used to compensate evaporation losses in the cooling tower is very small in comparison with the investment. The cost for maintenance is comparable to that of a conventional cooling system. The main advantage of a cooling tower is its performance/COP. This performance makes the running costs of the system significantly lower compared with its alternatives.
From this coarse analysis follows that a cooling tower for passive cooling is at least economically feasible in the lower range of cooling power. A complete analysis of actual investment and running costs compared to its alternatives should be made to justify application.
Chap
ter 5
: Con
clus
ion
29
5 Conclusion
5.1 General The application of passive cooling with a cooling tower (without the use of a chiller) is technically feasible in the Netherlands. To be able to extract enough heat from a building the cooling water temperature should be 18oC at most. A difference of at least 2K between outlet temperature and wet-bulb temperature should exist to exchange the heat with the ambient air in the cooling tower. This makes the required wet-bulb temperature 16oC. The technical feasibility follows from the fact that the average wet-bulb temperature in the Netherlands is lower than this limit during the cooling season. This corresponds to the findings of Costelloe and Finn 2002. [7]
When the minimum WBT of 16oC is not exceeded a cooling tower is a very efficient means of cooling with a COP of 35. As cooling method for base cooling, a cooling tower in the Netherlands could be used continuously. As cooling method to meet the full cooling load in an office building, flexible comfort boundaries should be applied to bridge the hours the availability of sufficiently cool water is too low. The indoor temperature will rise in this case. In the commonly used reference year 1994 this occurred for 217 hours during office hours. A buffer could be used to lower the amount of hours the outlet temperature is too high. A point of concern is the size of a buffer for 1 day: approximately 232 m3 for a sensible buffer and 10.6 m3 for a latent buffer.
The application of passive cooling with a cooling tower (without the use of a chiller and buffer) is also economically feasible in the Netherlands, at least at cooling capacities of around 100 kW. This follows from a coarse evaluation of the investment and exploitation costs in comparison with alternative cooling sources with a heat pump in this capacity range. Including a sensible (water) buffer does not change this statement. A latent (paraffin) buffer increases the investment per kW by 375%, depending on the comfort criteria this investment could still be feasible if a sensible buffer is not possible due to its size.
5.2 Recommendations This report is the result of an analysis of the applicability of cooling towers in the Netherlands. During this research a few assumptions have been made and aspects have been left out of consideration to restrict the extent of the research. Following are a few topics which could be investigated for further research:
• In this report data from a manufacturer has been used to calculate the COP of a certain cooling tower at different WBT’s. To be certain about the performance of cooling towers the results should be compared to actual measurements and possibly compared to other manufacturers i.e. check the validity of the manufacturer’s data.
• This report focuses solely on the application of cooling. When designing a new building in the Dutch climate, heating and cooling should be treated at the same time to generate an optimum design. It would be interesting to know what the effect would be on the applicability of cooling towers in the Netherlands.
• Because the difference between WBT and inlet temperature determine the performance of a cooling tower, the use of a cooling tower could be extra beneficial when applied in places with a high cooling load in the winter too e.g. ICT rooms, data centres and theatres.
Chap
ter 5
: Con
clus
ion
30
• Cooling towers produce noise when in operation. This could pose problems in urban areas, especially during the night. Many solutions exist to limit the amount of noise a cooling tower makes. It would be interesting to know to what extend these measures work and if the resulting sound pressure is sufficiently low.
• Cooling towers have been in the news in a negative way because of the risk of Legionnaires’ disease. Because of the low temperatures when applying cooling towers for direct building cooling the risk is relatively low. According to the manufacturer the risk of Legionnaires’ disease can be averted with proper maintenance.
• From the literature study in this report follows that a wet cooling tower is more efficient than, or at least as efficient as a dry-cooler. This raises the question why dry-coolers are used most commonly. This might be because of deficient general knowledge (maintenance cost, occupied space, performance, etc.) on the topic. Bad publicity of poorly maintained cooling towers could also have had an effect on this.
References 1. GEA Polacel. GEA PolaSelections. [cited 2010; Available from:
http://www.polacel.nl/polaselections. 2. SenterNovem, Cijfers en tabellen, in Kompas, energiebewust wonen en werken. 2007. 3. Molina, S.Y.E.E.J.L., Roof Cooling Techniques: A design handbook. 2006: Earthscan. 4. GEA Polacel, Koeltorenboekje, in 'Koeltorens'. 5. Notitie: Afstuderen bij DWA installatie- energieadvies. 2009, DWA installatie- en
energieadvies. 6. ASHRAE: American Society of Heating Refrigerating and Air-Conditioning Engineers, 2008
ASHRAE handbook heating, ventilating, and air-conditioning systems and equipment. 2008, ASHRAE: Atlanta, Ga. p. 1 v. (various pagings).
7. Costelloe, B. and B. Finn, Indirect evaporative cooling potential in air-water systems in temperate climates. Energy and Buildings, 2002. 35: p. 573-591.
8. Jin, G.-Y., et al., A simplified modeling of mechanical cooling tower for control and optimization of HVAC systems. Energy Conversion and Management, 2007. 48(2): p. 355-365.
9. SenterNovem, Energiedata 2008. 2008, Ministerie van Volkshuisvesting, Ruimtelijke Ordening en Milieubeheer.
10. Advances in Passive Cooling. Earthscan, ed. M. Santamouris. 2007: Earthscan. 11. Givoni, B., Indoor temperature reduction by passive cooling systems. Solar Energy, 2009. In
Press, Corrected Proof. 12. Costelloe, B. and D. Finn, Thermal effectiveness characteristics of low approach indirect
cooling systems in buildings. Energy and Buildings, 2007. 39. 13. Facão, J. and A.C. Oliveira, Thermal behaviour of closed wet cooling towers for use with
chilled ceilings. Applied Thermal Engineering, 2000. 20(13): p. 1225-1236. 14. Klimaatplafonds / Koelconvectoren. ISSO Publicatie 48. 1998. 15. KNMI klimaatdata en -advies. [cited 2010 January 6, 2010]; Available from:
http://www.knmi.nl/klimatologie. 16. Hensen, J., Referentiejaar of beter een langere referentieperiode? TVVL Magazine, 2005. 17. Sharma, A., et al., Review on thermal energy storage with phase change materials and
applications. Renewable and Sustainable Energy Reviews, 2009. 13(2): p. 318-345. 18. Crowther & Partnes, L. and I. George Reeves Associates, Stratified Chilled-Water storage
Design Guide, in EM-4852. 1988, Electric Power Research Institute: California. 19. He, B. and F. Setterwall, Technical grade paraffin waxes as phase change materials for cool
thermal storage and cool storage systems capital cost estimation. Energy Conversion and Management, 2002. 43(13): p. 1709-1723.
II: Occurrence of wet-bulb temperatures in ‘de Bilt’ averaged over 20 years (1981-2000)
III: Technical data GEA Polacel - CMC4-DL-90-PS3/3
IV: Part of ASHRAE fundamentals about the heat balance and performance of cooling towers
Appendix I: Mollier diagram
Appendix II: Frequency of occurrence of wet-bulb temperatures Measured in ‘de Bilt’ averaged over 20 years (1981-2000)[15]
JAN FEB MRT APR MEI JUN JUL AUG SEP OKT NOV DEC TOT TOT CUMM CUMM(hrs) (hrs) (hrs) (hrs) (hrs) (hrs) (hrs) (hrs) (hrs) (hrs) (hrs) (hrs) (hrs) (%) (hrs) (%)
Datum : 21-1-2010 11:27:33 Ons projectnummer : 1000 Uw referentie : Test5 | TU Eindhoven Pagina : 2 / 2
GEA Polacel Cooling Towers B.V.
Waterverbruik
Gemiddeld verdampingsverlies : 0.1 m3/h
De maximale verdamping, welke de suppletie bepaalt, kan 25% hoger zijn.
Spuiverlies : Afhankelijk van de waterkwaliteit
Geluidsvermogen koeltoren
Het totale geluidsvermogen (PWL) van de koeltoren wordt bepaald door sommatie van de verschillende deelbronnen: ventilatoruitblaas en luchtinlaat. Het geluid aan de luchtinlaat is een gevolg van het in de wateropvangbak vallende koelwater. Dit geluid kan gedempt worden met door Polacel ontwikkelde drijvende dempers. De opgave is conform DIN 45635 Sub 46, klasse 3. De geluidsdruk op afstand kan worden berekend met behulp van de tabel “Conversie geluidsvermogen naar geluidsdruk tegenstroom”. PWL - uitblaas ventilator : 85.7 dB(A)
PWL - luchtinlaat zonder dempers : 87.3 dB(A)
PWL - koeltoren totaal zonder dempers : 89.6 dB(A)
De toepassing van drijvende dempers reduceert het geluid aan de luchtinlaat.
PWL - luchtinlaat met dempers : 76.8 dB(A)
PWL - koeltoren totaal met dempers : 86.3 dB(A)
Materiaal specificatie
Ventilatorbladen/ type : Aluminium / 05-06-24L/B3TR Stock NL
Suppletie-afsluiter met vlotter (max. 250 kPa / 36,25 PSI)
Appendix IV: Part of ASHRAE fundamentals about the heat balance and performance of cooling towers
Cooling Towers 39.15
general operating characteristics described. (See specific manufac-turer’s data for maximum accuracy when planning for test or criticaltemperature needs.)
A cooling tower selected for a specified design condition willoperate at other temperature levels when the ambient temperature isoff-design or when heat load or flow rate varies from the design con-dition. When flow rate is held constant, range falls as heat load falls,causing temperature levels to fall to a closer approach. Hot- and cold-water temperatures fall when the ambient wet bulb falls at constantheat load, range, and flow rate. As water loading to a particular towerfalls at constant ambient wet bulb and range, the tower cools thewater to a lower temperature level or closer approach to the wet bulb.
COOLING TOWER THERMAL PERFORMANCE
Three basic alternatives are available to a purchaser/designerseeking assurance that a cooling tower will perform as specified:(1) certification of performance by an independent third party suchas the Cooling Technology Institute (CTI), (2) an acceptance testperformed at the site after the unit is installed, or (3) a performancebond. Codes and standards that pertain to performance certificationand field testing of cooling towers are listed in Chapter 51.
Certification. The thermal performance of many commerciallyavailable cooling tower lines, both open- and closed-circuit, is cer-tified by CTI in accordance with their Standard STD-201, whichapplies to mechanical-draft, open- and closed-circuit water coolingtowers. It is based on entering wet-bulb temperature and certifiestower performance when operating in an open, unrestricted environ-ment. Independent performance certification eliminates the need forfield acceptance tests and performance bonds.
Field Acceptance Test. As an alternative to certification, towerperformance can be verified after installation by conducting a fieldacceptance test in accordance with one of the two available test stan-dards. Of the two standards, CTI Standard ATC-105 is more com-monly used, although American Society of Mechanical Engineers(ASME) Standard PTC-23 is also used. These standards are similarin their requirements, and both base the performance evaluation onentering wet-bulb temperature. ASME Standard PTC-23, however,provides an alternative for evaluation based on ambient wet-bulbtemperature as well.
With either procedure, the test consists of measuring the hot-water temperature in the inlet piping to the tower or in the hot-waterdistribution basin. Preferably, the cold-water temperature is mea-sured at the discharge of the circulating pump, where there is muchless chance for temperature stratification. The wet-bulb temperatureis measured by an array of mechanically aspirated psychrometers.The recirculating water flow rate is measured by any of severalapproved methods, usually a pitot-tube traverse of the piping lead-ing to the tower. Recently calibrated instruments should be used forall measurements, and electronic data acquisition is recommendedfor all but the smallest installations.
For an accurate test, the tower should be running under a steadyheat load combined with a steady flow of recirculating water, bothas near design as possible. Weather conditions should be reasonablystable, with prevailing winds of 4.5 m/s or less. The tower should beclean and adjusted for proper water distribution, with all fans oper-ating at design speed. Both the CTI and ASME standards specifymaximum recommended deviations from design operating condi-tions of range, flow, wet-bulb temperature, heat load, and fan power.
Performance Bond. A few manufacturers offer a performancebond, which provides for seeking redress from a surety in the eventthe cooling tower does not meet the manufacturer’s rated thermalperformance.
COOLING TOWER THEORY
Baker and Shryock (1961) developed the following theory.Consider a cooling tower having one square metre of plan area;
cooling volume V, containing extended water surface per unit vol-ume a; and water mass flow rate L and air mass flow rate G. Figure26 schematically shows the processes of mass and energy transfer.The bulk water at temperature t is surrounded by the bulk air at dry-bulb temperature ta, having enthalpy ha and humidity ratio Wa . Theinterface is assumed to be a film of saturated air with an intermedi-ate temperature t″, enthalpy h″, and humidity ratio W″. Assuming aconstant value of 4.19 kJ/(kg ·K) for the specific heat of water cp,the total energy transfer from the water to the interface is
dqw = Lcp dt = KLa(t – t″)dV (2)
whereqw = rate of total heat transfer, bulk water to interface, WL = inlet water mass flow rate, kg/s
KL = unit conductance, heat transfer, bulk water to interface, W/(m2·K)
V = cooling volume, m3
a = area of interface, m2/m3
The heat transfer from interface to air is
dqs = KG a(t″ – ta)dV (3)
whereqs = rate of sensible heat transfer, interface to airstream, W
KG = overall unit conductance, sensible heat transfer, interface to main airstream, W/(m2·K)
The diffusion of water vapor from film to air is
dm = K ′a(W″ – Wa)dV (4)
wherem = mass transfer rate, interface to airstream, kg/s
K ′ = unit conductance, mass transfer, interface to main airstream, kg/(s·m2)
W″ = humidity ratio of interface (film), kg/kgWa = humidity ratio of air, kg/kg
The heat transfer due to evaporation from film to air is
dqL = r dm = rK′a(W″ – Wa)dV (5)
whereqL = rate of latent heat transfer, interface to airstream, W
r = latent heat of evaporation (constant), kJ/kg
The process reaches equilibrium when ta = t, and the air be-comes saturated with moisture at that temperature. Under adiabatic
Fig. 26 Heat and Mass Transfer Relationships BetweenWater, Interfacial Film, and Air
Fig. 26 Heat and Mass Transfer Relationships Between Water, Interfacial Film, and Air
39.16 2008 ASHRAE Handbook—HVAC Systems and Equipment (SI)
conditions, equilibrium is reached at the temperature of adiabaticsaturation or at the thermodynamic wet-bulb temperature of the air.This is the lowest attainable temperature in a cooling tower. Thecirculating water rapidly approaches this temperature when a toweroperates without heat load. The process is the same when a heatload is applied, but the air enthalpy increases as it moves throughthe tower so the equilibrium temperature increases progressively.The approach of the cooled water to the entering wet-bulb temper-ature is a function of the capability of the tower.
Merkel (1925) assumed the Lewis relationship to be equal to onein combining the transfer of mass and sensible heat into an overallcoefficient based on enthalpy difference as the driving force:
KG/(K ′cpm) = 1 (6)
where cpm is the humid specific heat of moist air in J/(kg ·K) (dry airbasis).
Equation (5) also explains why the wet-bulb thermometerclosely approximates the temperature of adiabatic saturation in anair-water vapor mixture. Setting water heat loss equal to air heatgain yields
Lcp dt = G dh = K ′a(h″ – ha)dV (7)
where G is the air mass flow rate in kg/s.The equation considers the transfer from the interface to the air-
stream, but the interfacial conditions are indeterminate. If the filmresistance is neglected and an overall coefficient K ′ is postulated,based on the driving force of enthalpy h ′ at the bulk water temper-ature t, the equation becomes
Lcp dt = G dh = K ′a(h′ – ha)dV (8)
or (9)
and (10)
In cooling tower practice, the integrated value of Equation (8) iscommonly referred to as the number of transfer units (NTU). Thisvalue gives the number of times the average enthalpy potential (h′ −ha) goes into the temperature change of the water (∆ t) and is a mea-sure of the difficulty of the task. Thus, one transfer unit has the def-inition of cp∆t/(h′ − ha)avg = 1.
The equations are not self-sufficient and are not subject to directmathematical solution. They reflect mass and energy balance at anypoint in a tower and are independent of relative motion of the twofluid streams. Mechanical integration is required to apply the equa-tions, and the procedure must account for relative motion. Integra-tion of Equation (8) gives the NTU for a given set of conditions.
Counterflow IntegrationThe counterflow cooling diagram is based on the saturation
curve for air-water vapor (Figure 27). As water is cooled from tw1 totw2, the air film enthalpy follows the saturation curve from A to B.Air entering at wet-bulb temperature taw has an enthalpy ha corre-sponding to C ′. The initial driving force is the vertical distance BC.Heat removed from the water is added to the air, so the enthalpyincrease is proportional to water temperature. The slope of the airoperating line CD equals L/G.
Counterflow calculations start at the bottom of a tower, the onlypoint where the air and water conditions are known. The NTU is cal-culated for a series of incremental steps, and the summation is theintegral of the process.
Example 1. Air enters the base of a counterflow cooling tower at 24°Cwet-bulb temperature, water leaves at 30°C, and L/G (water-to-air ratio)is 1.2, so dh = 1.2 × 4.18 × dt, where 4.18 kJ/(kg·K) is the specific heatcp of water. Calculate the NTU for various cooling ranges.
Solution: The calculation is shown in Table 2. Water temperatures areshown in column 1 for 0.5 K increments from 30 to 33°C and 1 Kincrements from 33 to 38°C. The corresponding film enthalpies,obtained from psychrometric tables, are shown in column 2.
The upward air path is shown in column 3. The initial air enthalpyis 72.40 kJ/kg, corresponding to a 24°C wet bulb, and increases by therelationship ∆ h = 1.2 × 4.18 × ∆ t.
The driving force h ′ − ha at each increment is listed in column 4.The reciprocals 1/(h ′ − ha) are calculated (column 5), ∆ t is noted (col-umn 6), and the average for each increment is multiplied by cp∆ t toobtain the NTU for each increment (column 7). The summation of the
Table 2 Counterflow Integration Calculations for Example 1
incremental values (column 8) represents the NTU for the summationof the incremental temperature changes, which is the cooling rangegiven in column 9.
Because of the slope and position of CD relative to the saturationcurve, the potential difference increases progressively from the bot-tom to the top of the tower in this example. The degree of difficultydecreases as this driving force increases, reflected as a reduction inthe incremental NTU proportional to a variation in incrementalheight. This procedure determines the temperature gradient withrespect to tower height.
The procedure of Example 1 considers increments of tempera-ture change and calculates the coincident values of NTU, whichcorrespond to increments of height. Baker and Mart (1952) devel-oped a unit-volume procedure that considers increments of NTU(representing increments of height) with corresponding temperaturechanges calculated by iteration. The unit-volume procedure is morecumbersome but is necessary in cross-flow integration because itaccounts for temperature and enthalpy change, both horizontallyand vertically.
Cross-Flow IntegrationIn a cross-flow tower, water enters at the top; the solid lines of
constant water temperature in Figure 28 show its temperature dis-tribution. Air enters from the left, and the dotted lines show constantenthalpies. The cross section is divided into unit volumes in whichdV becomes dxdy and Equation (7) becomes
cpL dt dx = G dh dy = Ka(h′ – ha)dx dy (11)
The overall L/G ratio applies to each unit-volume by consideringdx/dy = w/z. The cross-sectional shape is automatically consideredwhen an equal number of horizontal and vertical increments areused. Calculations start at the top of the air inlet and proceed downand across. Typical calculations are shown in Figure 29 for waterentering at 50°C, air entering at 24°C wet-bulb temperature, andL /G = 1.0. Each unit-volume represents 0.1 NTU. Temperaturechange vertically in each unit is determined by iteration from
∆t = 0.1(h′ – ha)avg (12)
The expression cp(L /G)dt = dh determines the horizontal changein air enthalpy. With each step representing 0.1 NTU, two stepsdown and across equal 0.2 NTU, etc., for conditions correspondingto the average leaving water temperature.
Figure 28 shows that air flowing across any horizontal planemoves toward progressively hotter water, with entering hot watertemperature as a limit. Water falling through any vertical sectionmoves toward progressively colder air that has the entering wet-bulbtemperature as a limit. This is shown in Figure 30, which is a plot ofthe data in Figure 29. Air enthalpy follows the family of curves radi-ating from Point A. Air moving across the top of the tower tends tocoincide with OA. Air flowing across the bottom of a tower of infiniteheight follows a curve that coincides with the saturation curve AB.
Water temperatures follow the family of curves radiating fromPoint B, between the limits of BO at the air inlet and BA at the outletof a tower of infinite width. The single operating line CD of thecounterflow diagram in Figure 27 is replaced in the cross-flow dia-gram (Figure 30) by a zone represented by the area intersected bythe two families of curves.
TOWER COEFFICIENTS
Calculations can reduce a set of conditions to a numerical valuerepresenting degree of difficulty. The NTU corresponding to a set ofhypothetical conditions is called the required coefficient and eval-uates degree of difficulty. When test results are being considered,the NTU represents the available coefficient and becomes an evalu-ation of the equipment tested.
The calculations consider temperatures and the L/G ratio. Theminimum required coefficient for a given set of temperatures occursat L/G = 0, corresponding to an infinite air rate. Air enthalpy does notincrease, so the driving force is maximum and the degree of difficulty
Fig. 27 Counterflow Cooling Diagram
Fig. 27 Counterflow Cooling Diagram
Fig. 28 Water Temperature and Air Enthalpy VariationThrough Cross-Flow Cooling Tower
Fig. 28 Water Temperature and Air Enthalpy Variation Through Cross-Flow Cooling Tower
39.18 2008 ASHRAE Handbook—HVAC Systems and Equipment (SI)
is minimum. Decreased air rate (increase in L/G) decreases the driv-ing force, and the greater degree of difficulty shows as an increase inNTU. This situation is shown for counterflow in Figure 31. Maxi-mum L/G (minimum air rate) occurs when CD intersects the satura-tion curve. Driving force becomes zero, and NTU is infinite. Thepoint of zero driving force may occur at the air outlet or at an inter-mediate point because of the curvature of the saturation curve.
Similar variations occur in cross-flow cooling. Variations in L/Gvary the shape of the operating area. At L/G = 0, the operating areabecomes a horizontal line, which is identical to the counterflow dia-gram (Figure 31), and both coefficients are the same. An increase inL/G increases the height of the operating area and decreases thewidth. This continues as the areas extend to Point A as a limit. Thismaximum L/G always occurs when the wet-bulb temperature of theair equals the hot-water temperature and not at an intermediatepoint, as may occur in counterflow.
Both types of flow have the same minimum coefficient at L/G = 0,and both increase to infinity at a maximum L/G. The maximums arethe same if the counterflow potential reaches zero at the air outlet, butthe counterflow tower will have a lower maximum L/G when thepotential reaches zero at an intermediate point, as in Figure 31. Acooling tower can be designed to operate at any point within the two
Fig. 29 Cross-Flow Calculations
Fig. 29 Cross-Flow Calculations(Baker and Shryock 1961)
limits, but most applications restrict the design to much narrower lim-its determined by air velocity.
A low air rate requires a large tower, while a high air rate in asmaller tower requires greater fan power. Typical limits in air veloc-ity are about 1.5 to 3.6 m/s in counterflow and 1.8 to 4 m/s or morein cross-flow.
Available CoefficientsA cooling tower can operate over a wide range of water rates, air
rates, and heat loads, with variation in the approach of the cold waterto the wet-bulb temperature. Analysis of a series of test points showsthat the available coefficient is not a constant but varies with theoperating conditions, as shown in Figure 32.
Figure 32 is a typical correlation of a tower characteristic showingthe variation of available KaV/L with L/G for parameters of constantair velocity. Recent fill developments and more accurate test meth-ods have shown that some of the characteristic lines are curves ratherthan a series of straight, parallel lines on logarithmic coordinates.
Ignoring the minor effect of air velocity, a single average curvemay be considered:
Ka V /L ~ (L /G)″ (13)
The exponent n varies over a range of about –0.35 to –1.1 but aver-ages between –0.55 and –0.65. Within the range of testing, –0.6 hasbeen considered sufficiently accurate.
The family of curves corresponds to the following relation:
Ka V/L ~ (L) n (G) m (14)
where m varies slightly from n numerically and is a positive exponent.The triangular points in Figure 32 show the effect of varying tem-
perature at nominal air rate. The deviations result from simplifyingassumptions and may be overcome by modifying the integrationprocedure. Usual practice, as shown in Equation (9), ignores evap-oration and assumes that
G dh = cpL dt (15)
The exact enthalpy rise is greater than this because a portion ofthe heat in the water stream leaves as vapor in the airstream. Thecorrect heat balance is as follows (Baker and Shryock 1961):
(16)
where LE is the mass flow rate of water that evaporates, in kg/s. Thisreduces the driving force and increases the NTU.
Evaporation causes the water rate to decrease from L at the inlet toL − LE at the outlet. The water-to-air ratio varies from L/G at the waterinlet to (L − LE)/G at the outlet. This results in an increased NTU.
Basic theory considers the transfer from the interface to the air-stream. As the film conditions are indeterminate, film resistance isneglected as assumed in Equation (7). The resulting coefficientsshow deviations closely associated with hot water temperature andmay be modified by an empirical hot water correction factor (Bakerand Mart 1952).
The effect of film resistance (Mickley 1949) is shown in Figure33. Water at temperature t is assumed to be surrounded by a film ofsaturated air at the same temperature at enthalpy h′ (Point B on thesaturation curve). The film is actually at a lower temperature t ″ atenthalpy h″ (Point B′ ). The surrounding air at enthalpy ha corre-sponds to Point C. The apparent potential difference is commonlyconsidered to be h′ − ha , but the true potential difference is h ″ − ha(Mickley 1949). From Equations (1) and (6),
(17)
The slope of CB′ is the ratio of the two coefficients. No means toevaluate the coefficients has been proposed, but a slope of −11.1 forcross-flow towers has been reported (Baker and Shryock 1961).
Establishing Tower CharacteristicsThe performance characteristic of a fill pattern can vary widely
because of several external factors. For a given volume of fill, theoptimal thermal performance is obtained with uniform air and waterdistribution throughout the fill pack. Irregularities in either alter thelocal L/G ratios within the pack and adversely affect the overall ther-mal performance of the cooling tower. Accordingly, the design of thetower water distribution system, air inlets, fan plenum, and so forth isvery important in ensuring that the tower will perform to its potential.
In counterflow towers, some cooling occurs in the spray chamberabove the fill and in the open space below the fill. This additionalperformance is erroneously attributed to the fill itself, which canlead to inaccurate predictions of a tower’s performance in otherapplications. A true performance characteristic for the total coolingtower can only be developed from full-scale tests of the actual cool-ing tower assembly, typically by the tower manufacturer, and not bycombining performance data of individual components.
ADDITIONAL INFORMATION
The Cooling Technology Institute (CTI) offers a reference guideon CD-ROM containing information on pyschrometrics, MerkelKaV/L calculation, characteristic curve performance evaluation, andperformance curve evaluation, along with general information oncooling towers.
REFERENCES
ASHRAE. 1998. Legionellosis position document.ASHRAE. 2000. Minimizing the risk of Legionellosis associated with build-
ing water systems. Guideline 12.ASME. 2003. Atmospheric water cooling equipment. ANSI/ASME Stan-
dard PTC 23-2003. American Society of Mechanical Engineers, NewYork.
Baker, D.R. and H.A. Shryock. 1961. A comprehensive approach to theanalysis of cooling tower performance. ASME Transactions, Journal ofHeat Transfer (August):339.
Gdh cpLdt= cpLE
tw2( )+
h″ ha–
t t″–-----------------
KL
K′------=
Fig. 33 True Versus Apparent Potential Difference
Fig. 33 True Versus Apparent Potential Difference(Baker and Shryock 1961)


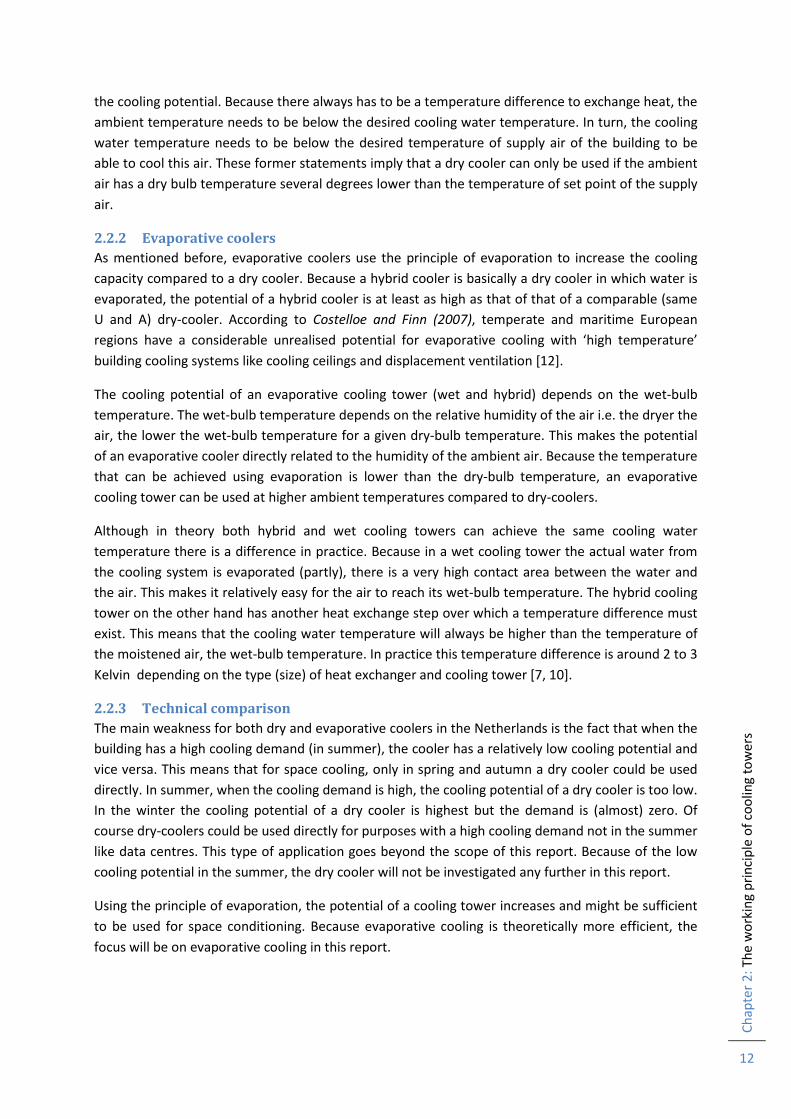

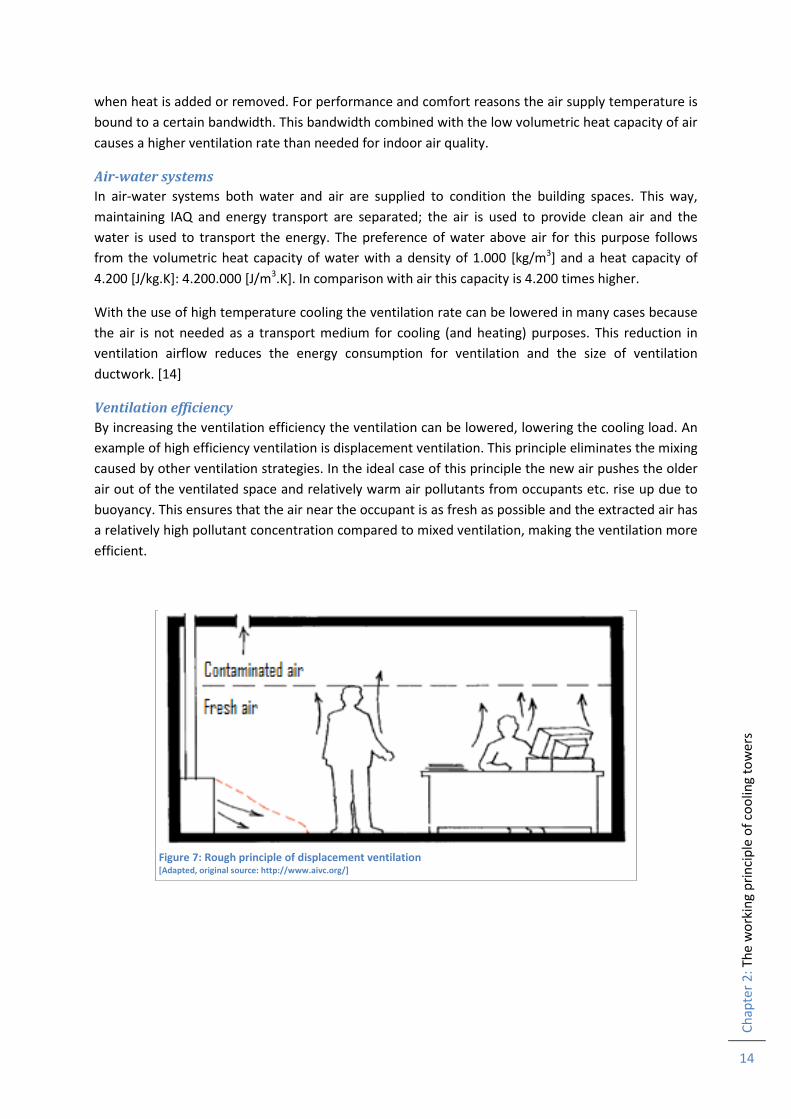

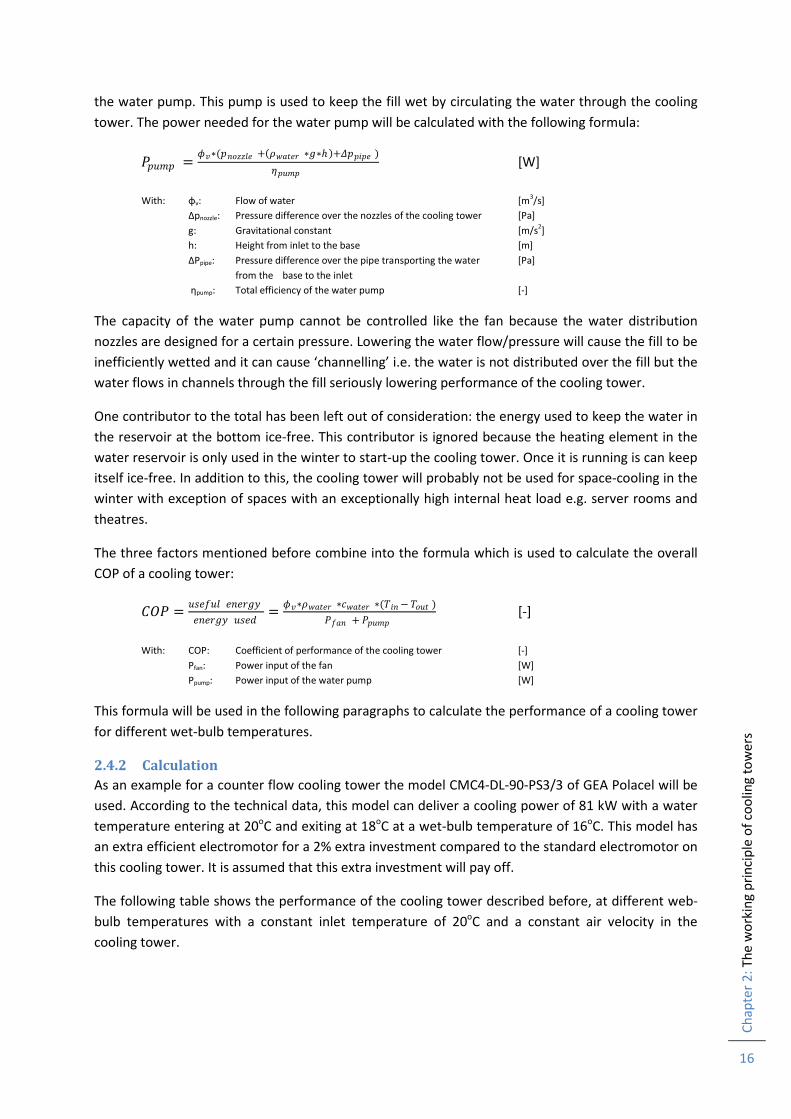

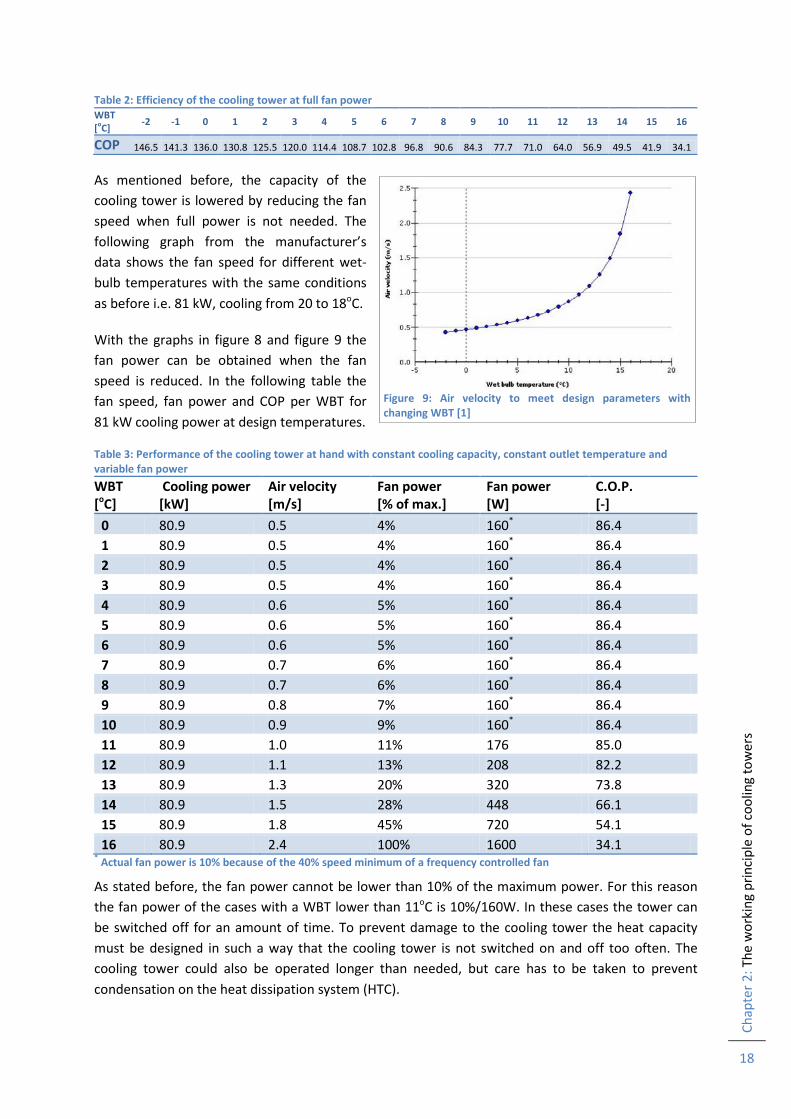

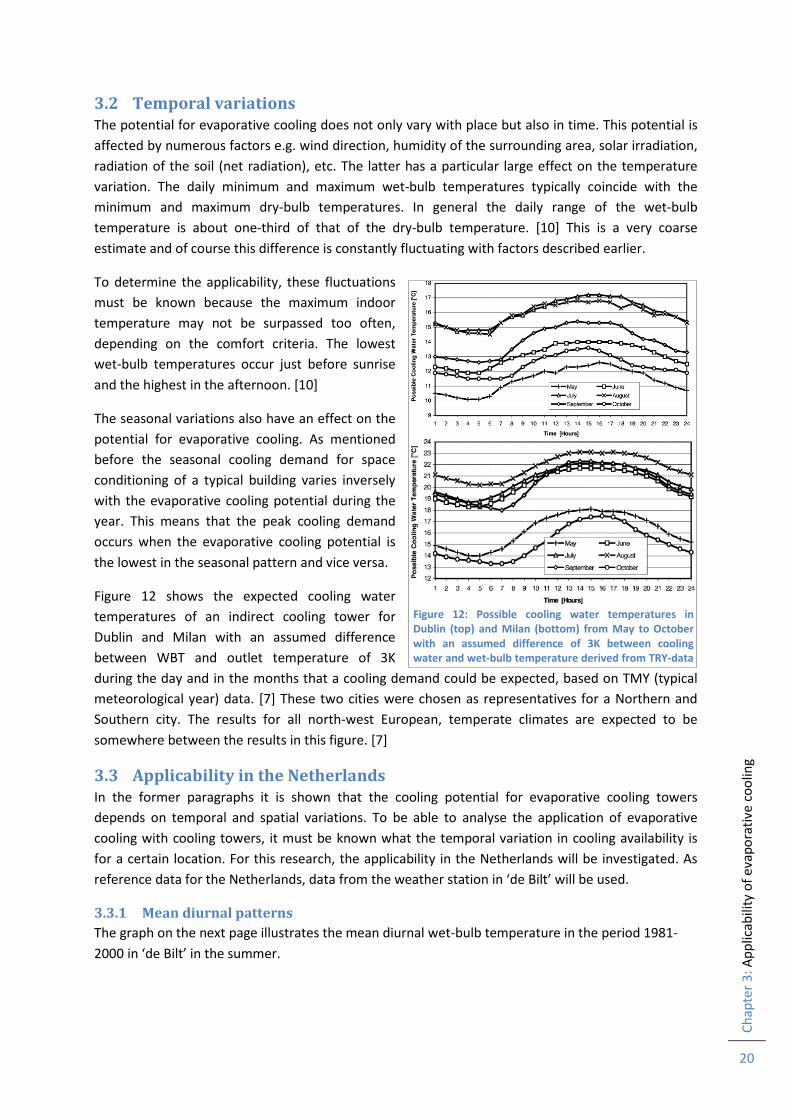
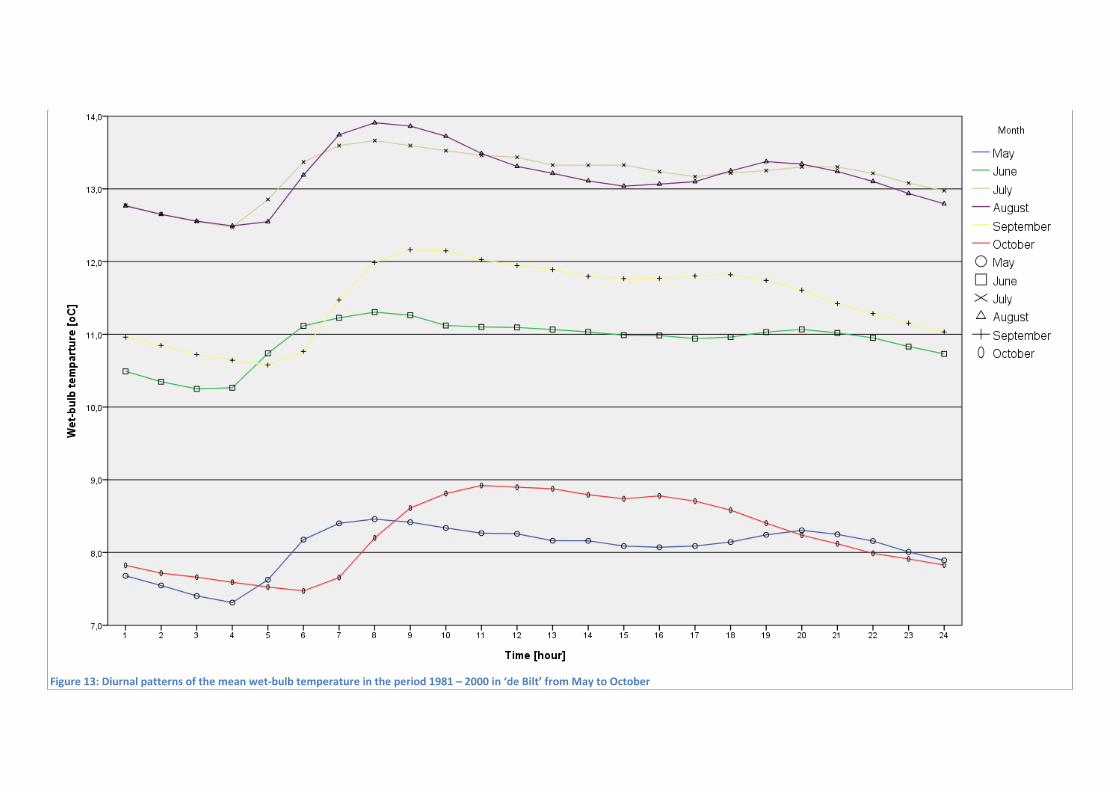

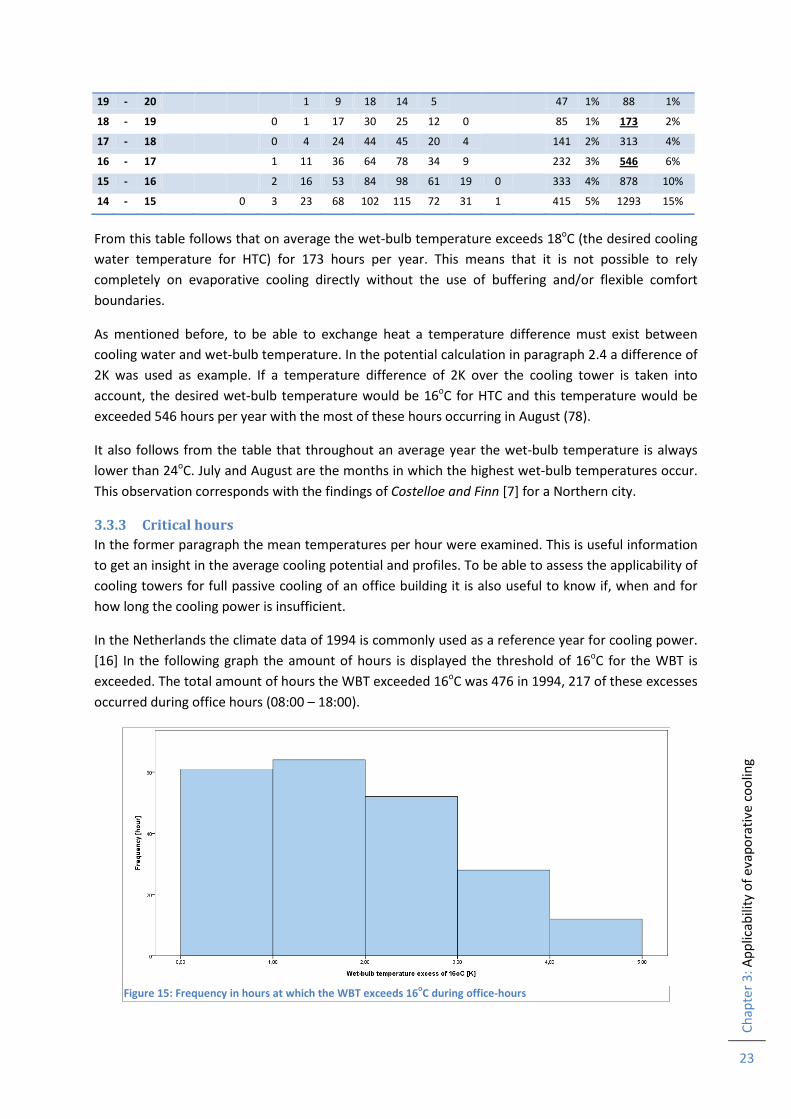

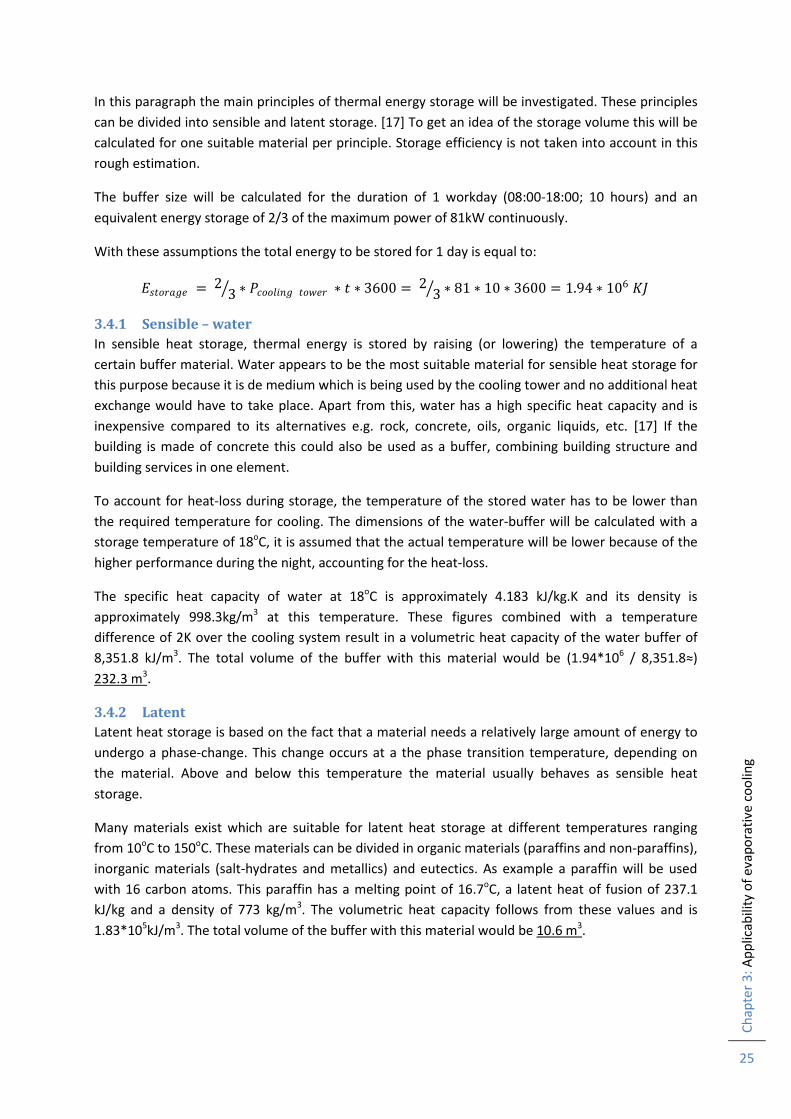
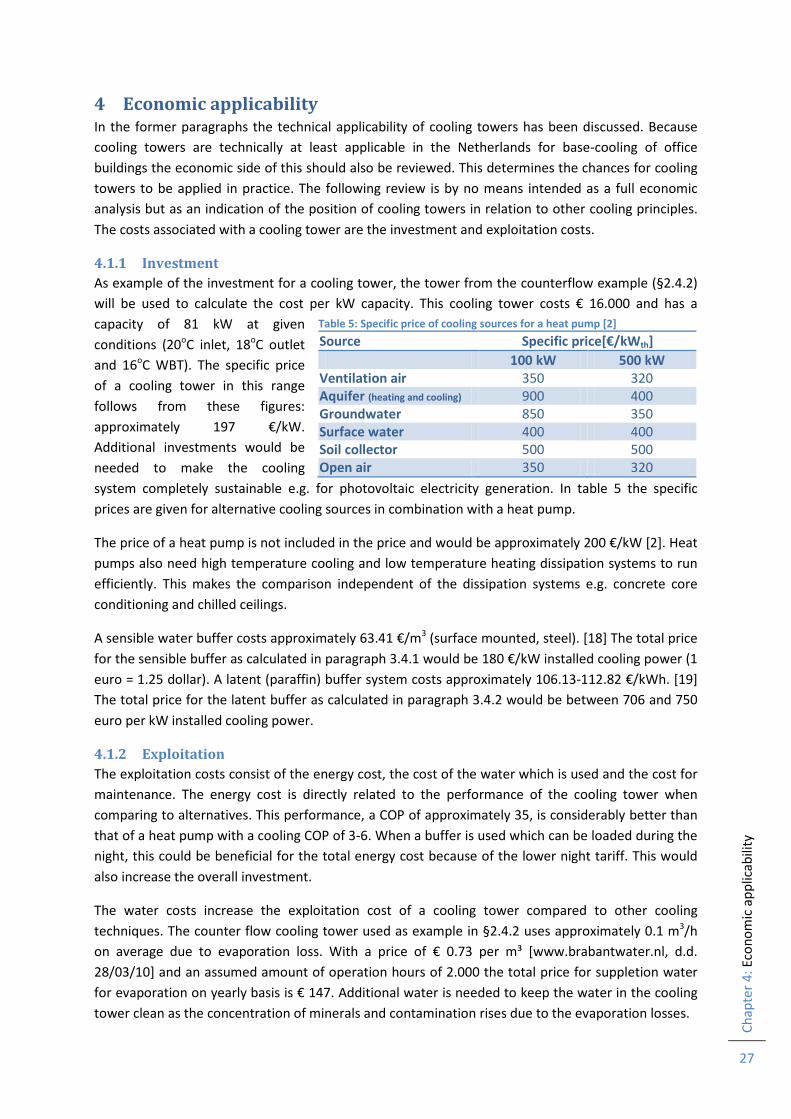


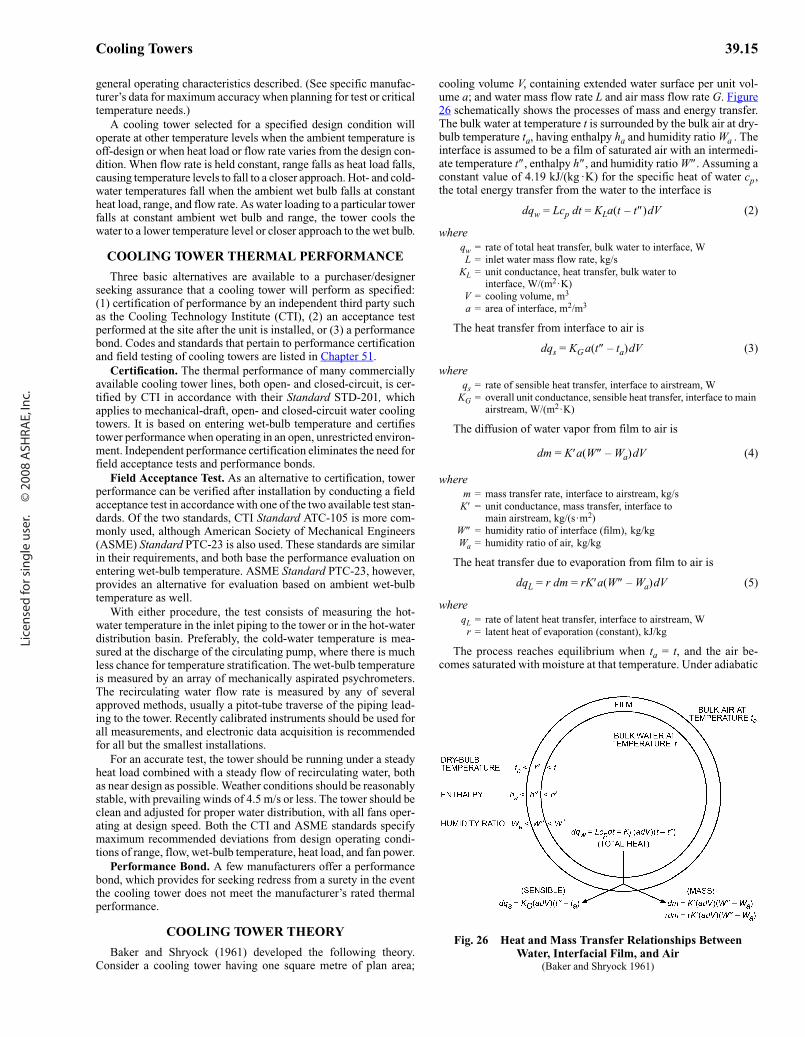


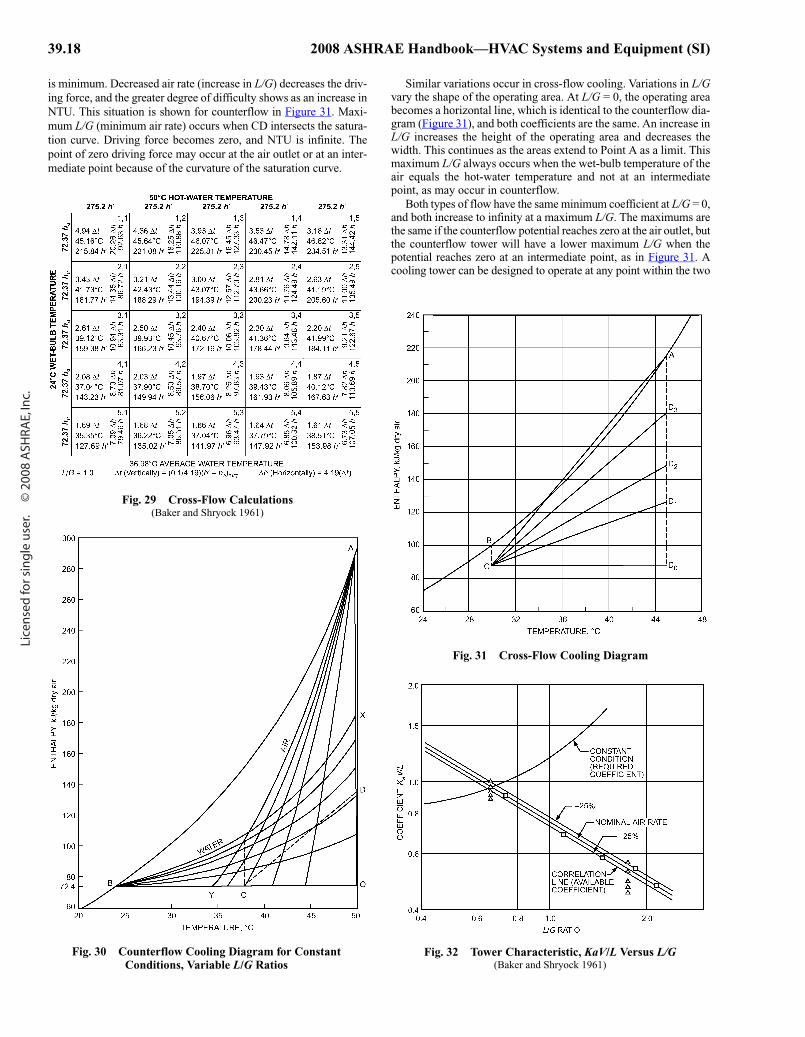
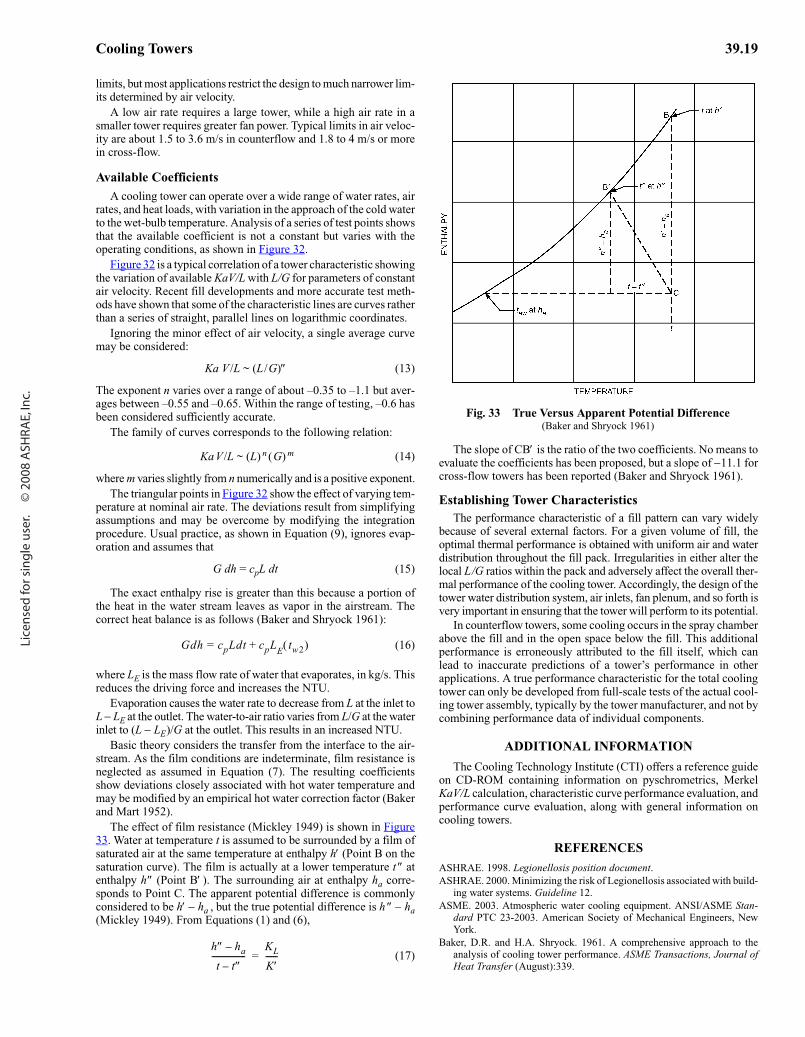
![PASSIVE DOWNDRAUGHT EVAPORATIVE COOLING: The … · can be used to achieve thermal comfort. [1] Passive Downdraught Evaporative cooling (PDEC) Origin: Evaporative cooling has been](https://static.documents.pub/doc/80x56/5f835db0418ed251ad1ae1c3/passive-downdraught-evaporative-cooling-the-can-be-used-to-achieve-thermal-comfort.jpg)


