Page 1
EVERYTHING IN MODERATION
A Study of the Effects of Alcohol Consumption on Health from Local and International
Perspectives
by
Casia Lynn Wardzala
A THESIS
submitted to
Oregon State University
Honors College
in partial fulfillment of
the requirements for the
degree of
Honors Baccalaureate of Science in Bioengineering
(Honors Scholar)
Honors Baccalaureate of Arts in International Studies
(Honors Scholar)
Presented August 24, 2016
Commencement June 2017
Page 3
AN ABSTRACT OF THE THESIS OF
Casia Lynn Wardzala for the degree of Honors Baccalaureate of Science in
Bioengineering and Honors Baccalaureate of Arts in International Studies presented on
August 24, 2016. Title: Everything in Moderation: A Study of the Effects of Alcohol
Consumption on Health from Local and International Perspectives.
Abstract approved:_____________________________________________________
Michelle Bothwell
The consumption of alcohol has been shown to have effects on health that are both harmful and
therapeutic, depending on the amount that is consumed. Alcohol’s effects can be damaging to the
body in excess but, in moderation, can act as a protectant against certain conditions. The two
studies discussed in this thesis seek to further explore the outcomes of alcohol use, in both
moderate and heavy quantities, on health. The first study used a local data set from Oregon to
investigate the effects of moderate alcohol consumption on cognitive decline and how these
effects vary between males and females. Statistical analysis was conducted with mixed-effect
models. The results confirmed that alcohol in moderation is protective against cognitive decline
and suggested that alcohol affects the brains of males and females in fundamentally different
ways. Although moderate alcohol consumption appears to be protective in both sexes, men
experience greater benefit from moderate alcohol use. The second study used international data
sets to analyze the worldwide relationship between alcohol and health, focusing on alcohol’s
effects on liver cirrhosis, alcohol abuse, and dementia. Plots comparing measures of alcohol
consumption and health from countries around the globe were analyzed for trends. The results
indicated that: rates of liver cirrhosis were both linearly and exponentially related to consumption
rates worldwide; countries with greater consumption rates and heavy consumption patterns have
greater rates of alcohol dependency; alcohol in moderation has either little to no negative effects
on dementia or a minor protective effect; and heavy alcohol consumption is a risk factor for
dementia. Overall, these studies reinforced that alcohol in moderation can have a positive effect
on health, while alcohol in excess can lead to a whirlwind of health issues.
Key Words: Alcohol, moderation, excess, cognitive decline, dementia, liver cirrhosis,
alcohol dependence, international study, local study, sex differences
Corresponding e-mail address: [email protected] , [email protected]
Page 4
©Copyright by Casia Lynn Wardzala
August 24, 2016
All Rights Reserved
Page 5
EVERYTHING IN MODERATION
A Study of the Effects of Alcohol Consumption on Health from Local and International
Perspectives
by
Casia Lynn Wardzala
A THESIS
submitted to
Oregon State University
Honors College
in partial fulfillment of
the requirements for the
degree of
Honors Baccalaureate of Science in Bioengineering
(Honors Scholar)
Honors Baccalaureate of Arts in International Studies
(Honors Scholar)
Presented August 24, 2016
Commencement June 2017
Page 6
Honors Baccalaureate of Science in Bioengineering and Honors Baccalaureate of Arts in
International Studies project of Casia Lynn Wardzala presented on August 24, 2016.
APPROVED:
_____________________________________________________________________
Michelle Bothwell, Mentor, representing Chemical, Biological, and Environmental
Engineering
_____________________________________________________________________
Clare Wilhelm, Committee Member, representing the VA Portland Health Care System’s
Psychiatric Department
_____________________________________________________________________
Joseph McGuire, Committee Member, representing Chemical, Biological, and
Environmental Engineering
_____________________________________________________________________
Kerry Thomas, Committee Member, representing International Studies
____________________________________________________________________
Toni Doolen, Dean, Oregon State University Honors College
I understand that my project will become part of the permanent collection of Oregon
State University, Honors College. My signature below authorizes release of my project
to any reader upon request.
_____________________________________________________________________
Casia Lynn Wardzala, Author
Page 7
ACKNOWLEDGEMENTS
I would like to thank my mentor, Dr. Michelle Bothwell, for her overall assistance,
especially with the thesis timeline and presentation, and for being patient and persistent against
my mission to procrastinate as much as possible. In addition, I would like to thank my supervisor
from the Portland VA, Clare Wilhelm, PhD, for all of his guidance with local, Oregon study
(Study I) and for providing me with a fantastic summer project. I would also like to acknowledge
the support of my international advisor, Kerry Thomas, with the global component of my thesis
(Study II). Finally, I would like to thank Dr. Joe McGuire for serving on my thesis committee
and all friends and family that have supported me during this endeavor.
Page 8
TABLE OF CONTENTS
Page
1. Introduction……………………………………………………………………………….1
2. Study I: A Local Perspective............................................................................................3
2.1 Introduction.................................................................................................................3
2.2 Methods.......................................................................................................................5
2.2.1 Research Participants..............................................................................5
2.2.2 Study Approach ………………………………………………………...7
2.2.3 Statistical Analysis ................................................................................10
2.3 Results........................................................................................................................11
2.3.1 Study Demographics..............................................................................11
2.3.2 Effects of Moderate Alcohol Consumption on Cognitive and
Functional Decline ................................................................................12
2.4 Discussion...........................................................................................................20
3. Study II: An International Perspective.............................................................................22
3.1 Introduction.........................................................................................................22
3.2 Methods...............................................................................................................24
3.2.1 Breakdown of Data Sets........................................................................24
3.2.2 Analysis of Liver Cirrhosis…………………………………………….25
3.2.3 Analysis of Alcohol Use Disorders…………………………………….26
3.2.4 Analysis of Dementia ............................................................................26 3.3 Results and Discussion...................................................................................23
3.3 Results and Discussion………………………………………………………….26
3.2.1 Analysis of Liver Cirrhosis…………………….……………………….26
3.2.2 Analysis of Alcohol Use Disorders………………………………….....32
3.2.3 Analysis of Dementia………………………………………………......37
3.2.4 Overall Study Limitations .....................................................................42
4. Conclusion .......................................................................................................................42
5. Works Cited ………………………..………………………………………………...…43
6. Appendix………………………………..……………………………………………….46
Appendix A WHO Regions .......................................................................................46
Appendix B Additional Study II Plots........................................................................47
Page 9
LIST OF FIGURES
Figure Page
1. Figure 1..............................................................................................................................2
2. Figure 2..............................................................................................................................4
3. Figure 3 ……...…………………………………………………………………………...9
4. Figure 4.....……………………………………………………………………………....10
5. Figure 5..………………………………………………………………………………....13
6. Figure 6……………………………………..…………………………………………....14
7. Figure 7 ………………………………………………………..………………………...15
8. Figure 8 ..............………………………………………………………………….…….15
9. Figure 9…………………………………………………………………………………..16
10. Figure 10………………………………………………………………………………...17
11. Figure 11..........................................................................................................................17
12. Figure 12 .........................................................................................................................18
13. Figure 13 ………………………………………………………………………………..18
14. Figure 14 ..............……………………………………………………………………….19
15. Figure 15…………………………………………………………………………………19
16. Figure 16………………………………………………………………………………....22
17. Figure 17 ………………………………………………………………………………..23
18. Figure 18 ..............……………………………………………………………………….28
19. Figure 19…………………………………………………………………………………29
20. Figure 20…………………………………………………………………………………30
21. Figure 21..........................................................................................................................31
22. Figure 22 .........................................................................................................................33
23. Figure 23 ………………………………………………………………………………...34
Page 10
LIST OF FIGURES (cont’d)
Figure Page
24. Figure 24 ..............……………………………………………………………………....35
25. Figure 25…………………………………………………………………………………36
26. Figure 26………………………………………………………………………………....38
27. Figure 27 ………………………………………………………………………………...39
28. Figure 28 ..............…………………………………………………………………….....40
LIST OF TABLES
Table Page
1. Table 1.................................................................................................................................6
2. Table 2 ................................................................................................................................6
3. Table 3 ……………………………………………………………………………………7
4. Table 4 ..............…………………………………………………………………………12
5. Table 5…………………………………………………………………………………...12
Page 11
LIST OF APPENDICES
Appendix Page
Appendix A WHO Regions .....................................................................................................46
Figure 1................................................................................................................46
Appendix B Additional Study II Plots.....................................................................................47
B.1 Analysis of Liver Cirrhosis.................................................................................47
Figure 2...............................................................................................................47
Figure 3………………………………………………………………………….48
Figure 4……………………………………………………………………….....49
Figure 5………………………………………………………………………….49
Figure 6………………………………………………………………………….49
B.2 Analysis of Alcohol Use Disorders……….…………………………………….50
Figure 7...............................................................................................................50
Figure 8…………………………………………………………………………51
Figure 9………………………………………………………………………...52
B.3 Analysis of Dementia…………………………………………………………...53
Figure 10.............................................................................................................53
Figure 11………………………………………………………………………..53
Figure 12…………………………………………………………….………….54
Figure 13……………………………………………………………..………....54
Page 12
1
INTRODUCTION
Alcohol, as it is commonly known, is a psychoactive drug that is used by people all
around the globe. It is often considered a controversial substance due to its strong correlation to
health, resulting in both beneficial and detrimental effects on health, depending on the amount
consumed.
In excessive quantities, alcohol’s effects are primarily negative. Consuming too much on
a single occasion or over time has been associated with the development of a wide array of health
issues that afflict different areas of the body. One area of affliction is the heart; excessive
drinking can lead to cardiomyopathy, arrhythmias, high blood pressure, and stroke (“Alcohol’s
Effect on the Body”). Heavy drinking patterns also take a toll on the liver, causing steatosis,
alcoholic hepatitis, fibrosis, and cirrhosis, and can affect the pancreas, resulting in the
development of pancreatitis. Copious consumption of alcohol also impacts the brain. One-time
overconsumption leads to negative short-term effects that impair thinking and judgment. Habitual
overconsumption leads to long-term effects that can substantially damage brain health and, in
some cases, results in the development of alcohol use disorders, which are characterized by a
strong dependence on alcohol. Over-consumption can weaken the immune system, making the
user susceptible to infectious diseases, pneumonia and tuberculosis in particular (“Alcohol’s
Effect on the Body”)(Wiren). It has been correlated with diabetes, neonatal conditions such as
fetal alcohol syndrome, and a large collection of cancers, including cancers of the mouth,
esophagus, throat, liver, and breast (World Health Organization 12) (“Alcohol’s Effects on the
Body”). Finally, excessive alcohol use can lead to unintentional injuries due to reduced motor
control and intentional injuries, such as assault or suicide, due to changes in judgment. Put
together, alcohol can be attributed to roughly 6.0% of deaths globally (World Health
Organization 48).
Clearly, alcohol is a dangerous substance when consumed in large quantities. However,
in moderate doses, it can have some therapeutic effects. Studies have shown that habitual
consumption of moderate amounts can lead to decreased risk for total mortality, coronary artery
disease, diabetes mellitus, congestive heart failure, and stroke (O’Keefe et al. 382). The
protective effect of moderate consumption also appears to vary in men and women. Women have
less of a tolerance to alcohol, so they experience the detrimental effects of alcohol at lower
drinking levels than men. This is, in part, due to the weight differences between men and women.
It also has to do with the different physiologies of males and females. Women have less water
per pound of body mass, which means that a woman of the same weight and consumption rate as
her male counterpart will still have a higher blood alcohol content. Other physiological
Page 13
2
differences also may play a role in this (“Women and Alcohol”). Furthermore, women are more
vulnerable to liver damage and heart disease than men, and female moderate consumers have an
increased risk for breast cancer over female non-consumers (“Women and Alcohol”). Due to
differences in physiology and a discrepancy in long-term consequences on health, women are
evidently more vulnerable to alcohol’s detrimental effects than men.
Figure 1 illustrates the positive and negative effects of alcohol consumption for both
males and females. Note that the relative risk of total mortality decreases below 1.0 (baseline) for
both men and women as the amount of alcohol consumed in grams/day increases. At these
consumption rates, alcohol use is considered protective, as values assessing the risk of total
mortality below are below baseline (1.0). After a certain amount of alcohol is consumed, this risk
increases above 1.0, and the effects of consumption stop being beneficial and instead become
harmful. In addition, the amount of alcohol in which the risk increase varies between men and
women, and unsurprisingly, this risk rises above 1.0 at a consumption rate lower than that for
men (roughly 25 g/d vs. 40 g/d). This plot demonstrates both the protective effect of moderate
alcohol consumption as well as women’s increased susceptibility to alcohol’s harmful effects.
Figure 1: Relative risk of total morality as a function of the rate of alcohol consumption in grams
per day (g/d). Lines flanking the middle line represent a 99% confidence interval. This plot
demonstrates the protective of effect of moderate alcohol consumption and women’s increased
susceptibility to risk. For reference, a standard drink, as outlined by the United States, is 14 grams
of pure alcohol (Di Castelnuovo et al)(Wilhelm).
Page 14
3
The studies described in this thesis were aimed at exploring the effects of alcohol
consumption on health, looking specifically at how sex and the amount of consumption influence
health. Their purpose was to further define the relationship between alcohol use and health,
specifically exploring cognitive decline, dementia, liver cirrhosis, and alcohol abuse using
available local and international data. The first study, Study I, focused on effects of moderate
alcohol use on the aging brain, via measures of cognitive decline, functional decline, and
dementia, and used data from a local population of Oregon residents collected by the Oregon
Health and Science University (OHSU). The second study, Study II, used international data
provided by the World Health Organization (WHO) and Alzheimer’s Disease International to
evaluate how liver cirrhosis, alcohol dependence, and dementia are related to different patterns
and levels of alcohol consumption.
STUDY I: A LOCAL PERSPECTIVE
Introduction
Results of alcohol-focused studies have shown that consuming alcohol affects the brain.
These effects can be short-term as well as long-term. The short term effects, which are generally
widely accepted and well-researched, are the cognition changes experienced during states of
“tipsiness” or “drunkenness,” such as mood swings, reduced coordination, slurred speech, blurred
vision, impaired memory, and blackouts (“Alcohol’s Damaging Effect on the Brain”).
In contrast, long-term effects have been difficult to determine, due to differences among
individuals in their susceptibility to alcohol (“Alcohol’s Damaging Effect on the Brain”).
Nevertheless, there are established correlations between overconsumption and brain injury, in
addition to cognitive impairment. Long-term alcohol abuse can cause severe damage to the brain,
which involves both the death of neurons and brain shrinkage. The latter is represented in the
MRI image in Figure 2. The construct of the alcoholic brain in the following figure is atypical
and is of lesser health than its non-alcoholic counterpart. Its ventricles are enlarged and both
white and grey matter have degraded, showing a clear reduction in overall brain size.
Page 15
4
Figure 2: MRI images of healthy and alcohol brains of the same age (43 years old). In
comparison to normal brain on left, alcoholic brain on right shows clear brain shrinkage.
Ventricles are enlarged and white and grey matter show deterioration. Demonstrates one of the
effects of excessive alcohol consumption on brain (Wiren).
In addition, excessive long-term consumption of alcohol has been linked to two severe
illnesses that strongly affect cognition. The first is Wernicke-Korsakoff syndrome, a brain
disorder that is a result of thiamine deficiencies. In this case, these deficiencies are caused by the
nutrition shortage that results from alcohol abuse. Alcoholics have difficulty obtaining nutrients
necessary for normal functioning, as they tend to rely on alcohol for their calories. (“Alcohol’s
Damaging Effect on the Brain”) Wernicke-Korsakoff syndrome severely impairs cognition,
resulting in symptoms such as confusion, loss of mental activity, memory loss, confabulation, and
hallucination (“Wernicke-Korsakoff Syndrome”). It is a particularly debilitating disorder.
Secondly, the damage done to the liver as a result of long-term abuse can lead to another
devastating disease, hepatic encephalopathy. Symptoms of this potentially-deadly disease may
include: changes in sleep patterns, mood and personality swings, detrimental effects on cognition,
the development of psychiatric conditions such as anxiety or depression, and the impairment of
coordination (“Alcohol’s Damaging Effect on the Brain”). Clearly, alcohol’s effect on the brain
is incredibly detrimental when consumed in excess.
While there is a clear correlation between alcohol abuse and brain damage, the long-term
effects associated with consuming alcohol moderately have been difficult to verify. A review of
recent longitudinal studies has suggested that moderate alcohol consumption may reduce rates of
cognitive decline and dementia (Peters et al. 505). This is a logical conclusion because the health
Page 16
5
of the cardiovascular system and the risk for developing dementia are directly proportional and
alcohol has been shown to have a substantial protective effect on the cardiovascular system.
Nonetheless, the studies reviewed varied widely in population size and the standard size
of one drink, among other variables. As a result of their significant heterogeneity, it is difficult to
make any definitive conclusions about the relationship between moderate alcohol consumption
and cognitive decline. Another reason for the inconsistent results might be attributed to the
differing response of males and females to alcohol. Because females are more susceptible to the
harms of alcohol, alcohol may not offer the same protective effects. The reviewed studies did not
explore the two sexes separately and potentially missed distinct cognitive responses due to sex.
Therefore, the goal of Study I was to first confirm that alcohol in moderation reduces rates of
cognitive decline and then determine if alcohol use affects cognitive and functional decline in
female and males differently.
Methods
Research Participants
Study I was conducted using data provided by two cohorts: the Oregon Brain Aging
Study (OBAS) and the Intelligent Systems for Assessing Aging Changes (ISAAC). These
cohorts were comprised of older Oregon residents that were tested over time for both cognitive
and functional decline.
OBAS commenced in 1989 at the Layton Oregon Aging and Alzheimer’s Disease Center.
Initially, entry criteria required participants to be 55 years or older, functionally independent
community members, and free of co-morbid illnesses proven to alter risk for cognitive decline.
In 2004, these requirements were adjusted to include subjects with controlled, chronic medical
conditions common in elders to better model the general population. The participants enrolled in
2004 were 85 or older (“Oregon Brain Aging Study”).
ISAAC began in 2007 and enrolled participants of age 70 or older from the Portland,
Oregon metropolitan area. At entry, participants needed to be non-demented, as defined by a
Clinical Dementia Rating of <0.5 and a Mini-Mental State Examination score of >24, living
autonomously, and of average health for their age. Excluded participants were those that were
limited physically from participating due to a medical condition and those inflicted by a condition
likely to result in premature death (“Intelligent Systems for Assessing Aging Changes
(ISAAC)”).
Participants of both cohorts were assessed annually for cognitive and functional decline.
Measures tested and their descriptions are provided in Tables 1-3 below.
Page 17
6
Table 1: Measures testing for dementia
Measure Scoring
Mini-Mental State Examination
Scored on a scale of 0-30. Scores of 25-30
indicate normal cognition, scores of 19-24
indicate mild dementia, scores of 10-18
indicate moderate dementia, and a score of 9 or
less indicates severe dementia (Folstein et al).
Clinical Dementia Rating
Rating of 0 corresponds to no symptoms of
dementia. Rating of 0.5 denotes very mild
dementia, 1 denotes mild, 2 denotes moderate,
and 3 denotes severe dementia (Morris).
CDR Sum of Boxes
Scored on a scale of 0-18. 18 is the maximum
score, indicating severe dementia and 0
indicates no dementia (O’Bryant et al).
Table 2: Measures testing for cognitive decline
Measure Description/Scoring
Category Fluency Test (Animal)
Subjects are asked to name as many different
animals as possible in a minute. The total score
is the number of unique animals named. Scores
below 15 are generally indicative of cognitive
impairment (Goodglass and Kaplan)
CERAD Word List Delayed Recall
Subject given 10 words, and after a delay of 4
to 5 minutes with distraction, the subject is
asked to recall the words. Score is the number
of words out of 10 that the subject recalled
(Welsh et al).
Digit Symbol Test
Subjects are given a key that relates a symbol to
a number and a chart that contains numbers and
blanks. Using that key, the subject is asked to
fill out as many blanks with the corresponding
symbol as possible in a 90 second period. The
max score for this test is 93 (Manual for the
Wechsler Adult Intelligence Scale).
Trail Making Test Part B
Subjects are shown a page covered with letters
and numbers. The subjects are asked to connect
these with lines alternating between number and
letter in a hierarchical fashion (1-A-2-B…).
The score is the number of seconds it takes for
the participant to complete this task and it
reaches a maximum at 300 seconds (Wechsler
Adult Intelligence Scale).
Logical Memory Delayed Recall
Subjects are told a story (Story A) and are asked
to recall it after a period of time has passed.
The score is based on the number of items the
participants remembers and maxes out at 25
(Wechsler Memory Scale).
Page 18
7
Table 3: Measures testing for functional decline
Measure Description/Scoring
Activities of Daily Living
Measurement of activities of daily living, i.e.
self-care tasks, walking, etc. A score of 0
pertains to no assistance required and a
maximum score of 18 pertains to full assistance
for all tasks (Center for the Study of Aging and
Human Development).
Instrumental Activities of Daily Living
Measurement of activities important for living
independently in society, i.e. using the
telephone, shopping for food or clothing, etc.
A score of 0 pertains to no assistance needed
and a maximum of 14 pertains to full assistance
for all tasks (Center for the Study of Aging and
Human Development).
Functional Activities Questionnaire
Measurement of activities important for
functioning independently and living
autonomously. A higher score indicates more
assistance is required (Pfeffer et al).
This annual assessment involved a neuropsychological evaluation, a comprehensive interview,
and questionnaires intended for updating medical history. In addition, phone interviews between
yearly assessments were conducted in order to update health histories. Caregivers of the
participants were involved in annual assessments and phone interviews in some cases. All
participants provided written consent, and all study protocols received approval from the OHSU
Institutional Review Board (OBAS IRB #361; ISAAC IRB #2353).
Study Approach
Data used in this study were the measures of cognitive and functional decline tabulated
above (Tables 1-3) and the records of alcohol use history also provided by the cohorts. Lifetime
alcohol history was determined at admission to the study with a survey that asked participants to
determine their frequency of consuming four or more drinks on a single occasion, their frequency
and quantity of alcohol consumption as a teen, adult, and elder, whether they had consumed one
drink or more per week for more than three months, and whether they were a current drinker. A
single drink was defined by the American standard of 14 grams of pure alcohol, which is found in
12 oz of beer, 5 oz of wine, or 1.5 oz of distilled liquor (“What Is A Standard Drink?”). Current
alcohol use was updated if it changed during the subject’s participation in the study.
Participants were divided into six different categories based on their drinking patterns and
their sex: female non-drinker, male non-drinker, female moderate drinker, male moderate drinker,
female heavy drinker, and male heavy drinker.
Page 19
8
Non-drinkers were differentiated from drinkers based on their response to the question,
“have you ever consumed more than one drink per week regularly for more than three months?”
A negative response designated them as a non-drinker. It is important to note that non-drinkers
may have some experience with alcohol, but did not demonstrate a history of habitual
consumption. Those who answered “yes” were designated as drinkers and were further
subdivided into moderate and heavy consumers. Ninety-one percent of the subjects answered this
question at baseline. If the subject failed to answer the question after entry to the study, their
response at baseline was assumed consistent over time. Participants that had no response were
omitted from the analysis.
Moderate drinkers were those who followed low risk patterns for alcohol consumption,
as defined by the National Institute on Alcohol Abuse and Alcoholism (NIAAA). Limits for
moderate consumption were as follows: for women, low-risk drinking is no more than 3 drinks
per day and no more than 7 drinks per week, and for men, low-risk drinking is no more than 4
drinks per day and no more than 14 drinks per week (“Drinking Levels Defined”). Patterns of
low-risk consumption were determined with two parameters. The first parameter was the quantity
of drinks per day as an elder. The second parameter was the total number of drinks per week,
calculated by multiplying the daily quantity by the frequency of consumption in one week.
Heavy drinkers were those that exceeded low-risk patterns of drinking and those that
gave a response other than “Rarely/never” to the question “How often do you have four or more
drinks per occasion as an elder?” Heavy drinkers were excluded from this analysis, as the
population of heavy drinkers was not substantial enough to provide statistically significant
results.
In total, the cohorts were comprised of a total of 527 participants. Of those subjects, 346
were female (66%) and 181 were male (34%). As seen in Figure 3, the population was
predominantly white and well-educated.
Page 20
9
Figure 3: Pie charts illustrating demographics of cohort population. Charts reveal that population
was primarily white and well-educated, with roughly ¾ of individuals with 13 and above years of
education (indicating at least one year of college education) and roughly ¼ of individuals with 16
and above years of education (indicating pursuit of master and doctoral degrees).
Furthermore, the number of participants that filled out the alcohol assessment to completion was
limited. Percentage of completion varied between questions. Of the total number of participants,
401 subjects were included in the final study. Participants were removed due to inadequate
completion of the alcohol survey or due to patterns of heavy drinking (shown in Figure 4).
Page 21
10
Figure 4: Diagram illustrating how starting cohort population of 527 participants was reduced to
final study population of 401 participants. Participants were excluded due to an insufficient
alcohol history or for patterns of excessive drinking. Final population is divided based on sex and
drinking pattern.
Statistical Analysis
All baseline characteristics for the moderate and non-drinker populations were assessed
using pairwise t-tests, except for two. The prevalence of the APOE gene and percentage of
Caucasian participants were assessed using the Fisher test.
A linear mixed-effects model was used to analyze the relationship between alcohol
consumption and each of the measures provided by the cohorts. A mixed-effects model combines
the fixed effects of the general population and the random effects associated with each subject.
This model evaluated the changes in measure scores for each subject with respect to time.
Possible confounders, such as age, gender, years of schooling, the Cumulative Illness Rating
score (CIRS), and APOE genotype, were used as covariates (Linn et al). The APOE ε4 genotype
was included as a confounder, as it has been linked to increased risk for developing Alzheimer’s
disease for both homozygous and heterozygous genotypes. Presence of APOE ε4 in either a
homozygous fashion or heterozygous fashion was noted and taken into account (Lange et al).
Page 22
11
Because the primary interest was in determining sex differences, the groups were
separated in the six groups discussed above, the heavy drinkers were excluded, and the non-
drinking and moderate groups were compared in sex-separate studies. Statistical models were
generated with R software using lme4, ggplot2, and influence.ME packages (“Fitting Linear
Mixed…”)(“lme4: Linear…”)(Wickham). Baseline values of the measures were controlled when
evaluating rates of change and data from cohorts was assumed missing at random. Visual
assessments of residual plots and quantile-quantile plots were done to inspect the integrity of the
model and remove easily discernable outliers.
The comparison of multiple response variables was accounted for using the Holm-Sidak
correction to adjust p-values, with significance maintained at <0.05. The influence of moderate
alcohol consumption was considered for its effect on cognition at baseline and for its effect on
decreases in cognition over time. McFadden’s log-likelihood based R2 was used to measure the
models’ goodness of fit. A chi-squared test was executed to investigate how much the model
changed with the addition of the alcohol survey data. A significant p-value associated with this
test implied incorporating the alcohol data caused a significant change in the model.
Results
Study Demographics
Recall that the OBAS and ISAAC cohorts included a total of 527 participants. The final
population for this study encompassed 401 individuals; the 126 participants removed from the
study were excluded due to insufficient histories of alcohol consumption or patterns of heavy
alcohol consumption. Among these 401 individuals, 36.4% (146) were considered moderate
drinkers and 66% (268) were female. As verified by the insignificant p-values given in the Table
4 below, male moderate and non-drinkers had similar baseline characteristics for age, education,
initial MMSE score, ethnicity, CIRS score, and presence of APOE ε4. Female moderate and non-
drinkers also had similar baselines, save education level (Table 5). Female moderate drinkers had
a statistically significant increase (p < 0.05) in the total years of education. Though, the mixed
models used to evaluate cognitive and functional decline accounted for these differences in
baseline demographics.
Page 23
12
Table 4: Baseline demographics of male non-drinkers and moderate drinkers
MALES Non-Drinkers
(n = 72)
Moderate
Drinkers
(n = 61)
p-value
Mean Age (years) 83.1 (8.0) 81.4 (8.3) 0.22
Mean Education (years) 15.2 (3.0) 15.9 (2.3) 0.14
MMSE score at intake 28.3 (1.5) 28.2 (1.5) 0.78
Caucasian (n) 94% (68) 98% (60) 0.38
Cumulative Illness Rating
Scale
20.7 (3.3) 20.0 (3.3) 0.35
APOE4 (%) 22.2% 34.4% 0.49 5.6% of the non-drinkers did not have APOE genotype identified.
11.5% of the drinkers did not have APOE genotype identified.
Table 5: Baseline demographics of female non-drinkers and moderate drinkers
FEMALES Non-Drinkers
(n = 183)
Moderate
Drinkers
(n = 85)
p-value
Mean Age (years) 83.7 (6.6) 83.9 (6.5) 0.80
Mean Education (years) 14.2 (2.5) 15.0 (2.4) 0.04
MMSE score at intake 28.5 (1.6) 28.6 (1.4) 0.66
Caucasian (n) 92% (168) 92% (78) 0.60
Cumulative Illness Rating
Scale
20.4 (3.4) 20.9 (3.5) 0.45
AP0Ε4 (%) 21.3% 32.9% 0.20 6.4% of the non-drinkers did not have APOE genotype identified.
8.6% of the drinkers did not have APOE genotype identified.
Data are presented as means (standard deviation) unless otherwise indicated.
Statistical comparisons were made using t-tests, with the exception of race/Caucasian and APOE, which
were determined with the Fisher test.
Effects of Moderate Alcohol Consumption on Cognitive and Functional Decline
Mixed-effects models were used to determine the impact of moderate alcohol
consumption on cognitive and functional decline. To reiterate, alcohol consumption histories
were used to divide the population into heavy, moderate, and non-drinkers. The battery of
measures described previously in Tables 1-3 was employed to evaluate cognitive and functional
health over time. The models accounted for the confounding variables of age, level of education
in years, CIRS score, and presence of APOE4 genotype.
The resulting models are shown in Figures 5-15 below. Participants demonstrated
cognitive and functional decline with age, as scores for all measures of cognition and function
worsened with time (p < 0.001). In addition, visual assessment of all models indicated that
moderate drinkers of both sexes experienced less cognitive and functional decline. This would
imply both males and females experience a protective effect from moderate alcohol consumption.
However, not all measures for cognition and function exhibited a statistically significant
Page 24
13
reduction in decline for moderate consumers over non-consumers. Statistically significant
reduction in rates of decline varied based on sex. Males who moderately consumed displayed
reduced decline for the following measures: MMSE (p = 0.003), CDR (p = 0.029), and CDR Sum
of Boxes (p = 0.005) (Figures 5-7). In contrast, females who moderately consumed displayed
reduced decline for only two measures, the logical memory delayed recall (p = 0.007) and
category fluency tests (p = 0.04) (Figures 8-9).
Furthermore, including the alcohol consumption data improved the model fit for males
for the following measures: the digit symbol test, the activities of daily living examination, and
the category fluency test. Cognition and functional levels at baseline (time = 0 years) were
significantly different for multiple tests as well. Male moderate drinkers exhibited lower
cognition and function at baseline than non-drinkers for the digit symbol test, activities of daily
living examination, CDR, and CDR Sum of Boxes. Female moderate drinkers exhibited lower
levels of functioning at baseline than non-drinkers for the instrument activities of daily living test.
These differences imply that there are slight negative effects on function and cognition as a result
of alcohol consumption prior to study entry.
(a) (b)
Figure 5: Mixed models for Mini-Mental State Examination for a) females and b) males.
Fem_Non and Male_Non denote female and male non-drinkers respectively. Fem_Alc and
Male_Alc denote female and male moderate drinkers respectively. A larger MMSE score
indicates better cognition, and all linear models slope downward, signifying decreasing cognitive
functioning with age (p < 0.001). Male moderate drinkers exhibit a decreased rate of cognitive
decline compared to male nondrinkers. Slope of line representing male moderate drinkers is
Page 25
14
significantly smaller at p < 0.05 than slope of male nondrinkers. There was no statistically
significant difference in the cognitive decline of female moderate drinkers and nondrinkers.
(a) (b)
Figure 6: Mixed models for Clinical Dementia Rating for a) females and b) males. A smaller
CDR score is indicative of better cognition. The upward slopes denote decreasing cognition over
time (p < 0.001). Male moderate drinkers exhibit a decreased rate of cognitive decline compared
to male nondrinkers. Slope of line representing male moderate drinkers is significantly smaller at
p < 0.05 than slope of male nondrinkers. Male moderate drinkers also display worse cognition at
baseline (time 0) at p < 0.05. There was no statistically significant difference in the cognitive
decline of female moderate drinkers and nondrinkers.
Page 26
15
(a) (b)
Figure 7: Mixed models for Clinical Dementia Rating: Sum of Boxes for a) females and b) males.
Akin to the Clinical Dementia Rating, a smaller CDR Sum of Boxes score is indicative of better
cognition. The upward slopes denote decreasing cognition over time (p < 0.001). Male moderate
drinkers exhibit a decreased rate of cognitive decline compared to male nondrinkers. Slope of line
representing male moderate drinkers is significantly smaller at p < 0.05 than slope of male
nondrinkers. Male moderate drinkers also display worse cognition at baseline (time = 0 years) at p
< 0.05. There was no statistically significant difference in the cognitive decline of female
moderate drinkers and nondrinkers.
(a) (b)
Figure 8: Mixed models for Category Fluency Test (Animals) for a) females and b) males. Better
cognition is exhibited by greater scores on the fluency test. Downward slopes are indicative of
Page 27
16
decline at p < 0.001. Female moderate drinkers exhibit a decreased rate of cognitive decline
compared to female nondrinkers. Slope of line representing female moderate drinkers is
significantly smaller at p < 0.05 than slope of female nondrinkers. Inclusion of alcohol data
improved fit of model for males (p < 0.05), however there was no statistically significant
difference in the cognitive decline of male moderate drinkers and nondrinkers.
(a) (b)
Figure 9: Mixed models for Logical Memory Delayed Recall for a) females and b) males.
Greater scores on LMDR are indicative of greater cognition and memory functioning, thus the
negative slopes signify cognitive decline at p < 0.001. Female moderate drinkers exhibit a
decreased rate of cognitive decline compared to female nondrinkers. Slope of line representing
female moderate drinkers is significantly smaller at p < 0.05 than slope of female nondrinkers.
There was no statistically significant difference in the cognitive decline of male moderate drinkers
and nondrinkers.
Page 28
17
(a) (b)
Figure 10: Mixed models for Activities of Daily Living test for a) females and b) males. Greater
ADL scores suggest a decrease in function. The positive slopes in both plots point towards
functional decline at p < 0.001. Rates of functional decline are not statistically different for either
males or females, but inclusion of alcohol histories improved the fit of the model for males at p <
0.06 and male moderate drinkers displayed worse functioning at baseline (p < 0.05).
(a) (b)
Figure 11: Mixed models for Digit Symbol Test for a) females and b) males. Larger scores on
DST suggest greater cognition and downward slopes denote cognitive decline at p < 0.001. Rates
of cognitive decline are not statistically different for either males or females, but inclusion of
Page 29
18
alcohol histories improved the fit of the model for males at p < 0.05 and male moderate drinkers
displayed worse cognition than non-consumers at baseline (p < 0.05).
(a) (b)
Figure 12: Mixed models for Instrumental Activities of Daily Living test for a) females and b)
males. Larger scores on IADL signify decreased functioning. Functional decline is observed at p
< 0.001. There are no statistical differences for the functional decline of moderate and
nondrinkers. However, females moderate consumers have significantly less functioning at
baseline than nondrinkers at p <0.05.
(a) (b)
Figure 13: Mixed models for Functional Activities Questionnaire for a) females and b) males.
Larger scores on FAQ signify decreased functioning. Functional decline is observed at p < 0.001.
There are no statistical differences between moderate and nondrinkers in decline of functioning.
Page 30
19
(a) (b)
Figure 14: Mixed models for CERAD Word List Delayed Recall for a) females and b) males.
Larger scores on CERAD Word List signify greater cognition. Cognitive decline is observed at p
< 0.001. There are no statistical differences between moderate and nondrinkers in decline of
cognition.
(a) (b)
Figure 15: Mixed models for Trail Making Test Part B for a) females and b) males. Larger scores
on Trails B test signify decreased cognition. Cognitive decline is observed at p < 0.001. There are
no statistical differences between moderate and nondrinkers in decline of cognition.
Page 31
20
Discussion
A meta-analysis on previous studies has shown that moderate alcohol consumption can
act as a protectant against cognitive decline (Peters et al 505). These studies varied greatly in
method and study populations, among other variables. As a whole, they did not evaluate males
and females separately and also looked at populations of adults younger than those in Study I.
One of the goals of Study I, which was the first longitudinal study on alcohol effects in a
population of octogenarians, was to confirm the conclusion established by these previous studies.
In general, the results of this study did verify that moderate alcohol consumption has a protective
effect on cognitive decline. However, some interesting sex differences were observed.
There is a clear difference in the cognitive response of men and women to alcohol. In the
eleven measures tested, the measures in which the moderate drinkers exhibited significantly
reduced rates of decline did not overlap for males and females. This suggests that alcohol affects
the brain of men and women in physiologically different ways. The male moderate consumers
showed less decline for tests aimed at diagnosing dementia, the MMSE, CDR, and CDR Sum of
Boxes. The female moderate consumers showed less decline for tests of cognition, the category
fluency test and the logical memory delayed recall.
This would suggest that moderate consumption of alcohol is a protectant for men against
dementia, as male moderate consumers exhibited less decline than male non-consumers for all
three tests specifically designed to evaluate dementia. However, for women, only two of five
total measures designed to test cognition yielded significant results. Interestingly enough, the two
tests that demonstrated statistical differences in women, the category animal fluency test and
logical memory delayed recall, both evaluate aspects of the long-term memory. The former
focuses on semantic memory (processing of ideas and facts, not based on personal experience),
while the latter mostly evaluates episodic memory (personal memories) in addition to testing
some aspects of semantic memory (Lippincott Williams and Wilkins) (Maccow) (Graham et al).
The other three of the five total cognition tests generally focus on different parts of cognition.
The digit symbol test evaluates working memory, or short-term memory, and processing speeds
(Heerema). The CERAD word list tests episodic memory and the Trails B test evaluates
executive functioning (Lippincott Williams and Wilkins). Notably, all tests with significant
results assessed long-term memory, save the CERAD word list test (not statistically significant).
Therefore, it is possible that moderate alcohol use has a protective effect on long-term memory
for women, though this cannot be substantiated without more research.
In general, these results suggest that alcohol consumption in moderation is protective in
women against cognitive decline, but not in the same way as it is for men. Though the tests in
Page 32
21
which female moderate drinkers excelled are measures of cognition, they have been used to
examine the progression of dementia, beginning with stages that precede more severe forms of
dementia (Lange et al) (Gomez and White). As a result, moderate alcohol consumption could
still be a modest protectant against dementia in women. Nevertheless, alcohol consumption
appears to act as better protectant for males than it does for females. Regardless of the larger
sample size of females and thus a larger statistical power for detecting differences, males did
noticeably better on three measures versus the two measures for females. This would imply that
moderate alcohol consumption has more benefit against dementia and cognitive decline in males
than it does in females. In addition, no effects on functional decline were observed for either sex.
There are several important limitations of this study that require consideration. The first
is the lack of variety in the population demographics. Over ninety percent of the participants
were Caucasian and the total years of education was averaged at 14-15. As a result, these
findings may or may not be applicable to more diverse population. Secondly, these results were
based on self-reported alcohol histories and these histories were limited in their level of
completion. This study also did not account for specific patterns of consumption for the
individual, such as the type of alcohol consumed (beer, wine, spirits) or how quickly a drink is
consumed, and repeat testing could have caused participants to improve over time, skewing the
results. However, cases of improvement due to repeat testing have been observed for cases in
which testing was more frequent than the annual testing of the participants involved this study
(Beres and Baron). Despite these shortcomings and its preliminary nature, Study I included a
large population and a considerable collection of well-validated measures that are used
extensively. In addition, the limited diversity of the study population is beneficial, as confounds
due to ethnicity were unaccounted for and may affect the results with a more diverse population.
Overall, results of this study imply that long-term moderate alcohol consumption has a
protective effect on the brain, reducing rates of cognitive decline and dementia. This protective
effect is most prevalent in men; women do not appear to benefit as greatly. This study also
suggests that moderate alcohol consumption affects the brains of women and men in
fundamentally different ways, but more research is needed to substantiate this claim.
Nevertheless, if the effects discovered in this study are replicated, it is possible that moderate
alcohol consumption, according to those standards set by the NIAAA, would be a good
therapeutic for males.
Page 33
22
STUDY II: AN INTERNATIONAL PERSPECTIVE
Introduction
Alcohol is consumed all around the world. A study by the World Health Organization
found that total global consumption of alcohol was 6.2 liters of pure alcohol per person (aged
15+) in 2010. This translates to 13.5 grams of pure alcohol per day, which is closely equivalent
to the U.S. standard for a single drink (World Health Organization 29).
Alcohol consumption rates vary substantially with country and culture. As seen in Figure
16, there are countries that consume a great deal more alcohol than others, namely Eastern
Europe and Russia. There are also countries that consume substantially less. These different
consumption rates are often a result of location. For instance, there are regions of the world in
which drinking is widely accepted and is a large part of the culture, while there are other regions
where alcohol consumption is disapproved of or prohibited due to cultural and religious norms
(World Health Organization 30).
Figure 16: Map showing total consumption of pure alcohol per individual aged 15+ for the year
2010. Per capita consumption varies based on country (World Health Organization 29).
Developed countries tend to have greater alcohol consumption. As a result, of the six
regions defined by WHO, the WHO European and American Regions (EUR and AMR), have the
Page 34
23
greatest overall alcohol consumption per capita (see Figure 1 in Appendix A for map of WHO
regions). In the developed countries such as the ones in these regions, alcohol is deeply
engrained into the culture. Because these countries are of greater economic status, their citizens
can afford to drink a greater amount (World Health Organization 10, 29). This trend remains true
for the rest of the world; there is a direct relationship between the economic wealth of a country
and the amount of alcohol consumed. The WHO South-East Region (SEAR) and, in particular,
the WHO Eastern Mediterranean Region (EMR) exhibit the lowest consumption rates. The low
rates in the Eastern Mediterranean Region are largely due to the strong prevalence of Islam, a
religion that does not endorse alcohol consumption. The WHO African and Western Pacific
Regions (AFR and WPR) have intermediary consumption rates (World Health Organization 29).
Drinking patterns also differ among countries. While greater economic wealth signifies
greater consumption, the countries of high or upper middle income tend to have less risky
patterns of drinking, save Eastern Europe and the Russian Federation (seen in Figure 17). Riskier
patterns of drinking generally lead to greater burden of disease (World Health Organization 35).
Figure 17: Map showing patterns of consumption, ranging from least to most risky. Countries of
high or upper middle class exhibit less risky consumption patterns, except for Eastern Europe and
Russia (World Health Organization 36).
Because the total consumption of alcohol and consumption patterns vary globally, the
effects on health also vary. The number of alcohol-attributable deaths is greatest in the European
Region where alcohol consumption is the greatest. However, this region encompasses Eastern
Page 35
24
Europe, which has highly risky drinking patterns (World Health Organization 49). Regions with
the lowest number of alcohol-attributable deaths include the African Region and the Eastern
Mediterranean Region. The former is likely a result of the high incidence of premature death in
this area, which can be attributed to issues such as communicable diseases, lack of medical aid,
and lack of nutrition (“The Global Burden of Disease…”). That latter is explained by the high
rates of abstinence in that region, which is again explained by the prevalence of Islam (World
Health Organization 49).
The goal of Study II was to determine how consumption levels and different patterns of
consumption across countries affected health, namely liver cirrhosis, alcohol use
disorders/dependence, and dementia. Alcohol consumption is a proven risk factor for liver
cirrhosis (Rehm et al). However, the nature of the relationship between alcohol and liver damage
remains unclear. Various studies have shown that alcohol affects the liver in a dose-dependent
manner, whereas others have found that there is a threshold value at which increased
consumption no longer affects the progression of the disease (Rehm et al) (Sorensen). As a
result, the first objective of this study was to relate consumption rates to liver cirrhosis prevalence
and death rates and to determine whether or not this relationship follows a dose-dependent or
threshold response. The second objective was to determine the relationship between the
prevalence of alcohol use disorders and consumption rates. As alcohol use disorders and alcohol
dependence involve high consumption rates, it was expected that countries with higher
consumption rates would also have greater prevalence of alcohol abuse. The third and final
objective of this study was to discern the connection between international consumption rates and
prevalence and incidence of dementia. Study I had found that moderate alcohol consumption is
protective against cognitive decline and dementia, so it was expected that rates of dementia would
decrease with moderate consumption. Rates of dementia were also expected to increase with
heavier consumption, as brain damage and excessive alcohol use have been strongly correlated
(Wiren).
Methods
Breakdown of Data Sets
Study II was conducted with data sets provided in the World Health Organization’s
Global Status Report on Alcohol and Health: 2014 (World Health Organization) and the
Alzheimer’s Disease International’s World Alzheimer Report 2015: The Global Impact of
Dementia (Prince et al). To evaluate the relationship between health and alcohol consumption
Page 36
25
worldwide, statistics from the countries profiles listed in the Global Status Report on Alcohol and
Health and those listed by WHO region in the World Alzheimer Report were used.
Consumption amounts and patterns were determined for various countries with the
following measures provided by the World Health Organization: the 2008-2010 average of total
alcohol per capita (ages 15+) consumption for males, females, and both; the prevalence (%) of
heavy episodic drinking (HED) in 2010 for males, females, and both (15+); the percentage of
lifetime abstainers, 2010 for males, females, and both (15+); the percentage of abstainers for the
past year (2010), including former drinkers, for males, females, and both (15+); and the patterns
of drinking score, 2010. Heavy episodic drinking was defined as the consumption of 60 grams or
more of pure alcohol in a single occasion in the past 30 days. The patterns of drinking score is
rated one through five, five being the most risky and one being the least. These patterns are based
on the following characteristics: the usual quantity of alcohol consumed per occasion, festive
drinking, the proportion of drinking events in which consumers become inebriated, the proportion
of drinkers who are daily or nearly daily consumers, drinking with meals, and drinking in public
environments.
Measures of health provided by the WHO Status Report by country were: the age-
standardized death rates (ASDR) from liver cirrhosis for males and females, 2012 (per
populations of 100,000, ages 15+); the alcohol-attributable fractions (AAF) in percent for liver
cirrhosis in males and females, 2012; the prevalence (%) of alcohol use disorders, 2010 (15+);
and the prevalence (%) of alcohol dependence, 2010 (15+). The World Alzheimer Report
provided prevalence and incidence rates of dementia for the following regions: Australasia; Asia
Pacific – High Income; Oceania; Central, East, South, and Southeast Asia; Western, Central, and
Eastern Europe; North America; Andean, Central, Southern, and Tropical Latin America; the
Caribbean; North Africa/Middle East; and Central, East, Southern, and West Sub-Saharan Africa.
Analysis of Liver Cirrhosis
The relationship between alcohol consumption and liver cirrhosis was determined by
plotting the measures of consumption outlined above (except the patterns of drinking score) for
each country against the corresponding measures of liver cirrhosis, ASDR and AAF. Rates for
females and males were first plotted separately and if clear trends were observed, rates for both
sexes were plotted on the same plot to establish sex-specific relationships. Outliers, if present,
were identified. Trends in the data were evaluated.
Page 37
26
Analysis of Alcohol Use Disorders
The international relation between alcohol use disorders and rates of consumption was
established by plotting measures of consumption (outlined above) by country against the
country’s corresponding percentages of prevalence of alcohol use disorders and alcohol
dependence. Rates for both populations were plotted first. Female and male populations were
then plotted separately, and if clear trends were observed, rates for both sexes were plotted on the
same plot to establish sex-specific relationships. Outliers, if present, were identified. Trends in
the data were evaluated.
Analysis of Dementia
The connection between dementia and alcohol consumption was determined by plotting
measures of consumption provided by WHO (alcohol consumption per capita, percentage of
lifetime abstainers/abstainers for past year, and prevalence of HED) against incidence and
prevalence rates of dementia provided by Alzheimer’s Disease International. To do so, the
alcohol consumption data provided by country in the WHO data set was organized by the regions
provided in the World Alzheimer Report, as prevalence and incidence of dementia were only
available by region and not by country. This was done using Table A.1 provided in Appendix A
of the World Alzheimer Report, which stated which countries belonged to each region. Then, the
alcohol consumption data of the countries in each region were averaged to produce a single mean
value for the region. These values were first plotted against the crude estimated prevalence of
2015, given in Table 2.10 of the World Alzheimer Report (Prince et al). Then, these values were
compared against the incidence rating, which was calculated by taking the number of incidence
cases by region (provided in Table 3.2 of World Alzheimer Report) and dividing that by the
population of that region (Table 2.10) (Prince et al). The Asia East region was excluded due to
insufficient data from the WHO Alcohol Status Report. The resulting plots were evaluated for
trends and outliers were identified.
Results and Discussion
Analysis of Liver Cirrhosis
Rates of liver cirrhosis, which included alcohol-attributable fractions and age-
standardized death rates, were compared to rates and patterns of alcohol consumption by country
for males and females separately. Data involving both sexes was not available. In general, clear
trends were observed for the alcohol-attributable fraction of liver cirrhosis (Figures 18-21);
however, an evident correlation between measures of alcohol consumption and the age-
Page 38
27
standardized death rates of liver cirrhosis (ASDR) was not identified (Figures 4-6 in Appendix
B). Because the age-standardized death rates of liver cirrhosis include causes other than alcohol
consumption, such as fatty liver and hepatitis C, there are confounders that might obscure the
correlation between levels of consumption and the prevalence of liver cirrhosis (“Cirrhosis of the
Liver”). In fact, a recent study on global liver health revealed that most cases of liver cirrhosis
and cancer are due to hepatitis B and C infections. The prevalence of hepatitis also varies greatly
worldwide, because hepatitis infections are dealt with differently in different countries, depending
on the resources available to that country and its previous pervasiveness in the region (Perz et al).
The variation in the ASDR data is consistent with the alternate causes of liver cirrhosis and the
variation in the prevalence of the various causes in global populations. A more direct correlation
between alcohol consumption and the alcohol-attributable fractions of liver cirrhosis is expected
because the latter measure includes only percentages of liver cirrhosis caused by alcohol
consumption.
The relationship between the consumption per capita and the alcohol-attributable fraction
of liver cirrhosis was particularly strong, as seen in Figure 18. In general, these relationships
seem fairly linear, with some exponential characteristics. It appears in both plots that as the
alcohol consumption per capita increases, the alcohol-attributable fraction approaches a threshold
value. This supports previous studies that have suggested that there is a level of consumption at
which the amount no longer affects the progression of liver cirrhosis (Rehm et al) (Sorensen).
Page 39
28
(a)
(b)
Figure 18: The alcohol-attributable fractions of liver cirrhosis as a function of yearly alcohol
consumption rates in liters pure alcohol for a) males and b) females. The circled outliers include
the following countries: for males (a), Canada, Estonia, Latvia, Ukraine, Russian Federation,
Lithuania, Republic of Moldova, and Belarus; and for females (b), Belize.
Nonetheless, there are characteristics of the above figures that indicate a dose-dependent
relationship at lower consumption levels. As the consumption rates increase, the prevalence of
liver cirrhosis attributable to alcohol consumption also increases at a similar rate. This dose-
dependency is evident in both men and women, as the relationship between alcohol-attributable
fractions of liver cirrhosis and consumption per capita exhibits linearity early on. Males maintain
Page 40
29
this linearity longer, at higher rates of alcohol consumption. In contrast, females demonstrate
linearity at very low rates of alcohol consumption, and a steep incline near the origin is observed.
A study by Becker et al. also detected this steep increase in women (Becker et al). This incline
levels out with increasing consumption later on, suggesting women reach their threshold value
earlier than men. The steep increase and the early threshold indicate that smaller amounts of
alcohol have a greater effect on the liver of women than they do for men, signifying that women
may be more susceptible to liver damage with less consumption, confirming previous studies
(“Women and Alcohol”).
Countries that were outliers for the male population included: Canada, Estonia, Latvia,
Ukraine, Russian Federation, Lithuania, the Republic of Moldova, and Belarus. Except for
Canada and Russia, all of these countries lie in the Eastern European region. Because most of the
outliers were from Eastern Europe, it is possible to speculate that people of this region are less
susceptible to the effects of alcohol on the liver. The only country that was an outlier for females
was Belize, a country in Central America.
Plotting the female and male populations on the same graph (Figure 19) yielded
noteworthy results that confirmed previous conclusions.
Figure 19: AAF of liver cirrhosis as a function of total alcohol consumption, displaying both
female and male populations. Women tend to have higher percentages of alcohol-attributable liver
cirrhosis than men at lower rates of alcohol consumption. Women also exhibit less total
consumption by approximately fifteen liters of pure alcohol.
First and foremost, the following plot confirms that women drink significantly less than men.
Secondly, females experience a steeper incline of AAF at lower doses of alcohol than men. This
Page 41
30
would again suggest that women are much more susceptible to liver damage than men despite
having the same consumption rates. Finally, it again appears that the trend for females is more
exponential in character, reaching a threshold alcohol-attributable fraction sooner than males.
The connection between alcohol-attributable fractions of liver cirrhosis and the
prevalence of heavy episodic drinking as well as the percentage of lifetime abstainers was less
apparent. In general, as the prevalence of heavy episodic drinking increased, the alcohol-
attributable fractions increased. The opposite was true for the percentage of lifetime abstainers,
as the percentage of abstainers increased, the alcohol-attributable fractions decreased. The
increased variation in measures of prevalence of heavy episodic drinking and the percentage of
abstainers in comparison to the total consumption per capita indicates that there is a stronger
correlation between rates of alcohol consumption and liver cirrhosis. This provides further proof
that the relationship between liver damage and alcohol is reliant on the amount or the dose of
alcohol, instead of depending on other factors such as drinking patterns. Plots depicting these
relationships for both sexes are shown in Figures 20 and 21 below. Plots that look at the sexes
separately are included in Figures 2 and 3 in Appendix B.
Figure 20: AAF of liver cirrhosis as a function of prevalence of HED (%) for male and female
populations. In general, as prevalence of HED increases, the alcohol-attributable fractions also
increase. Females also exhibit less variation than males.
Page 42
31
Figure 21: AAF of liver cirrhosis as a function of the percentage of female and male lifetime
abstainers. The correlation demonstrates that as the percentage of lifetime abstainers in a country
increases, the alcohol-attributable fractions decrease. In addition, females exhibit less variation
than males.
The plots that included both sexes (Figures 20 and 21) showed less variation in alcohol-
attributable fractions of liver cirrhosis with increasing alcohol consumption for the female
population. The male population is more widely spread. The reduced variation in females
suggests that there is a tighter correlation between alcohol and liver damage in women. This is
reasonable, as women have been shown to be more vulnerable to the effects of alcohol and a
more direct relationship would be expected.
Overall, trends in the data suggest that countries with higher consumption rates have
more cases of liver cirrhosis that is directly due to alcohol use, which was the expected
correlation. Since alcohol use has been proven as a risk factor for liver cirrhosis, it was
reasonable that countries with higher abstaining populations, lower consumption rates, and lower
prevalence of heavy drinking patterns had a reduced percentage of alcohol-attributable liver
cirrhosis.
Page 43
32
Analysis of Alcohol Use Disorders
The prevalence of alcohol dependence and alcohol use disorders was plotted against
measures detailing patterns and rates of alcohol consumption. Plots comparing the total
population are shown in Figures 22-25. Plots that are divided based on sex are included in
Figures 7-9 in Appendix B.
In general, the correlation between alcohol dependence and rates/patterns of consumption
exhibited a wide range of variability. Trends were not as well-defined as they were with liver
cirrhosis. This is likely due to the relationship between alcohol abuse and genetics. An
individual’s genetics is the predominant determinant in whether or not one becomes an alcoholic
(Wiren). Because different countries could have a greater genetic predisposition towards alcohol
abuse, certain countries could have greater rates of alcohol abuse regardless of consumption
levels and patterns.
Three outliers were consistent throughout the study for all measures of alcohol
consumption and had a prevalence for alcohol use disorders and alcohol dependence that was
substantially higher than other countries. The outliers, Belarus, the Russian Federation, and
Hungary, were all from the Eastern European region, save Russia, and exhibited patterns of
consumption that were considered excessive and risky. These patterns are in accordance with
indicators of alcohol abuse; thus, it is reasonable that countries that exhibit both of these
indicators have exorbitantly high dependency/abuse rates. Furthermore, women consistently
displayed less prevalence of alcohol abuse than men and, again, lower rates of consumption
(Figures 7-9 in Appendix B). This finding is consistent with previous studies concluding that
men have higher rates of alcohol abuse than women (Wiren).
As seen in Figure 22, the prevalence of alcohol abuse tends to increase with increasing
rates of consumption. This would suggest that countries that consume more alcohol have greater
rates of alcohol abuse.
Page 44
33
(a)
(b)
Figure 22: The a) prevalence of alcohol use disorders (%) and b) prevalence of alcohol
dependence (%) as a function of total alcohol consumption. As consumption rates increase,
prevalence of alcohol use disorders and dependence tends to increase.
Likewise, countries with greater prevalence of drinking patterns that would be considered
heavy have greater rates of alcohol abuse, as prevalence of alcohol abuse increases with
increasing prevalence of heavy episodic drinking (Figure 23). These results are consistent with
alcohol abuse patterns, since alcoholics are more predisposed to drink heavily (“Alcohol Use
Disorder”).
Page 45
34
(a)
(b)
Figure 23: The a) prevalence of alcohol use disorders (%) and b) prevalence of alcohol
dependence (%) as a function of prevalence of HED (%). As the prevalence of HED increases, the
prevalence of alcohol use disorders and dependence shows an increase as well.
Countries with greater percentages of lifetime abstainers tend to have a reduced
prevalence of alcohol abuse, as seen in Figure 24. Once more, this trend is expected, as countries
that have a greater population of abstainers should have a smaller population of alcoholics.
Page 46
35
(a)
(b)
Figure 24: The a) prevalence of alcohol use disorders (%) and b) prevalence of alcohol
dependence (%) as a function of the percentage of lifetime abstainers. As the percentage of
lifetime abstainers in the country increases, the prevalence of alcohol use disorders and
dependence appears to decrease.
The relationship between alcohol abuse and the patterns of drinking score is notable. To
reiterate, the patterns of drinking score is a measurement of the riskiness of drinking, rated on a
scaled from one to five. If its drinking patterns are most risky, the country will earn a five and, in
contrast, will earn a one if its patterns are least risky. According to Figure 25, it appears that the
Page 47
36
risk level associated with consumption does not have a clear correlation to the prevalence of
alcohol abuse.
(a)
(b)
Figure 25: The a) prevalence of alcohol use disorders (%) and b) prevalence of alcohol
dependence (%) as a function of the patterns of drinking score, which is based on a 1-5 scale
where 5 is defined as most risky and 1 as least risky. No direct correlation between the two
variables was observed.
Countries that have risky patterns of consumption do not display the highest prevalence
of alcohol use disorders. However, the three outliers that have high prevalence of alcohol abuse
generally demonstrate medium to high levels of risk. Even so, some countries with high
Page 48
37
prevalence of alcohol use disorders have consumption patterns with low levels of risk. It appears
that the risk levels of consumption have little to no effect on the prevalence of alcohol abuse.
Measures of greater significance are those of total alcohol consumption, prevalence of heavy
episodic drinking, and percentage of lifetime abstainers.
Overall, the relationship between alcohol dependence and alcohol consumption measures
shows greater variance, likely due to differences in genetics. Despite this variation, countries that
had the greatest dependence on alcohol were those that demonstrated high levels of consumption
and patterns similar to those exhibited by alcoholics.
Analysis of Dementia
Measures of alcohol consumption were plotted against prevalence and incidence rates of
dementia. The former measures were provided by the WHO Alcohol Status Report and the latter
by Alzheimer’s Disease International. The incidence is a measurement of the annual occurrence
of new cases of dementia, while the prevalence is a measurement of the proportion of dementia
cases in the population at a given time. Incidence and prevalence are not equivalent measures.
Despite the use of two different data sets, clear trends were observed for alcohol measures plotted
against the incidence of dementia (Figures 26-27 described below). However, the graphs
examining the prevalence of dementia and alcohol measures yielded no significant trends, as seen
in Figures 10 and 11 in Appendix B. Because the prevalence of dementia readings were only
crude estimates, this discrepancy is explicable. Furthermore, this could be due to the different
nature of incidence and prevalence. Incidence better models the risk of developing dementia,
whereas prevalence is a measurement of how widespread the disease is. The prevalence measure
also fails to include the population who has died from dementia and may not be as robust of a
measure as incidence for studying the relationship between dementia and alcohol consumption.
First and foremost, the plot of incidence vs. consumption per capita in Figure 26 shows a
quadratic-like function that is roughly similar to the J-shaped curve seen in Figure 1. Regions
with relatively small levels of consumption have an incidence of dementia that is slightly
increased or roughly equal to regions with moderate levels of consumption. Moreover, the
regions with heavy consumption levels have dramatically more normalized incidents of dementia.
This denotes that excessive alcohol consumption is a risk factor for dementia. It is important to
note that the J-shaped nature of this curve is not as exaggerated as it is in Figure 1, thus it is
difficult to determine whether or not moderate levels of alcohol consumption are protective
against dementia. As a result, this data cannot conclusively support the conclusions found in
Study I, but it in no way refutes them. While there may be no evidence of a protective effect, it is
Page 49
38
evident that moderate alcohol consumption does not significantly increase the risk for developing
dementia.
Figure 26: The incidence of dementia in % annual cases as a function of the total consumption per
capita in liters of pure alcohol. Curve follows rough J-shape, indicating that moderate alcohol
consumption has little effect on the risk for developing dementia and is possibly protective against
dementia. Also shows that heavy alcohol consumption increases the risk for developing dementia.
Outliers include Asia Pacific and Eastern European regions.
There are two main outliers in Figure 26: the Asia Pacific – High Income region, which
has a high incidence of dementia at a low level of consumption, and the Eastern European region,
which has a low incidence of dementia at a high level of consumption. It is fascinating that the
Eastern European region is an outlier in this portion of the study, as countries in this region were
also outliers in the liver cirrhosis study. This would suggest that people from this region, despite
their high levels of consumption, do not experience the same effect of heavy consumption on
body. In this case, it is possible they experience less risk of developing dementia as a result of a
reduced susceptibility to alcohol or that there is some genetic factor that reduces their risk of
developing dementia in general. In contrast, the Asia Pacific region has a substantially higher
incidence. This is unusual because this region comprises Japan, which has one of the lowest rates
Page 50
39
of dementia globally, and other high income countries that already have policies in place to deal
with disease (“Looming Dementia Epidemic in Asia”). Despite this, dementia has been described
as a growing epidemic in the Asia Pacific region (“Dementia in the Asia Pacific Region…”)
(“Looming Dementia Epidemic in Asia”). This is due in large part to China, and China is not
included in the Asia Pacific – High Income region. However, observations of a growing
epidemic could perhaps explain the high incidence rate.
The plots of dementia incidence versus the percentage of abstainers, both lifetime
abstainers and abstainers for the past year, exhibit similar results. The curves appear to be a subtle
reverse J-shape, as seen below in Figure 27. This corroborates the conclusion above.
(a) (b)
Figure 27: The incidence of dementia in % annual cases as a function of the a) percentage of
lifetime abstainers and b) percentage of abstainers for the past year. Curves follow a reverse J-
shape, indicating that regions with high-medium abstinence rates have reduced incidence of
dementia in comparison to regions with low or especially high abstinence rates. The circled
outlier for both plots is the Asia Pacific region.
The regions with medium to high abstinence rates have an incidence that is roughly equal to or
slightly lower than the regions with the highest abstinence rates. In addition, regions with a high
to medium percentage of abstainers have a lower incidence of dementia than regions with a low
percentage of abstainers. This would suggest that countries with a higher percentage of
consumers are more likely to develop dementia and countries with a low-medium percentage of
consumers do not experience an increased risk for cognitive decline. This data also demonstrates
Page 51
40
that low levels of alcohol consumption are possibly protective against dementia due to a small dip
in the plot, but it is difficult to substantiate this with the above results. Furthermore, the
abstinence data can only supplement the consumption data discussed previously, as the
percentage of abstainers is not a measure of consumption rate. Nevertheless, as seen in Figure 12
in Appendix B, the relationship between rates of alcohol consumption and the percentage of
abstainers is roughly linear, so the trends seen are consistent with the inferences made previously.
This linear correlation also suggests that the effects of alcohol on dementia, both perhaps
beneficial and detrimental, are dose-dependent. The relationship between the prevalence of
heavy episodic drinking and the incidence of dementia, or lack thereof, further substantiates this
and will be discussed shortly. The single outlier for both measures of abstinence is the Asia
Pacific region, one of the same outliers that was present in Figure 26.
Finally, there is no significant correlation between the incidence of dementia and the
prevalence of heavy episodic drinking (seen in Figure 28).
Figure 28: The incidence of dementia in % annual cases as a function of the prevalence of heavy
episodic drinking (%). No significant correlation between the two variables is observed.
Page 52
41
This is likely due to the relatively weak comparison between prevalence of heavy episodic
drinking and the total alcohol consumption per capita (Figure 13 in Appendix B). This is further
proof that the relationship between dementia and alcohol is a dose-dependent relationship.
Alcohol’s effect on dementia is reliant on the amount of consumption, not necessarily patterns of
consumption. However, the connection between patterns of consumption and dementia rates
must be further studied before stating there is no correlation between the two.
Overall, the analysis of dementia against alcohol consumption neither confirmed nor
refuted the results discussed in Study I. Regions that have nearly zero consumption have an
equal, if not slightly higher, incidence of dementia to regions of moderate consumption. As a
result, it is possible there is small protective effect against cognitive decline for the regions with
moderate levels of consumption. Analyzing females and males separately might make this
protective effect more pronounced, which is perhaps the reason why Study I demonstrated a clear
protective effect, where Study II was modest at best. In addition, Study II also allowed the
exploration of the effects of heavy consumption. It appears that high levels of alcohol
consumption dramatically increase the risk for developing dementia. Considering the effects on
the brain discussed previously, such as brain shrinkage, brain cell death, and the Wernicke-
Korsakoff syndrome, this is a logical finding.
There are some important study limitations to reflect on that are specific to this
international study of dementia and alcohol consumption. The primary limitation is the
heterogeneity of the data sets. Because this data was obtained from two different sources (WHO
and Alzheimer’s Disease International) and essentially includes two different populations, there
are confounders that were not considered. Clear trends were still observed despite this limitation,
so the global relationship between alcohol consumption and dementia is an association that
should be studied further with a single data set. Furthermore, the population analyzed for
dementia is of an older generation (age 60+) than the population analyzed for alcohol
consumption (age 15+). Worldwide trends in alcohol consumption during the time in which the
population with dementia was affected by alcohol consumption could have been different than the
trends today. Because this analysis assumes that the trends in alcohol consumption stayed
constant over time, observed correlations might be skewed. To reiterate, significant correlations
between alcohol consumption rates and dementia incidence were detected, even with the above
limitations.
Page 53
42
Overall Study Limitations
There are also two overall limitations of Study II to consider. Firstly, Study II is limited
to trend analysis and thus, patterns in the data can only be observed and not statistically
confirmed. A more in-depth statistical analysis would require a larger population and a battery of
statistical tests. Secondly, it is difficult to collect data internationally without some discrepancies
in method. It is hard to be consistent in determining drinking patterns and distinguishing what
countries have patterns of drinking that are either riskier or are in line with heavy episodic
drinking. This could be a source of error that might make observed correlations seem stronger or
weaker than they are in reality. Despite these limitations, the global trends detected were
generally strong correlations and followed patterns published in local and national studies.
CONCLUSIONS
Studies I and II were conducted to analyze the connection between alcohol consumption
and health. Previous work has shown that alcohol use can be both beneficial and detrimental
depending on dosage. The results of these studies confirmed this conclusion using both local and
international data-sets. In general, alcohol in moderation appears to have little to no negative
effects on health and can be protective in some cases. In contrast, when used in excess, alcohol
can be incredibly harmful to one’s body. Study I revealed that moderate alcohol consumption can
be used as a preventive measure against cognitive decline. Conversely, Study II demonstrated
that heavy alcohol consumption is correlated with an increase in dementia. Study II also revealed
that rates of liver cirrhosis generally increase with increasing consumption amounts among
different countries and that alcohol dependency is more prevalent in regions with greater
consumption.
Furthermore, both studies have shown that women have greater susceptibility to the
detriments of alcohol. Women who follow moderate consumption patterns experience less of a
protective effect on cognition than men, and women who consume the same amounts as men are
more prone to liver cirrhosis. The only measure in which this differed was alcohol dependency;
men have greater rates of alcohol abuse worldwide than women. Due to an increased
vulnerability to alcohol, women should pay extra attention to their consumption levels. All in all,
these studies have exemplified that when it comes to alcohol, “everything in moderation” is a
good rule to live by.
Page 54
43
WORK CITED
"Alcohol's Damaging Effect on the Brain." National Institute on Alcohol Abuse and Alcoholism
(NIAAA). National Institutes of Health, Oct. 2004. Web. 30 July 2016.
"Alcohol's Effects on the Body." National Institute on Alcohol Abuse and Alcoholism (NIAAA).
National Institutes of Health, n.d. Web. 28 July 2016.
“Alcohol Use Disorder.” National Institute on Alcohol Abuse and Alcoholism (NIAAA). National
Institutes of Health, n.d. Web. 28 July 2016.
Bates, D.M., M. Maechler, B.M. Bolker and S. Walker. “Fitting Linear Mixed-Effects Models
Using lme4. Journal of Statistical Software (2015):1-48. Web. 15 July 2015.
Bates, D.M., M. Maechler, B.M. Bolker and S. Walker. “lme4: Fitting Linear Mixed-Effects
Models Using Eigen and S4.” R Package Version 1.1-7, 2014. Web. 15 July 2015.
Becker, U., A. Deis, T.I. Sorensen, M. Gronbaek, K. Borch-Johnsen, C.F. Muller, P. Schnohr,
and G. Jensen. “Prediction of risk of liver disease by alcohol intake, sex, and age: A
prospective population study.” Hepatology (1996): 1025-1029. Web. 3 Aug. 2016.
Beres, C.A. and A. Baron. “Improved digit symbol substitution by older women as a result of
extended practice.” Journals of Gerontology (1981): 591-597. Web. 10 Dec. 2015.
Center for the Study of Aging and Human Development. Multidimensional functional
assessment: the OARS methodology, a manual. 2nd
ed. Durham: Duke University, 1978.
Print.
Cirrhosis of the Liver." WebMD. WebMD, LLC, 2016. Web. 3 Aug. 2016.
"Dementia in the Asia Pacific Region: The Epidemic Is Here." Fightdementia.org. Access
Economics, 21 Sept. 2006. Web. 2 Aug. 2016.
Di Castelnuovo, Augusto, ScD., Simona Costanzo, ScD., Vincenzo Bagnardi, ScD., Maria
Donati, M.D., PhD., Licia Iacoviello, M.D., PhD., and Giovanni de Gaetano, M.D., PhD.
“ Alcohol Dosing and Total Mortality in Men and Women.” Archives of Internal
Medicine (2006): 2437-2445. Web. 7 July 2015.
"Drinking Levels Defined." National Institute on Alcohol Abuse and Alcoholism (NIAAA).
National Institutes of Health, n.d. Web. 30 July 2016.
Folstein, M.F., Folstein, S.E., McHugh, P.R. “Mini-Mental State: a Practical Method for Grading
the Cognitive State of Patients for the Clinician.” Journal of Psychiatric Research
(1975): 189-198. Web. 28 July 2016.
Gomez, Rowena G. and Desiree A. White. “Using verbal fluency to detect very mild dementia of
the Alzheimer type.” Archives of Clinical Neuropsychology (2006): 771-775. Web. 28
July 2016.
Page 55
44
Goodglass, H. and E. Kaplan. Assessment of Aphasia and Related Disorders. Philadelphia: Lea &
Febiger, 1983. Print.
Graham, N.L., T. Emery, and J.R. Hodges. “Distinctive cognitive profiles in Alzheimer’s disease
and subcortical vascular dementia.” Journal of Neurology, Neurosurgery and Psychiatry
(2004): 61-71. Web. 10 July 2016.
Heerema, Esther, MSW. "What Is the Digit Symbol Test?" Very Well. About, Inc., 20 July 2015.
Web. 03 Aug. 2016.
"Intelligent Systems for Assessment of Aging Changes (ISSAC)." Layton Aging & Alzheimer's
Disease Center. Oregon Health & Science University, n.d. Web. 10 July 2015.
Lange, Kelly L., Mark W. Bondi, David P. Salmon, Douglas Galasko, Dean C. Delis, Ronald G.
Thomas, and Leon J. Thal. "Decline in Verbal Memory during Preclinical Alzheimer's
Disease: Examination of the Effect of APOE Genotype." Journal of the International
Neuropsychological Society (2002): 943-955. Web. 30 July 2016.
Linn, B.S., M.W. Linn and L. Gurel. “Cumulative Illness Rating Scale.” Journal of the American
Geriatrics Society (1968):622-626. Web. 15 July 2015.
Lippincott Williams & Wilkins. "Appendix I." Wolters Kluwer Health, 2014. Web. 3 Aug. 2016.
"Looming Dementia Epidemic in Asia." WHO. World Health Organization, Mar. 2011. Web. 4
Aug. 2016.
Maccow, Gloria, PhD. "WMS-IV: Administration, Scoring, Basic Interpretation.” Pearson
Clinical. Pearson, Inc., 9 Sept. 2011. Web. 3 Aug. 2016.
Morris, J.C. “The Clinical Dementia Rating (CDR): Current version and scoring rules.”
Neurology (1993): 2412-2414. Web. 10 July 2015.
O’Bryant, S.E., S.C. Waring. C.M. Cullum, et al. “Staging dementia using Clinical Dementia
Rating Scale Sum of Boxes scores: a Texas Alzheimer’s research consortium study.”
Archives of Neurology (2008): 1091-1095. Web. 10 July 2015.
O'Keefe, James H., MD, Salman K. Bhatti, MD, Ata Bajwa, MD, James J. DiNicolantonio,
PharmD, and Carl J. Lavie, MD. "Alcohol and Cardiovascular Health: The Dose Makes
the Poison…or the Remedy." Mayo Clinic Proceedings (2014): 382-393. Web. 28 July
2016.
"Oregon Brain Aging Study." Layton Aging & Alzheimer's Disease Center. Oregon Health and
Science University, n.d. Web. 30 July 2016.
Perz, Joseph F., Gregory L. Armstrong, Leigh A. Farrington, Yvan J.F. Hutin, Beth P. Bell. “The
contributions of hepatitis B virus and hepatitis C virus infections to cirrhosis and primary
liver cancer worldwide.” Journal of Hepatology (2006): 529-538. Web. 3 Aug. 2016.
Page 56
45
Peters, Ruth, Jean Peters, James Warner, Nigel Beckett, and Christopher Bulpitt. “Alcohol,
dementia and cognitive decline in the elderly: a systematic review.” Age and Ageing
(2008): 505-512. Web. 28 July 2016.
Pfeffer, R.I., T.T. Kurosaki, C.H. Harrah, Jr., J.M. Chance, and S. Filo. “Measurement of
functional activities in older adults in the community.” Journal of Gerontology (1982):
323-329. Web. 10 July 2015.
Prince, Martin, Anders Wimo, Maelenn Guerchet, Gemma-Claire Ali, Yu-Tzu Wu, and Mathew
Prina. “World Alzheimer Report 2015: The Global Impact of Dementia.” Alzheimer’s
Disease International, Aug. 2015. Web. 16 July 2016.
Rehm, Jurgen, Benjamin Taylor, Satya Mohapatra, Hyacinth Irving, Dolly Baliunas, Jayadeep
Patra, and Michael Roerecke. “Alcohol as a risk factor for liver cirrhosis: A systematic
review and meta-analysis.” Drug and Alcohol Review (2010): 437-445. Web. 20 July
2016.
Sorensen, Thorkild. “Alcohol and Liver Injury: Dose-Related or Permissive Effect?” Addiction
(1989): 581-589. Web. 20 July 2016.
"The Global Burden of Disease: Main Findings for Sub-Saharan Africa." World Bank. The World
Bank Group, 9 Sept. 2013. Web. 2 Aug. 2016.
Wechsler, D. Manual for the Wechsler Adult Intelligence Scale. Revised. San Antonio: The
Psychological Corporation, 1981. Print.
Wechsler D. Wechsler Adult Intelligence Scale. 3rd
ed. San Antonio: The Psychological
Corporation, 1997. Print.
Wechsler, D. Wechsler Memory Scale. 3rd
ed. San Antonio: The Psychological Corporation, 1997.
Print.
Welsh K.A., N. Butters, R.C. Mohs, D. Beekly, S. Edland, G. Fillenbaum, and A. Heyman. “The
Consortium to Establish a Registry for Alzheimer's Disease (CERAD). Part V. A
normative study of the neuropsychological battery.” Neurology (1994): 609-614. Web. 10
July 2015.
"Wernicke-Korsakoff Syndrome." MedlinePlus Medical Encyclopedia. National Institutes of
Health, 7 July 2016. Web. 30 July 2016.
"What Is A Standard Drink?" National Institute on Alcohol Abuse and Alcoholism (NIAAA).
National Institutes of Health, n.d. Web. 30 July 2016.
Wickham, H. Ggplot2: Elegant Graphics for Data Analysis. New York, Springer: 2009. Print.
Wilhelm, Clare, PhD. “Alcohol in females: Is a little too much?” Oregon Health and Science
University. VA Medical Center, Portland, OR. July 2015. Conference Presentation.
Page 57
46
Wiren, Kristine, PhD. “Importance of biological sex/gender vs. family history to influence the
response to alcohol abuse during distinct stages of addiction.” Department of Behavioral
Neurosciences, Oregon Health and Science University. VA Medical Center, Portland,
OR. July 2014. Conference Presentation.
"Women and Alcohol." National Institute on Alcohol Abuse and Alcoholism (NIAAA). National
Institutes of Health, Dec. 2015. Web. 30 July 2016.
World Health Organization. Global status report on alcohol and health: 2014. Luxembourg:
World Health Organization, 2014. Print.
"WHO Regional Offices." WHO. World Health Organization, 2016. Web. 3 Aug. 2016.
APPENDIX
Appendix A: WHO Regions
Figure 1: Map representing the WHO regions for global burden of disease, given in the Global
Status Report on Alcohol and Health (“WHO Regional Offices”)
Page 58
47
Appendix B: Additional Study II Plots
Analysis of Liver Cirrhosis
(a)
(b)
Figure 2: AAF of liver cirrhosis as a function of the prevalence of HED (%) for a) male and b)
female populations. In general, as prevalence of HED increases, the alcohol-attributable fractions
also increase. Females also exhibit less variation than males.
Page 59
48
(a)
(b)
Figure 3: AAF of liver cirrhosis as a function of a) male lifetime abstainers and b) female lifetime
abstainers. For both males and females, as the percentage of lifetime abstainers in a country
increases, the alcohol-attributable fractions decreases and females show less variation than males.
Page 60
49
(a) (b)
Figure 4: The age-standardized death rates of liver cirrhosis as a function of alcohol consumption
per capita for a) males and b) females. No clear trends were observed.
(a) (b)
Figure 5: The age-standardized death rates of liver cirrhosis as a function of the prevalence of
HED (%) for a) males and b) females. No clear trends were observed.
(a) (b)
Figure 6: The age-standardized death rates of liver cirrhosis as a function of the percentage of a)
male lifetime abstainers and b) female lifetime abstainers. No clear trends were observed.
Page 61
50
Analysis of Alcohol Use Disorders
(a)
(b)
Figure 7: The a) prevalence of alcohol use disorders (%) and b) prevalence of alcohol dependence
(%) as a function of the total alcohol consumption per capita for males and females. As
consumption rates increase, prevalence of alcohol use disorders and dependence tends to increase.
Women show lower prevalence rates of alcohol abuse and lower rates of consumption.
Page 62
51
(a)
(b)
Figure 8: The a) prevalence of alcohol use disorders (%) and b) prevalence of alcohol dependence
(%) as a function of the prevalence of heavy episodic drinking (%) for males and females. As the
prevalence of HED increases, the prevalence of alcohol use disorders and dependence shows an
increase as well. Women show lower prevalence rates for both alcohol dependence and HED.
Page 63
52
(a)
(b)
Figure 9: The a) prevalence of alcohol use disorders (%) and b) prevalence of alcohol dependence
(%) as a function of the percentage of lifetime abstainers for males and females. As the
percentage of lifetime abstainers in the country increases, the prevalence of alcohol use disorders
and dependence appears to decrease. Women generally show lower prevalence rates for alcohol
dependence, especially in countries where the percentage of male and female abstainers is low.
Page 64
53
Analysis of Dementia
Figure 10: The prevalence of dementia in percent as a function of the total consumption per capita
in liters of pure alcohol. No clear trends were observed.
(a) (b)
Figure 11: The prevalence of dementia (%) as a function of the percentage of a) lifetime
abstainers and b) abstainers for the past year. No clear trends were observed.
Page 65
54
(a) (b)
Figure 12: The a) percentage of lifetime abstainers and b) percentage of abstainers for the past
year as a function of the total alcohol consumption per capita. Relationship between these two
variables is fairly linear for both plots; linear fit has R2 above 0.75.
Figure 13: The prevalence of heavy episodic drinking as a function of the total alcohol
consumption per capita. Correlation between the two variables does not appear to be linear, at
least not to the significance of the fit in Figure 12 above.


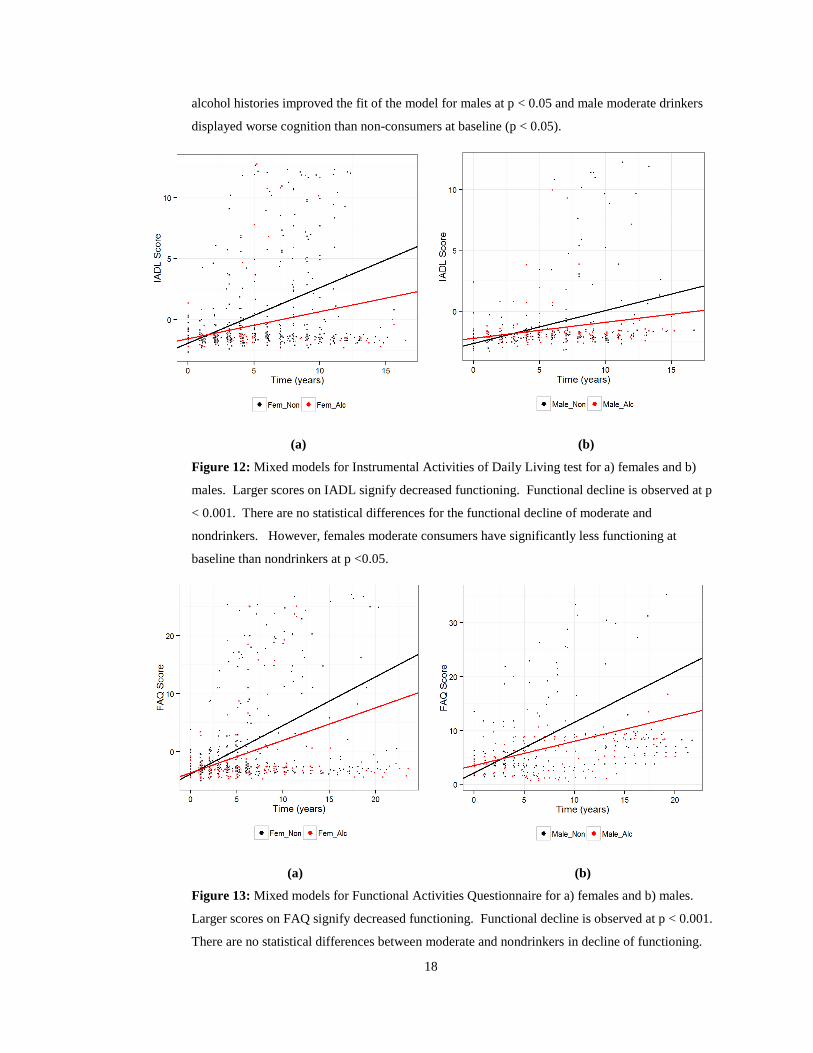


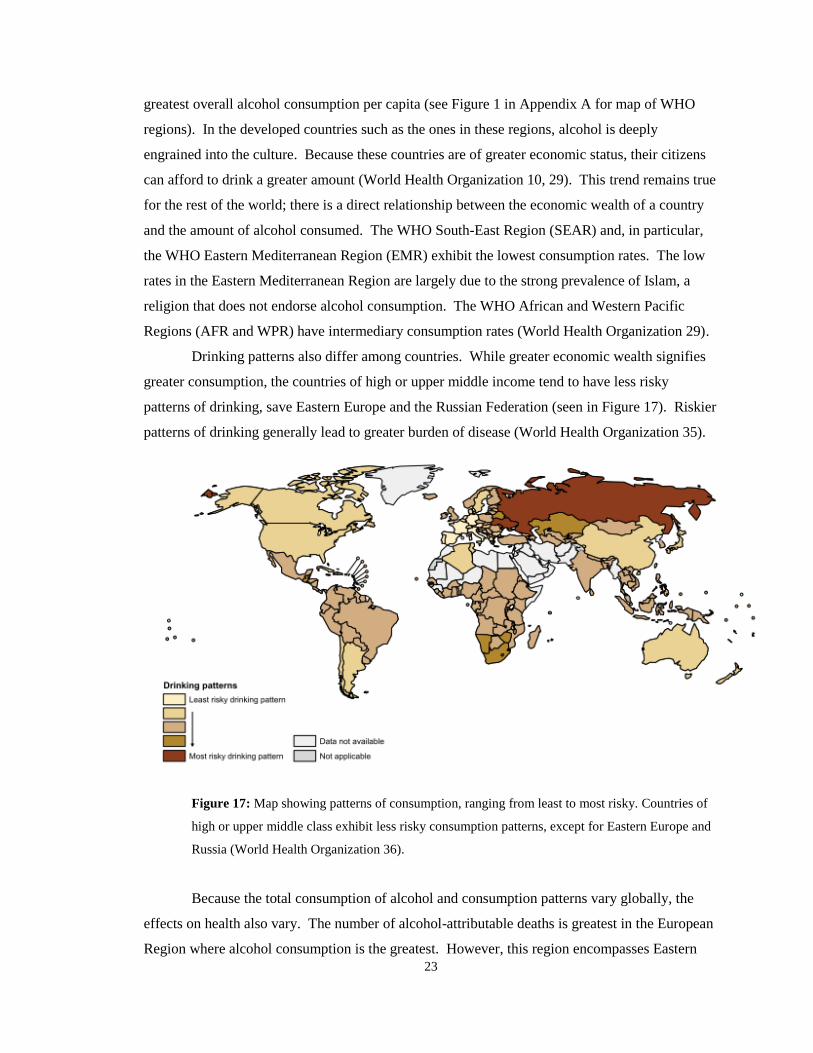


![Moderation process for dummies [Read-Only] - pdfMachine ... · 1. PLAN FOR MODERATION Before you can start with Moderation, ask the following questions first:-Who asked for moderation?-Why](https://static.documents.pub/doc/80x56/5bc5d2c209d3f264788dfdf4/moderation-process-for-dummies-read-only-pdfmachine-1-plan-for-moderation.jpg)


