Everything You Don’t Know About Infographics Starting at 10:30am PST Chat with follow webinar attendees: http://bit.ly/seomozchat Technical problems or feedback on the webinar: Please email [email protected]Ask questions using the Questions functionality to the right.
Transcript
Everything You Don’t Know About Infographics
Starting at 10:30am PST
Chat with follow webinar attendees:http://bit.ly/seomozchat
Technical problems or feedback on the webinar:Please email [email protected]
Ask questions using the Questions functionality to the right.
Everything You Don’t Know About Infographics
{ Chris Bennett }@chrisbennett
I ’m hoping to... Pursued those that have never tried data visualization.Encourage those that have failed.Inspire those that can’t stand to look at another infographic.
INFO(CRAP)HICSAre
Increased Traffic
Branding
Social Success
Links
Better Rankings
Good Data Visualizations Work and Work Well
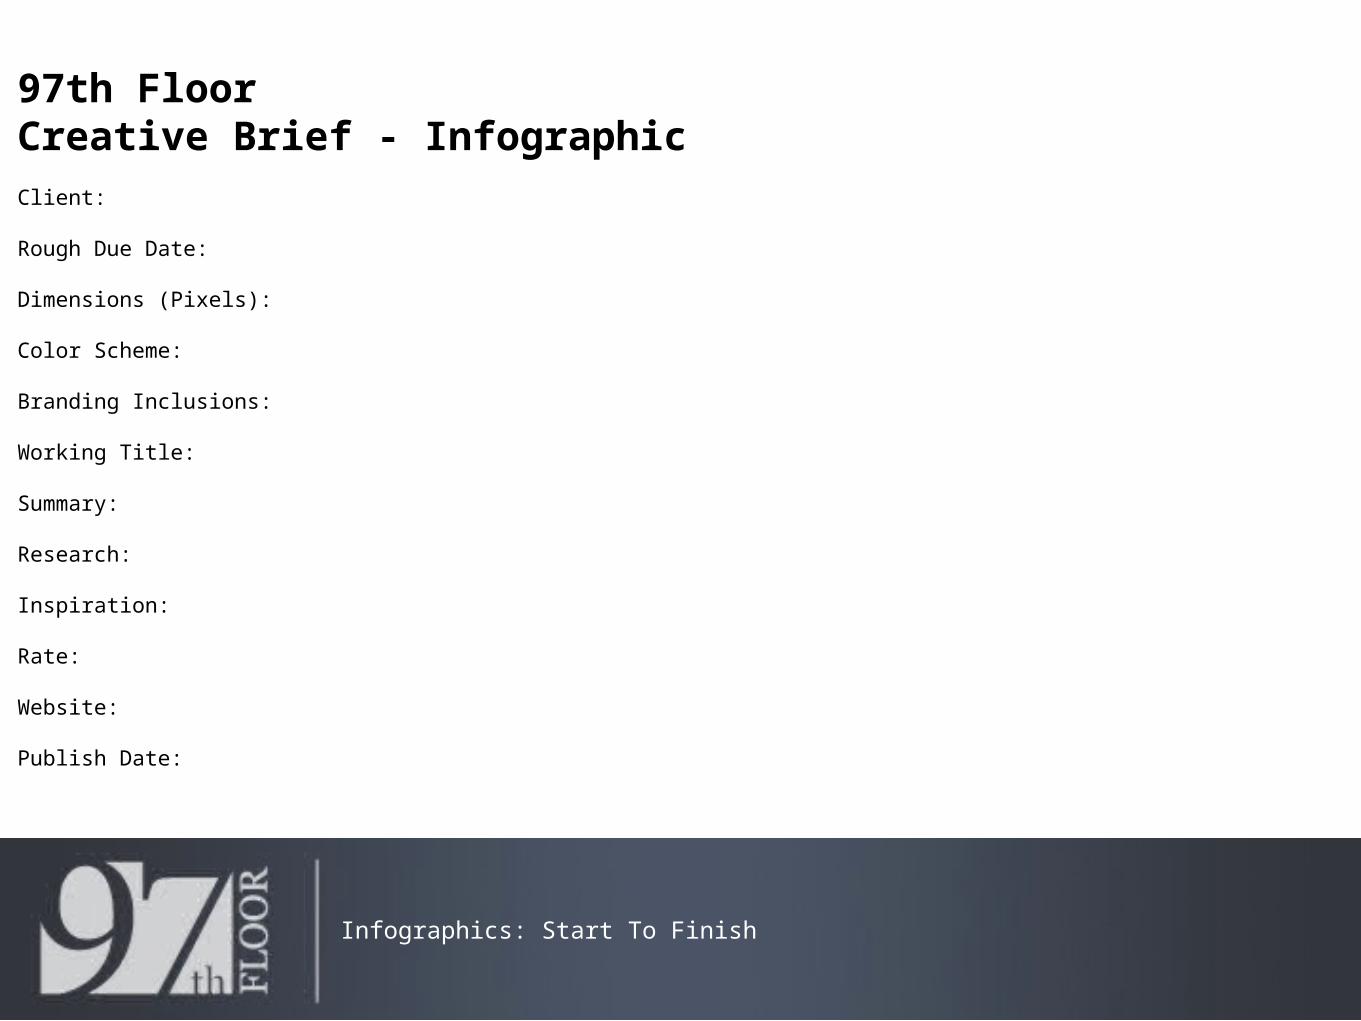
97th FloorCreative Brief - InfographicClient:
Rough Due Date:
Dimensions (Pixels):
Color Scheme:
Branding Inclusions:
Working Title:
Summary:
Research:
Inspiration:
Rate:
Website:
Publish Date:
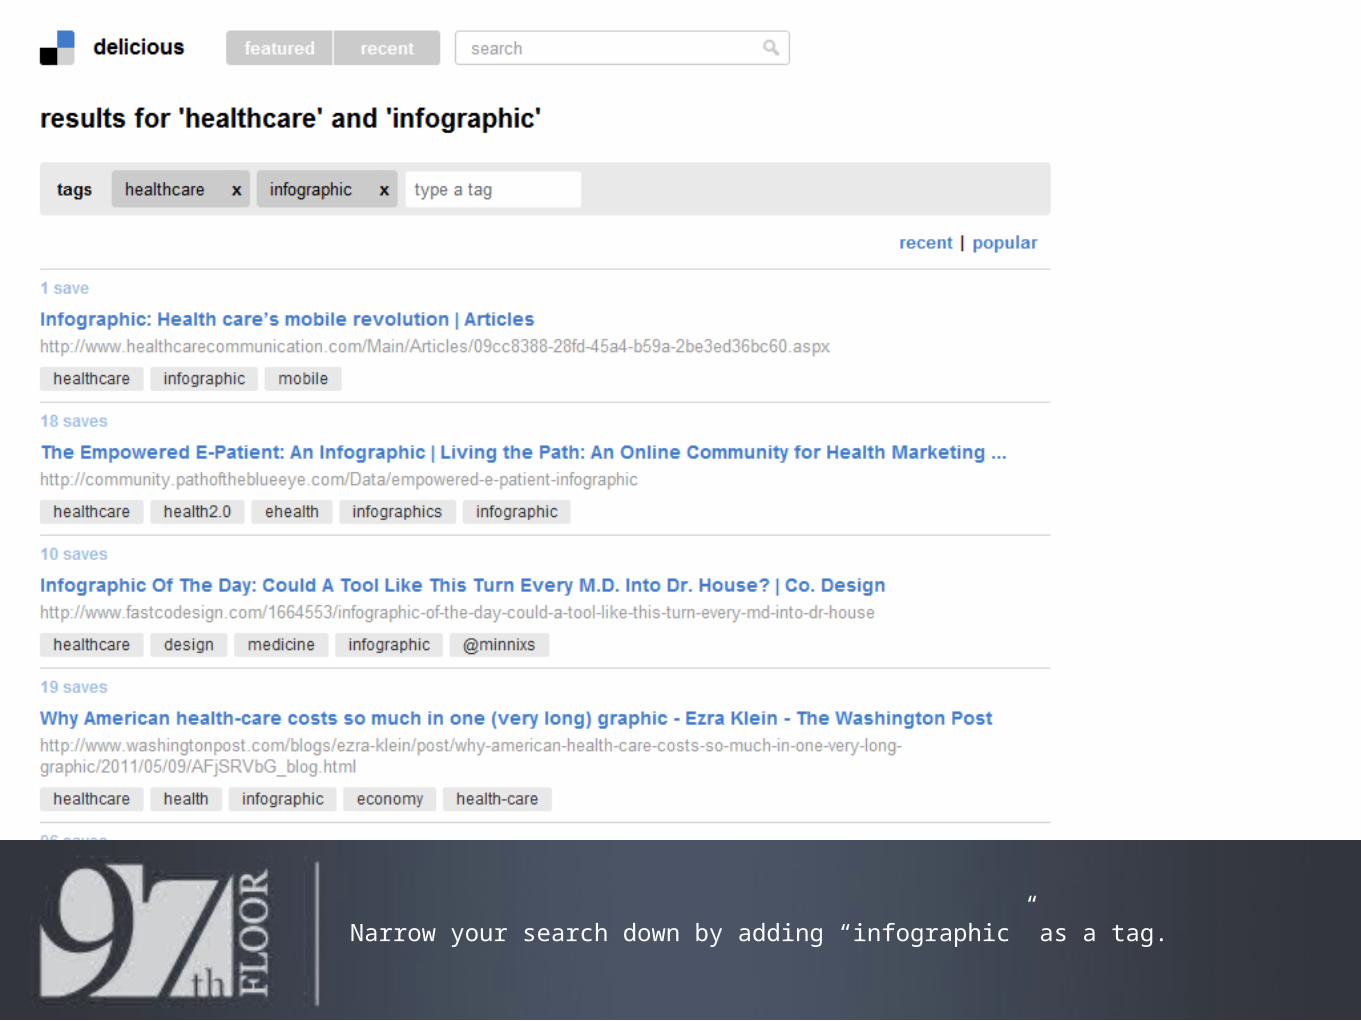
Infographics: Start To Finish
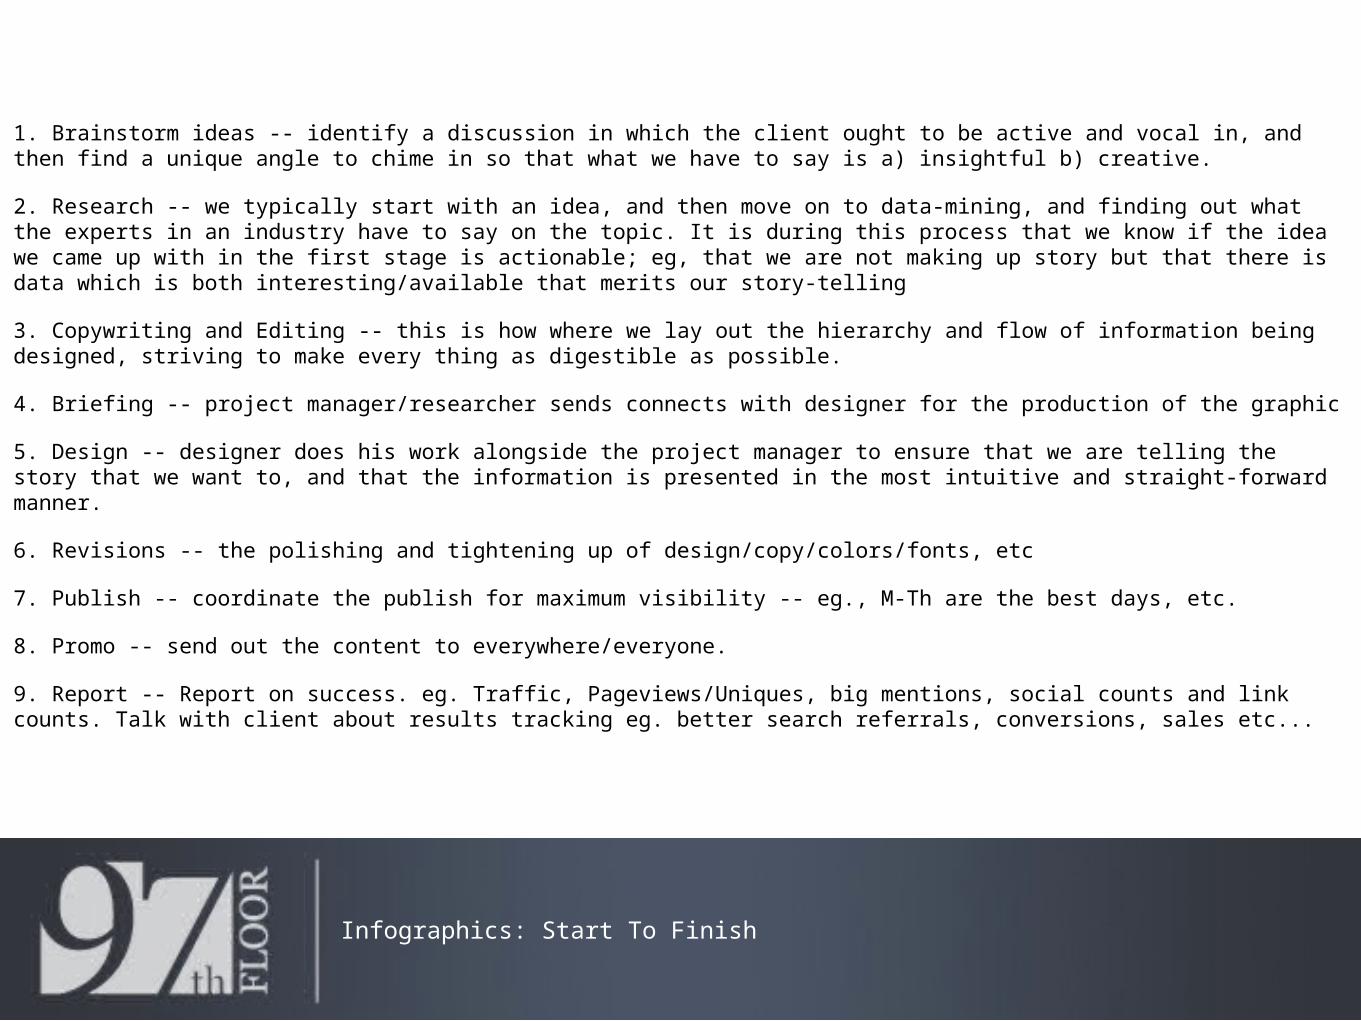
1. Brainstorm ideas -- identify a discussion in which the client ought to be active and vocal in, and then find a unique angle to chime in so that what we have to say is a) insightful b) creative.
2. Research -- we typically start with an idea, and then move on to data-mining, and finding out what the experts in an industry have to say on the topic. It is during this process that we know if the idea we came up with in the first stage is actionable; eg, that we are not making up story but that there is data which is both interesting/available that merits our story-telling
3. Copywriting and Editing -- this is how where we lay out the hierarchy and flow of information being designed, striving to make every thing as digestible as possible.
4. Briefing -- project manager/researcher sends connects with designer for the production of the graphic
5. Design -- designer does his work alongside the project manager to ensure that we are telling the story that we want to, and that the information is presented in the most intuitive and straight-forward manner.
6. Revisions -- the polishing and tightening up of design/copy/colors/fonts, etc
7. Publish -- coordinate the publish for maximum visibility -- eg., M-Th are the best days, etc.
8. Promo -- send out the content to everywhere/everyone.
9. Report -- Report on success. eg. Traffic, Pageviews/Uniques, big mentions, social counts and link counts. Talk with client about results tracking eg. better search referrals, conversions, sales etc...
Infographics: Start To Finish
Ideas and Research
Stick to your guns
Be creative, no marketing 101, Top 10 List, History of..., Evolution of...crap.
Infographicsarenot
Gimmicks
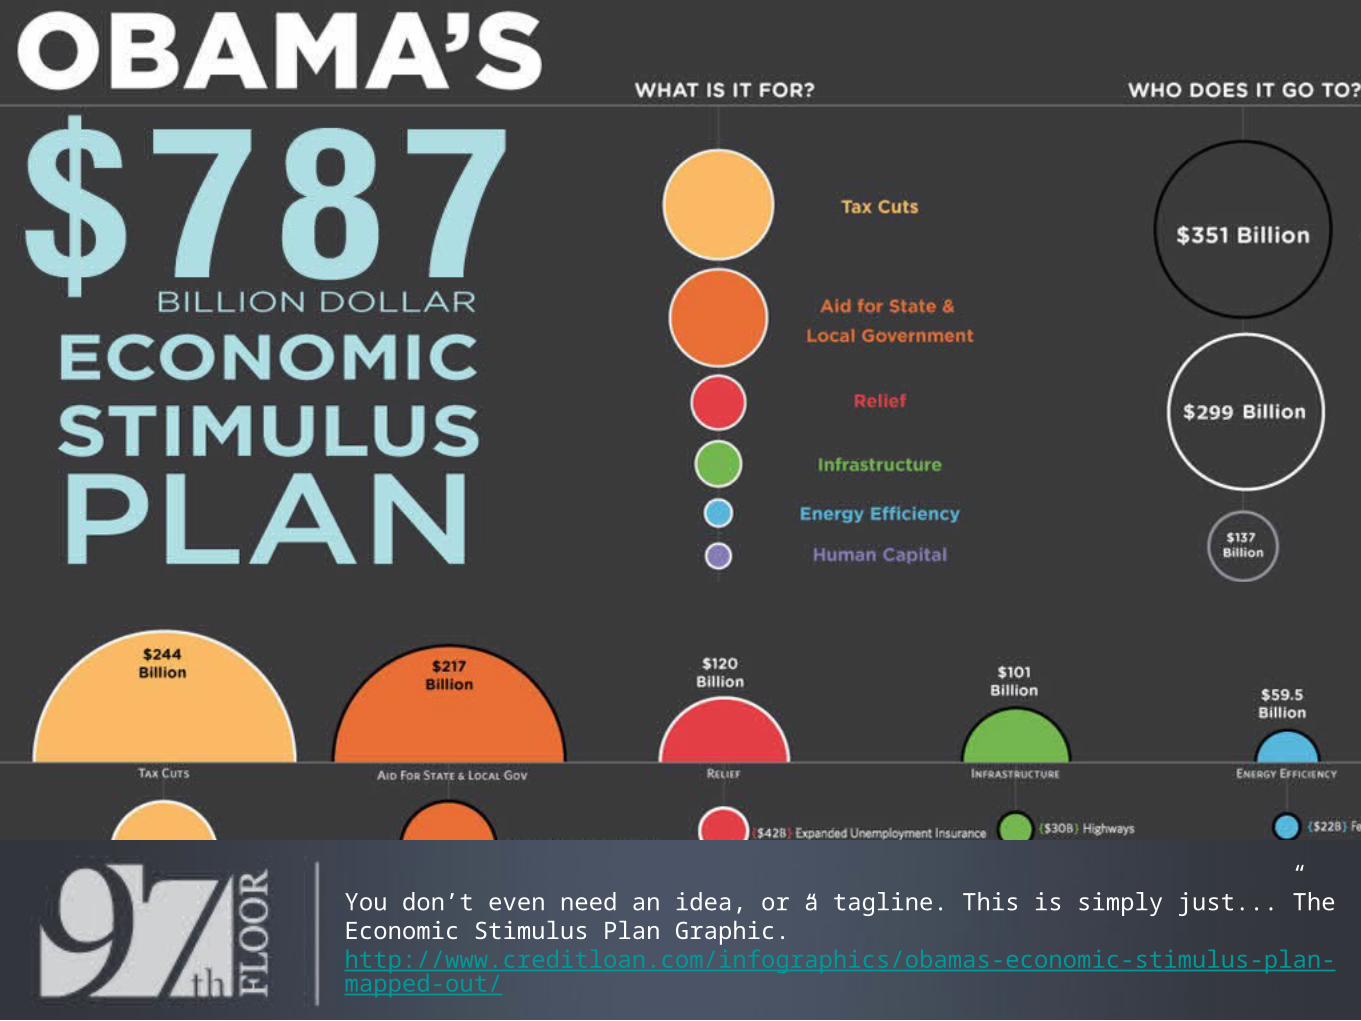
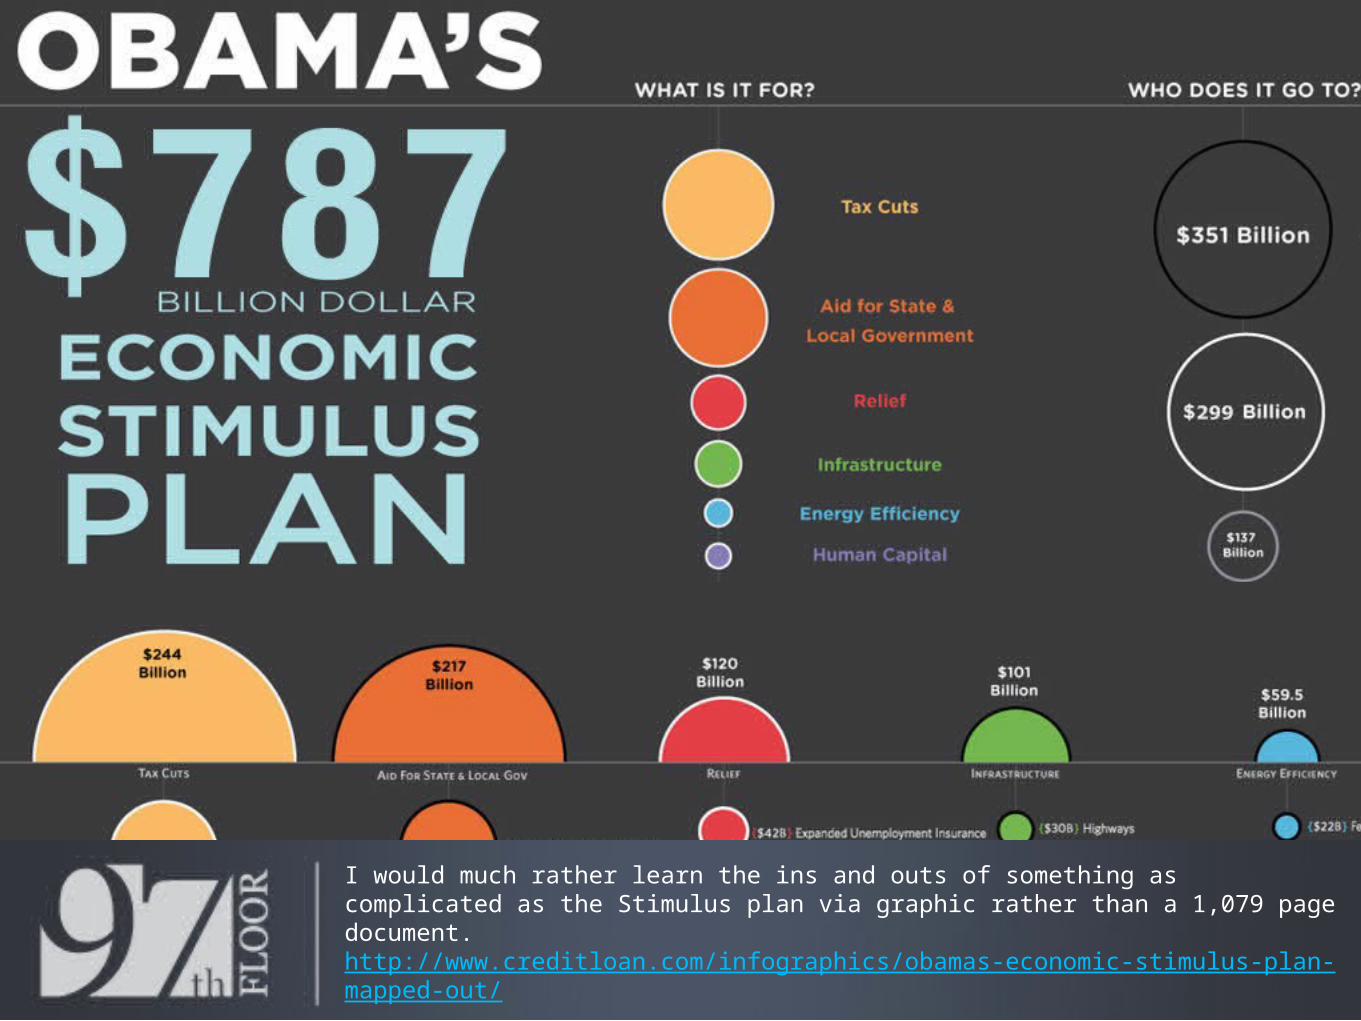
You don’t even need an idea, or a tagline. This is simply just...”The Economic Stimulus Plan Graphic.” http://www.creditloan.com/infographics/obamas-economic-stimulus-plan-mapped-out/
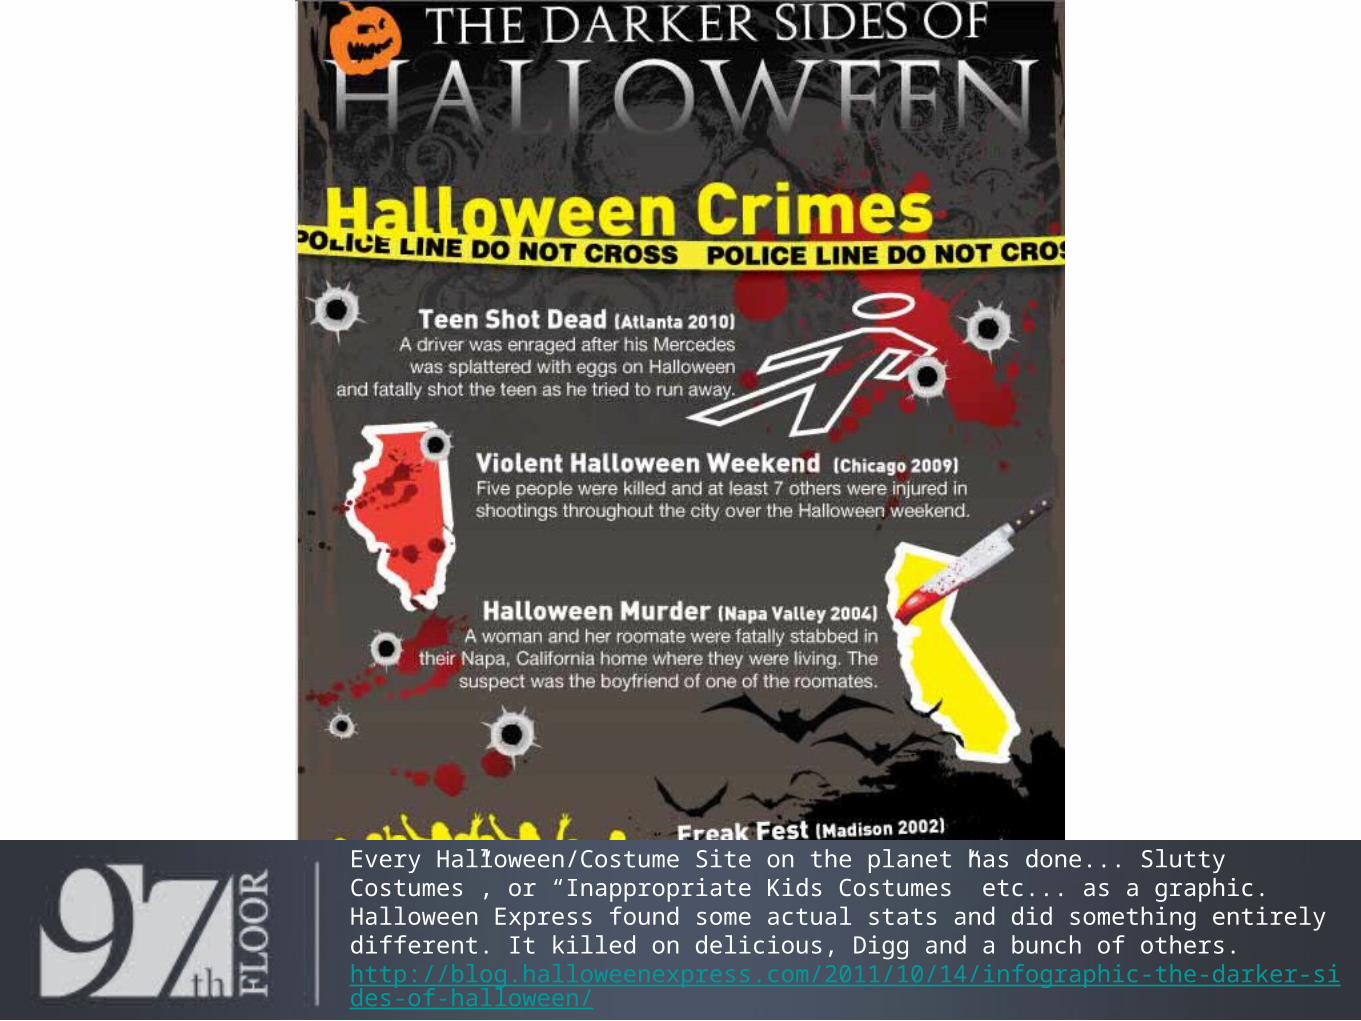
Every Halloween/Costume Site on the planet has done...”Slutty Costumes”, or “Inappropriate Kids Costumes” etc... as a graphic. Halloween Express found some actual stats and did something entirely different. It killed on delicious, Digg and a bunch of others. http://blog.halloweenexpress.com/2011/10/14/infographic-the-darker-sides-of-halloween/
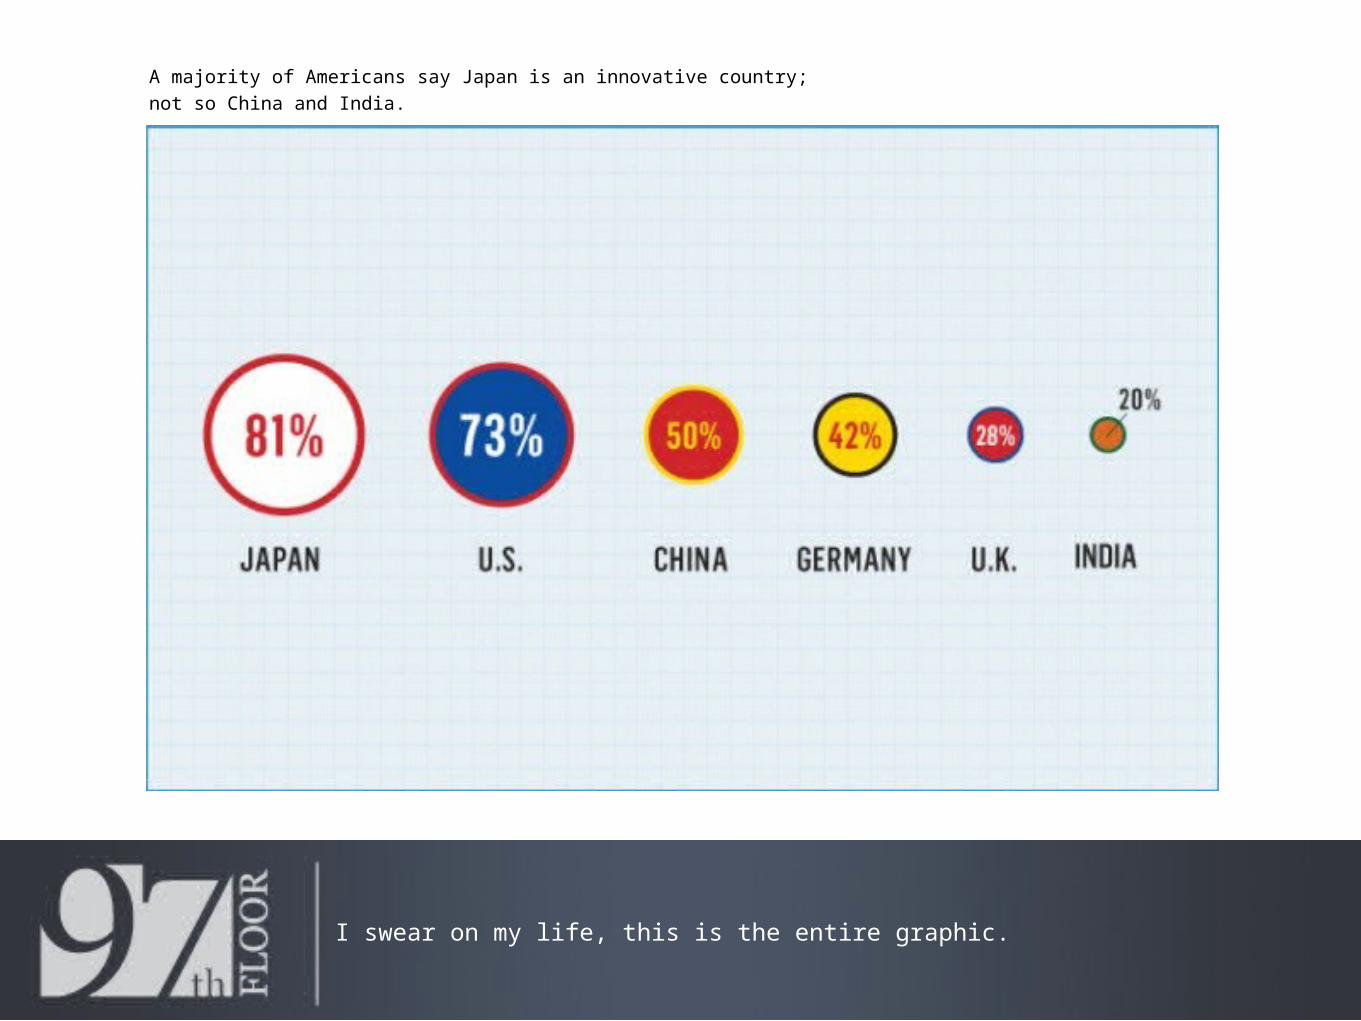
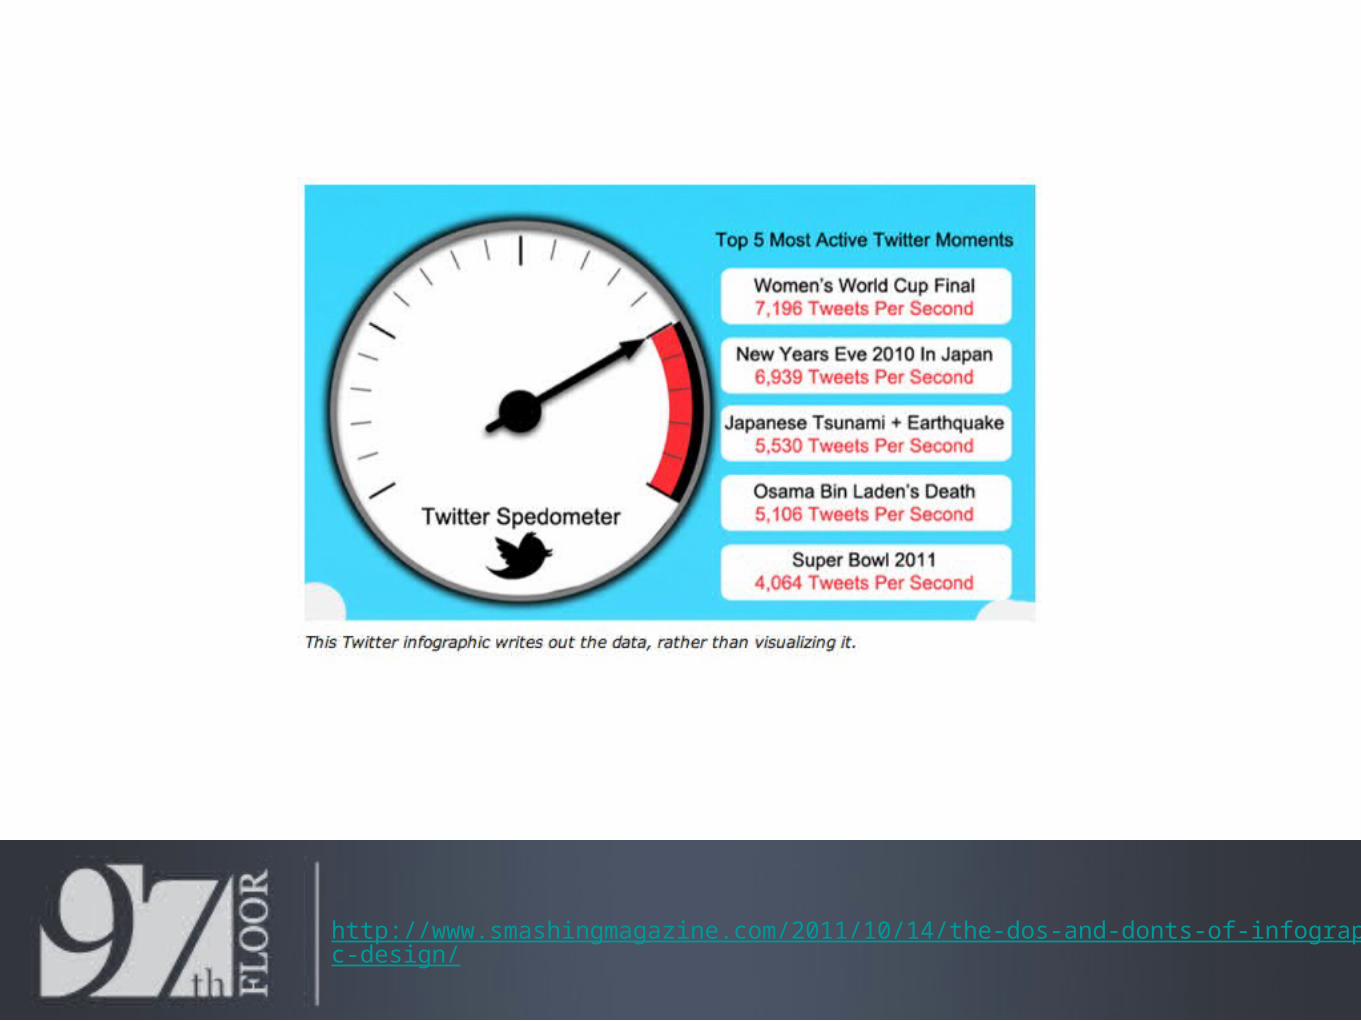
Remember your are telling a story with DATA rather than words. Sell your Hooks. http://www.smashingmagazine.com/2011/10/14/the-dos-and-donts-of-infographic-design/
Social Media Landscape Launched in 2010 = Extremley Successfulhttp://www.cmo.com/social-media/cmos-guide-social-media-landscape
Social Media Landscape Launched in 2011 = Rinse and Repeathttp://www.cmo.com/social-media/2011-cmos-guide-social-andscape
Infographics: Branding
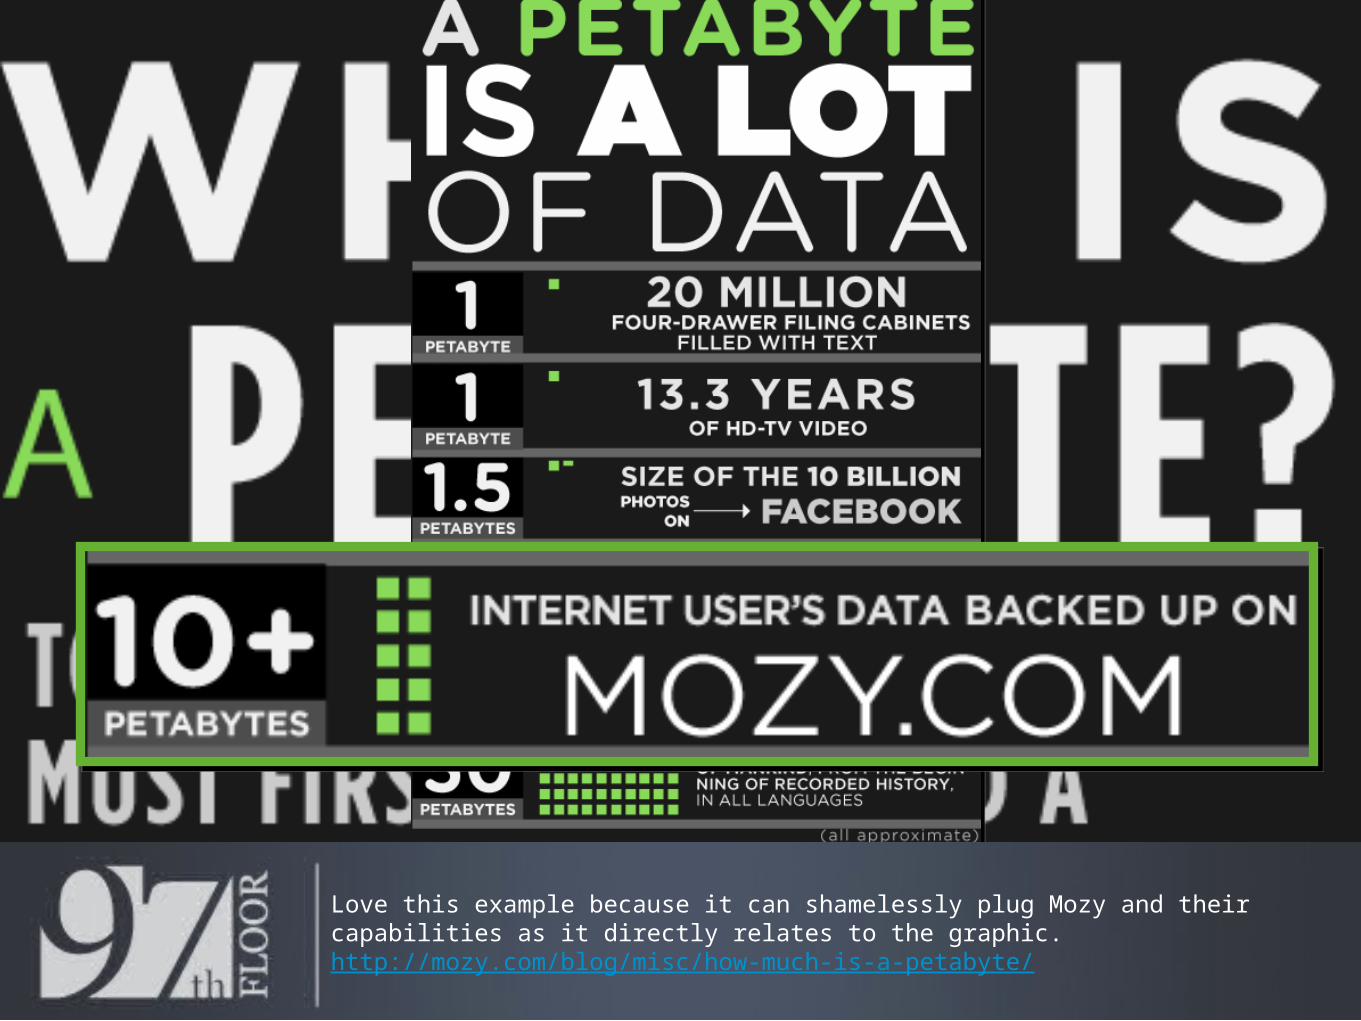
Love this example because it can shamelessly plug Mozy and their capabilities as it directly relates to the graphic.http://mozy.com/blog/misc/how-much-is-a-petabyte/
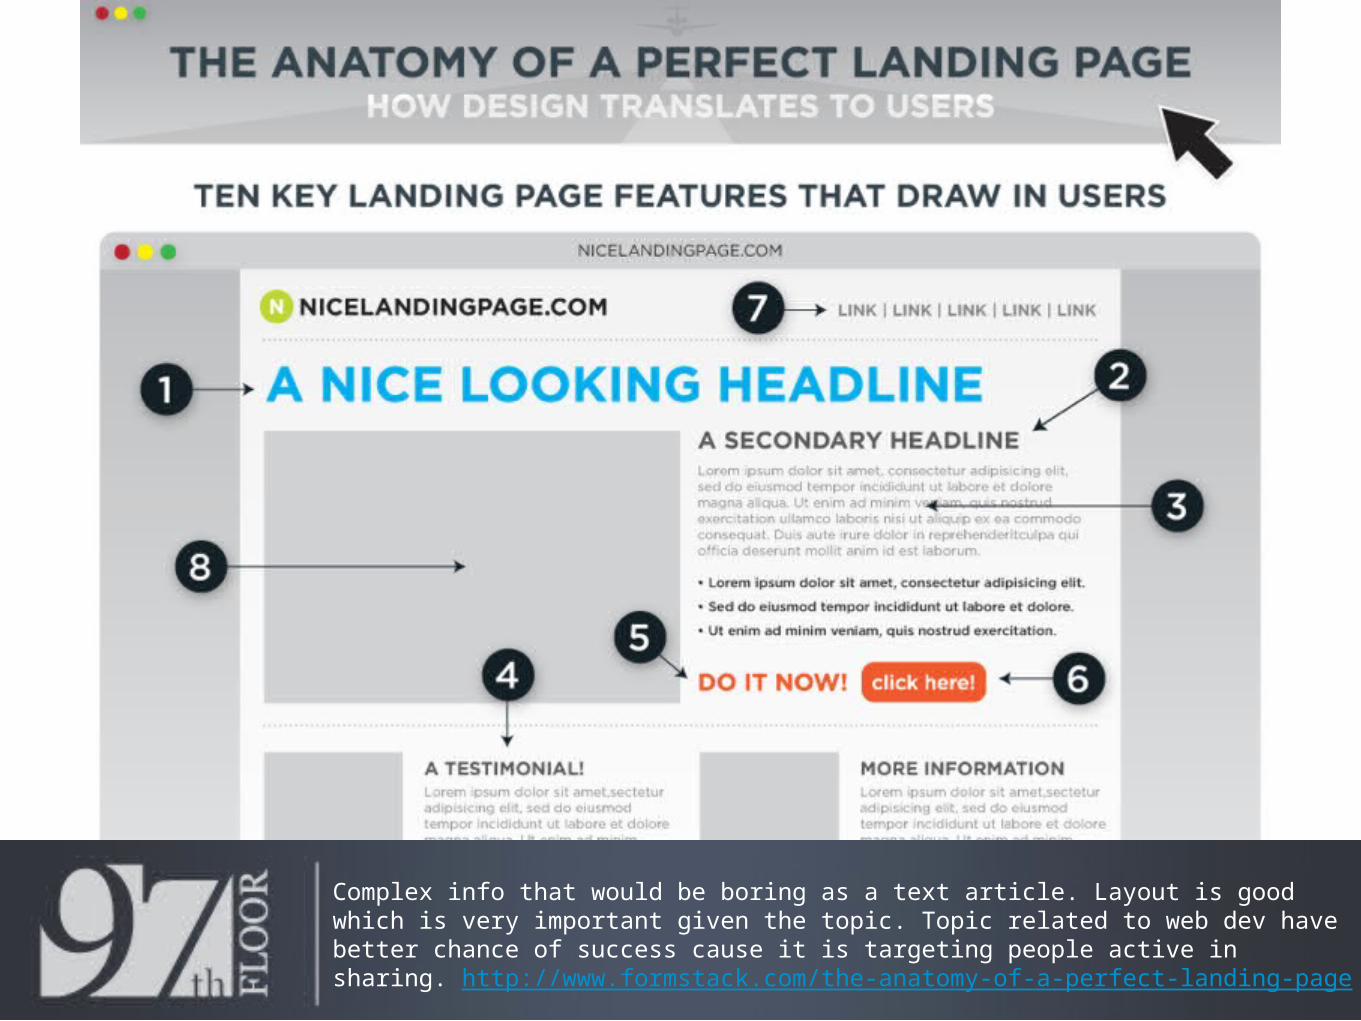
Complex info that would be boring as a text article. Layout is good which is very important given the topic. Topic related to web dev have better chance of success cause it is targeting people active in sharing. http://www.formstack.com/the-anatomy-of-a-perfect-landing-page
Looking Ahead
Infographics still work, but you should be thinking about other cool ways to visualize data.
API’sTicker
s
Interactive Visualizations
Live Stats
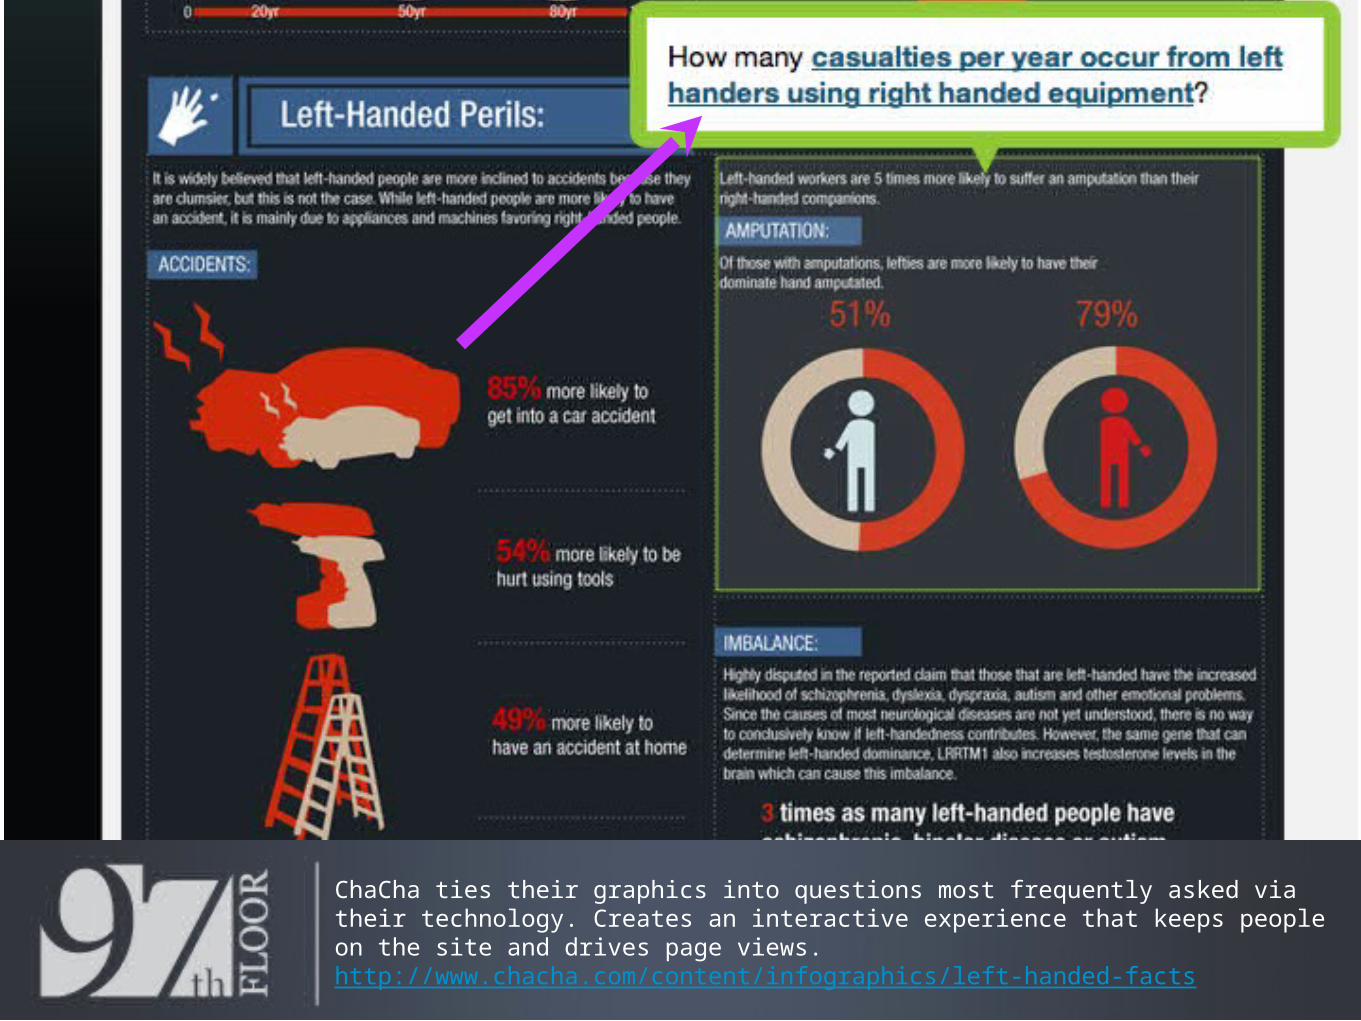
ChaCha ties their graphics into questions most frequently asked via their technology. Creates an interactive experience that keeps people on the site and drives page views. http://www.chacha.com/content/infographics/left-handed-facts
Super Simple! The idea isn’t whats genius the visualization and function is. http://www.nytimes.com/interactive/2011/10/23/sunday-review/an-overview-of-the-euro-crisis.html
Click the boxes on the left and it changes. http://www.nytimes.com/interactive/2011/10/23/sunday-review/an-overview-of-the-euro-crisis.html
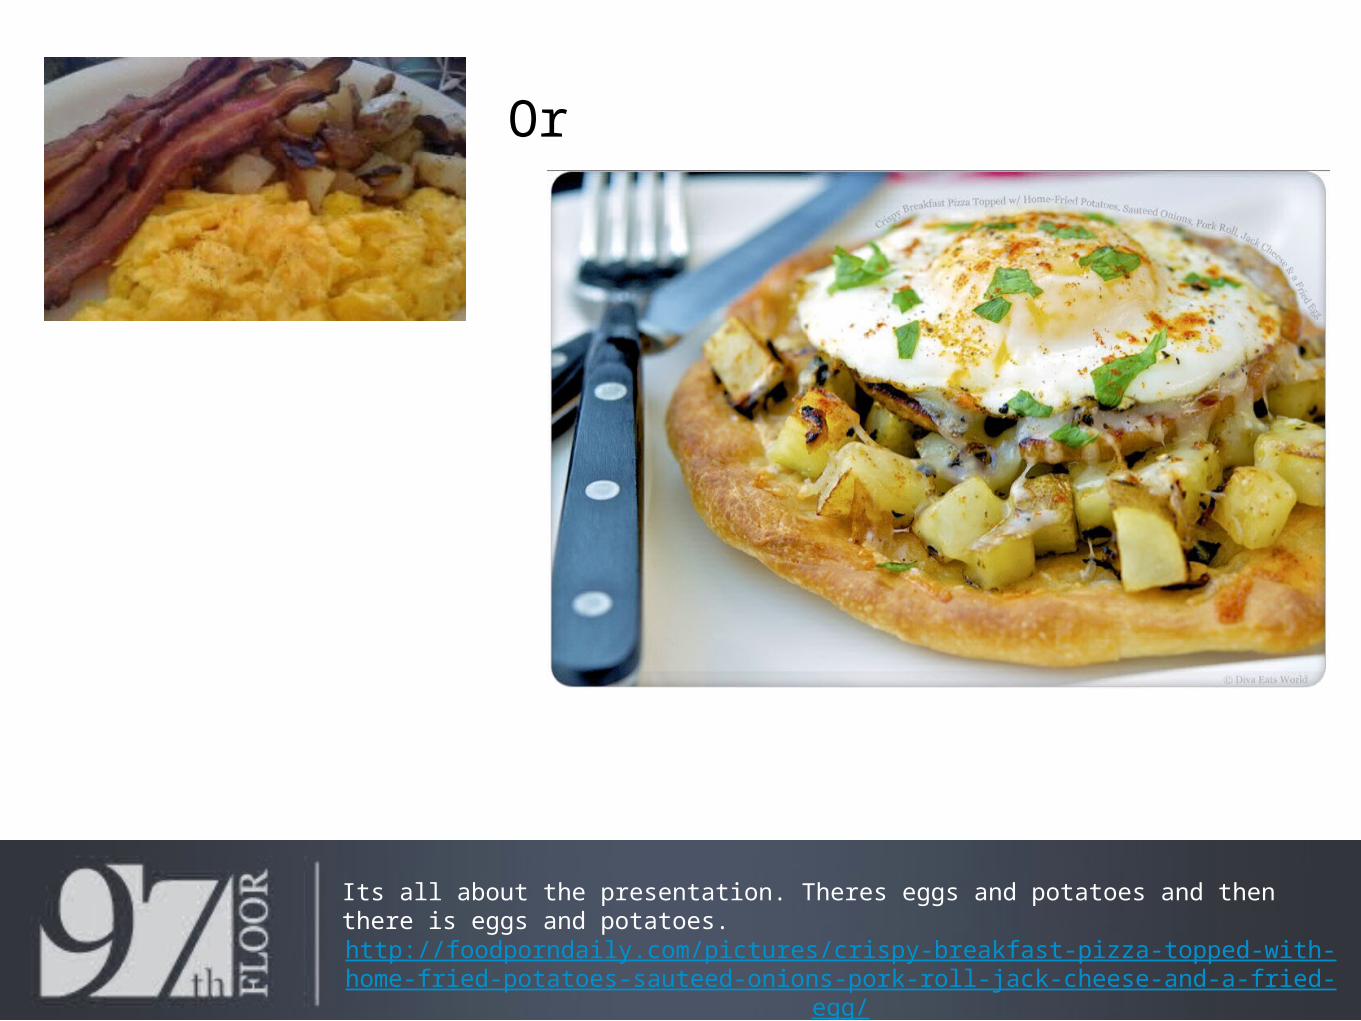
Its all about the presentation. Theres eggs and potatoes and then there is eggs and potatoes.
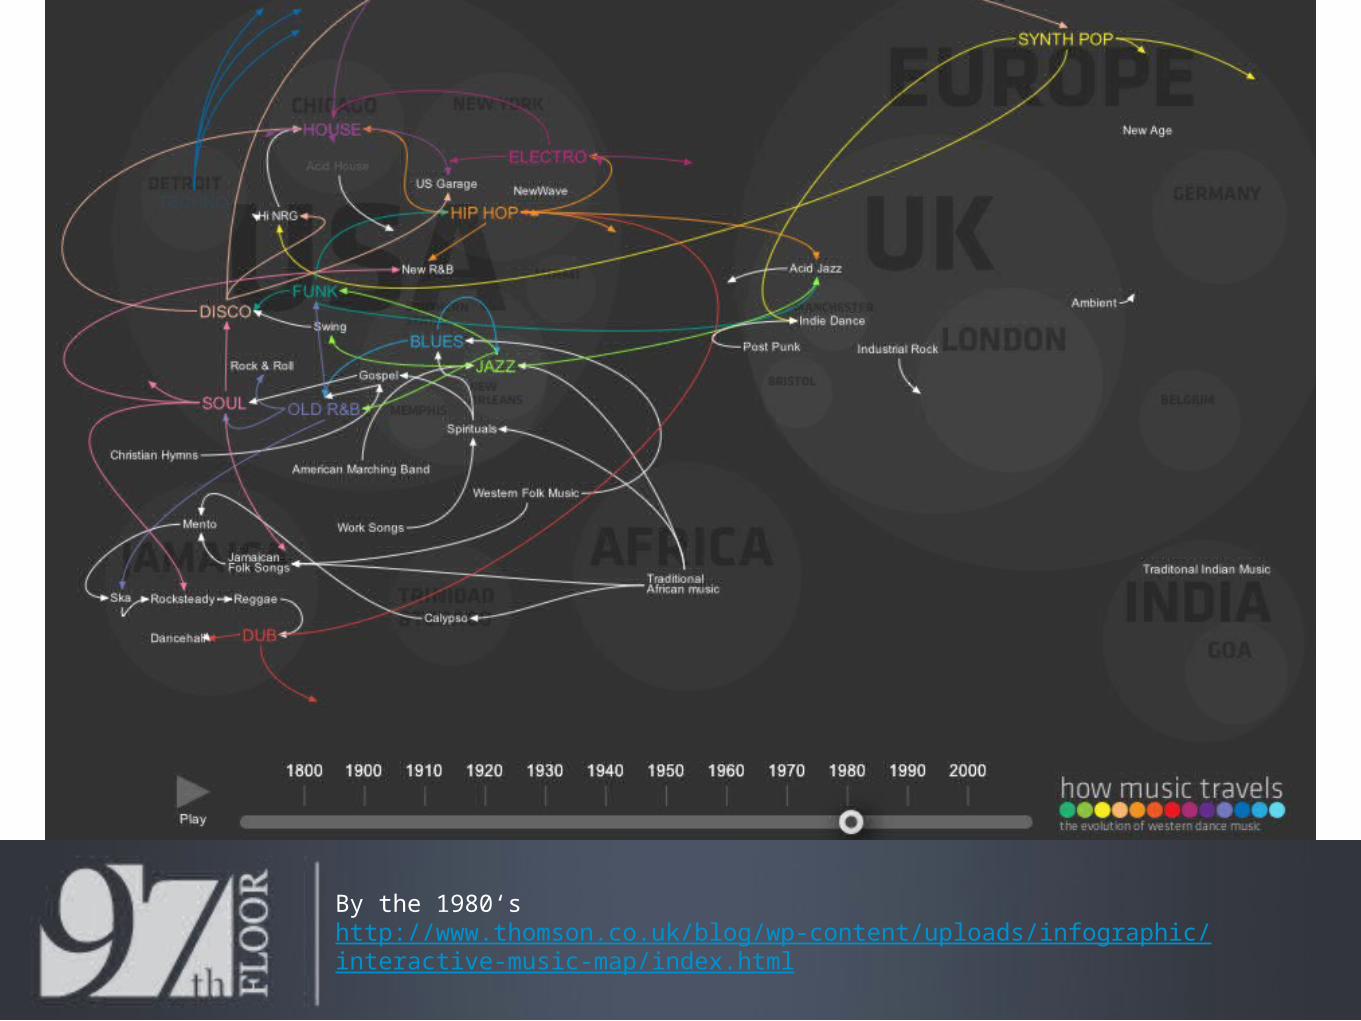
Love this idea. See how far Western Dance Music had spread by the 1960‘s http://www.thomson.co.uk/blog/wp-content/uploads/infographic/interactive-music-map/index.html
By the 1980‘s http://www.thomson.co.uk/blog/wp-content/uploads/infographic/interactive-music-map/index.html
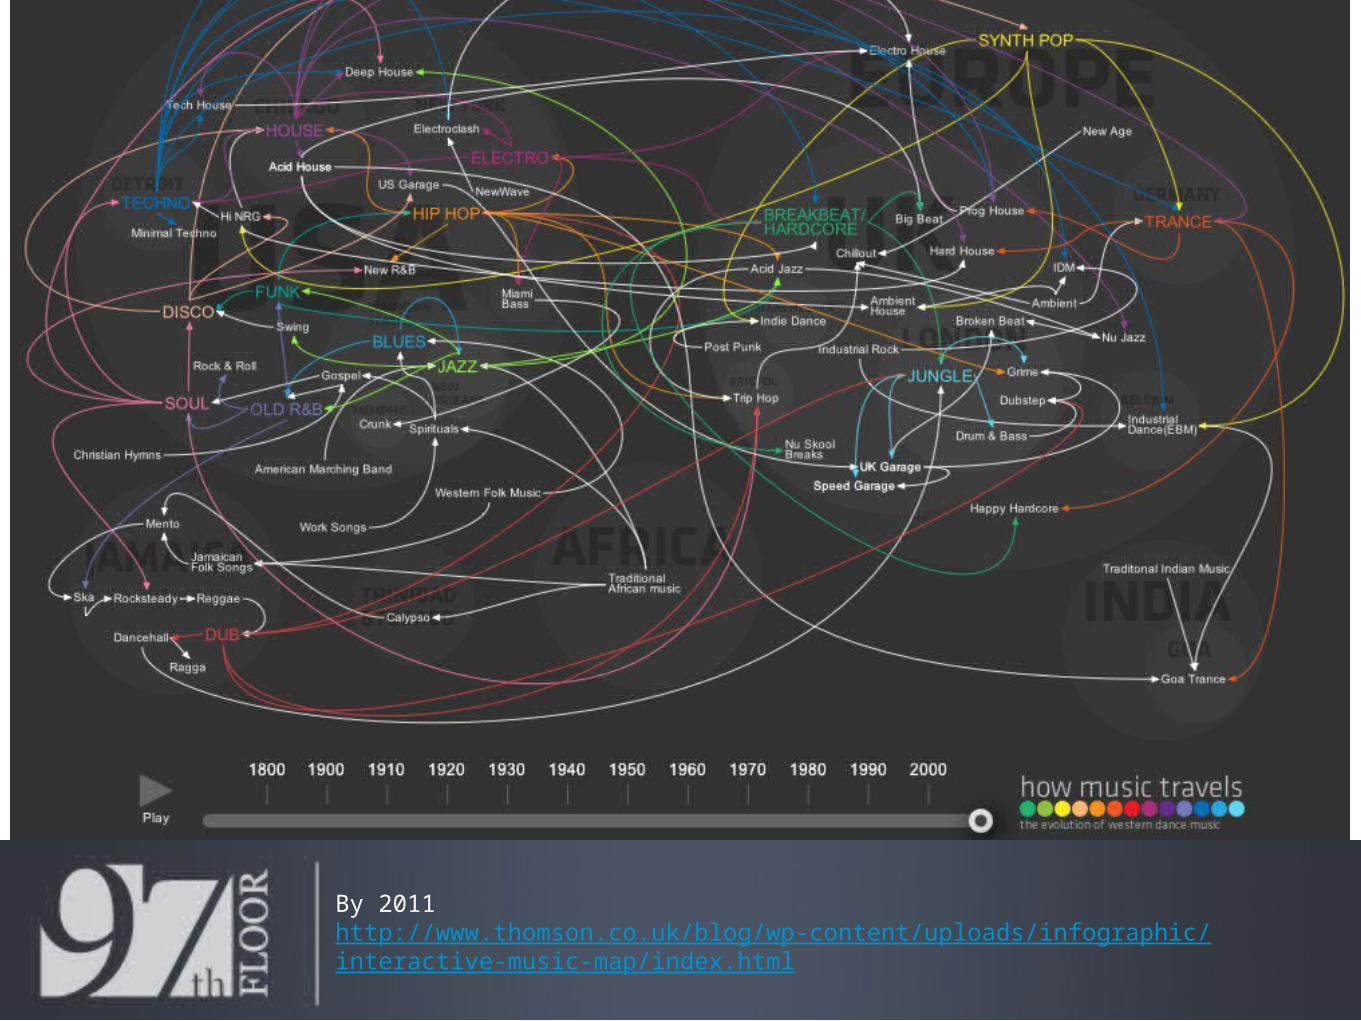
By 2011 http://www.thomson.co.uk/blog/wp-content/uploads/infographic/interactive-music-map/index.html
You’d better believe the 2012 version of this is going to be interactive. http://www.cmo.com/social-media/2011-cmos-guide-social-andscape
Yes you need to target social sites, no I am not going to talk about them. It has been talked about a million times, do a search you will find plenty.
But...
Use paid StumbleUpon Ads to reignite or launch if you don’t have a good account. Also network with those in your industry that have huge FaceBook Pages and Twitter accounts.
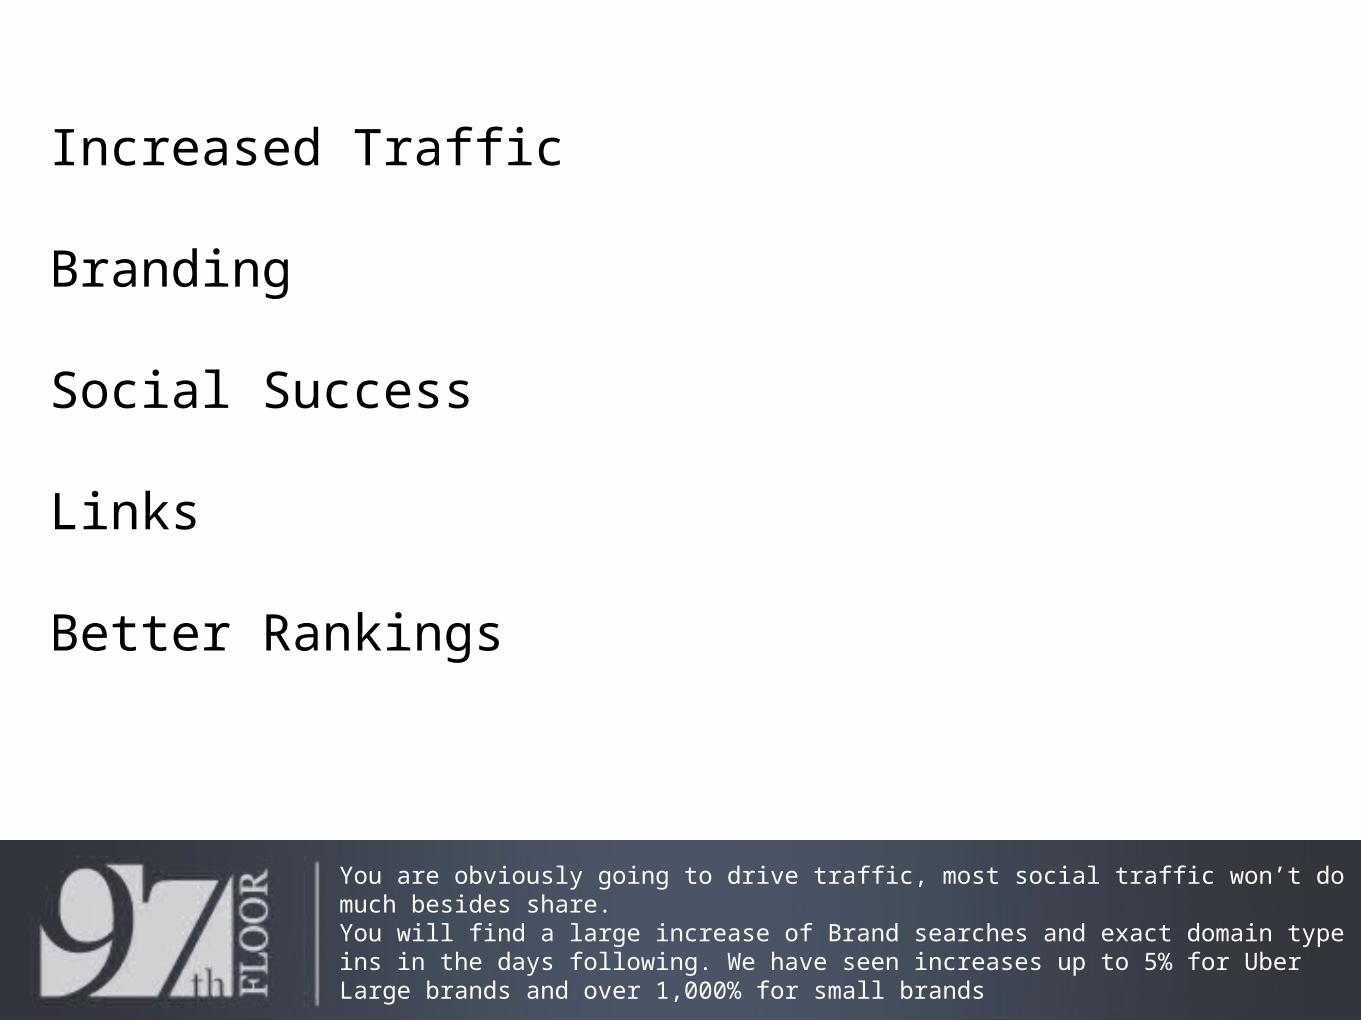
Increased Traffic
Branding
Social Success
Links
Better Rankings
You are obviously going to drive traffic, most social traffic won’t do much besides share.You will find a large increase of Brand searches and exact domain type ins in the days following. We have seen increases up to 5% for Uber Large brands and over 1,000% for small brands
That is a lot of Links!
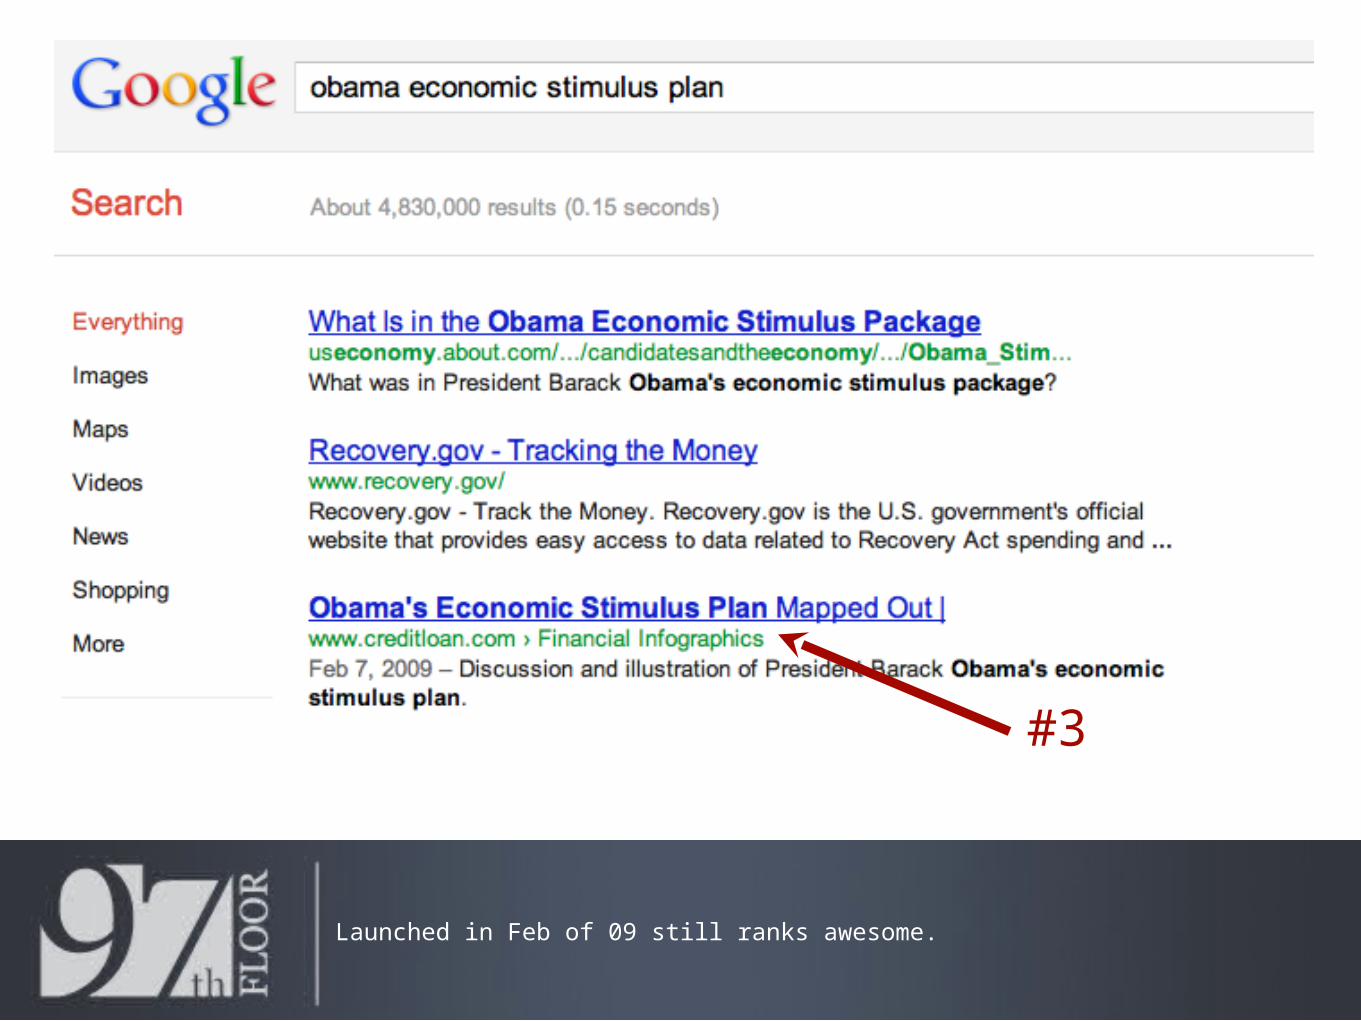
#3
Launched in Feb of 09 still ranks awesome.
I would much rather learn the ins and outs of something as complicated as the Stimulus plan via graphic rather than a 1,079 page document. http://www.creditloan.com/infographics/obamas-economic-stimulus-plan-mapped-out/
Most Important Promo SlideYou’ll Ever See
Contact your sources used to support your data, they should all be linking to, tweeting or sharing your graphic.
So Simple! But no one does it. You are often using awesome sources for your graphic as to enhance its credibility. Why aren’t you talking with them and asking them to publish, share, tweet or like your graphic?
How to obtain any link you wish
If only you could get a link from that one site...all your problems would go away. So why not take their data, research or study and create a killer visualization and give it to them for free. Obviously they would need to link to you as the creator :)