281
| Date post: | 18-Aug-2015 |
| Category: |
Health & Medicine |
| Upload: | scu-hospital |
| View: | 10 times |
| Download: | 0 times |

Evidence-Based Emergency CareDiagnostic Testing and Clinical Decision Rules
9781405154000_1_pre.qxd 19/03/2008 10:42 Page i
Evidence-Based Emergency Care: Diagnostic Testing and Clinical Decision Rules. J.M. Pines andW.W. Everett. 2008 Jesse M. Pines and Worth W. Everett, ISBN: 978-1-4051-5400-0.

To our wives, Lori and Linda, for their support, and to all the emergencydoctors and nurses who work tirelessly and selflessly to provide the bestpatient care.
J.M.P. and W.W.E.
9781405154000_1_pre.qxd 19/03/2008 10:42 Page ii

Evidence-BasedEmergency CareDiagnostic Testing andClinical Decision Rules
Jesse M. Pines, MD, MBA, MSCEAssistant Professor, Department of Emergency Medicine
Senior Scholar, Center for Clinical Epidemiology and Biostatistics
University of Pennsylvania School of Medicine
Philadelphia, USA
Worth W. Everett, MDAssistant Professor, Department of Emergency Medicine
University of Pennsylvania School of Medicine
Philadelphia, USA
9781405154000_1_pre.qxd 19/03/2008 10:42 Page iii

This edition first published 2008, © by Jesse M. Pines and Worth W. Everett
BMJ Books is an imprint of BMJ Publishing Group Limited, used under licence by Blackwell Publishingwhich was acquired by John Wiley & Sons in February 2007. Blackwell’s publishing programme has beenmerged with Wiley’s global Scientific, Technical and Medical business to form Wiley-Blackwell.
Registered office: John Wiley & Sons Ltd, The Atrium, Southern Gate, Chichester, West Sussex, PO198SQ, UK
Editorial offices: 9600 Garsington Road, Oxford, OX4 2DQ, UKThe Atrium, Southern Gate, Chichester, West Sussex, PO19 8SQ, UK111 River Street, Hoboken, NJ 07030-5774, USA
For details of our global editorial offices, for customer services and for information about how to applyfor permission to reuse the copyright material in this book please see our website atwww.wiley.com/wiley-blackwell
The right of the author to be identified as the author of this work has been asserted in accordance withthe Copyright, Designs and Patents Act 1988.
All rights reserved. No part of this publication may be reproduced, stored in a retrieval system, ortransmitted, in any form or by any means, electronic, mechanical, photocopying, recording orotherwise, except as permitted by the UK Copyright, Designs and Patents Act 1988, without the priorpermission of the publisher.
Wiley also publishes its books in a variety of electronic formats. Some content that appears in print maynot be available in electronic books.
Designations used by companies to distinguish their products are often claimed as trademarks. All brandnames and product names used in this book are trade names, service marks, trademarks or registeredtrademarks of their respective owners. The publisher is not associated with any product or vendormentioned in this book. This publication is designed to provide accurate and authoritative informationin regard to the subject matter covered. It is sold on the understanding that the publisher is not engagedin rendering professional services. If professional advice or other expert assistance is required, theservices of a competent professional should be sought.
The contents of this work are intended to further general scientific research, understanding, anddiscussion only and are not intended and should not be relied upon as recommending or promoting a specific method, diagnosis, or treatment by physicians for any particular patient. The publisher and the author make no representations or warranties with respect to the accuracy or completeness of thecontents of this work and specifically disclaim all warranties, including without limitation any impliedwarranties of fitness for a particular purpose. In view of ongoing research, equipment modifications,changes in governmental regulations, and the constant flow of information relating to the use ofmedicines, equipment, and devices, the reader is urged to review and evaluate the information providedin the package insert or instructions for each medicine, equipment, or device for, among other things,any changes in the instructions or indication of usage and for added warnings and precautions. Readersshould consult with a specialist where appropriate. The fact that an organization or Website is referredto in this work as a citation and/or a potential source of further information does not mean that theauthor or the publisher endorses the information the organization or Website may provide orrecommendations it may make. Further, readers should be aware that Internet Websites listed in this work may have changed or disappeared between when this work was written and when it is read. No warranty may be created or extended by any promotional statements for this work. Neither thepublisher nor the author shall be liable for any damages arising herefrom.
Library of Congress Cataloguing-in-Publication Data
Pines, Jesse M.Evidence-based emergency care : diagnostic testing and clinical decision rules / Jesse M. Pines, Worth
W. Everett.p. ; cm.
Includes bibliographical references.ISBN 978-1-4051-5400-0
1. Emergency medicine—Diagnosis. 2. Emergency medicine—Decision making. 3. Evidence-basedmedicine. I. Everett, Worth W. II. Title.[DNLM: 1. Emergency Medicine—methods. 2. Diagnostic Techniques and Procedures. WB 105 P6492008]
RC86.7.P56 2008616.02′5—dc22
2007043480
ISBN: 978-1-4051-5400-0
A catalogue record for this book is available from the British Library.
Set in 9.5/12pt Minion by Graphicraft Limited, Hong KongPrinted in Singapore by Utopia Press Pte Ltd.
1 2008
9781405154000_1_pre.qxd 19/03/2008 10:42 Page iv
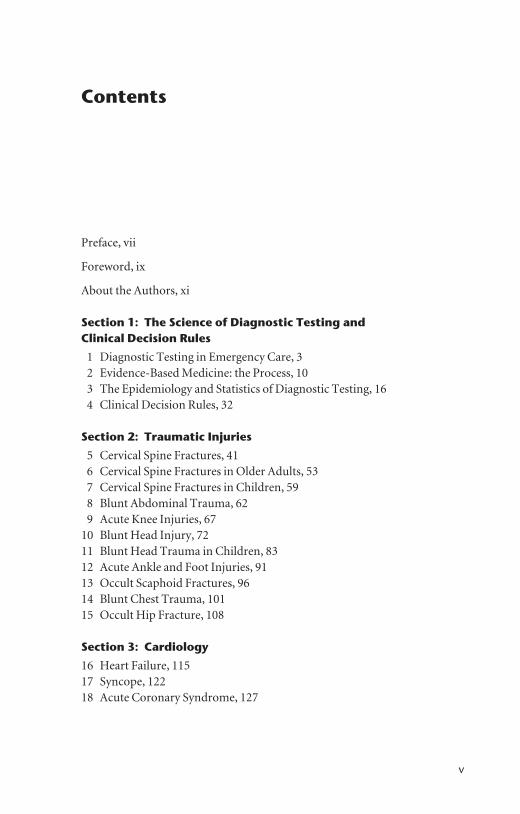
Contents
Preface, vii
Foreword, ix
About the Authors, xi
Section 1: The Science of Diagnostic Testing and Clinical Decision Rules
1 Diagnostic Testing in Emergency Care, 32 Evidence-Based Medicine: the Process, 103 The Epidemiology and Statistics of Diagnostic Testing, 164 Clinical Decision Rules, 32
Section 2: Traumatic Injuries
5 Cervical Spine Fractures, 416 Cervical Spine Fractures in Older Adults, 537 Cervical Spine Fractures in Children, 598 Blunt Abdominal Trauma, 629 Acute Knee Injuries, 67
10 Blunt Head Injury, 7211 Blunt Head Trauma in Children, 8312 Acute Ankle and Foot Injuries, 9113 Occult Scaphoid Fractures, 9614 Blunt Chest Trauma, 10115 Occult Hip Fracture, 108
Section 3: Cardiology
16 Heart Failure, 11517 Syncope, 12218 Acute Coronary Syndrome, 127
v
9781405154000_1_pre.qxd 19/03/2008 10:42 Page v

vi Contents
Section 4: Infectious Disease
19 Serious Bacterial Infections and Occult Bacteremia in Children, 14320 Bacterial Meningitis in Children, 14921 Necrotizing Fasciitis, 15222 Pharyngitis, 15623 Infective Endocarditis, 16024 Urinary Tract Infection, 16725 Sinusitis, 17126 Pneumonia, 17627 Spontaneous Bacterial Peritonitis, 181
Section 5: Surgical and Abdominal Complaints
28 Acute Nonspecific, Nontraumatic Abdominal Pain, 18929 Bowel Obstruction, 19430 Acute Pancreatitis, 19831 Acute Appendicitis, 20132 Acute Cholecystitis, 208
Section 6: Urology
33 Kidney Stones, 21534 Testicular Torsion, 220
Section 7: Neurology
35 Subarachnoid Hemorrhage, 22936 Acute Stroke, 234
Section 8: Miscellaneous: Ophthalmology, Hematology,Rheumatology, and Pulmonology
37 Pulmonary Embolism and Deep Vein Thrombosis, 24338 Temporal Arteritis, 25439 Intraocular Pressure, 25940 Asthma, 266
Index, 277
9781405154000_1_pre.qxd 19/03/2008 10:42 Page vi

Preface
One of the vital functions of emergency medicine is to differentiate betweenthose who need emergent treatment from those who don’t. Primary methodsof differentiation across test-treatment thresholds include a detailed historyand physical examination, and clinical judgment. The skills of taking a history, doing a physical examination, and clinical judgment are developedthrough medical school, residency, and the experience of evaluating andtreating patients. Another primary method to differentiate patients who needemergent treatment is the use of diagnostic testing. The technology of testingin emergency medicine has blossomed in the past 50 years and continues tochange rapidly with a greater availability of advanced radiography (CT, ultra-sound, and MRI) and novel laboratory tests. There has also been a prolifera-tion of research studies designed to guide test ordering and application of test results to individual patients. However, not all patients in the emergencydepartment necessarily need tests. Many disease processes can be excludedreliably by clinical criteria alone. Probably the best example of this is anklesprains, where only a small proportion of patients will have radiographs thatdemonstrate clinically significant fractures. Clinical decision rules for diag-nostic testing can serve as guides in deciding which patients may not benefitfrom testing in the emergency department. Because the art and science ofdiagnostic testing is so central to emergency medicine practice, emergencyphysicians must be experts in this area.
The purpose of this book is to present relevant questions on diagnostictesting that arise in everyday emergency medicine practice and to commenton the best available evidence. The first part of the book serves as an overviewof the science of diagnostic testing and reviews the process behind the devel-opment of clinical decision rules. Subsequent chapters focus on practicalquestions that have been addressed in original research studies. We provide areview of the current literature on a specific question, an interpretation of theclinical question in the context of the literature, and finally how we apply the evidence to the care of our patients. Importantly, we also provide theactual data, sample sizes, and statistics. As readers, you can come to your own
vii
9781405154000_1_pre.qxd 19/03/2008 10:43 Page vii

viii Preface
conclusions about how to interpret the best available data by understandingnot just the bottom line study conclusions but also the limitations of studydesigns. As a caveat, our comment section should not be interpreted as thestandard of care. Not all emergency departments have the same resources for testing or treatment, nor do all departments have the same availability ofspecialty consultation. Therefore, it is vital to evaluate our interpretation of the literature in the context of your local resources and practice patterns.
Jesse M. PinesWorth W. Everett
2008
9781405154000_1_pre.qxd 19/03/2008 10:43 Page viii

Foreword
Open any copy of the Wall Street Journal and read “What’s News” on thefront page. You will consistently learn about the status of new drugs, vaccines,medical devices and equipment that will impact human medicine. The head-lines often recapitulate some version of this story: “Trial Hints of Promise forNew Cancer Drug.” Diagnosis does not make headlines. It could be reason-ably asserted that both lay and medical society alike afford excessive attentionon treatment of disease, rather than its detection. After all, since when did therich family travel across two states to bring dad to the Mecca “. . . to get thebest evidence-based decision rule?” Alas, decision rules and clinical diagnosisare the linemen on our metaphorical medical team. They block and tackle,but they seldom dance in the end-zone or make the highlights.
However, the next 40 chapters illuminate the importance of clinical criteriato screen for emergency conditions. Taken as a whole, this text shows thatdecision rules do not just sort out presence or absence of disease, but helpdirect the use of resources, and ultimately vector patients toward the correctplace in the mind of the clinician. What does that mean? From a treatmentstandpoint, all that matters is what the clinician formulates a correct belief. Ifhe or she believes a patient has a disease, then treatment and its benefit willfollow. Conversely, if the clinician rejects the belief that a disease is present,the patient will be spared the risk of unnecessary treatment. Taken in its parts,each chapter presents a comprehensive, contemporaneous presentation ofthe published decision rules that matter in emergency medicine. The authorsinvoke a friendly and no-nonsense style of writing, and they employ clinicalexamples that make these criteria spring to life. The authors paint the pictureof how these criteria fit into the overall complex process of human decision-making at the bedside, and I believe this text will help emergency clinicianstake the safest, fastest, cheapest route to arrive at the correct belief about needfor treatment.
Like all humans, most ED physicians have personalities that embody dif-ferent characteristics at different times, ranging from the erudite academicianto the wise-cracking “pit doc.” This book will serve this range of need very
ix
9781405154000_1_pre.qxd 19/03/2008 10:43 Page ix
x Foreword
well. As a researcher in this field, I believe this work will serve a vital role tohelp me understand-and perhaps explain-the theoretical construct of clinicaldecision rules in modern emergency medicine. As a pit doc in the ED, I expectthis book will become my dog-eared companion that I will open and readaloud on most shifts. Allow me to suggest that the subject of each chapterappears in cadence, one after the next, in a way that resembles the chief com-plaints that pop up on your ED patient tracking system during any given shift.If for no other reason, this work will retain importance because of the brutworkload and time required to organize, discuss and reference these decisionrules and related criteria under one cover.
I am still waiting for the headline: “New Decision Rule Saves Lives andMoney,” and I will probably be waiting for a while longer. In Evidence-BasedEmergency Care: Diagnostic Testing and Clinical Decision Rules, Pines andEverett have turned up the voltage to the spotlight, and aimed at the processof screening and diagnosis in the emergency department. Keep a copy nearbyfor your next shift.
Jeffrey Kline2008
9781405154000_1_pre.qxd 19/03/2008 10:43 Page x

About the Authors
Jesse M. Pines, MD, MBA, MSCE is an AssistantProfessor of Emergency Medicine and Epidemi-ology at the University of Pennsylvania Schoolof Medicine and a board-certified emergencyphysician. He is a Senior Scholar in the Centerfor Clinical Epidemiology and Biostatistics and Associate Director of the Emergency CarePolicy Group in the Department of EmergencyMedicine. He holds a Bachelor of Arts and aMasters of Science in Clinical Epidemiologyfrom the University of Pennsylvania as well as a Medical Degree and Masters of Business
Administration from Georgetown University. He completed a residency inemergency medicine at the University of Virginia and a fellowship in researchat the Center for Clinical Epidemiology and Biostatistics at the University ofPennsylvania. He lives in Wynnewood, Pennsylvania with his wife Lori andtwo dogs.
Worth W. Everett, MD is an Assistant Professor of Emergency Medicine at the University ofPennsylvania School of Medicine and a board-certified emergency physician. He holds aBachelor of Science degree from McGill Uni-versity and received his Medical Degree fromthe University of Texas-Houston. He completed a residency in emergency medicine at the Uni-versity of California-Irvine in 2000. He nowlives in Bellingham, Washington with his wifeLinda and two children, Vail and Amelie.
xi
9781405154000_1_pre.qxd 19/03/2008 10:43 Page xi

SECTION 1
The Science of DiagnosticTesting and ClinicalDecision Rules
9781405154000_4_001.qxd 19/03/2008 10:43 Page 1
Evidence-Based Emergency Care: Diagnostic Testing and Clinical Decision Rules. J.M. Pines andW.W. Everett. 2008 Jesse M. Pines and Worth W. Everett, ISBN: 978-1-4051-5400-0.

3
Chapter 1 Diagnostic Testing inEmergency Care
As providers of emergency care, we spend a good deal of our time order-ing and waiting for the results of diagnostic tests. When it comes to deter-mining who needs a test to rule out potentially life-threatening conditionsand subsequently interpreting test results, we are the experts. We are expertsat diagnostic testing for many reasons. First and foremost, we see a lot ofpatients. The expectation, especially if you are working in a busy hospital, is that you see everyone in a timely way, provide quality care, and make sure patients are satisfied. If we order time-consuming tests on everyone then emergency department (ED) crowding will worsen, efficiency willdecline, the costs of care will go up, and patients will experience even longerwaiting times than they already do. However, differentiating which patientstruly need tests in the ED is a complex process. Over the past 30 years, scientific research into diagnostic testing and clinical decision rules in emergency care has advanced considerably. Now, there is a greater under-standing of the sensitivity, specificity, and overall accuracy of tests. Validatedclinical decision rules provide criteria whereby many patients do not needtests at all and serious, potentially life-threatening conditions such asintracranial bleeding and C-spine fractures can be ruled out based on clinicalgrounds. There are also good risk stratification tools to determine the probability of disease for conditions like pulmonary embolism before anytests are even ordered.
So how do we decide who to test and who not to test? There are some people who obviously need tests, such as the head-injured patient who hasaltered mental status and who may have a head bleed. There are also thosepatients who obviously do not need tests, such as patients with a simpletoothache. There is a large group of patients in the middle where testing
9781405154000_4_001.qxd 19/03/2008 10:43 Page 3
Evidence-Based Emergency Care: Diagnostic Testing and Clinical Decision Rules. J.M. Pines andW.W. Everett. 2008 Jesse M. Pines and Worth W. Everett, ISBN: 978-1-4051-5400-0.

4 Chapter 1: Diagnostic Testing in Emergency Care
decisions can sometimes be challenging. This group of patients is where youmay find yourself to be ‘on the fence’ with regards to testing. It may not beclear whether to order a test, or even how to interpret a test once you have theresults. And finally, when we receive the results of a test that is not what wesuspected clinically, it may be unclear how to extrapolate from the test resultsto the care of that particular individual patient.
Let’s give some examples of how diagnostic testing can be a challenge in theED. You are coming onto your shift and are signed out a patient for whomyour colleague has ordered a D-dimer test (a test for pulmonary embolism).She is 83 years old and developed acute shortness of breath, chest pain, and hypoxia (room air oxygen saturation = 89%). She has history of priorpulmonary embolism and physical examination is unremarkable except formild left anterior chest wall tenderness and notably clear lung sounds. Thetest comes back negative. Has pulmonary embolism been satisfactorily ruledout? Should you perform a pulmonary angiogram or a computed tomogra-phy (CT) scan of the chest, or maybe even consider a ventilation/perfusion(V/Q) scan? Was D-dimer the right test for her to begin with?
Let’s consider a different scenario. How about if a D-dimer was ordered ona 22-year-old male with atypical chest pain and no risk factors, and the testcomes back positive; what do you do then? Should he be anticoagulated andadmitted? Does he have a pulmonary embolism, or should you move forwardwith further confirmatory testing before initiating treatment? Or is he so lowrisk, that he’s probably fine anyway? But you could argue, if he was so low risk, why then was the test ordered in the first place?
In another example, you are evaluating a 77-year-old female who has fallendown and has acute hip pain and is unable to ambulate. The hip radiograph isnegative. Should you pursue it and possibly get a CT or magnetic resonanceimaging (MRI) scan done? But the test is negative so can’t she go home?
These are examples of when test results often do not confirm your clinicalsuspicion. What do you do in those cases? Should you believe the test result or your clinical judgment before ordering the test? Were these the optimaltests for these patients in the first place? Remember back to conversationswith your teachers in emergency medicine on diagnostic testing. Didn’t theyalways ask: “how will a test result change your management?” and “what willyou do if it’s positive, or negative?”
The purpose of diagnostic testing is to reach a state where we are ade-quately convinced of the presence or absence of a condition. Test results areinterpreted in the context of the prevalence of the suspected disease state andthe clinical suspicion of the presence or absence of disease in the individualpatient. For example, coronary artery disease is common. However, if welook for coronary disease in 25 year olds, we are not likely to find it because
9781405154000_4_001.qxd 19/03/2008 10:43 Page 4
Chapter 1: Diagnostic Testing in Emergency Care 5
it is very uncommon in that population. There are times when your clinicalsuspicion is so high that you do not need objective testing. In those patients,you can proceed with treatment. Other times you do need testing to confirmwhat you think is the diagnosis or to rule out more severe, life-threateningdiseases.
The choice over whether to test or not test in the ED also depends upon theresources of the hospital and on the patient. Some hospitals allow easy accessto radiographic testing and laboratory testing. In other hospitals, obtaining adiagnostic test may not be so easy. Some places do not allow certain types oftests at night (like MRIs and ultrasounds) because staff may be unavailable toperform them. Sometimes a patient may not necessarily need a test if youbelieve they can be trusted to return if symptoms worsen. For others, you maybelieve that a patient’s emergency presentation may be the only time that they will have access to diagnostic testing. For example, saying to a patient“follow-up with your doctor this week for a stress test” may be impractical ifthe patient does not have a primary care doctor or does not have good accessto medical care. You may practice in an environment where you cannot ordera lot of tests (like developing countries). You also may be in an office environ-ment that simply does not have easy access to testing. However, regardless of the reason why we order tests in the ED, what is certain is that the use ofdiagnostic testing in many cases can change how you manage a patient’s care.
Sometimes, you may question your choice of whether to test, to not test, orwhether to involve a specialist early. Should you get a CT scan first or just calla surgeon in for a young male with right lower quadrant pain, fever, nausea,and possible appendicitis? How many cases have you seen where the CT scanhas changed your management? What if it is a young, non-pregnant female?Does that change your plan?
How about using clinical decision rules in practice? By determining ifpatients meet specific clinical criteria we can choose not to test if they are lowrisk. Do all patients with ankle sprains need X-rays? Can you use the OttawaAnkle Rules in children? What are the limits of clinical decision rules? Is itpossible to apply the Canadian C-spine rules to a 70-year-old female? Thesequestions come up everyday in emergency medicine practice.
In fact, a major source of variability among physicians is whether or notthey order tests. Remember back to your training when you were gettingready to present a patient to the attending physician. Weren’t you trying tothink to yourself: what would she do in this case? What tests would she order?
Access to test results helps us to decide whether to treat the disease, initiateeven more testing, or no longer worry about a condition. As emergencyphysicians, we gain confidence in this process with experience. Much of the empirical science and mathematics behind the testing described in this
9781405154000_4_001.qxd 19/03/2008 10:43 Page 5

6 Chapter 1: Diagnostic Testing in Emergency Care
book becomes instinctive and intuitive the longer you practice emergencymedicine. Sometimes we may think a patient does not need to be testedbecause the last 100 patients who had similar presentations all had negativeresults. Maybe you or a colleague were ‘burned’ once when a subtle clinicalpresentation of a life-threatening condition was missed (like a subarachnoidhemorrhage). The next patient who presents with those symptoms is prob-ably more likely to get a head CT followed by a lumbar puncture. Is this evidence-based?
Step back for a moment and think about what we do when we order a test.After evaluating a patient, we come away with a differential diagnosis of boththe most common and also most life-threatening possibilities. The followingapproach to medical decision making was derived by Pauker and Kassirer in1980.1 Imagine diagnostic testing as two separate thresholds, each denoted as‘I’ (Fig. 1.1). The scale at the bottom of Fig. 1.1 denotes pre-test probability,which is the probability of the disease in question before any testing isemployed. The threshold between ‘don’t test’ and ‘test’ is known as the testingthreshold; between ‘test’ and ‘treat’ is what is known as the test-treatmentthreshold. In this schema, treatment should be withheld if the pre-test pro-bability of disease is smaller than the testing threshold and no testing shouldbe performed. Treatment should be given without testing if the pre-test probability of disease is approximately equal to the test-treatment threshold.And then, when the pre-test probability lies between the testing and test-treatment thresholds, the test should be performed and the patient treatedaccording to the test results. That is the theory; now let’s make this more clinically relevant.
Sometimes disease is clinically apparent and we do not need confirmatorytesting before proceeding with treatment. If you are evaluating a patient withan obvious cellulitis, you may choose to give antibiotics before initiating anytesting. How about the evaluation of a 50-year-old male with chest pain whohas large inferior ‘tombstone’ ST-segment elevations on his electrocardio-gram consistent with acute myocardial infarction (AMI)? Cardiac markersare not likely to be very helpful in the acute management of this patient. Thisis another example where it is important to treat the patient first: give them
Figure 1.1 Pre-test probability of disease.
Testing threshold Test-treatment threshold
Don’t test I ITest Treat
0% 50% 100%
9781405154000_4_001.qxd 19/03/2008 10:43 Page 6
Chapter 1: Diagnostic Testing in Emergency Care 7
aspirin and beta-blockers, anticoagulate them, provide oxygen, and sendthem off to the cardiac catheterization laboratory if your hospital has one, orprovide intravenous thrombolysis if cardiac catheterization is not readilyavailable. Now imagine that the patient has a history of Marfan’s syndromeand you think the patient is having an acute AMI, but you want to get a chestX-ray to make sure that they don’t have an aortic dissection before you anti-coagulate them. That might put you on the ‘test’ side of the line. If the test is positive for what may be a dissection, you won’t give aspirin and anticoagu-late; if it’s negative, you will.
The scenario of the potential use for tissue plasminogen activator (tPA) instroke patients frequently comes up in the ED. When a patient comes to theED within the first 3 hours after the onset of their stroke symptoms, you rushto get a patient to the CT scanner. Why? The primary reason is to differentiatebetween ischemic and hemorrhagic stroke, which will make a major differ-ence to whether or not the patient is even eligible to receive tPA.
Now imagine cases where you are below the testing threshold. You have a32-year-old male with what appears to be musculoskeletal chest pain. Somewould argue that the patient doesn’t need any emergency tests at all if thepatient is otherwise healthy and the physical examination is normal. Othersmight get a chest X-ray and an electrocardiogram to rule out occult things likepneumothorax and heart disease, while some others may even get a D-dimerto rule out pulmonary embolism. Which of these is the right way to managethe patient? Is there any evidence behind that decision or is it just physician’spreference? In some patients, at the end of the ED evaluation you may still nothave a definitive answer. Imagine you have a 45-year-old female with atypicalchest pain and normal electrocardiogram and cardiac marker results, andyour hospital does not perform stress testing from the ED. Does she need ahospital admission for rule out and a stress test?
The way that Pauker and Kassirer1 designed the test-treatment thresholdsalmost 30 years ago did not account for the proliferation of ‘confirmatory’diagnostic testing in hospitals. While the lower boundary of the testing thresh-old is certainly lower than it has ever been, the upper boundary has alsoincreased as there are occasions when we are loathed to treat before testing,even when the diagnosis seems apparent. The reason for this is that Occam’srazor does not often hold true in emergency medicine.
So what is Occam’s razor? In the 14th century William of Occam statedthat “plurality must not be posited without necessity,” which has been inter-preted to mean ‘among competing hypotheses, favor the simplest one.’2
When applied to test-treatment thresholds, what we find is that a patient withobjective findings for what might seem like pneumonia (that is hypoxia,infiltrate, and a history of cough) is likely to have pneumonia and should be
9781405154000_4_001.qxd 19/03/2008 10:43 Page 7
8 Chapter 1: Diagnostic Testing in Emergency Care
treated empirically as such, but may also have a pulmonary embolism. Whilefinding parsimony of diagnosis is important, often the principle of test-treatment thresholds means that if you are above the test-treatment thresholdthen you should certainly treat, but also consider carrying out more tests,particularly in patients with objective signs of disease.
Think about how trauma surgeons practice. When the multi-injuredtrauma patient is seen, isn’t their approach to test, test, test? If you are alreadyinjured and another part hurts, get a CT scan. Some order CT scans on patientswhere it doesn’t even hurt; the thinking behind this approach is not illogical.When a patient has been in a major car accident and has a broken left femurand a broken left radius and mild abdominal tenderness, do they need moreCT scans to rule out intra-abdominal injuries and intracranial injuries?Where Occam’s razor dulls is in the situation when although the most parsi-monious diagnosis (just a radius and femur fracture) is possible, patients withmultiple traumatic injuries tend to have not only the obvious ones, but alsotend to have occult injuries too. This necessitates the diagnostic search for theoccult intra-abdominal, intra-thoracic, and intra-cranial injuries in thepatient with the obviously broken arm and leg.
When deciding on care plans, we develop our own risk tolerance based onour training, clinical expertise, and experiences, and on the local standardpractice, and attitudes of the patient, family, or other physicians caring for thepatient. Risk tolerance guides where we draw our own individual testing andtest-treatment thresholds, and how much effort we put into searching for the occult. Risk tolerance refers to the post-test probability that we are com-fortable with, having excluded a disease or confirmed a disease. That is, risktolerance is where we are comfortable setting our testing and test-treatmentthresholds.
For example, let’s say we are evaluating someone for a possible acute coronary syndrome. At the end of the ED stay after an electrocardiogram,chest X-ray, and evaluation of their cardiac marker levels, you calculate thatthey have a 2% risk of being sent home and having an unexpected eventwithin 30 days. Is it OK to send them home with this level of risk? Isn’t thatthe published rate for missed AMI? What if the risk is 1%, or 0.5%, or 0.1%?
How do you make the decision about when to order a test to just treat?How do you assign a pre-test probability? How do you apply test results to anindividual patient? This is where research and the practice of evidence-basedmedicine (EBM) can influence medical practice by taking the best evidencefrom the literature about diagnostic testing or clinical decision rules andusing that information to make an informed decision about how to care for patients. Chapters 2 and 3 provide an overview of the process of EBM and examples of its application to individual patients in the ED. Chapter 4
9781405154000_4_001.qxd 19/03/2008 10:43 Page 8
Chapter 1: Diagnostic Testing in Emergency Care 9
comprises a discussion of how we derive, validate, and study the impact ofclinical decision rules in practice.
Understanding the evidence behind diagnostic testing and using clinicaldecision rules to decide not to test is at the core of emergency medicine prac-tice. Think back to your last shift in the ED; how many tests did you order?
The purpose of this book is to demystify the evidence behind diagnostictesting and clinical decision rules in emergency care by going back and carefullyevaluating the evidence behind our everyday decision making. This book iswritten to provide objective information on the evidence behind these questionsand our opinion on how we manage our patients with that clinical problemgiven the best available evidence. Now, keep in mind that we are writing thisfrom the perspective of academic emergency physicians. We work in an innercity ED with abundant (although not always quick) access to consultants, astate-of-the-art laboratory, and high-resolution imaging tests. Physicians inour practice also tend to have somewhat of a testing threshold, where patientsoften have testing done for minor symptoms. As you read this, realize that not all emergency medicine practice is the same and you should interpret theliterature yourself in the context of your own clinical practice environment.
We have designed each chapter around clinical questions that come up in everyday emergency medicine practice. For each question, we present theobjective data from published studies and then provide our ‘expert’ commenton how we use these tests in our practice. We try to provide insights into howwe interpret the literature for each testing approach. Again, our commentsshould not necessarily be interpreted as the standard of care in emergencymedicine. Standard of care is based on practice guidelines and local practicepatterns. Instead, these chapters should serve as a forum or a basis for dis-cussion for each clinical question. If you are a researcher, you can also thinkof this book as a roadmap to what is really ‘known’ or ‘not known’ with regardto diagnostic testing in emergency medicine, and what needs further study.Finally, rigorous and sound research often takes months to years to accom-plish, and sometimes longer to publish. Therefore the discussions we presentare likely to change as newer, larger, and more comprehensive studies arepublished, as new prediction or decision rules are validated and replicated,and as newer diagnostic technology is introduced.
References
1. Pauker, S.G. and Kassirer, J.P. (1980) The threshold approach to clinical decisionmaking. New England Journal of Medicine 302: 1109–1117.
2. Drachman, D.A. (2000) Occam’s razor, geriatric syndromes, and the dizzy patient.Annals of Internal Medicine 132: 403–404.
9781405154000_4_001.qxd 19/03/2008 10:43 Page 9

10
Chapter 2 Evidence-Based Medicine: the Process
The process that we use in this book has been termed evidence-based medicine (EBM). The first and most important question is “what is EBM?”EBM has been defined as “the conscientious, explicit and judicious use of current best evidence in making decisions about the care of patients”.1 Thebest way to describe EBM in the emergency department (ED) is a process by which we: (i) ask relevant clinical questions; (ii) go out and search for data; (iii) evaluate the data; and (iv) use that data in everyday clinical practiceand apply it to the way that we manage individual patients. For this book, we use the process of EBM to answer important and relevant clinical ques-tions that come up everyday while working in the ED regarding the use of diagnostic testing and clinical decision rules. Most of the questions we ask and attempt to answer in this book have to do with how to use, when to use, and how much to trust diagnostic testing and clinical decision rules,and then how to apply published knowledge to individual patients. EBM canalso be used for other applications in emergency care outside of diagnostictesting, such as determining which treatment is best for an individual patient.However, in this book we will be focusing on diagnostic testing and clinicaldecision rules.
The purpose of this chapter is to go through the steps of EBM in detail andto discuss how to use EBM in the practice of emergency care with regard todiagnostic testing. The practice of EBM is a process that follows four simplesteps, as shown in the list below.Step 1: Formulate a clear question from a patient’s problem. Does this patientneed a test? Which test do they need? For example, does a patient with atypicalchest pain who is otherwise low risk need a troponin test? You may ask
9781405154000_4_002.qxd 19/03/2008 10:44 Page 10
Evidence-Based Emergency Care: Diagnostic Testing and Clinical Decision Rules. J.M. Pines andW.W. Everett. 2008 Jesse M. Pines and Worth W. Everett, ISBN: 978-1-4051-5400-0.

Chapter 2: Evidence-Based Medicine: the Process 11
yourself, “how good is troponin I as a screening test for excluding acute coronary syndrome in ED patients?” Ask yourself, is this an answerable question?Step 2: Search the literature for clinical articles that have addressed this question. Ideally, the sample will include ED patients with a similar com-plaint or disease process (i.e. patients with chest pain who are low risk foracute coronary syndrome where troponin has been studied). You might startby doing searches on patients with chest pain in the ED then narrow yoursearch to include only articles that deal with the use of cardiac biomarkers.Step 3: Read and critically appraise the articles for validity and applicability tothe individual patient. That is, you can ask yourself “would the patient havemet the inclusion criteria for this study?” or “Is this patient similar to patientswho were included in the study?”Step 4: Use the study findings and apply them to the care of an individualpatient (i.e. does this patient need a troponin I test?) or to how you approachthe use of cardiac troponins in the ED.
EBM problems are broken down into two categories: (i) general medicalquestions (i.e. what is the sensitivity of urine leukocyte esterase in diagnosingurinary tract infections?); and (ii) specific patient-based questions (i.e. in a45-year-old female without risk factors, atypical chest pain, and nonspecificECG changes, what is the value of a negative troponin?). In general, through-out this book we ask the former type of general medical questions, but we dogive examples of the latter in the first three chapters. We recommend that youuse our interpretation of the literature as a starting point, from which you canfollow the same process to answer specific questions and hence apply yourown interpretation of the literature to guide diagnostic plans.
The acronym ‘PICO’ has been used to define the four elements of ananswerable question regarding a diagnostic test.2 When referring to studieson diagnostic testing, PICO consists of the: (i) patient/population; (ii) invest-igation; (iii) comparison, i.e. what is the gold standard; and (iv) outcome ofinterest. In our prior example, P = women in their 40s without cardiac riskfactors, I = troponin I measurement, C = cardiac catheterization or possiblecoronary angiogram, and O = identification of an intervenable coronary arterylesion or the presence of coronary artery disease (for risk stratification).
Once you have come up with a clinical question that is answerable then the search begins. For those of you who have access to online databases (suchas MEDLINE), it is probably best to start there because you can enter specificsearch criteria and narrow your search as appropriate. Websites such as www.pubmed.com allow access to abstracts and some full text articles; sometimeshospitals and universities will allow a greater level of access to full-text articlesthrough institutional memberships.
9781405154000_4_002.qxd 19/03/2008 10:44 Page 11

12 Chapter 2: Evidence-Based Medicine: the Process
OK, you’re logged on; what now? What you can do is either search by usinga specific set of search criteria like ‘troponin’ and ‘chest pain,’ or you can use amore rigorous approach such as a using the Medical Subject Headings(MeSH) system. MeSH is a vocabulary that is used to index articles in MEDLINE/PubMed. It is probably a more consistent way to search because different terminology is sometimes used for the same topic. Just like what theBritish call the boot, the Americans call a trunk. These differences are evenmore common in medical terminology. For example, you may want to knowabout shortness of breath, but papers on this may describe shortness of breath in other ways, such as respiratory distress, dyspnea, or breathlessness.Another way to search PubMed is by using a ‘clinical query,’ which allows theuser to search for specific clinical studies by diagnosis. Another common trickto use is to impose ‘limits’ on your search, which allows you to search for articles of a specific type, such as reviews, or to limit searches to specific ageranges, gender, publication dates, or language of publication. After findingthe best evidence you can find on a clinical topic, you then need to do yourown critical appraisal of the literature. Traditionally, assessment of the liter-ature surrounding a clinical topic is good fodder for group discussion ineither a conference or a residency journal club, but you can also go directly to the literature to answer important and relevant clinical questions yourself.
The assessment of studies involving diagnostic tests follows four criticalsteps,3 which are detailed in the list below.Step 1: Was there an independent, blind comparison with a reference stand-ard (i.e. gold standard) for diagnosis? Examples of relevant gold standards inemergency medicine include surgical evaluation or biopsy results at laparo-tomy or laparoscopy for patients with appendicitis, cardiac catheterizationresults for patients with possible acute coronary syndrome, and pulmonaryangiogram results for patients with potential pulmonary embolism. Theremay also be other ways to incompletely measure a gold standard, like the useof a negative chest CT followed by negative leg ultrasounds in patients withpulmonary embolism.Step 2: Was the diagnostic test under question evaluated in the same popula-tion of patients as the patient in question? You can stratify this question byage, gender, location (i.e. were they ED patients?), or presenting symptoms(i.e. patients with chest pain). That is, when I read that the sensitivity for D-dimer is 95% in a meta-analysis, is my patient similar to the ones that wereincluded in those studies?Step 3: Did all patients have the reference standard test or follow-up, wherebyyou can be convinced that the test was either positive or negative? An exampleof this is if we only perform the gold standard test on patients with positivetest results then this may skew the results of our assessment of sensitivity. For
9781405154000_4_002.qxd 19/03/2008 10:44 Page 12

Chapter 2: Evidence-Based Medicine: the Process 13
example, if we only do temporal artery biopsies on patients with positive erythrocyte sedimentation rates (ESRs) you may miss some patients who hada negative ESR and would have had a positive biopsy. This is called ‘verifica-tion bias.’Step 4: Has the test been validated in another independent group of patients?This is particularly concerning when the test is derived and validated in aspecific population. For example, if a diagnostic test works well in Canada,does that mean it will have the same test characteristics in Boston?
Assessing studies on clinical decision rules is related but a little differentand also involves four steps, which are detailed in the following list4.Step 1: Were the patients chosen in an unbiased fashion and do the studypatients represent a wide spectrum of severity of disease? For example, did theenrollment criteria for the Canadian Head CT Rule include patients withminor bumps with a loss of consciousness through to major head injuries?Step 2: Was there a blinded assessment of the gold standard for all patients?That is, did all patients who were enrolled in the study have CT scans?Step 3: Was there an explicit and accurate interpretation of the predictor variables and the actual rule without knowledge of the outcome? Were thestudy forms filled out before the physicians had knowledge of the CT results?Was there an assessment of inter-rater reliability?Step 4: Was follow-up obtained for 100% of patients who were enrolled? Forpatients who were discharged, did they follow them up to make sure that theydid not have pain, any positive head CT scans, or poor outcome in a specifictime period?
If you read a study or series of studies about a test or a clinical decision rulethat does not meet the criteria detailed in either of the two lists shown above,you should be appropriately skeptical. However, in actual practice and as wefound in writing this book, for many topics it is difficult to find literature thatfulfills all of these specifications. In that case what we need to do is to interpretthe literature whilst being aware of its weaknesses, and to do our best to applythe results to how we practice medicine. Certainly, for some tests, there maybe a huge literature from which we can make strong recommendations (suchas for D-dimer or the Ottawa Ankle Rules). For others, like using an ESR torule out temporal arteritis, there may be no literature that meets all theserequirements.
The next step is to use these findings and apply them to individual patientsand thus integrate your understanding of the literature into clinical practice.Chapter 3 describes in detail the terms sensitivity, specificity, likelihood ratios,and Bayesian analysis, and discusses the mathematics behind the practicalapplication of what we learn from studies to individual patients. By deter-mination of a specific pre-test probability (or prevalence) of the disease in a
9781405154000_4_002.qxd 19/03/2008 10:44 Page 13

14 Chapter 2: Evidence-Based Medicine: the Process
particular patient, this can then help us to not only calculate a post-test probability but also to decide whether we need to perform the test at all.
The purpose of the process of diagnostic testing is not necessarily to reach100% certainty; instead we are trying to reduce the level of uncertainty toallow us to optimize medical decision making. In order to move between testand test-treatment thresholds then we need to remember back to Chapter 1and only order tests that ultimately change patient management and move usover a specific threshold.
There are potential pitfalls in the application of EBM to diagnostic testingand clinical decision rules. The first potential pitfall is in trying to describe the ‘P’ component (patient/population) without being too exclusive. Let’ssay we are trying to determine what the sensitivity of the troponin I test is fora 45-year-old woman with atypical chest pain and a non-diagnostic ECG.There is not likely to be any one specific study that describes troponin sensit-ivity in 45-year-old women with that exact description. On the other hand, ifwe are too vague in how we choose the ‘P’ component it can become similarlyfrustrating. For example, let’s say we wanted to determine the test sensitivityfor this patient using a study that includes patients of different ages with allsorts of complaints.
The ‘I’ component (investigation) is generally fairly straightforward, butfor diagnostic testing clinicians need to be aware that there is sometimes poorstandardization. We need to be aware of which test our laboratory uses. Doesyour hospital use the D-dimer enzyme-linked immunosorbant assay (ELISA)or immunoassay? The reason that this is important is because the sensitivitiesfor the two tests are actually different. Therefore, the results for a publishedassay will not necessary be identical to those obtained from the assay used inyour hospital; you should keep this in mind.
The ‘C’ component is the comparison. A comparison is typically a goldstandard test for whatever you might be interested in studying. The gold standard is the most definitive test there is. For example, for appendicitis the gold standard would be a histologic diagnosis of inflammation of theappendix. In some studies, gold standard tests may not be ordered on allpatients because often gold standard tests may have a high risk of complica-tions (like pulmonary angiogram for pulmonary embolism). Another waythat is not as good that researchers use for patients who have not had the goldstandard is either a series of tests or some form of follow-up evaluation, such as a 14-day follow-up phone call for patients with potential C-spine fractures; if they are not having pain at 14-days, it is likely that they did nothave a fracture.
The ‘O’ component is the outcome. Outcomes should be objective andclear. For example, was the patient alive at 30 days? Survival is an outcome
9781405154000_4_002.qxd 19/03/2008 10:44 Page 14
Chapter 2: Evidence-Based Medicine: the Process 15
that is difficult to dispute. Some outcomes are not ideal in the emergencymedicine literature, such as whether a patient was admitted or not. Becausesome admission decisions can be subjective, you should be skeptical of studiesthat use subjective outcomes where there is the possibility of inter-rater variability in the key outcome.
Once a question has been framed using PICO, literature searching is alsostraightforward. Care should be given to use limit searches appropriately. Forexample, age limits should be set if you are studying children. However, whenyou are studying older adults, limiting it to an upper bound can sometimesresult in the exclusion of important studies.
In conclusion, understanding the process of EBM can allow you to movefrom the general medical questions that we have attempted to answer in thisbook to the application of these principles to patient care in the ED. Under-standing the pitfalls is important, as is sitting down and practicing clinicalscenarios to see if you can make this process work for you.
References
1. Sackett, D.L., Rosenberg, W.M., Gray, J.A., Haynes, R.B. and Richardson, W.S.(1996) Evidence based medicine: what it is and what it isn’t. British Medical Journal312: 71–72.
2. Sackett, D.L., Richardson, W.S., Rosenberg, W. and Haynes, R.B. (1998) Evidence-Based Medicine: How to Practice and Teach EBM. Churchill Livingstone, Oxford.
3. Jaeschke, R., Guyatt, G.H. and Sackett, D.L. (1994) How to use an article about adiagnostic test. A. Are the results of the study valid? Journal of the American MedicalAssociation 271: 389–391.
4. Richardson, W.S. and Detsky, A.S. (1995) How to use a clinical decision analysis. A.Are the results of the study valid? Journal of the American Medical Association 273:1292–1295.
9781405154000_4_002.qxd 19/03/2008 10:44 Page 15
16
Chapter 3 The Epidemiology andStatistics of Diagnostic Testing
Throughout much of this book, we will be referring to diagnostic test characteristics including sensitivity, specificity, negative predictive value,positive predictive value, and likelihood ratios. There are also references tocommon epidemiological terms such as incidence and prevalence. Termsthat denote risk are odds and probability, and the odds ratio is commonlyused in the literature to denote comparative risk among populations. Con-fidence intervals are also a frequently used but sometimes misunderstoodconcept. There is also the term ‘spectrum bias’ that is used in reference todiagnostic testing and the interpretation of studies about diagnostic testing.Another more complex statistic that we will describe because it is frequentlyused in diagnostic testing is the receiver operator curve (ROC). This chapterwill provide explanations of the terms that we use in this book and will offer examples of how they can be used in clinical practice in the emergencydepartment (ED).
The 2 ×× 2 table
Throughout this chapter and in other areas of this book we will be using thefollowing 2 × 2 table format, which you may remember (and tried to forget)from your biostatistics class in medical school:
9781405154000_4_003.qxd 19/03/2008 10:44 Page 16
Evidence-Based Emergency Care: Diagnostic Testing and Clinical Decision Rules. J.M. Pines andW.W. Everett. 2008 Jesse M. Pines and Worth W. Everett, ISBN: 978-1-4051-5400-0.

Chapter 3: Epidemiology and Statistics 17
In the top row of the table the ‘disease’ is listed and on the left-hand side of the table the ‘test’ is listed. Both ‘disease’ and ‘test’ are further broken downinto ‘+’, ‘−’ and ‘total’. For ‘disease’, a ‘+’ means that the disease is present anda ‘−’ means that the disease is absent; similarly for ‘test’ a ‘+’ denotes a positiveresult and a ‘−’ denotes a negative result.
Using information in these cells, all of the common test characteristicsincluding sensitivity, specificity, positive predictive value, negative predictivevalue, and likelihood ratios can be calculated. We can also take a pre-testprobability (i.e. the probability that a patient has a specific condition before atest is applied) of disease, apply known sensitivity and specificity, and hencecalculate a post-test probability. These 2 × 2 tables can be very helpful in theED if you know how to use them properly. A thorough understanding ofthem can allow you to apply ‘real-time’ evidence-based medicine (EBM). The way we do it is to first calculate a pre-test probability based on either avalidated risk stratification tool or on our own clinical judgment. Accuratelyassigning a pre-test probability is both an art and a science. You have to thinkabout the overall prevalence of disease—is it common or rare? Then you haveto think about how prevalent the disease might be in the individual patientunder question. Aside from certain widely studied disease like pulmonaryembolism and acute coronary syndrome (ACS), it is often difficult to knowwhether the pre-test probability that you are assigning is correct. Often, youmust make a guess, which seems rather arbitrary given the complex math-ematics and calculations that ensue from this choice.
The next step is to apply a diagnostic test with known sensitivity andspecificity. From that we can establish what the post-test probability is (i.e.the probability that a patient has a specific condition after the test results areknown). Using a post-test probability, we can then decide how to proceedwith the care of an individual patient. Now that is EBM in practice!
Sensitivity and specificity
Sensitivity refers to the ability of a test to detect a disease when it is actuallypresent. A common acronym that has been used to remember sensitivity
+
−
Total
+
Disease
− Total
Test
9781405154000_4_003.qxd 19/03/2008 10:44 Page 17
18 Chapter 3: Epidemiology and Statistics
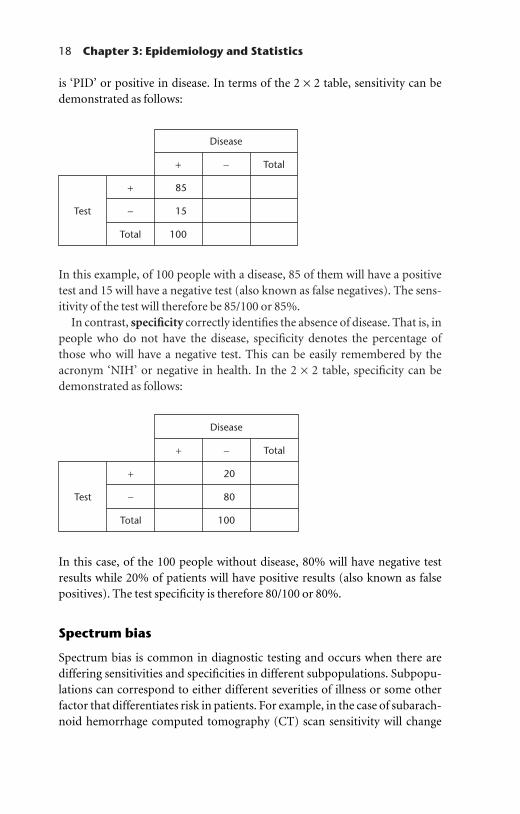
In this example, of 100 people with a disease, 85 of them will have a positivetest and 15 will have a negative test (also known as false negatives). The sens-itivity of the test will therefore be 85/100 or 85%.
In contrast, specificity correctly identifies the absence of disease. That is, inpeople who do not have the disease, specificity denotes the percentage ofthose who will have a negative test. This can be easily remembered by theacronym ‘NIH’ or negative in health. In the 2 × 2 table, specificity can bedemonstrated as follows:
+
−
Total
+
85
15
100
Disease
− Total
Test
is ‘PID’ or positive in disease. In terms of the 2 × 2 table, sensitivity can bedemonstrated as follows:
+
−
Total
+
Disease
−
20
80
100
Total
Test
In this case, of the 100 people without disease, 80% will have negative testresults while 20% of patients will have positive results (also known as falsepositives). The test specificity is therefore 80/100 or 80%.
Spectrum bias
Spectrum bias is common in diagnostic testing and occurs when there are differing sensitivities and specificities in different subpopulations. Subpopu-lations can correspond to either different severities of illness or some otherfactor that differentiates risk in patients. For example, in the case of subarach-noid hemorrhage computed tomography (CT) scan sensitivity will change
9781405154000_4_003.qxd 19/03/2008 10:44 Page 18
Chapter 3: Epidemiology and Statistics 19
over time, with the greatest degree of sensitivity seen soon after the onset of a sentinel headache and the lowest level of sensitivity 12–24 h after onset.Another example of spectrum bias is where test sensitivity will be variable at different clinical likelihoods of disease. Rapid strep tests are an example of spectrum bias where in patients with sore throats higher Centor scores(denoting a higher probability of a positive group A Streptococcus infection)means that the sensitivity of the tests will be higher.
Incidence and prevalence
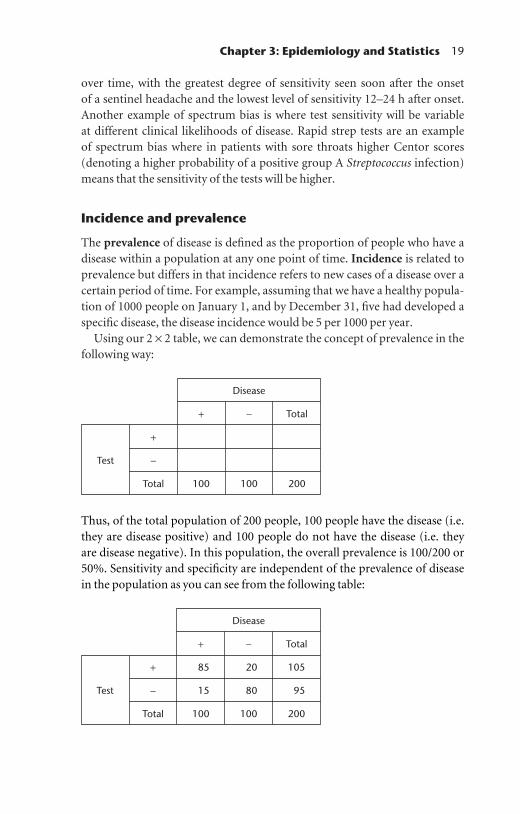
The prevalence of disease is defined as the proportion of people who have adisease within a population at any one point of time. Incidence is related toprevalence but differs in that incidence refers to new cases of a disease over acertain period of time. For example, assuming that we have a healthy popula-tion of 1000 people on January 1, and by December 31, five had developed aspecific disease, the disease incidence would be 5 per 1000 per year.
Using our 2 × 2 table, we can demonstrate the concept of prevalence in thefollowing way:
+
−
Total
+
100
Disease
−
100
Total
200
Test
Thus, of the total population of 200 people, 100 people have the disease (i.e.they are disease positive) and 100 people do not have the disease (i.e. they are disease negative). In this population, the overall prevalence is 100/200 or50%. Sensitivity and specificity are independent of the prevalence of diseasein the population as you can see from the following table:
+
−
Total
+
Disease
− Total
85
15
100
20
80
100
105
95
200
Test
9781405154000_4_003.qxd 19/03/2008 10:44 Page 19

20 Chapter 3: Epidemiology and Statistics
That is to say, sensitivity and specificity do not change when the pre-valence changes; instead, predictive values change—except for when there is spectrum bias.
Predictive values
Positive predictive value is the probability that the disease is present if thetest is positive. This can be illustrated as:
+
−
Total
+
85
Disease
−
20
Total
105
Test
In this case, of the 105 people with positive tests, 85 actually have the disease.Therefore, the positive predictive value is 85/105 or 81%.
The negative predictive value is the probability that the disease is absent ifthe test is negative, which is illustrated in the following 2 × 2 table:
+
−
Total
+
15
Disease
−
80
Total
95Test
Of the 95 people with negative tests, 80 do not have the disease. Therefore, thenegative predictive value is 80/95 or 84%.
Integrating concepts
Another way to integrate sensitivity and specificity with predictive values is byusing mnemonics. The mnemonics ‘snout’, or sensitivity (rule out), and‘spin’, or specificity (rule in), have been proposed. When you want to rulesomething out (e.g. by deciding upon a clinical decision rule or a diagnostic
9781405154000_4_003.qxd 19/03/2008 10:44 Page 20

Chapter 3: Epidemiology and Statistics 21
test for a low-risk patient), then the ideal test should have near perfect sensit-ivity. This will result in a correspondingly high negative predictive value (i.e.the disease is ruled out). Conversely, when you are trying to rule somethingin, ideal tests have near perfect specificity, which will correspond to a highpositive predictive value (i.e. the disease will be ruled in).
Using 2 ×× 2 tables: an example
In contrast to sensitivity and specificity, the positive and negative predictivevalues do change with changing disease prevalence. For the moment, let’sassume that there is no spectrum bias. As an example you go to see a patientand, based on your initial assessment, there is a high pre-test probability ofdisease. Let’s set the pre-test probability estimate at 80%. If we take the sametest characteristics that we had in the prior example, where sensitivity is 85%and specificity is 80%, what happens to the predictive values?
First, we start with the disease prevalence (80%) where, in a hypotheticalpopulation of 200 people, 160 have the disease and 40 do not.
+
−
Total
+
160
Disease
−
40
Total
200
Test
We then add in the known sensitivity (85%) and specificity (80%). The number of true positives will be 136, false positives 8, true negatives 32, andfalse negatives 24:
+
−
Total
+
Disease
− Total
136
24
160
8
32
40
144
56
200
Test
Now, if we have a positive test in this population, the positive predictive value would be 136/144 or 94% (which is higher than it would be if the pre-valence was 50%) and the negative predictive value would be 32/56 or 57%
9781405154000_4_003.qxd 19/03/2008 10:44 Page 21

22 Chapter 3: Epidemiology and Statistics
(which is lower than it would be if the prevalence was 50%). What tends tohappen is that as your prevalence goes up, a positive test is more likely to be atrue positive and a negative test is less likely to be a true negative.
So how does this work if the disease prevalence is low? Let’s set a prevalenceof 10%:
+
−
Total
+
20
Disease
−
180
Total
200
Test
Now, if we apply the same test characteristics where sensitivity is 85% andspecificity is 80%:
+
−
Total
+
Disease
− Total
17
3
20
36
144
180
53
147
200
Test
In this case, the positive predictive value is 17/53 or 32% (which is less than itwas when the population prevalence was 50%) and the negative predictivevalue is 144/147 or 98% (which is higher than when the population pre-valence was 50%). In this case, because the prevalence is low, a positive test is less likely to be a true positive and a negative test is more likely to be a truenegative.
As a general principle, as your disease prevalence goes up, your positivepredictive value increases. As your disease prevalence goes down, your negat-ive predictive value increases. In other words, if you are worried about apatient and you think they are high risk for the disease, then if the test is positive it has a good chance of being a true positive. Conversely, if a patient is probably OK and you have ordered an imperfect test (like an electrocar-diogram to rule out ACS in a 25 year old), which comes back normal, the likelihood that it is a true negative is very high.
Another way to think about prevalence is in terms of pre-test probability.After you see and evaluate a patient, the prevalence is equal to the pre-test
9781405154000_4_003.qxd 19/03/2008 10:44 Page 22

Chapter 3: Epidemiology and Statistics 23
probability for that individual patient. If you see 100 patients with the samepresentation, what percentage will have the disease? Put another way, you canuse the disease ‘+/−/total’ boxes using pre-test probability to determine yourpredictive values for an individual patient.
Let’s use an example of a specific patient to illustrate how we can use EBM at the bedside in emergency medicine. Imagine you are evaluating a 55-year-old female who presents with intermittent, sharp, right-sided chestpain and shortness of breath for one week. She has no traditional risk factorsfor pulmonary embolism or coronary artery disease. She has a normal phys-ical examination except for tenderness to palpation over the right side of thechest. Vitals are within normal limits except for a heart rate of 110 beats perminute that is regular.
You are considering the diagnosis of pulmonary embolism in this patientand you want to determine the risk of them having this condition. So youpose your question, you search the literature and then you evaluate a study on the Wells criteria and decide to use it. According to the Wells criteria, youassign 1.5 points for a heart rate of ≥100 beats per minute based upon yourclinical judgment. This places her in a ‘low-risk’ category. In addition, youassign her a pre-test probability of 3.6% based on the Wells criteria, whichwas the prevalence of pulmonary embolism in that category in the originalstudy. While this is not likely to be her exact pre-test probability, you do agreethat she is relatively low risk for pulmonary embolism.
Because she is low risk, you decide to order a D-dimer on her. You thinkback to the key questions: “what will I do if it’s positive?” or “what if it’s negat-ive?” Let’s go back to the 2 × 2 tables to see. You first start by entering her pre-test probability. Of every 100 patients you see that are identical to thisone, approximately 7 in 200 will have the disease:
+
−
Total
+
7
Disease
−
193
Total
200
Test
Now, let’s look up the sensitivity and specificity for D-dimer. We found a review article in MEDLINE that shows that in a meta-analysis, D-dimersensitivity was 94% and the specificity was 45%.1 Conveniently, our hospitaljust so happens to use the same D-dimer assay as that used in this meta-analysis. Let’s enter the numbers and see what we get:
9781405154000_4_003.qxd 19/03/2008 10:44 Page 23

24 Chapter 3: Epidemiology and Statistics
Well, it’s not perfect, but let’s say for simplicity that D-dimer will pick up 6/7(85%) of the patients with disease to make the numbers fit.
So our test is positive; what is the positive predictive value? We can calcu-late that this is 6/112 or 5%. This is not very good; with a positive D-dimer wehave moved our pre-test probability from 3.6% to a post-test probability of5.4%. This certainly does not push us over any treatment threshold. That is,we do not want to anticoagulate people who have a 5.4% chance of having thedisease with heparin or enoxaparin (the treatment for pulmonary embolism)because of the potential side effects of those medications. What if the test is negative? Well, then our negative predictive value is 87/88 or 98.9%. That’sa pretty good negative predictive value. So, given a negative test, we havemoved from a pre-test probability of 3.6% to a post-test probability of 1.2%.With a post-test probability of 1.2%, it may be reasonable to say that a diag-nosis has been mostly excluded. As we can see from this example, D-dimer isa good rule-out test because the sensitivity is high and the specificity is poor.Remember: ‘snout’.
Odds, probability, and the odds ratio
We will be using two related terms that denote risk in this book: odds and probability. People often use odds and probability interchangeably, butodds and probability actually mean different things. Probability makes moreintuitive sense than odds in terms of how physicians see the world, but anodds ratio is often used in statistics to represent the likelihood that whencomparing two groups, one will have the outcome in question.
Let’s start with probability because this is the easiest to understand. Theprobability is the expected number over the total number. An easy example isto use six-sided dice. The probability of rolling a six on any individual roll is1/6 or 16.7%. Using a hypothetical clinical example, the probability that a 50-year-old male who has risk factors for coronary disease, acute chest pain, andnew electrocardiographic changes is having an ACS is high (let’s say 80% asan estimate). That means, out of 100 identical patients, 80 of them will have ACS.
+
−
Total
+
Disease
− Total
6
1
7
106
87
193
112
88
200
Test
9781405154000_4_003.qxd 19/03/2008 10:44 Page 24

Chapter 3: Epidemiology and Statistics 25
Odds are related but different. Odds are the ratio of the probability ofoccurrence to non-occurrence. Using the same example, the odds that youwill roll a six is 1:5; while the odds that the 50-year-old male will have ACS is 4:1. You can convert odds to probabilities using the following formulas:
Odds = probability/(1 − probability)Probability = odds/(1 + odds)
An odds ratio is a measure of the size of the difference between odds and is commonly used in the medical literature to denote risk. It is defined as aratio of the odds of an event or outcome in one group to the odds of an eventor outcome in another group. These groups are traditionally dichotomousclassifications, like older people (≥65 years old) versus younger people (<65 years old), or men versus women. It can also be the difference between atreatment group and a control group. When the odds ratio is equal to 1, thisindicates that the event or outcome is equally likely in both groups. When it is greater than 1, the condition or outcome is more likely in the first group.Finally, when it is less than 1, it is less likely in the first group. In an odds ratio,p is the probability of the outcome in group 1 and q is the probability of theoutcome in group 2. As mentioned above, we can use the formula for odds tocalculate an odds ratio in terms of probabilities:
Odds ratio = [p/(1 − p)]/[q(1 − q)]
As a clinical example, suppose that we have a sample of 100 male and 100female ED patients with acute chest pain. This is only a theoretical example todemonstrate how to calculate an odds ratio and is not based on any studies.Of the 100 patients, 20 males and 10 females will have a serious cause for theirpain. Thus the odds of a male having a serious cause for this pain are 20 to 80or 1:4 while the odds of a female having a serious cause for her pain are 10 to90 or 1:9. Using the above formula, we can calculate the odds ratio:
Odds ratio = [(0.20)/(1 − 0.20)]/[0.10/(1 − 0.10)] = 2.25
This calculation can be interpreted to mean that men have 2.25 timeshigher odds of have a serious cause for their chest pain than women. This alsoillustrates how an odds ratio can be larger than the difference in probability.While men are twice as likely to have a serious cause for their chest pain (interms of probability), the odds ratio is higher (2.25).
Likelihood ratios
Likelihood ratios are a different way of interpreting sensitivity and specificityand provide a direct estimate of how much a test result (positive or negative)
9781405154000_4_003.qxd 19/03/2008 10:44 Page 25

26 Chapter 3: Epidemiology and Statistics
will change the odds of having a disease. The likelihood ratio for a positiveresult (LR+) tells you how much the odds of the disease increase when a test ispositive. The likelihood ratio for a negative result (LR−) tells you how muchthe odds of the disease decrease when a test is negative.
In order to use likelihood ratios, you need to specify the pre-test odds. Thepre-test odds are the likelihood that the patient would have a specific diseaseprior to any testing. Pre-test odds are related to the prevalence of disease andmay be adjusted upwards or downwards depending on the characteristics ofyour overall patient pool (i.e. is the disease likely in your community) or ofthe individual patient (i.e. is the disease likely in the individual patient). Tocalculate likelihood ratios you can use the following formulas:
LR+ = sensitivity/(1 − specificity)LR− = 1 − sensitivity/specificityOddspost = oddspre × LR+ (a positive test)Oddspost = oddspre × LR− (a negative test)
As a general rule of thumb, likelihood ratios greater than 10 or less than 0.1generate sizeable changes in post-test disease probability, while likelihoodratios of 0.5–2 have little effect. It is also possible to use likelihood ratios whenconsidering a sequence of independent tests (for example, an electrocardio-gram followed by troponin I testing for potential ACS). Likelihood ratios canalso be multiplied in series.
Using odds, probabilities and likelihood ratios: an example
The best way to describe odds, probabilities and likelihood ratios are by usinga clinical example. Using D-dimer as an example, let’s assume that the sensit-ivity is 94% and the specificity is 45%. We can calculate the LR+ to be 1.71 bythe calculation (0.94)/(1 − 0.45), and the LR− to be 0.13 from the calculation(1 − 0.94)/(0.45).
OK, so let’s go through the maths, starting with a pre-test probability of10%. The first step is to convert that to an odds: 0.10/(1 − 0.10) = 0.1111. Soour pre-test odds value is 0.1111. If we want to apply likelihood ratios, weneed to know our test results. If the test is positive, then given a LR+ of 1.71 wecan calculate the post-test odds: 1.71 × 0.1111 = 0.1899. If the test is negative,we can apply a LR− of 0.13. So given a negative test result the post-test oddsare 0.13 × 0.1111 = 0.0144. Now, we need to convert these back to probabilityvalues. An odds of 0.1899 is equal to a probability of 0.1899/(1 + 0.1899) = 16.0%. An odds of 0.0144 is equal to a probability of 0.0144/(1 + 0.0144) = 1.4%.
9781405154000_4_003.qxd 19/03/2008 10:44 Page 26
Chapter 3: Epidemiology and Statistics 27
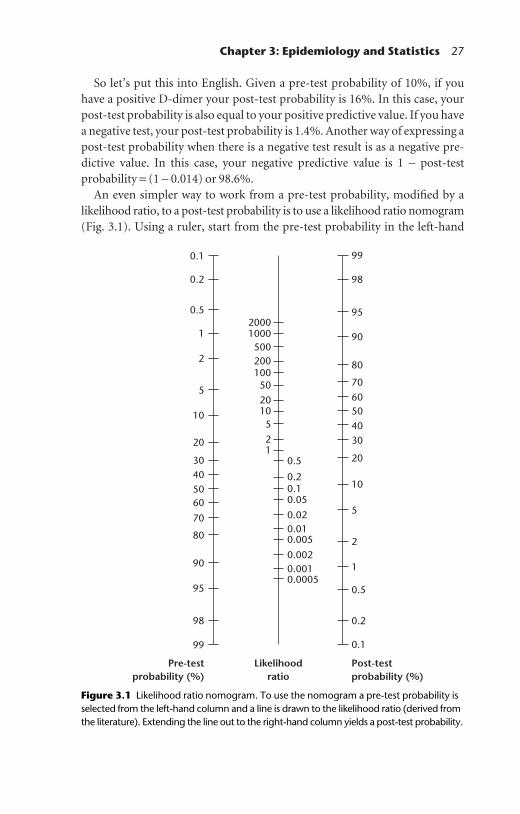
So let’s put this into English. Given a pre-test probability of 10%, if youhave a positive D-dimer your post-test probability is 16%. In this case, yourpost-test probability is also equal to your positive predictive value. If you havea negative test, your post-test probability is 1.4%. Another way of expressing apost-test probability when there is a negative test result is as a negative pre-dictive value. In this case, your negative predictive value is 1 − post-test probability = (1 − 0.014) or 98.6%.
An even simpler way to work from a pre-test probability, modified by alikelihood ratio, to a post-test probability is to use a likelihood ratio nomogram(Fig. 3.1). Using a ruler, start from the pre-test probability in the left-hand
0.1
200010005002001005020105
21
0.5
99
98
95
90
80
7060504030
20
10
5
2
1
0.5
0.2
0.1
Post-testprobability (%)
Likelihoodratio
Pre-testprobability (%)
0.20.10.05
0.020.010.005
0.0005
0.0020.001
0.2
0.5
1
2
5
10
20
30405060
70
80
90
95
98
99
Figure 3.1 Likelihood ratio nomogram. To use the nomogram a pre-test probability isselected from the left-hand column and a line is drawn to the likelihood ratio (derived fromthe literature). Extending the line out to the right-hand column yields a post-test probability.
9781405154000_4_003.qxd 19/03/2008 10:44 Page 27
28 Chapter 3: Epidemiology and Statistics
column and intersect the likelihood ratio value in the middle column. Extend-ing the straight line from those two points out to the right-hand column resultsin the new post-test probability.
Bayes’ theorem
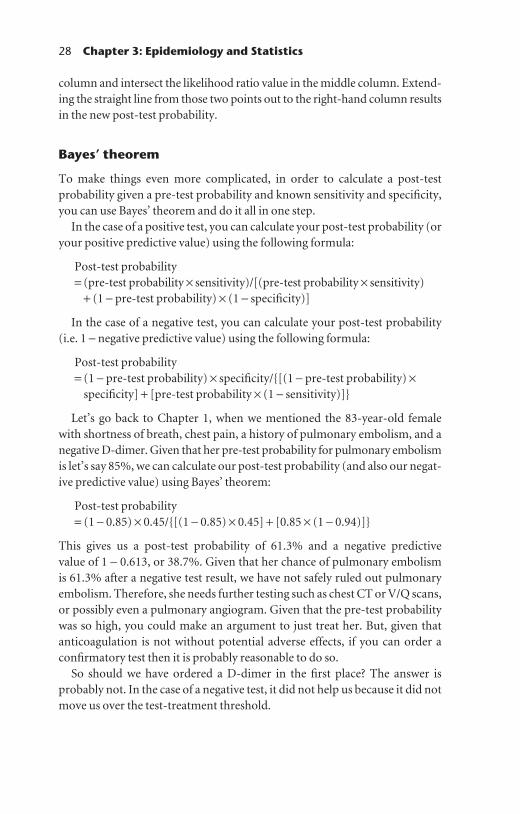
To make things even more complicated, in order to calculate a post-testprobability given a pre-test probability and known sensitivity and specificity,you can use Bayes’ theorem and do it all in one step.
In the case of a positive test, you can calculate your post-test probability (oryour positive predictive value) using the following formula:
Post-test probability = (pre-test probability × sensitivity)/[(pre-test probability × sensitivity)
+ (1 − pre-test probability) × (1 − specificity)]
In the case of a negative test, you can calculate your post-test probability(i.e. 1 − negative predictive value) using the following formula:
Post-test probability = (1 − pre-test probability) × specificity/{[(1 − pre-test probability) ×
specificity] + [pre-test probability × (1 − sensitivity)]}
Let’s go back to Chapter 1, when we mentioned the 83-year-old femalewith shortness of breath, chest pain, a history of pulmonary embolism, and anegative D-dimer. Given that her pre-test probability for pulmonary embolismis let’s say 85%, we can calculate our post-test probability (and also our negat-ive predictive value) using Bayes’ theorem:
Post-test probability = (1 − 0.85) × 0.45/{[(1 − 0.85) × 0.45] + [0.85 × (1 − 0.94)]}
This gives us a post-test probability of 61.3% and a negative predictive value of 1 − 0.613, or 38.7%. Given that her chance of pulmonary embolism is 61.3% after a negative test result, we have not safely ruled out pulmonaryembolism. Therefore, she needs further testing such as chest CT or V/Q scans,or possibly even a pulmonary angiogram. Given that the pre-test probabilitywas so high, you could make an argument to just treat her. But, given thatanticoagulation is not without potential adverse effects, if you can order aconfirmatory test then it is probably reasonable to do so.
So should we have ordered a D-dimer in the first place? The answer is probably not. In the case of a negative test, it did not help us because it did notmove us over the test-treatment threshold.
9781405154000_4_003.qxd 19/03/2008 10:44 Page 28

Chapter 3: Epidemiology and Statistics 29
Confidence intervals
Throughout this book we make reference to confidence intervals (CI). Theseare commonly used in statistics to give an estimated range of values that islikely to include an unknown population parameter (like an odds ratio or apopulation mean). As an easy example, let’s say we are trying to estimate theaverage age of everyone living in a county of 50 000 people. In order to dothis, we randomly select 100 houses and go door to door to find out what theages are of everyone living at each house. This gives us a total sample of 322people and we find that the average age is 32 years old. But how certain are wethat 32 is the real average for the population? Instead of saying that 32 is theaverage, what we can do is give CI values. So we plug our numbers into ourstatistics program and what we find is that the average is indeed 32, but the95% CI is 26–42. What we can say is that we are 95% sure that whatever thereal value is (if we sampled all 50 000), it lies between 26 and 42 years old.Intervals are usually reported with 95% confidence, but if we want to be reallysure we can report wider CI, such as 99%.
Let’s use a clinical example. Like before, we want to know what the odds arefor a male having a serious cause for chest pain compared to a female. Whatwe would do is to go out and collect sample data to answer the question bystudying males and females with chest pain and estimating the odds ratiobased on the sample data. If we were to calculate an odds ratio of 2.25 with a95% CI of 1.5–3.5, then what we can say is that we are 95% confident that thereal difference between men and women falls between 1.5 and 3.5. Since it isgreater than one, we can say that men are at higher risk of their chest painbeing due to a serious cause than women.
Confidence interval width gives an indication of how uncertain we areabout this unknown parameter. For example if we reported an odds ratio of2.25 (95% CI 2.0–2.5), we could be fairly confident in our estimate. However, if we reported an odds ratio of 2.25 (95% CI 0.25–10.0), we would be lessconfident. A wide interval indicates that nothing very definite can be saidabout that particular parameter. As a rule of thumb, a parameter estimatewith a small CI is more reliable than a result with a large CI.
Receiver operator characteristic (ROC) curves
Determination of sensitivity and specificity for a specific diagnostic testdepends on the value that we define as an abnormal test. The threshold valuethat we set for an abnormal test will determine the number of true positives,true negatives, false positives and false negatives. For example, if we say anabnormal D-dimer test is at a specific threshold, let’s say 500 ng/dL, then if we
9781405154000_4_003.qxd 19/03/2008 10:44 Page 29

30 Chapter 3: Epidemiology and Statistics
were to set the cutoff at a higher level, let’s say 2000 ng/dL, the number ofboth true positives and false negatives would increase. The purpose of ROCcurves is to find the test cutoff that maximizes both sensitivity and specificityso that tests can be used and interpreted in clinically meaningful ways. Fig. 3.2shows a typical ROC curve.
ROC curves are a way to plot test sensitivity and specificity at different values for thresholds that define positive and negative tests. Traditionally anROC curve is a plot of the true positive rate (sensitivity) compared with thefalse positive rate (1 − specificity). The accuracy of a test is dependent on howwell the test separates the group being tested into those with and without thedisease. Test accuracy can be measured by the area under the ROC curve. Ifthe area is equal to 1, then the test is perfect. An area of 0.5 is a worthless test.Table 3.1 provides a rough guide to classifying the accuracy of a diagnostictest using the area under the ROC curve.
Table 3.1 Determining the accuracy of a diagnostic test using the area under the ROC curve
Value Accuracy
0.90–1.00 Excellent0.80–0.90 Good0.70–0.80 Fair0.60–0.70 Poor
Sens
itivi
ty
1.00
0.75
0.50
0.25
0.00
0.00 0.25 0.50
1 – Specificity
0.75 1.00
Area under ROC curve = 0.7925
Figure 3.2 Receiver operator characteristic (ROC) curve.
9781405154000_4_003.qxd 19/03/2008 10:44 Page 30

Chapter 3: Epidemiology and Statistics 31
Another way of describing the area under the ROC curve is as test dis-crimination. It measures the ability of a test to correctly classify those withand without disease. Imagine a situation where we have two sets of patients,one with occult bacteremia and one without. If we were to randomly pick one patient from the group with bacteremia and one from the group withoutbacteremia and get white blood cell (WBC) counts for both, we should findthat the patient with the highest WBC level is from the group with occult bacteremia. The area under the ROC curve is the percentage of randomlydrawn pairs for which this is true (i.e. the test correctly classifies the twopatients in the random pair). We will make reference to studies that use ROCcurves throughout this book.
In conclusion, learning how to use diagnostic test characteristics (sensit-ivity, specificity, predictive values, and likelihood ratios), determine appro-priate cutoffs and the accuracy of tests (ROC curves), report results (oddsratios and CIs), and understand the inherent bias in diagnostic testing (spectrum bias) can be helpful in the practice of EBM in the ED. An under-standing of both the power and limitations of testing can aid in diagnosis andmedical decision making.
Reference
1. Brown, M.D., Rowe, B.H., Reeves, M.J., et al. (2002) The accuracy of the enzyme-linked immunosorbent assay D-dimer test in the diagnosis of pulmonary embolism:a meta-analysis. Annals of Emergency Medicine 40: 133–144.
9781405154000_4_003.qxd 19/03/2008 10:44 Page 31

32
Chapter 4 Clinical Decision Rules
Clinical decision rules are practical tools that are intended to assist us indeciding whether a diagnostic test is needed or what the likelihood is for thepresence or absence of a particular disease or condition. They are designed tobe simple and to provide a practical decision-making guide to differentiatepatients who require testing or treatment from those who do not. Clinicaldecision rules typically include at least three elements from the patient’s his-tory, physical examination, and simple ancillary tests that can guide us at thebedside in the emergency department (ED) or in the office.1 Decision rulesare derived using a series of research studies on a specific clinical question.They must then be validated and tested in a different population. Each step inthe derivation, validation, and external testing of a decision rule involvesspecific study designs and statistical analyses. At each stage in the develop-ment process, aspects of exactly how the study was conducted (i.e. patientpopulation tested, specific outcomes) have an impact on how the rule shouldbe interpreted and used in clinical practice. In this chapter we describe thesteps researchers take to derive (generate) clinical decision rules and validatethem (show that they work).
A decision rule is derived from a specific research question. When related to diagnostic testing, it traditionally starts with a question like: “XYZ is a disease that we often suspect but has a low positive testing rate. Is there a way to clinically differentiate cases with negative tests when there is a risk for XYZ, so that XYZ can be ruled out clinically without ordering any tests?” ‘XYZ’ may refer to common diseases that we want to exclude but which have a low prevalence of positives; for example intra-cranial bleeds, C-spine fractures, and knee and ankle fractures. How specificthe clinical question may be suggests that there are limits to when a clinicaldecision rule can and should be used. For instance, consider the inclusion
9781405154000_4_004.qxd 19/03/2008 10:45 Page 32
Evidence-Based Emergency Care: Diagnostic Testing and Clinical Decision Rules. J.M. Pines andW.W. Everett. 2008 Jesse M. Pines and Worth W. Everett, ISBN: 978-1-4051-5400-0.

Chapter 4: Clinical Decision Rules 33
criteria for a rule. If the derivation and validation of a decision rule regard-ing whether a blunt trauma patient should get a noncontrast head com-puted tomography (CT) scan to rule out intracranial pathology only included adult patients over the age of 18 years, the results may not be appliedto similarly injured pediatric patients unless it was validated in that specificpopulation.
Decision rules are intended to include elements of the patient’s history,physical examination, or diagnostic tests that are reproducible and straight-forward. Elements of clinical decision rules are also ideally binary (i.e. yes/no)or at least discrete with unambiguous options. We want to eliminate sub-jectivity as much as possible and maximize inter-rater reliability. This meansthat when two separate people assess an element of a rule, they have a highchance of agreeing on the results of that element. For example, few wouldargue that about a patient being 72 years old if the criterion was ‘is the patient65 and older?’ it is likely that there would be perfect agreement between twoindividuals assessing this element. However, when we start using physicalexamination findings in a rule, such as does the patient have point tendernessover either malleolus of the ankle, then there is a greater chance for disagree-ment. This becomes further muddied when we try to use more subjectivefindings such as, is there rebound or guarding on an abdominal examinationwhere clinicians may have a high likelihood of obtaining different results.Clinical decision rules also frequently do not take into context other intan-gible elements of the clinical setting. That is to say, clinical decision rules are not perfect. In the Canadian Head CT rule, a rule that determines whetheror not patients require head CT scans after blunt head trauma, one of the elements includes a failure to reach a Glasgow Coma Scale (GCS) of 15 within2 hours. If you are monitoring a patient who has the highest possible GCS but who starts to behave strangely 30 minutes after a blunt head trauma, you probably should not wait the 2 hours to see whether she normalizes.Rather, you should consider ordering a head CT early. Clinical decision rules often guide whether the likelihood of a disease is low enough to warrantthe test. However, they are not necessarily binding. Even though clinical decision rules are designed to be 100% sensitive in theory, when tested inreal-life practice they are almost always less than 100% sensitive. Clinicalexperience and gestalt are valuable assets in emergency medicine but are part of the intangible components that cannot be incorporated into clinicaldecision rules.
Over the past 15 years many decision rules have been introduced. The most notable and likely the most widely known are the sets of rules known as the Ottawa rules (the knee rules and ankle rules). Dr. Ian Stiell and hisresearch colleagues in Ottawa, Canada have made a career of taking common
9781405154000_4_004.qxd 19/03/2008 10:45 Page 33

34 Chapter 4: Clinical Decision Rules
clinical conditions where testing is frequently employed and positive tests are relatively rare, and trying to figure out who needs tests and who doesn’t.By asking very simple and straightforward questions, Dr. Stiell’s research has aimed to reduce unnecessary testing on patients by deriving decisionrules to identify low risk patients who don’t need tests. The other benefits of eliminating unnecessary testing using clinical decision rules include: (i) reductions of time in the ED for the patients; (ii) reduced exposure to radiation (for imaging); and (iii) reduced costs to both patients and thehealth care system overall.
The clinical decision rule development process
A first step in creating a rule is to consider a clinical situation that is common enough to warrant a decision rule. Is there a discrete and finite clinical question? For instance, does every patient with ankle pain need an X-ray? How frequently are tests positive? Ankle injuries are common andwidespread complaints presenting to EDs around the world and ankle X-raysare frequently negative. Therefore, a rule that can identify low risk criteria toreduce unnecessary ankle radiography would be clinically helpful. So do weneed a decision rule for patients with ankle pain? The clinical question is, “isthere a fractured bone or not?” The practical question becomes, “is an X-rayneeded?”
How do you go about creating a decision rule? The rest of this chapter will summarize the approach by describing the essential steps that researchersmust undertake to develop a rule that is useful in practice. Several nicely written articles describing and discussing the methods for these componentsare available for those of you who want additional details.1–5 As readers of the medical literature, developing a working understanding of each of thesesteps is important to determine, if you should use any specific decision rulefor your patients.
The first step is defining the outcome. The outcome should be explicitlydescribed and clinically relevant to the condition under study. For example, is there a fracture of either malleolus of the ankle? Does the patient have anacute appendicitis or a cervical spine fracture? All of these are discrete con-ditions with a binary yes or no answer. In describing the condition or testbeing examined, researchers also must define the patient population for therule. Defining the outcome and the appropriate target patient population are essential because this determines the patient population to whom the rulecan be applied.
Next, what are the most relevant and logical factors that might be used to predict an outcome or diagnosis? It is from the initial pool of predictor
9781405154000_4_004.qxd 19/03/2008 10:45 Page 34

Chapter 4: Clinical Decision Rules 35
variables that the final decision rule is derived. The predictor variables usually include demographic factors, medical history, circumstances sur-rounding the patient’s injury (mechanism of injury, timing), results of thephysical examination, and sometimes blood test results, electrocardiogramfindings, or results of imaging studies. Accurately and consistently determin-ing the presence of the predictor variables is the key to determining whichvariables should be ultimately included in the decision rule. Both the intra-observer agreement (i.e. repeated measurements by the same clinician) andinterobserver agreement (i.e. measurements by different clinicians) shouldbe high for inclusion in a decision rule. In terms of statistical measurement,researchers need to show that the predictor variables they are consideringhave sufficiently high reproducibility, in the form of kappa statistic (κ). A κ statistic is a number from 0 to 1, where 0 indicates no agreement and 1indicates perfect agreement. Variables that are too subjective and have low κvalues (<0.6) should not be included in the decision rule.
If the goal is to reliably exclude a fracture based on the history and physicalfindings for a patient with ankle pain, the predictor variables should be deter-mined before knowledge of the X-ray results. Similarly, the X-ray resultsshould not be interpreted solely on the basis of the history and physical exam-ination findings. Blinded assessment of the predictor variables and out-comes from the imaging study ensures there is no observer or ascertainmentbias in terms of the validity of the findings. For instance, let’s say we haveexamined a patient and know there is point tenderness over the medial malle-olus. We may review an X-ray more carefully in the area of concern lookingfor a fracture in that specific area, and may be more likely to call any irregular-ity a fracture. This is in contrast to a radiologist who is reading a similar X-raywithout prior knowledge of the physical examination, and who concludesthat there is no fracture present.
The derivation phase of a decision rule is a process of collecting the data ina standardized way, including the predictor variables, assessing the reliabilityof those data, and determining the outcome(s) being studied (in the ankleexample the outcome is fracture). Researchers then use statistical methods to distill the predictor variables down to those that are the most predictive of the outcome. The two most common methods are recursive partitioningand logistic regression analysis. The former takes patients and divides themsequentially into groups with a particular outcome. Subsets of patients withthat particular outcome are created based upon common predictor variablesassociated with the outcomes. Logistic regression analysis generates a modelthat predicts the outcome—which has to be binary (fracture or no fracture)—by using the best statistical combination of predictor variables. Function-ally, this type of analysis creates odds of the outcome event based on the
9781405154000_4_004.qxd 19/03/2008 10:45 Page 35
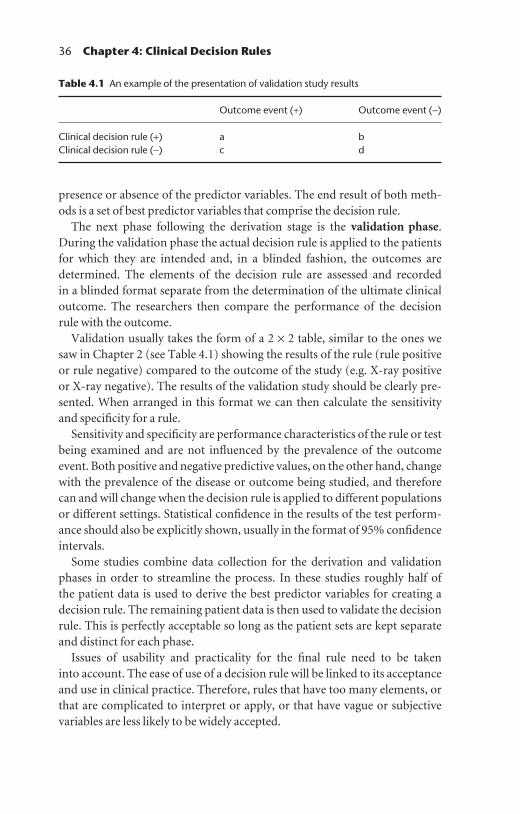
36 Chapter 4: Clinical Decision Rules
presence or absence of the predictor variables. The end result of both meth-ods is a set of best predictor variables that comprise the decision rule.
The next phase following the derivation stage is the validation phase.During the validation phase the actual decision rule is applied to the patientsfor which they are intended and, in a blinded fashion, the outcomes are determined. The elements of the decision rule are assessed and recorded in a blinded format separate from the determination of the ultimate clinicaloutcome. The researchers then compare the performance of the decision rule with the outcome.
Validation usually takes the form of a 2 × 2 table, similar to the ones we saw in Chapter 2 (see Table 4.1) showing the results of the rule (rule positiveor rule negative) compared to the outcome of the study (e.g. X-ray positive or X-ray negative). The results of the validation study should be clearly pre-sented. When arranged in this format we can then calculate the sensitivityand specificity for a rule.
Sensitivity and specificity are performance characteristics of the rule or testbeing examined and are not influenced by the prevalence of the outcomeevent. Both positive and negative predictive values, on the other hand, changewith the prevalence of the disease or outcome being studied, and thereforecan and will change when the decision rule is applied to different populationsor different settings. Statistical confidence in the results of the test perform-ance should also be explicitly shown, usually in the format of 95% confidenceintervals.
Some studies combine data collection for the derivation and validationphases in order to streamline the process. In these studies roughly half of the patient data is used to derive the best predictor variables for creating adecision rule. The remaining patient data is then used to validate the decisionrule. This is perfectly acceptable so long as the patient sets are kept separateand distinct for each phase.
Issues of usability and practicality for the final rule need to be taken into account. The ease of use of a decision rule will be linked to its acceptanceand use in clinical practice. Therefore, rules that have too many elements, orthat are complicated to interpret or apply, or that have vague or subjectivevariables are less likely to be widely accepted.
Table 4.1 An example of the presentation of validation study results
Outcome event (+) Outcome event (−)
Clinical decision rule (+) a bClinical decision rule (−) c d
9781405154000_4_004.qxd 19/03/2008 10:45 Page 36

Chapter 4: Clinical Decision Rules 37
The final steps in the decision rule evolution are assessing the impact andcost effectiveness of the rule in actual clinical practice. Reports of the impactof a decision rule are described in implementation studies. They reveal if theuse of the rule results in changes in clinical practice and behavior patterns.Once effectiveness can be demonstrated, the economic effect can then beassessed. Demonstrating conservation of resources, health savings, increasedefficiency, or, better still, all of these, can determine the success or failure of adecision rule.
The process from concept to final decision rule often takes several years to complete. The derivation and validation phases are often published separately. Implementation and cost-effectiveness studies for a clinical deci-sion rule add additional years to a rule’s long road to acceptance and use in clinical practice. Indeed, few decision rules have undergone these lattersteps of testing. There is often a temptation to want to apply the results of aderivation study for a promising new decision rule based on the derivationstudy alone. We want to state explicitly that this should not be done, no matter how good the results appear to be. The initial validation and deriva-tion studies often employ highly trained research personnel to record andelicit the data used in these studies and are, in effect, efficacy studies. That is,under ideal clinical research terms and settings can a rule be created andapplied? This is different and distinct from effectiveness studies that examinehow the rule works under regular routine clinical situations that are not study settings. A promising new decision rule should be examined criticallyand with caution. We should be sure to wait for external validation studiesthat replicate the findings in new or different setting from the initial sets of derivation/validation studies by different clinical researchers before incor-porating a new decision rule into practice.
Unfortunately, few of the chapters in this book have a nice series of deriva-tion, validation, implementation, and cost-effectiveness studies to describeand discuss. Instead many of the common clinical questions have only beenpartially evaluated or are in the formative stages of evaluation. Our hopes arethat future studies will fill in the gaps that we point out; or, better still, thatour discussions could fuel new exploration for clinically relevant questionswith new, innovative decisions rules.
References
1. Laupacis, A., Sekar, N. and Stiell, I.G. (1977) Clinical prediction rules: a review and suggested modifications of methodological standards. Journal of the AmericanMedical Association 277(6): 488–494.
9781405154000_4_004.qxd 19/03/2008 10:45 Page 37

38 Chapter 4: Clinical Decision Rules
2. Randolph, A.G., Guyatt, G.H., Calvin, J.E., Doig, G. and Scott, R.W. (1998)Understanding articles describing clinical prediction tools. Critical Care Medical26(9): 1603–1612.
3. Stiell, I.G. and Wells, G.A. (1999) Methodological standards for the development ofclinical decision rules in emergency medicine. Annals of Emergency Medicine 33(4):437–447.
4. McGinn, T.G., Guyatt, G.H., Wyer, P.C., Naylor, C.D., Stiell, I.G. and Richardson,W.S. (2000) Users’ guide to the medical literature XXII: how to use articles aboutclinical decision rules. Evidence-Based Medicine Working Group. Journal of theAmerican Medical Association 284(1): 79–84.
5. Reilly, B.M. and Evans, A.T. (2006) Translating clinical research into clinical prac-tice: impact of using prediction to make decisions. Annals of Internal Medicine144(3): 201–209.
9781405154000_4_004.qxd 19/03/2008 10:45 Page 38

SECTION 2
Traumatic Injuries
9781405154000_4_005.qxd 19/03/2008 10:46 Page 39
Evidence-Based Emergency Care: Diagnostic Testing and Clinical Decision Rules. J.M. Pines andW.W. Everett. 2008 Jesse M. Pines and Worth W. Everett, ISBN: 978-1-4051-5400-0.

41
Chapter 5 Cervical Spine Fractures
Highlights
• The prevalence of cervical spine injuries from blunt trauma is low at around
1–2%.
• Applying either of the clinical decision rules for bluntly injured patients
[Canadian C-spine rule (CCR) or the National Emergency X-Radiography
Utilization Study (NEXUS) low-risk criteria (NLC)] helps identify low-risk
patients in the emergency department (ED) for whom neck radiography
can be deferred.
• Computed tomography (CT) imaging of the cervical spine is highly sensitive
compared to plain film imaging, but should be reserved for selected patients
at high risk of cervical spine injury.
Background
More than 14 million patients undergo radiographic imaging of the cervicalspine each year in the US, with a clinically significant spine or cord injuryfound in less than 2% of all cases. As a result, many patients without injuriesundergo negative radiographic imaging. The development of sensitive clinicaldecision rules to help clinicians identify patients that are at extremely low riskof a cervical spine injury has been helpful in reducing unnecessary imaging.
Two rules have been developed that use accepted clinical decision rulemethodology: the NLC, and the CCR.1,2 Each rule has been derived and valid-ated in large and diverse populations of ED patients with very high sensitivityand negative predictive values.
There are also multiple radiographic modalities that are available to studythe cervical spine including plain films (Fig. 5.1), computed tomography
9781405154000_4_005.qxd 19/03/2008 10:46 Page 41
Evidence-Based Emergency Care: Diagnostic Testing and Clinical Decision Rules. J.M. Pines andW.W. Everett. 2008 Jesse M. Pines and Worth W. Everett, ISBN: 978-1-4051-5400-0.
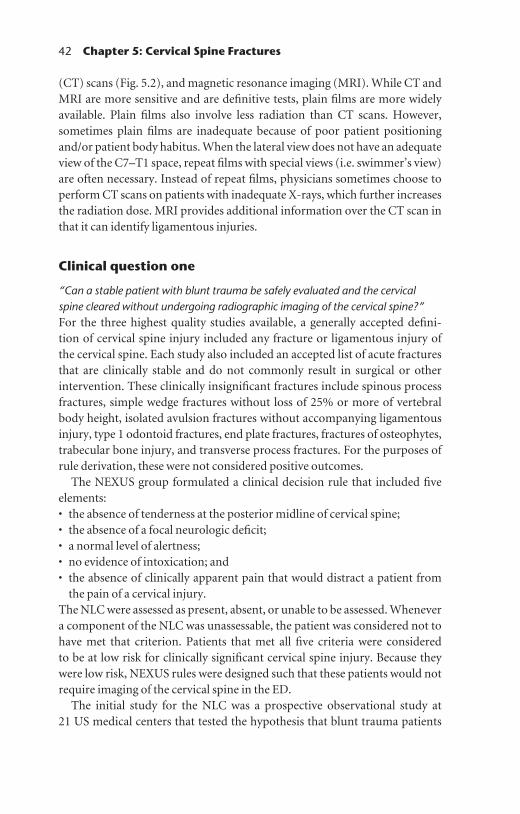
42 Chapter 5: Cervical Spine Fractures
(CT) scans (Fig. 5.2), and magnetic resonance imaging (MRI). While CT andMRI are more sensitive and are definitive tests, plain films are more widelyavailable. Plain films also involve less radiation than CT scans. However,sometimes plain films are inadequate because of poor patient positioningand/or patient body habitus. When the lateral view does not have an adequateview of the C7–T1 space, repeat films with special views (i.e. swimmer’s view)are often necessary. Instead of repeat films, physicians sometimes choose toperform CT scans on patients with inadequate X-rays, which further increasesthe radiation dose. MRI provides additional information over the CT scan inthat it can identify ligamentous injuries.
Clinical question one
“Can a stable patient with blunt trauma be safely evaluated and the cervicalspine cleared without undergoing radiographic imaging of the cervical spine?”For the three highest quality studies available, a generally accepted defini-tion of cervical spine injury included any fracture or ligamentous injury ofthe cervical spine. Each study also included an accepted list of acute fracturesthat are clinically stable and do not commonly result in surgical or otherintervention. These clinically insignificant fractures include spinous processfractures, simple wedge fractures without loss of 25% or more of vertebralbody height, isolated avulsion fractures without accompanying ligamentousinjury, type 1 odontoid fractures, end plate fractures, fractures of osteophytes,trabecular bone injury, and transverse process fractures. For the purposes ofrule derivation, these were not considered positive outcomes.
The NEXUS group formulated a clinical decision rule that included fiveelements:• the absence of tenderness at the posterior midline of cervical spine;• the absence of a focal neurologic deficit;• a normal level of alertness;• no evidence of intoxication; and• the absence of clinically apparent pain that would distract a patient from
the pain of a cervical injury.The NLC were assessed as present, absent, or unable to be assessed. Whenevera component of the NLC was unassessable, the patient was considered not tohave met that criterion. Patients that met all five criteria were considered to be at low risk for clinically significant cervical spine injury. Because theywere low risk, NEXUS rules were designed such that these patients would notrequire imaging of the cervical spine in the ED.
The initial study for the NLC was a prospective observational study at 21 US medical centers that tested the hypothesis that blunt trauma patients
9781405154000_4_005.qxd 19/03/2008 10:46 Page 42

Chapter 5: Cervical Spine Fractures 43
Figure 5.1 Open mouth odontoid cervical spine X-ray showing widening of the lateralpillar (arrow) of the first cervical vertebra, consistent with an acute fracture.
Figure 5.2 A second vertebral fracture is demonstrated on the cervical spine computedtomography scan.
who met all of the criteria would have an extremely low probability of cervicalspine injury. All patients that underwent imaging of the cervical spine wereincluded, except those that had a penetrating trauma or that required imag-ing of the cervical spine for a reason unrelated to trauma. Patients underwentthe standard three-view imaging of the C-spine (lateral, anteroposterior, andopen mouth views) or advanced imaging (CT, MRI). The NLC were appliedin 34 069 patients and the incidence of radiographically documented cervical
9781405154000_4_005.qxd 19/03/2008 10:46 Page 43

44 Chapter 5: Cervical Spine Fractures
spine injury was 2.4%. Table 5.1 shows the results of the study and the per-formance of the NLC.
The criteria from this study missed a total of eight patients with documentedcervical spine injuries. Only two of those injuries were clinically significant,and neither required surgical intervention or had any long-term clinical con-sequences. With 99.6% sensitivity and a 99.9% negative predictive value, itwas felt that the patients from this large multicenter study met all of the criteriaand could safely be considered as extremely low risk for cervical spine injury.
In a similar study performed at approximately the same time in Canada,Stiell and colleagues created the CCR. This decision rule was first published asa derivation study in 2001,2 with the goal being to develop a prediction rulewith extremely high sensitivity for detecting acute cervical spine injuries instable ED patients with blunt trauma. The authors conducted a prospectivecohort study in 10 Canadian EDs and derived the clinical and historical factorssurrounding the injury that would optimize detection of a cervical spineinjury. This was different from the NLC because the NEXUS criteria do notconsider the events surrounding the injury. Patients with blunt head or necktrauma were included in the study if they were alert [defined as a value of 15 onthe Glasgow Coma Scale (GCS)] and stable (defined as systolic blood pressure
Table 5.1 NEXUS low-risk criteria (NLC): study results and test performance fromHoffman et al.1
Radiographically Decision rule documented injury performance
Assessment result forany cervical injury Injury No injury Total 95% CI
Decision rule positive 810 28 950 29 760 Sensitivity 99.0% 98.0–99.6Specificity 12.9% 12.8–13
Decision rule negative 8 4 301 4 309 NPV 99.8% 99.6–100PPV 2.7% 2.6–2.8
Total 818 33 251 34 069
Clinically significantcervical injury Injury No injury Total
Decision rule positive 576 29 184 29 760 Sensitivity 99.6% 98.6–100Specificity 12.9% 12.8–13
Decision rule negative 2 4 307 4 309 NPV 99.9% 99.8–100PPV 1.9% 1.8–2.0
Total 578 33 491 34 069
NPV, negative predictive value; PPV, positive predictive value.
9781405154000_4_005.qxd 19/03/2008 10:46 Page 44

Chapter 5: Cervical Spine Fractures 45
For Alert (Glasgow Coma Scale Score = 15) and Stable TraumaPatients Where Cervical Spine (C-Spine) Injury is a Concern
*Dangerous Mechanism:• Fall From ≥1 meter/five Stairs• Axial Load to Head; e.g. Diving• MVC High Speed (>100 km/h), Rollover, Ejection• Motorized Recreational Vehicles• Bicycle Collision
No
No
Yes
Unable
Yes
Able
1. Any High-Risk Factor that Mandates Radiography? Age ≥65 Years or Dangerous Mechanism* or Paresthesias in Extremities
3. Able to Actively Rotate Neck? 45° Left and Right
2. Any Low-Risk Factor that Allows Safe Assessment of Range of Motion? Simple Rear-end MVC†
or Sitting Position in ED or Ambulatory at Any Time or Delayed Onset of Neck Pain‡
or Absence of Midline C-Spine Tenderness
No Radiography
Radiography
†Simple Rear-end MVC Excludes:• Pushed into Oncoming Traffic• Hit by Bus/Large Truck• Rollover• Hit by High-Speed Vehicle
‡Delayed:• Not lmmediate Onset of Neck Pain
Figure 5.3 The Canadian C-spine rules. ED, emergency department; MVC, motorvehicle collision. (Source: Journal of the American Medical Association 2001; 286:1841.Copyright © 2001, American Medical Association. All rights reserved.)
9781405154000_4_005.qxd 19/03/2008 10:46 Page 45

46 Chapter 5: Cervical Spine Fractures
greater than 90 mmHg and respiratory rate greater than 10 but less than 24/min).Patients were excluded if they met one of the following predefined criteria:age less than 16 years; minor injuries, not including blunt head/neck trauma(such as lacerations or abrasions); GCS below 15; grossly abnormal vital signs;injury age of greater than 48 h; penetrating trauma; acute paralysis; knownvertebral disease; return for reassessment of the same injury; or pregnancy.
Data were collected based on 20 standardized clinical findings from theneurologic status, patient history and physical examination. Patients under-went imaging of the cervical spine at the discretion of the treating physician.This was not mandatory and therefore some patients did not undergo imag-ing. For those patients without cervical spine imaging, a structured telephonefollow-up was conducted to assess for missed injuries. The purpose of thishybridized gold standard was to ensure that there were no missed injuries inpatients who did not receive radiographs. Patients were considered not tohave a clinically significant cervical spine injury if, during the telephone inter-view at 14 days, they met all of the following criteria: (i) neck pain was rated asmild or none; (ii) restriction of neck movement was rated as mild or none;(iii) the use of a cervical collar was not required: and (iv) the neck injury didnot prevent the return of the patient to their usual occupational activities.
The CCR includes three sets of criteria that need to be evaluated in a stepwise manner (Fig. 5.3). The stepwise nature of the CCR makes it some-what more complicated than the NEXUS criteria and a bit more difficult toremember. However, if a patient satisfies all of the criteria, the decision ruleindicates a low risk of cervical spine injury and radiography can be deferred.The following lists the criteria that must be fulfilled in order to safely deferimaging according to the CCR.Criterion 1: Is there any high-risk factor that mandates radiography? Spe-cifically, does the patient satisfy any of the following: age 65 years or older,paresthesias in any extremity, or a dangerous mechanism of injury (definedas a fall from 1 m or greater, axial load to the head as in a diving injury, motorvehicle crash at a speed in excess of 100 km/h, rollover or ejection, motorizedrecreational vehicle, bicycle collision)? If yes to any of these, radiographicimaging is recommended. If no, the second set of criteria are assessed.Criterion 2: Are there any low-risk factors that allow safe assessment of arange of motion of the cervical spine? Specifically, are any of the followingpresent: simple rear-end motor vehicle crash (excludes pushed into oncom-ing traffic, hit by bus/large truck, rollovers, hit by high-speed vehicle), sittingposition in the ED, ambulatory at any time, delayed onset of neck pain(defined as not immediate onset of neck pain), or absence of midline cervicalspine tenderness? If none of these are present, radiographic imaging is recom-mended. If any one of these is present, the final criterion is assessed.
9781405154000_4_005.qxd 19/03/2008 10:46 Page 46
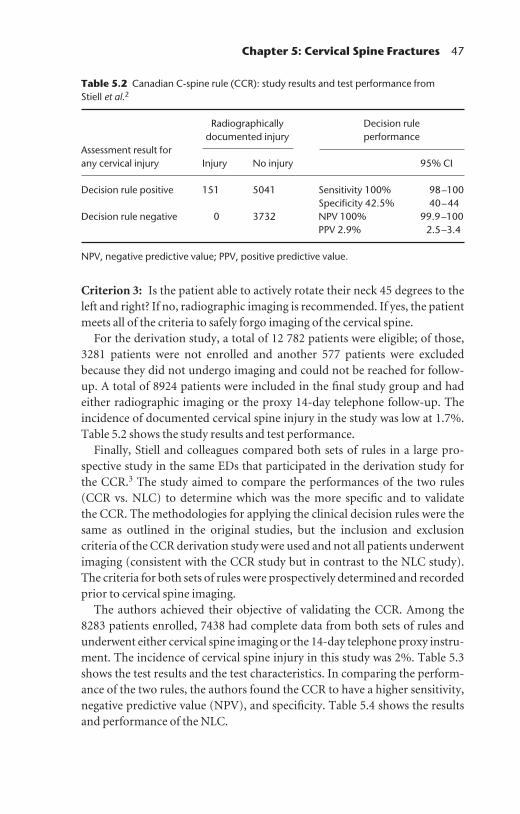
Chapter 5: Cervical Spine Fractures 47
Criterion 3: Is the patient able to actively rotate their neck 45 degrees to theleft and right? If no, radiographic imaging is recommended. If yes, the patientmeets all of the criteria to safely forgo imaging of the cervical spine.
For the derivation study, a total of 12 782 patients were eligible; of those,3281 patients were not enrolled and another 577 patients were excludedbecause they did not undergo imaging and could not be reached for follow-up. A total of 8924 patients were included in the final study group and hadeither radiographic imaging or the proxy 14-day telephone follow-up. Theincidence of documented cervical spine injury in the study was low at 1.7%.Table 5.2 shows the study results and test performance.
Finally, Stiell and colleagues compared both sets of rules in a large pro-spective study in the same EDs that participated in the derivation study forthe CCR.3 The study aimed to compare the performances of the two rules(CCR vs. NLC) to determine which was the more specific and to validate the CCR. The methodologies for applying the clinical decision rules were thesame as outlined in the original studies, but the inclusion and exclusion criteria of the CCR derivation study were used and not all patients underwentimaging (consistent with the CCR study but in contrast to the NLC study).The criteria for both sets of rules were prospectively determined and recordedprior to cervical spine imaging.
The authors achieved their objective of validating the CCR. Among the8283 patients enrolled, 7438 had complete data from both sets of rules andunderwent either cervical spine imaging or the 14-day telephone proxy instru-ment. The incidence of cervical spine injury in this study was 2%. Table 5.3shows the test results and the test characteristics. In comparing the perform-ance of the two rules, the authors found the CCR to have a higher sensitivity,negative predictive value (NPV), and specificity. Table 5.4 shows the resultsand performance of the NLC.
Table 5.2 Canadian C-spine rule (CCR): study results and test performance from Stiell et al.2
Radiographically Decision rule documented injury performance
Assessment result for any cervical injury Injury No injury 95% CI
Decision rule positive 151 5041 Sensitivity 100% 98–100Specificity 42.5% 40–44
Decision rule negative 0 3732 NPV 100% 99.9–100PPV 2.9% 2.5–3.4
NPV, negative predictive value; PPV, positive predictive value.
9781405154000_4_005.qxd 19/03/2008 10:46 Page 47
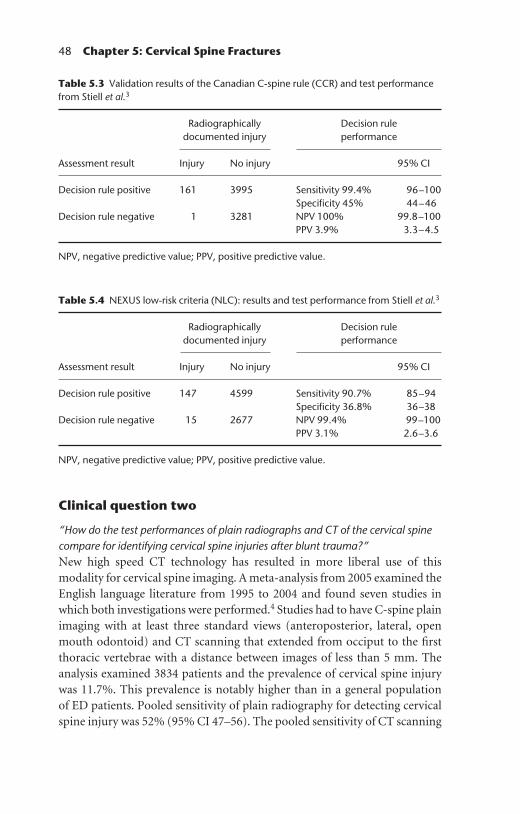
48 Chapter 5: Cervical Spine Fractures
Clinical question two
“How do the test performances of plain radiographs and CT of the cervical spinecompare for identifying cervical spine injuries after blunt trauma?”New high speed CT technology has resulted in more liberal use of this modality for cervical spine imaging. A meta-analysis from 2005 examined theEnglish language literature from 1995 to 2004 and found seven studies inwhich both investigations were performed.4 Studies had to have C-spine plainimaging with at least three standard views (anteroposterior, lateral, openmouth odontoid) and CT scanning that extended from occiput to the firstthoracic vertebrae with a distance between images of less than 5 mm. Theanalysis examined 3834 patients and the prevalence of cervical spine injurywas 11.7%. This prevalence is notably higher than in a general population of ED patients. Pooled sensitivity of plain radiography for detecting cervicalspine injury was 52% (95% CI 47–56). The pooled sensitivity of CT scanning
Table 5.3 Validation results of the Canadian C-spine rule (CCR) and test performancefrom Stiell et al.3
Radiographically Decision rule documented injury performance
Assessment result Injury No injury 95% CI
Decision rule positive 161 3995 Sensitivity 99.4% 96–100Specificity 45% 44–46
Decision rule negative 1 3281 NPV 100% 99.8–100PPV 3.9% 3.3–4.5
NPV, negative predictive value; PPV, positive predictive value.
Table 5.4 NEXUS low-risk criteria (NLC): results and test performance from Stiell et al.3
Radiographically Decision rule documented injury performance
Assessment result Injury No injury 95% CI
Decision rule positive 147 4599 Sensitivity 90.7% 85–94Specificity 36.8% 36–38
Decision rule negative 15 2677 NPV 99.4% 99–100PPV 3.1% 2.6–3.6
NPV, negative predictive value; PPV, positive predictive value.
9781405154000_4_005.qxd 19/03/2008 10:46 Page 48

Chapter 5: Cervical Spine Fractures 49
of the cervical spine was 98% (95% CI 96–99). Specificity, positive and negative predictive values could not be calculated because there was no independent gold standard test. Injuries identified by CT were consideredtrue injuries.
Comment
The NLC and the CCR have both been validated in large cohorts of patients inED patients with blunt trauma to the neck. In the validation cohorts, bothhave high sensitivities (>99.3%) and negative predictive values (>99.9%),making both decision rules safe.
When comparing the two rules, Stiell and colleagues concluded that theCCR performed better than the NLC.3 We feel that there are sufficient differ-ences between the two rules and the studies supporting them to make the issuenot as clear cut as Stiell has suggested. Table 5.5 compares and contrasts thedifferences in the derivation, validation, and implementation of these rules.
Given the differences, we believe that both sets of rule are useful for assess-ing the stable patient with blunt trauma. Overall, the NLC are somewhat easier to use clinically because they are less difficult to remember. The CCRare more complex and must be employed in a stepwise fashion. In our experi-ence, the most common reason for failure of the NLC and for the need forcervical radiography is midline tenderness. The CCR are more specific thanthe NLC and patients with midline tenderness can be identified who do nototherwise meet criteria for cervical radiography.
Because of the higher specificity of the CCR, we propose that the CCR cri-teria be applied as a first step in the ED. While both the NLC and the CCRhave roughly equal high sensitivity and high negative predictive values, CCRwill have many fewer false positives. That is not to say that the NLC shouldnot be used, just that you should be aware that while the NPV is very highwith both sets of rules, the very low specificity of the NLC will lead to moreunnecessary imaging (i.e. false positives—when the prediction rule indicatesthat the patient is not low risk and therefore recommends imaging).
We do however want to remind you that should there be a suspicion forcervical spine injury for any reason beyond those elements incorporated into either set of rules, you should err on the side of clinical safety and obtainimaging. A missed C-spine fracture can have catastrophic consequences topatients, including potential disability and even death. In the case of a negativerule but a high clinical suspicion of injury, clinical judgment should always beused when choosing whether to employ or defer cervical radiography.
Regarding whether or not plain films or CT should be the initial test ofchoice in blunt cervical trauma, it appears in the limited studies of highly
9781405154000_4_005.qxd 19/03/2008 10:46 Page 49

50 Chapter 5: Cervical Spine Fractures
Tab
le 5
.5A
com
par
ison
of N
EXU
S lo
w-r
isk
crite
ria (N
LC) a
nd th
e C
anad
ian
C-s
pin
e ru
le (C
CR)
Exp
licit
desc
riptio
n fo
r eac
h cr
iterio
n in
th
e ru
le
Patie
nt e
nrol
lmen
t
Excl
usio
n cr
iteria
Com
men
t
NLC
:•
auth
ors
felt
into
xica
tion
and
pai
nful
dis
trac
ting
inju
ry w
ere
best
dete
rmin
ed c
linic
ally
and
str
ict d
efini
tions
wou
ld li
mit
use
in
clin
ical
pra
ctic
eC
CR:
•in
toxi
catio
n no
t inc
lude
d as
it w
as fo
und
in th
e p
relim
inar
y st
udie
s to
not
be
pre
dict
ive
of in
jury
•p
rovi
ded
list o
f hig
h-ris
k m
echa
nism
s bu
t man
y ot
hers
exi
st th
atar
e no
t exp
licitl
y lis
ted
NLC
:•
risk
of s
elec
tion
bias
bas
ed o
n w
heth
er o
r not
at r
isk
pat
ient
s go
t in
itial
imag
ing,
pos
sibl
y lim
iting
gen
eral
izab
ility
CC
R:•
not a
ll p
atie
nts
had
gold
sta
ndar
d (im
agin
g) b
ut p
roxy
tool
ac
coun
ted
for t
hose
pat
ient
with
out i
mag
ing
Excl
usio
n cr
iteria
lim
it ge
nera
lizab
ility
NLC
:•
Thes
e ar
e re
ason
able
giv
en th
e em
pha
sis
on b
lunt
trau
ma
CC
R:•
No
exp
lana
tion
as to
why
age
, pre
gnan
cy, a
nd s
pin
al d
isea
se
wer
e lis
ted
CC
R
Hig
h ris
k m
echa
nism
defin
ed b
y th
e au
thor
s
Patie
nts
with
com
ple
teda
ta (u
nder
goin
gei
ther
imag
ing
or 1
4-da
y p
roxy
tele
pho
nesu
rvey
)
List
of e
xclu
ded
cond
ition
exp
licitl
ylis
ted
NLC
Into
xica
tion
and
pai
nful
dis
trac
ting
inju
ry le
ft u
ndefi
ned
Patie
nts
with
blu
nttr
aum
a un
derg
oing
cerv
ical
imag
ing
Patie
nts
with
pen
etra
ting
trau
ma
or w
ho h
ad c
ervi
cal
imag
ing
for r
easo
nsot
her t
han
blun
ttr
aum
a
9781405154000_4_005.qxd 19/03/2008 10:46 Page 50

Chapter 5: Cervical Spine Fractures 51
NLC
:•
no a
ge li
mita
tion
CC
R:•
excl
uded
pat
ient
s yo
unge
r tha
n 16
yea
rs, l
imiti
ng g
ener
aliz
abili
ty
Div
erse
ED
pat
ient
pop
ulat
ions
mak
es re
sults
gen
eral
izab
le
Com
par
able
sen
sitiv
ities
, with
cor
resp
ondi
ngly
hig
h N
PVs
The
CC
R ha
s a
sign
ifica
ntly
hig
her s
pec
ifici
ty, t
here
fore
few
er fa
lse
pos
itive
s
NLC
:•
few
er e
lem
ents
and
a s
trai
ghtf
orw
ard
inte
rpre
tatio
n, is
sim
ple
r to
use
CC
R:•
man
y el
emen
ts m
akes
it c
umbe
rsom
e to
use
•ag
e cr
iteria
sim
plifi
es a
pp
roac
h fo
r old
er p
atie
nts
Age
16
year
s or
old
er
1.7%
>740
0 p
atie
nts
in n
ine
Can
adia
n m
edic
alce
nter
s
99.4
% (9
5% C
I96
–100
)
45.1
% (9
5% C
I44
–46
)
A to
tal o
f thr
ee s
ets
ofcr
iteria
, tot
alin
g 14
elem
ents
to d
eter
min
e;so
me
dict
ate
imag
ing,
othe
rs d
icta
te n
oim
agin
g
Non
e
2.4%
>34
000
pat
ient
s in
21 U
S m
edic
alce
nter
s
99%
(95%
CI
98–9
9.6)
12.9
% (9
5% C
I12
.8–1
3)
Five
ele
men
ts to
dete
rmin
e as
pre
sent
or a
bsen
t
Age
crit
eria
Inci
denc
e of
clin
ical
ly
sign
ifica
nt in
jury
Stud
y si
ze
(val
idat
ion
stud
y)
Sens
itivi
ty, %
(v
alid
atio
n st
udy)
Spec
ifici
ty, %
(v
alid
atio
n st
udy)
Dec
isio
n ru
le u
sabi
lity
NPV
, neg
ativ
e p
redi
ctiv
e va
lue.
9781405154000_4_005.qxd 19/03/2008 10:46 Page 51

52 Chapter 5: Cervical Spine Fractures
selected trauma patients, CT C-spine has a higher sensitivity for detectingcervical spine injury compared to plain film imaging. However, in these stud-ies, the overall prevalence of cervical spine injury was much higher than isseen in everyday ED practice. In fact, it was nearly six times higher than in theNEXUS and Canadian studies. This selection bias makes it difficult to gener-alize the patients in these studies (patients were enrolled at primary traumacenters) to the typical patient with a minor motor vehicle crash who is seen in the ED and outside of the trauma bay. Regardless, at this time, in patientssuspected of C-spine injury, our opinion is that you should consider CTimaging over plain radiographs, especially in high-risk cases. However, radia-tion exposure and cost are the two factors that have not been sufficientlyexplored. While there may be subgroups of patients who would benefit fromCT scanning over plain radiography, the data on this topic remains unclear.
References
1. Hoffman, J.R., Mower, W.R., Wolfson, A.B., Todd, K.H. and Zucker, M.I. (2000)Validity of a set of clinical criteria to rule out injury to the cervical spine in patientswith blunt trauma. National Emergency Radiography Utilization Study Group.New England Journal of Medicine 343(2): 94–99.
2. Stiell, I.G., Wells, G.A., Vandemheen, K.L., et al. (2001) The Canadian C-spine rulefor radiography in alert and stable trauma patients. Journal of the American MedicalAssociation 286(15): 1841–1848.
3. Stiell, I.G., Clement, C.M., McKnight, R.D., et al. (2003) The Canadian C-spinerule versus the NEXUS low-risk criteria in patients with trauma. New EnglandJournal of Medicine 349(26): 2510–2518.
4. Holmes, J.F. and Akkinepalli, R. (2005) Computed tomography versus plain radio-graphy to screen for cervical spine injury: a meta-analysis. Journal of Trauma 58(5):902–905.
9781405154000_4_005.qxd 19/03/2008 10:46 Page 52

53
Chapter 6 Cervical Spine Fractures inOlder Adults
Highlights
• The prevalence of traumatic cervical spine injury in older adults is
approximately double compared with younger patients.
• Clinical decision rules for determining who should undergo imaging of the
cervical spine have excellent sensitivity but poor specificity.
• Clinicians should have a low threshold for imaging the cervical spine in older
adults due to anatomic and physiologic changes that are less tolerant of even
minor trauma.
Background
Older adults (≥65 years of age) presenting to the emergency department (ED)for evaluation after blunt trauma involving the neck should be evaluated forpotential cervical spine injuries. Anatomic and physiologic factors associatedwith the older adult patient, such as osteopenia, osteophytes, and relativeimmobility, predispose them to cervical injury in the setting of low impact orminimal energy transfer mechanisms. In addition, one of the current clinicaldecision rules to identify patients who are at low-risk for clinically significantcervical spine injury—the Canadian C-spine rule (CCR)—identifies patientswho are 65 years and older as a high-risk group who should receive objectiveradiography.
Clinical question
“Are there decision rules for determining low risk for cervical spine injury in older adults?”
9781405154000_4_006.qxd 19/03/2008 10:46 Page 53
Evidence-Based Emergency Care: Diagnostic Testing and Clinical Decision Rules. J.M. Pines andW.W. Everett. 2008 Jesse M. Pines and Worth W. Everett, ISBN: 978-1-4051-5400-0.
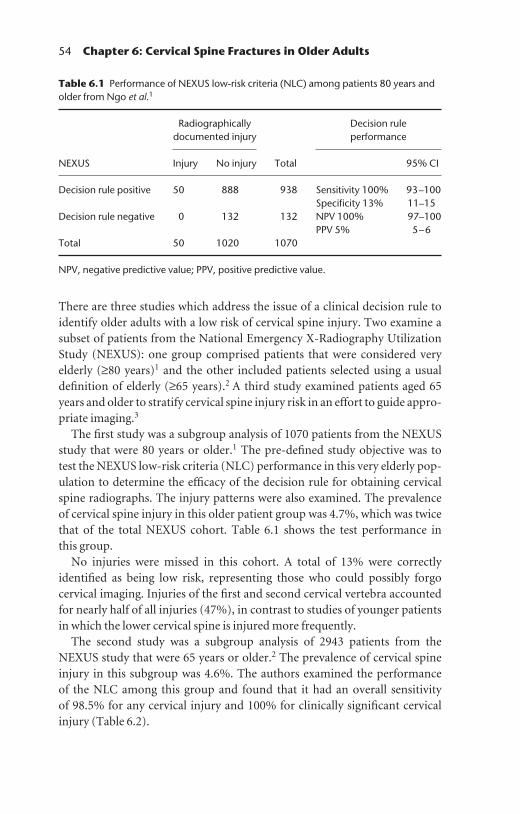
54 Chapter 6: Cervical Spine Fractures in Older Adults
There are three studies which address the issue of a clinical decision rule toidentify older adults with a low risk of cervical spine injury. Two examine asubset of patients from the National Emergency X-Radiography UtilizationStudy (NEXUS): one group comprised patients that were considered veryelderly (≥80 years)1 and the other included patients selected using a usualdefinition of elderly (≥65 years).2 A third study examined patients aged 65years and older to stratify cervical spine injury risk in an effort to guide appro-priate imaging.3
The first study was a subgroup analysis of 1070 patients from the NEXUSstudy that were 80 years or older.1 The pre-defined study objective was to test the NEXUS low-risk criteria (NLC) performance in this very elderly pop-ulation to determine the efficacy of the decision rule for obtaining cervicalspine radiographs. The injury patterns were also examined. The prevalence of cervical spine injury in this older patient group was 4.7%, which was twicethat of the total NEXUS cohort. Table 6.1 shows the test performance in this group.
No injuries were missed in this cohort. A total of 13% were correctlyidentified as being low risk, representing those who could possibly forgo cervical imaging. Injuries of the first and second cervical vertebra accountedfor nearly half of all injuries (47%), in contrast to studies of younger patientsin which the lower cervical spine is injured more frequently.
The second study was a subgroup analysis of 2943 patients from theNEXUS study that were 65 years or older.2 The prevalence of cervical spineinjury in this subgroup was 4.6%. The authors examined the performance of the NLC among this group and found that it had an overall sensitivity of 98.5% for any cervical injury and 100% for clinically significant cervicalinjury (Table 6.2).
Table 6.1 Performance of NEXUS low-risk criteria (NLC) among patients 80 years andolder from Ngo et al.1
Radiographically Decision rule documented injury performance
NEXUS Injury No injury Total 95% CI
Decision rule positive 50 888 938 Sensitivity 100% 93–100Specificity 13% 11–15
Decision rule negative 0 132 132 NPV 100% 97–100PPV 5% 5–6
Total 50 1020 1070
NPV, negative predictive value; PPV, positive predictive value.
9781405154000_4_006.qxd 19/03/2008 10:46 Page 54
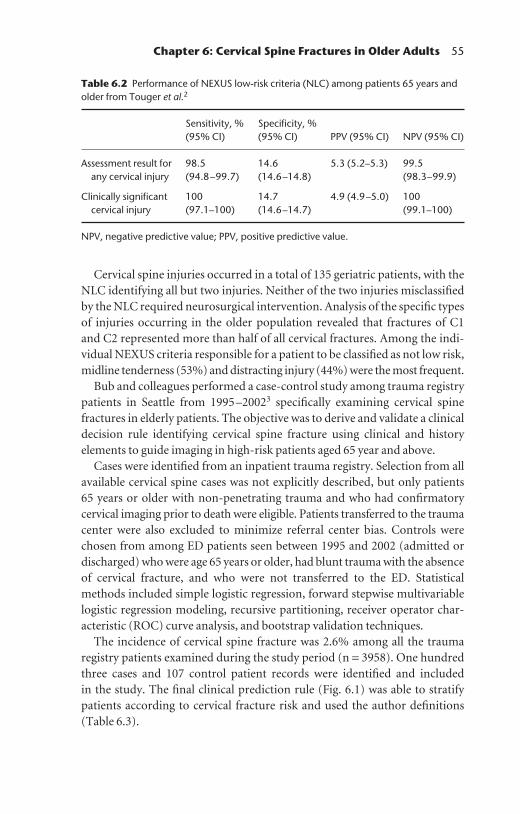
Chapter 6: Cervical Spine Fractures in Older Adults 55
Cervical spine injuries occurred in a total of 135 geriatric patients, with theNLC identifying all but two injuries. Neither of the two injuries misclassifiedby the NLC required neurosurgical intervention. Analysis of the specific typesof injuries occurring in the older population revealed that fractures of C1 and C2 represented more than half of all cervical fractures. Among the indi-vidual NEXUS criteria responsible for a patient to be classified as not low risk,midline tenderness (53%) and distracting injury (44%) were the most frequent.
Bub and colleagues performed a case-control study among trauma registrypatients in Seattle from 1995–20023 specifically examining cervical spinefractures in elderly patients. The objective was to derive and validate a clinicaldecision rule identifying cervical spine fracture using clinical and history elements to guide imaging in high-risk patients aged 65 year and above.
Cases were identified from an inpatient trauma registry. Selection from allavailable cervical spine cases was not explicitly described, but only patients 65 years or older with non-penetrating trauma and who had confirmatorycervical imaging prior to death were eligible. Patients transferred to the traumacenter were also excluded to minimize referral center bias. Controls werechosen from among ED patients seen between 1995 and 2002 (admitted ordischarged) who were age 65 years or older, had blunt trauma with the absenceof cervical fracture, and who were not transferred to the ED. Statistical methods included simple logistic regression, forward stepwise multivariablelogistic regression modeling, recursive partitioning, receiver operator char-acteristic (ROC) curve analysis, and bootstrap validation techniques.
The incidence of cervical spine fracture was 2.6% among all the traumaregistry patients examined during the study period (n = 3958). One hundredthree cases and 107 control patient records were identified and included in the study. The final clinical prediction rule (Fig. 6.1) was able to stratifypatients according to cervical fracture risk and used the author definitions(Table 6.3).
Table 6.2 Performance of NEXUS low-risk criteria (NLC) among patients 65 years andolder from Touger et al.2
Sensitivity, % Specificity, %(95% CI) (95% CI) PPV (95% CI) NPV (95% CI)
Assessment result for 98.5 14.6 5.3 (5.2–5.3) 99.5 any cervical injury (94.8–99.7) (14.6–14.8) (98.3–99.9)
Clinically significant 100 14.7 4.9 (4.9–5.0) 100 cervical injury (97.1–100) (14.6–14.7) (99.1–100)
NPV, negative predictive value; PPV, positive predictive value.
9781405154000_4_006.qxd 19/03/2008 10:46 Page 55

56 Chapter 6: Cervical Spine Fractures in Older Adults
Focal neurologicaldeficit
(24.2%)
Age ≥65 years withblunt trauma (2.6%)
Noneurological
deficits
Severe headinjury
(7.9%)
Nosevere head
injury
Moderate energymechanism
(1.4%)
Low energymechanism
(0.4%)
High energymechanism
(3.4%)
Figure 6.1 Schematic of clinical prediction rule for cervical spine fractures in elderlypatients in a trauma registry from Bub et al.3 Percentages correspond to absolutecervical fracture risk.
Table 6.3 Definitions for clinical prediction rule from Bub et al.3
Criterion
Severe head injury
High energy mechanism
Moderate energy mechanism
Low energy mechanism
Definition
• intracranial hemorrhage• skull fracture• unconscious• all intubated patients
• fall from a height of 10 feet• pedestrian struck by an automobile• airplane accident• high speed motor vehicle injury (≥30 mph)
• low speed motor vehicle injury (<30 mph)• fall from <10 feet• skiing accident
• fall from standing or sitting position
9781405154000_4_006.qxd 19/03/2008 10:46 Page 56

Chapter 6: Cervical Spine Fractures in Older Adults 57
Comment one
It is clinically intuitive that older patients can have spine injuries from mechanisms and situations that may be not obvious. Older patients can incursignificant injuries from seemingly minor mechanisms such as falling out of achair or falling from standing. Furthermore, older patients may not reportsymptoms or circumstances in as clear a manner as younger patients becauseof underlying medical illness, dementia, and/or difficulty in communicating.The two secondary analyses from the NEXUS group focus on cervical spineinjuries in the elderly (≥65 years) and the very elderly (≥80 years). These twostudies reveal that using the NLC patients at low risk of cervical spine injurycan be identified with a very high sensitivity. While age is not an independentrisk factor in the NEXUS criteria, you should use common sense and intui-tion as to the likelihood of a cervical spine injury in older adults. There hasbeen one published case involving a 101-year-old patient in which applyingthe NEXUS criteria resulted in misclassifying a patient as being low risk for cervical spine injury.4 The CCR, on the other hand, has an age criterion(≥65 years) that prompts imaging regardless of other risk factors. There hasnot been an independent study examining only elderly patients with blunttrauma or a subset analysis of elderly patients from the CCR study performedto date.
The clinical prediction rule developed by Bub et al.3 has only been derivedand validated in the same dataset. At this point, we would exercise caution inusing this rule until it has been validated in an external setting. Additionallimitations about clinical usefulness include the absence of both reported test performance characteristics and the need for cervical imaging, and onlycervical spine fractures were identified. Furthermore, the rule itself is notexplicitly intuitive in what it accomplishes, other than to stratify the risk ofcervical fracture. The simple fact that all older patients are at risk of cervicalfractures given the data extracted in their study implies a more liberal imag-ing tendency rather that a selective approach, which was the goal of both theNEXUS and CCR studies.
Comment two
Geriatric patients with blunt trauma may be assessed with the NLC in orderto detect cervical spine injury with a high sensitivity. However, keep in mindthe physiologic and anatomic changes that occur with aging together with theknowledge that less overall force is needed to incur a significant injury. Whenevaluating older adults with potential cervical spine trauma, we would recom-mend employing a very conservative approach because of the higher likelihoodof clinically significant injuries, even in the context of minor trauma.
9781405154000_4_006.qxd 19/03/2008 10:46 Page 57

58 Chapter 6: Cervical Spine Fractures in Older Adults
References
1. Ngo, B., Hoffman, J.R. and Mower, W.R. (2000) Cervical spine injury in the veryelderly. Emergency Radiology 7(5): 287–291.
2. Touger, M., Gennis, P., Nathanson, N., et al. (2002) Validity of a decision rule toreduce cervical spine radiography in elderly patients with blunt trauma. Annals ofEmergency Medicine 40(3): 287–293.
3. Bub, L.D., Blackmore, C.C., Mann, F.A. and Lomoschitz, F.M. (2005) Cervicalspine fracture in patients 65 years and older: a clinical prediction rule for blunttrauma. Radiology 234(1): 143–149.
4. Barry, T.B. and McNamara, R.M. (2005) Clinical decision rules and cervical spineinjury in an elderly patient: a word of caution. Journal of Emergency Medicine 29(4):433–436.
9781405154000_4_006.qxd 19/03/2008 10:46 Page 58

59
Chapter 7 Cervical Spine Fractures in Children
Highlights
• The prevalence of traumatic cervical spine injuries in children is less than 1%.
• The National Emergency X-Radiography Utilization Study (NEXUS) low-risk
criteria (NLC) are highly sensitive but poorly specific in children older than
8 years old.
• There should be a low threshold for imaging nonverbal children and patients
with suspicious or high energy injury mechanisms.
• Large prospective studies are unlikely to be performed because of the low
prevalence of cervical spine injuries in children.
Background
Cervical spine injury in the pediatric population is a major concern in the setting of blunt trauma, albeit less common relative to adults. Imaging of thecervical spine is frequently used in children; however, very few (<1%) of casesare positive for cervical spine injuries.
Clinical question
“Are there decision rules for determining low risk for cervical spine injury in thepediatric patient?”There has been one large multicenter, prospective study carried out to examine a clinical decision rule for obtaining cervical spine radiographs inpediatric patients with blunt trauma.1 The study comprised a pre-specifiedanalysis of patients less than 18 years of age who were enrolled in NEXUS andinvolved applying the five-item NLC to them.2 If none of the criteria were
9781405154000_4_007.qxd 19/03/2008 10:47 Page 59
Evidence-Based Emergency Care: Diagnostic Testing and Clinical Decision Rules. J.M. Pines andW.W. Everett. 2008 Jesse M. Pines and Worth W. Everett, ISBN: 978-1-4051-5400-0.

60 Chapter 7: Cervical Spine Fractures in Children
present, the patient was considered low risk for cervical spine injury. Whenany one of the criteria was positive, the patient was classified as not low risk,and the decision rule hence recommended cervical imaging. Only patientswho underwent cervical imaging were included in NEXUS.
The NEXUS cohort was comprised of 34 069 patients and included 3065pediatric patients (9% of the total study cohort). The incidence of cervicalspine injury in the pediatric subgroup was 0.98% (n = 30). The distribution ofinjuries was mainly in the lower cervical spine.
Table 7.1 shows the performance of the NLC in children. A perfect sensiti-vity was achieved, but due the low number of actual injuries the confidenceintervals were wide (95% CI: 88–100). The authors point out that of the 603 (approximately 20%) patients that the NLC classified as low risk (i.e. forwhom the decision rule was negative), no cervical spine injury occurred.
Comment
In the only prospective study examining a decision rule regarding risk deter-mination for cervical spine injury in children with blunt trauma, Viccellio et al. validated the NLC as being highly sensitive. Exploration of their dataalso found no cases of spinal cord injury without radiographic abnormality(SCIWORA) in any child, which is always a lingering concern in the minds of clinicians. The authors are careful to note that there were 3000 patientswith 30 cervical spine injuries resulting in wide confidence intervals aroundthe test parameters, despite not missing any case of cervical spine injury. Theyfurther report that it would require a study of nearly 80 000 children to narrow the confidence intervals to within 0.5%, making it highly unlikelythey will ever improve on the current performance of the NLC in children.
Table 7.1 Test characteristics for the NEXUS low-risk criteria (NLC) in children fromViccellio et al.1
Radiographically Decision rule documented injury performance
Assessment result forany cervical injury Injury No injury Total 95% CI
Decision rule positive 30 2432 2462 Sensitivity 100% 87.8–100Specificity 19.9% 18.5–21.3
Decision rule negative 0 603 603 NPV 100% 99.2–100PPV 1.2% 0.8–1.8
Total 30 3035 3065
NPV, negative predictive value; PPV, positive predictive value.
9781405154000_4_007.qxd 19/03/2008 10:47 Page 60

Chapter 7: Cervical Spine Fractures in Children 61
A major concern clinicians may have is in applying the NLC in the infant(0–2 years) and toddler (2–8 years) groups, as they may be nonverbal or it may be difficult to accurately determine whether any individual item is present or absent. In fact, only 4 of the 30 cervical spine injuries occurred inpatients ≤8 years old. Despite this concern, at least one criterion was positiveamong these four patients. Differences between the cervical spine anatomiesare greatest during the infant/toddler and adolescent/adult developmentalstages; this partially explains why more cervical spine injuries occur in thelower cervical spine in the younger age groups and in the higher cervical spinein the older age groups.
Because of the very low prevalence of cervical spine injury in patients of 8 years or younger and the impracticality of performing a larger studyexamining pediatric patients, clinicians should use clinical judgment in thisyounger age group. We recommend applying the NLC in the verbal andcooperative patients above 8 years old. You should take care to exercise vigil-ance in ruling out cervical spine injuries in children because missed injuriescan lead to poor outcomes. If there is either a high-risk mechanism of injuryor a high suspicion for cervical spine injury based on clinical evaluation, wecertainly recommend obtaining objective neck imaging.
References
1. Viccellio, P., Simon, H., Pressman, B.D., et al. (2001) A prospective multicenterstudy of cervical spine injury in children. Pediatrics 108(2): E20.
2. Hoffman, J.R., Mower, W.R., Wolfson, A.B., Todd, K.H. and Zucker, M.I. (2000)Validity of a set of clinical criteria to rule out injury to the cervical spine in patientswith blunt trauma. National Emergency Radiography Utilization Study Group.New England Journal of Medicine 343(2): 94–99.
9781405154000_4_007.qxd 19/03/2008 10:47 Page 61

62
Chapter 8 Blunt Abdominal Trauma
Highlights
• There are many diagnostic tests available to evaluate the presence of
intra-abdominal injury in patients with blunt abdominal trauma including
computed tomography (CT) scans, focused assessment by sonography in
trauma (FAST), and diagnostic peritoneal lavage.
• FAST has high sensitivity and accuracy in adult patients and is a useful,
rapid, non-invasive adjunct that is used routinely in the evaluation of blunt
abdominal trauma.
• FAST is particularly useful in unstable trauma patients who cannot go
immediately for CT imaging.
• High clinical suspicion in the setting of a negative FAST should prompt
further evaluation by CT scanning or surgical exploration.
• Caution should be used with a negative FAST examination in pediatric
trauma patients due to poor sensitivity in this population.
Background
In the acutely injured patient with abdominal trauma, many diagnosticmodalities are available in the emergency department (ED) to detect the pre-sence of solid organ injuries and intra-abdominal bleeding. There have beenmany studies comparing abdominal ultrasound (US) with CT scans, most ofwhich have shown that CT is superior to US in detecting intra-abdominalinjuries. CT scanning does have drawbacks, primarily in that it can not besafely performed in unstable patients. In order to detect the presence of intra-abdominal bleeding, a diagnostic peritoneal lavage can be used for patientsthat are too unstable for a CT scan. However, over the past ten years diagnostic
9781405154000_4_008.qxd 19/03/2008 10:47 Page 62
Evidence-Based Emergency Care: Diagnostic Testing and Clinical Decision Rules. J.M. Pines andW.W. Everett. 2008 Jesse M. Pines and Worth W. Everett, ISBN: 978-1-4051-5400-0.
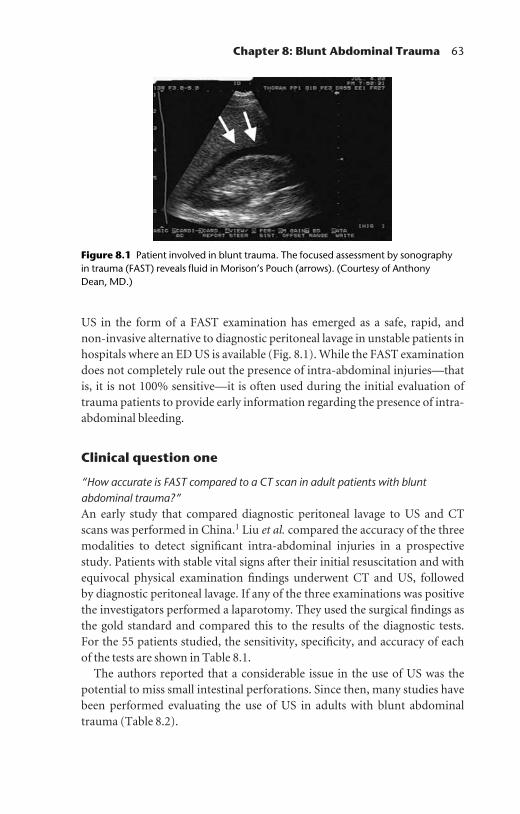
Chapter 8: Blunt Abdominal Trauma 63
US in the form of a FAST examination has emerged as a safe, rapid, and non-invasive alternative to diagnostic peritoneal lavage in unstable patients inhospitals where an ED US is available (Fig. 8.1). While the FAST examinationdoes not completely rule out the presence of intra-abdominal injuries—thatis, it is not 100% sensitive—it is often used during the initial evaluation oftrauma patients to provide early information regarding the presence of intra-abdominal bleeding.
Clinical question one
“How accurate is FAST compared to a CT scan in adult patients with bluntabdominal trauma?”An early study that compared diagnostic peritoneal lavage to US and CTscans was performed in China.1 Liu et al. compared the accuracy of the threemodalities to detect significant intra-abdominal injuries in a prospectivestudy. Patients with stable vital signs after their initial resuscitation and withequivocal physical examination findings underwent CT and US, followed by diagnostic peritoneal lavage. If any of the three examinations was positivethe investigators performed a laparotomy. They used the surgical findings as the gold standard and compared this to the results of the diagnostic tests. For the 55 patients studied, the sensitivity, specificity, and accuracy of each of the tests are shown in Table 8.1.
The authors reported that a considerable issue in the use of US was thepotential to miss small intestinal perforations. Since then, many studies havebeen performed evaluating the use of US in adults with blunt abdominaltrauma (Table 8.2).
Figure 8.1 Patient involved in blunt trauma. The focused assessment by sonography in trauma (FAST) reveals fluid in Morison’s Pouch (arrows). (Courtesy of Anthony Dean, MD.)
9781405154000_4_008.qxd 19/03/2008 10:47 Page 63

64 Chapter 8: Blunt Abdominal Trauma
A systematic review performed in 2001 aimed to determine the precisionand reliability of US in blunt abdominal trauma.7 The authors performed astatistical analysis and reported summary receiver operating characteristiccurves (SROCs) using weighted and robust regression models, with Q*denoting the shoulder of the curve, and calculated post-test probabilities as afunction of pooled likelihood ratios (LRs). They found that 30 of 123 trialswere eligible for their enrollment; these included data on 9047 patients. Theyalso found that ultrasonography showed a summary Q* value of 0.91 (where1.0 represents perfect sensitivity and specificity) and negative predictive values ranged from 72 to 99%. For screening for free fluid, the SROC was calculated at Q* = 0.89. They found that US detects the presence of organlesions, but does not adequately exclude abdominal injuries (LR− = 0.23).They calculated that given a pre-test probability of 50% (0.5) for bluntabdominal injury, a post-test probability of nearly 25% (0.25) remains in thecase of a negative US. They concluded that despite high specificity, US has a
Table 8.2 Test performance summaries of ultrasound to detect intra-abdominal injuryin blunt abdominal trauma
Sensitivity Specificity AccuracyAuthors N Patients (%) (%) (%)
Hoffmann et al.2 291 Severely injured 89 97 94(ISS >20)
McKenney et al.3 1000 Blunt trauma 88 99 97Rothlin et al.4 312 Blunt thoracic and 90.1* 99.5 —
abdominal injuryRozyski et al.5 476 Blunt abdominal 79 95.6 —
traumaDolich et al.6 2576 Blunt abdominal 86 98 97
trauma
* 98.1% for intra-abdominal fluid and 41.4% for solid organ injuries. ISS, injury severityscore.
Table 8.1 Comparison of test sensitivity, specificity and accuracy of computedtomography (CT) scans, diagnostic peritoneal lavage (DPL), and ultrasound (US) in 55 patients, using surgical findings as the gold standard from Liu et al.1
Sensitivity (%) Specificity (%) Accuracy (%)
CT scan 97.2 94.7 96.4DPL 100.0 84.2 94.5US 91.7 94.7 92.7
9781405154000_4_008.qxd 19/03/2008 10:47 Page 64

Chapter 8: Blunt Abdominal Trauma 65
low sensitivity for the detection of both free fluid and solid organ lesions. In cases where there is a suspicion of true intra-abdominal injury (i.e. a highpre-test probability), they concluded that another assessment (e.g. CT scan)must be performed regardless of the initial US findings.
Clinical question two
“Can FAST exclude intra-abdominal injuries in pediatric patients with blunttrauma?”Three studies have examined the sensitivity of FAST in detecting intra-abdominal injuries in pediatric patients requiring laparotomy.8 –10 In thesestudies, sensitivities ranged from 33 to 55%. Another study by Luks et al.reported a higher US sensitivity of 89% in a pediatric population; however, agold standard examination was not performed in all patients.11
Comment
The FAST examination performs with high sensitivity in the detection ofhemoperitoneum and is therefore useful in blunt abdominal trauma patientswho are unstable. In many Level I trauma centers, FAST has become a usefuladjunct in nearly all patients with blunt abdominal trauma—not just theunstable patients, and is part of the evaluation process following the primaryand secondary surveys. In centers where US is readily available, it has all but replaced diagnostic peritoneal lavage in unstable trauma patients withpotential hemoperitoneum. In cases of a high pre-test probability when thereis a suspicion of solid organ injury, and in children, the FAST examinationshould not be used as a gold standard and further testing or laparotomyshould be considered in consultation with a trauma surgeon.
References
1. Liu, M., Lee, C.H. and P’eng, F.K. (1993) Prospective comparison of diagnosticperitoneal lavage, computed tomographic scanning, and ultrasonography for thediagnosis of blunt abdominal trauma. Journal of Trauma 35: 267–270.
2. Hoffmann, R., Nerlich, M., Muggia-Sullam, M., et al. (1992) Blunt abdominaltrauma in cases of multiple trauma evaluated by ultrasonography: a prospectiveanalysis of 291 patients. Journal of Trauma 32: 452–458.
3. McKenney, M.G., Martin, L., Lentz, K., et al. (1996) 1000 consecutive ultrasoundsfor blunt abdominal trauma. Journal of Trauma 40: 607–610; discussion 611–612.
4. Rothlin, M.A, Naf, R., Amgwerd, M., et al. (1993) Ultrasound in blunt abdominaland thoracic trauma. Journal of Trauma 34(4): 488–495.
9781405154000_4_008.qxd 19/03/2008 10:47 Page 65
66 Chapter 8: Blunt Abdominal Trauma
5. Rozycki, G.S., Ochsner, M.G., Jaffin, J.H., et al. (1993) Prospective evaluation ofsurgeons’ use of ultrasound in the evaluation of trauma patients. Journal ofTrauma 34: 516–26; discussion 526–527.
6. Dolich, M.O., McKenney, M.G., Varela, J.E., et al. (2001) 2576 ultrasounds forblunt abdominal trauma. Journal of Trauma 50(1): 108–112.
7. Stengel, D., Bauwens, K., Sehouli, J., et al. (2001) Systematic review and meta-analysis of emergency ultrasonography for blunt abdominal trauma. BritishJournal of Surgery 88(7): 901–912.
8. Patel, J.C. and Tepas, J.J. (1999) The efficacy of focused abdominal sonography fortrauma (FAST) as a screening tool in the assessment of injured children. Journal ofPediatric Surgery 34: 44–47; discussion 52–54.
9. Mutabagani, K.H., Coley, B.D., Zumberge, N., et al. (1999) Preliminary experi-ence with focused abdominal sonography for trauma (FAST) in children: is it useful? Journal of Pediatric Surgery 34: 48–52; discussion 52–54.
10. Coley, B.D., Mutabagani, K.H., Martin, L.C., et al. (2000) Focused abdominalsonography for trauma (FAST) in children with blunt abdominal trauma. Journalof Trauma 48: 902–906.
11. Luks, F.I., Lemire, A., St-Vil, D., et al. (1993) Blunt abdominal trauma in children:the practical value of ultrasonography. Journal of Trauma 34: 607–611.
9781405154000_4_008.qxd 19/03/2008 10:47 Page 66
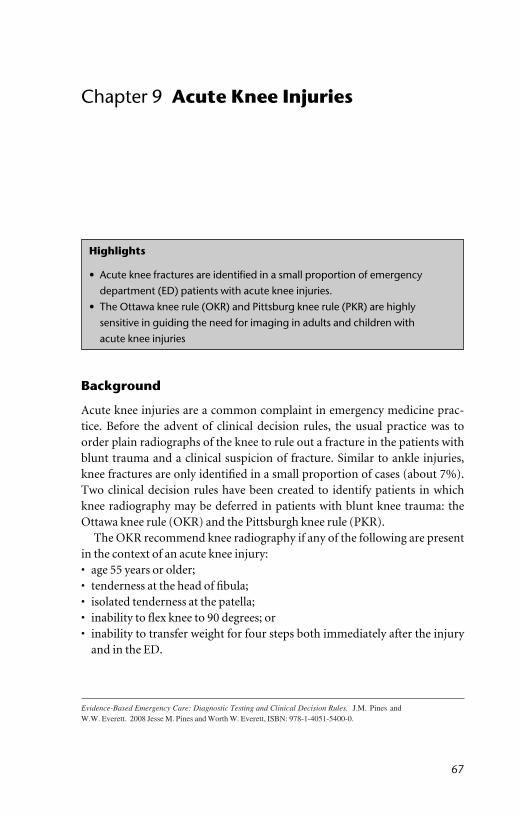
67
Chapter 9 Acute Knee Injuries
Highlights
• Acute knee fractures are identified in a small proportion of emergency
department (ED) patients with acute knee injuries.
• The Ottawa knee rule (OKR) and Pittsburg knee rule (PKR) are highly
sensitive in guiding the need for imaging in adults and children with
acute knee injuries
Background
Acute knee injuries are a common complaint in emergency medicine prac-tice. Before the advent of clinical decision rules, the usual practice was toorder plain radiographs of the knee to rule out a fracture in the patients withblunt trauma and a clinical suspicion of fracture. Similar to ankle injuries,knee fractures are only identified in a small proportion of cases (about 7%).Two clinical decision rules have been created to identify patients in whichknee radiography may be deferred in patients with blunt knee trauma: theOttawa knee rule (OKR) and the Pittsburgh knee rule (PKR).
The OKR recommend knee radiography if any of the following are presentin the context of an acute knee injury:• age 55 years or older;• tenderness at the head of fibula;• isolated tenderness at the patella;• inability to flex knee to 90 degrees; or• inability to transfer weight for four steps both immediately after the injury
and in the ED.
9781405154000_4_009.qxd 19/03/2008 10:48 Page 67
Evidence-Based Emergency Care: Diagnostic Testing and Clinical Decision Rules. J.M. Pines andW.W. Everett. 2008 Jesse M. Pines and Worth W. Everett, ISBN: 978-1-4051-5400-0.

68 Chapter 9: Acute Knee Injuries
Exclusion criteria for the OKR include: age <18, superficial skin injuries,injuries greater than seven days old, re-evaluation of recent injuries, alteredlevels of consciousness, paraplegia, or multiple injuries.
The PKR recommends radiography if the mechanism of injury is eitherblunt trauma or a fall and either:1. Age less than 12 years or above 50 years; or2. there is an inability to walk four weight-bearing steps in the ED.Exclusion criteria for the PKR are knee injuries occurring more than six daysbefore presentation, only superficial lacerations and abrasions, a history ofprevious surgeries or fractures on the injured knee, and those being reassessedfor the same injury.
Clinical question one
“How well do the OKR work in identifying patients that require kneeradiography?”This question was addressed in a recent systematic review of studies on theOKR, which included articles that reported patient information to determinelevels of sensitivity and specificity.1 Two independent reviewers independ-ently tallied data on study samples, the ways that the OKR was used, andmethodological characteristics. There were 11 studies identified; the data fromsix, involving 4249 adult patients, were considered appropriate for pooledanalysis. The results of this analysis were that the negative likelihood ratio was 0.05 (95% CI: 0.02–0.23), sensitivity was 98.5% (95% CI: 93.2–100), andspecificity was 48.6% (95% CI: 43.4–51.0). Given a knee fracture prevalenceof 7%, if the OKR are negative, this gives a probability of knee fracture of1.5%. Table 9.1 shows the data from the six studies reviewed, with reportedsensitivities and specificities.
Table 9.1 Six studies reporting sensitivity and specificity of the Ottawa knee rules
Sensitivity, % Specificity, % Reference Year (95% CI) (95% CI)
Steill2 1996 100 (94–100) 50 (46–53)Steill3 1997 100 (94–100) 48 (45–51)Richman4 1997 85 (65–96) 45 (39–52)Emparanza5 2001 100 (96–100) 52 (50–55)Szucs6 2001 100 (63–100) 47 (36–58)Ketelslegers7 2002 100 (87–100) 32 (26–38)
9781405154000_4_009.qxd 19/03/2008 10:48 Page 68

Chapter 9: Acute Knee Injuries 69
Clinical question two
“How do the OKR compare with the PKR?”A prospective study conducted at three academic centers investigated thisquestion.8 The decision whether to order radiographs was made based on thejudgment of the physician. All patients that underwent radiography had afour-view knee series (one anterior-posterior, one lateral, and two oblique)and a sunrise view added when patellar fractures were suspected. The perform-ance of the OKR and PKR was determined by using appropriate variablesfrom the data sheets and film reports from board-certified radiologists. There were a total of 934 patients evaluated and the OKR and the PKR wereapplicable to 745 and 750 patients, respectively. The main results of the studyare detailed in Table 9.2.
The difference in sensitivity was not significant; however, the PKR wasconsiderably more specific (33% difference; 95% CI: 28–38). However, twoelements of this study bring into question its validity. First, the authors failedto follow patients who did not undergo radiography, thus introducing apotential selection bias. However, in a previous study 357 patients with kneepain who did not have radiography were re-evaluated by a formal telephoneinterview two weeks later and none required clinical reassessment. A secondissue was that two of the three clinical sites were University of Pittsburgh-affiliated hospitals. Therefore, it is possible that the individual physicians may have already been using the PKR or OKR to make decisions in followingnormal procedures for determining who needed knee films.
Table 9.2 Study comparing the Ottawa knee rules (OKR) with the Pittsburgh kneerules (PKR) from Seaberg et al.8
NPV (%) Sensitivity, % (95% CI) Specificity, % (95% CI) PPV (%)
PKR 99.8 99 (94–100) 60 (56–64) 24.1OKR 98.5 97 (90–99) 27 (23–30) 14.8
NPV, negative predictive value; PPV, positive predictive value
Clinical question three
“How well do the OKR work in pediatric patients?”A recent study aimed to determine the sensitivity and specificity of the OKRin children.9 The authors performed a prospective, multicenter validationstudy and included children aged 2 to 16 years presenting to the ED with aknee injury sustained within the previous seven days. Physicians ordered
9781405154000_4_009.qxd 19/03/2008 10:48 Page 69

70 Chapter 9: Acute Knee Injuries
radiographs according to their usual practice and the outcome measure wasany fracture. Patients with negative films were followed for 14 days. A total of 750 were enrolled, 670 had radiography, and less than 10% (n = 70) hadfractures. The OKR were 100% sensitive (95% CI: 95–100), with a specificityof 42.8% (95% CI: 39–47). The authors concluded that the OKR is valid touse in children.
Comment
When deciding whether or not to order a knee film in the ED, both the PKRand the OKR can be used to identify adults and children who may not needknee films in the setting of an acute knee injury. The PKR is considerablymore specific and includes the mechanism of injury, which is an importantfeature for predicting fractures. Blunt knee injuries, including direct blows tothe knee and falls, account for 80% of knee fractures. When this type of injuryis present, patients are four-times more likely to have fractures.10 While thespecificity of the PKR is higher and may therefore result in less unnecessaryradiography, the sensitivity for both rules was near 100%, making both safefor use in the ED. In addition, the OKR were determined safe for use in onestudy in children.
References
1. Bachmann, L.M., Haberzeth, S., Steurer, J., et al. (2004) The accuracy of theOttawa knee rule to rule out knee fractures: a systematic review. Annals ofInternational Medicine 140: 121–124.
2. Stiell, I.G., Greenberg, G.H., Wells, G.A., et al. (1996) Prospective validation of adecision rule for the use of radiography in acute knee injuries. Journal of theAmerican Medical Association 275: 611–615.
3. Stiell, I.G., Wells, G.A., Hoag, R.H., et al. (1997) Implementation of the Ottawaknee rule for the use of radiography in acute knee injuries. Journal of the AmericanMedical Association 278: 2075–2079.
4. Richman, P.B., McCuskey, C.F., Nashed, A., et al. (1997) Performance of two clinical decision rules for knee radiography. Journal of Emergency Medicine 15:459–463.
5. Emparanza, J.I. and Aginaga, J.R. (2001) Validation of the Ottawa knee rules.Annals of Emergency Medicine 38: 364–368.
6. Szucs, P.A., Richman, P.B. and Mandell, M. (2001) Triage nurse application of theOttawa knee rule. Academic Emergency Medicine 8: 112–116.
7. Ketelslegers, E., Collard, X., Vande Berg, B., et al. (2002) Validation of the Ottawa knee rules in an emergency teaching centre. European Radiology 12: 1218–1220.
9781405154000_4_009.qxd 19/03/2008 10:48 Page 70

Chapter 9: Acute Knee Injuries 71
8. Seaberg, D.C., Yealy, D.M., Lukens, T., et al. (1998) Multicenter comparison oftwo clinical decision rules for the use of radiography in acute, high-risk kneeinjuries. Annals of Emergency Medicine 32: 8–13.
9. Bulloch, B., Neto, G., Plint, A., et al. (2003) Validation of the Ottawa knee rule inchildren: a multicenter study. Annals of Emergency Medicine 42: 48–55.
10. Dalinka, M.K., Alazraki, N.P., Daffner, R.H., et al. (2005) Expert Panel onMusculoskeletal Imaging. Suspected ankle fractures. American College of Radio-logy [WWW document]. URL http://www.guideline.gov/summary/summary.aspx?doc_id=8301
9781405154000_4_009.qxd 19/03/2008 10:48 Page 71

72
Chapter 10 Blunt Head Injury
Highlights
• The prevalence of computed tomography (CT) head scans that are positive
for clinically significant injury in the emergency department (ED) population
with minor head trauma is low.
• The New Orleans criteria (NOC) and Canadian CT head rule (CCHR) are
sensitive clinical decision rules that identify patients at low risk for clinically
significant head injuries where noncontrast head CT can be deferred.
• No decision rules have identified a population of older adults who are at low
risk for intracranial injuries following head trauma.
Background
There are more than 1.5 million cases of traumatic head injuries occurringannually in the US, with a mortality rate of 3–4%. Patients with minor headinjury, variably described as those having a Glasgow coma scale (GCS) scoreof 13–15 and a non-focal neurological examination, comprise the majority oftraumatic head injury cases seen and evaluated in EDs. Traditionally, patientswho have either a high-risk head injury or a loss of consciousness are evalu-ated with the use of nonconstrast head CT to identify fractures, intracranialbleeding, and other clinically significant injuries (Fig. 10.1). However, theoverall prevalence of clinically significant injuries is low in the ED popula-tion. Recent studies have focused on the identification of clinical factors that influence the likelihood of intracranial injury and researchers have constructed clinical decision rules to identify patients that do not requireevaluation with noncontrast head CT.
9781405154000_4_010.qxd 19/03/2008 10:48 Page 72
Evidence-Based Emergency Care: Diagnostic Testing and Clinical Decision Rules. J.M. Pines andW.W. Everett. 2008 Jesse M. Pines and Worth W. Everett, ISBN: 978-1-4051-5400-0.

Chapter 10: Blunt Head Injury 73
Clinical question one
“Which patients do not need a head CT after sustaining a minor head injury?”Five well-designed and large prospective studies have evaluated this ques-tion.1–5 The first of these to examine the problem and to create a set of clinicaldecision rules, known as the New Orleans criteria (NOC), was published in2000 by Haydel et al.1 In this study, patients presenting to a single inner-cityED were examined in order to identify those with minor head injury who didnot need to undergo noncontrast head CT. Enrolled patients were three yearsold or above, had loss of consciousness or amnesia after the incident, hadnormal neurological examinations, and a GCS of 15. A total of 1429 patientswere enrolled in the study and all underwent head CT. The initial portion of the study was a derivation phase that included 520 patients. Eight clinicalfindings collected during the study were determined a priori by the studyauthors as being associated with significant head injury. These includedheadache, age greater than 60 years, vomiting, drug or alcohol intoxication,deficits in short-term memory, post-traumatic seizure, coagulopathy, or evid-ence of trauma above the clavicles. Each criterion was explicitly defined by the authors. The presence or absence of each factor was determined beforethe head CT was performed. Head CTs were interpreted by radiologist whodid not have information about the clinical criteria being assessed. A positive
Figure 10.1 Epidural hematoma from a blunt head injury.
9781405154000_4_010.qxd 19/03/2008 10:48 Page 73

74 Chapter 10: Blunt Head Injury
head CT included acute intracranial hemorrhages and hematomas, cerebralcontusions, and depressed skull fractures. An analysis of the eight clinical factors determined that the presence of any one of seven factors yielded adecision rule that was 100% sensitive. The final set of clinical criteria thatwere tested on a validation cohort (n = 909) were as follows:• headache;• age 60 years or older;• vomiting;• drug or alcohol intoxication;• short-term memory loss;• seizure after the injury; and• evidence of trauma above the clavicles.The test results and decision rule performance are shown in Table 10.1.
Within a year of publishing the NOC, Canadian researchers led by IanStiell introduced the Canadian CT head rule (CCHR).2 This study examinedpatients presenting to 10 Canadian EDs within 24 hours of sustaining a blunthead trauma who had loss of consciousness, amnesia, or disorientation, andan initial GCS of 13 or above, in order to determine two outcome measures:the need for neurosurgical intervention (death and neurosurgical procedures)
Table 10.1 Performance of the New Orleans criteria (NOC) in the derivation andvalidation phases from Haydel et al.1
Head CT result Decision rule performanceNOC derivationcohort (n = 520) Injury No injury Total 95% CI
Decision rule positive 36 368 404 Sensitivity 100% 90–100(≥1 factor present) Specificity 24%Decision rule negative 0 116 116 NPV 100% 20–28(all factors absent) PPV 9%Total 36 484 520
NOC validation cohort (n = 909) Injury No injury Total
Decision rule positive 57 640 697 Sensitivity 100% 96–100Specificity 25%
Decision rule negative 0 212 212 NPV 100% 6–12PPV 8%
Total 57 852 909
CT, computed tomography; NPV, negative predictive value; PPV, positive predictive value.
9781405154000_4_010.qxd 19/03/2008 10:48 Page 74

Chapter 10: Blunt Head Injury 75
and clinically important brain injury requiring hospital admission and neurological follow-up (abnormal head CT requiring admission). Patientsunderwent either head CT or a structured outpatient telephone evaluation.The study employed derivation methods to examine 22 clinical factors ineach patient. The larger set of variables was ultimately distilled into a final setof seven clinical variables using statistical validation techniques. The sevenrisk factors were broken down into two categories according to the outcome.Five were used to classify patients as high risk for neurosurgical intervention:• GCS score of less than 15 at 2 hours after injury;• suspected open or depressed skull fracture;• two or more episodes of vomiting after injury;• any sign of basal skull fracture; and• age 65 years or above.Two more variables were added in order to classify patients as medium riskfor brain injury on head CT:• amnesia before impact of greater than 30 minutes; and• dangerous mechanism (pedestrian struck by motor vehicle, ejection from
motor vehicle, fall from a height of more than 3 ft or five stairs).Only patients with complete data were included in the analysis. The studyenrolled 3121 patients over three years. The overall prevalence of neurosurgicalintervention and brain injury on CT was 1.4 and 8.1%, respectively. When allfive high-risk factors were absent, no injuries requiring neurosurgical inter-ventions were missed, yielding a negative predictive value (NPV) of 100%(95% CI: 99–100; Table 10.2). When all seven risk factors were absent, fourintracranial injuries were missed, none requiring interventions, yielding aNPV of 99% (95% CI: 99.2–99.9; Table 10.2).
Canadian researchers followed the derivation/validation study with ahead-to-head study comparing the NOC with the CCHR.3 The study was performed in nine Canadian EDs and enrolled more than 2000 patients with over 300 practicing physicians involved. To make a fair, direct com-parison of the two clinical decision rules only the patients with a GCS of 15 were included; however, an analysis of the CCHR on the larger cohort was also performed (i.e. including patients with GCS of 13 or 14). Prior to carrying out a head CT scan, physicians completed a data form thatincluded both the NOC and CCHR. Outcomes were need for neurosur-gical intervention and clinically important brain injuries, similar to the priorstudy. Patients not undergoing head CT were followed up with a 14-day telephone interview. Only patients with complete data receiving head CT, or with complete data and a 14-day follow-up if they did not receive a headCT, were included for analysis. The incidence of neurosurgical inter-vention and clinically important brain injury was 0.4 and 5.3%, respectively.
9781405154000_4_010.qxd 19/03/2008 10:48 Page 75
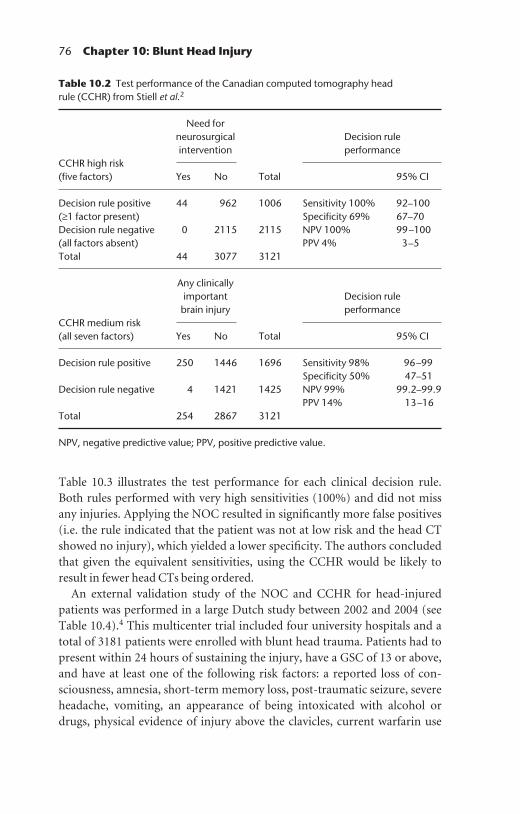
76 Chapter 10: Blunt Head Injury
Table 10.3 illustrates the test performance for each clinical decision rule. Both rules performed with very high sensitivities (100%) and did not missany injuries. Applying the NOC resulted in significantly more false positives(i.e. the rule indicated that the patient was not at low risk and the head CTshowed no injury), which yielded a lower specificity. The authors concludedthat given the equivalent sensitivities, using the CCHR would be likely toresult in fewer head CTs being ordered.
An external validation study of the NOC and CCHR for head-injuredpatients was performed in a large Dutch study between 2002 and 2004 (seeTable 10.4).4 This multicenter trial included four university hospitals and atotal of 3181 patients were enrolled with blunt head trauma. Patients had topresent within 24 hours of sustaining the injury, have a GSC of 13 or above,and have at least one of the following risk factors: a reported loss of con-sciousness, amnesia, short-term memory loss, post-traumatic seizure, severeheadache, vomiting, an appearance of being intoxicated with alcohol ordrugs, physical evidence of injury above the clavicles, current warfarin use
Table 10.2 Test performance of the Canadian computed tomography head rule (CCHR) from Stiell et al.2
Need for neurosurgical Decision rule intervention performance
CCHR high risk(five factors) Yes No Total 95% CI
Decision rule positive 44 962 1006 Sensitivity 100% 92–100(≥1 factor present) Specificity 69% 67–70Decision rule negative 0 2115 2115 NPV 100% 99–100(all factors absent) PPV 4% 3–5Total 44 3077 3121
Any clinically important Decision rulebrain injury performance
CCHR medium risk (all seven factors) Yes No Total 95% CI
Decision rule positive 250 1446 1696 Sensitivity 98% 96–99Specificity 50% 47–51
Decision rule negative 4 1421 1425 NPV 99% 99.2–99.9PPV 14% 13–16
Total 254 2867 3121
NPV, negative predictive value; PPV, positive predictive value.
9781405154000_4_010.qxd 19/03/2008 10:48 Page 76

Chapter 10: Blunt Head Injury 77
or a history of coagulopathy, or to have a neurological deficit. Note that allseven of the NOC criteria are included in the enrollment criteria for thisstudy. Given the differences in the inclusion criteria based on GCS, a separateanalysis was made for each clinical prediction rule based on the originaldescription. All patients included in the study underwent head CT and theinterpreting radiologist was not blinded to the data being collected. Physicianassessment was performed by a neurologist prior to head CT. The outcomeswere need for neurosurgical intervention within 30 days of the traumaticinjury, and traumatic injury detected on CT requiring hospitalization.
The authors concluded that both the NOC and CCHR performed with100% sensitivity, despite the application in a new setting and the slight differ-ences in the strictly-defined inclusion/exclusion criteria, and also the explicitdefinitions for each criterion in each rule. The specificities were much lowerfor each rule and may not result in fewer head CTs being ordered.
Table 10.3 Comparison of clinical decision rules for patients with a GCS of 15 fromStiell et al.3
CCHR NOCNeed for neurosurgical intervention Injury No injury Total Injury No injury Total
Decision rule positive 8 430 438 8 1595 1603Decision rule negative 0 1384 1384 0 219 219Total 8 1814 1822 8 1814 1822Sensitivity (95% CI) 100% (63–100); 100% (63–100); Specificity (95% CI) 76.3% (74–78) 12% (10–13)NPV (95% CI) 100% (99–100); 100% (98–100); PPV (95% CI) 1.8% (0.8–4) 0.5% (0.2–1)
CCHR NOCAny clinically importantbrain injury Injury No injury Total Injury No injury Total
Decision rule positive 97 853 950 97 1506 1603Decision rule negative 0 872 872 0 219 219Total 97 1725 1822 97 1725 1822Sensitivity (95% CI) 100% (96–100); 100% (96–100); Specificity (95% CI) 50% (48–53) 12% (11–14)NPV (95% CI) 100% (99–100); 100% (98–100); PPV (95% CI) 10% (8–12) 6% (5–7)
CCHR, Canadian computed tomography head rule; GCS, Glasgow coma scale; NOC, New Orleans criteria; NPV, negative predictive value; PPV, positive predictive value.
9781405154000_4_010.qxd 19/03/2008 10:48 Page 77

78 Chapter 10: Blunt Head Injury
The largest study to date to derive a clinical decision rule to identify pati-ents that are low risk for having intracranial injuries after blunt trauma camefrom the National Emergency X-Radiography Utilization Study (NEXUS) IIgroup.5 Patients were enrolled between 1999 and 2000 and the results werepublished in October 2005. The study consisted of a multicenter, prospective,observational study in 21 EDs of patients presenting with blunt trauma forwhich a head CT was ordered. Detailed clinical and mechanistic infor-mation on 19 variables was collected and recorded by physicians prior tohead CT. Patients not undergoing head CT at the discretion of the treatingphysician were not included in the study. The two outcomes that were exam-ined were the presence of a significant intracranial injury, defined as the need for neurosurgical intervention that might otherwise lead to a precip-itous deterioration or long-term neurological impairment, and minor headinjuries, defined as intracranial injuries among patients with a GCS of 15.This was a derivation study that used recursive partitioning to select the set
Table 10.4 External validation results comparing two clinical decision rulesperformances on a Dutch patient cohort with head injuries from Smits et al.4
CCHR NOCNeed for neurosurgicalintervention Injury No injury Total Injury No injury Total
Decision rule positive 7 1269 1276 2 1236 1238Decision rule negative 0 752 752 0 69 69Total 7 2021 2028 2 1305 1307Sensitivity (95% CI) 100% (59–100); 100% (15–100); Specificity (95% CI) 37% (35–39) 5% (4–6)NPV (95% CI) 100% (99–100); 100% (94–100); PPV (95% CI) 0.5% (0.2–1) 0.1% (0–0.6)
Neurocranial traumatic CT finding Injury No injury Total Injury No injury Total
Decision rule positive 171 1105 1276 115 1152 1267Decision rule negative 34 718 752 2 67 69Total 205 1823 2028 117 1219 1336Sensitivity (95% CI) 83% (77–88); 98% (94–99); Specificity (95% CI) 39% (37–41) 5% (4–7)NPV (95% CI) 95% (93–97); 97% (90–99); PPV (95% CI) 13% (11–15) 9% (7–11)
CCHR, Canadian computed tomography head rule; CT, computed tomography; GCS, Glasgow coma scale; NOC, New Orleans criteria; NPV, negative predictive value;PPV, positive predictive value.
9781405154000_4_010.qxd 19/03/2008 10:48 Page 78

Chapter 10: Blunt Head Injury 79
of clinical predictors that would maximize the sensitivity while optimizingthe specificity. No patient follow-up was described. A total of 13 728 patientswere enrolled, including 917 patients with intracranial injuries, of whom 330had a GCS of 15. Eight clinical variables were chosen that yielded the highestsensitivity with maximal specificity:• evidence of significant skull fracture;• scalp hematoma;• neurological deficit;• age 65 years and above;• altered level of consciousness;• abnormal behavior;• coagulopathy; and• persistent vomiting.
The performance of the NEXUS II head CT (HCT) rules is shown in Table 10.5. The highest sensitivity that was achieved for detecting any
Table 10.5 Performance of the NEXUS II head computed tomography (HCT) rule fromthe derivation study from Mower et al.5
NEXUS II HCT rules all intracranial injuries
Injury No injury Total
Decision rule positive 901 11 059 11 960Decision rule negative 16 1 752 1 768Total 917 12 811 13 728Sensitivity (95% CI) 98% (97–99)Specificity (95% CI) 13% (13–14)NPV (95% CI) 99% (98–99.5)PPV (95% CI) 7.5% (7–8)
NEXUS II HCT rules minor head injury (GCS 15)
Injury No injury Total
Decision rule positive 314 8 375 8 689Decision rule negative 16 1 752 1 768Total 330 10 127 10 457Sensitivity (95% CI) 95% (92–97)Specificity (95% CI) 17% (16–18)NPV (95% CI) 99% (98–99.5)PPV (95% CI) 3.6% (3–4)
GCS, Glasgow coma scale; NPV, negative predictive value; PPV, positive predictive value.
9781405154000_4_010.qxd 19/03/2008 10:48 Page 79

80 Chapter 10: Blunt Head Injury
intracranial injury was 98% (95% CI: 97–99) with a specificity of 13% (95%CI: 13–14). The authors concluded that the eight clinical factors were gooddiscriminators for identifying patients at high risk for traumatic brain injury.However, they also acknowledged that a prospective validation study wasneeded to further confirm their clinical prediction instrument.
Comments
Minor head injuries are a common ED complaint with a low prevalence of clinically significant injury and/or need for intervention following non-contrast head CT. Because the prevalence of injury is low, head CTs are oftennegative for these patients. The estimated prevalence of injury varies from 0.5 to 4% across the US. The CCHR and the NOC have been proposed to differentiate those who need a head CT after minor head injury from thosewho do not.
Since the introduction of these two clinical decision rules, both have beenreproduced and externally validated. Stiell and colleagues compared the tworules in a head-to-head study and found the sensitivities for both to be 100%.3
The specificities differed significantly, however, implying that fewer head CTs would be averted if applying only the NOC. The original NOC study wascriticized as not having any patient follow-up after discharge from the ED.This element is at least partially addressed in this comparison study, whichincluded outpatient follow-up for all of those patients not undergoing headCT. An inherent bias of the comparison study is the use of EDs that wereincluded in the development and derivation/validation studies, hence leadingto an enhanced familiarity with the CCHR over the NOC, despite the author’sexplanation to the contrary. But readers should find reassurance that overall,the two rules appropriately detected those patients with clinically meaningfultraumatic cranial injuries.
The NEXUS II HCT rules have only been derived and not validated, there-fore we cannot comment on their performance beyond the findings in theoriginal study. Readers will take specific note, however, of the similaritybetween the three sets of decision rules. All include evidence of head trauma,elderly patients, and vomiting as high-risk factors. Therefore regardless ofwhich rule is ultimately used, it is safe to assume that each of these factors isconcerning and not unique to the study setting.
The application of a decision rule in a clinical setting significantly differentfrom the one it was derived in is a major test in determining the ultimate usefulness of the rule in clinical practice. Dutch researchers took on the challenge and studied the performances of each clinical decision rule inDutch patients with head injuries.4 The difficulties of adapting a clinical
9781405154000_4_010.qxd 19/03/2008 10:48 Page 80

Chapter 10: Blunt Head Injury 81
decision rule to already established practice standards were handled well inthis study. Each rule performed with 100% sensitivity for detecting the need for neurosurgical intervention. The NOC had higher sensitivities forCT-detected injuries than did the CCHR, which the authors felt was likely tobe because of the restrictive definition for physical evidence of head trauma(only signs of basilar skull fracture or depressed skull fracture) in contrast to the broader criterion in the NOC (any evidence of trauma above the clavicles). In contrast, the specificities of the NOC were significantly lowerthan both the original study and the comparison by Stiell et al. This is becauseall of the NOC were included among the list of conditions a patient had to meet for eligibility.
Regardless, at this point the studies have shown the reproducibility andexternal validation of the rules in detecting the most important intracranialinjuries. What remains to be seen are the results of a formal impact analysisthat will determine if clinicians will actually use the rules and what theirimpact will be on ordering head CTs. Inconsistencies in the inclusion/exclu-sion criteria between studies, the absence of head CTs for all patients in theCanadian-based studies, and the ever-present legal ramifications of not want-ing to miss any intracranial injuries, raise concerns of translation of theseresults into confident clinical practice application.
A conservative approach that we suggest is to apply both the NOC and theCCHR to an individual patient. While it is more difficult to remember tworules than one, the overall sensitivity is likely to be higher if both are applied.If one or more of the risk factors are present, a head CT would be recom-mended. Additionally, if clinical judgment or other factors not described in these studies are present and the patient might have a serious injury, a head CT is warranted. However, the absence of all risk factors suggests anextremely low chance of a clinically significant head injury. Care should betaken to use clinical judgment when deciding what is or is not a dangerousmechanism and in making a reasonable judgment about whether their injuryjustifies a head CT. Furthermore, we would recommend strict follow-up precautions in all patients with minor head injuries and blunt head traumas,particularly those for whom a head CT was not ordered.
Clinical question two
“Are there decision rules for determining low risk for intracranial injury in theelderly patient?”There are no decision rules that have studied elderly patients in order todetermine if they are at low risk of intracranial injury. There is an advancedage criterion in the NOC (>60 years old), the CCHR (≥65 years old), and the
9781405154000_4_010.qxd 19/03/2008 10:48 Page 81

82 Chapter 10: Blunt Head Injury
NEXUS II HCT rules, designating these patients at high risk in the setting of blunt trauma. It is unlikely that future studies will focus exclusively on the elderly in this clinical context. Anatomic changes associated with aginginclude smaller brain volumes that predispose the patient to the developmentof hemorrhages. Changes in cognition as well as medication use (most notablyantiplatelet agents, anticoagulants, and antihypertensive agents) place theelderly patient at potentially higher risk for traumatic injuries from mechan-isms such as falls, in addition to the normal trauma mechanisms. Therefore, aclinical practice that includes obtaining a head CT for all patients with blunthead trauma who are elderly is supported by these authors.
References
1. Haydel, M.J., Preston, C.A., Mills, T.J., Luber, S., Bladeau, E. and DeBlieux, P.M.C.(2000) Indications for computed tomography in patients with minor head injury.New England Journal of Medicine 343(2): 100–105.
2. Stiell, I.G., Wells, G.A., Vandemheen, K., et al. (2001) The Canadian CT head rulefor patients with minor head injury. Lancet 357: 1391–1396.
3. Stiell, I.G., Clement, C.M., Rowe, B.H., et al. (2005) Comparison of the CanadianCT head rule and the New Orleans criteria in patients with minor head injury.Journal of the American Medical Association 294(12): 1511–1518.
4. Smits, M., Dippel, D.W.J., de Haan, G.G., et al. (2005) External validation of theCanadian CT head rule and the New Orleans criteria for CT scanning in patientswith minor head injury. Journal of the American Medical Association 294(12):1519–1525.
5. Mower, W.R., Hoffman, J.R., Herbert, M., Wolfson, A.B., Pollack, C.V. and Zucker,M.I. (2005) Developing a decision instrument to guide computed tomographicimaging of blunt head injury patients. Journal of Trauma 59(4): 954–959.
9781405154000_4_010.qxd 19/03/2008 10:48 Page 82

83
Chapter 11 Blunt Head Trauma in Children
Highlights
• Blunt head trauma in children is associated with significant morbidity and
mortality.
• Four sets of clinical decision rules to identify children at high risk of
intracranial injury from blunt head trauma have been derived: University of
California-Davis head computed tomography (HCT) rules, National
Emergency X-Radiography Utilization Study (NEXUS) II HCT rules, children’s
head injury algorithm for the prediction of important clinical events
(CHALICE) rules, and the Italian pediatric HCT rules.
• All are highly sensitive but none have been prospectively validated.
Background
Traumatic brain injury is a leading cause of morbidity and mortality in children and accounts for a significant proportion of ED visits and hospital-izations annually, which total in excess of one million for all trauma-relatedhead injuries. The concern of the physician seeing a child involved in atrauma is to establish the presence or absence of an intracranial injury. Effortsin North America and Europe have addressed the development of clinicaldecision rules for children with blunt head traumas to establish criteria toidentify patients who would be considered not low risk, and therefore forwhom head computed tomography (CT) imaging would be recommended.
Clinical question
“Are there decision rules for determining low risk for intracranial injury in pediatricpatients?”
9781405154000_4_011.qxd 19/03/2008 10:49 Page 83
Evidence-Based Emergency Care: Diagnostic Testing and Clinical Decision Rules. J.M. Pines andW.W. Everett. 2008 Jesse M. Pines and Worth W. Everett, ISBN: 978-1-4051-5400-0.
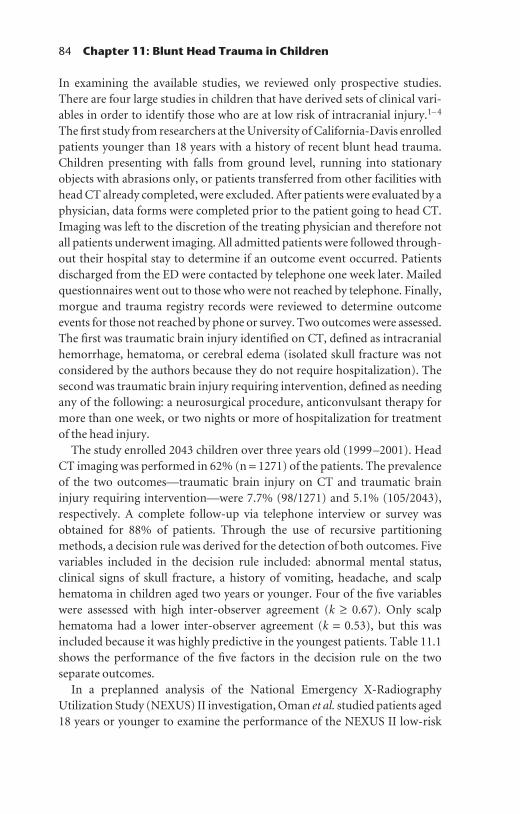
84 Chapter 11: Blunt Head Trauma in Children
In examining the available studies, we reviewed only prospective studies.There are four large studies in children that have derived sets of clinical vari-ables in order to identify those who are at low risk of intracranial injury.1– 4
The first study from researchers at the University of California-Davis enrolledpatients younger than 18 years with a history of recent blunt head trauma.Children presenting with falls from ground level, running into stationaryobjects with abrasions only, or patients transferred from other facilities withhead CT already completed, were excluded. After patients were evaluated by aphysician, data forms were completed prior to the patient going to head CT.Imaging was left to the discretion of the treating physician and therefore notall patients underwent imaging. All admitted patients were followed through-out their hospital stay to determine if an outcome event occurred. Patientsdischarged from the ED were contacted by telephone one week later. Mailedquestionnaires went out to those who were not reached by telephone. Finally,morgue and trauma registry records were reviewed to determine outcomeevents for those not reached by phone or survey. Two outcomes were assessed.The first was traumatic brain injury identified on CT, defined as intracranialhemorrhage, hematoma, or cerebral edema (isolated skull fracture was notconsidered by the authors because they do not require hospitalization). Thesecond was traumatic brain injury requiring intervention, defined as needingany of the following: a neurosurgical procedure, anticonvulsant therapy formore than one week, or two nights or more of hospitalization for treatmentof the head injury.
The study enrolled 2043 children over three years old (1999–2001). HeadCT imaging was performed in 62% (n = 1271) of the patients. The prevalenceof the two outcomes—traumatic brain injury on CT and traumatic braininjury requiring intervention—were 7.7% (98/1271) and 5.1% (105/2043),respectively. A complete follow-up via telephone interview or survey wasobtained for 88% of patients. Through the use of recursive partitioningmethods, a decision rule was derived for the detection of both outcomes. Fivevariables included in the decision rule included: abnormal mental status,clinical signs of skull fracture, a history of vomiting, headache, and scalphematoma in children aged two years or younger. Four of the five variableswere assessed with high inter-observer agreement (k ≥ 0.67). Only scalphematoma had a lower inter-observer agreement (k = 0.53), but this wasincluded because it was highly predictive in the youngest patients. Table 11.1shows the performance of the five factors in the decision rule on the two separate outcomes.
In a preplanned analysis of the National Emergency X-RadiographyUtilization Study (NEXUS) II investigation, Oman et al. studied patients aged18 years or younger to examine the performance of the NEXUS II low-risk
9781405154000_4_011.qxd 19/03/2008 10:49 Page 84

Chapter 11: Blunt Head Trauma in Children 85
head CT (HCT) rules on this population.2 The NEXUS II HCT rules aredescribed in detail in Chapter 10 (see Table 10.5 for performance results). In an adaptation suited for the study of children, only seven of the eight variables were evaluated (the advanced age criterion was dropped). NEXUS II enrolled 1666 children, all of whom underwent head CT. The outcomesevaluated were the same as for the larger NEXUS II study; i.e. clinicallyimportant intracranial injury (ICI) that required neurosurgical interventionor was likely to lead to significant long-term neurological impairment. Theprevalence of clinically significant ICI was 8.3% (138/1666). The perform-ance of the adapted NEXUS II HCT rules is shown in Table 11.2. Readersmust keep in mind that in this study the NEXUS II authors have used a deci-sion rule that was derived using a large cohort of patients (n = 13 728), and arenow presenting results of how that clinical decision rule performs in a subsetof the original study group. Therefore, it is not surprising that sensitivities are very high and the specificity is low, similar to the original NEXUS II study results.
Table 11.1 Performance measures of the University of California (UC)-Davis headcomputed tomography (HCT) rules for the derivation cohort from Palchak et al.1
UC-Davis HCT rules: traumatic brain Decision rule
injury on CT performance
Injury No injury Total 95% CI
Decision rule positive 97 870 967 Sensitivity 99% 94–100Specificity 26% 23–28
Decision rule negative 1 303 304 NPV 99.7% 99–100PPV 10% 8–12
Total 98 1173 1271
UC-Davis HCT rules: traumatic brain injury Decision rulerequiring intervention performance
Injury No injury Total 95% CI
Decision rule positive 105 1111 1216 Sensitivity 100% 97–100Specificity 43% 40–45
Decision rule negative 0 827 827 NPV 100% 99–100PPV 8.6% 7–10
Total 105 1938 2043
NPV, negative predictive value; PPV, positive predictive value.
9781405154000_4_011.qxd 19/03/2008 10:49 Page 85

86 Chapter 11: Blunt Head Trauma in Children
British researchers, also searching for a set of clinical predictors to identifychildren at low risk for clinically significant injury, created the children’s headinjury algorithm for the prediction of important clinical events (CHALICE)rule.3 This study examined children under 16 years old between 2000 and2002 that presented to EDs in 10 hospitals in the northwest of England withany history or sign of head injury. Only patients who refused to consent wereexcluded. Data was collected based upon 40 clinical variables. The primaryoutcome was a composite of death from head injury, requirement for neuro-surgical intervention, or marked abnormality on head CT. Abnormalities in CT imaging were defined as an acute, new traumatic ICI that includedintracranial hematomas, cerebral contusions, cerebral edema, and depressedskull fractures. Non-depressed skull fractures were specifically not includedas they were deemed not significant injuries and do not normally requireintervention or hospitalization. Similar to the Canadian CT head rule, thestudy did not mandate that all patients underwent CT. Patients who wereadmitted for inpatient stays, had a head CT or skull radiographs, or who under-went neurosurgery were followed up. At the end of the study all participating
Table 11.2 Performance of the National Emergency X-Radiography Utilization Study(NEXUS) II head computed tomography (HCT) rule in children from Oman et al.2
NEXUS II HCT rules: Decision ruleclinically important ICI performance
Injury No injury Total 95% CI
Decision rule positive 136 1298 1434 Sensitivity 98% 95–100Specificity 15% 13–17
Decision rule negative 2 230 232 NPV 99% 97–100PPV 9% 97–100
Total 138 1528 1666
NEXUS II HCT rules: clinically important Decision ruleICI − age <3 years performance
Injury No injury Total 95% CI
Decision rule positive 25 269 294 Sensitivity 100% 86–100Specificity 5% 3–9
Decision rule negative 0 15 15 NPV 100% 78–100PPV 8% 5–12
Total 25 284 309
ICI, intracranial injury; NPV, negative predictive value; PPV, positive predictive value.
9781405154000_4_011.qxd 19/03/2008 10:49 Page 86

Chapter 11: Blunt Head Trauma in Children 87
hospital radiology records were reviewed for skull radiographs and head CTs, and were cross-referenced with enrolled patients. The National Office of Statistics was also contacted regarding deaths in children with head injury. Recursive partitioning techniques were used to derive a set of clinicalvariables that would yield the highest possible sensitivity while trying toachieve maximal specificity.
This study, which is the largest of its kind dedicated to examining chil-dren, enrolled 22 772 patients. Only 744 patients underwent head CT. Theprevalence of clinically significant head injury was 1.2% (281/22 772). The CHALICE rule states that a head CT is indicated if the patient has:• a witnessed loss of consciousness lasting more than 5 min;• a history of amnesia with a duration in excess of 5 min;• abnormal drowsiness;• three of more episodes of vomiting after the injury;• a suspicion of non-accidental injury; or• a seizure after injury.Or if following examination any of the following are reported:• a GCS of less than 14, or less than15 if younger than 12 months old;• a suspicion of penetrating or depressed skull fracture, or bulging fontanelle;• signs of basal skull fracture;• focal neurological findings; or• a bruise, swelling, or laceration in excess of 5 cm if younger than 12 months
old.Or if the mechanism for injury is any of the following:• a high speed road traffic injury (>40 mph);• a fall from a height in excess of 3 m (10 ft); or• a high speed injury from a projectile or object.It consists of 14 criteria, with a head CT being indicated when any item is present. In this derivation study, the clinical prediction rule for detecting any clinically significant head injury performed with a sensitivity of 98.6%and a specificity of 86.9% (Table 11.3).
A group from Italy examined a cohort of children under 16 years oldinvolved in blunt head trauma presenting to pediatric EDs to determine predictors of the diagnosis of ICI and death.4 They enrolled 3806 patientsbetween 1996 and 1997 and derived a clinical prediction rule with five clinical variables. All patients discharged from the ED were followed up by phone after 10 days. Patients underwent routine care and ordering a head CT was at the discretion of the treating physician. The final variables includedin the prediction model include loss of consciousness, drowsiness, amnesia,prolonged headache, and evidence of basal or non-frontal skull fracture. Thepresence of any one of these clinical variables would classify a patient as high
9781405154000_4_011.qxd 19/03/2008 10:49 Page 87
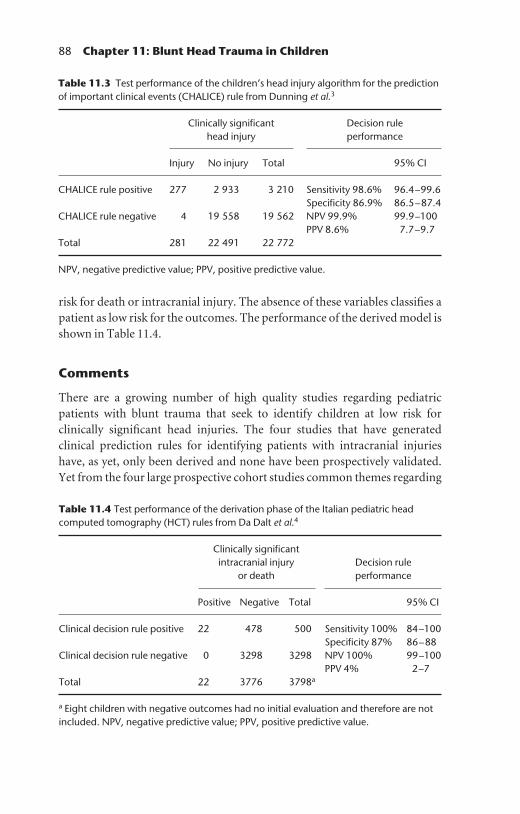
88 Chapter 11: Blunt Head Trauma in Children
risk for death or intracranial injury. The absence of these variables classifies apatient as low risk for the outcomes. The performance of the derived model isshown in Table 11.4.
Comments
There are a growing number of high quality studies regarding pediatricpatients with blunt trauma that seek to identify children at low risk for clinically significant head injuries. The four studies that have generated clinical prediction rules for identifying patients with intracranial injurieshave, as yet, only been derived and none have been prospectively validated.Yet from the four large prospective cohort studies common themes regarding
Table 11.3 Test performance of the children’s head injury algorithm for the predictionof important clinical events (CHALICE) rule from Dunning et al.3
Clinically significant Decision rulehead injury performance
Injury No injury Total 95% CI
CHALICE rule positive 277 2 933 3 210 Sensitivity 98.6% 96.4–99.6Specificity 86.9% 86.5–87.4
CHALICE rule negative 4 19 558 19 562 NPV 99.9% 99.9–100PPV 8.6% 7.7–9.7
Total 281 22 491 22 772
NPV, negative predictive value; PPV, positive predictive value.
Table 11.4 Test performance of the derivation phase of the Italian pediatric headcomputed tomography (HCT) rules from Da Dalt et al.4
Clinically significant intracranial injury Decision rule
or death performance
Positive Negative Total 95% CI
Clinical decision rule positive 22 478 500 Sensitivity 100% 84–100Specificity 87% 86–88
Clinical decision rule negative 0 3298 3298 NPV 100% 99–100PPV 4% 2–7
Total 22 3776 3798a
a Eight children with negative outcomes had no initial evaluation and therefore are notincluded. NPV, negative predictive value; PPV, positive predictive value.
9781405154000_4_011.qxd 19/03/2008 10:49 Page 88
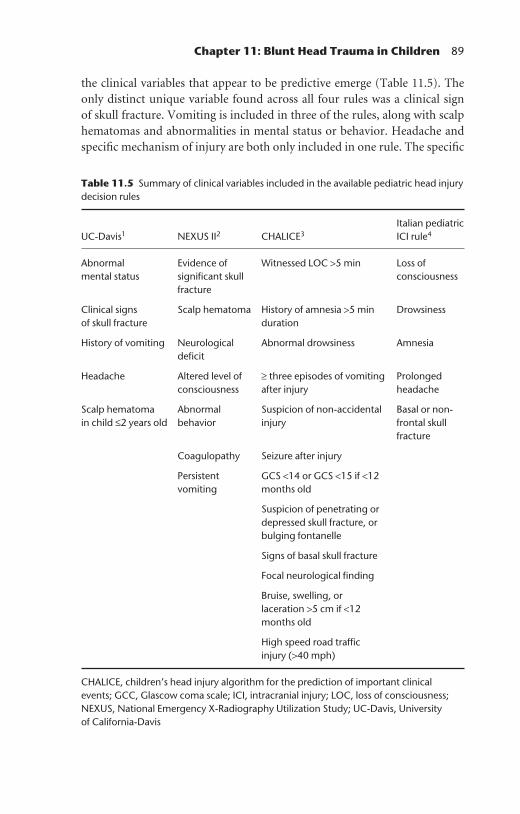
Table 11.5 Summary of clinical variables included in the available pediatric head injurydecision rules
UC-Davis1
Abnormal mental status
Clinical signs of skull fracture
History of vomiting
Headache
Scalp hematoma in child ≤2 years old
CHALICE, children’s head injury algorithm for the prediction of important clinicalevents; GCC, Glascow coma scale; ICI, intracranial injury; LOC, loss of consciousness;NEXUS, National Emergency X-Radiography Utilization Study; UC-Davis, University of California-Davis
Chapter 11: Blunt Head Trauma in Children 89
the clinical variables that appear to be predictive emerge (Table 11.5). Theonly distinct unique variable found across all four rules was a clinical sign of skull fracture. Vomiting is included in three of the rules, along with scalphematomas and abnormalities in mental status or behavior. Headache andspecific mechanism of injury are both only included in one rule. The specific
Italian pediatricICI rule4
Loss ofconsciousness
Drowsiness
Amnesia
Prolongedheadache
Basal or non-frontal skullfracture
CHALICE3
Witnessed LOC >5 min
History of amnesia >5 minduration
Abnormal drowsiness
≥ three episodes of vomitingafter injury
Suspicion of non-accidentalinjury
Seizure after injury
GCS <14 or GCS <15 if <12months old
Suspicion of penetrating ordepressed skull fracture, orbulging fontanelle
Signs of basal skull fracture
Focal neurological finding
Bruise, swelling, orlaceration >5 cm if <12months old
High speed road trafficinjury (>40 mph)
NEXUS II2
Evidence ofsignificant skullfracture
Scalp hematoma
Neurologicaldeficit
Altered level ofconsciousness
Abnormalbehavior
Coagulopathy
Persistentvomiting
9781405154000_4_011.qxd 19/03/2008 10:49 Page 89

90 Chapter 11: Blunt Head Trauma in Children
wording of each clinical variable differs between the rules and can influencethe performance and utility of the specific rule.5 While these studies involvedseparate pediatric populations in different countries across a span of years, itis likely that these are the important clinical variables that clinicians shouldelicit until validation and implementation studies are available. The preval-ence of intracranial injury in the studies ranged from 0.6–8.3%, and differspartially based on the definition of an injury. There is already evidence in theUS that ordering patterns of head CTs for pediatric patients with blunt headtrauma is increasing, and therefore the impact of evidence-based guidelinescould be significant.
Not every child evaluated will require a head CT. Associated with every CTthat is ordered are concerns over radiation exposure, the need for sedation inthe youngest patients, and time away or out of the ED. Issues of cost areimportant, but are secondary to the clinical issues of concern in our perspect-ive and should not be part of the decision-making process. Until validationand impact studies become available we recommend attention to the clinicalfactors listed in Table 11.5.
References
1. Palchak, M.J., Holmes, J.F., Vance, C.W., et al. (2003) A decision rule for identi-fying children at low risk for brain injury after blunt head trauma. Annals ofEmergency Medicine 42(4): 492–506.
2. Oman, J.A., Cooper, R.J., Holmes, J.F., et al., and for the NEXUS II Investigators.(2006) Performance of a decision rule to predict need for computed tomographyamong children with blunt head trauma. Pediatrics 117(2): 238–246.
3. Dunning, J., Daly, J.P., Lomas, J.P., Lecky, F., Batchelor, J., Mackway-Jones, K., andon behalf of the children’s head injury algorithm for the prediction of importantclinical events (CHALICE) study group. (2006) Derivation of the children’s headinjury algorithm for the prediction of important clinical events decision rule forhead injury in children. Archives of Disease in Childhood 91: 885–891.
4. Da Dalt, L., Marchi, A.G., Laudizi, L., et al. (2006) Predictors of intracranial injuriesin children after blunt head trauma. European Journal of Pediatrics 165: 142–148.
5. Sun, B.C., Hoffman, J.R. and Mower, W.R. (2007) Evaluation of a modified predic-tion instrument to identify significant pediatric intracranial injury after blunt headtrauma. Annals of Emergency Medicine 49: 325–32.
9781405154000_4_011.qxd 19/03/2008 10:49 Page 90

91
Chapter 12 Acute Ankle and Foot Injuries
Highlights
• The prevalence of ankle fractures among emergency department (ED)
patients with ankle sprain is about 15%.
• The Ottawa ankle rules (OAR) are a widely used, well-validated set of clinical
decision rules that accurately identify patients at low risk for fractures.
• The OAR have been shown to be highly sensitive in children; however, they
should be used in populations that can give a good verbal history of the
injury and that were able to walk prior to the injury.
Background
The management of patients with acute foot and ankle injuries is a commonpart of emergency medicine practice. The most common presentation is aninversion injury. Patients with these sorts of injuries can either have anklefractures, which are typically seen on a three-view ankle series, or foot frac-tures, which are seen on a three-view foot series. Depending on the site of theinjury and degree of tenderness, patients traditionally get an ankle series, afoot series, or both. However, the overall prevalence of fractures is relativelylow (about 15% of injuries). The recognition that a high proportion of X-raysare negative in patients with these injuries triggered the development of theOttawa ankle rules (OAR). The OAR were derived for the sensitivity to be100%, so that if the criteria for the rules are met, fractures can be effectivelyruled out based on the clinical evaluation and hence radiography can bedeferred.
9781405154000_4_012.qxd 19/03/2008 10:49 Page 91
Evidence-Based Emergency Care: Diagnostic Testing and Clinical Decision Rules. J.M. Pines andW.W. Everett. 2008 Jesse M. Pines and Worth W. Everett, ISBN: 978-1-4051-5400-0.

92 Chapter 12: Acute Ankle and Foot Injuries
For ankle radiography to be deferred the patient must undergo physicalexamination of ankle and must meet two criteria (Fig. 12.1):• ability to bear weight (four steps) immediately after the injury or in the
ED; and• absence of localized tenderness over the posterior aspect of either the distal
lateral or distal medial malleolus.For foot radiography to be deferred, the patient must undergo a physicalexamination and must meet two criteria (Fig. 12.2):• ability to bear weight (four steps) immediately after the injury or in the ED;
and• absence of localized tenderness over the navicular or the base of the fifth
metatarsal.In the OAR studies, patients were excluded if they had a delayed presentationof injury (greater than one week), altered mental status, or were pregnant.
The OAR is probably the best studied of all decision rules in emergencymedicine. The rules have been derived and validated in multiple settingsacross multiple cultures. The purpose of this chapter will be to briefly reviewthe evidence behind the OAR and to examine the use of the OAR in children.
An ankle X-ray series is only necessary if there is pain near the malleoli and any of these findings:
6 cm
Lateral Medial
1 Inability to bear weight bothimmediately and in emergencydepartment (four steps)
or2 Bone tenderness at the posterior
edge or tip of either malleolus
Figure 12.1 The Ottawa ankle rules. (Source: Journal of the American MedicalAssociation 1993; 269:1127. Copyright © 1993, American Medical Association. All rights reserved.)
9781405154000_4_012.qxd 19/03/2008 10:49 Page 92

Chapter 12: Acute Ankle and Foot Injuries 93
Clinical question one
“What is the extent of the evidence behind using the OAR to clinically excludefractures of the ankle and mid-foot?”In 2003, Bachmann et al. performed a systematic review and meta-analysis ofthe evidence behind the use of the OAR.1 The authors extracted data on thestudy population, the type of OAR used, and study methodology. The intentwas to calculate a pooled sensitivity for the decision rules. A bootstrappingmethod for statistical analysis was to ensure that their estimate of the stan-dard error was correct. They also calculated and pooled negative likelihoodratios for many subgroups and adjusted for methodological quality. Theyexcluded studies that had unknown blinding of the radiologist and those that were not prospective. For the 32 studies that met the inclusion criteriaand 27 reporting data on 15 581 patients, they calculated a negative likeli-hood ratio of 0.08 (95% CI: 0.03–0.18) for the ankle and 0.08 (95% CI:0.03–0.20) for the mid-foot. In children, the pooled negative likelihood ratiowas 0.07 (95% CI: 0.03–0.18). The data in Table 12.1 were tabulated as boot-strapped sensitivities and specificities with a focus on specific populations,prevalence of fracture, and time to referral (‘n’ denotes the number of studiesused to calculate the point estimate for the sensitivity or the median specificity.)
The authors calculated that applying these ratios to a 15% fracture prevalence yielded a less than 1.4% probability of actual fracture in these subgroups. The authors concluded that evidence supports the use of the OAR
A foot X-ray series is only necessary if there is pain in the mid-foot and any of these findings:
Lateral Medial
1 Inability to bear weight bothimmediately and in emergencydepartment (four steps)
or2 Bone tenderness at the navicular
or the base of the fifth metatarsal
Figure 12.2 The Ottawa foot rules. (Source: Journal of the American Medical Association 1993; 269:1127. Copyright © 1993, American Medical Association. All rights reserved.)
9781405154000_4_012.qxd 19/03/2008 10:49 Page 93
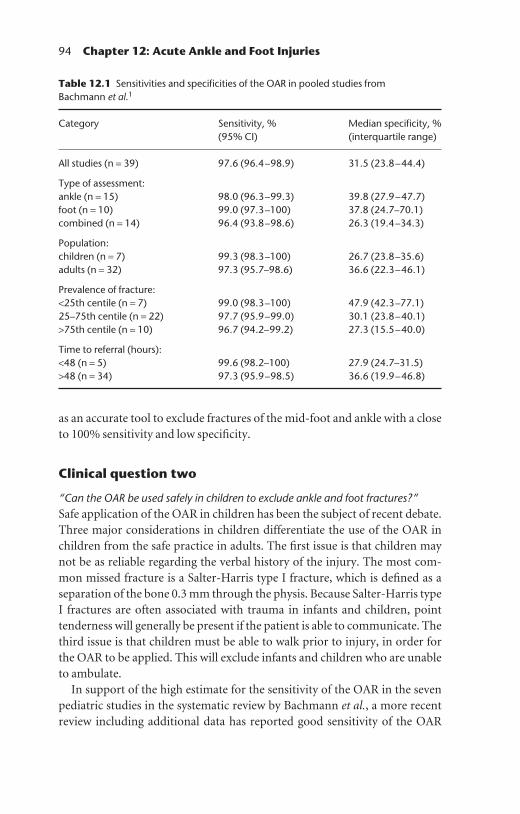
94 Chapter 12: Acute Ankle and Foot Injuries
as an accurate tool to exclude fractures of the mid-foot and ankle with a closeto 100% sensitivity and low specificity.
Clinical question two
“Can the OAR be used safely in children to exclude ankle and foot fractures?”Safe application of the OAR in children has been the subject of recent debate.Three major considerations in children differentiate the use of the OAR inchildren from the safe practice in adults. The first issue is that children maynot be as reliable regarding the verbal history of the injury. The most com-mon missed fracture is a Salter-Harris type I fracture, which is defined as aseparation of the bone 0.3 mm through the physis. Because Salter-Harris typeI fractures are often associated with trauma in infants and children, point tenderness will generally be present if the patient is able to communicate. Thethird issue is that children must be able to walk prior to injury, in order for the OAR to be applied. This will exclude infants and children who are unableto ambulate.
In support of the high estimate for the sensitivity of the OAR in the sevenpediatric studies in the systematic review by Bachmann et al., a more recentreview including additional data has reported good sensitivity of the OAR
Table 12.1 Sensitivities and specificities of the OAR in pooled studies from Bachmann et al.1
Category Sensitivity, % Median specificity, % (95% CI) (interquartile range)
All studies (n = 39) 97.6 (96.4–98.9) 31.5 (23.8–44.4)
Type of assessment:ankle (n = 15) 98.0 (96.3–99.3) 39.8 (27.9–47.7)foot (n = 10) 99.0 (97.3–100) 37.8 (24.7–70.1)combined (n = 14) 96.4 (93.8–98.6) 26.3 (19.4–34.3)
Population:children (n = 7) 99.3 (98.3–100) 26.7 (23.8–35.6)adults (n = 32) 97.3 (95.7–98.6) 36.6 (22.3–46.1)
Prevalence of fracture:<25th centile (n = 7) 99.0 (98.3–100) 47.9 (42.3–77.1)25–75th centile (n = 22) 97.7 (95.9–99.0) 30.1 (23.8–40.1)>75th centile (n = 10) 96.7 (94.2–99.2) 27.3 (15.5–40.0)
Time to referral (hours):<48 (n = 5) 99.6 (98.2–100) 27.9 (24.7–31.5)>48 (n = 34) 97.3 (95.9–98.5) 36.6 (19.9–46.8)
9781405154000_4_012.qxd 19/03/2008 10:49 Page 94

Chapter 12: Acute Ankle and Foot Injuries 95
in children.2 In the latter study, the authors calculated an overall sensitivity of 97% (95% CI: 93–100) and specificity of 29% (95% CI: 18–40). In all ofthe studies examined a prevalence of 12% was calculated. While one article in their review showed that a total of five patients who were rule negativeactually had a fracture, yielding a sensitivity of 83% (95% CI: 65–94),3 mostarticles had zero or one missed fracture in the pediatric population.
Comment
The OAR are very useful for clinically excluding fractures in both adult andpediatric populations and they have been validated in multiple settings. Inapplying the OAR to children, is important to only use the rules when chil-dren are able to communicate verbally and have the ability to walk prior tothe injury. In the pooled studies reviewed in this chapter, a small percentageof the patients that were excluded from receiving X-rays based on the OARdid actually have a fracture. However, given a prevalence of 12% in pediatricstudies and 15% in adult studies, a very low percentage of patients (less than 1.4%) will fall into this category. It is also unknown what the clinical relevance is of a subtle missed ankle fracture. Therefore, in the case of eithernegative ankle radiography or deferred ankle radiography because the patientdid not meet the OAR, we recommend that patients with significant soft tissue injuries be splinted, use ice and elevation, and use crutches to minimizethe discomfort of weight-bearing.
In the pediatric population, missed fractures will be of the Salter-Harristype I classification, which has almost no long-term consequence. As a note of caution, because the sensitivity for the rule is not 100%, in settings wherethe rule is negative and the pre-test probability is high, clinicians should use their best judgment in the decision to order foot and ankle X-rays.
References
1. Bachmann, L.M., Kolb, E., Koller, M.T., et al. (2003) Accuracy of Ottawa anklerules to exclude fractures of the ankle and mid-foot: systematic review. BritishMedical Journal 326(7386): 417.
2. Myers, A., Kanty, K. and Nelson, T. (2005) Are the Ottawa ankle rules helpful in ruling out the need for X-ray examination in children? Archives of Disease inChildhood 90: 1309–1311.
3. Clarke, K.D. and Tanner, S. (2003) Evaluation of Ottawa ankle rules in children.Pediatrics in Emergency Care 19: 73–78.
9781405154000_4_012.qxd 19/03/2008 10:49 Page 95

96
Chapter 13 Occult Scaphoid Fractures
Highlights
• Suspicion of scaphoid fracture is based on the mechanism of injury (fall on
outstretched hand) and physical examination findings.
• Plain radiography will miss 5–20% of initial scaphoid fractures in the
emergency department (ED).
• Missed scaphoid fractures can be associated with poor outcomes, including
non-union, delayed union, and avascular necrosis.
• Patients with negative films should be splinted using a thumb spica.
• Close follow-up should be planned for patients with potential scaphoid
fractures for follow-up re-evaluation, which may involve a repeat
examination or radiographic testing.
• MRI seems to be the most sensitive test for occult scaphoid fractures.
Background
The scaphoid, also commonly known as the carpal navicular, is the most frequently fractured carpal bone, accounting for approximately 70–80% ofall carpal fractures. Suspicion of a scaphoid fracture is based largely on apatient’s mechanism of injury, which in most cases is from a fall on an out-stretched hand (FOOSH). While not occurring exclusively in adolescenceand early adulthood, scaphoid fractures have their highest incidence in theseage groups. Scaphoid fractures occur infrequently in the very old and veryyoung. Physical findings, such as tenderness in the anatomic snuffbox, painwith axial loading of the ipsilateral thumb, and pain with supination againstresistance, have all been used as indications of a scaphoid fracture. Clinicians
9781405154000_4_013.qxd 19/03/2008 10:50 Page 96
Evidence-Based Emergency Care: Diagnostic Testing and Clinical Decision Rules. J.M. Pines andW.W. Everett. 2008 Jesse M. Pines and Worth W. Everett, ISBN: 978-1-4051-5400-0.
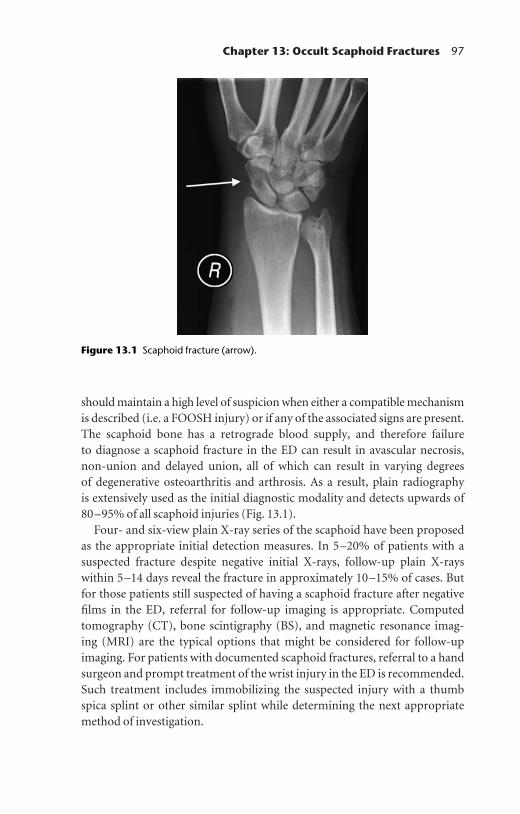
Chapter 13: Occult Scaphoid Fractures 97
should maintain a high level of suspicion when either a compatible mechanismis described (i.e. a FOOSH injury) or if any of the associated signs are present.The scaphoid bone has a retrograde blood supply, and therefore failure to diagnose a scaphoid fracture in the ED can result in avascular necrosis, non-union and delayed union, all of which can result in varying degrees of degenerative osteoarthritis and arthrosis. As a result, plain radiography is extensively used as the initial diagnostic modality and detects upwards of80–95% of all scaphoid injuries (Fig. 13.1).
Four- and six-view plain X-ray series of the scaphoid have been proposedas the appropriate initial detection measures. In 5–20% of patients with a suspected fracture despite negative initial X-rays, follow-up plain X-rayswithin 5–14 days reveal the fracture in approximately 10–15% of cases. Butfor those patients still suspected of having a scaphoid fracture after negativefilms in the ED, referral for follow-up imaging is appropriate. Computedtomography (CT), bone scintigraphy (BS), and magnetic resonance imag-ing (MRI) are the typical options that might be considered for follow-upimaging. For patients with documented scaphoid fractures, referral to a hand surgeon and prompt treatment of the wrist injury in the ED is recommended.Such treatment includes immobilizing the suspected injury with a thumbspica splint or other similar splint while determining the next appropriatemethod of investigation.
Figure 13.1 Scaphoid fracture (arrow).
9781405154000_4_013.qxd 19/03/2008 10:50 Page 97

98 Chapter 13: Occult Scaphoid Fractures
Clinical question
“Which diagnostic imaging modality is recommended next for a clinicallysuspected scaphoid fracture when the initial plain X-rays are negative or non-diagnostic?”Comparative studies for scaphoid fractures have focused on BS versus MRI.CT is generally not used when either BS or MRI is available, and therefore willnot be discussed here. Similarly, studies examining the potential of ultra-sound in diagnosing scaphoid fractures are starting to appear; however, thesestudies are limited based on sample sizes and diagnostic availability, and arealso not recommended at this time.
Studies of the optimal diagnostic modality to use for a suspected occultscaphoid fracture with negative initial X-rays have compared MRI and BS.The largest of the studies involved 61 patients with wrist injuries that had negative initial and 7–10 day follow-up X-rays. BS and MRI each detectedfour additional scaphoid fractures.1 Table 13.1 shows the diagnostic test characteristics for MRI and BS using a composite gold standard of MRI, BS,and follow-up X-rays.
Kitis et al. compared MRI and BS results performed 2–4 weeks after theinitial assessment in 22 patients with suspected scaphoid injuries but withnegative plain films.2 Scaphoid fractures were identified in three patients byboth MRI and BS; bone scanning detected one scaphoid fracture that MRImissed. Ten other non-scaphoid injuries were detected by MRI but not by BS.The authors concluded that both were sensitive tests, but that MRI hadgreater specificity for non-scaphoid injuries.
A small study in the Netherlands examined 16 patients with suspectedoccult scaphoid fractures using both MRI and BS, with the latter being
Table 13.1 Comparative studies of magnetic resonance imaging (MRI) and bonescintigraphy (BS) in the detection of occult scaphoid fractures
Sensitivity Specificity Reference Study n TP TN FP FN (95% CI) (95% CI)
MRI* 43 6 37 0 0 100% (54–100) 100% (94–100)BS* 43 5 35 2 1 83% (35–100) 95% (82–99)MRI^ 16 6 6 4 0 60% (26–87) 100% (54–100)
FN, false negative; FP, false positive; TN, true negative; TP, true positive.* From Fowler et al. 1998. The gold standard is considered to be a composite of eitherBS-positive (for MRI comparison) or MRI-positive (for BS comparison) and all X-rays.^ From Tiel-van Buul et al. 1996. The gold standard is considered to be BS.
9781405154000_4_013.qxd 19/03/2008 10:50 Page 98

Chapter 13: Occult Scaphoid Fractures 99
considered the gold standard.3 MRI had a sensitivity of 60% and a specificityof 100% (see Table 13.1), indicating that this technique was not superior toBS. While the sensitivity was calculated as 60%, only one true false negativeoccurred with MRI testing. Other MRI negative but BS positive patients wereconsidered based on the nonspecific BS readings. It is clear from this studythat MRI was able to delineate soft tissue and ligamentous injuries that werenot clear on BS.
Finally, Thorpe et al. studied 59 patients in the UK with suspected occultscaphoid fractures using both MRI and BS.4 All four scaphoid fracturesidentified by BS were also identified on MRI, plus other fractures. Threesignificant ligamentous injuries were diagnosed through MRI but were notseen on BS.
Comments
While plain X-rays detect the majority of scaphoid fractures on the initialevaluation, the long-term disability and the complications that arise fromnon-union or avascular necrosis are worrisome for clinicians. Repeat plainfilms in 7–10 days should detect a few fractures. The initial managementremains similar for definite and suspected but not proven scaphoid injuries,but debate over the next appropriate diagnostic study to order varies.
Based on the series of small studies examining both MRI and BS, it appearsthat MRI is as sensitive as BS and has superior specificity for detecting occultscaphoid fractures. MRI has the additional benefit of discretely differentiat-ing a soft tissue and ligamentous injury from a true bony injury with remark-able detail compared with bone scanning. Furthermore, the MRI results canbe used to help guide surgical intervention if indicated. Therefore MRI shouldbe the preferred follow-up diagnostic imaging study. MRI availability in the ED is typically not an issue in this case because the studies are not needed emergently. Both MRI and BS are available outpatient services.Patients should be immobilized with a thumb spica splint and follow-upshould be recommended for either repeat examination or further radio-graphic testing.
References
1. Fowler, C., Sullivan, B., Williams, L.A., et al. (1998) A comparison of bone scinti-graphy and MRI in the early diagnosis of the occult scaphoid wrist fracture. SkeletalRadiology 27: 683–687.
2. Kitsis, C., Taylor, M., Chandey, J., et al. (1998) Imaging the problem scaphoid.Injury 29(7): 515–520.
9781405154000_4_013.qxd 19/03/2008 10:50 Page 99

100 Chapter 13: Occult Scaphoid Fractures
3. Tiel-van Buul, M.M., Rookler, W., Verbeeten, B.W., et al. (1996) Magnetic reso-nance imaging versus bone scintigraphy in suspected scaphoid fracture. EuropeanJournal of Nuclear Medicine and Molecular Imaging 23(8): 971–975.
4. Thorpe, A.P., Murray, A.D., Smith, F.W., et al. (1996) Clinically suspected scaphoidfracture: a comparison of magnetic resonance imaging and bone scintigraphy.British Journal of Radiology 69(818): 109–113.
9781405154000_4_013.qxd 19/03/2008 10:50 Page 100

101
Chapter 14 Blunt Chest Trauma
Highlights
• Potential injuries in blunt chest trauma include cardiac contusion,
pneumothorax, hemothorax, lung contusion, diaphragmatic injury, and
injuries to the thoracic aorta.
• No formal decision rules have been validated to identify patients who are
at low risk for injuries; however, the findings of chest wall tenderness and
hypoxia are highly sensitive for injuries.
• Chest computed tomography (CT) identifies more injuries and should be
used in the setting of severely injured patients.
• Data on the use of troponin in detecting cardiac contusion is inconclusive
with some studies reporting high sensitivity but one study reports a very
low sensitivity (23%).
• Minor cardiac contusions, while detectable using troponin,
electrocardiogram (ECG) and echocardiography, are associated with no
adverse consequences.
Background
Patients with blunt chest trauma in the emergency department (ED) oftenrequire diagnostic testing to exclude potential injuries such as cardiac con-tusion, pneumothorax, hemothorax, lung contusion, diaphragmatic injuriesand injuries to the thoracic aorta. For patients with severe thoracic trauma,gold standard testing (i.e. CT angiography) is often undertaken because in70–90% multiple injuries are present.
There is a clinical divide between the ambulatory ED patient with a historyof blunt chest trauma and chest pain and the multi-injured trauma patient
9781405154000_4_014.qxd 19/03/2008 10:50 Page 101
Evidence-Based Emergency Care: Diagnostic Testing and Clinical Decision Rules. J.M. Pines andW.W. Everett. 2008 Jesse M. Pines and Worth W. Everett, ISBN: 978-1-4051-5400-0.
102 Chapter 14: Blunt Chest Trauma
because the probability of clinically significant injury is considerably differ-ent. Both patient groups are traditionally screened initially with chest radio-graphy (Fig. 14.1). When a patient is ambulatory or not severely injured, they can receive an upright posterior-anterior chest X-ray. By comparison,traditionally in the multi- or severely-injured patient, the initial diagnostictest is a supine anterior-posterior chest X-ray because these patients cannotsafely receive upright X-rays. In cases of severe chest trauma, most if not all will receive CT scans of the chest (Fig. 14.2). The initial screening supineX-ray is less sensitive than an upright chest X-ray for detecting thoracicinjuries. However, both can be useful in guiding initial management in terms of detecting thoracic injuries in the case of the multi-injured patient, ordeciding upon a screening test in patients with minor injuries.
Clinical question one
“Which ED patients need diagnostic chest X-rays following blunt chest trauma?”A recent pilot study investigated ED patients with blunt chest trauma to pre-dict intrathoracic injuries enrolled 507 patients with blunt chest trauma.1
The purpose was to use the results as the basis for the derivation of a clinicaldecision rule to identify patients at low risk for intrathoracic injuries fol-lowing blunt chest trauma. However, to date there has been no validation of this data as a clinical decision rule. The authors excluded patients less than 15 years old and those with penetrating trauma, isolated head trauma, or aGlasgow Coma Scale score below 14, and those for whom the trauma hadoccurred more than 72 hours before presentation. Providers filled out surveys prior to viewing radiographic results and documented the mechan-ism of injury and vital signs including oxygen saturation, patient symptoms,intoxication, distracting injuries, and the presence of visible chest wall injury, chest palpation tenderness, pain on lateral chest compression, crepitus,and abnormal chest auscultation. Significant intrathoracic injuries weredefined as pneumothoraces, hemothoraces, aortic injuries, two or more rib fractures, sternal fractures, or pulmonary contusions on blinded plainchest radiography. The prevalence of significant intrathoracic injury was6% (31 of 492 who had complete data). Tenderness to palpation and chest
pain had the highest sensitivity as individual criteria to predict significantinjuries (90%), and hypoxia was the most specific (97%). The combination of tenderness to palpation and hypoxia identified all significant injuries: sensitivity 100% (95% CI: 91–100); specificity 50% (95% CI: 45–54); positivepredictive value 12% (95% CI: 9–17); and negative predictive value 100%(95% CI: 99–100).
9781405154000_4_014.qxd 19/03/2008 10:50 Page 102

Chapter 14: Blunt Chest Trauma 103
Clinical question two
“How does a chest X-ray compare to a CT scan in excluding thoracic injury inpatients with blunt chest trauma?”Most studies addressing this question have been small and retrospective,involving trauma registries investigating severely injured trauma patients.
Figure 14.1 Chest X-ray from a patient with a traumatic aortic injury demonstrating awide mediastinum and blurring of the aortic arch, suggestive of an acute aortic injury.
Figure 14.2 A chest computed tomography (CT) was performed on the patient fromFigure 14.1 and reconstructions demonstrate a traumatic tear in the aorta (arrow) with a surrounding hematoma.
9781405154000_4_014.qxd 19/03/2008 10:50 Page 103

104 Chapter 14: Blunt Chest Trauma
One study of 112 patients with blunt chest trauma found that four of the ninepatients with acute aortic rupture had a normal mediastinum on the initialsupine chest X-ray, while helical CT scanning was diagnostic in eight out ofthe nine, and suggestive in one patient who had a brachiocephalic injury.2 Arecent study from Australia involved a two-year retrospective survey of 141 patients with an injury severity score (ISS) of greater than 15 (i.e. multi-injured trauma patients) and blunt trauma to the chest.3 Patients had both asupine chest X-ray and a CT of the chest. In patients with chest wall tender-ness they found that the CT chest X-ray was more likely to provide furtherdiagnostic information compared to a plain radiography (odds ratio, OR: 6.7; 95% CI: 2.6–17.7). In patients with reduced air entry, the CT was morelikely to add clinical information (OR: 4.5; 95% CI: 1.3–15.0), and similarlyin patients with an abnormal respiratory effort (OR: 4.1; 95% CI: 1.3–12.7).They also found that a CT scan was more effective than a routine chest X-rayin detecting lung contusions, pneumothoraces, mediastinal, hematomas, aswell as fractures (ribs, scapula, sternum and vertebrae).
A prospective study of 103 patients with chest trauma and a mean ISS of 30 (severely injured trauma patients) found that in 67 patients (65%), CTscanning detected major chest trauma complications that were missed onchest X-rays; of those 33 were lung contusions, 27 were pneumothoraces,seven were residual pneumothoraces after chest tube placement, 21 werehemothoraces, five were displaced chest tubes, two patients had diaphrag-matic ruptures, and one had a myocardial rupture.4 In 11 patients, minoradditional findings (dystelectasis, small pleural effusion) were visualized onCT scans, and in only 14 patients did chest X-rays and CT scans show thesame results.
Another study followed 93 consecutive trauma patients with blunt chesttrauma, all of which had anterior-posterior chest radiographs and helicalchest CTs.5 Chest radiography was abnormal in 73% of patients. In 13 of the 25 patients with normal chest radiography (52%), chest CTs demon-strated multiple injuries including two aortic lacerations and one pericardial effusion.
Clinical question three
“What is the role of troponin in excluding myocardial injury in blunt chesttrauma?”Patients with blunt chest trauma can sustain myocardial injuries. In severecases, this can be dramatic, involving hemodynamic instability. In minor cases,however, blunt cardiac injury can be an occult event because it can produce
9781405154000_4_014.qxd 19/03/2008 10:50 Page 104

Chapter 14: Blunt Chest Trauma 105
mild symptoms that may be attributed to the musculoskeletal trauma. Plain radiography (CT and X-ray) is often not helpful in diagnosing cardiaccontusions unless there is an associated great vessel or other intrathoracicinjury. Laboratory testing, ECG, and echocardiogram are often used to detectinjuries. Creatine kinase (CK) levels can be used; however, the detection ofcardiac injury in patients with blunt chest trauma can be difficult because levels of the isoenzyme CK-MB can be elevated as a result of skeletal muscleinjury.
Troponin I has emerged as a potential indicator of cardiac contusion. One study followed 44 patients with blunt chest trauma and suspected cardiac contusion.6 Patients underwent serial echocardiograms and troponinI testing. Six out of 44 (14%) had evidence of cardiac injury by echocardiogra-phy and all had elevations of CK-MB and troponin I. One patient had eleva-tions of both CK-MB and troponin I and was found to have a pericardialeffusion.
Another study followed 32 patients admitted with signs of acute bluntchest trauma.7 All patients underwent transesophageal echocardiographywithin 24 hours of injury and had serial troponin I measurements taken. A total of 17 (53%) of patients had abnormal troponin I (>0.4 ng/mL) levels,and 10 had levels of greater than 1 ng/mL. In six out of the ten with troponin,levels exceeding 1 ng/mL, there were segmental wall motion abnormalitiesconsistent with myocardial contusion. None of the patients with troponinlevels between 0.4 and 1 ng/mL had abnormal echocardiograms.
Another study followed 96 patients with blunt chest trauma that wereadmitted to a trauma center for evaluation.8 A total of 24 out of 96 (28%) hadmyocardial contusion diagnosed by echocardiogram (12), ECG (29), or both.Notably, all patients survived admission to hospital and were hemodynamic-ally stable. No patients died or had severe in-hospital cardiac complications.There were no differences in the percentage of patients with an elevated CK ratio (CK-MB/total CK) or CK-MB mass concentration among patientswith and without cardiac contusion. In patients with cardiac contusion, thepercentage of patients with elevated circulating troponin I and troponin T(defined as ≥0.1 µg/L) was higher (23% vs. 3%) In terms of predicting amyocardial contusion in blunt trauma patients, the respective sensitivity,specificity, and negative and positive predictive values were 23, 97, 77, and75%, respectively, for troponin I, and 12, 100, 74, and 100%, respectively, fortropinin T. The patients were followed for up to 18 months and 88% hadcomplete follow-up. There were no deaths from cardiac complications andnone of the patients had any long-term cardiac complications or myocardialfailures related to blunt chest trauma.
9781405154000_4_014.qxd 19/03/2008 10:50 Page 105

106 Chapter 14: Blunt Chest Trauma
Comment
The studies on blunt chest trauma reviewed here have considerable method-ological issues. Most have very small sample sizes and are retrospective. To date, there is no validated decision rule to identify patients who needradiography, nor are there large studies to differentiate patients who requirechest X-rays as opposed to CT scans. Through this review, however, itappears that a number of clinical themes have emerged. For example, in EDpatients with blunt chest trauma the prevalence of clinically significantinjuries is relatively low (6%) and clinical factors, such as the presence of tenderness to palpation and chest pain, may suggest the need for chest radio-graphy. In patients with severe chest trauma or a high index of suspicion for intrathoracic injury, CT scans seem to be the study of choice given thepotential for missed injuries on initial chest X-rays, especially given the highmiss rate (50%) in severely injured patients.
The data on myocardial contusion seems to be inconclusive. While somestudies have reported that troponin I is a sensitive marker for myocardialinjury, one study found that the sensitivity was only 23%. An interestingfinding was that in patients with minor contusions (without any hemo-dynamic instability) no patients had any clinical complications, indicating that the contusion, although detectable radiographically or by ECG, was notclinically significant. Certainly a larger study is needed before concluding thatobjective findings such as these are clinically benign.
References
1. Rodriguez, R.M., Hendey, G.M., Marek, G., et al. (2006) A pilot study to deriveclinical variables for selective chest radiography in blunt trauma patients. Annals ofEmergency Medicine 47: 415–418.
2. Demetriades, D., Gomez, H., Velmahos, G.C., et al. (1998) Routine helical com-puted tomographic evaluation of the mediastinum in high-risk blunt traumapatients. Archives of Surgery 133: 1084–1088.
3. Traub, M., Stevenson, M., McEvoy, S., et al. (2007) The use of chest computed tomo-graphy versus chest X-ray in patients with major blunt trauma. Injury 38: 43–7.
4. Trupka, A., Waydas, C., Hallfeldt, K.K., et al. (1997) Value of thoracic computedtomography in the first assessment of severely injured patients with blunt chesttrauma: results of a prospective study. Journal of Trauma 43: 405–411.
5. Exadaktylos, A.K., Sclabas, G. and Schmid, S.W. (2001) Do we really need routinecomputed tomographic scanning in the primary evaluation of blunt chest traumain patients with “normal” chest radiograph? Journal of Trauma 51: 1173–1176.
6. Adams, J.E., Davila-Roman, V.G., Bessey, P.Q., et al. (1996) Improved detection of cardiac contusion with cardiac troponin I. American Heart Journal 131(2):308–312.
9781405154000_4_014.qxd 19/03/2008 10:50 Page 106

Chapter 14: Blunt Chest Trauma 107
7. Mori, F., Zuppiroli, A., Ognibene, A., et al. (2001) Cardiac contusion in blunt chest trauma: a combined study of transesophageal echocardiography and cardiactroponin I determination. Italian Heart Journal 2: 222–227.
8. Bertinchant, J.P., Polge, A., Mohty, D., et al. (2000) Evaluation of incidence, clinicalsignificance, and prognostic value of circulating cardiac troponin I and T elevationin hemodynamically stable patients with suspected myocardial contusion afterblunt chest trauma. Journal of Trauma 48: 924–931.
9781405154000_4_014.qxd 19/03/2008 10:50 Page 107

108
Chapter 15 Occult Hip Fracture
Highlights
• Hip fractures will not be seen on initial plain X-rays in nearly 10% of patients
with hip pain after falls or trauma.
• Advanced imaging, either with computed tomography (CT) or magnetic
resonance imaging (MRI), should be used in cases of suspected occult
fracture.
Background
Hip fractures are common in the elderly population, with an incidence rate ofapproximately 250 000 per year. A large proportion of patients with hip frac-ture will present to the emergency department (ED) for evaluation and treat-ment, typically following a fall or an acute traumatic injury. The diagnosis ofhip fracture is normally not a diagnostic dilemma because plain radiographsare often confirmatory studies, particularly in patients with classic anatomicdeformities (Fig. 15.1). However, a small proportion of patients with hipfracture (2–9%) will initially have negative plain films. These ‘occult’ hipfractures are more common in the elderly because of the high prevalence ofosteoporosis. A diagnostic dilemma comes when there is a high clinical likeli-hood of hip fracture based on physical examination or history, and whenplain radiographs are either negative or equivocal. The classic case is an olderadult patient who has fallen, has hip tenderness, and can not bear any weighton the affected leg. A missed diagnosis of hip fracture can place elderlypatients at substantial risk of displacement, avascular necrosis, and subse-quently, for more involved surgical procedures.
9781405154000_4_015.qxd 19/03/2008 11:03 Page 108
Evidence-Based Emergency Care: Diagnostic Testing and Clinical Decision Rules. J.M. Pines andW.W. Everett. 2008 Jesse M. Pines and Worth W. Everett, ISBN: 978-1-4051-5400-0.

Chapter 15: Occult Hip Fracture 109
An approach to the diagnosis of occult hip fractures has evolved over thepast 10 years. Previously, repeat plain films or bone scans had been advocated.Bone scans will typically become positive 24 to 72 hours following an acutefracture. Patients who present to the ED with acute traumatic hip pain and who are unable to ambulate require further imaging to exclude occult hip fracture. The primary dilemma for the emergency physician is thereforewhether to order a CT scan of the hip or an MRI.
Clinical question
“Which is the optimal diagnostic modality when pursuing the diagnosis of occulthip fracture in the ED?”Since bone scanning can take days to become positive and serial plain filmsare not typically performed in the ED setting, we believe that these modalitiesare impractical as sensitive, rapid detection strategies for occult hip fracture.While there are cases series and retrospective studies that address this ques-tion indirectly, there are very few studies investigating whether a CT or MRI should be ordered.1 The literature primarily describes cases where MRI has been used to diagnose hip fractures, and cases reporting a negative CT followed by a positive MRI for fracture. The concern is that CT scans can miss very small impacted fractures of the femoral head and non-displaced
Jointcapsule
1
2
3
4 Extra-capsular3 Intertrochanteric4 Subtrochanteric
Intra-capsular1 Femoral head (capital)2 Femoral neck (subcapital)
Figure 15.1 Hip fractures. This illustration depicts the different types of proximalfemoral fractures. (Source: Knoop et al. Atlas of Emergency Medicine 2nd Edition © 2002.Reproduced with permission of The McGraw-Hill Companies.)
9781405154000_4_015.qxd 19/03/2008 11:03 Page 109

110 Chapter 15: Occult Hip Fracture
fractures that run parallel to the axial plane.2 One study assessed 13 elderlypatients that had suffered a fall and that had no evidence of a fracture on plainfilms.3 A total of six patients underwent CT and MRI, and seven underwentMRI only. In the six patients that had both studies, four of the CT imagesresulted in misdiagnosis due to inaccuracy. While this is a very small study, itdemonstrates that MRI is likely to be more sensitive than CT scanning whenevaluating patients with occult hip fracture. In the group that had MRI only,all seven patients received an accurate diagnosis of hip fracture.
A recent retrospective study sought to determine the prevalence of hip and pelvic fractures in ED patients with hip pain and negative initial radio-graphs.4 This was a retrospective study where plain films and MRIs wereordered at the discretion of the treating physician. A structured follow-up of 85% of the patients was conducted one month after the visit. Of the 545 patients who had negative initial radiographs, 11% underwent hip MRI during the ED visit and this identified 24 additional patients with hip frac-tures with good interobserver agreement among radiologists (Fig. 15.2). Therewere no patients in the one-month follow-up period that subsequently hadhip fractures identified.
(a) (b)
Figure 15.2 Occult hip fracture. (a) Anteroposterior radiograph of a 55-year-oldpatient on steroids who had right hip pain after a fall. No fracture is evident. (b) T1-weighted coronal magnetic resonance scan of the same hip clearly demonstrates anondisplaced intertrochanteric femoral shaft fracture (arrows). (Reproduced fromTintinalli et al. (2004) Tintinalli’s Emergency Medicine: A Comprehensive Study Guide6th Edition, with permission of The McGraw-Hill Companies.)
9781405154000_4_015.qxd 19/03/2008 11:03 Page 110

Chapter 15: Occult Hip Fracture 111
Comment
While are few reports in the literature that directly address whether CT orMRI is the optimal diagnostic test for investigating occult hip fractures, caseseries and retrospective studies support the use of MRI for this purpose. In fact, MRI is currently recognized as the gold standard for diagnosing hipfractures based on reported cases of negative CTs and positive MRIs. Addition-ally, the absence of any subsequent diagnoses of hip fracture over a one one-month follow-up in patients with negative MRIs in one study supports thebelief that this modality is close to 100% sensitive for fractures. However,MRI may not be available at all EDs, particularly during off-hours. Individualpatient and hospital circumstances should dictate whether a CT should beordered first because CTs can occasionally diagnose hip fractures that are not present on plain radiographs (Fig. 15.3). In situations where the plainfilms and the CT are negative for fracture and there is still a high clinical likelihood, then MRI should be ordered or the patient should be admitted for MRI, if it is not readily available in the ED.
References
1. Mlinek, E.J., Clark, K.C. and Walker, C. (1998) Limited magnetic resonance imag-ing in the diagnosis of occult hip fracture. American Journal of Emergency Medicine16: 390–393.
2. Perron, A.D., Miller, M.D. and Brady, W.J. (2002) Orthopedic pitfalls in the ED:Radiographically occult hip fracture. American Journal of Emergency Medicine 20:234–237.
(a) (b)
Figure 15.3 Intertrochanteric fracture was suspected on the left hip plain X-ray (a),and was confirmed with the noncontrast CT scan (b).
9781405154000_4_015.qxd 19/03/2008 11:03 Page 111

112 Chapter 15: Occult Hip Fracture
3. Lubovsky, O., Liebergall, M., Mattan, Y., et al. (2005) Early diagnosis of hip frac-tures: MRI versus CT scan. Injury 36: 788–792.
4. Dominguez, S., Liu, P., Roberts, C., et al. (2005) Prevalence of traumatic hip andpelvic fractures in patients with suspected hip fracture and negative initial standardradiographs – a study of emergency department patients. Academic EmergencyMedicine 12: 366–369.
9781405154000_4_015.qxd 19/03/2008 11:03 Page 112

SECTION 3
Cardiology
9781405154000_4_016.qxd 19/03/2008 11:02 Page 113
Evidence-Based Emergency Care: Diagnostic Testing and Clinical Decision Rules. J.M. Pines andW.W. Everett. 2008 Jesse M. Pines and Worth W. Everett, ISBN: 978-1-4051-5400-0.

115
Chapter 16 Heart Failure
Highlights
• The incidence of heart failure is high with nearly half a million new cases
annually in the US.
• Differentiating acute heart failure from chronic obstructive pulmonary
disease (COPD) or severe asthma is sometimes a challenge in the emergency
department (ED).
• Clinical impression is sensitive but nonspecific for heart failure, while an S3
heart sound and chest X-ray findings suggestive of heart failure are specific
but not sensitive.
• Elevated brain natriuretic peptide (BNP) levels can be informative, but are
not a definitive test for heart failure.
Background
Heart failure is a widespread disease that accounts for more than one mil-lion hospitalizations annually in the US, with nearly half a million new cases arising annually. Multiple models of the various pathophysiologic paradigmsof the cardiac decompensation process have been described and include car-diorenal and cardiocirculatory models, and neurohormonal levels.1 Briefly,the cardiorenal model describes heart failure as a process of peripheral edema resulting from decreased renal blood flow, which in turn is a result ofcardiac dysfunction. The cardiocirculatory model is based on a cascade ofevents starting with peripheral vasoconstriction resulting in reduced preload,ventricular wall stress, and arterial vasoconstriction leading to an increasedafterload. In turn, cardiac output drops and renal perfusion decreases result-ing in sodium retention and edema. Finally, the neurohormonal model
9781405154000_4_016.qxd 19/03/2008 11:02 Page 115
Evidence-Based Emergency Care: Diagnostic Testing and Clinical Decision Rules. J.M. Pines andW.W. Everett. 2008 Jesse M. Pines and Worth W. Everett, ISBN: 978-1-4051-5400-0.

116 Chapter 16: Heart Failure
acknowledges the role that neurohormones play when there is decreased cardiac function, increased vascular tone, and fluctuating volume retentionelements, all of which are found to some degree in most patients with heartfailure.
Heart failure is conceptually a syndrome with multiple possible etiologiesthat manifests clinically in a spectrum of signs and symptoms. Given thecomplex nature of the disease, we are challenged to use what is immediatelyavailable to us—the patient’s history and physical findings—and, when possible, diagnostic tests to confirm the diagnosis. However, an exhaustiveevaluation is not always possible and we must often begin treatment while the workup is getting started. The most common presentation of heart failure is a patient with new or progressive dyspnea, and the sensation of difficulty or increased effort in breathing. Indeed, most of us confronted with the dyspneic patient contemplate the diagnosis of heart failure versus primarypulmonary processes such as COPD or severe asthma. This review will focuson physical examination findings, including the presence of an S3 (ventricu-lar filling gallop), routine chest X-ray results, and BNP levels, that may beused to confirm or rule out the diagnosis of heart failure.
Clinical question
“Are the physical examination findings of an S3, chest X-ray, or BNP analysissufficiently predictive in establishing or excluding the diagnosis of heart failure in an acutely dyspneic patient?”
Figure 16.1 Chest X-ray showing cardiomegaly, prominent vascular markings, andinterstitial edema, consistent with congestive heart failure.
9781405154000_4_016.qxd 19/03/2008 11:02 Page 116
Chapter 16: Heart Failure 117
A meta-analysis in 2005 examined the accuracy of multiple factors (history,physical, diagnostic studies) in making the diagnosis of heart failure amongED patients with acute dyspnea.2 The pooled analysis examined only studieswith original data in which patients were aged 18 years or older, and in whichthere was a reference standard that included a panel of physician reviewersthat examined clinical data and cardiac studies to determine if the patient hadheart failure. Studies were excluded if they were population-based or reviewarticles, used only echocardiography or computed tomography (CT) scans asa reference standard, did not report clinical examination data, or did notspecifically state that patients with dyspnea were enrolled. Out of a total of815 citations, 18 studies were included in the analysis.
Overall, clinical impression was moderately specific (86%) as a diagnostictool, but insensitive (61%). The average likelihood ratios for the diagnosis ofheart failure were LR+ 4.4 (95% CI: 1.8–10) and LR− 0.45 (95% CI: 0.28–0.73).When considering specifically patients that had a history of asthma or COPDthe performance characteristics for overall clinical impression were 37% forsensitivity and 96% for specificity, and corresponding pooled likelihoodratios were LR+ 9.9 (95% CI: 5.3–18) and LR− 0.65 (95% CI: 0.55–0.77).
The presence of a third heart sound was highly specific (99%) in the diag-nosis of heart failure but not sensitive (13%), with corresponding pooledlikelihood ratios of LR+ 11.0 (95% CI: 4.9–25) and LR− 0.88 (95% CI: 0.83–0.94). Among patients with a specific history of asthma or COPD, sensitivitywas 17% and specificity 100%, and corresponding pooled likelihood ratioswere LR 57+ (95% CI: 7.6–425) and LR− 0.83 (95% CI: 0.75–0.91).
Chest X-rays that revealed pulmonary vascular congestion and interstitialedema (Fig. 16.1) were highly specific (96% and 97%, respectively), but neither were found to be sensitive (54% and 34%, respectively). Both wereassociated with very high LR+ and low LR− values: for pulmonary vascularcongestion LR+ was 12.0 (95% CI: 6.8–21) and LR− was 0.48 (95% CI:0.28–0.83), and for interstitial edema LR+ was 12.0 (95% CI: 5.2–27) andLR− was 0.68 (95% CI: 0.54–0.85).
BNP is a neurohormone that is secreted by cardiac ventricles under con-ditions of increased ventricular volume and pressure. An international, multicenter, prospective study examined ED patients with acute dyspnea toinvestigate the use of BNP as a marker for congestive heart failure.3 Clinicaldata was collected and blood samples were obtained for analysis. Patientswith a history of myocardial infarction or advanced renal failure wereexcluded due to the fact that BNP levels are known to be elevated in theseconditions. Patients with blunt or penetrating chest trauma or the presence ofa pneumothorax were also excluded. The final determination of heart failurewas made by two cardiologists who were blinded to the BNP levels. A history
9781405154000_4_016.qxd 19/03/2008 11:02 Page 117
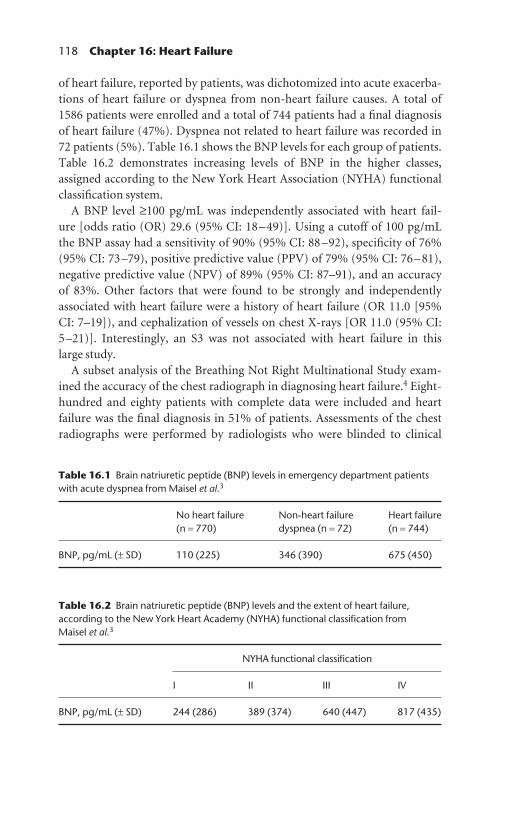
118 Chapter 16: Heart Failure
of heart failure, reported by patients, was dichotomized into acute exacerba-tions of heart failure or dyspnea from non-heart failure causes. A total of 1586 patients were enrolled and a total of 744 patients had a final diagnosis of heart failure (47%). Dyspnea not related to heart failure was recorded in 72 patients (5%). Table 16.1 shows the BNP levels for each group of patients.Table 16.2 demonstrates increasing levels of BNP in the higher classes,assigned according to the New York Heart Association (NYHA) functionalclassification system.
A BNP level ≥100 pg/mL was independently associated with heart fail-ure [odds ratio (OR) 29.6 (95% CI: 18–49)]. Using a cutoff of 100 pg/mL the BNP assay had a sensitivity of 90% (95% CI: 88–92), specificity of 76%(95% CI: 73–79), positive predictive value (PPV) of 79% (95% CI: 76–81),negative predictive value (NPV) of 89% (95% CI: 87–91), and an accuracy of 83%. Other factors that were found to be strongly and independently associated with heart failure were a history of heart failure (OR 11.0 [95% CI: 7–19]), and cephalization of vessels on chest X-rays [OR 11.0 (95% CI:5–21)]. Interestingly, an S3 was not associated with heart failure in this large study.
A subset analysis of the Breathing Not Right Multinational Study exam-ined the accuracy of the chest radiograph in diagnosing heart failure.4 Eight-hundred and eighty patients with complete data were included and heart failure was the final diagnosis in 51% of patients. Assessments of the chestradiographs were performed by radiologists who were blinded to clinical
Table 16.2 Brain natriuretic peptide (BNP) levels and the extent of heart failure,according to the New York Heart Academy (NYHA) functional classification from Maisel et al.3
NYHA functional classification
I II III IV
BNP, pg/mL (± SD) 244 (286) 389 (374) 640 (447) 817 (435)
Table 16.1 Brain natriuretic peptide (BNP) levels in emergency department patientswith acute dyspnea from Maisel et al.3
No heart failure Non-heart failure Heart failure (n = 770) dyspnea (n = 72) (n = 744)
BNP, pg/mL (± SD) 110 (225) 346 (390) 675 (450)
9781405154000_4_016.qxd 19/03/2008 11:02 Page 118

Chapter 16: Heart Failure 119
findings. Specific chest radiograph findings of alveolar edema, interstitialedema, alveolar edema, cephalization, and cardiomegaly were present in 4%,15%, 23%, and 50% of the patients, respectively. The authors also includeddata on the presence of a third heart sound, which was present in 7% ofpatients. Table 16.3 shows the univariate performance characteristics of thechest radiograph and S3 findings. Multivariate logistic modeling, performedusing all of the clinical, historic, radiographic, and BNP data, found that threechest X-ray findings were significantly associated with a diagnosis of heartfailure: interstitial edema had an OR of 7.0 (95% CI: 2.9–17), cephalizationhad an OR of 6.4 (95% CI: 3.3–12.5), and cardiomegaly had an OR of 2.3 (95% CI: 1.4–3.7).
Collins et al. recently compared physician auscultation of heart soundswith electronically detected heart sounds in order to assess the utility of thethird heart sound in diagnosing heart failure.5 Using a convenience sample ofpatients in four EDs presenting with signs or symptoms of heart failure, theauthors compared prospectively recorded physician determination of thepresence/absence of a third heart sound with electronically recorded heartsounds that were analyzed in a blinded fashion after the patient encounter.The final diagnosis of heart failure was made by two senior cardiologists whohad copies of the complete patient charts, edited to remove all heart soundand BNP data. The electronic heart sound was taken as the criterion standardin the comparison against physician-determined auscultation for the thirdheart sound.
A total of 439 patients were enrolled and 343 were included in the finalanalysis. Excluded patients were either pilot subjects or those for which therewere problems in obtaining or interpreting electronic heart sound data.Acute heart failure was the final diagnosis in 133 (39%) patients. Table 16.4
Table 16.3 Diagnostic performance of variables used for predicting heart failure fromKnudsen et al.4
Odds ratio Sensitivity Specificity(95% CI) % % LR+ LR−
CXR findingsAlveolar edema 7.1 (2.5–20.6) 6 99 7.0 1.0Cephalization 15.4 (9.4–25.3) 41 96 9.4 0.6Cardiomegaly 15.4 (11.1–21.3) 79 80 4.0 0.3Interstitial edema 17.1 (8.6–34.2) 27 98 12.7 0.7
Clinical findingsS3 9.1 (4.1–20) 13 98 8.1 0.9
CXR, chest X-ray.
9781405154000_4_016.qxd 19/03/2008 11:02 Page 119

120 Chapter 16: Heart Failure
shows the performance characteristics for both auscultation and electronicallydetected S3. The test characteristics did not change significantly when patientswith a past history of heart failure were excluded.
The limitations of this study included the method of patient enrollment—convenience sampling, which may have resulted in a selection bias. The lackof blinding of the examining physician to the rest of the clinical informationand findings could have also lead to biased reporting of auscultated heartsounds.
Comments
The accurate diagnosis of acute heart failure is the primary goal of acute carephysicians when evaluating dyspneic patients. Evaluation of the presence of athird heart sound has been repeatedly shown to be highly specific, but lackingin sensitivity. This means that determination of the presence of a third heartsound can yield rapid information for the clinician; in other words, if youdetect an S3 in the setting of appropriate clinical presentation, you can pre-dict with moderately high confidence that the patient has acute heart failure.Furthermore, a small study comparing bedside auscultation to electronicallyrecorded and interpreted heart tones indicates that physical examination isreliable. However, physical diagnosis with a reliance on patient interviews andphysical examinations should continue to be the bedrock for clinical medicine.
The plain chest radiograph can contribute additional data regarding thelikelihood of acute heart failure. Findings of interstitial and alveolar edema,
Table 16.4 Test parameters for auscultated and electronically detected S3 in patientswith acute heart failure (HF) from Collins et al.5
Auscultated Electronically detected
Acute HF Acute HF Total Acute HF Acute HF Total(+) (−) (+) (−)
S3 present (+) 21 7 28 45 14 59S3 absent (−) 107 200 307 88 196 284Total 128 207 335 133 210 343Sensitivity, % (95% CI) 16 (11–24) 34 (26–43)Specificity, % (95% CI) 97 (93–99) 93 (89–96)PPV, % (95% CI) 84 (76–89) 66 (57–74)NPV, % (95% CI) 3 (2–7) 7 (4–11)Diagnostic accuracy, 66 (61–71) 70 (65–75)% (95% CI)
NPV, negative predictive value; PPV, positive predictive value.
9781405154000_4_016.qxd 19/03/2008 11:02 Page 120

Chapter 16: Heart Failure 121
vascular redistribution in the form of cephalization, as well as cardiomegaly,are all highly specific for the diagnosis of acute heart failure. However, theabysmally low sensitivity of these methods should deter the clinician from atotal reliance on chest radiography in the setting of a normal or non-diagnosticX-ray.
Elevated BNP levels can further help us to diagnose acute heart failure,especially when presented in conjunction with other features, such as radio-graphic findings or the presence of an S3. We do though offer a word of caution about the use of BNP as a diagnostic marker: conditions that cause anelevation in right-heart pressures in the acute setting (as in acute myocardialinfarction, pulmonary embolism) or in the chronic setting (cor pulmonale orpulmonary hypertension), as well as systemic conditions that cause volumeoverload, as in the case of an end-stage renal disease patient on hemodialysis,can also be associated with elevated BNP levels. Therefore, when using elevated BNP as a diagnostic test for acute heart failure, results should beinterpreted with these other conditions listed on the differential diagnosis.
Rapid assessment of the acute dyspneic patient using a solid physical examination, plain chest radiography, and analysis of BNP levels if possible,can assist clinicians in tailoring appropriate therapies for acute heart failure.However, further testing is recommended in order to establish left ventricu-lar function and to rule out proximal causes of acute heart failure, and thisshould prompt inpatient admissions in most cases.
References
1. Chung, P. and Hermann, L. (2006) Acute decompensated heart failure: formulat-ing an evidence-based approach to diagnosis and treatment (Part 1). Mount SinaiJournal of Medicine 73(2): 506–515.
2. Wang, C.S., FitzGerald, J.M., Schulzer, M., Mak, E. and Ayas, N.T. (2005) Does this dyspneic patient in the emergency department have congestive heart failure?Journal of the American Medical Association 294(15): 1944–1956.
3. Maisel, A.S., Krishnaswamy, P., Nowak, R.M., et al. and for the Breathing NotProperly Multinational Study Investigators (2002) Rapid measurement of B-typenatriuretic peptide in the emergency diagnosis of heart failure. New England Journalof Medicine 347(3): 161–167.
4. Knudsen, C.W., Omland, T., Clopton, P., et al. (2004) Diagnostic value of B-typenatriuretic peptide and chest radiographic findings in patients with acute dyspnea.American Journal of Medicine 116: 363–368.
5. Collins, S.P., Lindsell, C.J., Peacock, W.F., et al. (2006) The combined utility of an S3 heart sound and B-type natriuretic peptide levels in emergency departmentpatients with dyspnea. Journal of Cardiac Failure 12(4): 286–292.
9781405154000_4_016.qxd 19/03/2008 11:02 Page 121

122
Chapter 17 Syncope
Highlights
• Patients with syncope can appear clinically benign in the emergency
department (ED), but a small proportion will have life-threatening
conditions.
• The San Francisco syncope rule has been derived and validated for
identifying patients at a high risk of serious outcomes, and can help risk
stratify patients with syncope.
• Because the San Francisco syncope rule was shown to be insensitive in
an external validation study, it cannot be recommended at this time as a
definitive guide for admission decisions.
Background
Syncope is a transient loss of consciousness associated with a return to pre-existing neurological function and accounts for up to 3% of all ED visits.Syncope is a symptom that has a wide variety of causes, ranging from thebenign to the life-threatening. The evaluation of syncope poses a diagnosticchallenge to the emergency physician because in up to 50% of cases the causefor syncope is unclear, even after a thorough ED evaluation. The potential for serious causes of syncope include cardiac arrhythmias, myocardial infarc-tion, ruptured ectopic pregnancy, stroke, subarachnoid hemorrhage, andpulmonary embolism.
As a result of the diagnostic uncertainty and the multiple potentially ser-ious etiologies of syncope, patients are frequently admitted to the hospital forfurther evaluation. As an inpatient, a patient may receive further diagnostictesting such as an echocardiogram or electroencephalogram, or may undergo
9781405154000_4_017.qxd 19/03/2008 11:02 Page 122
Evidence-Based Emergency Care: Diagnostic Testing and Clinical Decision Rules. J.M. Pines andW.W. Everett. 2008 Jesse M. Pines and Worth W. Everett, ISBN: 978-1-4051-5400-0.
Chapter 17: Syncope 123
cardiac monitoring and cardiac stress testing. Specific treatments, such aspacemakers or defibrillators, can be used if a cardiac arrhythmia is deter-mined as the cause for syncope, or changes in medication may be made toreduce the risk of syncope in the future.
Over the past 10 years multiple studies have been performed to identifypatients with syncope who may be safe for discharge after ED evaluation.Most recently, a decision rule to identify low-risk patients with syncope was derived and validated and has been named the San Francisco syncoperule.
Clinical question
“Does the San Francisco rule reliably identify low-risk patients with syncope whoare safe for hospital discharge after ED evaluation?”Initial studies of the diagnosis and prognosis of syncope attempted to identifyED patients with syncope who were at risk for poor outcomes such as death,myocardial infarction and arrhythmias, in order to provide a framework forrisk stratification. In 1997, Martin et al. performed a prospective analysis of patients who presented to the ED with syncope to determine risk factorsfor arrhythmias and sudden death at one year.1 They included two cohorts: a derivation cohort for which data was collected between March 1981 andFebruary 1984, and a validation cohort for which data was collected betweenAugust 1987 and February 1991. Because of the long time period over whichthe study data was gathered, there were differences in data collection strat-egies and in the evaluation between the derivation and validation cohorts. All patients underwent a standard syncope evaluation including electro-cardiogram (ECG), routine laboratory testing, and in excess of 24 hours of cardiac monitoring. The primary outcomes in the study were arrhythmias(broadly defined) and mortality at one year. The authors found that signi-ficant multivariable predictors for one-year mortality included: abnormalECG, a history of ventricular arrhythmia and/or congestive heart failure, age above 45 years, and being of non-white race. For mortality, an additionalsignificant risk factor was having no prior history of syncope. When appliedto the validation cohort, these risk factors and combinations thereof wereused in an overall risk score that totaled the number of risk factors; this performed fairly well, despite there being a lower event rate in the validationcohort. The authors also looked at cardiac mortality and found that in theabsence of any of these risk factors the overall mortality from cardiac causesapproached zero. Some of the limitations of the study included the fact thatthe study was performed at one center and that electrophysiological testingwas not performed on all patients.
9781405154000_4_017.qxd 19/03/2008 11:02 Page 123

124 Chapter 17: Syncope
Another study to investigate risk stratification of patients with syncope,derived and validated in Italy, is called the OESIL (Osservatorio Epidemio-logico sulla Sincope nel Lazio) risk score.2 The investigators used a similarmethod to that of Martin et al.1 and followed patients who presented to the ED with syncope to determine risk factors for mortality at one year. Their inclusion criteria were broadened to include patients as young as 12 years old. The authors identified the following as significant univar-iable predictors of mortality: age above 65 years, hypertension, a clinical history of cardiovascular disease, diabetes, syncope without prodrome, syncope-related traumatic injuries, and an abnormal ECG. In multivariableanalysis the following predictors were all found to be significant and thesewere combined to form the OESIL risk score where each factor was given one point: (i) age above 65 years; (ii) a history of cardiovascular disease; (iii) syncope without prodrome; and (iv) an abnormal ECG. Patients whopresented with zero or one point had a mortality rate near zero at one year.From this the authors concluded that these patients were low risk. However,the authors did not measure interventions such as the fitting of pacemakersor defibrillators, or any further diagnostic testing that was performed onthese patients.
More recently, Quinn et al. performed a derivation study and validated the use of the San Francisco syncope rule.3 In comparison to previous studies, the authors used outcome at seven days to determine whether apatient with syncope required hospital admission. The authors prospectivelyfollowed 684 patients with syncope or near syncope that were evaluated in the ED. Physicians filled out a structured data form for each patient and serious outcomes (death, myocardial infarction, arrhythmia, pulmonaryembolism, stroke, subarachnoid hemorrhage, significant hemorrhage, orreturn to the ED) were recorded at seven days after ED arrival. There were 79 serious outcomes in the derivation database. Individual chi-square tests(test of association for categorical variables) were performed for predictorvariables and serious outcomes. They also performed a kappa analysis (test of inter-rater agreement) and only used variables with good agreement(0.5–1) for the decision rule. The goal, as in all decision rules, was to approach100% sensitivity and to maximize specificity as much as possible.
The absence of all of the following risk-factors was 96% sensitive and 62%specific for identifying serious outcomes at seven days:• an abnormal ECG;• a complaint of shortness of breath;• a hematocrit of less than 30%;• a triage systolic blood pressure of less than 90 mmHg; and• a history of congestive heart failure.
9781405154000_4_017.qxd 19/03/2008 11:02 Page 124

Chapter 17: Syncope 125
The authors reported that when applied to the derivation cohort, this couldhave potentially decreased the admission rate for syncope by 10%.
The validation of the San Francisco syncope rule included 791 con-secutive ED visits and there were 53 serious reported outcomes.4 The authorsfound that the rule was 98% sensitive (95% CI: 89–100) and 56% specific(95% CI: 52–60). Some limitations of the study included the fact that the participants were all from one hospital. Because the authors used a compositeoutcome that included multiple serious outcomes, the study was not poweredto detect any one outcome (such as pulmonary embolism) individually. Theauthors refrained from stating that the San Francisco syncope rule was adefinitive guide for which patients should necessarily be admitted, statingrather that it should be used more as a risk stratification rule and citing thefact that there are many reasons for hospital admission.
Another group performed an independent validation of the San Franciscosyncope rule in an ED population in a single academic center.5 At the time ofcare, physicians recorded the elements of the rule and they then contactedpatients at 14 days with a structured interview. The primary outcome of thestudy was the sensitivity of the San Francisco syncope rule for predicting serious events at seven days. A secondary outcome of the study was the pre-diction of any serious clinical events that were not detected during the initialED visit. They consented 477 patients and obtained full records (either fromthe admission or through telephone follow-up). The serious event prevalencewas 12%, and 3% had a serious diagnosis that was not identified during theinitial ED evaluation. They reported a sensitivity of 89% (95% CI: 81–97) anda specificity of 42% (95% CI: 37–48) for the San Francisco syncope rule inpredicting seven-day serious outcomes. They also reported a sensitivity of69% (95% CI: 46–95) and 42% (95% CI: 37–48) for a serious diagnosis thatwas not identified during the initial ED evaluation. The authors concludedthat the San Francisco syncope rule had a lower sensitivity and specificitythan had been previously reported.
Comment
While the San Francisco syncope rule does provide a good risk stratificationscheme for determining which patients are at a low risk for serious short-termoutcomes, it does not provide us with a definitive guide for determiningwhich patients should be admitted or discharged. While it was validated in asimilar population to that from which it was derived, when tested on anexternal ED population it did not perform well. Because syncope is a symp-tom with heterogeneous causes, to power a study to rule out the presence orabsence of any specific cause would require a large number of patients.
9781405154000_4_017.qxd 19/03/2008 11:02 Page 125

126 Chapter 17: Syncope
In the context of relevant ED risk stratification, the San Francisco syncoperule comes closer than previous studies that had considered one-year mort-ality. From a patient perspective, one-year mortality is certainly importantand determining which patients are high risk can guide decisions on whetherto admit, and whether to obtain further testing and follow the patients longitudinally. When we evaluated ED patients with syncope, our evaluationconsidered immediate life threats and whether the cause of syncope requiredemergency admission for further testing and/or treatment for the primarycause.
So, this leaves us with the question of whether to use or not to use the SanFrancisco syncope rule. While one study has suggested that the rule does notwork, we would recommend using it as a risk stratification tool and to informdecisions regarding whether to admit patients with syncope, but certainly notas a definitive guide for admission decisions.
References
1. Martin, T.P., Hanusa, B.H. and Kapoor, W.N. (1997) Risk stratification of patientswith syncope. Annals of Emergency Medicine 29: 459–466.
2. Colivicchi, F., Ammirati, F., Melina, D., et al. (2003) Development and prospectivevalidation of a risk stratification system for patients with syncope in the emergencydepartment: the OESIL risk score European Heart Journal 24: 811–819.
3. Quinn, J.V., Steill, I.G., McDermott, D.A., et al. (2004) Derivation of the SanFrancisco syncope rule to predict patients with short-term serious outcomes.Annals of Emergency Medicine 43: 224–232.
4. Quinn, J., McDermott, D., Stiell, I., et al. (2006) Prospective validation of the San Francisco syncope rule to predict patients with serious outcomes. Annals ofEmergency Medicine 47: 448–454.
5. Sun, B.C., Mangione, C.M., Merchant, G., et al. (2007) External validation of theSan Francisco syncope rule. Annals of Emergency Medicine 49: 420–427.
9781405154000_4_017.qxd 19/03/2008 11:02 Page 126
127
Chapter 18 Acute Coronary Syndrome
Highlights
• Acute coronary syndrome is a spectrum of conditions ranging from acute
myocardial infarction to stable angina.
• Troponin I is poorly sensitive but highly specific for initial testing, but
sensitivity increases considerably with serial testing.
• Any positive troponin I test is predictive of higher short-term risks for
adverse outcomes.
• Non-invasive stress testing can determine the presence and extent of
coronary disease.
• Exercise electrocardiogram (ECG) stress testing is widely available but lacks
sensitivity or specificity.
• Pharmacologic agents can increase sensitivity when combined with
myocardial perfusion imaging, and when combined with echocardiography
the specificity is maximized.
• Stress echocardiography with dobutamine has higher specificity in women
compared to nuclear scintigraphy.
• Computed tomography (CT) coronary angiography may be useful for
low-risk emergency department (ED) patients and appears to be at least
as sensitive and specific as stress myocardial perfusion imaging.
Background
Coronary artery disease (CAD) is one of the main causes of death in the US and worldwide. Patients with symptomatic CAD frequently presentdirectly to the ED with symptoms of acute chest pain. The spectrum of acutechest pain and other symptoms of myocardial ischemia, ranging from acute
9781405154000_4_018.qxd 26/03/2008 12:17 Page 127
Evidence-Based Emergency Care: Diagnostic Testing and Clinical Decision Rules. J.M. Pines andW.W. Everett. 2008 Jesse M. Pines and Worth W. Everett, ISBN: 978-1-4051-5400-0.

128 Chapter 18: Acute Coronary Syndrome
myocardial infarction (AMI) with myocardial necrosis to reversible ischemicdamage or unstable angina (UA), are described clinically by the term acutecoronary syndrome (ACS). The first step in ED management of patients is to obtain a 12-lead electrocardiogram (ECG). Findings on the initial ECGmay be diagnostic or suggestive of ACS, but sometimes the ECG is normal ornon-diagnostic. Distinguishing AMI and UA from other non-cardiac chestpain typically involves serial ECGs and/or serial analysis of serum biomarkersof myocardial injury, in conjunction with diagnostic imaging (stress test orCT scan) or cardiac catheterization.
For patients presenting to the ED with acute chest pain, an ECG should beobtained promptly in order to detect the presence of ST-segment elevation,new left bundle branch blocks, or new dynamic ST changes indicative ofAMI. And while the standard ECG is the single best test to identify patientswith AMI when they present to the ED, it has relatively low sensitivity for the detection of AMI. In patients with AMI, the ST segment is elevated on the initial ECG in approximately 50% of cases. Because of the insensitivity of ECG, other tests are incorporated into the work-up of patients with acute chest pain with suspected ACS, including analysis of cardiac specificbiomarkers and diagnostic imaging or stress testing.
The clinical questions that are likely to arise during the assessment of apatient with suspected ACS are the test characteristics of cardiac biomarkers,non-invasive stress testing, and cardiac CT imaging.
Serum biomarkers
Serum biomarkers have been used in the assessment of ED patients with suspected ACS but with no history of ECG signs of ST-elevation, myocardialinfarction, or dynamic ECG changes for over 30 years. Technological advanceshave meant that the use of nonspecific biomarkers, such as lactose dehydro-genase (LDH) and aspartate aminotransferase (AST) has declined and moresensitive and specific cardiac specific biomarkers, including creatine kinase(CK)-MB, troponin T, and troponin I, are now used routinely. The biokineticproperties of the cardiac troponins are similar in terms of the increase inserum concentrations, usually within 4–6 h of AMI (similar changes are seenin CK-MB); however, the serum levels remain elevated for over a week. Both I and T subunits are part of the striated cardiac muscle contractile unit (Fig. 18.1). The I subunit is a smaller, inhibitory protein and, as it is not found in the serum in the absence of myocardial injury, it should exhibit high sensitivity and specificity. The T subunit is larger and is not found in the serum of patients in the absence of heart complaints or heart disease. It isreleased into the serum at a slightly slower rate than troponin I and has been
9781405154000_4_018.qxd 26/03/2008 12:17 Page 128

Chapter 18: Acute Coronary Syndrome 129
found to be elevated in patients with reversible ischemic injury, resulting in agreater number of false positives in the setting of UA.
Clinical question one
“What are the performance characteristics of the cardiac troponins (I and T) interms of the diagnosis of acute cardiac ischemia? Do these differ when initialbiomarker levels are compared to serial biomarkers?”One systematic review and three meta-analyses have examined the diagnosticperformance of biochemical markers for ACS, including AMI and UA. All of these studies were published in 2001 and therefore do not incorporate
123
35.5 nm
38.5 nm
Tropomyosin Troponin
G-actin
F-actin
6–7 nm
TpCTpI
TpT
The assembled thin filament
Figure 18.1 Schematic representation of the thin filament, showing the spatialconfiguration of its three major protein components: actin, myosin, and tropomyosin.The upper panel shows individual molecules of G-actin. The middle panel shows actinmonomers assembled into F-actin. Individual molecules of tropomyosin (two strandswound around one another) and troponin (made up of its three subunits) are alsoshown. The lower panel shows the assembled thin filament, consisting of F-actin,tropomyosin, and the three subunits of troponin (TpC, TpI, and TpT). (Source: Murrayet al. Harper’s Illustrated Biochemistry 25th Edition © 2000. Reproduced with permissionof The McGraw-Hill Companies)
9781405154000_4_018.qxd 26/03/2008 12:17 Page 129
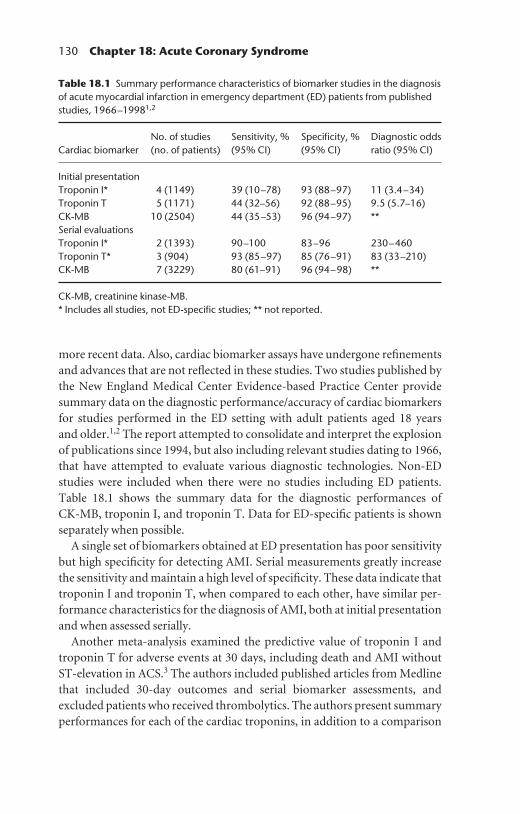
130 Chapter 18: Acute Coronary Syndrome
more recent data. Also, cardiac biomarker assays have undergone refinementsand advances that are not reflected in these studies. Two studies published bythe New England Medical Center Evidence-based Practice Center providesummary data on the diagnostic performance/accuracy of cardiac biomarkersfor studies performed in the ED setting with adult patients aged 18 years and older.1,2 The report attempted to consolidate and interpret the explosionof publications since 1994, but also including relevant studies dating to 1966,that have attempted to evaluate various diagnostic technologies. Non-EDstudies were included when there were no studies including ED patients.Table 18.1 shows the summary data for the diagnostic performances of CK-MB, troponin I, and troponin T. Data for ED-specific patients is shown separately when possible.
A single set of biomarkers obtained at ED presentation has poor sensitivitybut high specificity for detecting AMI. Serial measurements greatly increasethe sensitivity and maintain a high level of specificity. These data indicate thattroponin I and troponin T, when compared to each other, have similar per-formance characteristics for the diagnosis of AMI, both at initial presentationand when assessed serially.
Another meta-analysis examined the predictive value of troponin I andtroponin T for adverse events at 30 days, including death and AMI withoutST-elevation in ACS.3 The authors included published articles from Medlinethat included 30-day outcomes and serial biomarker assessments, andexcluded patients who received thrombolytics. The authors present summaryperformances for each of the cardiac troponins, in addition to a comparison
Table 18.1 Summary performance characteristics of biomarker studies in the diagnosisof acute myocardial infarction in emergency department (ED) patients from publishedstudies, 1966–19981,2
No. of studies Sensitivity, % Specificity, % Diagnostic odds Cardiac biomarker (no. of patients) (95% CI) (95% CI) ratio (95% CI)
Initial presentationTroponin I* 4 (1149) 39 (10–78) 93 (88–97) 11 (3.4–34)Troponin T 5 (1171) 44 (32–56) 92 (88–95) 9.5 (5.7–16)CK-MB 10 (2504) 44 (35–53) 96 (94–97) **Serial evaluationsTroponin I* 2 (1393) 90–100 83–96 230–460Troponin T* 3 (904) 93 (85–97) 85 (76–91) 83 (33–210)CK-MB 7 (3229) 80 (61–91) 96 (94–98) **
CK-MB, creatinine kinase-MB.* Includes all studies, not ED-specific studies; ** not reported.
9781405154000_4_018.qxd 26/03/2008 12:17 Page 130

Chapter 18: Acute Coronary Syndrome 131
of performances for clinical trial and cohort studies. Seven studies including atotal of 3579 patients were found that reported both troponin I and troponinT data. Two-hundred and sixty patients (7.2%) had an adverse event. Thesummary predictive sensitivity and specificity was 65% (95% CI: 58.9–70.8)and 74.5% (95% CI: 73–76), respectively, for troponin I, and 56.9% (95% CI: 50.7–63) and 76.9% (95% CI: 75.4–78.3), respectively, for troponin T. The summary negative predictive values, reflecting the prevalence of the outcomes, were 96.5% (95% CI: 95.7–97.1) for troponin I and 95.8% (95% CI: 95–96.5) for troponin T. There were no significant differences in the performance characteristics of either troponin biomarker when these studieswere compared.
Heidenreich et al. examined the prognostic performance of troponin T and troponin I in clinical trials and cohort studies of patients with ACS.4
A total of seven clinical trials and 19 cohort studies were found in their Medline search from 1966 to 1999. Studies that included only AMIs wereexcluded. The outcomes of death and death or AMI were reported. Two trialsand two cohort studies compared troponin I and troponin T values directly,and the summary odds ratios for predicting mortality were similar [troponinI: OR 3.9 (95% CI: 2.3–6.6); troponin T: OR 5.2 (95% CI: 3.1–8.5)]. When troponin-positive death rates were compared between clinical trials and cohorts,using troponin I or troponin T, the cohort studies had higher summary oddsratios than the clinical trials, regardless of troponin subtype [troponin I: clinical trials summary OR 2.6 (95% CI: 1.8–3.6), cohort studies OR 8.5(95% CI: 3.5–21.1), P <0.01; troponin T clinical trials summary OR 3.0 (95% CI: 1.6–5.5), cohort studies OR 5.1 (95% CI: 3.2–8.4), P <0.2].
Comments
Cardiac biomarkers are an integral part of the assessment for ACS in patientspresenting with chest pain; however, they should not be the sole determinant.The studies we have reviewed showed poor sensitivity and high specificity for initial testing using the cardiac troponins, with serial testing leading toincreased sensitivity. A positive result for troponin indicates higher short-term risks for the adverse outcomes of death and/or AMI. Results fromcohort studies using either troponin I or troponin T show poorer short-termoutcomes when compared to clinical trials, inferring that study-specific subject selection, patient heterogeneity, or trial conditions have an impact on the outcome.
Most EDs and hospital laboratories will run cardiac panels that typicallyinclude CK-MB and either troponin I or troponin T. Unless ST elevations,new left bundle branches, or dynamic ST segment changes are detected on the
9781405154000_4_018.qxd 26/03/2008 12:17 Page 131

132 Chapter 18: Acute Coronary Syndrome
initial ECG, we advocate using cardiac troponin in the initial assessment ofsuspected ACS. A positive result for troponin should result in a cardiologyevaluation, depending on the patient’s medical history and presentation, andwill often necessitate an evaluation of the coronary arteries, either invasivelyor non-invasively. Because of the biokinetic properties of the troponins,patients presenting acutely for the evaluation of chest pain may be negativefor cardiac enzymes in the first instance. In these patients serial ECGs andserial cardiac biomarkers should be obtained. Among patients presentingwith longer episodes of chest pain (hours to days) and with normal or non-diagnostic ECGs, the strategy of using a single troponin assessment in orderto risk stratify them has not been adequately studied.
Non-invasive cardiac testing
There are several non-invasive tests that are commonly used in the assess-ment of CAD. Exercise ECG stress testing involves the assessment of a con-tinuous ECG under an exercise protocol, often using a treadmill or bicycle.Dynamic ECG changes over time during the exercise process yield importantand useful diagnostic information about the presence of underlying CAD. It is considered a low-cost test, is widely available, and can be performed andinterpreted by a wide variety of non-cardiology physicians. Myocardial per-fusion imaging with single-photon emission computed tomography (SPECT)uses a safe nuclear tracer (thallium-201 or technetium-99 sestamibi) that permits an evaluation of ventricular function, coronary artery perfusion, and regional blood flow. It is often coupled with a pharmacologic stressingagent that has vasodilatory effects—usually adenosine or dipyridamole—toenhance the diagnostic accuracy. Stress echocardiography in conjunctionwith either exercise alone or in combination with a pharmacological stressor,commonly dobutamine, permits the assessment of global cardiac and regionalbiventricular functions, transient regional wall motion abnormalities, andvalvular dysfunction. Both SPECT imaging and echocardiography testingrequire specialized facilities for the preparation and execution of the study.Determining which one to use will be based on each individual patient, theirexercise capacity, and study availability.
Clinical question two
“What are the performance characteristics for the following forms of non-invasivestress testing in diagnosing CAD: exercise ECG stress, stress echocardiography(exercise and pharmacologic), and stress myocardial perfusion imaging withSPECT?”
9781405154000_4_018.qxd 26/03/2008 12:17 Page 132
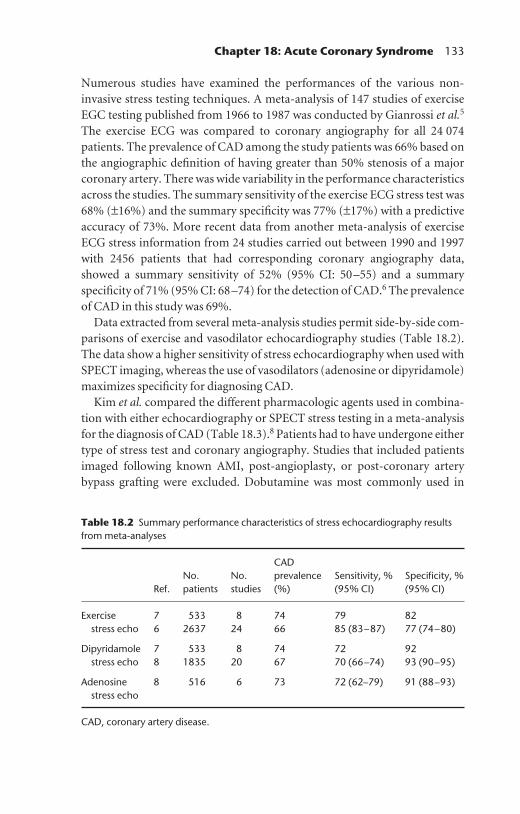
Chapter 18: Acute Coronary Syndrome 133
Numerous studies have examined the performances of the various non-invasive stress testing techniques. A meta-analysis of 147 studies of exerciseEGC testing published from 1966 to 1987 was conducted by Gianrossi et al.5
The exercise ECG was compared to coronary angiography for all 24 074patients. The prevalence of CAD among the study patients was 66% based onthe angiographic definition of having greater than 50% stenosis of a majorcoronary artery. There was wide variability in the performance characteristicsacross the studies. The summary sensitivity of the exercise ECG stress test was68% (±16%) and the summary specificity was 77% (±17%) with a predictiveaccuracy of 73%. More recent data from another meta-analysis of exerciseECG stress information from 24 studies carried out between 1990 and 1997with 2456 patients that had corresponding coronary angiography data,showed a summary sensitivity of 52% (95% CI: 50–55) and a summaryspecificity of 71% (95% CI: 68–74) for the detection of CAD.6 The prevalenceof CAD in this study was 69%.
Data extracted from several meta-analysis studies permit side-by-side com-parisons of exercise and vasodilator echocardiography studies (Table 18.2).The data show a higher sensitivity of stress echocardiography when used withSPECT imaging, whereas the use of vasodilators (adenosine or dipyridamole)maximizes specificity for diagnosing CAD.
Kim et al. compared the different pharmacologic agents used in combina-tion with either echocardiography or SPECT stress testing in a meta-analysisfor the diagnosis of CAD (Table 18.3).8 Patients had to have undergone eithertype of stress test and coronary angiography. Studies that included patientsimaged following known AMI, post-angioplasty, or post-coronary arterybypass grafting were excluded. Dobutamine was most commonly used in
Table 18.2 Summary performance characteristics of stress echocardiography resultsfrom meta-analyses
CAD No. No. prevalence Sensitivity, % Specificity, %
Ref. patients studies (%) (95% CI) (95% CI)
Exercise 7 533 8 74 79 82stress echo 6 2637 24 66 85 (83–87) 77 (74–80)
Dipyridamole 7 533 8 74 72 92stress echo 8 1835 20 67 70 (66–74) 93 (90–95)
Adenosine 8 516 6 73 72 (62–79) 91 (88–93)stress echo
CAD, coronary artery disease.
9781405154000_4_018.qxd 26/03/2008 12:17 Page 133

134 Chapter 18: Acute Coronary Syndrome
combination with echocardiography and had a higher sensitivity but lowerspecificity when compared to adenosine and dipyridamole studies. Con-versely, dipyridamole was most commonly used together with SPECT imagingwith higher sensitivity but also lower specificity compared to dobutamine.
Women have been under-represented in the majority of non-invasivestress testing studies throughout the 20th century. Because the majority ofstudies examined middle-aged men who have an overall higher prevalence of CAD, there have been concerns about the application of the various stresstest modalities to women. Fortunately, once CAD is recognized, treatmentsand interventions are similar for both sexes; but for the clinician the concernabout gender bias in the literature is a reasonable one.
Kwok et al. examined studies published from 1966 to 1995 that included at least 50 women who underwent a minimum of one type of exercise stress test and who had corresponding coronary angiography information.9
Studies that did not present female-specific data were not included, nor werenon-English studies or studies done for post-myocardial infarction or post-angioplasty evaluations. A total of 21 studies involving 4113 patients wereincluded in the meta-analysis with a mean CAD prevalence of 39% (see Table 18.4). These data demonstrated that none of the non-invasive exercisestress tests were highly sensitive or specific in women. Stress echocardio-graphy demonstrated the highest sensitivity and specificity but was also theleast studied modality in this report.
Dutch researchers examined the dobutamine stress echocardiographyamong women in a meta-analysis of 14 studies between 1992 and 2002 inwhich there was corresponding coronary angiography data.10 In six of the
Table 18.3 Summary performance test characteristics of different pharmacologicagents coupled with echocardiography or single-photon emission computedtomography (SPECT) stress testing in published studies, 1975–1999, from Kim et al. 20018
No. studies CAD Sensitivity, % Specificity, % (no. patients) prevalence, % (95% CI) (95% CI)
Echocardiography stressAdenosine 6 (516) 73 72 (62–79) 91 (88–93)Dipyridamole 20 (1835) 67 70 (66–74) 93 (90–95)Dobutamine 40 (4097) 70 80 (77–83) 84 (80–86)
SPECT stressAdenosine 9 (1207) 80 90 (89–92) 75 (70–79)Dipyridamole 21 (1464) 71 89 (84–93) 65 (54–74)Dobutamine 14 (1066) 66 82 (77–87) 75 (70–79)
CAD, coronary artery disease.
9781405154000_4_018.qxd 26/03/2008 12:17 Page 134
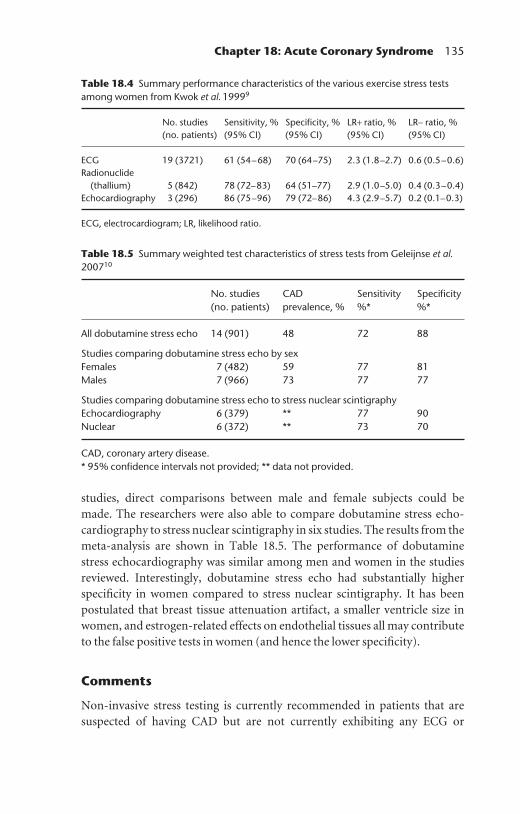
Chapter 18: Acute Coronary Syndrome 135
studies, direct comparisons between male and female subjects could be made. The researchers were also able to compare dobutamine stress echo-cardiography to stress nuclear scintigraphy in six studies. The results from themeta-analysis are shown in Table 18.5. The performance of dobutaminestress echocardiography was similar among men and women in the studiesreviewed. Interestingly, dobutamine stress echo had substantially higherspecificity in women compared to stress nuclear scintigraphy. It has beenpostulated that breast tissue attenuation artifact, a smaller ventricle size inwomen, and estrogen-related effects on endothelial tissues all may contributeto the false positive tests in women (and hence the lower specificity).
Comments
Non-invasive stress testing is currently recommended in patients that are suspected of having CAD but are not currently exhibiting any ECG or
Table 18.5 Summary weighted test characteristics of stress tests from Geleijnse et al.200710
No. studies CAD Sensitivity Specificity (no. patients) prevalence, % %* %*
All dobutamine stress echo 14 (901) 48 72 88
Studies comparing dobutamine stress echo by sexFemales 7 (482) 59 77 81Males 7 (966) 73 77 77
Studies comparing dobutamine stress echo to stress nuclear scintigraphyEchocardiography 6 (379) ** 77 90Nuclear 6 (372) ** 73 70
CAD, coronary artery disease.* 95% confidence intervals not provided; ** data not provided.
Table 18.4 Summary performance characteristics of the various exercise stress testsamong women from Kwok et al. 19999
No. studies Sensitivity, % Specificity, % LR+ ratio, % LR− ratio, % (no. patients) (95% CI) (95% CI) (95% CI) (95% CI)
ECG 19 (3721) 61 (54–68) 70 (64–75) 2.3 (1.8–2.7) 0.6 (0.5–0.6)Radionuclide
(thallium) 5 (842) 78 (72–83) 64 (51–77) 2.9 (1.0–5.0) 0.4 (0.3–0.4)Echocardiography 3 (296) 86 (75–96) 79 (72–86) 4.3 (2.9–5.7) 0.2 (0.1–0.3)
ECG, electrocardiogram; LR, likelihood ratio.
9781405154000_4_018.qxd 26/03/2008 12:17 Page 135

136 Chapter 18: Acute Coronary Syndrome
enzymatic evidence of AMI or UA. Exercise ECG is the most widely available form of stress testing but suffers from a lack of sufficiently high sensitivity orspecificity. However, in cases when clinicians have a low to very low suspicionof CAD, it is a reasonable first step stress test. If the facilities and resources forexercise imaging or other imaging modes are available, additional informa-tion can be obtained with better test performances. Pharmacologic additionsto the stress tests enhance diagnostic accuracy and can be used in those patientsincapable of exercising. Vasodilator drugs such as adenosine and dipyridamolecan maximize sensitivity when combined with SPECT imaging, whereas whencombined with echocardiography the specificity is maximized. For women,stress echocardiography with dobutamine appears to have better specificitycompared to stress nuclear scintigraphy methods.
CT coronary angiography
CT angiography of the coronary vessels for the purposes of identifying poten-tial ACS is among the most recently developed diagnostic modality to assesspatients with chest pain in the ED. Advances in CT technology with improvedspatial and temporal resolution have permitted the acquisition of detailedpictures of the coronary anatomy to detect coronary artery stenosis as well ascalcified and non-calcified coronary artery plaques.
Clinical question three
“How do the test characteristics of multi-detector CT (MDCT) angiographycompare with conventional invasive coronary angiography?”Three meta-analyses, all published in 2006, have examined this question and have come to the same general conclusion. The first study by Dutchresearchers examined original studies published between 2000 and 2005 inwhich at least 20 patients with native coronary arteries were involved, and in which both MDCT and coronary angiography were performed.11 Fifteenstudies were found, totaling 944 patients. The mean prevalence of CAD in the studies was 59% (range 31–81%). The pooled patient-based sensitivityfor the 10 studies reporting patient-based data was 89% (95% CI: 85–92).The pooled negative likelihood ratio was 0.16 (95% CI: 0.10–0.26).
Another study by European researchers evaluated studies from 2002 to2006 that reported results with at least 30 patients that had undergone bothMDCT and coronary angiography studies.12 The MDCTs had to employ the newer generation CT technology (≥16 slices). A total of 27 studies wereincluded in the analysis, permitting analysis at the coronary segment, vessel,and patient levels. The results are summarized in Table 18.6.
9781405154000_4_018.qxd 26/03/2008 12:17 Page 136

Chapter 18: Acute Coronary Syndrome 137
The largest meta-analysis comes from Sun and Jiang who examined 47studies from 1998 to 2006.13 The studies included reports with 10 or morepatients who underwent MDCT and coronary angiography. The studiesincluded used CTs with between 4 and 64 detectors. Table 18.7 summarizesthe results; the prevalence of CAD was found to be 74% (95% CI: 64–84).
Comments
The three published meta-analyses on the topic of the diagnostic perform-ance of MDCT angiography consistently show that the sensitivity is in themid 80–90% range, and increases as one moves from the coronary segmentlevel to the patient level. Conversely, the specificity is in the mid 80–90%range and decreases as one moves from the coronary segment to the patientlevel. An important element to keep in mind when interpreting this data isthat almost none of the studies included in the meta-analyses examined EDpatients presenting acutely for evaluation of chest pain.
Table 18.6 Pooled performance characteristics of multi-detector computedtomography angiography compared to coronary angiography, based on the meta-analysis from Hamon et al. 200612
Level of analysis
Coronary segment Coronary vessel Patient (n = 22 789) (n = 2726) (n = 1570)
Sensitivity, % (95% CI) 81 (72–89) 82 (80–85) 96 (94–98)Specificity, % (95% CI) 93 (90–97) 91 (90–92) 74 (65–84)LR+ (95% CI) 22 (13–35) 12 (7–21) 5 (3–8)LR− (95% CI) 0.11 (0.06–0.21) 0.08 (0.02–0.32) 0.05 (0.03–0.09)
LR, likelihood ratio.
Table 18.7 Pooled performance characteristics of multi-detector computedtomography angiography compared to coronary angiography, based on the meta-analysis from Sun and Jiang 200613
Level of analysis
Coronary segment Coronary vessel Patient (n = 34 studies) (n = 16 studies) (n = 21 studies)
Sensitivity, % (95% CI) 83 (79–89) 90 (87–94) 91 (88–95)Specificity, % (95% CI) 93 (91–96) 87 (80–93) 86 (81–92)
9781405154000_4_018.qxd 26/03/2008 12:17 Page 137
138 Chapter 18: Acute Coronary Syndrome
A review by Hollander and Litt of the six small cohort studies to date thathave examined the use of CT coronary angiography in the evaluation of EDpatients considered low risk for ACS, indicate that non-invasive CT coronaryangiography is at least as sensitive and specific as stress myocardial perfusionimaging for the exclusion or detection of ACS, and that it has the potential to decrease the overall time required to complete an evaluation, and has no short-term adverse outcomes associated with its use or with missed diag-noses.14 The major limitation of the reviewed studies is the small sample sizes(the number of enrolled patients ranged from 40 to 197). This modality hasthe potential to significantly speed up the evaluation process and is a researcharea that holds promise in the evaluation of low-risk ACS patients.
References
1. Lau, J., Ioannidis, J.P.A., Balk, E.M., et al. (2001) Diagnosing acute cardiacischemia in the emergency department: a systematic review of the accuracy andclinical effect of current technology. Annals of Emergency Medicine 37(5): 453–460.
2. Balk, E.M., Ioannidis, J.P.A., Salem, D., Chew, P.W. and Lau, J. (2001) Accuracy ofbiomarkers to diagnose acute cardiac ischemia in the emergency department: ameta-analysis. Annals of Emergency Medicine 37(5): 478– 494.
3. Fleming, S.M. and Daly, K.M. (2001) Cardiac troponins in suspected acute coron-ary syndrome. Cardiology 95: 66–73.
4. Heidenreich, P.A., Alloggiamento, T., Melsop, K., McDonald, K.M., Go, A.S. andHlatky, M.A. (2001) The prognostic value of troponin in patients with non-ST elevation acute coronary syndromes: a meta-analysis. Journal of American Collegeof Cardiology 38(2): 478–485.
5. Gianrossi, R., Detrano, R., Muvihill, D., et al. (1989) Exercise-induced ST depres-sion in the diagnosis of coronary artery disease. Circulation 80(1): 87–98.
6. Fleischmann, K.E., Hunink, M.G., Kuntz, K.M. and Douglas, P.S. (1998) Exerciseechocardiography or exercise SPECT imaging? A meta-analysis of diagnostic testperformance. Journal of the American Medical Association 280(10): 913–920.
7. Fonseca, L.A. and Picano, E. (2001) Comparison of dipyridamole and exercisestress echocardiography for detection of coronary artery disease (a meta-analysis).American Journal of Cardiology 87: 1193–1196.
8. Kim, C., Kwok, Y.S., Heagerty, P. and Redberg, R. (2001) Pharmacologic stresstesting for coronary artery disease diagnosis: a meta-analysis. American HeartJournal 142(6): 934–944.
9. Kwok, Y., Kim, C., Grady, D., Segal, M. and Redberg, R. (1999) Meta-analysis ofexercise testing to detect coronary artery disease in women. American Journal ofCardiology 83: 660–666.
10. Geleijnse, M.L., Krenning, B.J., Soliman, O., II, Nemes, A., Galema, T.W. and ten Cate, F.J. (2007) Dobutamine stress echocardiography for the detection ofcoronary artery disease in women. American Journal of Cardiology 99: 714–717.
9781405154000_4_018.qxd 26/03/2008 12:17 Page 138

Chapter 18: Acute Coronary Syndrome 139
11. van der Zaag-Loonen, H.J., Dikkers, R., de Bock, G.H. and Oudkerk, M. (2006)The clinical value of a negative multi-detector computed tomographic angio-graphy in patients suspected of coronary artery disease: a meta-analysis. EuropeanRadiology 16: 2748–2756.
12. Hamon, M., Biondi-Zoccai, G.G.L., Malagutti, P., et al. (2006) Diagnostic performance of multislice spiral computed tomography of coronary arteries as compared with conventional invasive coronary angiography. Journal of AmericanCollege of Cardiology 48(9): 1896–1910.
13. Sun, Z. and Jiang, W. (2006) Diagnostic value of multislice computed tomographyangiography in coronary artery disease: a meta-analysis. European Journal ofRadiology 60: 279–286.
14. Hollander, J.E. and Litt, H.I. (2006) Computerized tomographic coronary angio-graphy for the evaluation of ED patients with potential acute coronary syndromes.Emergency Medicine Cardiac Research and Education Group International. Availableat: http://www.emcreg.org/education/cme/cme.html
9781405154000_4_018.qxd 26/03/2008 12:17 Page 139

SECTION 4
Infectious Disease
9781405154000_4_019.qxd 19/03/2008 11:01 Page 141
Evidence-Based Emergency Care: Diagnostic Testing and Clinical Decision Rules. J.M. Pines andW.W. Everett. 2008 Jesse M. Pines and Worth W. Everett, ISBN: 978-1-4051-5400-0.

143
Chapter 19 Serious Bacterial Infectionsand Occult Bacteremia in Children
Highlights
• The principle goal of the emergency department (ED) evaluation of the
febrile infant under three years of age is to identify patients at risk for serious
bacterial infection (SBI) and occult bacteremia.
• Two clinical decision rules, the Philadelphia protocol and Rochester criteria,
are sensitive rules for identifying febrile infants at low risk from SBI.
• Successful vaccination programs against Haemophilus influenzae type B (HIB)
and Streptococcus pneumoniae have resulted in lower rates of occult
bacteremia in febrile infants.
Background
About 20% of febrile children (under 3 years old) will have no source of infection after a thorough physical examination. A small percentage of febrile children will have an SBI, which encompasses bacteremia, bacter-ial gastroenteritis, cellulitis, meningitis, osteomyelitis, pneumonia, septicarthritis, and urinary tract infection. The challenge in the ED is to identifychildren with fevers who are at risk of SBI and who need more testing, empirical antibiotics, and/or inpatient admission for observation. Severallarge studies have examined various criteria to differentiate the risk of SBI for children with fever.
In general, children who are 0–28 days old have a high prevalence of a serious occult source of infection and should receive a full sepsis work-up(including laboratory screening, urinalysis, and lumbar puncture) and empir-ical antibiotics. For children who are between 29 and 60 days old there areclinical decision rules to identify children who are at low risk (the Philadelphia
9781405154000_4_019.qxd 19/03/2008 11:01 Page 143
Evidence-Based Emergency Care: Diagnostic Testing and Clinical Decision Rules. J.M. Pines andW.W. Everett. 2008 Jesse M. Pines and Worth W. Everett, ISBN: 978-1-4051-5400-0.
144 Chapter 19: Serious Bacterial Infections
protocol and Rochester criteria). For children who are not low risk, the recommendations are to hospitalize them, do a full work-up, and empiricallytreat. For those deemed to be low risk, discharging them on the condition thatthey can receive a close follow-up is recommended. Between two and threemonths old there is a grey zone with differing approaches used, ranging fromurinalysis testing to empirical treatment with intramuscular antibiotics.
Children between the ages of 3 and 36 months that have no focal source ofinfection are at risk of occult bacteremia. This is defined as the presence ofbacteria in the blood in a febrile child that otherwise appears to be well andthat has no focus of infection, and is a source of controversy in the ED. Occultbactermia is more frequent in children with high white blood cell (WBC)counts (>15 000/mm3) and elevated temperatures (>39°C). Therefore, for a child that appears toxic, has a high fever, and an elevated WBC count>15, bandemia, or a high absolute neutrophil count (ANC), a full work-up(including a lumbar puncture where meningitis is a concern) should be performed, antibiotics prescribed and the child admitted. However, non-toxicchildren who do not have elevated ANCs may be considered as candidates for outpatient management.
The advent of two vaccines against HIB and Streptococcus pneumoniaehas changed the epidemiology of occult bacteremia. In the pre-HIB era, theprevalence ranged from about 3 to 12%. The most frequent cause was Strepto-coccus pneumoniae (60–85%), while HIB was responsible for approximately5–20%. A recent study has estimated the prevalence of occult bacteremia tobe less than 2%.
Clinical question one
“What are the Philadelphia protocol and the Rochester criteria and how do theseclinical decision rules differentiate children less than two months old with SBI?”The derivation of the Philadelphia protocol involved a study of 747 consecut-ive infants who were between 29 and 56 days old and that had temperatures of 38.2°C or above.1 A total of 460 infants had laboratory or clinical findingsindicating SBI and were hospitalized and treated empirically with antibiotics.The authors used the following screening criteria for SBI: a WBC count in excess of 15 000/mm3; a spun urine specimen with more than 10 WBC per high-power field or that was positive under bright-field microscopy; acerebrospinal fluid (CSF) with a WBC count greater than 8/mm3 or a positiveGram’s stain; or an infiltrate on chest radiography. The 287 infants with normal physical examinations and normal laboratory findings were assignedto either inpatient observation without antibiotics, or outpatient care with a close follow-up. A total of 65 infants (9%) had SBI and 64 were identified
9781405154000_4_019.qxd 19/03/2008 11:01 Page 144

Chapter 19: Serious Bacterial Infections 145
using the screening criteria. The sensitivity was 98% (95% CI: 92–100). Of the287 who were low risk, only one had SBI. The authors termed these criteriathe Philadelphia protocol, which states that children are low risk if all of thefollowing are met:• a WBC count below 15 000 with a band cell count of less than 20%;• a WBC count of less than 10 per high-power field in urinalysis;• a WBC count for the CSF of less than 7/mm3; and• a negative chest radiography.More recently the same authors performed a three-year prospective cohortstudy of the Philadelphia protocol.2 They followed 422 infants who werebetween 29 and 60 days old and had a fever exceeding 38°C. A total of 101infants (24%) were identified as low risk and safe for outpatient manage-ment. The authors reported that of the 43 children with SBI, none wereidentified as low risk by the Philadelphia protocol.
The initial derivation of the Rochester criteria involved a two-year study of233 infants aged three months or younger.3 Term infants with no perinatalcomplications or serious underlying diseases, or who had previously receivedantibiotics were included. A total of 144 (62%) were considered unlikely to have an SBI, in that they did not have any physical examination findingsconsistent with ear, soft tissue or skeletal infections, and had a WBC count of5000–15 000/mm3, less than 1500 band cells/mm3, and a normal urinalysis.Of the 144, only one infant had an SBI (0.7%) compared to 22 (25%) in thehigh-risk group. No patients in the low-risk group had bacteremia comparedwith 9% in the high-risk group. They termed these criteria the Rochester criteria and stated that there is a low risk if the infant:• was full-term;• was previously healthy;• has a WBC count of 5000–15 000/mm3 with less than 1500 band cells/mm3;
and• has a WBC count of less than 10 per high-power field in unrinalysis.The same authors then prospectively examined the criteria in a study a fewyears later (1988).4 They enrolled 237 previously healthy infants aged threemonths or younger with fever. A total of 149 (63%) were low risk by the following criteria: no findings of soft tissue or skeletal infections, no otitismedia, normal urinalysis, less than 25 WBC per high-power field on stoolexamination, and a WBC count of 5000–15 000/mm3 with less than 1500band cells/mm3. None of the low-risk patients had SBI compared with 24% of the high-risk patients, and 8% had bacteremia.
A reappraisal of the Philadelphia protocol and the Rochester criteria wasrecently published.5 The study involved infants aged 56 days or younger witha rectal temperature of greater than 38.1°C. As part of the study protocol the
9781405154000_4_019.qxd 19/03/2008 11:01 Page 145

146 Chapter 19: Serious Bacterial Infections
physicians gave their overall impression of sepsis and scored each infant using an Infant Observation Score. They assigned 188 infants to the Phila-delphia protocol and 259 to the Rochester criteria. The negative predictivevalue of the Philadelphia protocol was 97.1% (95 CI: 85.1–99.8) and that of the Rochester criteria was 97.3% (95% CI: 90.5–99.2). The authors con-cluded that the Philadelphia protocol and the Rochester criteria both hadhigh negative predictive values, similar to the initial derivation and validationstudies.
Clinical question two
“How well does the Philadelphia protocol work when applied to children of lessthan 29 days of age?”The Philadelphia protocol was applied retrospectively to a cohort of 254infants younger than 29 days who were admitted for evaluation of SBI.6 Theoverall prevalence of SBI was 12.6%. A total of 109 (43%) of infants couldhave been classified as low risk by the Philadelphia protocol. Five childrenwere found to have an SBI that would have been missed by the Philadelphiaprotocol. The authors warned that these results demonstrate the unpre-dictable nature of SBI in infants less than 29 days of age.
Clinical question three
“What is the utility of laboratory testing to discriminate children with occultbacteremia?”In 1998, Kuppermann et al. studied a large cohort of 6579 outpatients aged 3–36 months with temperatures of 39°C and higher in 10 US hospitalsbetween 1987 and 1991 to examine predictors for occult pneumococcal bac-teremia.7 A total of 164 patients (2.5%) had occult pneumococcal bacteremia(OPB). The authors performed a split derivation and validation to derive a model for predicting the presence of OPB. In univariable analysis, theyreported that patients with occult bacteremia were younger, more frequentlyill-appearing, and had higher temperatures, WBC counts, ANCs, and abso-lute band cell counts than patients without bacteremia. In the multivariableanalysis three variables were independently significant: (i) ANC with an oddsration (OR) of 1.15 (95% CI: 1.06–1.25) for each increase of 1000 cells/mm3;(ii) temperature with an OR of 1.77 (95% CI: 1.21–2.58) for each 1°Cincrease; and (iii) age younger than two years with an OR of 2.43 (95% CI:1.11–5.3). They reported that 8.1% of patients with an ANC greater than 10 000 cells/mm3 had occult bacteremia compared to 0.8% of those with acount less than 10 000 cells/mm3.
9781405154000_4_019.qxd 19/03/2008 11:01 Page 146

Chapter 19: Serious Bacterial Infections 147
Clinical question four
“In the age of pneumococcal conjugate vaccination are vaccinated children still atrisk of pneumoccocal bacteremia?”A recent study sought to answer this question. The authors performed a non-concurrent prospective observational cohort study.8 They enrolled patientsaged less than 36 months with temperatures exceeding 38°C. Of 3571 eligiblepatients, 1428 had blood cultures. Of those, 833 had received at least oneimmunization with a heptavalent pneumococcal vaccine. In the group thathad received the vaccine, no patients had positive pneumococcal blood cultures compared with 13 (2.4%) in the non-immunized group.
Comment
The majority of children who are evaluated for fever when aged three years or younger will have a self-limited viral illness. Before the advent of the HIB and pneumococcal conjugate vaccines about 10% of these children with an unknown source of infection had occult bacteremia and SBI. Recentstudies have found lower rates of SBI (<2%). It appears clear, though, that any infant who is younger than 29 days old should have a full work-up, and be admitted and treated with empirical antibiotics. Children who appearnon-toxic, between 1 and 36 months old, with no apparent source of fever,and who have received their vaccinations, can undergo risk stratificationthrough laboratory analysis and can be sent home with close follow-up.However, many of the studies that used the Philadelphia protocol andRochester criteria are small single-center studies and have not been validatedin large cohorts of children.
In light of recent change in the microbiology of infection in this age group because of the reduced rates of infection by pneumoccous and HIB,evaluation and treatment recommendations are certainly evolving and may be modified as newer data is published. However, we recommend a cautiousapproach to every febrile child under three years old because of the potentialfor poor outcomes in the case of untreated SBI.
References
1. Baker, M.D., Bell, L.M. and Avner, J.R. (1993) Outpatient management withoutantibiotics of fever in selected infants. New England Journal of Medicine 329(20):1437–1441.
2. Baker, M.D., Bell, L.M. and Avner, J.R. (1999) The efficacy of routine outpatientmanagement without antibiotics of fever in selected infants. Pediatrics 103(3):627–631.
9781405154000_4_019.qxd 19/03/2008 11:01 Page 147
148 Chapter 19: Serious Bacterial Infections
3. Dagan, R., Powell, K.R., Hall, C.B. and Menegus, M.A. (1985) Identification ofinfants unlikely to have serious bacterial infection although hospitalized for suspected sepsis. Journal of Pediatrics 107(6): 855–860.
4. Dagan, R., Sofer, S., Phillip, M. and Shachak, E. (1988) Ambulatory care of febrileinfants younger than 2 months of age classified as being at low risk for having serious bacterial infections. Journal of Pediatrics 112(3): 355–360.
5. Garra, G., Cunningham, S.J. and Crain, E.F. (2005) Reappraisal of criteria used topredict serious bacterial illness in febrile infants less than 8 weeks of age. AcademicEmergency Medicine 12(10): 921–925.
6. Baker, M.D. and Bell, L.M. (1999) Unpredictability of serious bacterial infections in febrile infants from birth to 1 month of age. Archives of Pediatric AdolescentMedicine 153: 508–511.
7. Kuppermann, N., Fleisher, G.R. and Jaffe, D.M. (1998) Predictors of occult pneumococcal bacteremia in young febrile children. Annals of Emergency Medicine31: 679–687.
8. Carstairs, K.L., Tanen, D.A., Johnson, A.S., Kailes, S.B. and Riffenburgh, R.H.(2007) Pneumococcal bacteremia in febrile infants presenting to the emergencydepartment before and after the introduction of the heptavalent pneumococcalvaccine. Annals of Emergency Medicine 49(6): 772–777.
9781405154000_4_019.qxd 19/03/2008 11:01 Page 148

149
Chapter 20 Bacterial Meningitis in Children
Highlights
• All children suspected of having meningitis should undergo a lumbar
puncture.
• The Bacterial Meningitis Score (BMS) is a simple decision rule that
discriminates bacterial meningitis from aseptic meningitis with high
sensitivity in children with cerebrospinal fluid (CSF) pleocytosis.
Background
Meningitis in a child can be suspected based upon history and physical exam-ination alone, but confirming the diagnosis requires a lumbar puncture andexamination of the CSF. CSF pleocytosis is defined as a CSF white blood cell(WBC) count of 10 cells/µL or above, with a correction made for the presence ofCSF red blood cells (RBCs) using a 1:500 ratio of leukocytes to erythrocytes.When evaluating a child with CSF pleocytosis, the most common diagnosis isaseptic meningitis (in more than 80–90% of cases); however, bacterial menin-gitis is still present in a small proportion of patients. Completely excludingbacterial meningitis requires a negative CSF culture (which takes 2–3 days).When there is CSF pleocytosis, most children are admitted for broad spectrumantibiotics while waiting for culture results. The advent of two vaccines, theHaemophilus influenzae type B (HIB) and the pneumoccoal conjugate vaccines,have significantly reduced the incidence of bacterial meningitis in children inthe US. Because the prevalence of bacterial meningitis in children with CSFpleocytosis is low, a clinical decision rule to identify children that are at verylow risk for meningitis at the time of clinical presentation may limit unneces-sary hospital admissions and antibiotic use in aseptic meningitis.
9781405154000_4_020.qxd 19/03/2008 11:01 Page 149
Evidence-Based Emergency Care: Diagnostic Testing and Clinical Decision Rules. J.M. Pines andW.W. Everett. 2008 Jesse M. Pines and Worth W. Everett, ISBN: 978-1-4051-5400-0.

150 Chapter 20: Bacterial Meningitis in Children
The BMS was recently validated across 20 academic medical centers in thepost-HIB and post-pneuococcal vaccine era. While there have been manyother clinical decision rules derived to answer this question, most have not been internally or externally validated. In addition, many rules were pub-lished in the pre-HIB and pre-pneumococcal vaccine eras.
Clinical question
“What is the BMS and how can this be used to rule out bacterial meningitis at thetime of clinical presentation in children with CSF pleocytosis?”The BMS was developed by Nigrovic and colleagues to classify patients withCSF pleocytosis who are at very low risk of bacterial meningitis.1 This clinicaldecision rule states that patients are at very low risk of bacterial meningitis ifthey lack all of the following criteria:• a positive CSF Gram stain;• a CSF absolute neutrophil count (ANC) of 1000 cells/µL or above;• a CSF protein level of 80 mg/dL or above;• a peripheral blood ANC of 10 000 cells/µL or above; and• a history of seizure before or at the time of presentation.The BMS was derived from a study of 696 children aged from 29 days to 19 years old who were hospitalized with CSF pleocytosis at one center. Theoverall prevalence of bacterial meningitis was 18%. The authors performed asplit derivation and validation study and used multivariable logistic regres-sion and recursive partitioning to derive the clinical prediction rule. A BMSwas calculated by giving two points for a positive CSF Gram stain and onepoint for each other variables, if present. They found that a BMS equal to zero identified patients with aseptic meningitis with 100% accuracy and didnot misclassify any child with bacterial meningitis in the validation set. Thenegative predictive value for a score of zero was 100% (95% CI: 97–100) and aBMS of two or above predicted the presence of bacterial meningitis with asensitivity of 87% (95% CI: 72–96).
The BMS was recently validated using a multicenter retrospective cohortstudy in 20 US academic medical centers.2 This included all children betweenthe ages of 29 days and 19 years old who presented from January 2001 to June2004 with CSF pleocytosis, and who had not received any antibiotics prior to lumbar puncture. In 3295 patients with CSF pleocytosis, 3.7% (95% CI:3.1–4.4) had bacterial meningitis and the remainder had aseptic meningitis.There were 1714 children who were categorized as low risk by the BMS (i.e.score = 0). Of those, two were identified with bacterial meningitis at a sensit-ivity of 98.3% (95% CI: 94.2–99.8) and a negative predictive value of 99.9%(95% CI: 99.6–100). Both of the patients with bacterial meningitis and BMS
9781405154000_4_020.qxd 19/03/2008 11:01 Page 150

Chapter 20: Bacterial Meningitis in Children 151
scores of zero were less than two months old. From this, the authors con-cluded that the BMS is an accurate clinical decision rule that imparts a verylow risk of bacterial meningitis (0.1%) in patients with none of the criterialisted above.
Comment
In a large multicenter study, the BMS seemed to accurately discriminate children with CSF pleocytosis and aseptic meningitis from those with bac-terial meningitis, with close to 100% sensitivity. The BMS is a simple and easy to use scoring system that involves routinely collected data. This may bevery helpful to clinicians in distinguishing children with pleocytosis that may be candidates for outpatient management because they have a very low likelihood of bacterial meningitis. There has been an external validationof the BMS in two small studies in France which confirmed a sensitivity ofalmost 100%.3
There are two considerations that must be taken into account when usingthe BMS to guide clinical management. First, because the BMS was designedto identify patients at low risk for bacterial meningitis only, some patientswho may benefit from antimicrobial therapy, such as those with Lymemeningitis and herpes simplex virus encephalitis may not be captured by theBMS. We therefore recommend that the BMS be used in conjunction with aclinical assessment of the patient for other important and treatable infections.Second, because the two cases of meningitis that were missed by the BMS in the multicenter validation study involved children under two months ofage, we would recommend exercising caution when applying the BMS to thishigh-risk population.
References
1. Nigrovic, L.E., Kuppermann, N. and Malley, R. (2002) Development and valida-tion of a multivariable predictive model to distinguish bacterial from asepticmeningitis in children in the post-Haemophilus influenzae era. Pediatrics 110:712–719.
2. Nigrovic, L.E., Kuppermann, N., Macias, C.G., et al. (2007) Clinical prediction rule for identifying children with cerebrospinal fluid pleocytosis at very low risk of bacterial meningitis. Journal of the American Medical Association 297: 52–60.
3. Dubos, F., Lamotte, B., Bibi-Triki, F., et al. (2006) Clinical decision rules to dis-tinguish between bacterial and aseptic meningitis. Archives of Disease in Childhood91: 647–650.
9781405154000_4_020.qxd 19/03/2008 11:01 Page 151

152
Chapter 21 Necrotizing Fasciitis
Highlights
• Necrotizing fasciitis is a rare but potentially lethal condition that requires
early recognition and aggressive surgical treatment.
• The Laboratory Risk Indicator for Necrotizing Fasciitis (LRINEC) score uses
routine blood test results that can discriminate necrotizing fasciitis from
severe cellulitis/abscess.
• The LRINEC criteria still need to be validated in an external setting before
widespread use can be recommended.
Background
Necrotizing fasciitis is a rapidly progressive infection involving the fascia and subcutaneous tissue (Fig. 21.1). Differentiating necrotizing fasciitis fromother skin and soft tissue infections is important in the emergency depart-ment (ED) because while necrotizing fasciitis is a rare disease, it can result in high morbidity and mortality rates. According to some reports, mortality as a result of necrotizing fasciitis can approach 34%. Necrotizing fasciitis is a surgical disease and the early recognition and debridement of necrotic fascia and other involved areas are major determinants of overall outcome(Fig. 21.2). A delay in debridement has been associated with poorer survival.
Early on, necrotizing fasciitis can be difficult to distinguish from otherforms of soft tissue infections, such as cellulitis and abscess. While computedtomography, magnetic resonance imaging, and ultrasound have been shownto be useful in distinguishing necrotizing fasciitis from other clinical entities,the choice of which patients to perform either rule-out or rule-in imagingstudies on has been a source of controversy.
9781405154000_4_021.qxd 19/03/2008 11:00 Page 152
Evidence-Based Emergency Care: Diagnostic Testing and Clinical Decision Rules. J.M. Pines andW.W. Everett. 2008 Jesse M. Pines and Worth W. Everett, ISBN: 978-1-4051-5400-0.

Chapter 21: Necrotizing Fasciitis 153
ANATOMY
Epidermis ErysipelasImpetigoFolliculitisEcthymaFurunculosisCarbunculosis
Cellulitis
Necrotizingfasciitis
Myonecrosis(clostridial andnon-clostridial)
Dermis
Skin
Superficial fasciaSubcutaneous tissue
Deep fascia
Muscle
Subcutaneous fat,nerves, arteries, veins
SYNDROME
Figure 21.1 Schematic of the different layers of skin and the corresponding infectionsassociated with each layer.
(a) (b)
Figure 21.2 (a) A suspected case of necrotizing fasciitis. Left foot shown with oozingwound, dusky skin, and bullae formation. (b) Surgical exploration resulted in extensivedebridement. (Source: Hall et al. Principles of Critical Care 3rd Edition © 2005.Reproduced with permission of The McGraw-Hill Companies.)
9781405154000_4_021.qxd 19/03/2008 11:00 Page 153
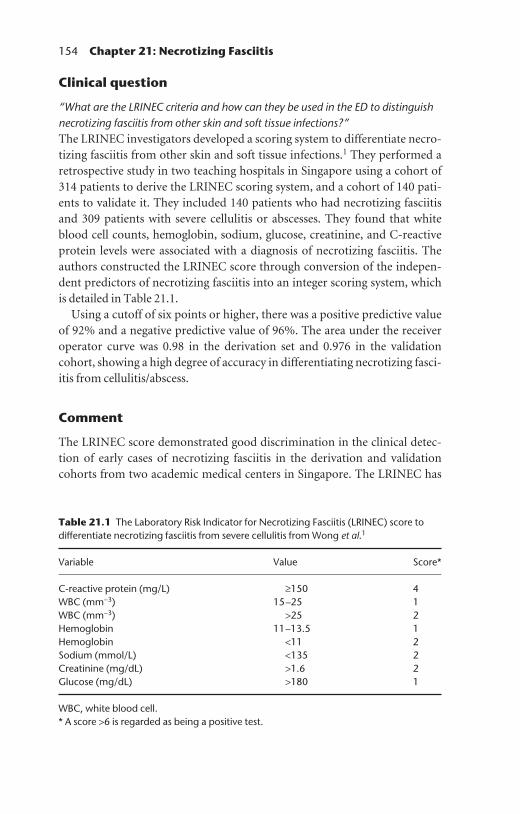
154 Chapter 21: Necrotizing Fasciitis
Clinical question
“What are the LRINEC criteria and how can they be used in the ED to distinguishnecrotizing fasciitis from other skin and soft tissue infections?”The LRINEC investigators developed a scoring system to differentiate necro-tizing fasciitis from other skin and soft tissue infections.1 They performed aretrospective study in two teaching hospitals in Singapore using a cohort of314 patients to derive the LRINEC scoring system, and a cohort of 140 pati-ents to validate it. They included 140 patients who had necrotizing fasciitisand 309 patients with severe cellulitis or abscesses. They found that whiteblood cell counts, hemoglobin, sodium, glucose, creatinine, and C-reactiveprotein levels were associated with a diagnosis of necrotizing fasciitis. Theauthors constructed the LRINEC score through conversion of the indepen-dent predictors of necrotizing fasciitis into an integer scoring system, which is detailed in Table 21.1.
Using a cutoff of six points or higher, there was a positive predictive valueof 92% and a negative predictive value of 96%. The area under the receiveroperator curve was 0.98 in the derivation set and 0.976 in the validationcohort, showing a high degree of accuracy in differentiating necrotizing fasci-itis from cellulitis/abscess.
Comment
The LRINEC score demonstrated good discrimination in the clinical detec-tion of early cases of necrotizing fasciitis in the derivation and validationcohorts from two academic medical centers in Singapore. The LRINEC has
Table 21.1 The Laboratory Risk Indicator for Necrotizing Fasciitis (LRINEC) score todifferentiate necrotizing fasciitis from severe cellulitis from Wong et al.1
Variable Value Score*
C-reactive protein (mg/L) ≥150 4WBC (mm−3) 15–25 1WBC (mm−3) >25 2Hemoglobin 11–13.5 1Hemoglobin <11 2Sodium (mmol/L) <135 2Creatinine (mg/dL) >1.6 2Glucose (mg/dL) >180 1
WBC, white blood cell.* A score >6 is regarded as being a positive test.
9781405154000_4_021.qxd 19/03/2008 11:00 Page 154

Chapter 21: Necrotizing Fasciitis 155
not yet been validated in a separate population; however, given its high accuracy in differentiating necrotizing fasciitis from other less severe infections, ED physicians should consider using the LRINEC scoring systemor the laboratory abnormalities detailed within it, along with their clinicalevaluation, in selecting patients for imaging studies to rule out necrotizingfasciitis.
Reference
1. Wong, C.H., Khin, L.W., Heng, K.S., et al. (2004) The LRINEC (Laboratory RiskIndicator for Necrotizing Fasciitis) score: a tool for distinguishing necrotizing fasciitis from other soft tissue infections based on routine laboratory testing.Critical Care Medical 32(7): 1535–1541.
9781405154000_4_021.qxd 19/03/2008 11:00 Page 155

156
Chapter 22 Pharyngitis
Highlights
• Differentiating bacterial pharyngitis (group A streptococci; GAS) from other
causes of sore throat is a clinical challenge.
• The Centor criteria can predict the probability of a GAS infection based on
clinical criteria.
• Patients with intermediate scores may benefit from confirmatory rapid strep
testing or cultures before starting therapy, to avoid the overtreatment of viral
infections.
Background
The complaint of sore throat is common in emergency medicine. The mostcommon bacterial cause for sore throat is GAS. The prevalence of GASpharyngitis in patients with sore throat is 15–36% for children and 5–17%for adults. The value of using antibiotics has been debated in this diseasebecause it usually resolves spontaneously, without complications. However,antibiotics are recommended in cases where there is a high likelihood of, or culture-confirmed, streptococcal infection of the throat.
The reasons for treating patients with antibiotics are to prevent com-plications, reduce symptoms, and to prevent the transmission of disease toothers. A recent Cochrane review found that at three days antibiotics reduced symptoms of sore throat, headache and fever.1 Complications following GASpharyngitis include suppurative (acute otitis media and sinusitis) and non-suppurative (acute glomerulonephritis and rheumatic fever) complications.In general, antibiotics tend to reduce the incidence of suppurative complica-tions considerably—by about a quarter in acute otitis media and by about a
9781405154000_4_022.qxd 19/03/2008 11:00 Page 156
Evidence-Based Emergency Care: Diagnostic Testing and Clinical Decision Rules. J.M. Pines andW.W. Everett. 2008 Jesse M. Pines and Worth W. Everett, ISBN: 978-1-4051-5400-0.

Chapter 22: Pharyngitis 157
half in acute sinusitis. Antibiotics reduce the likelihood of rheumatic fever byabout a third.
There are no standardized diagnostic testing guidelines to follow whendeciding which emergency department (ED) patients with a sore throat requireantibiotic therapy. However, many of the guidelines available base their strategyon a clinical scoring system for either not treating, testing further (with eithera rapid strep test or throat culture), or empirically treating with antibiotics.
Clinical question one
“Which physical examination findings alter the likelihood of a positive GAS culturein patients with a sore throat?”A recent systematic review compiled data and calculated likelihood ratios(LR+ and LR−) for clinical findings and the chance of a positive GAS culture.2
The following data is presented with respective 95% confidence intervals(CI): the most predictive elements included pharyngeal exudates [LR+2.1(1.4–3.1); LR− 0.90 (0.75–1.1)], tonsillar swelling/enlargement [LR+ 1.8(1.5–2.3); LR− 0.63 (0.56–0.72)], tender anterior cervical nodes [LR+(1.2–1.9); LR− 0.60 (0.49–0.71)], tonsillar exudates [LR+ 3.4 (1.8–6.0); LR- 0.72 (0.60–0.88)], no cough [LR+ (1.1–1.7); LR− (0.53–0.89)], and strep exposure within the previous two weeks [LR+ 1.9 (1.3–2.8); LR− 0.92(0.86–0.99)]. Notably, no single clinical finding showed a good ability to discriminate through its presence or absence in GAS positive and negativepatients with a sore throat.
Clinical question two
“What are the clinical prediction rules for GAS pharyngitis and how can theyguide therapy for ED patients with a sore throat?”The Centor criteria is a prediction rule based on selected signs and symptomsin patients with pharyngitis that can identify patients at low risk for GASpharyngitis.2 The Centor criteria include: (i) a history of fever; (ii) anteriorcervical adenopathy; (iii) tonsillar exudates; and (iv) the absence of a cough.Using a positive culture for GAS as the gold standard, in the initial derivationstudy of the Centor criteria, probabilities assigned to each score included: a56% probability of a positive culture in patients with four positive criteria, a32% probability with three, a 15% probability with two, 6.5% with one, and2.5% with no positive criteria.3 The Centor criteria have since been validatedin adult populations.
Given that the probability of a strep infection is higher in children becauseof the difference in the prevalence between adults and children, McIssac et al.
9781405154000_4_022.qxd 19/03/2008 11:00 Page 157

158 Chapter 22: Pharyngitis
suggested a revision to the Centor criteria that would take age into account.4
In the McIssac revision, if the patient was under five years old they wouldreceive an additional point, whereas if they were over 45 years old they wouldhave a point subtracted. Using the McIssac modification, the risk of strep-tococcal infection is listed in Table 22.1.
In each case, as we described in Chapter 2, a pre-test odds can be multipliedby the likelihood ratio, which in this instance would hence generate a post-test odds of GAS infection based on these criteria.
Comment
Specific signs and symptoms can increase or reduce the likelihood of patientswith a sore throat having positive throat cultures for GAS. The Centor criteriawith the McIssac modifications have been validated in both adults and chil-dren for use in predicting the probability of GAS pharyngitis. To determinethe probability of GAS and the use of antibiotics, application of these criteriacan be helpful in guiding testing and treatment decisions in the ED.
There is however, considerable controversy over how these rules should beapplied in clinical practice and multiple management strategies have beensuggested. Using two separate criteria as an example, the Infectious DiseaseSociety of America (IDSA) and the American College of Physicians/AmericanSociety of Internal Medicine (ACP-ASIM) have proposed different manage-ment strategies for adults with pharyngitis (see Table 22.2).
The clinical balancing act centers on overtreatment (which may result in the inappropriate use of antibiotics for cases that are not a result of GAS)versus undertreatment (which may result in missed cases). It does make clinical sense given the higher prevalence of GAS pharyngitis in children toemploy a liberal approach to testing, as per the IDSA guidelines in adults.
It should, however, be noted that the use of rapid strep tests is subject tospectrum bias, where there are different test sensitivities at different Centorscores (likelihoods of GAS pharyngitis).6 According to this study, the Centor
Table 22.1 The Centor strep score likelihood ratio (LR) and probability of infectionfrom McIssac et al.4
Points LR Probability of infection
−1 or 0 0.05 1%1 0.52 10%2 0.95 17%3 2.5 35%4 or 5 4.9 51%
9781405154000_4_022.qxd 19/03/2008 11:00 Page 158

Chapter 22: Pharyngitis 159
score corresponded to the following rapid strep test sensitivities: Centor 0 or 1 = 61%; Centor 2 = 76%; Centor 3 = 90%; and Centor 4 = 97%. Given that rapid strep testing is not 100% sensitive, the recommendation of theAmerican Academy of Pediatrics (AAP) is to culture all negative rapid streptests. Given the number of negative tests, a recent guideline recommended bythe AAP and the IDSA organizations was that EDs should consider validatinglocally that rapid strep tests are as sensitive as throat cultures.
References
1. Del Mar, C.B., Glasziou, P.P. and Spinks, A.B. (2003) Antibiotics for sore throat(Cochrane methodology review). In: The Cochrane Library 4. John Wiley & SonsLtd., Chicester, UK.
2. Ebell, M.H., Smith, M.A., Barry, H.C., et al. (2000) The rational clinical examina-tion: does this patient have strep throat? Journal of the American Medical Association284: 2912–2918.
3. Centor, R., Witherspoon, J., Dalton, H., Brody, C. and Link, K. (1981) The diag-nosis of strep throat in adults in the emergency room. Medical Decision Making1(3): 239–246.
4. McIsaac, W.J., Goel, V., To, T., et al. (2000) The validity of a sore throat score infamily practice. Canadian Medical Association Journal 168: 811–815.
5. Centor, R., Allison, J.J. and Cohen, S.J. (2007) Pharyngitis Management: Definingthe Controvery. Journal of General Internal Medical 22: 127–130.
6. DiMatteo, L.A., Lowenstein, S.R., Brimhall, B., et al. (2001) The relationship betweenthe clinical features of pharyngitis and the sensitivity of a rapid antigen test: evidence of spectrum bias. Annals of Emergency Medicine 38: 648–652.
Table 22.2 Adult pharyngitis guidelines for diagnostic testing and treatment withantibiotics (abx) based on the Centor score (adapted from Centor et al. 20075)
Centor score Decision IDSA ACP-ASIM
0 Test No NoTreat No No
1 Test No NoTreat No No
2 Test Rapid Strep Rapid StrepTreat Abx if rapid Strep+ Abx if rapid Strep+
3 Test Rapid Strep No test/rapid StrepTreat Abx if rapid Strep+ Empirical abx/abx if Strep+
4 Test Rapid Strep No testTreat Abx if rapid Strep+ Empirical abx
ACP-ASIM, American College of Physicians/American Society of Internal Medicine; IDSA, Infectious Disease Society of America.
9781405154000_4_022.qxd 19/03/2008 11:00 Page 159

160
Chapter 23 Infective Endocarditis
Highlights
• Infective endocarditis is a challenging diagnosis in the emergency
department (ED).
• The major Duke criteria rely heavily on blood culture and echocardiography
results.
• The minor Duke criteria provide risk factors that emergency physicians can
use to stratify the risk of endocarditis.
• Transesophageal echocardiography is currently the superior method of
evaluation for endocarditis because it is more sensitive in both native and
prosthetic heart valves.
Background
Infective endocarditis is a microbial infection of the endocardial surface ofthe heart that has an incidence of between 1.8 and 7.0 per 100 000 people peryear. Endocarditis is challenging to diagnose, primarily because of the presenceof nonspecific clinical features at ED presentation. Because a missed diag-nosis of endocarditis can lead to poor outcomes, emergency physicians musthave a low threshold for the consideration of this potentially lethal disease.Fever is the most common symptom of endocarditis and some sources reportthat relapsing fevers lasting for a week or more should prompt considerationof this diagnosis. The second most common clinical feature is the presence ofa murmur or evidence of valvular heart disease. Other common signs includesplenomegaly, microscopic hematuria, anemia, and leukocytosis.
Over the past 30 years, there has been a shift in the epidemiology of endo-carditis that has altered the prevalence of common classic cutaneous and
9781405154000_4_023.qxd 19/03/2008 10:59 Page 160
Evidence-Based Emergency Care: Diagnostic Testing and Clinical Decision Rules. J.M. Pines andW.W. Everett. 2008 Jesse M. Pines and Worth W. Everett, ISBN: 978-1-4051-5400-0.

Chapter 23: Infective Endocarditis 161
ophthomologic manifestations such as Oslers nodes, Roth spots, Janewaylesions (Fig. 23.1), splinter hemorrhages, or oral petichiae.1 These changes are primarily attributable to the increase in incidence of endocarditis in prosthetic valve recipients, intravenous drug abusers (IVDA), and geriatricpatients.2 There has also been a shift in the microbiology of endocarditis fromprimarily streptococci species to coagulase-positive and coagulase-negativestaphylococci. This has led to a change in the classic presentation of infectiveendocarditis, where most commonly a patient with IVDA may present moreacutely with right-sided valvular infections caused by Staphalococcus aureuswithout the classic peripheral stigmata of endocarditis.
Figure 23.1 Janeway lesions from bacterial endocarditis. (Source: Wolff et al.Fitzpatrick’s Color Atlas and Synopsis of Clinical Dermatology 4th Edition © 2001.Reproduced with permission of The McGraw-Hill Companies.)
Figure 23.2 Apical four-chamber view demonstrating a large mitral valve vegetation(arrow). RA, right atrium; LA, left atrium; LV, left ventricle; RV, right ventricle. (Courtesyof Anthony Dean, MD.)
9781405154000_4_023.qxd 19/03/2008 10:59 Page 161

162 Chapter 23: Infective Endocarditis
Clinical question
“What is the most accurate method of diagnosing suspected infectiveendocarditis in the ED?”The best criteria for the diagnosis of endocarditis are the Duke criteria, whichwere initially suggested in 1994 by Dureck et al.3 The Duke criteria werederived using 405 consecutive cases of suspected infective endocarditis in 353 patients between 1985 and 1992. The authors defined two ‘major criteria’(positive blood culture and positive echocardiogram (Fig. 23.2) ) and six ‘minorcriteria’ (predisposition, fever, vascular phenomena, immunologic phenomena,suggestive echocardiogram, and suggestive microbiologic findings). They alsodefined three distinct diagnostic categories: ‘definite’ by pathologic or clinicalcriteria, ‘possible,’ and ‘rejected.’ A definite case was stated to be when therewas direct evidence of infectious endocarditis based on histology or bacteriologyof a vegetation or peripheral embolus. There were a total of 69 pathologicallyconfirmed cases of definite endocarditis, and 55 (80%) of these were classifiedclinically as definite endocarditis. Table 23.1 provides a list of the Duke criteria.
Other studies have investigated how well the Duke criteria work in exclud-ing a diagnosis of infective endocarditis. Dodd et al. investigated the long-term follow-up study of 49 episodes where there was suspected endocarditisbut the diagnosis of endocarditis was rejected by the Duke criteria.4 Of these, 63% had a firm alternative diagnosis established at the time of initial
Criteria definitions
Microorganisms: demonstrated by culture orhistology in a vegetation, in a vegetation that has embolized or in an intracardiac abscessorPathologic lesions: vegetation or intracardiacabscess present, confirmed by histology showingactive endocarditis
Findings of endocarditis that fall short of definite,but not rejected
Firm alternate diagnosis explaining evidence of IEorResolution of endocarditis syndrome, withantibiotic therapy for ≤4 daysorNo pathologic evidence of IE at surgery orautopsy, after antibiotic therapy for ≤4 days
Diagnostic category
Definite IE
Possible IE
Rejected (i.e. not IE)
Table 23.1 The Duke criteria for infective endocarditis (IE)
Criteria type
Pathologic
Clinical
9781405154000_4_023.qxd 19/03/2008 10:59 Page 162
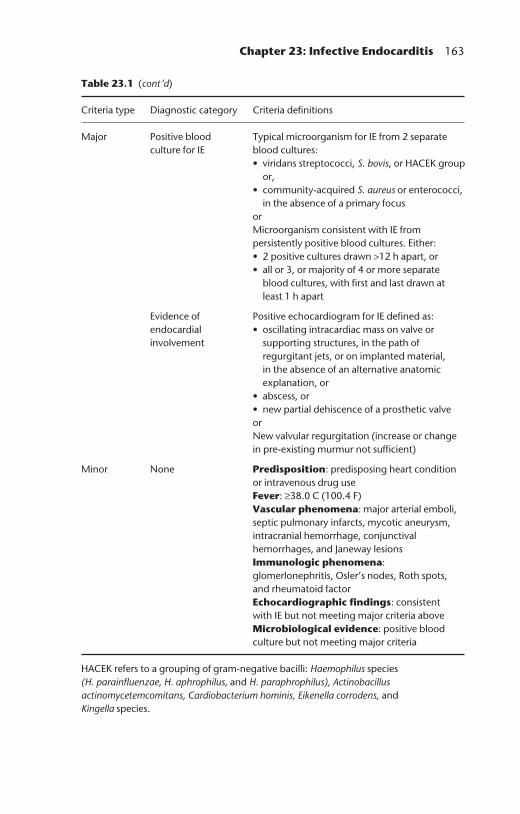
Table 23.1 (cont’d)
Criteria type
Major
Minor
HACEK refers to a grouping of gram-negative bacilli: Haemophilus species (H. parainfluenzae, H. aphrophilus, and H. paraphrophilus), Actinobacillusactinomycetemcomitans, Cardiobacterium hominis, Eikenella corrodens, and Kingella species.
Chapter 23: Infective Endocarditis 163
Criteria definitions
Typical microorganism for IE from 2 separateblood cultures:• viridans streptococci, S. bovis, or HACEK group
or,• community-acquired S. aureus or enterococci,
in the absence of a primary focusorMicroorganism consistent with IE frompersistently positive blood cultures. Either:• 2 positive cultures drawn >12 h apart, or• all or 3, or majority of 4 or more separate
blood cultures, with first and last drawn atleast 1 h apart
Positive echocardiogram for IE defined as:• oscillating intracardiac mass on valve or
supporting structures, in the path ofregurgitant jets, or on implanted material, in the absence of an alternative anatomicexplanation, or
• abscess, or• new partial dehiscence of a prosthetic valveorNew valvular regurgitation (increase or changein pre-existing murmur not sufficient)
Predisposition: predisposing heart conditionor intravenous drug useFever: ≥38.0 C (100.4 F)Vascular phenomena: major arterial emboli,septic pulmonary infarcts, mycotic aneurysm,intracranial hemorrhage, conjunctivalhemorrhages, and Janeway lesionsImmunologic phenomena:glomerlonephritis, Osler’s nodes, Roth spots, and rheumatoid factorEchocardiographic findings: consistent with IE but not meeting major criteria aboveMicrobiological evidence: positive bloodculture but not meeting major criteria
Diagnostic category
Positive bloodculture for IE
Evidence ofendocardialinvolvement
None
9781405154000_4_023.qxd 19/03/2008 10:59 Page 163

164 Chapter 23: Infective Endocarditis
evaluation, 35% had syndromes that resolved spontaneously following fouror fewer days of antibiotic treatment, and one patient had endocarditis ruled out at the time of heart surgery. Follow-up information was obtained for allpatients at three months post-hospitalization. There was one patient who hada diagnosis of prosthetic-valve endocarditis and one patient who died, with adiagnosis of possible endocarditis on autopsy.
The Duke criteria have also been applied to a group of 100 patients withfever of unknown origin who had multiple blood cultures and who under-went echocardiography, in order to calculate the specificity of the criteria.5
Similar to the study by Dodd et al., 65% had an alternative diagnosis and 35%had a clinical syndrome that resolved after either short-term or no antibiotictherapy. There was only one patient who was misclassified as negative by theDuke criteria, making the criteria 99% specific.
Recently it has been proposed that the Duke criteria should be revised andthe minor criteria, ‘echocardiogram consistent with infective endocarditis,’eliminated as a result of the use of transesophageal echocardiography. Therehave been other recent suggestions for modifications, including adding fur-ther minor criteria, such as splenomegaly and a C-reactive protein (CRP) of 100 mg/L or above. In addition, other adjunctive testing, such as for pro-calcitonin levels, have been suggested to aid in the diagnosis of infectiveendocarditis. Mueller et al. performed a prospective cohort study in 67 pati-ents admitted with the suspicion of infective endocarditis and inpatients withsuspected endocarditis.6 Infective endocarditis was diagnosed by the Dukecriteria and confirmed in 21 patients. Procalcitonin levels were found to behigher in patients with endocarditis (median 6.56 ng/mL) than in those without(median 0.44 ng/mL, P<0.001). The optimal concentration of procalcitoninfor calculating positive and negative predictive values was 2.3 ng/mL. With thiscutoff, the test characteristics for procalcitonin were: sensitivity 81%, speci-ficity 85%, negative predictive value 92%, and positive predictive value 72%.
The choice of echocardiograhic imaging technique has been the subject of controversy when comparing transthoracic echocardiography (TTE) totransesophageal echocardiography (TEE). Because in TEE the transducer is in much closer proximity to the heart, there is an improved ability to visualizesmaller structures including small vegetations, leaflet perforations, and small(<5 mm) abscesses. TEE is currently the superior method of evaluation forendocarditis as it is more sensitive in both native and prosthetic heart valves.
Comment
In the context of the diagnosis of endocarditis in the ED, the major microbio-logical Duke criteria cannot be met on initial evaluation unless blood cultures
9781405154000_4_023.qxd 19/03/2008 10:59 Page 164
Chapter 23: Infective Endocarditis 165
are drawn in advance. Patients may be evaluated for endocarditis by the use ofa TTE or a TEE. A TEE in the ED is technically more challenging because it requires sedation. Echocardiograms are also not a commonly ordered EDtest unless the patient is unstable or an emergent echocardiogram is guid-ing ED management. Even in emergency cases, some hospital EDs may have limited access to echocardiography.
However, emergency echocardiograms can change the management of apatient within the ED, particularly in the presence of an intracardiac abscess.The most common life-threatening complication of infective endocarditis is congestive heart failure, with the most common cause being infection-induced valvular damage. Because heart failure is a common ED presentation,infective endocarditis should be considered in patients with new murmursand acute congestive heart failure in an appropriate clinical setting (i.e. whereother risk factors such as IVDA are present).
While TEE is the current recommended test for ruling out endocarditis,particularly for patients with suspected, complicated infective endocarditisand for patients with suspected prosthetic valve endocarditis, this may beeven more difficult to order in the ED than a traditional TTE.7 Procalci-tonin levels may be helpful in diagnosing endocarditis in the ED; however,procalcitonin levels may also be difficult to order on an emergency basis,depending upon the laboratory. C-reactive protein levels may be easier toorder on an emergency basis, but these are relatively nonspecific. Becauseblood cultures are the most important laboratory diagnostic test in suspectedendocarditis and can provide antibiotic suspectibility results that can guidelong-term treatment, the current recommendation is to draw three sets ofblood cultures.
The Duke minor criteria provide factors by which an emergency physicianmay stratify risk of endocarditis. The presence of a predisposing heart con-dition such as rheumatic heart disease, valvular heart disease or other abnorm-alities, or IVDA should raise suspicion for endocarditis in the context of afever or other symptoms of infection. Other risk factors include indwellingcatheters and patients on long-term hemodialysis; other considerations in the evaluation of infective endocarditis include the presence of a previouslyundocumented heart murmur. Vascular phenomenon and immunologicphenomenon should be evaluated on physical examination in these patientsas these are minor criteria. However, given the change in the microbiologyand epidemiology of endocarditis over the past 30 years, these types of lesionsare less frequently seen. Some thought should also be given to including thepresence of leukocytosis, microscopic hematuria, and anemia in the evalu-ation of suspected endocarditis, as these are commonly ordered tests and maybe present in endocarditis.
9781405154000_4_023.qxd 19/03/2008 10:59 Page 165

166 Chapter 23: Infective Endocarditis
References
1. Bayer, A.S. (1996) Diagnosis and management of infectious endocarditis. Cardio-logy Clinical 14(3): 345–351.
2. Bayer, A.S. (1993) Infectious endocarditis: state of the art. Clinical InfectiousDiseases 17: 313–322.
3. Dureck, D.T., Lukes, A.S. and Bright, D.K. and the Duke Endocarditis Service.(1994) New criteria for diagnosis of infective endocarditis: utilization of specificechocardiographic findings. American Journal of Medicine 96(3): 200–209.
4. Dodds, G.A. III, Sexton, D.J., Durack, D.T., et al. and the Duke EndocarditisService. (1996) Negative predictive value of the Duke criteria for infective endo-carditis. American Journal of Cardiology 77: 403–407.
5. Hoen, B., Beguinot, I., Maignan, M., et al. (1996) The Duke criteria for the diag-nosis of infective endocarditis are specific: An analysis of 100 patients with acutefever or fever of unknown origin. Clinical Infectious Diseases 23(2): 298–302.
6. Mueller, C., Huber, P., Laifer, G., et al. (2004) Procalcitonin and the early diagnosisof endocarditis. Circulation 109: 1707–1710.
7. Horstkotte, D., Follath, F., Gutschik, E., et al. (2004) Guidelines on prevention,diagnosis and treatment of infective endocarditis – executive summary. EuropeanHeart Journal 25: 267–276.
9781405154000_4_023.qxd 19/03/2008 10:59 Page 166
167
Chapter 24 Urinary Tract Infection
Highlights
• Urinary tract infections (UTIs) commonly affect young women and older
men with disorders of the prostate.
• Urine culture is the gold standard for UTIs and results are not available at
the time of emergency department (ED) care.
• Urine dipsticks are not highly sensitive indicators of positive urine cultures;
however, information from the urine dipstick can be used in conjunction
with clinical pre-test probability.
• Because UTI symptoms and dipstick testing are not highly sensitive and
specific, patients should receive a full examination (including pelvic
examinations), especially if vaginal symptoms are present.
Background
Urinary tract infections (UTI) are common complaints in emergency medi-cine practice. Young women account for most of the seven million UTIs peryear. UTIs are relatively uncommon in young men and tend to affect older men and be associated with disorders of the prostate. The most com-mon way to diagnose UTIs in the ED is via either a urine dipstick test, whichmeasures urinary leukocytes, nitrite, blood, protein, and pH, or laboratoryurinalysis.
The diagnosis of UTI can be difficult in the ED because of the often incon-sistent relationship between the clinical symptoms, bacteriuria and pyuria. Inaddition, because the gold standard test (urine culture) cannot be completedin the ED because it can take 2–3 days to grow, emergency physicians mustdiagnose and treat UTIs without gold standard testing. There are problems
9781405154000_4_024.qxd 19/03/2008 10:59 Page 167
Evidence-Based Emergency Care: Diagnostic Testing and Clinical Decision Rules. J.M. Pines andW.W. Everett. 2008 Jesse M. Pines and Worth W. Everett, ISBN: 978-1-4051-5400-0.
168 Chapter 24: Urinary Tract Infection
with both overtreatment and misdiagnosis of UTIs in EDs and ambulatorysettings given the common complaints and multiple alternative etiologies(i.e. vaginal or cervical infections).
Clinical question one
“What is the sensitivity and specificity of urine dipstick and urinalysis fordiagnosing urinary tract infections in the ED?”There are many studies that have directly addressed this question. We describetwo relevant studies in this chapter. Semeniuk and Church evaluated the use of leukocyte esterase and nitrite as screening tests for the detection of bacteriuria in women with suspected uncomplicated urinary tract infec-tions in a non-ED setting.1 Subsequently, Lammers et al. published a study investigating the test characteristics of urine dipstick and urinalysis in ED andintermediate care patients.2
The paper by Semeniuk and Church reported data on 479 women andsought to determine the sensitivity and specificity as well as the predictive values for urinalysis, as compared with differing quantitative cutoffs, fordefining a positive urine culture [i.e. 103–105 colony-forming units (CFU)/mL].The highest sensitivities for urinalysis were demonstrated with the presenceof both nitrite and leukocyte esterase (84%), and with leukocyte esterasealone (84%), at a cutoff of 105 CFU/mL. Interestingly, the presence of leukocyte esterase alone had a very low positive predictive value (PPV) at allCFU cutoffs (3–19%), while the PPVs of nitrite and leukocyte esterasetogether or nitrite alone were higher (84% and 75%, respectively), using acutoff of 105 CFU/mL. The negative predictive values (NPVs) were all veryhigh for the absence of any leukocyte esterase or nitrite, with values rangingfrom 97–99%. This study concluded that women with urinary tract symptomscan have low levels of bactiuria (less than 105 CFU/mL), and that this mayrepresent urethral colonization. They also highlighted the fact that 19% ofpositive cultures with significant bacteriuria (>105 CFU/mL) would havebeen missed if a urine culture had not been ordered.
Lammers et al. carried out a prospective, observational study investigatingthe test characteristics of both urine dipstick and urinalysis using multipletest cutoff points in females with symptoms of a UTI (dysuira, urgency, orurinary frequency on history, or suprapubic or costovertebral angle tender-ness on examination) who were seen in the ED and an intermediate care center. They excluded patients who had taken antibiotics within the previous72 h, or who had indwelling Foley cathethers, symptomatic vaginal discharge,diabetes, or human immunodeficiency virus (HIV). A positive urine culturein this study was treated as the gold standard; this was defined as having more
9781405154000_4_024.qxd 19/03/2008 10:59 Page 168

Chapter 24: Urinary Tract Infection 169
than 105 CFU/mL of one or two uropathogenic bacteria at 48 h after collec-tion. In 349 patients, a little less than half had positive cultures. Urine dipstickresults were defined as positive when either nitrite or leukocyte esterase werepositive, or when blood was more than trace; the overtreatment rate was 47%(defined as 1–PPV) and the undertreatment rate was 13%. By defining a positive urinalysis as having more than three white blood cells per high powerfield, or when red blood cells were in excess of five per high power field, the overtreatment rate was 44% and the undertreatment rate was 11%. Theauthors concluded that similar overtreatment and undertreatment rates wereidentified for various test cutoff points for urine dipstick tests and urinalysis.
Clinical question two
“How does the addition of clinical symptoms augment the predictive value forurine dipsticks?”One study originating from the UK directly addressed this question.3 Littleand colleagues sought to estimate dipstick and clinical predictors of UTI in a primary care setting. They studied 429 women with symptoms of UTI andused a low cutoff (103 CFU/mL) as the gold standard. They found that nitrite,leukocyte esterase and blood (trace or greater) independently predicted thepresence of UTIs with respective odds ratios of 6.36, 4.52, and 2.23. A dipstick-only decision rule, which included having either nitrite or leukocyteesterase and blood, was 77% sensitive and 70% specific, with a PPV of 81%and an NPV of 65%. If all three were negative, the NPV was 73%. A clinicaldecision rule was derived based on having two of the following symptoms:urine cloudiness, an offensive smell, and dysuria and/or noctiuria of moder-ate severity, with sensitivity 65%, specificity 69%, PPV 77%, and NPV 54%.NPV was 71% if there were no clinical features and PPV was 84% if three ormore symptoms were present. Interestingly, the performance of the clinicalprediction rule was not improved by adding together both the dipstick andclinical results. The authors were also concerned that their data differed considerably with regard to NPVs for leukocyte esterease, nitrite, and blood,with reported NPVs in the range 50–70% compared to values approaching90–100% in other studies.
Comment
This chapter highlights the continued difficulty in identifying ED patientswith UTIs without gold standard testing information available at the point ofcare (i.e. urine culture). In the context of clinical ED practice, this short reviewidentifies a number of conclusions and observations from the literature for
9781405154000_4_024.qxd 19/03/2008 10:59 Page 169
170 Chapter 24: Urinary Tract Infection
the care of females with suspected UTIs. First, the performances of urinarydipstick tests and urinalysis were similar in the paper by Lammers et al.and were shown to be not highly sensitive. While one paper should not neces-sarily change practice, this indicates that a point of care urine dipstick may be a reasonable diagnostic endpoint in a classic presentation of UTI (i.e. high pre-test probability). Also, the absence of leukocyte esterase, nitrite, andblood does not fully exclude UTI. Clinical judgment and patient resourcesshould be balanced when deciding to treat patients with negative tests andclassic symptoms. One caveat to consider when reviewing these studies is that the authors described the use of dipsticks in what were effectively idealclinical settings where patients with vaginal complaints were excluded. In ED practice a full evaluation, including a pelvic examination, should be performed on women with any vaginal symptoms, even in the absence of apositive dipstick test.
References
1. Semeniuk, H. and Church, D. (1999) Evaluation of the leukocyte esterase andnitrite urine dipstick screening tests for detection of bactiuria in women with suspected uncomplicated urinary tract infections. Journal of Clinical Microbiology37: 3051–3052.
2. Lammers, R.L., Gibson, S., Kovacs, D., et al. (2001) Comparison of test character-istics of urine dipstick and urinalysis at various test cutoff points. Annals ofEmergency Medicine 38: 505–512.
3. Little, P., Turner, S., Rumsby, K., et al. (2006) Developing clinical rules to predicturinary tract infections in primary care settings: sensitivity and specificity of nearpatient tests (dipsticks) and clinical scores. British Journal of General Practice56(529): 606–612.
9781405154000_4_024.qxd 19/03/2008 10:59 Page 170

171
Chapter 25 Sinusitis
Highlights
• The vast majority of patients with symptoms of sinus congestion in the
emergency department (ED) will have viral infections.
• The gold standard for the diagnosis of bacterial sinusitis is sinus puncture,
which is not practical in the ED.
• Sinus imaging has been used as a gold standard in some studies, but sinus
imaging is not currently recommended in the ED unless invasive disease is
suspected.
• Certain clinical symptoms and signs are suggestive of acute bacterial sinusitis
including a ‘double sickening’, length of symptoms >10 days, unilateral facial
pain, mucopurulent nasal discharge, unilateral maxillary tenderness, and
maxillary toothache.
• A Task Force on Rhinosinusitis has stratified the diagnosis of acute bacterial
sinusitis on the basis of at least two major factors (facial pain/pressure, facial
congestion/fullness, nasal obstruction, nasal purulence or discolored
postnasal discharge, hyposmia or anosmia, or fever), or one major and two
minor factors (headache, halitosis, fatigue, dental pain, cough, ear pain,
pressure, fullness, or fever). The validity of this recommendation has not
been tested.
Background
The complaint of sinus congestion is very common in emergency care. Themajority of patients with such complaints have viral infections while a smallsubset will have acute bacterial sinusitis, requiring treatment with antibiotics.Acute bacterial sinusitis is typically preceded by a viral upper respiratory tract
9781405154000_4_025.qxd 19/03/2008 10:58 Page 171
Evidence-Based Emergency Care: Diagnostic Testing and Clinical Decision Rules. J.M. Pines andW.W. Everett. 2008 Jesse M. Pines and Worth W. Everett, ISBN: 978-1-4051-5400-0.
172 Chapter 25: Sinusitis
infection, and less commonly by allergic rhinitis. Approximately 0.5–2% of cases of acute viral upper respiratory tract infections will be complicated by acute bacterial sinusitis in adults, while in children the proportion is considerably higher at 6–13%. Therefore, differentiating patients who pre-sent with symptoms of sinus inflammation caused by viral or allergic causescompared with bacterial causes is a clinical challenge for emergency and primary care physicians. The gold standard diagnosis for acute bacterialsinusitis is sinus puncture and culture, both of which are impractical in theED setting. Sinus imaging has been used in some studies as a gold standard.However, imaging is not 100% accurate; in many cases sinus imaging can bepositive and the sinusitis can still be of viral etiology. Currently sinus imagingis not recommended for patients unless more invasive disease (i.e. orbital) is suspected.
Clinical question
“Which clinical features are associated with acute bacterial sinusitis inambulatory ED patients?”Given the absence of a sensitive ED-based test for sinusitis, the diagnosis of acute bacterial sinusitis and the decision to treat with antibiotics is oftenmade on clinical grounds based on the history and physical examination. A strong factor in distinguishing patients with acute bacterial sinusitis is theduration of symptoms. One trial studied the natural course of rhinosinusitisand found that 60% of patients who reported symptoms persisting for at least10 days had a positive bacterial culture from a sinus aspirate. On that basis,consensus groups have recommended different time intervals for making adiagnosis of acute bacterial sinusitis and for subsequent antibiotic therapy.Some groups recommend seven days of symptoms as an appropriate time touse antibiotics, others have recommended that antibiotics should be with-held for up to ten days in children. This recommendation was based on astudy of 2013 children, which found that of those screened at 10 days withWaters view radiography, 92% had a confirmed radiographic diagnosis ofsinusitis.1 Other recommendations include only treating if there is a worsen-ing of the patient’s clinical status after five to six days, regardless of the overallduration of the illness.
Studies of the signs and symptoms of sinusitis are limited by the choice of agold standard. There are no studies to date that have used the gold standard of growth of 105 CFU/mL or greater from a sinus aspirate. Those reportedhave varied considerably in their use of a gold standard, from purulent sinus aspirates to sinus radiography. One early study (from 1988) evaluated155 patients with acute sinusitis and found that unilateral purulent nasal
9781405154000_4_025.qxd 19/03/2008 10:58 Page 172

Chapter 25: Sinusitis 173
discharge, unilateral facial pain, physical examination findings of purulentnasal discharge, and pus in the nasal cavity were the predominant symptomsto be highly associated with a positive radiography for sinusitis. They calcu-lated a sensitivity of 81% and a specificity of 88% in patients with three or four of these signs or symptoms.2
Another study of 247 men with rhinorrhea, facial pain, or self-suspectedsinusitis in the Veterans Health Administration system in the US used plainradiography as the gold standard and found five independent predictors ofsinusitis: (i) maxillary toothache [odds ratio (OR): 2.9]; (ii) lack of transillu-mination (OR: 2.7); (iii) poor response to nasal decongestants or antihis-tamines (OR: 2.4); (iv) report of colored nasal discharge (OR: 2.2); and (v)purulent mucus on physical examination (OR: 2.9).3
Another paper used computed tomography (CT) findings as the gold standard and studied 201 patients with clinically diagnosed acute sinusitis.4
More than half met the CT criteria for acute bacterial sinusitis (i.e. an air-fluid level or total opacification of any sinus) (Fig. 25.1). Four signs or symp-toms were independently (and significantly) associated with a CT diagnosis of bacterial sinusitis: (i) purulent nose secretion; (ii) purulent rhinorrhea;(iii) ‘double sickening’ (defined as the presence of two phases of illness his-tory); and (iv) an erythrocyte sedimentation rate of greater than 10 mm/h.The presence of three or more of these yielded a sensitivity of 66% and aspecificity of 81%. The authors felt that ‘double sickening,’ which had an
Figure 25.1 Head computed tomography showing sinusitis with left maxillaryocclusion (arrow).
9781405154000_4_025.qxd 19/03/2008 10:58 Page 173

174 Chapter 25: Sinusitis
OR of 2.8, was particularly relevant given the association with the natural his-tory of a viral upper respiratory infection followed by a secondary bacterialinfection. This study also found that 82% of patients with CT-confirmedsinusitis had symptoms for 10 or more days, while 74% without CT findingshad symptoms of less than seven days duration.
A more recent study used three separate gold standards in 174 adultpatients with suspected sinusitis: CT, sinus aspiration, and culture.5 Of the70% with abnormal CT findings, only half met the diagnostic criteria foracute bacterial sinusitis (i.e. the presence of a purulent or mucopurulent sinusaspirate). Signs and symptoms associated with a positive culture includedunilateral facial pain (OR: 1.9), maxillary toothache (OR: 1.9), unilateralmaxillary tenderness (OR: 2.5), and mucopurulent nasal discharge (OR: 1.6).
Taken together these results suggest that acute bacterial sinusitis may becharacterized by the clinical signs and symptoms of: (i) unilateral facial pain; (ii) mucopurulent nasal discharge; (iii) unilateral maxillary tenderness;and (iv) maxillary toothache. No single clinical finding is sensitive andspecific enough to diagnose acute bacterial sinusitis. The Task Force onRhinosinusitis of the American Academy of Otolaryngology-Head and NeckSurgery has provided guidance by stratifying specific diagnostic factors intomajor and minor categories.6 They have stratified the diagnosis of acute bac-terial sinusitis on the basis of at least two major factors (facial pain/pressure,facial congestion/fullness, nasal obstruction, nasal purulence or discoloredpostnasal discharge, hyposmia or anosmia, or fever), or one major and twominor factors (headache, halitosis, fatigue, dental pain, cough, ear pain,pressure, fullness, or fever). The validity of this classification system is basednot on culture results of sinus aspirates but on sinus imaging, which is not avalidated gold standard.
Comment
The diagnosis of acute bacterial sinusitis in the ED setting is a challenge due to the absence of an empirically validated decision rule to identify whichpatients to treat. Clinical signs and symptoms, duration of illness, and pati-ent resources must be considered in determining which patients should betreated. Guidelines regarding the treatment of acute bacterial sinusitis areprimarily based on the literature discussed in this chapter and on expert con-sensus. However, in comparison to the primary care setting, as ED physicianswe frequently will not see the patients in follow-up, so a plan for close follow-up may not be feasible in all of our patients. One potential management strategy may be to write a prescription for patients with clinical signs andsymptoms suspicious for sinusitis with explicit recommendations to fill the
9781405154000_4_025.qxd 19/03/2008 10:58 Page 174

Chapter 25: Sinusitis 175
prescription if symptoms do not remit for seven days. However, using thisstrategy in clinical ED practice has not been validated empirically.
References
1. Ueda, D. and Yoto, Y. (1996) The ten-day mark as a practical diagnostic approachfor acute paranasal sinusitis in children. Pediatric Infectious Disease Journal 15:576–579.
2. Berg, O. and Carenfelt, C. (1988) Analysis of symptoms and clinical signs in themaxillary sinus empyema. Acta Oto-laryngologica 105: 343–349.
3. Williams, J.W., Jr, Simel, D.L., Roberts, L., et al. (1992) Clinical evaluation forsinusitis: making the diagnosis by history and physical examination. Annals ofInternal Medicine 117: 705–710.
4. Lindbaek, M., Hjortdahl, P. and Johnsen, U.L. (1996) Use of symptoms, signs, and blood tests to diagnose acute sinus infections in primary care: comparison with computed tomography. Family Medicine 28: 183–188.
5. Hansen, J.G., Schmidt, H., Rosborg, J., et al. (1995) Predicting acute maxillarysinusitis in a general practice population. British Medical Journal 311: 233–236.
6. Brooks, I., Gooch, W.M., III, Jenkins, S.G., et al. (2000) Medical management of acute bacterial sinusitis: recommendations of a clinical advisory committee on pediatric and adult sinusitis. Annals of Otology, Rhinology and Laryngology182(Suppl): 2–20.
9781405154000_4_025.qxd 19/03/2008 10:58 Page 175
176
Chapter 26 Pneumonia
Highlights
• The Pneumonia Severity Index (PSI) accurately discriminates patients at low
risk for 30-day mortality.
• The CURB-65 rule accurately stratifies patients at high risk for 30-day
mortality.
• A combination of these risk stratification tools and clinical judgment can be
used when making disposition decisions for emergency department (ED)
patients with pneumonia.
One of the challenges when evaluating patients in the ED with community-acquired pneumonia (CAP) (Fig. 26.1) is the assessment of illness severity,which in this disease will often guide decisions about admission, further diag-nostic testing, and the choice of antibiotics. Several scoring systems have beendeveloped to aid in ED decision making regarding patients with CAP.
Probably the most widely used scoring system is the PSI, which was developed by Fine et al.1 Tables 26.1 and 26.2 detail the elements of the PSIand demonstrate that the PSI is associated with risk of death at 30 days. Theprimary purpose of the PSI was to identify patients who were at low risk for mortality and could be managed on an outpatient basis (i.e. at home). The authors have suggested that groups I, II, and III have mortality rates that are sufficiently low, and that these groups could therefore be treated as outpatients.
The CURB-65 score was developed by the British Thoracic Society. Thepurpose of CURB-65 is to identify patients that are at high risk of mortalityfrom pneumonia. The following list includes the elements of the CURB-65scoring system; each element is assigned one point when positive:
9781405154000_4_026.qxd 19/03/2008 10:58 Page 176
Evidence-Based Emergency Care: Diagnostic Testing and Clinical Decision Rules. J.M. Pines andW.W. Everett. 2008 Jesse M. Pines and Worth W. Everett, ISBN: 978-1-4051-5400-0.
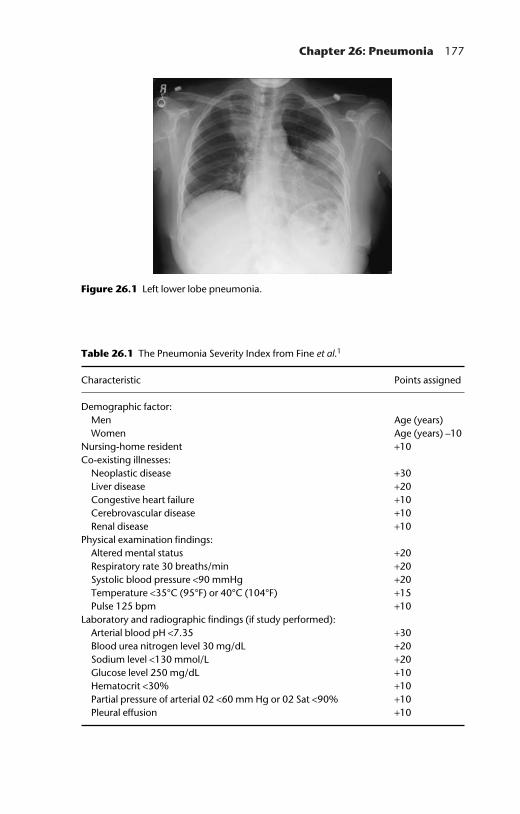
Chapter 26: Pneumonia 177
Figure 26.1 Left lower lobe pneumonia.
Table 26.1 The Pneumonia Severity Index from Fine et al.1
Characteristic Points assigned
Demographic factor:Men Age (years)Women Age (years) –10
Nursing-home resident +10Co-existing illnesses:
Neoplastic disease +30Liver disease +20Congestive heart failure +10Cerebrovascular disease +10Renal disease +10
Physical examination findings:Altered mental status +20Respiratory rate 30 breaths/min +20Systolic blood pressure <90 mmHg +20Temperature <35°C (95°F) or 40°C (104°F) +15Pulse 125 bpm +10
Laboratory and radiographic findings (if study performed):Arterial blood pH <7.35 +30Blood urea nitrogen level 30 mg/dL +20Sodium level <130 mmol/L +20Glucose level 250 mg/dL +10Hematocrit <30% +10Partial pressure of arterial 02 <60 mm Hg or 02 Sat <90% +10Pleural effusion +10
9781405154000_4_026.qxd 19/03/2008 10:58 Page 177

178 Chapter 26: Pneumonia
• confusion;• elevated blood urea nitrogen (BUN; >7 mmol/L);• respiratory rate (≥30/min);• blood pressure (systolic <90 mmHg or diastolic ≤60 mmHg); and• age ≥65 years.Mortalities for the six-point scores found in an international derivation and validation study were 0.7% for score 0, 3.2% for score 1, 3% for score 2,17% for score 3, 41.5% for score 4, and 57% for score 5.
The authors of the CURB-65 criteria have suggested that patients whoscore 0 or 1 are at low risk for mortality and can be managed as outpatients,those who have a score of 2 have an intermediate risk, and those with scoresgreater than 2 have severe CAP and are at high risk and hence should be managed in an intensive care unit.
Clinical question one
“Which severity adjustment tool provides the best discriminatory power inpredicting survival in patients with pneumonia?”A recent study compared the PSI to CURB-65 in 3181 ED patients.2 Both the PSI and CURB-65 were good predictors of 30-day mortality and were also good at identifying patients at low risk of mortality. However, the PSIappeared to be better at identifying patients with a lower risk of mortality.Using the PSI, 68% were identified as low risk (class I–III) with a mortalityrate of 1.4%, while CURB-65 identified 61% as low risk (score 0 or 1) with amortality rate of 1.7%. In more severe CAP (score ≥2) CURB-65 seemed to beof greater use because each score (2–5) was associated with a progressiveincrease in mortality, while the PSI only discriminated between high-risk andlow-risk groups.
Another study used the PSI and CURB-65 in a large group of both inpatients and outpatients with CAP in Spain.3 The authors found that both CURB-65 and CRB-65 (a simpler version that excludes the BUN
Table 26.2 The Pneumonia Severity Index: classification according to points scorefrom Fine et al.1
Class Points Mortality
I <51 0.1%II 51–70 0.6%III 71–90 0.9%IV 91–130 9.5%V >130 26.7%
9781405154000_4_026.qxd 19/03/2008 10:58 Page 178

Chapter 26: Pneumonia 179
measurement) accurately predicted 30-day mortality rate, mechanical ventila-tion, and to some degree, hospitalization. CURB-65 also correlated with timeto clinical stability and was predictive of a longer duration of intravenousantibiotics. The PSI also predicted mortality well in this study.
Clinical question two
“Can procalcitonin be used to predict survival in pneumonia and a bacterialetiology of infection?”One study followed 185 patients who had procalcitonin levels measuredwithin 24 h of admission for CAP.4 The authors found that procalcitonin levels correlated with the PSI score and also predicted complications includ-ing the development of empyema, the need for mechanical ventilation, septicshock, and mortality. An interesting finding of this study was that a low PSI score predicted a bacterial etiology for pneumonia. These findings didnot apply to those with more severe CAP.
Comment
The two major scoring systems for severity of illness in CAP—PSI andCURB-65—have been widely studied. The PSI seems to be a more reliableway of identifying patients that have a low risk of mortality. However, there isa tendency for the PSI to underestimate the severity of illness in youngerpatients with comorbid illness because it places a heavy weight on age andcomoribidities. CURB-65 seems to be somewhat better at identifying patientsthat are at a higher risk for mortality and discriminates better among themore severely ill patients. One problem with CURB-65 is that it does notaccount as well for comorbidities. It also may be difficult to use in olderpatients with other chronic conditions who are at high risk for mortality, eventhough they may have a lower CURB-65 score.
While both scoring systems seem to be good tools for predicting survival in CAP, neither is perfect for differentiating which patients can be safelyadmitted or discharged from the ED. Other factors including clinical andsocial variables, and having adequate access to follow-up health care visitsmust be factored into this decision.
A recent commentary has suggested that the PSI and CURB-65 be combined,and this report also recognized that each system has its own limitations.5
The authors suggested that low-risk patients (PSI class I–III or CURB-65score 0–1) could be managed at home if serious vital sign abnormalities andcomorbidities were absent, as measured by both scoring systems, and if noother factors (such as social situation) necessitated hospital admission.
9781405154000_4_026.qxd 19/03/2008 10:58 Page 179

180 Chapter 26: Pneumonia
Finally, procalcitonin may be a promising tool for predicting survival inpatients with CAP. In addition, it may be helpful in guiding decisions regard-ing the use of antibiotics in lower risk patients. However, before it is used inED patients to guide antibiotic decisions, larger studies must be performed.
References
1. Fine, M.J., Auble, T.E., Yealy, D.M., et al. (1997) A prediction rule to identify low-risk patients with community-acquired pneumonia. New England Journal ofMedicine 336: 243–250.
2. Aujesky, D., Auble, T.E., Yealy, D.M. et al. (2005) Prospective comparison of threevalidated prediction rules for prognosis in community-acquired pneumonia.American Journal of Medicine 118: 384–392.
3. Capelastegui, A., Espana, P.P., Quintana, J.M., et al. (2006) Validation of a pre-dictive rule for the management of community-acquired pneumonia. EuropeanRespiratory Journal 27: 151–157.
4. Masia, M., Gutierrez, F., Shum, C., et al. (2005) Usefulness of procalcitonin levels incommunity-acquired pneumonia according to the patients outcome research teampneumonia severity index. Chest 128: 2223–2229.
5. Niederman, M.S., Feldman, C. and Richards, G.A. (2006) Combining informationfrom prognostic scoring tools for CAP: an American view on how to get the best ofall worlds. European Respiratory Journal 27: 9–11.
9781405154000_4_026.qxd 19/03/2008 10:58 Page 180

181
Chapter 27 Spontaneous BacterialPeritonitis
Highlights
• Diagnosing spontaneous bacterial peritonitis (SBP) requires a paracentesis to
sample the peritoneal fluid.
• Missing the diagnosis of SBP carries a high risk of mortality.
• Formal analysis and culture of the peritoneal fluid should be routinely
performed when SBP is suspected.
• Rapid colorimetric reagent strips commonly used in dipstick testing of urine
are highly sensitive in confirming a diagnosis of SBP.
Background
Spontaneous bacterial peritonitis (SBP) is an infection of the usually sterileintra-abdominal cavity involving ascitic fluid. SBP occurs in patients withhepatic disease, most commonly cirrhosis. The prevalence in unselected hospitalized cirrhotic patients ranges from 10 to 30%. Mortality from SBP hasimproved with aggressive empiric antibiotic treatment but still remains highat around 30%. By definition, the source of the intra-abdominal infection isuncertain, making reliance on the history and physical examination import-ant in order to consider the diagnosis. Ultimately though, sampling of theascitic fluid via paracentesis is required (Fig. 27.1). The diagnosis of SBPrequires a polymorphonuclear (PMN) cell count of above 250/mL in theascitic fluid to start empiric antibiotic treatment; however, the diagnosis can also be made with cell counts below 250/mL if an organism is identifiedfrom cultures of the ascitic fluid. Despite efforts to identify both the organismand the source of the infection, cultures of ascitic fluid yield an organism inroughly 40–50% of cases. In addition, there is not always immediate access
9781405154000_4_027.qxd 19/03/2008 10:57 Page 181
Evidence-Based Emergency Care: Diagnostic Testing and Clinical Decision Rules. J.M. Pines andW.W. Everett. 2008 Jesse M. Pines and Worth W. Everett, ISBN: 978-1-4051-5400-0.

182 Chapter 27: Spontaneous Bacterial Peritonitis
to a good and reliable laboratory for testing, emergent cell counts can bedelayed, and cultures can take days to grow. Therefore, alternative methodsfor the rapid diagnosis of SBP have been sought.
Clinical question
“Can rapid colorimetric reagent strips commonly used in urine dipstick testing beused with ascitic fluid to accurately diagnose SBP?”Leukocyte esterase (LE) reacts with a chemical compound strip to produce acolorimetric change that is proportional to the concentration of the LE in the sample, and hence the number of PMNs present. This reaction has beenused commonly in the assessment of urine, but the principle is the same formeasuring LE levels in any bodily fluid. Urine strips are commonly found in emergency departments (EDs) and acute care settings and are easy to use.Several studies have examined the applicability of such ‘urine dipsticks’ toascitic fluid for the rapid assessment of SBP.
At least three recent studies have examined the usefulness of rapid reagentstrips for diagnosing SBP in patients with hepatic disease. The earliest of thesewas carried out by Spanish scientists who examined ascitic fluid in unselectedcirrhotic patients admitted to a university-based hospital.1 Following theparacentesis, ascitic fluid was tested using a commercially available urinereagent strip (Aution sticks®, A. Menarini Diagnostics, Firenze, Italy). Thefive-grade colorimetric scale is linearly correlated to the PMN counts (grades
(a) (b)
Figure 27.1 (a) Needle aspiration of ascites during a paracentesis. (b) When there isample fluid, larger volumes of ascitic fluid can be removed.
9781405154000_4_027.qxd 19/03/2008 10:57 Page 182

Chapter 27: Spontaneous Bacterial Peritonitis 183
0–4 are equivalent to a PMN count of 0, 25, 75, 250, and 500/mL, respect-ively). Two investigators, blinded to each other’s results, rated the strip at 90 sec. The test was considered positive if the reagent strip was grade 3 or 4,corresponding to a PMN count of 250/mL or higher. The gold standard was aPMN count of 250/mL or above in the ascitic fluid, as determined by the hospital laboratory.
A total of 228 paracentesis in 128 patients were included. A diagnosis of SBP was made in 52 cases, with 23 (44%) of these yielding positive asciticfluid cultures. Table 27.1 shows the performance characteristics of the reagentstrip. The authors concluded that the rapid assessment of ascitic fluid using acolorimetric scale with a commonly available chemical reagent strip could beuseful in the rapid diagnosis of SBP.
Korean researchers studied 53 consecutive cirrhotic patients hospitalizedover a six month period in 2003 and 2004.2 Using similar methods to thosereported in the previous study, the ascitic fluid was tested using two kinds ofurine strips (UriSCAN®, Young-Dong Corp., Seoul, Korea; Multistix10SG®,Bayer Corp., Bridgend, UK). The UriSCAN has a four-grade scale (0–3) corresponding to PMN counts of 0, 25, 75, and 500/mL, respectively. TheMultistix10SG has a five-grade scale (0–4) corresponding to PMN counts of 0–4, 5–9, 10–29, 30–74, and 75–200/mL, respectively. The UriSCAN testwas performed in all paracentesis cases (n = 75), while the Multistix10SG wasavailable for only 62 of the 75 cases.
Overall there were 18 cases of SBP (incidence 24%). When the UriSCANwas considered positive with a grade of three or above, the sensitivity, specificity, positive predictive value (PPV), negative predictive value (NPV), and accuracy were 67%, 100%, 100%, 89%, and 91%, respectively. If the
Table 27.1 Test characteristics of a reagent strip (Aution stick®) for detectingspontaneous bacterial peritonitis (SBP) from Castellote et al.1
SBP (+) SBP (−) Total
Reagent strip grade 3 or 4 (+) 51 1 52Reagent strip grades 0, 1, or 2 (−) 6 170 176Total 57 171 228Sensitivity, % (95% CI) 89 (81–97)Specificity, % (95% CI) 99 (98–100)PPV, % (95% CI) 98 (94–100)NPV, % (95% CI) 97 (94–100)Diagnostic accuracy, % (95% CI) 97 (95–99)
NPV, negative predictive value; PPV, positive predictive value.
9781405154000_4_027.qxd 19/03/2008 10:57 Page 183

184 Chapter 27: Spontaneous Bacterial Peritonitis
UriSCAN was considered positive with a grade of two or above, then all performance parameters were 100%.
In comparison, if the Multistix10SG was considered positive with a grade of three or above, the test had a sensitivity, specificity, PPV, NPV, and accuracy 50%, 100%, 100%, 87%, and 89%, respectively. The authorsconcluded that although the sample size of the study was small and allpatients were hospitalized, both reagent strips were highly accurate.
A French study examined 245 ascitic samples from 51 patients using twochemical reagent strips for quantifying LE (Nephur-Test®, Roche diagnost-ics, Meylan, France; and Multistix10SG®).3 For this study, any colorimetricchange on the reagent strip was considered a positive test. Inter-rater reliab-ility was assessed between a study physician and a non-study nurse; theseresults were then compared to the gold standard of standard laboratory reportedcell counts. There were 17 cases of SBP in this study, yielding a prevalence of 7%. The sensitivity, specificity, PPV, NPV, and accuracy of each test areshown in Table 27.2. There was 100% agreement in the reagent test stripreadings obtained by the physician and the nurse.
The authors concluded that both reagent strips were sufficiently accurateto warrant consideration for clinical use in ambulatory settings where labor-atory facilities may not be available. However, given the low occurrence of disease in this study, larger studies are needed in order to determine whichstrip is superior and whether the test performances are of a high enough standard to forgo formal laboratory analysis other than culture.
Comments
It is recommended that patients with ascites that is of recent onset or is resistant/refractory to medical therapy undergo an ‘exploratory’ paracentesis.Missing the diagnosis of SBP carries with it a high risk of mortality, which
Table 27.2 A comparison of the sensitivity of two separate reagent strips for detectingspontaneous bacterial peritonitis from Sapey et al.3
Nephur-Test® (n = 245) Multistix10SG® (n = 245)
Sensitivity, % (95% CI) 88 (62–98) 65 (39–85)Specificity, % (95% CI) 100 (97–100) 100 (97–100)PPV, % (95% CI) 94 (68–100) 92 (60–100)NPV, % (95% CI) 99 (96–100) 97 (94–99)Diagnostic accuracy, % (95% CI) 99 (96–100) 97 (94–99)
NPV, negative predictive value; PPV, positive predictive value.
9781405154000_4_027.qxd 19/03/2008 10:57 Page 184
Chapter 27: Spontaneous Bacterial Peritonitis 185
remains as high as 20–30% even when appropriate antibiotic treatment isadministered. Once considered, the diagnosis of SBP requires a paracentesisalong with a formal laboratory analysis and culture of the ascitic fluid.
The three studies described above have examined different colorimetricchemical reagent strips that have a component for examining LE, a markerfor PMNs. When used with ascitic fluid from patients with cirrhosis or other liver diseases, the sensitivity ranged from approximately 50 to 100%,with wide confidence intervals. This indicates that many patients could be subjected to false negative tests. Nevertheless, as an alternative for use in theambulatory setting or other acute care facilities that have limited laboratoryresources, a colorimetric chemical reagent strip is an intriguing and innovat-ive use of technology when applied in this way. It must be kept in mind thatthere are no data suggesting early treatment in the ED, or for the length oftime it may take a regular laboratory to process ascitic fluid cell counts (in theorder of 1–2 h), or how this test may improve outcomes or reduce mortality.However, the ease of use, widespread availability, and easy interpretationmake this bedside point of care test promising and exciting. It must also bekeep in mind that while there may be many commercially marketed urinedipsticks, the studies presented here only examined three different products.From a cost perspective, at approx 0.15 euros/strip for the Multistix andNephur-test, it may well be cost-effective to pursue larger studies in order tobetter refine the test parameters on unselected patients with ascites.
References
1. Castellote, J., Lopez, C., Gornals, J., et al. (2003) Rapid diagnosis of spontaneousbacterial peritonitis by use of reagent strips. Hepatology 37: 893–896.
2. Kim, D.Y., Kin, J.H., Chon, C.Y., et al. (2005) Usefulness of urine strip test in the rapid diagnosis of spontaneous bacterial peritonitis. Liver International 25(6):1197–1201.
3. Sapey, T., Kabissa, D., Fort, E., Laurin, C. and Mendler, M.H. (2005) Instant diagnosis of spontaneous bacterial peritonitis using leukocyte esterase reagentstrips: Nephur-Test® vs. MultistixSG®. Liver International 25(2): 343–348.
9781405154000_4_027.qxd 19/03/2008 10:57 Page 185

SECTION 5
Surgical and Abdominal Complaints
9781405154000_4_028.qxd 19/03/2008 10:57 Page 187
Evidence-Based Emergency Care: Diagnostic Testing and Clinical Decision Rules. J.M. Pines andW.W. Everett. 2008 Jesse M. Pines and Worth W. Everett, ISBN: 978-1-4051-5400-0.
189
Chapter 28 Acute Nonspecific,Nontraumatic Abdominal Pain
Highlights
• The evaluation of undifferentiated abdominal pain may include an
abdominal computed tomography (CT) scan when clinically indicated.
• Compared to plain abdominal X-rays, noncontrast abdominal CT identifies
intra-abdominal pathologies with higher sensitivity and specificity.
Background
Acute abdominal pain is one of the most common presenting complaints inthe emergency department (ED). Recent developments in imaging techniqueshave dramatically changed the ED evaluation of abdominal pain. In contrast15 to 20 years ago patients with abdominal pain traditionally received surgicalconsultations when it was decided whether to either take the patient to theoperating room, admit and observe, or discharge the patient from the ED.Nowadays, because of the wide availability of imaging in the ED care oftendoes not involve surgical consultation and frequently surgeons are involvedafter the results of laboratory tests and imaging studies are made available.Radiographic imaging modalities available in many EDs include plainabdominal radiography, CT (with or without intravenous and oral contrast),and ultrasound (US). Common blood tests such as white blood cell (WBC)counts are also often figured into the overall clinical evaluation. Almost 90%of the presentations with acute abdominal pain fall into one of eight diag-noses: appendicitis, bowel obstruction, cholecystitis, renal colic, peptic ulcerdisease, pancreatitis, diverticular disease, and nonspecific abdominal pain.
With such a wide array of potential etiologies for abdominal pain, and thepractical limitations that preclude performing every test and every imaging
9781405154000_4_028.qxd 19/03/2008 10:57 Page 189
Evidence-Based Emergency Care: Diagnostic Testing and Clinical Decision Rules. J.M. Pines andW.W. Everett. 2008 Jesse M. Pines and Worth W. Everett, ISBN: 978-1-4051-5400-0.

190 Chapter 28: Nontraumatic Abdominal Pain
procedure on every patient, the clinician must decided how to balance notimaging everyone and not missing serious causes for abdominal pain. In thischapter and the following four chapters, the discussion will focus on four of the most common clinical entities presenting as acute abdominal pain:bowel obstruction, and acute appendicitis, pancreatitis, and cholecystitis. To begin, the role of imaging in undifferentiated acute abdominal pain will be discussed.
Clinical question
“Which diagnostic imaging modality is most sensitive in diagnosing patients withundifferentiated acute abdominal pain?”A retrospective descriptive study performed in 1994 examined a consecutiveseries of ED patients presenting with acute onset nontraumatic abdominal or flank pain who received both plain abdominal imaging (three view) andabdominal CT imaging (note that it was not specified in the study whetherCTs were contrast or noncontrast).1 Among 177 adult patients who receivedabdominal CT, 74 also received plain abdominal imaging. The gold standarddiagnosis was determined from test results and the clinical outcomes recordedin the medical records. The results are shown in Table 28.1.
The authors found that the difference in imaging modality sensitivities and specificities were all statistically significant, with abdominal CT imaging
Table 28.1 Test parameters for plain film (PF) abdominal radiographs and abdominalcomputed tomography (CT) imaging (n = 74) from Nagurney et al.1
PF CT
Disease Disease Disease Diseasepresent (+) absent (−) Total present (+) absent (−) Total
Study abnormal (+) 25 4 29 53 1 54
Study normal (−) 33 12 45 5 15 20
Total 58 16 74 58 16 74
Sensitivity, % (95% CI) 43 (32–54) 91 (84–98)Specificity, % (95% CI) 75 (65–85) 94 (89–99)PPV, % (95% CI) 86 (78 –94) 98 (95–100)NPV, % (95% CI) 27 (17–37) 75 (65–85)Diagnostic accuracy, 50 (39–61) 92 (86–98)% (95% CI)
NPV, negative predictive value; PPV, positive predictive value.
9781405154000_4_028.qxd 19/03/2008 10:57 Page 190

Chapter 28: Nontraumatic Abdominal Pain 191
performing uniformly better than plain abdominal radiography. They concluded that in patients with acute abdominal or flank pain in which a CTscan was likely to be obtained, there was minimal to no additional benefitfrom obtaining plain abdominal radiographs.
MacKersie et al. performed a prospective study of ED patients presentingwith acute abdominal pain in which they compared noncontrast abdominalCT with three-view plain abdominal radiography.2 They examined the test characteristics and diagnostic accuracy of the two imaging modalitiescompared to the final diagnosis made by surgical, pathological, and clinical follow-up at six months. Patients were enrolled if they had an onset of acuteabdominal pain within the previous seven days. Patients were excluded if theywere pregnant, intoxicated, lacked the mental capacity for decision making,or had vaginal bleeding, penile discharge, dysuria, or hematuria without flankpain. Interpreting radiologists were blinded to the study and to the clinicalhistory of each patient.
Over a seven-month period 103 patients were enrolled, with 91 patientsparticipating in both studies (Table 28.2). The final diagnoses included gastrointestinal diseases (n = 35) including acute appendicitis, cholecystitis,and pancreatitis, and diverticulitis, inflammatory bowel disease, hernias, andbowel obstructions; the remaining were diagnosed with either gynecologicaldisease (n = 3), genitourinary disease (n = 8), metastatic disease (n = 4), ornonspecific abdominal pain (n = 41).
This study demonstrated that the noncontrast abdominal CT was betterthan plain films at revealing the cause of acute abdominal pain, includingmany of the concerning surgical or medically emergent/urgent causes. Inmany cases the CT led to the discovery of pathology that was not identified
Table 28.2 Diagnostic parameters comparing computed tomography (CT) and plainabdominal radiography (acute abdominal series, AAS) with the clinical outcome fromMacKersie et al.2
Outcome (+) Outcome (−) Total
CT (+) 48 2 50CT (−) 2 39 41Total 50 41 91
AAS (+) 15 5 20AAS (−) 35 36 71Total 50 41 91
AAS: sensitivity 30% (95% CI: 18–45), specificity 88% (95% CI: 74–96), accuracy 56%;CT: sensitivity 96% (95% CI: 86–100), specificity 95% (95% CI: 83–99), accuracy 96%.
9781405154000_4_028.qxd 19/03/2008 10:57 Page 191

192 Chapter 28: Nontraumatic Abdominal Pain
using plain radiography. This study also demonstrated that noncontrast CThas sufficiently high sensitivity, specificity, and accuracy to makes it a usefulimaging modality in the absence of any contrast, thus avoiding the risks ofallergic reactions and contrast-induced nephropathy.
In another study, the diagnostic yields of both abdominal plain radio-graphy and abdominal CT scanning were compared in a subset of patientspresenting to an ED with undifferentiated acute abdominal pain.3 Out of1000 patients, only 120 received both plain abdominal imaging and abdom-inal CTs. This retrospective review of adult patients undergoing plain radio-graphy (three view) in the first instance, followed by abdominal CT scanningwith oral and intravenous contrast, examined the imaging performanceparameters with respect to the outcome of final diagnosis, either at the time ofED or hospital discharge, for the following six diagnoses: bowel obstruction,urolithiasis, appendicitis, pyelonephritis, pancreatitis, and diverticulitis. Amongthis small sample there were 25 cases of urolithiasis, nine of diverticulitis, two of pyelonephritis, and three cases each for bowel obstruction, appen-dicitis, and pancreatitis. Plain abdominal radiography had sensitivities of 0% (95% CI: 0–84) for all but the bowel obstruction condition (sensitivity33%; 95% CI: 25–42). The specificity for all of the diagnoses was 100% (95%CI: 96–100). The diagnostic accuracy of abdominal radiography ranged from80 to 98%. Abdominal CT had sensitivities across all of the diagnoses rangingfrom 33 to 68% (95% CI: 25–76), with specificities ranging from 91 to 100%(95% CI: 85–100). The diagnostic accuracy of abdominal CT ranged from 86to 98%. The authors concluded that plain abdominal radiography was insuf-ficiently sensitive in the evaluation of acute nontraumatic abdominal pain.
Because of the difficulty in knowing exactly which laboratory tests, imag-ing studies, and history and physical examination findings are predictive of the need for acute medical or surgical interventions (defined as surgery or need for inpatient hospitalization) Gerhardt et al. examined 165 patientsundergoing acute abdominal imaging and noncontrast helical CT scanningof the abdomen with nontraumatic, nonspecific abdominal pain.4 Patientsthat were aged 18 years or older and that reported nontraumatic abdominalpain of up to seven days in duration were included. The authors found thatwhen all of the data was aggregated, including the acute abdominal seriesresults, the noncontrast abdominal CT was the most accurate clinical variablefor an acute medical or surgical intervention. In a classification and regres-sion tree analysis, the combination of history, physical examination, acuteabdominal series imaging, and noncontrast abdominal CT imaging yieldedthe best test characteristics for predicting the need for medical or surgicalintervention (sensitivity 92%, specificity 90%, positive predictive value 83%, negative predictive value 95%, accuracy 90%). Other models that did
9781405154000_4_028.qxd 19/03/2008 10:57 Page 192

Chapter 28: Nontraumatic Abdominal Pain 193
not include CT imaging had sensitivities and specificities that were felt to beunacceptably low. The authors concluded that from their derivation studyguideline, that noncontrast abdominal CT was very useful and should be the imaging modality of choice when faced with nonspecific abdominal pain.
There are few good head-to-head comparative studies in the medical liter-ature for different imaging modalities applicable to acute abdominal pain.Furthermore, studies performed using CT and US from as recently as 5–10years ago may not be totally applicable today due to technological advanceswith each of these modalities. Many of these studies, including several ofthose reviewed here, suffer from a lack of uniform diagnostic gold standards,making broad comparisons between several similar studies difficult. Patientsprospectively enrolled into the studies were often selected based upon a suspected diagnosis rather than an undifferentiated abdominal complaint,suggesting that some degree of selection bias was likely to be involved.
The use of oral and IV contrast dyes with abdominal CT scanning will con-tinue to be a subject of debate. As CT is used more and more as the imagingmodality of choice for acute abdominal pain, and specifically when bowelobstruction is being considered, there will continue to be an increase in theincidence of contrast nephropathy. Future studies are needed to comparecontrast and noncontrast studies in order to minimize the iatrogenic effectsof IV contrast. For patients with allergies or other contraindications for theuse of IV contrast, the evidence supports the use of noncontrast CT as thediagnostic study of choice.
References
1. Nagurney, J.T., Brown, D.F.M., Novelline, R.A., Kim, J. and Fischer, R.H. (1999)Plain abdominal radiographs and abdominal CT scans for nontraumatic abdom-inal pain – added value? American Journal of Emergency Medicine 17: 668–671.
2. MacKersie, A.B., Lane, M.J., Gerhardt, R.T., et al. (2005) Nontraumatic acuteabdominal pain: unenhanced helical CT compared with three-view acute abdom-inal series. Radiology 237: 114–122.
3. Ahn, S.H., Mayo-Smith, W.W., Murphy, B.L., Reinert, S.E. and Cronan, J.J. (2002)Acute nontraumatic abdominal pain in adult patients: abdominal radiographycompared with CT evaluation. Radiology 225: 159–164.
4. Gerhardt, R.T., Nelson, B.K., Keenan, S., Kernan, L., MacKersie, A. and Lane, M.S.(2005) Derivation of a clinical guideline for the assessment of nonspecific abdom-inal pain: the Guideline for Abdominal Pain in the ED Setting (GAPEDS) Phase 1Study. American Journal of Emergency Medicine 25: 709–717.
9781405154000_4_028.qxd 19/03/2008 10:57 Page 193

194
Chapter 29 Bowel Obstruction
Highlights
• Abdominal computed tomography (CT) identifies small bowel obstructions
with higher sensitivity, specificity, and accuracy than plain abdominal films.
• Abdominal CT can identify the level and cause of the obstruction in most
cases.
Background
Most patients with bowel obstruction will eventually seek acute medical evalu-ation. Bowel obstruction is a common cause of nontraumatic abdominal pain. The common causes of bowel obstruction include adhesions, hernias,malignancies, volvulus, inflammatory conditions, foreign bodies, gallstones,pancreatitis, intussusception, and closed-loop obstructions.
Clinical question one
“Which diagnostic imaging modality is most sensitive in diagnosing bowelobstruction?”One of the first studies comparing abdominal CT with plain abdominalradiography (Fig. 29.1) in diagnosing small bowel obstruction was by Frageret al.1 They studied a total of 85 patients on over 90 occasions in which eachpatient underwent both acute abdominal radiography (supine and erectimages) and abdominal CT with intravenous (IV) and oral contrast. The gold standard for comparison was surgical outcome in 61 cases and clinicaloutcome in 29 cases. In cases where there was no obstruction (n = 24), plain films yielded a specificity of 88% (95% CI: 66–100) compared to CT,
9781405154000_4_029.qxd 19/03/2008 10:57 Page 194
Evidence-Based Emergency Care: Diagnostic Testing and Clinical Decision Rules. J.M. Pines andW.W. Everett. 2008 Jesse M. Pines and Worth W. Everett, ISBN: 978-1-4051-5400-0.

Chapter 29: Bowel Obstruction 195
which had a specificity of 83% (95% CI: 63–100). For cases of partial andcomplete small bowel obstruction (n = 20 and 46, respectively) the sensitivityof CT was 100% for both (95% CI: 78–100% and 92–100%, respectively),while plain films performed poorly with a sensitivity of 30% for partialobstruction (95% CI: 8–52) and 46% for complete obstruction (95% CI:32–60). The authors concluded that the performance of abdominal CT wasbetter than that of plain abdominal films for identifying partial and com-plete small bowel obstructions. CT provided additional information regard-ing the degree and location of the obstruction that helped to guide those casesrequiring surgical intervention.
A small prospective study of 32 patients with acute abdominal pain wasconducted in which the patients were evaluated with all of the followingimaging modalities: plain abdominal radiographs (supine and erect view);abdominal CT with oral and IV contrast, and with and without rectal contrast;and abdominal ultrasound.2 The study sought to compare the sensitivities,specificities, and accuracies of each imaging modality compared with the outcomes at surgery (n = 25) and clinical follow-up (n = 7). The interpretingradiologists were blinded to the findings from other imaging studies. Allimaging occurred within a period of 6–36 h following presentation. Theresults are shown in Table 29.1 for the total of 30 bowel obstructions.
From this study it was concluded that CT yielded a significantly higher sensitivity than both ultrasound and plain radiography, and had 100%
(a) (b)
Figure 29.1 Multiple air-fluid levels (a) and dilated loops of small bowel (b). (Courtesyof Anthony Dean, MD.)
9781405154000_4_029.qxd 19/03/2008 10:57 Page 195

196 Chapter 29: Bowel Obstruction
specificity. Furthermore, CT was able to identify the level and cause of theobstruction in 93 and 87% of cases, respectively, compared to ultrasound (70and 23%, respectively) and plain radiography (60 and 7%, respectively). Thecauses of bowel obstruction were malignancy (n = 9), inflammation (n = 9),adhesions (n = 3), volvulus (n = 3), strictures (n = 3), intussusception (n = 2),and foreign body (n = 1).
When interpreting this data one must keep in mind the limitations of thestudy. For example, the time course over which the studies were performedmay have impacted the ability to diagnose by a particular imaging modality.In addition the patient cohort was small. However, the performance of CT inthis study is remarkable in terms of the high sensitivity shown, especiallygiven the 100% specificity, and also in terms of its ability to accurately localizeand diagnose the cause of the obstruction.
With few exceptions plain abdominal radiography has no role in the evaluation of suspected bowel obstruction. The exceptions include expectedprolonged delay or absolute unavailability of CT imaging. Plain radiographyis still used in other acute abdominal pain situations (foreign body ingestion,penetrating trauma, and suspected pneumoperitoneum), but its use isbecoming rarer and therefore it is more difficult to learn about.
Newer imaging methods are being tested using MRI technology and thepreliminary results look promising. In a prospective cross-sectional study of patients with clinical evidence of bowel obstruction, Beall et al. evaluated44 patients that received rapid noncontrast MRI, IV contrast CT scanning, or both, and reported the following test characteristics: MRI sensitivity 95%, specificity 100%, accuracy 96%; and CT sensitivity 71%, specificity71%, accuracy 71%.3 In this study the total time taken for MRI, includingpatient set-up and image acquisition, was just under seven minutes. It isunclear why the CT had such low sensitivity and specificity in this smallcohort compared to the previously cited studies. However, the possibility of awidespread use for MRI in the evaluation of acute abdominal pain remains a thought for the future.
Table 29.1 Test characteristics for diagnosing bowel obstruction among plainradiography, computed tomography (CT), and ultrasound (95% confidence intervalsnot provided in source study) from Suri et al.2
Sensitivity, % Specificity, % Accuracy, %
Plain radiography 77 50 75CT 93 100 94Ultrasound 83 100 84
9781405154000_4_029.qxd 19/03/2008 10:57 Page 196

Chapter 29: Bowel Obstruction 197
References
1. Frager, D., Medwid, S.W., Baer, J.W., Mollinelli, B., Friedman, M. (1994) CT ofsmall-bowel obstruction; value in establishing the diagnosis and determining thedegree and cause. American Journal of Roentgenology 162: 37–41.
2. Suri, S., Gupta, S., Sudhakar, P.J., Venkatataramu, N.K., Sood, B. and Wig, J.D.(1999) Comparative evaluation of plain films, ultrasound and CT in the diagnosisof intestinal obstruction. Acta Radiologica 40: 422–428.
3. Beall, D.P., Fortman, B.J., Lawler, B.C. and Regan, F. (2002) Imaging bowelobstruction: a comparison between fast magnetic resonance imaging and helicalcomputed tomography. Clinical Radiology 57: 719–724.
9781405154000_4_029.qxd 19/03/2008 10:57 Page 197

198
Chapter 30 Acute Pancreatitis
Highlights
• Acute pancreatitis is commonly associated with alcohol use and gallstones
and carries a mortality rate of approximately 1%.
• Serum lipase performs with excellent sensitivity and specificity compared to
serum amylase in discriminating acute pancreatitis from other forms of acute
abdominal pathology.
Background
Acute pancreatitis typically presents with abdominal pain, often in the epigastrium, with radiation through to the back. Excessive alcohol use andgallstones are the two most common risk factors for pancreatitis. Acute pan-creatitis typically carries a mortality rate of approximately 1%, whereas 20%of cases constitute severe acute pancreatitis with mortality ranging from 10 to 25%. Two laboratory tests—serum amylase and lipase—are commonlyobtained to help in the diagnosis of acute pancreatitis. Unfortunately, manyof the studies examining the use of these tests utilize them as part of the diag-nostic criteria for pancreatitis, thus artificially augmenting the sensitivity ofthe test.
Clinical question
“What is the role of serum amylase and lipase in the diagnosis of acutepancreatitis?”Researchers in Germany studied amylase and lipase levels in a cohort of patientspresenting to a university hospital for the evaluation of acute abdominal pain
9781405154000_4_030.qxd 19/03/2008 10:56 Page 198
Evidence-Based Emergency Care: Diagnostic Testing and Clinical Decision Rules. J.M. Pines andW.W. Everett. 2008 Jesse M. Pines and Worth W. Everett, ISBN: 978-1-4051-5400-0.

Chapter 30: Acute Pancreatitis 199
suspected to be pancreatitis.1 The gold standard used to classify patients as having pancreatitis was either contrast-enhanced computed tomography(CT) or abdominal ultrasound. Serum levels of amylase and lipase were takenat admission and within 48 h of the onset of symptoms. Of the total of 253patients followed during the 10-month single hospital study, 32 (12.6%) werediagnosed by imaging with acute pancreatitis. For patients presenting within48 h of symptom onset, an elevated lipase level had a sensitivity of 100% and a specificity of 84%, and an elevated amylase level had a sensitivity of 94% anda specificity of 88%. When diagnosis was based upon either of the initial tests being positive then the sensitivity was 100% and the specificity was 98%.An analysis of enzyme levels in the first serum draw compared to those insamples taken at days 2–3 and days 4–5 revealed that the sensitivity of thelipase assay fell to 59%, and that for the amylase assay fell to 35%. Receiveroperating characteristic curve analysis showed the lipase assay to be slightlysuperior to the amylase assay, with 95% sensitivity achieved when lipase cutoff levels of two-fold above normal were used. From this study, theauthors concluded that addition of serum amylase added only minimally to the diagnostic evaluation.
This study incorporated a definition of pancreatitis that did not includeenzymatic parameters, and thus the enzyme performance parameters can beconsidered to be valid. The patients in this study may have been specificallyselected because no data was provided regarding the total number of patientswith abdominal pain who were not included, leaving clinicians to make sup-positions about the study enrollment. Similarly, there was no mention of anyother patients being identified with a final diagnosis of pancreatitis, thus casesmay have been missed.
Researchers in New Zealand studied patients admitted to a single hospitalover a three- to four-year period in which pancreatitis was a diagnostic con-sideration.2 A total of 328 patients were consented and enrolled. The diagnosisof pancreatitis was based on a combination of factors, none of which includedenzymatic determinations (operative-autopsy results, clinical features, andimaging results). Serum enzyme levels were determined on day one followingpresentation. A total of 51 patients were classified as having acute pancre-atitis. The authors found that an elevated lipase level (above the diagnosticthreshold) was 97% specific, but only 67% sensitive. This was significantlymore discriminating compared to an elevated amylase level (specificity 97%,sensitivity 45%). The authors concluded that lipase was the preferred enzy-matic study to perform in the initial presentation. The authors in this studyfocused on maximizing the specificity aspect of the diagnostic test as a way toavoid excessive false-positive results. The impact this has is to maximize thepositive predictive value of a test.
9781405154000_4_030.qxd 19/03/2008 10:56 Page 199

200 Chapter 30: Acute Pancreatitis
References
1. Keim, V., Teich, N., Fiedler, F., Hartig, W., Thiele, G. and Mossner, J. (1998) A comparison of lipase and amylase in the diagnosis of acute pancreatitis in patients with abdominal pain. Pancreas 16(1): 45–49.
2. Treacy, J., Williams, A., Bais, R., et al. (2001) Evaluation of amylase and lipase in thediagnosis of acute pancreatitis. Australian and New Zealand Journal of Surgery71: 577–582.
9781405154000_4_030.qxd 19/03/2008 10:56 Page 200

201
Chapter 31 Acute Appendicitis
Highlights
• A white blood cell (WBC) count is insufficiently sensitive and specific, and
lacks the predictive and discriminatory ability to diagnose acute appendicitis.
• Abdominal computed tomography (CT) is more sensitive than abdominal
ultrasound (US) in diagnosing appendicitis and is the preferred imaging
study in non-pregnant adults.
• Despite an increasing reliance on CT scans, the rates of missed and ruptured
appendicitis have remained steady.
Background
Appendectomies are the most common emergency surgical procedures per-formed. Diagnosing acute appendicitis requires there to be a clinical suspicionafter interviewing the patient, followed by a physical examination, and oftendiagnostic imaging. A surgical consultant is usually involved early on duringa patient evaluation if there is a high clinical suspicion of appendicitis. In an effort to make a correct diagnosis, laboratory tests and imaging haveincreasingly been involved, with the hope being to reduce the number ofmissed or delayed diagnoses. However, the usefulness of specific laboratorytests and imaging studies in aiding the diagnosis has been questioned.
Clinical question one
“What is the role of the WBC count in the diagnosis of acute appendicitis?”Two studies published in 2004 illustrate the lack of sufficient sensitivity andspecificity for the total WBC count in diagnosing acute appendicitis. Cardall
9781405154000_4_031.qxd 19/03/2008 10:56 Page 201
Evidence-Based Emergency Care: Diagnostic Testing and Clinical Decision Rules. J.M. Pines andW.W. Everett. 2008 Jesse M. Pines and Worth W. Everett, ISBN: 978-1-4051-5400-0.

202 Chapter 31: Acute Appendicitis
et al. studied consecutive non-pregnant patients presenting to a single emer-gency department (ED) in which acute appendicitis was the working diagnosisafter initial history and physical examination.1 The diagnosis of appendicitiswas based on surgical and histopathologic assessments. For patients who didnot undergo an operation, follow-up was by telephone interviews two weekslater. A WBC count in excess of 10 000 cells/mm3 was considered positive andwas defined in this study a priori. A total of 293 patients had complete data for analysis, and the prevalence of acute appendicitis was found to be 31%.Table 31.1 shows the diagnostic test parameters. The area under the receiveroperating characteristic (ROC) curve for the total WBC count was 0.72 (95% CI: 0.65–0.79), which is considered neither good [area under curve(AUC)>0.8] nor excellent (AUC>0.9). The authors concluded that the WBCcount should not be relied upon to definitively rule in or rule out a workingdiagnosis of acute appendicitis because of its low sensitivity, low specificityand lack of discriminative power.
Anderson published a meta-analysis of laboratory values for diagnosingacute appendicitis.2 In a review of the English, German, French, Italian, Spanish,Portuguese, and Scandinavian medical literature, the author found 24 articlesthat met the inclusion criteria, which consisted of studies with patientsadmitted to hospital for suspected appendicitis, studies including data permitting calculation of likelihood ratios and/or ROC curves, and studiesincluding adult patients (pediatric-only studies were excluded). Diagnosticperformance was determined using weighted pooled estimates of the areaunder the ROC curves and likelihood ratios for the diagnostic variables ofinterest. The results indicated that WBC counts had moderate discriminatorypower, with a pooled area under the ROC curve of 0.77 (95% CI: 0.75–0.78).
Table 31.1 Test characteristics of white blood cell (WBC) counts in acute appendicitisfrom Cardall et al.1
Appendicitis (+) Appendicitis (−) Total
WBC >10 000 cells/mm3 (+) 66 89 155WBC ≤10 000 cells/mm3 (−) 21 98 119Total 87 187 274
Sensitivity, % (95% CI) 76 (65–84)Specificity, % (95% CI) 52 (45–60)PPV, % (95% CI) 42 (35–51)NPV, % (95% CI) 82 (74–89)LR+ (95% CI) 1.59 (1.31–1.93)LR− (95% CI) 0.46 (0.31–0.67)
LR, likelihood ratio; NPV, negative predictive value; PPV, positive predictive value.
9781405154000_4_031.qxd 19/03/2008 10:56 Page 202

Chapter 31: Acute Appendicitis 203
Higher WBC counts resulted in marginally better predictive capacity com-pared to lower WBC counts (Table 31.2).
This study demonstrated the lack of sufficient predictive and discrimin-atory ability of the total WBC count in diagnosing acute appendicitis. Indeed,the author performed calculations based on numerous permutations ofinflammatory markers [WBC, C-reactive protein, proportion of polymor-phonuclear cells (increased or decreased)] and found that only when two ormore inflammatory markers were normal could there be sufficient confidencethat appendicitis was unlikely.
Clinical question two
“Which diagnostic imaging modality is best for diagnosing acute appendicitis?”The two common imaging studies used in the setting of suspected acuteappendicitis are abdominal CT (Fig. 31.1) and US. Several studies have exam-ined and compared the diagnostic yields and performances of these twomodalities in settings in which both tests have been performed on all patients.
Pickuth et al. studied consecutive patients presenting with a suspicion ofacute appendicitis over a six-month period.3 All patients had noncontrastabdominal CT performed and abdominal US. The gold standard used forconfirming the diagnosis was operative and pathologic findings for thoseundergoing surgery. Non-operative patients were followed after hospital discharge for six months. The prevalence of appendicitis was 78%. In the 27 patients without appendicitis, an alternative diagnosis was found in 15(CT provided the alternative diagnosis in 14 cases; US provided an alternativediagnosis in nine cases). CT was accurate in 112/120 cases (93%), whereas USwas accurate in 101/120 cases (84%; Table 31.3). The authors concluded thatnoncontrast abdominal CT yielded more accurate findings compared to USin patients with suspected acute appendicitis.
To further elucidate the diagnostic performance of abdominal CT versusfocused right lower quadrant (RLQ) US, Wise et al. studied 100 consecutive
Table 31.2 Likelihood ratios (LR) of elevated white blood cell (WBC) counts indiagnosing acute appendicitis in pooled studies from Anderson2
WBC (×109/L) LR+ (95% CI) LR− (95% CI)
≥10 2.5 (2.1–3.0) 0.3 (0.2–0.4)≥12 2.8 (2.0–3.8) 0.5 (0.4–0.6)≥14 3.0 (2.5–3.5) 0.7 (0.6–0.9)≥15 3.5 (1.6–7.8) 0.8 (0.7–1.0)
9781405154000_4_031.qxd 19/03/2008 10:56 Page 203

204 Chapter 31: Acute Appendicitis
Figure 31.1 Computed tomography image showing tubular structure withsurrounding fat stranding consistent with acute appendicitis (arrow).
Table 31.3 Diagnostic test performances of computed tomography (CT) andultrasound (US) in acute appendicitis (n = 120) from Pickuth et al.3
CT US
Imaging study abnormal (++):Appendicitis (+) 88 81Appendicitis (−) 3 7Total 91 88
Imaging study normal (−−):Appendicitis (+) 5 12Appendicitis (−) 24 20Total 29 32
Sensitivity, % (95% CI) 95 (89–98) 87 (79–93)Specificity, % (95% CI) 89 (71–98) 74 (54–89)PPV, % (95% CI) 97 (91–99) 92 (84–97)NPV, % (95% CI) 83 (64–94) 63 (44–79)LR+ (95% CI) 8.5 (2.9–24.8) 3.4 (1.8–6.4)LR− (95% CI) 0.6 (0–0.1) 0.2 (0.1–0.3)
CT, computed tomography; LR, likelihood ratio; NPV, negative predictive value; PPV,positive predictive value; US, ultrasound.
9781405154000_4_031.qxd 19/03/2008 10:56 Page 204
Chapter 31: Acute Appendicitis 205
patients presenting to an urban ED that were suspected of having acuteappendicitis.4 The subjects each underwent five diagnostic studies: (i) focusedRLQ sonography; (ii) focused RLQ sonography following colonic contrastinjection; (iii) focused abdominal CT of the appendiceal region followingoral contrast; (iv) abdominopelvic CT following oral and intravenous (IV)contrast; and (v) focused abdominal CT of the cecal region following oral, IV, and colonic contrast injection. Imaging studies were interpreted blindlywith regard to patients’ clinical information, and CT and US studies wereinterpreted by different groups of radiologists. Outcomes were determinedby surgical/pathology reports if an operation was performed, and by clinicalfollow-up for up to six-months if there was no surgery.
Overall, the prevalence of acute appendicitis was 24%. The authors reportedthat abdominal CT performed better than US diagnostically (CT sensitivity96%, specificity 92%; US sensitivity 62%, specificity 71%; P < 0.0001). Further-more, addition of IV or colonic contrast did not improve the performance ofCT scanning.
The concern that prior studies that had examined selected patients in academic and university settings using specialized radiologists were not representative of general community practice was raised by a group of Dutchresearchers.5 The group went on to conduct a study of patients for whomthere was a clinical suspicion of acute appendicitis, using both general andspecialized radiologists. Of 339 patients with abdominal pain who were elig-ible for consent, 199 consented and underwent both noncontrast abdominalCT and RLQ US over a one-hour period. General radiologists (n = 10) andspecialized radiologists (n = 2) blindly interpreted the studies. The outcomeswere determined by surgical/pathology reports or by longitudinal follow-up,similar to other studies. Surgery was performed in 88% of the enrolledpatients and the prevalence of acute appendicitis was 66%. The diagnosticperformances of CT and US in this study were found to be statistically similar(Table 31.4).
A large systematic review of prospective studies examining the diagnosticaccuracy of CT and US in diagnosing acute appendicitis was conducted in2004.6 Studies spanning 15 years (1988–2003) that utilized either abdominalCT or US, that enrolled patients that were above 13 years of age, and thatincorporated surgical or clinical follow-up were included. The authors reportedthat, overall, CT performed better than US (Table 31.5).
The main limitation identified by the authors of all of the studies men-tioned above was the use of different reference standards for patients withpositive or negative tests. The studies cited used combinations of surgical and pathologic assessments and clinical follow-up, introducing bias when auniform outcome standard was not utilized. Similarly, most studies included
9781405154000_4_031.qxd 19/03/2008 10:56 Page 205
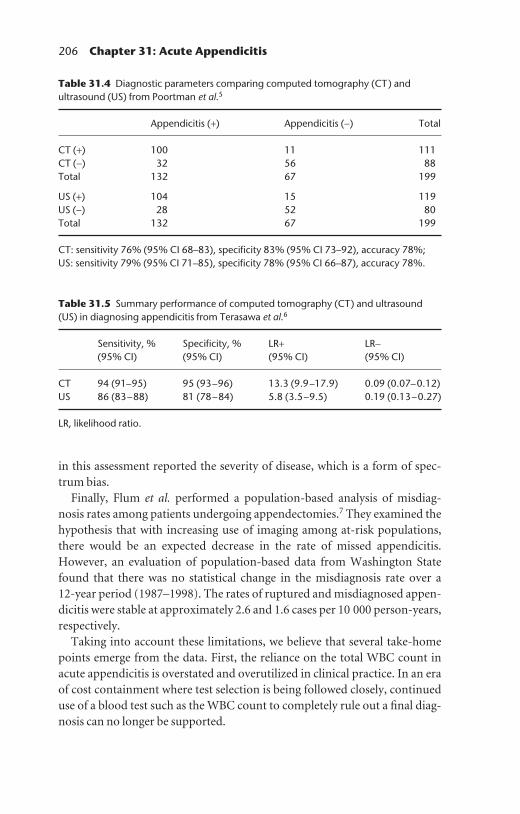
206 Chapter 31: Acute Appendicitis
in this assessment reported the severity of disease, which is a form of spec-trum bias.
Finally, Flum et al. performed a population-based analysis of misdiag-nosis rates among patients undergoing appendectomies.7 They examined thehypothesis that with increasing use of imaging among at-risk populations,there would be an expected decrease in the rate of missed appendicitis.However, an evaluation of population-based data from Washington Statefound that there was no statistical change in the misdiagnosis rate over a 12-year period (1987–1998). The rates of ruptured and misdiagnosed appen-dicitis were stable at approximately 2.6 and 1.6 cases per 10 000 person-years,respectively.
Taking into account these limitations, we believe that several take-homepoints emerge from the data. First, the reliance on the total WBC count inacute appendicitis is overstated and overutilized in clinical practice. In an eraof cost containment where test selection is being followed closely, continueduse of a blood test such as the WBC count to completely rule out a final diag-nosis can no longer be supported.
Table 31.4 Diagnostic parameters comparing computed tomography (CT) andultrasound (US) from Poortman et al.5
Appendicitis (+) Appendicitis (−) Total
CT (+) 100 11 111CT (−) 32 56 88Total 132 67 199
US (+) 104 15 119US (−) 28 52 80Total 132 67 199
CT: sensitivity 76% (95% CI 68–83), specificity 83% (95% CI 73–92), accuracy 78%;US: sensitivity 79% (95% CI 71–85), specificity 78% (95% CI 66–87), accuracy 78%.
Table 31.5 Summary performance of computed tomography (CT) and ultrasound(US) in diagnosing appendicitis from Terasawa et al.6
Sensitivity, % Specificity, % LR+ LR−(95% CI) (95% CI) (95% CI) (95% CI)
CT 94 (91–95) 95 (93–96) 13.3 (9.9–17.9) 0.09 (0.07–0.12)US 86 (83–88) 81 (78–84) 5.8 (3.5–9.5) 0.19 (0.13–0.27)
LR, likelihood ratio.
9781405154000_4_031.qxd 19/03/2008 10:56 Page 206

Chapter 31: Acute Appendicitis 207
For the diagnosis of bowel obstruction and acute appendicitis CT is thesuperior imaging modality compared with the other widely available imagingmodalities (plain abdominal radiography and US). The use of abdominal CT imaging has several advantages over the other methods. In addition to making the diagnosis, the level of the obstruction and the cause of theobstruction can be better delineated. Alternative causes for the abdominalpain, such as a leaking aortic aneurysm for example, can also be diagnosed.The principal criticism for the widespread use of CT as the first imagingmodality relates to indiscriminate radiation exposure compared with limitedplain abdominal imaging, which is associated with only minimal radiationexposure, or US/magnetic resonance imaging (MRI) which has no ionizingradiation exposure. The use of US in the evaluation of intestinal pathology is limited due to the presence of bowel gas and obesity, and due to the fact that it is highly user dependent. With the exception of selected populations,specifically pediatric patients (not discussed here), US is frequently insuf-ficient or non-diagnostic and thus a follow-up study is needed.
References
1. Cardall, T., Glasser, J. and Guss, D.A. (2004) Clinical value of the total white bloodcell count and temperature in the evaluation of patients with suspected appen-dicitis. Academic Emergency Medicine 11: 1021–1027.
2. Anderson, R.E.B. (2004) Meta-analysis of the clinical and laboratory diagnosis ofappendicitis. British Journal of Surgery 91: 28–37.
3. Pickuth, D., Heywang-Kobrunner, S.H. and Spielmann, R.P. (2000) Suspectedacute appendicitis: is ultrasound or computed tomography the preferred imagingtechnique? European Journal of Surgery 166: 315–319.
4. Wise, S.W., Labuski, M.R., Kasales, C.J., et al. (2001) Comparative assessment ofCT and sonographic techniques for appendiceal imaging. American Journal ofRoentgenology 176: 933–941.
5. Poortman, P., Lohle, P.N.M., Schoemaker, C.M.C., et al. (2003) Comparison of CTand sonography in the diagnosis of acute appendicitis: a blinded prospective study.American Journal of Roentgenology 181: 1355–1359.
6. Terasawa, T., Blackmore, C.C., Bent, S. and Kohlwes, R.J. (2004) Systematic review:computed tomography and ultrasonography to detect acute appendicitis in adultsand adolescents. Annals of Internal Medicine 141: 537–546.
7. Flum, D.R., Morris, A., Koepsell, T. and Dellinger, E.P. (2001) Has misdiagnosis ofappendicitis decreased over time? Journal of the American Medical Association 286:1748–1753.
9781405154000_4_031.qxd 19/03/2008 10:56 Page 207

208
Chapter 32 Acute Cholecystitis
Highlights
• History, physical examination findings, and laboratory values are not
sensitive predictors of acute cholecystitis.
• Gallbladder imaging can be performed with ultrasound (US), computed
tomography (CT), and hepatobiliary scintigraphy (HIDA); however, each
modality carries different advantages and disadvantages.
Background
Acute cholecystitis is a common concern among patients presenting for theevaluation of acute abdominal pain, accounting for approximately 5–9% ofsuch admissions. Similar to the previously discussed concerns with diagnosingbowel obstruction (Chapter 29), acute pancreatitis (Chapter 30), and acuteappendicitis (Chapter 31), the diagnosis entails a combination of historicaland physical examination features coupled with appropriate imaging studies.
Clinical question
“Which diagnostic imaging test is recommended for diagnosing acutecholecystitis?”Radiologists at the University of Pennsylvania compared abdominal CT withoral and intravenous (IV) contrast to US for the diagnosis of acute biliary disease (Figs 32.1 and 32.2) in a retrospective cohort of patients that under-went both imaging studies.1 Patients were included if they had right upperquadrant (RUQ) pain and both RUQ US and abdominal CT imaging studieswere performed within 48 h of each other. Patients with prior cholecystectomy
9781405154000_4_032.qxd 19/03/2008 10:55 Page 208
Evidence-Based Emergency Care: Diagnostic Testing and Clinical Decision Rules. J.M. Pines andW.W. Everett. 2008 Jesse M. Pines and Worth W. Everett, ISBN: 978-1-4051-5400-0.
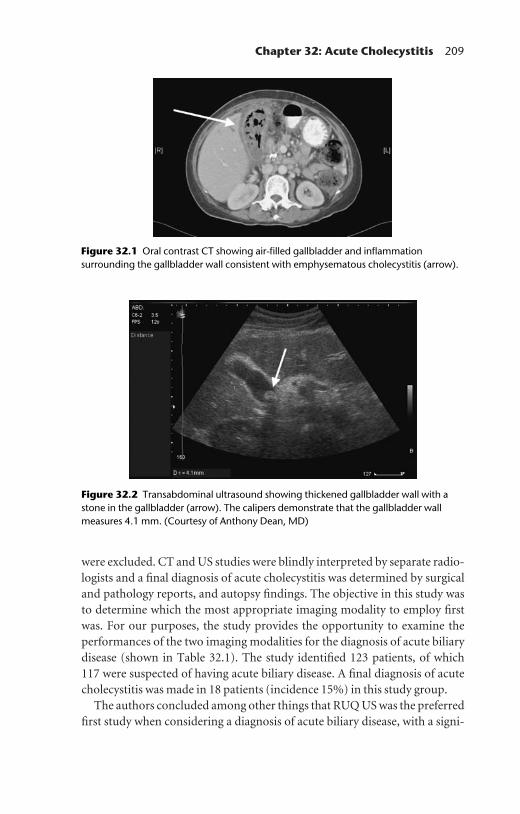
Chapter 32: Acute Cholecystitis 209
were excluded. CT and US studies were blindly interpreted by separate radio-logists and a final diagnosis of acute cholecystitis was determined by surgicaland pathology reports, and autopsy findings. The objective in this study wasto determine which the most appropriate imaging modality to employ firstwas. For our purposes, the study provides the opportunity to examine theperformances of the two imaging modalities for the diagnosis of acute biliarydisease (shown in Table 32.1). The study identified 123 patients, of which 117 were suspected of having acute biliary disease. A final diagnosis of acutecholecystitis was made in 18 patients (incidence 15%) in this study group.
The authors concluded among other things that RUQ US was the preferredfirst study when considering a diagnosis of acute biliary disease, with a signi-
Figure 32.1 Oral contrast CT showing air-filled gallbladder and inflammationsurrounding the gallbladder wall consistent with emphysematous cholecystitis (arrow).
Figure 32.2 Transabdominal ultrasound showing thickened gallbladder wall with astone in the gallbladder (arrow). The calipers demonstrate that the gallbladder wallmeasures 4.1 mm. (Courtesy of Anthony Dean, MD)
9781405154000_4_032.qxd 19/03/2008 10:55 Page 209

210 Chapter 32: Acute Cholecystitis
ficantly better sensitivity and marginally higher specificity compared toabdominal CT. It was specifically noted, however, that if other factors wereunder diagnostic consideration in the differential diagnosis then CT shouldstill be considered.
HIDA has long been considered the gold standard for diagnosing acutecholecystitis. In a retrospective analysis of patients presenting to a single center with suspected acute cholecystitis that had both US and HIDA orderedsimultaneously, the performance characteristics of the two tests were com-pared.2 It was standard practice in the study hospital for both studies to beordered together when this diagnosis was being considered. Consecutivepatients were included; patients were excluded if a test was ordered after the first test had been completed in an effort to minimize differential testordering bias. The final diagnosis was determined using surgical, pathology,and autopsy reports, or via a clinical diagnosis for those who did not die orundergo surgery. A total of 107 patients were examined and 32 (30%) had afinal diagnosis of acute cholecystitis. Using data from this study, the perform-ance characteristics of the two tests are shown in Table 32.2.
The authors concluded that HIDA was superior in diagnosing acute chole-cystitis. They suggested that the costs of each of these studies at the time were sufficiently similar that the decision should be based on availability anddiagnostic performance.
Finally, to highlight the importance of selecting the correct imaging study,Trowbridge and colleagues performed a comprehensive review of studiesexamining the ability of physical examination, patient history, or laboratorytests to diagnose acute cholecystitis.3 They found no historic or clinical fac-tors that could sufficiently rule in or rule out acute cholecystitis ( LR+ ≤2.8;LR− <0.4), indirectly supporting the notion that imaging is the cornerstoneof diagnosis.
Table 32.1 Computed tomography (CT) and ultrasound (US) performances for thediagnosis of acute biliary disease from Harvey and Miller1
Acute biliary disease (+) Acute biliary disease (−) Total
CT (+) 7 7 14CT (indeterminate or −) 11 92 103Total 18 99 117
US (+) 15 5 20US (indeterminate or −) 3 94 97Total 18 99 117
CT: sensitivity 39% (95% CI: 17–64), specificity 93% (95% CI: 86–97), accuracy 85%;US: sensitivity 83% (95% CI: 59–96), specificity 95% (95% CI: 89–98), accuracy 93%.
9781405154000_4_032.qxd 19/03/2008 10:55 Page 210

Chapter 32: Acute Cholecystitis 211
Comments
While CT is regarded as the study of choice, and this is supported by data formany abdominal conditions, US is very useful and is a reasonable diagnosticchoice in acute biliary diseases. HIDA has been shown to have superior testparameters, but the lack of widespread availability and access during off-hours are the main factors limiting its use.
References
1. Harvey, R.T. and Miller, W.T., Jr. (1999) Acute biliary diseases: initial CT and follow-up US versus initial US and follow-up CT. Radiology 13: 831–836.
2. Chatziioannou, S.N., Moore, W.H., Ford, P.V. and Dhekne, R.D. (2000)Hepatobiliary scintigraphy is superior to abdominal ultrasonography in suspectedacute cholecystitis. Surgery 127: 609–613.
3. Trowbridge, R.L., Rutkowski, N.K. and Shojania, K.G. (2003) Does this patienthave acute cholecystitis? Journal of the American Medical Association 289(1): 80–86.
Table 32.2 Test characteristics of hepatobiliary scintigraphy (HIDA) and ultrasound(US) for cholecystitis from Chatziioannou et al.2
Acute biliary disease (+) Acute biliary disease (−) Total
HIDA (+) 28 5 33HIDA (−) 4 70 74Total 32 75 107
US (+) 16 9 25US (indeterminate or −) 16 66 82Total 32 75 107
HIDA: sensitivity 88% (95% CI: 71–97), specificity 93% (95% CI: 85–98), accuracy92%; US: sensitivity 50% (95% CI: 32–68), specificity 88% (95% CI: 78–94), accuracy 77%.
9781405154000_4_032.qxd 19/03/2008 10:55 Page 211

SECTION 6
Urology
9781405154000_4_033.qxd 19/03/2008 10:55 Page 213
Evidence-Based Emergency Care: Diagnostic Testing and Clinical Decision Rules. J.M. Pines andW.W. Everett. 2008 Jesse M. Pines and Worth W. Everett, ISBN: 978-1-4051-5400-0.

215
Chapter 33 Kidney Stones
Highlights
• Kidney stones should be considered in patients presenting with acute flank
pain, hematuria, groin pain, and/or vomiting.
• Noncontrast computed tomography (CT) imaging in patients with
suspected kidney stones improves the diagnostic accuracy and can provide
important information about other unsuspected conditions, some of which
may require emergency treatment.
Background
Kidney stones affect up to 5% of the population. People frequently seekemergency care for pain associated with kidney stones because it is fre-quently severe and refractory to over-the-counter medications. Clinical features of symptomatic kidney stones include acute flank pain radiating tothe groin, nausea, vomiting, and microscopic hematuria. The standard forthe diagnosis of kidney stones is noncontrast spiral CT scanning (Fig. 33.1).Noncontrast CT has become the standard because it gives a considerableamount of information including the following: (i) whether the symptomsare actually due to kidney stones; (ii) whether the stones are obstructing; and (iii) an estimate of the stone burden if the scan is positive (Fig. 33.2). An estimate of stone burden may be helpful for physicians in managing an individual patient’s kidney stones after their emergency department (ED)visit. When a patient develops kidney stones, in almost 50% of cases a secondstone will form within 5–7 years.
9781405154000_4_033.qxd 19/03/2008 10:55 Page 215
Evidence-Based Emergency Care: Diagnostic Testing and Clinical Decision Rules. J.M. Pines andW.W. Everett. 2008 Jesse M. Pines and Worth W. Everett, ISBN: 978-1-4051-5400-0.
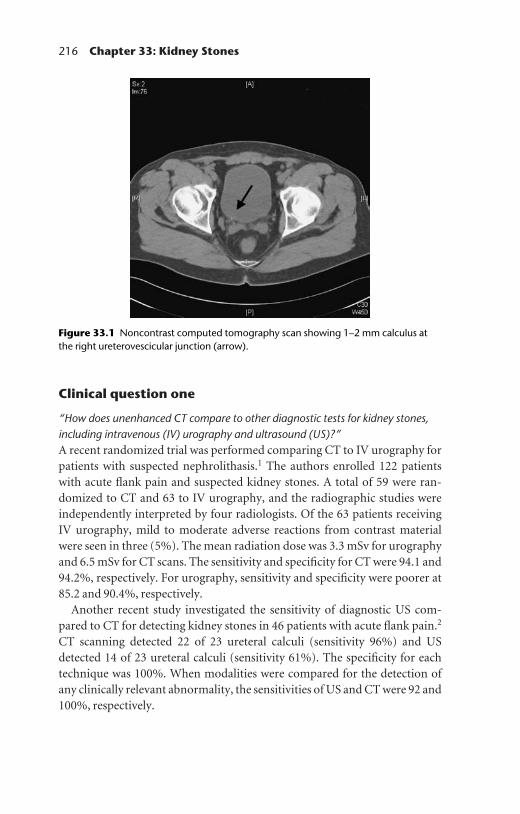
216 Chapter 33: Kidney Stones
Clinical question one
“How does unenhanced CT compare to other diagnostic tests for kidney stones,including intravenous (IV) urography and ultrasound (US)?”A recent randomized trial was performed comparing CT to IV urography forpatients with suspected nephrolithasis.1 The authors enrolled 122 patientswith acute flank pain and suspected kidney stones. A total of 59 were ran-domized to CT and 63 to IV urography, and the radiographic studies wereindependently interpreted by four radiologists. Of the 63 patients receivingIV urography, mild to moderate adverse reactions from contrast materialwere seen in three (5%). The mean radiation dose was 3.3 mSv for urographyand 6.5 mSv for CT scans. The sensitivity and specificity for CT were 94.1 and94.2%, respectively. For urography, sensitivity and specificity were poorer at85.2 and 90.4%, respectively.
Another recent study investigated the sensitivity of diagnostic US com-pared to CT for detecting kidney stones in 46 patients with acute flank pain.2
CT scanning detected 22 of 23 ureteral calculi (sensitivity 96%) and USdetected 14 of 23 ureteral calculi (sensitivity 61%). The specificity for eachtechnique was 100%. When modalities were compared for the detection ofany clinically relevant abnormality, the sensitivities of US and CT were 92 and100%, respectively.
Figure 33.1 Noncontrast computed tomography scan showing 1–2 mm calculus atthe right ureterovescicular junction (arrow).
9781405154000_4_033.qxd 19/03/2008 10:55 Page 216
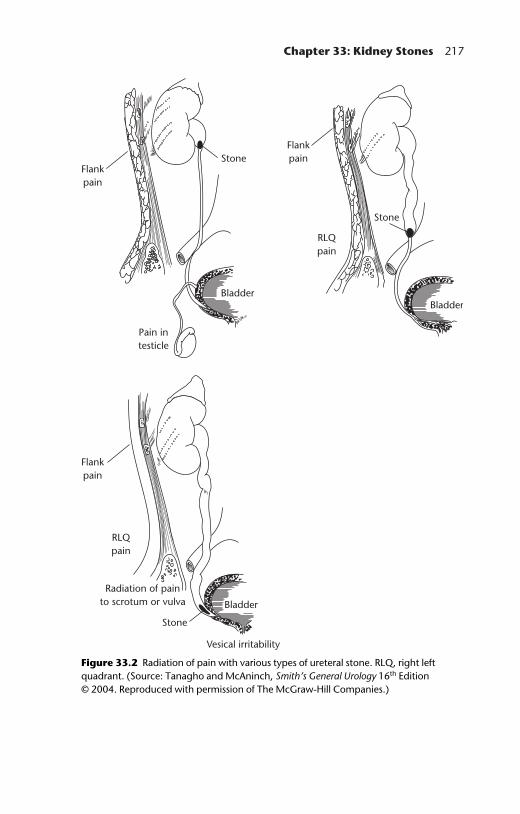
Chapter 33: Kidney Stones 217
Flankpain
Flankpain
RLQpain
Pain intesticle
BladderBladder
Stone
Stone
Flankpain
RLQpain
Bladder
Stone
Radiation of painto scrotum or vulva
Vesical irritability
Figure 33.2 Radiation of pain with various types of ureteral stone. RLQ, right leftquadrant. (Source: Tanagho and McAninch, Smith’s General Urology 16th Edition © 2004. Reproduced with permission of The McGraw-Hill Companies.)
9781405154000_4_033.qxd 19/03/2008 10:55 Page 217
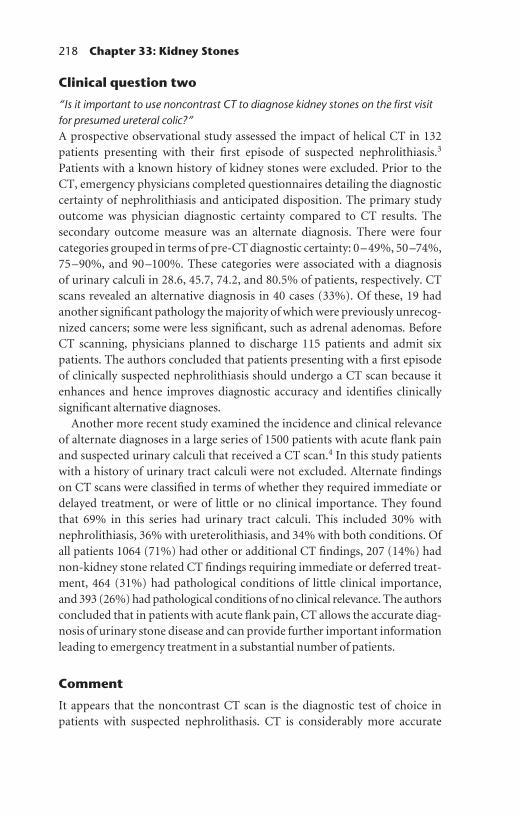
218 Chapter 33: Kidney Stones
Clinical question two
“Is it important to use noncontrast CT to diagnose kidney stones on the first visitfor presumed ureteral colic?”A prospective observational study assessed the impact of helical CT in 132patients presenting with their first episode of suspected nephrolithiasis.3
Patients with a known history of kidney stones were excluded. Prior to theCT, emergency physicians completed questionnaires detailing the diagnosticcertainty of nephrolithiasis and anticipated disposition. The primary studyoutcome was physician diagnostic certainty compared to CT results. The secondary outcome measure was an alternate diagnosis. There were four categories grouped in terms of pre-CT diagnostic certainty: 0–49%, 50–74%,75–90%, and 90–100%. These categories were associated with a diagnosis of urinary calculi in 28.6, 45.7, 74.2, and 80.5% of patients, respectively. CTscans revealed an alternative diagnosis in 40 cases (33%). Of these, 19 hadanother significant pathology the majority of which were previously unrecog-nized cancers; some were less significant, such as adrenal adenomas. BeforeCT scanning, physicians planned to discharge 115 patients and admit sixpatients. The authors concluded that patients presenting with a first episodeof clinically suspected nephrolithiasis should undergo a CT scan because itenhances and hence improves diagnostic accuracy and identifies clinicallysignificant alternative diagnoses.
Another more recent study examined the incidence and clinical relevanceof alternate diagnoses in a large series of 1500 patients with acute flank painand suspected urinary calculi that received a CT scan.4 In this study patientswith a history of urinary tract calculi were not excluded. Alternate findings on CT scans were classified in terms of whether they required immediate ordelayed treatment, or were of little or no clinical importance. They found that 69% in this series had urinary tract calculi. This included 30% withnephrolithiasis, 36% with ureterolithiasis, and 34% with both conditions. Ofall patients 1064 (71%) had other or additional CT findings, 207 (14%) hadnon-kidney stone related CT findings requiring immediate or deferred treat-ment, 464 (31%) had pathological conditions of little clinical importance,and 393 (26%) had pathological conditions of no clinical relevance. The authorsconcluded that in patients with acute flank pain, CT allows the accurate diag-nosis of urinary stone disease and can provide further important informationleading to emergency treatment in a substantial number of patients.
Comment
It appears that the noncontrast CT scan is the diagnostic test of choice inpatients with suspected nephrolithasis. CT is considerably more accurate
9781405154000_4_033.qxd 19/03/2008 10:55 Page 218

Chapter 33: Kidney Stones 219
than other testing modalities, such as IV urography or diagnostic ultrasound.For patients with a first episode of suspected nephrolithasis, CT scanningshould be used as it can confirm the presence of kidney stones and has the potential to find other clinically significant pathologies in a considerablenumber of cases.
References
1. Pfister, S.A., Deckart, A., Laschke, S., et al. (2003) Unenhanced helical computedtomography vs intravenous urography in patients with acute flank pain: accuracyand economic impact in a randomized prospective trial. European Radiology 13:2513–2520.
2. Sheafor, D.H., Hertzberg, B.S., Freed, K.S., et al. (2000) Nonenhanced helical CT and US in the emergency evaluation of patients with renal colic: prospectivecomparison. Radiology 217: 792–797.
3. Ha, M. and MacDonald, R.D. (2004) Impact of CT scan in patients with firstepisode of suspected nephrolithasis. Journal of Emergency Medicine 27: 225–231.
4. Hoppe, H., Studer, R., Kessler, T.M., et al. (2006) Alternate or additional findings tostone disease on unenhanced computerized tomography for acute flank pain canimpact management. Journal of Urology 175: 1725–1730.
9781405154000_4_033.qxd 19/03/2008 10:55 Page 219

220
Chapter 34 Testicular Torsion
Highlights
• Acute testicular torsion is a urological emergency and should be considered
in males presenting with testicular or scrotal pain.
• Testicular ultrasound (US) is widely available, highly accurate, and is
considered the study of choice.
• High-resolution ultrasonography (HRUS), which directly images the
spermatic cord, detects testicular torsion with high sensitivity and specificity;
however, it may not be widely available.
Background
The patient with testicular pain presents a diagnostic challenge for emergencyphysicians. There are multiple causes for testicular pain including infectiousand inflammatory reasons, neoplasms, hernias, acute trauma, and torsion.For those under the age of 25, testicular torsion occurs annually in approxim-ately 1 in 4000 males. Torsion should be considered in the differential diagnosis for every male presenting with testicular or scrotal pain, but it ispredominately a condition of the young and very young. Commonly, a twist-ing of the spermatic cord compromises the blood flow and causes acute pain.Obstruction of venous flow is the first finding of testicular torsion followedby arterial. The end result is testicular ischemia.
Testicular torsion is considered a urological emergency. Ruling out testicu-lar torsion is important and time-sensitive because delays in diagnosis andtherapy can result in problems with fertility, organ loss, and a poor cosmeticoutcome. Viability and salvageability of the torsed testicle decreases as thetime from the onset of symptoms (e.g. pain) increases, with approximately
9781405154000_4_034.qxd 26/03/2008 12:18 Page 220
Evidence-Based Emergency Care: Diagnostic Testing and Clinical Decision Rules. J.M. Pines andW.W. Everett. 2008 Jesse M. Pines and Worth W. Everett, ISBN: 978-1-4051-5400-0.

Chapter 34: Testicular Torsion 221
90% salvageability if detorsion is performed less than 6 h after onset, almost50% viability after 12 h, and close to 10% after 24 h. In the emergency depart-ment (ED), scintigraphy or US have become standard practice for diagnosingtesticular torsion. The limited widespread availability of nuclear imaging hasfurther restricted the use of testicular scintigraphy, resulting in testicular USbeing the usual imaging study ordered for this uncommon condition.
Clinical question
“What are the sensitivities and specificities of testicular scintigraphy compared totesticular US for the diagnosis of testicular torsion?”Several studies have compared testicular scintigraphy with testicular US. A 1990 study prospectively evaluated 28 males with acute scrotal pain rang-ing in age from one day old to 41 years.1 Patients with classic testicular torsionsymptoms were taken directly to the operating room and were thereforeexcluded from the study. All remaining patients underwent testicular scinti-graphy using technetium-99m pertechnetate as well as color Doppler US usinga 7.5-MHz linear probe. Studies were interpreted by the physician perform-ing the study who had full knowledge of the clinical histories. Seven testiculartorsion cases were identified at surgery (25%) and no cases were missed at follow-up. The performances of each diagnostic modality are shown in Table 34.1.
Not all patients underwent surgical exploration and therefore a hybridizedgold standard of a combination of clinical follow-up and surgical outcomewas used. The authors noted that color Doppler US permitted differentiationof other causes of acute scrotal pain, notably epididymitis and orchitis.
Table 34.1 Test performances of testicular color Doppler ultrasound (US) andtesticular scintigraphy for the diagnosis of acute testicular torsion from Middleton et al.1
Testicular torsion (+) Testicular torsion (−) Total
Color Doppler US (+) 7 0 7Color Doppler US (−) 0 21 21Total 7 21 28
Testicular scintigraphy (+) 6 0 6Testicular scintigraphy (−) 1 21 22Total 7 21 28
Color Doppler US: sensitivity 100% (95% CI: 59–100), specificity 100% (95% CI:84–100); testicular scintigraphy: sensitivity 86% (95% CI: 42–100), specificity 100%(95% CI: 84–100).
9781405154000_4_034.qxd 26/03/2008 12:18 Page 221

222 Chapter 34: Testicular Torsion
However, the small sample size precluded the recommendation of colorDoppler US as the preferred modality.
A retrospective pediatric study of 41 boys with acute scrotal pain andequivocal physical examinations from 1990 to 1996 compared the perform-ance of color Doppler US with testicular scintigraphy for the diagnosis of testicular torsion.2 Patients were followed through surgery or clinically untilthe symptoms were resolved. A total of 11 cases (27%) of torsion occurred.Several studies were interpreted as being non-diagnostic. The authors pre-sented two sets of performance tables, one that treated indeterminate studiesas being positive for torsion (see Table 34.2) and another that treated indeter-minate cases as being negative for torsion (see Table 34.3). The data presented
Table 34.3 Performance of color Doppler ultrasound (US) and testicular scintigraphyfor diagnosing testicular torsion when the indeterminate studies were considerednegative for torsion from Paltiel et al.2
Torsion (+) Torsion (−) Total
Color Doppler US (+) 9 1 10Color Doppler US (−) 2 29 31Total 11 30 41
Testicular scintigraphy (+) 10 0 10Testicular scintigraphy (−) 1 30 31Total 11 30 41
Color Doppler US: sensitivity 82% (95% CI: 48–98), specificity 97% (95% CI: 83–100);testicular scintigraphy: sensitivity 91% (95% CI: 59–100), specificity 100% (95% CI:88–100).
Table 34.2 Performance of color Doppler ultrasound (US) and testicular scintigraphyfor diagnosing testicular torsion when the indeterminate studies were consideredpositive for torsion from Paltiel et al.2
Torsion (+) Torsion (−) Total
Color Doppler US (+) 11 7 18Color Doppler US (−) 0 23 23Total 11 30 41
Testicular scintigraphy (+) 11 1 12Testicular scintigraphy (−) 0 29 29Total 11 30 41
Color Doppler US: sensitivity 100% (95% CI: 72–100), specificity 77% (95% CI:58–90); testicular scintigraphy: sensitivity 100% (95% CI: 72–100), specificity 97%(95% CI: 83–100).
9781405154000_4_034.qxd 26/03/2008 12:18 Page 222

Chapter 34: Testicular Torsion 223
in this way is a sensitivity analysis of sorts, showing the effect that indeter-minate cases have on the diagnostic performance of the tests.
The weaknesses of the retrospective design of the previous study prompteda prospective analysis of children comparing the same diagnostic tests.3
Forty-six children with acute scrotal pain that received both testicular scinti-graphy and US were enrolled. The final diagnosis was determined surgically in 16 cases and by following the clinical resolution in 30 boys. A total of 14cases of torsion were diagnosed in this study (34%); 12 had testicular torsionproven at surgery, one case was detected based on an antecedent torsion and testicular atrophy, and one case of late testicular torsion was detected at follow-up.
The correct diagnosis of torsion was made by US in 11 out of 14 cases (sensitivity 79%, 95% CI: 49–95) and the correct diagnosis of non-surgicalconditions was made in 31 out of 32 cases (specificity 97%, 95% CI: 84–100).The positive predictive value (PPV) and negative predictive value (NPV) for US were 92% (95%CI: 62–100) and 91% (95% CI: 76–98), respectively.Using US yielded a diagnostic accuracy of 91%. The correct diagnosis of torsion was made by scintigraphy in 11 of 14 cases (sensitivity 79%, 95% CI: 49–96) and the correct diagnosis of non-surgical conditions was made in 29 of 32 cases (specificity 91%, 95% CI: 75–98). The PPV and NPV forscintigraphy were 79% (95% CI: 49–95) and 91% (95% CI: 75–98), respec-tively. Scintigraphy resulted in a diagnostic accuracy of 87%.
The lack of a true gold standard imaging test is demonstrated by the falsenegatives seen in this study. The authors noted that one of the difficulties in diagnosing normal blood flow, not to mention the detection of abnormalor absent blood flow, was the small size of the prepubescent testicles.
From 1999 to 2005 European researchers studying the diagnosis of testi-cular torsion examined 61 infants and children ranging in age from one day old to 17 years presenting with acute scrotal pain, swelling, and redness.4 Allpatients underwent color Doppler US. Fifteen cases of torsion were detected(25%)—14 by the absence of venous pulsation and one by the absence of arterial pulsations—and all were surgically confirmed with no missedcases. Forty-six non-torsion cases were also diagnosed correctly. Table 34.4shows the performance of color Doppler US for the diagnosis of testiculartorsion.
These authors also performed a retrospective analysis of 75 acute scrotumcases from 1985 to 1994, before the start of the study described above. Allcases of suspected testicular torsion were explored surgically. Only 25 of the 75 cases (33%) were confirmed as torsion. These data were used as supporting evidence to demonstrate that the use of testicular US reduced the incidence of unnecessary surgical explorations.
9781405154000_4_034.qxd 26/03/2008 12:18 Page 223

224 Chapter 34: Testicular Torsion
The most recent modality to be tested for the diagnosis of testicular torsionis HRUS. This technique images the spermatic cord to enable twisting of the cord to be visualized directly. In a European multicenter study, childrenwith acute scrotal pain were imaged using both color Doppler US andHRUS.5 The study enrolled 919 patients from 1992 to 2005 (age range oneday old to 18 years). Spermatic cord torsion was diagnosed in 208 patients(23%). Using color Doppler US 158 of the 208 cases were detected (sensitivity76%, 95% CI: 70–82), whereas HRUS detected 199 of the 208 cases (sensitiv-ity 96%, 95% CI: 92–98). Calculation of the specificity of US could not be calculated from the data presented. The specificity of HRUS was 99% (95%CI: 98–100) with 705 of 711 cases revealing a linear (normal) spermatic cord.The PPV and NPV for HRUS were 97% (95% CI: 94–99) and 99% (95% CI:98–99), respectively.
Comments
The current practice environment for evaluation of the acute scrotumendorses either prompt surgical evaluation by a skilled urologist or, morecommonly, a diagnostic imaging study to aid in ruling out testicular torsion.Patients presenting with ‘classic’ findings of acute onset of pain, a high ridingtesticle, or other features that make the likelihood of acute torsion moderateor high, should not require a diagnostic test but rather should go directly tothe operating room for surgical exploration. It is cases in which the history,physical findings, or both are equivocal that should prompt the use of a diag-nostic imaging study.
The array of studies presented here demonstrate several key findings. First,regardless of the type of imaging study, none have been shown to be perfectly
Table 34.4 Performance of color Doppler ultrasound (US) for diagnosing acutetesticular torsion in pediatric patients from Gunther et al.4
Torsion (+) Torsion (−) Total
Color Doppler US (+) 15 0 15Color Doppler US (−) 0 46 46Total 15 46 61
Sensitivity, % (95% CI) 100 (78–100)Specificity, % (95% CI) 100 (92–100)PPV, % (95% CI) 100 (78–100)NPV, % (95% CI) 100 (92–100)
NPV, negative predictive value; PPV, positive predictive value.
9781405154000_4_034.qxd 26/03/2008 12:18 Page 224
Chapter 34: Testicular Torsion 225
sensitive or specific in any large study. Technological advances and neweruses for existing diagnostic equipment continue to increase diagnostic thresh-olds, and these have to be considered when conducting a review of the literature. Cases in which the clinical suspicion is great enough to warrantordering a study and cases in which the study results are indeterminate orpoor quality warrant a urological consultation. Second, clinicians shouldconsider the experience of the diagnostician interpreting the study. Finally,while this discussion has focused on using the imaging studies to rule out testicular torsion, US has the added advantage of providing an alternativediagnosis for conditions such as epididymitis, orchitis, and torsion of the testicular appendages.
The availability of US is greater than that of nuclear scintigraphy, making itthe study of choice. Clinicians with no access to either of these modalities, orwith no surgical backup available to perform the procedure, should arrangeto transfer the patient to a medical facility that is capable of performing boththe diagnostic study and the surgical procedure, as required for a positivediagnosis.
References
1. Middleton, W.D., Siegel, B.A., Melson, G.L., Yates, C.K. and Andriole, G.L. (1990)Acute scrotal disorders: prospective comparison of color Doppler US and testicularscintigraphy. Radiology 177(1): 177–181.
2. Paltiel, H.J., Connolly, L.P., Atala, A., Paltiel, A.D., Zurakowski, D. and Treves, S.T.(1998) Acute scrotal symptoms in boys with an indeterminate clinical presentation:comparison of color Doppler sonography and scintigraphy. Radiology 207(1):223–231.
3. Blask, A.R.N., Bulas, D., Shalaby-Rana, E., Rushton, G., Shao, C. and Majd, M.(2002) Color Doppler sonography and scintigraphy of the testis: a prospective,comparative analysis in children with acute scrotal pain. Pediatric Emergency Care18(2): 67–71.
4. Gunther, P., Schenk, J.P., Wunsch, R., et al. (2006) Acute testicular torsion in children: the role of sonography in the diagnostic workup. European Radiology16: 2527–2532.
5. Kalfa, N., Veyrac, C., Lopez, M., et al. (2007) Multicenter assessment of ultrasoundof the spermatic cord in children with acute scrotum. Journal of Urology 177:297–301.
9781405154000_4_034.qxd 26/03/2008 12:18 Page 225

SECTION 7
Neurology
9781405154000_4_035.qxd 19/03/2008 10:54 Page 227
Evidence-Based Emergency Care: Diagnostic Testing and Clinical Decision Rules. J.M. Pines andW.W. Everett. 2008 Jesse M. Pines and Worth W. Everett, ISBN: 978-1-4051-5400-0.

229
Chapter 35 Subarachnoid Hemorrhage
Highlights
• Noncontrast head computed tomography (CT) is the best initial imaging
study for diagnosing acute subarachnoid hemorrhage in the emergency
department (ED).
• Newer generation CT scanners have better diagnostic accuracy but may not
be available in all EDs.
• Lumbar puncture (LP) should be considered in patients with negative head
CTs who are still suspected of having the condition, particularly when there
is a high pre-test probability.
• There are no clinical decision rules or prediction rules regarding who
should undergo testing for subarachnoid hemorrhage or what constitutes
a positive LP.
Background
There are about five million ED visits per year for headache. Of those,between 1 and 4% have nontraumatic subarachnoid hemorrhage (SAH).Nontraumatic SAH is frequently caused by a ruptured cerebral aneurysm oran arteriovenous malformation. Extravasation of blood into the subara-chnoid space negatively affects local and global brain function. Dependingupon the size of the bleed, SAH can be fatal immediately; however, in cases ofsmaller bleeds, patients can present with severe headaches. SAH is a challengefor emergency providers because it can present in subtle ways and is associ-ated with considerable morbidity and mortality. SAH is typically diagnosedon nonconstrast head CT. However, head CT is not 100% sensitive for SAHand is particularly insensitive for diagnosing small intracranial bleeds or
9781405154000_4_035.qxd 19/03/2008 10:54 Page 229
Evidence-Based Emergency Care: Diagnostic Testing and Clinical Decision Rules. J.M. Pines andW.W. Everett. 2008 Jesse M. Pines and Worth W. Everett, ISBN: 978-1-4051-5400-0.

230 Chapter 35: Subarachnoid Hemorrhage
bleeding that is temporally distant from the ED presentation of headache.Because the greatest risk for rebleeding occurs within a month of the first sentient bleed, a timely and accurate diagnosis is vital for managing SAH andminimizing complications. Currently the gold standard for diagnosing SAHis LP, which will demonstrate either a high red blood cell count in the cere-brospinal fluid (CSF) or xanthochromia (a yellowing of the CSF secondary tobreakdown products of red blood cells). LP and CSF analysis can also revealother information that can be useful to clinicians, such as an elevation inintracranial pressure or the presence of infection.
There is no validated decision rule for predicting which patients requiretesting for SAH in the ED.1 A recent decision rule was derived for the detec-tion of SAH in ED patients with acute headache in six centers, which listedfour criteria: (i) arrival by ambulance; (ii) vomiting; (iii) a diastolic bloodpressure of 100 mmHg or above; and (iv) age 45 years or above. The rule wasfound to be 100% sensitive (95% CI: 97–100) and 36% specific (95% CI:34–39) for the detection of SAH. This data was published in abstract formonly, and as of the writing of this book no validation has been reported. Inaddition, the use of ‘arrival by ambulance’ as a criterion in any decision ruleconsiderably limits the validity and generalizability of the rule.
SAH is infrequently found on LP after a negative head CT. However, whenpatients are at high risk for SAH, a LP is certainly indicated. Given that a headCT does not completely rule out SAH, physicians often have to make thedifficult decision of whether to perform a LP when SAH is considered but the head CT is negative. Elements that often influence this decision include
Figure 35.1 Noncontrast head computed tomography showing a subarachnoidbleed.
9781405154000_4_035.qxd 19/03/2008 10:54 Page 230

Chapter 35: Subarachnoid Hemorrhage 231
the pre-test probability, the complication rate of LP, patient desire, and the concern over missing a potentially life-threatening disease. While LP has been shown to be a safe procedure, it still carries a relatively high rate of postdural headaches (up to 20–40% of cases). Up to 35% of patients will also experience low back pain. Also, in a busy ED, performing an LP can take considerable time by the emergency physician and can thus increase thelength of stay in the ED.
Clinical question
“What is the sensitivity of noncontrast head CT for subarachnoid hemorrhage?”The operating characteristic of sensitivity for noncontrast head CT for SAHhas been described in many studies. The major difference between these studies involves the type of CT scanner used. While earlier papers employedsingle-row CT scans to investigate nontraumatic SAH, more recent studieshave reported data on multidetector-row CT scans and have reported highersensitivity.
One of the first studies reporting data on nontraumatic SAH investigatedthe need for LP in patients that presented within the first 12 h of headacheonset and that had normal neurological examinations.2 They enrolled a con-secutive series of 175 patients where SAH was clinically suspected. All patientshad a noncontrast head CT followed by a LP (at 12 h or more after theheadache onset) if the head CT was negative. The CT was positive for SAH in 117 patients (67%); of the 58 patients with negative head CTs, CSF analysisrevealed SAH in two patients (3%; 95% CI: 0.4–12). In both of those cases,there was evidence of a ruptured aneurysm. Therefore, in two out of 119patients with SAH, the head CT was negative for a test sensitivity of 98%(95% CI: 92–100).
Another group studied data from patients with SAH from 1988 to 1994.3
They excluded patients who were age less than two years old and those that had a history of head trauma within 24 h of onset of symptoms. Theystratified patients into two groups based on symptom duration (<24 h and>24 h). They used a third-generation CT scanner for all scans in the study andall patients with negative head CTs received a diagnostic LP. In 181 patients,they determined the sensitivity of CT to be 93% for patients whose head CTwas performed with 24 h of symptom onset, and 84% for patients whose headCT was performed after 24 h for an overall sensitivity of 92%. This indicatesthat there is a spectrum bias that occurs with the use of CT scanning in SAHwhere as time goes by the sensitivity decreases.
Another study investigated the use of third-generation CT scanners inpatients with SAH over a three year period.4 Similar to the previous study,
9781405154000_4_035.qxd 19/03/2008 10:54 Page 231

232 Chapter 35: Subarachnoid Hemorrhage
patients received a noncontrast head CT followed by a LP if the CT was negative, and patients were stratified according to time of onset (<12 h and>12 h). Of 140 patients with SAH, the authors reported 100% sensitivity(95% CI: 95–100) in the 80 patients that were tested within 12 h of symptomonset and 82% (95% CI: 70–90) in patients tested after 12 h of symptomonset. They found that 11 out of 140 (8%) patients had a positive CSF forSAH after a negative head CT.
One of the only prospective studies examining this issue studied patientswho presented with the ‘worst headache of my life’ and who received LP iftheir CT was negative.5 Of the 107 patients enrolled, SAH was detected by CTin 18 patients (17%). Two patients (3%; 95% CI: 0–9) had SAH detected byLP after a negative head CT.
The most recent study investigating this issue used a fifth-generation multidetector-row CT scanner.6 Of 177 ED patients studied over a one-yearperiod that had a CT followed by a LP, they found that none had a negativehead CT and a positive LP.
Comment
Among the studies presented here there are some major limitations that needto be pointed out. Most of the studies are retrospective and did not followpatients who were discharged home without any testing or with just a negativehead CT. This is important because there may have been cases of SAH thatwere missed either because no testing was performed or because no LP wasperformed. Performances of the diagnostic tests would be expected to be different to those reported had potentially missed cases been considered.
There were also considerable differences in the prevalence of diseaseamong the populations studied, the highest being 67%. Certainly, in ourpractice such a high prevalence does not adequately characterize the patientsthat are assessed for SAH. This selection bias may affect the test sensitivity in a number of ways. It may underestimate it considerably because patients who had a negative head CT only and did not receive the gold standard test, either because the physician or the patient did not feel that the test wasindicated, may dramatically increase the denominator for whom SAH wasconsidered in the differential diagnosis. It is also possible that it could go the other way, where some patients with SAH were sent home without anytesting. Most of the studies did not follow patients and did not enroll a broadcohort of patients with headache to exclude either of these possibilities.
However, what is clear from these studies is the evidence of a spectrumbias, where test sensitivity decreases as time passes from the onset of acuteheadache. There were also variable definitions for a positive LP. Because there
9781405154000_4_035.qxd 19/03/2008 10:54 Page 232
Chapter 35: Subarachnoid Hemorrhage 233
are no widely accepted, validated criteria for a positive LP it can be difficult todistinguish a traumatic tap—whereby red blood cells from the mechanicalprocess of performing the procedure get into the CSF—from a truly positivetap. Finally, fifth-generation multidetector-row CT scanners seem be moreaccurate than earlier third-generation scanners in picking up SAH, indicatingthat test sensitivity may be higher in centers using the former. In addition,many of these studies had small sample sizes and were performed at only onecenter, both of which limits the generalizability of some these findings.
In largest study on missed SAH, the most common reason for missed diagnosis was the failure to order a head CT.7 In patients that present with the ‘worst headache of their life’, or when a patient who does not usually getheadaches presents with a new severe headache, or a patient with chronicheadaches presents with a change in their headache symptoms, then noncon-trast head CT is a reasonable diagnostic test if it is available. In our practice,the choice to perform LP on patients is highly dependent on the pre-testprobability for disease. Given the high risk of complications, including post-dural headache and lower back pain, in centers where multidetector-row CTis available, it may be reasonable practice to defer LP in cases where there is alow pre-test probability.
References
1. Perry, J.J., Stiell, I.G., Wells, G.A., et al. (2006) A clinical decision rule to safely ruleout subarachnoid hemorrhage in acute headache patients in the emergency depart-ment. Academic Emergency Medicine 13: S9.
2. van der Wee, N., Rinkel, G.J. and Hasan, D. (1995) Detection of subarachnoidhaemorrhage on early CT: is lumbar puncture still needed after a negative scan?Journal of Neurology, Neurosurgery and Psychiatry 58: 357–359.
3. Sames, T.A., Storrow, A.B., Finkelstein, J.A. and Magoon, M.R. (1996) Sensitivityof new-generation computed tomography in subarachnoid hemorrhage. AcademicEmergency Medicine 3: 16–20.
4. Sidman, R., Connolly, E. and Lemke, T. (1996) Subarachnoid hemorrhage diagnosis: lumbar puncture is still needed when the computed tomography scan isnormal. Academic Emergency Medicine 3: 827–831.
5. Morgenstern, L.B., Luna-Gonzales, H. and Huber, J.C., Jr, et al. (1998) Worstheadache and subarachnoid hemorrhage: prospective, modern computed tomo-graphy and spinal fluid analysis. Annals of Emergency Medicine 32: 297–304.
6. Boesiger, B.M. and Shiber, J.R. (2005) Subarachnoid hemorrhage diagnosis by com-puted tomography and lumbar puncture: are fifth generation CT scanners better atidentifying subarachnoid hemorrhage? Journal of Emergency Medicine 29: 23–27.
7. Kowalski, R.G., Classen, J. and Kreiter, K.T. (2004) Initial misdiagnosis and out-come after subarachnoid hemorrhage. Journal of the American Medical Association291: 866–869.
9781405154000_4_035.qxd 19/03/2008 10:54 Page 233
234
Chapter 36 Acute Stroke
Highlights
• Rapid evaluation of patients with acute stroke using noncontrast
head computed tomography (CT) scanning is critical in differentiating
hemorrhagic versus ischemic stroke and in identifying patients that
may be candidates for intravenous thrombolysis (within three hours of
symptom onset).
• Magnetic resonance imaging (MRI) with diffusion-weighted imaging
(DWI) is more sensitive (~97%) than noncontrast head CT for detecting
ischemic strokes.
• Noncontrast head CT and MRI can both accurately differentiate ischemic
from hemorrhagic stroke, but MRI can provide more information on
microhemorrhages.
• Noncontrast CT remains the standard brain imaging study for the initial
emergency department (ED) evaluation of patients with acute stroke
symptoms; however, MRI may gain favor as it becomes more widely
available.
Background
Stroke is the third leading cause of death in the US and the leading cause ofdisability. Rapid bedside and radiological evaluation in cases of acute strokewithin 6 h of symptom onset are critical in the assessment of patients that arepotentially eligible for intravenous and intra-arterial thrombolysis with tissueplasminogen activator (tPA). In acute ischemic stroke, the central event is an acute vascular occlusion (Fig. 36.1); however, 15% of strokes are hemor-rhagic (Fig. 36.2). Hemorrhagic strokes treated with tPA do not benefit from
9781405154000_4_036.qxd 19/03/2008 10:53 Page 234
Evidence-Based Emergency Care: Diagnostic Testing and Clinical Decision Rules. J.M. Pines andW.W. Everett. 2008 Jesse M. Pines and Worth W. Everett, ISBN: 978-1-4051-5400-0.

Chapter 36: Acute Stroke 235
thrombolysis; indeed this can worsen bleeding and can be lethal. Today,intravenous thrombolysis is the treatment of choice in patients that haveischemic lesions involving greater than one third of the middle cerebral arteryterritory, no incidence of intracranial hemorrhage presenting within 3 h ofthe onset of symptoms, and no other contraindications for tPA usage. Tra-ditionally, noncontrast head CT is the first imaging modality in acute strokein the ED. By using noncontrast head CT we are able to differentiate between hemorrhagic and ischemic stroke, and can also exclude other potential causes of acute neurological symptoms. Multimodal MRI with DWI is one of themore advanced imaging techniques that are frequently performed after CTscanning because it is considered to be a more accurate diagnostic test forstroke. The primary clinical concerns regarding the use of MRI with DWI as a solitary test are: (i) its reduced ability to detect intracranial hemorrhagein the setting of acute stroke; (ii) the poorer clinical access for potentiallyunstable patients; (iii) longer testing times; and (iv) the poor availability ofrapid MRI.
Clinical question
“What is the sensitivity of diagnostic modalities (head CT and MRI) in acutestroke, and does MRI miss acute intracranial hemorrhages?”A recent review of articles has been published in which noncontrast head CTwas compared to MRI with DWI in acute stroke patients in order to calculatesensitivity and specificity values.1 The authors included articles where both
(a) (b)
Figure 36.1 Noncontrast head computed tomography showing ischemic stroke in theleft posterior cerebral artery region (a), which was confirmed by magnetic resonanceimaging (b).
9781405154000_4_036.qxd 19/03/2008 10:53 Page 235
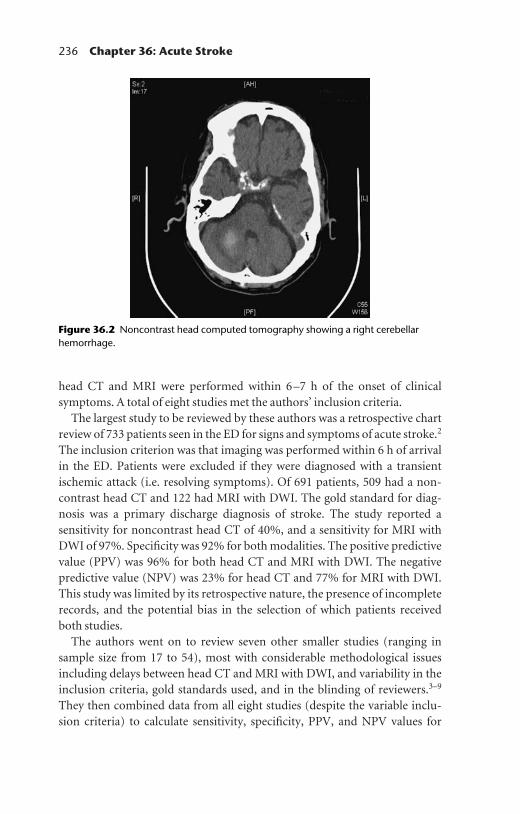
236 Chapter 36: Acute Stroke
head CT and MRI were performed within 6–7 h of the onset of clinical symptoms. A total of eight studies met the authors’ inclusion criteria.
The largest study to be reviewed by these authors was a retrospective chartreview of 733 patients seen in the ED for signs and symptoms of acute stroke.2
The inclusion criterion was that imaging was performed within 6 h of arrivalin the ED. Patients were excluded if they were diagnosed with a transientischemic attack (i.e. resolving symptoms). Of 691 patients, 509 had a non-contrast head CT and 122 had MRI with DWI. The gold standard for diag-nosis was a primary discharge diagnosis of stroke. The study reported a sensitivity for noncontrast head CT of 40%, and a sensitivity for MRI withDWI of 97%. Specificity was 92% for both modalities. The positive predictivevalue (PPV) was 96% for both head CT and MRI with DWI. The negativepredictive value (NPV) was 23% for head CT and 77% for MRI with DWI.This study was limited by its retrospective nature, the presence of incompleterecords, and the potential bias in the selection of which patients received both studies.
The authors went on to review seven other smaller studies (ranging in sample size from 17 to 54), most with considerable methodological issuesincluding delays between head CT and MRI with DWI, and variability in theinclusion criteria, gold standards used, and in the blinding of reviewers.3–9
They then combined data from all eight studies (despite the variable inclu-sion criteria) to calculate sensitivity, specificity, PPV, and NPV values for
Figure 36.2 Noncontrast head computed tomography showing a right cerebellarhemorrhage.
9781405154000_4_036.qxd 19/03/2008 10:53 Page 236

Chapter 36: Acute Stroke 237
each modality. For MRI with DWI, the sensitivity was 97% (95% CI: 94–98),specificity 100% (95% CI: 88–100), PPV 100% (95% CI: 98–100), and NPV91% (95% CI: 75–98). The sensitivity of head CT was 47% (95% CI: 43–51),specificity 93% (95% CI: 85–97), PPV 97% (95% CI: 94–99), and NPV 23%(95% CI: 19–28).
Another more recent prospective study compared MRI with DWI to non-contrast CT in the ED in a single center in patients with suspected stroke.10
The scans were interpreted independently by four separate radiologists whowere blinded to clinical information. In 356 patients, 217 had a final diagnosisof acute stroke. MRI detected acute stroke (both ischemic and hemorrhagic)and chronic hemorrhage more frequently than CT (P < 0.0001, for all com-parisons). However, in the detection of acute intracranial hemorrhage, MRIwas similar to CT. MRI and CT detected acute ischemic stroke in 164 out of356 patients (46%; 95% CI: 41–51) and 35 out of 356 patients (10%; 95% CI:7–14), respectively. A subset analysis was performed on patients who werescanned within 3 h of the onset of symptoms. In those patients, MRI and CTdetected acute ischemic stroke in 41 out of 90 patients (46%; 95% CI: 35–56)and 6 out of 90 patients (7%; 95% CI: 3–14), respectively. Using the final clinical diagnosis as the gold standard, they reported a sensitivity of 83%(95% CI: 78–88) for MRI and 26% (95% CI: 20–32) for CT. The authorsconcluded that MRI was better than CT in terms of its ability to detect acuteischemia. There were no differences in detecting acute and chronic hemor-rhage. They concluded that MRI should be the preferred test for patients with suspected stroke.
Other studies have confirmed that MRI with DWI is as sensitive as CTscanning for detecting acute intracranial hemorrhage. Fiebach et al. per-formed a multicenter study to test how accurate MRI was in the detection of acute intracranial hemorrhage in patients with suspected stroke.11 Theycompared MRI images from 62 patients with intracranial hemorrhages and62 without intracranial hemorrhages, all of whom were imaged within 6 h ofsymptom onset, using CT as the gold standard. Experienced readers of MRIwere able to detect intracranial hemorrhage in all cases (100% sensitivity;95% CI: 97–100).
Kidwell et al. also compared the accuracy of MRI to that of CT in detectingintracranial hemorrhage in patients within 6 h of onset of the acute focalsymptoms of stroke in two centers.12 Patients presenting underwent MRI followed by a noncontrast CT and scans were read by four blinded readers.The authors stopped the study early after only 200 patients were enrolled as a result of an interim analysis where they found that MRI was detecting casesof hemorrhagic transformation that were not detected on CT scans. MRI was positive in 71 patients with any hemorrhage and CT was positive in 29
9781405154000_4_036.qxd 19/03/2008 10:53 Page 237

238 Chapter 36: Acute Stroke
(P < 0.001). There was no difference in the ability of MRI and CT to diagnoseacute hemorrhage. Acute hemorrhage was detected in 25 patients on bothMRI and CT; however, in four different patients acute hemorrhage wasdetected on MRI but not CT. In three of the patients, regions that were inter-preted as an acute hemorrhage on CT scans were read as chronic hemorrhageon MRI. There was one patient in whom subarachnoid hemorrhage was seen on CT scans but not on MRI. Chronic hemorrhage (microbleeds) thatwas not seen on CT scan was visualized by MRI in 49 patients. The authorsconcluded that MRI was as accurate as CT scanning in detecting acute hemorrhage in patients with acute focal symptoms of stroke, and was moreaccurate than CT in detecting chronic intracranial hemorrhage.
Comment
In emergency care, the current standard in cases of acute stroke is non-contrast head CT to determine the presence of intracranial hemorrhage,detect large strokes, and potentially exclude other neurological causes forstroke symptoms. Head CT and clinical evaluation are the standards by which the decision to use thrombolysis is typically made. Because head CT has limited sensitivity, thrombolysis is used in up to one fifth of the cases of strokemimics. In most instances then this is followed by MRI with DWI, which is amore sensitive test for acute stroke. However, this modality has limited avail-ability, higher cost, takes longer to perform, and requires a higher degree ofpatient participation. MRI with DWI is also more sensitive than head CT inidentifying large-volume strokes, which are at increased risk of hemorrhagictransformation and are also more sensitive at detecting chronic intracranialhemorrhage.
A primary historical concern with the use of only MRI with DWI in acutestroke was that head CT was more sensitive at detecting acute intracranialhemorrhage. However, recent studies with newer MRI technology have vir-tually disproved this. In the future, improvements in the availability of MRImay make it the only test needed for stroke assessment in the ED.
References
1. Davis, D.P., Robertson, T. and Imbesi, S.G. (2006) Diffusion-weighted magneticresonance imaging versus computed tomography in the diagnosis of acuteischemic stroke. Journal of Emergency Medicine 31: 269–277.
2. Mullins, M.E., Schaefer, P.W., Sorensen, A.G., et al. (2002) CT and conventionaland diffusion-weighted MR imaging in acute stroke: study in 691 patients at presentation to the emergency department. Radiology 224: 353–359.
9781405154000_4_036.qxd 19/03/2008 10:53 Page 238

Chapter 36: Acute Stroke 239
3. Fiebach, J., Jansen, O., Schellinger, P., et al. (2001) Comparison of CT with diffusion-weighted MRI in patients with hyperacute stroke. Neuroradiology 43:628–632.
4. Fiebach, J.B., Schellinger, P.D., Jansen, O., et al. (2002) CT and diffusion-weightedMR imaging in randomized order. Stroke 33: 2206–2210.
5. Urbach, H., Flacke, S., Keller, E., et al. (2000) Detectability and detection rate of acute cerebral hemisphere infarcts on CT and diffusion-weighted MRI.Neuroradiology 42: 722–727.
6. Lansberg, M.G., Albers, G.W., Beaulieu, C. and Marks, M.P. (2000) Comparisonof diffusion-weighted MRI and CT in acute stroke. Neurology 54: 1557–1561.
7. Gonzales, R.G., Schaefer, P.W., Buonanno, F.S., et al. (1999) Diffusion-weightedMR imaging: diagnostic accuracy in patients imaged within 6 hours of strokesymptom onset. Radiology 210: 155–162.
8. Barber, P.A., Darby, D.G., Desmond, P.M., et al. (1999) Identification of majorischemic change, diffusion-weighted imaging versus computed tomography. Stroke30: 2059–2065.
9. Saur, D., Kucinski, T., Grzyska, U., et al. (2003) Sensitivity and interrater agree-ment of CT and diffusion-weighted MR imaging in hyperacute stroke. AJNRAmerican Journal of Neuroradiology 24: 878–885.
10. Chalela, J.A., Kidwell, C.S., Nentwich, L.M., et al. (2007) Magnetic resonanceimaging and computed tomography in emergency assessment of patients withsuspected acute stroke: a prospective comparison. Lancet 369: 293–298.
11. Fiebach, J.B., Schellinger, P.D., Gass, A., et al. (2004) Stroke magnetic resonanceimaging is accurate in hyperacute intracerebral hemorrhage: a multicenter studyon the validity of stroke imaging. Stroke 35: 502–506.
12. Kidwell, C.S., Chalela, J.A., Saver, J.L., et al. (2004) Comparison of MRI and CTfor detection of acute intracerebral hemorrhage. Journal of the American MedicalAssociation 292(15): 1823–1830.
9781405154000_4_036.qxd 19/03/2008 10:53 Page 239

SECTION 8
Miscellaneous:Ophthalmology,Hematology,Rheumatology, andPulmonology
9781405154000_4_037.qxd 19/03/2008 10:53 Page 241
Evidence-Based Emergency Care: Diagnostic Testing and Clinical Decision Rules. J.M. Pines andW.W. Everett. 2008 Jesse M. Pines and Worth W. Everett, ISBN: 978-1-4051-5400-0.

243
Chapter 37 Pulmonary Embolism andDeep Vein Thrombosis
Highlights
• Deep venous thrombosis (DVT) and pulmonary embolism (PE) are
potentially lethal conditions that can present atypically.
• Scoring systems like the Wells criteria, the Geneva score, and the Pulmonary
Embolism Research Consortium (PERC) rule can offer a guide for clinicians as
to the likelihood of thromboembolic disease.
• Diagnostic evaluation involves risk assessment coupled with D-dimer testing
for low to very low-risk patients.
• Imaging studies include venous compression ultrasound for DVT and chest
computed tomography angiography (CTA) plus venous-phase multidetector
computed tomography venography (CTV) for pulmonary embolism.
Background
Diagnosing DVT and PE, also known together as venous thromboembolic(VTE) disease, represents a challenge in emergency care because both canpresent with nonspecific symptoms and both can be potentially lethal. Accurateand timely identification of patients with DVT and PE in the emergencydepartment (ED) can minimize complications and morbidity. However, both DVT and PE are relatively rare entities—ones that are often sought but infrequently found. Approximately 84 in 100 000 patients per year developDVT and between 100 and 200 in 100 000 patients per year develop PE. Thechallenge in diagnosing DVT and PE in the ED is the appropriate selection of patients for diagnostic testing and risk stratification based on clinicalfindings. While many tests are available for DVT and PE for ED patients,there is a large literature on this topic—mostly directed at the determination
9781405154000_4_037.qxd 19/03/2008 10:53 Page 243
Evidence-Based Emergency Care: Diagnostic Testing and Clinical Decision Rules. J.M. Pines andW.W. Everett. 2008 Jesse M. Pines and Worth W. Everett, ISBN: 978-1-4051-5400-0.

244 Chapter 37: Pulmonary Embolism
of pre-test probabilities using clinical decision rules, and the calculation ofsensitivity and specificity for a diagnostic test. The following is not meant tobe a comprehensive review of all aspects of the diagnosis of DVT and PE inthe ED; rather, it is a compilation of clinically relevant questions and studiesproviding objective data for specific research questions.
There are multiple tests for PE, including the D-dimer test (performed as an enzyme-linked immunosorbant assay (ELISA) or whole-blood assay),chest computed tomography (CT), ventilation/perfusion (V/Q) scan, andpulmonary angiogram. The choice of test is traditionally made followingassessment of the pre-test probability of disease based on objective clinicalcriteria, where lower risk patients can receive D-dimers to rule out PE andhigher risk patients traditionally receive more tests, which have higher sensit-ivities, such as a chest CT or V/Q scan. Because the pulmonary angiogram,long considered the gold standard test for PE, has a 1.5% incidence of seriouscomplications as a result of the test itself, it is rarely used to make a diagnosisand/or guide patient management unless absolutely necessary.
Venous non-compressibility assessed using ultrasound is the major diag-nostic criterion for venous thrombosis (Fig. 37.1). However, compressionultrasound is not specific or sensitive enough for detecting DVT in patientswith asymptomatic proximal DVT or in patients with DVT in the calf. It alsohas limited accuracy in cases of chronic DVT. The use of ultrasound is furtherlimited in patients who are obese or who have edema. In general, despite itslimitations, leg compression ultrasound is used to detect DVT in the ED.Traditionally, only the proximal veins (from the femoral veins down to thecalf where they join the popliteal veins) are studied. DVTs usually start in thecalf and, in symptomatic DVT, more than 80% of the time this involves thepopliteal vein and more proximal leg veins. In patients with calf DVTs thatmay not be detected on the first ED ultrasound, about 20% will extend moreproximally within about a week. Non-extending calf DVTs very rarely causePE while proximal DVTs are at much higher risk for propagation and hencefor causing PE.
Clinical question one
“How sensitive is ultrasound in detecting DVT?”A recent review of non-invasive methods for the diagnosis of first and recur-rent DVT was performed to study the diagnostic sensitivity of ultrasound.1
The authors used contrast venography as the gold standard for the detectionof DVT and included only prospective cohort studies and randomized clinical trials. Combined data from individual studies were assessed using a random-effects model. In this pooled analysis the sensitivity of venous
9781405154000_4_037.qxd 19/03/2008 10:53 Page 244
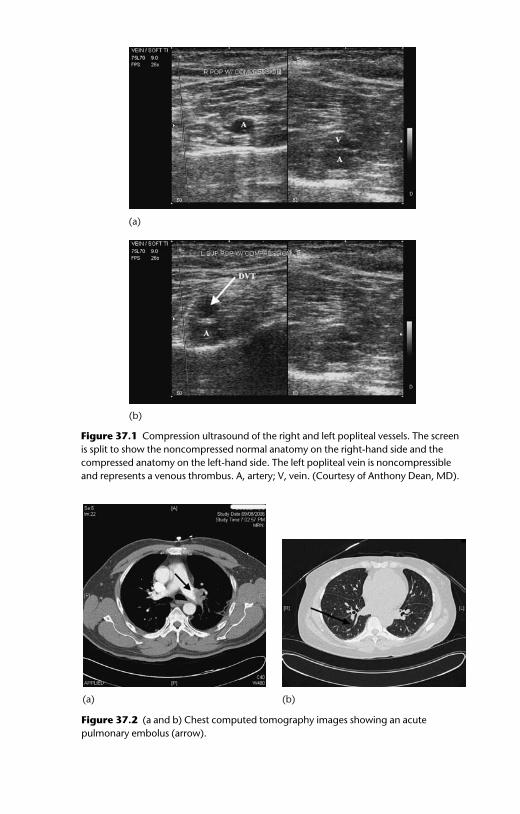
(a) (b)
Figure 37.2 (a and b) Chest computed tomography images showing an acutepulmonary embolus (arrow).
(a)
(b)
Figure 37.1 Compression ultrasound of the right and left popliteal vessels. The screenis split to show the noncompressed normal anatomy on the right-hand side and thecompressed anatomy on the left-hand side. The left popliteal vein is noncompressibleand represents a venous thrombus. A, artery; V, vein. (Courtesy of Anthony Dean, MD).
9781405154000_4_037.qxd 19/03/2008 10:53 Page 245
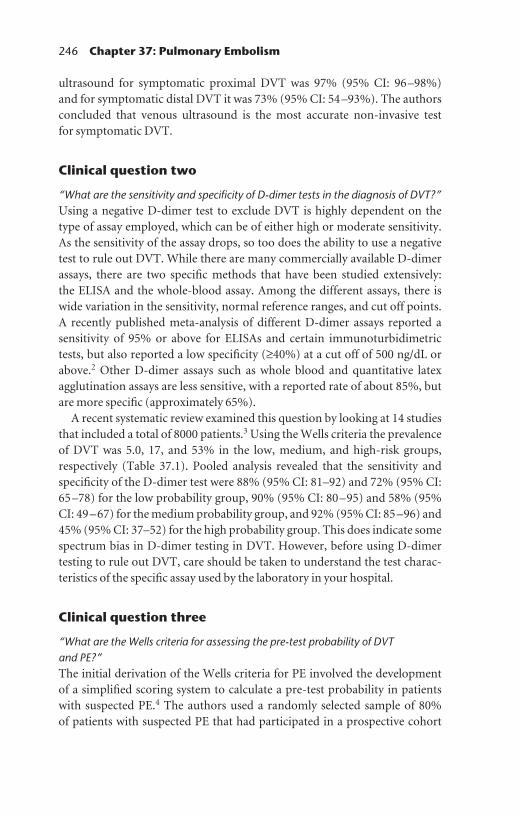
246 Chapter 37: Pulmonary Embolism
ultrasound for symptomatic proximal DVT was 97% (95% CI: 96–98%) and for symptomatic distal DVT it was 73% (95% CI: 54–93%). The authors concluded that venous ultrasound is the most accurate non-invasive test for symptomatic DVT.
Clinical question two
“What are the sensitivity and specificity of D-dimer tests in the diagnosis of DVT?”Using a negative D-dimer test to exclude DVT is highly dependent on thetype of assay employed, which can be of either high or moderate sensitivity.As the sensitivity of the assay drops, so too does the ability to use a negativetest to rule out DVT. While there are many commercially available D-dimerassays, there are two specific methods that have been studied extensively: the ELISA and the whole-blood assay. Among the different assays, there iswide variation in the sensitivity, normal reference ranges, and cut off points. A recently published meta-analysis of different D-dimer assays reported asensitivity of 95% or above for ELISAs and certain immunoturbidimetrictests, but also reported a low specificity (≥40%) at a cut off of 500 ng/dL orabove.2 Other D-dimer assays such as whole blood and quantitative latexagglutination assays are less sensitive, with a reported rate of about 85%, butare more specific (approximately 65%).
A recent systematic review examined this question by looking at 14 studiesthat included a total of 8000 patients.3 Using the Wells criteria the prevalenceof DVT was 5.0, 17, and 53% in the low, medium, and high-risk groups,respectively (Table 37.1). Pooled analysis revealed that the sensitivity andspecificity of the D-dimer test were 88% (95% CI: 81–92) and 72% (95% CI:65–78) for the low probability group, 90% (95% CI: 80–95) and 58% (95%CI: 49–67) for the medium probability group, and 92% (95% CI: 85–96) and45% (95% CI: 37–52) for the high probability group. This does indicate somespectrum bias in D-dimer testing in DVT. However, before using D-dimertesting to rule out DVT, care should be taken to understand the test charac-teristics of the specific assay used by the laboratory in your hospital.
Clinical question three
“What are the Wells criteria for assessing the pre-test probability of DVT and PE?”The initial derivation of the Wells criteria for PE involved the development of a simplified scoring system to calculate a pre-test probability in patientswith suspected PE.4 The authors used a randomly selected sample of 80% of patients with suspected PE that had participated in a prospective cohort
9781405154000_4_037.qxd 19/03/2008 10:53 Page 246

Chapter 37: Pulmonary Embolism 247
study of patients and had received D-dimer testing (SimpleRED test), andperformed logistic regression analysis using 40 clinical variables to create a clinical prediction rule. They created cut off points for the new rule anddevised two separate scoring systems. The first classified patients as havinglow, moderate, or high probability of PE, and the second created two cat-egories, PE likely and PE unlikely. The goal in the second system was thatpatients who were PE unlikely and had a negative D-dimer test would have aPE prevalence of less than 2%. The authors then applied these probabilities to the remaining 20% of the sample (to validate the scoring system). Sevenvariables ended up being predictive of PE and were termed the Wells criteriafor PE (see Table 37.2).
The interpreted point totals did not include D-dimer testing. ‘PE unlikely’was assigned to patients with a score of four points or less. Without the use
Table 37.1 Pooled analysis of the performance characteristics of the D-dimer test forruling out deep vein thrombosis from Wells et al.3
Pre-test probability
Specific measure Low Moderate High
Sensitivity, % 88 (81–92) 90 (80–95) 92 (85–96)Specificity, % 72 (65–78) 58 (49–67) 45 (37–52)NPV 99 (98–99) 96 (94–97) 84 (77–89)PPV 17 (13–20) 32 (25–41) 66 (56–75)
NPV, negative predictive value; PPV, positive predictive value.
Table 37.2 The Wells criteria for assessing the pre-test probability of suspectedpulmonary embolism (PE) from Wells et al.4
Clinical factor Point score*
Clinical DVT (objective leg swelling, tenderness) 3.0Heart rate ≥100 bpm 1.5Immobilization >3 days or surgery in previous 4 weeks 1.5Previous DVT/PE 1.5Hemoptysis 1.0Malignancy 1.0PE as likely or more likely than alternative diagnosis 3.0
DVT, deep venous thrombosis.* Interpretation of point score: <2 points, low risk (mean probability: 3.6%); 2–6 points, moderate risk (mean probability: 20.5%); ≥6 points, high risk (meanprobability: 66.7%).
9781405154000_4_037.qxd 19/03/2008 10:53 Page 247

248 Chapter 37: Pulmonary Embolism
of D-dimer testing, the prevalence of PE in those whose score was greaterthan four was 7.8%. However, when the D-dimer was negative, the rate of PEwas only 2.2% (95% CI: 1.0–4.0) in the derivation dataset and 1.7% in thevalidation dataset. Using a cut-off of two points or less, a negative D-dimertest resulted in a PE rate of 1.5% (95% CI: 0.4–3.7) in the derivation datasetand 2.7% (95% CI: 0.3–9.0) in the validation dataset, and only occurred in29% of patients. The authors concluded that a combination of a score of fouror less and a negative D-dimer test may have a negative predictive value wheresafe discharge is possible in patients with suspected PE.
Dr. Wells and colleagues also derived and validated a similar rule for DVT(see Table 37.3).5 In the validation study, all patients had ultrasonographyand venography. In 529 patients, the Wells criteria predicted the prevalenceof DVT in high (85%), medium (33%) and low-risk (5%) cases.
Clinical question four
“What is the Geneva score for PE and how does this compare to the Wells score?”The Geneva score is a system that clinicians can use to risk-stratify patientswith potential PE, similar to the Wells score. The original scoring system waslimited in that it required arterial blood gas analysis, which is painful andunnecessary in low-risk patients. The revised Geneva score was recently pub-lished and this does not include arterial blood gas analysis.6 This scoring sys-tem also does not require an assessment by the physician regarding whetherPE is the leading diagnosis, as in the Wells score.
The revised Geneva score was derived in 965 consecutive patients that wereevaluated for PE according to a standardized protocol. A total of 23% of
Table 37.3 The Wells criteria for deep vein thrombosis (DVT) from Wells et al.5
Clinical feature Score*
Active cancer (current treatment or within 6 months or palliative) 1Paralysis, paresis, or recent immobilization 1Recently bedridden for >3 days or major surgery within 4 weeks 1Localised calf tenderness 1Entire leg swollen 1Calf swelling >3 cm compared with the asymptomatic leg (10 cm below tibial tuberosity) 1Pitting edema in the symptomatic leg 1Collateral superficial veins (non-varicose) 1Alternative diagnosis as likely or greater than that of DVT −2
* Interpretation of score: high risk, ≥3 points; moderate risk, 1–2 points; low risk, ≤0 points.
9781405154000_4_037.qxd 19/03/2008 10:53 Page 248

Chapter 37: Pulmonary Embolism 249
patients in the derivation cohort and 26% in the validation cohort had PE.The area under the receiver operating characteristic (ROC) was 0.74 (95% CI: 0.70–0.78) in both the derivation and validation datasets. The revisedGeneva score also performed well in an external validation cohort of 756patients (see Tables 37.4 and 37.5).
Clinical question five
“Which patients require testing for PE and can the Pulmonary Embolism ResearchConsortium (PERC) rule aid in making this decision?”Overuse of the D-dimer test to screen for possible PE can have negative con-sequences due to its low specificity. Because patients with elevated D-dimersget CT scans to rule out PE and the number of negative CTs for PE is high, having the ability to select which patients need testing to rule out PEwould be clinically helpful. A study by Kline et al. aimed to derive and testclinical criteria to justify not ordering a D-dimer test on ED patients.7 They
Table 37.5 The revised Geneva score: classification according to points
Total points Risk Prevalence of PE*
0–3 Low 7.9%4–10 Intermediate 28%
≥11 High 74%
* In the validation cohort.
Table 37.4 The revised Geneva score from Pierre et al.6
Points
Risk factors:Age >65 years 1Previous DVT or PE 3Surgery or fracture within one month 2Active malignancy 2Symptoms:Unilateral lower limb pain 3Hemoptysis 2Clinical signs:Heart rate 75–94 bpm 3Heart rate ≥95 bpm 5Pain on lower limb deep vein palpation and unilateral edema 4
DVT, deep venous thrombosis; PE, pulmonary embolism.
9781405154000_4_037.qxd 19/03/2008 10:53 Page 249
250 Chapter 37: Pulmonary Embolism
constructed a prediction rule, called the PERC rule, in 3148 ED patients inorder to identify those at such low risk that they would not require any testing at all for PE. The authors sought to find variables that were associated with the absence of PE. In the derivation study, the prevalence of PE was 11%. The final model derived consisted of eight criteria. If all of the following arenegative, the patient does not require testing for PE and PE can be ruled outon clinical grounds:• age less than 50 years;• pulse less than100 bpm;• oxygen saturation greater than 94%;• absence of unilateral leg swelling;• no hemoptysis;• no recent trauma or surgery;• no history of DVT or PE; and• no hormone use.A validation set included 1427 low-risk patients, 8% of which had PE. Therule was negative (i.e. did not meet any of the criteria) in 25% of them.Among those who were PERC rule-negative, the proportion with PE was only1.4% (95% CI: 0.4–3.2). The authors concluded that these low-risk patientsdid not need a test for PE. When the same rule was applied retrospectively to acohort with a 25% prevalence of PE, 6.7% had PE.8 At the 2007 Society forAcademic Emergency Medicine meeting, Dr. Kline presented a multicentervalidation of the PERC rule and validated the results across multiple settings.The formal peer-reviewed publication of this work is still pending at the timeof writing this book.
Clinical question six
“Can CT of the chest be used as a diagnostic endpoint in patients at high risk of PE?”First generation CT scanners demonstrated poor sensitivity (70%) for detect-ing PE. However, in the past few years multidetector-row CT scanning hasbeen piloted as a potential replacement to pulmonary angiography (Fig. 37.2).In a prospective study of 756 patients that were referred to the ED with a suspicion of PE (prevalence of 26%), 524 patients that had either a high clinical probability, or a low or medium clinical probability and a positive D-dimer test (ELISA), received both a lower extremity ultrasound and a multidetector-row chest CT.9 A total of three out of 324 patients had a pro-ximal DVT on ultrasound and a negative chest CT (0.9%). At the three-month follow-up, the overall risk of DVT and PE was estimated to be 1.5%(95% CI: 0.8–3.0) if the D-dimer assay and CT scanning were the only tests
9781405154000_4_037.qxd 19/03/2008 10:53 Page 250

Chapter 37: Pulmonary Embolism 251
used to rule out PE. This study suggests that multidetector-row CT scanningand the D-dimer test can be used alone, without employing pulmonaryangiogram, in low or medium-risk patients. These data have been corrobor-ated by another study of 3306 patients that included mostly outpatients with suspected PE.10 Patients that were high risk according to the Wells scorehad a chest CT, and those who were considered to be low or medium riskwere assessed by D-dimer testing. Patients with elevated D-dimer levelsunderwent a chest CT. The three-month DVT and PE risk in patients thatwere not treated on the basis of a negative chest CT was 1.1% (95% CI:0.6–1.9). This was independent of the pre-test probability for PE.
Comment
Over the past ten years the assessment of ED patients for possible DVT andPE has changed considerably. There is a significant amount of informationavailable regarding the characteristics of laboratory tests and imaging studies,making the application of evidence-based medicine at the bedside a practic-able reality. Venous compression ultrasound has replaced contrast venogra-phy in the evaluation of DVT. The D-dimer assay is also useful in evaluatingpatients that are at low risk of DVT; however, there is spectrum bias and the test sensitivity only reaches 88% in the lowest risk group. There is goodevidence that the D-dimer assay can be used safely in patients who are at lowor medium risk of PE, and that multidetector-row chest CT is a safe way toevaluate higher risk presentations.
The recently published results of the PIOPED II study, which was a multicenter trial of CTA combined with venous-phase multidetector CTV,reported that in 824 patients CTA was 83% sensitive and 96% specific for the diagnosis of PE.11 In about 10% of patients the results of CTA-CTV wereinconclusive because of poor image quality, but it was shown that CTA-CTVwas 90% sensitive and 95% specific for PE. The authors concluded that inpatients with suspected PE, the use of multidetector-row CTA with CTV has ahigher sensitivity than CTA alone. However, they did warn that additionaltesting should be performed when the clinical probability is not consistentwith imaging results. These results indicate to us that for higher risk cases,multidetector-row CTA with CTV should be the test of choice, if it is available. However, when patients are at very high risk of PE, based on a clinical scoring system like the Wells score, a negative CTA-CTV should not be used as the diagnostic endpoint, rather the gold standard pulmonaryangiogram should be performed.
The question of how to select patients that do not require testing for PE is challenging, because in order to achieve a high negative predictive value
9781405154000_4_037.qxd 19/03/2008 10:53 Page 251

252 Chapter 37: Pulmonary Embolism
this needs to be applied to a very low-risk population. Deciding whether or not to consider a patient at any risk for PE occurs much more frequentlythan discriminating between medium and high-risk patients. The PERC ruleseems to perform well in the initial derivation and unpublished validationstudy. In the future, as further studies on the PERC rule are published in EDpatients at low risk for PE (<15% prevalence), then this scoring system maybecome a useful addition to everyday practice. Applying this rule to a higherrisk group, however, should be performed with caution because the numberof false negatives may be too high for practical use.
Finally, in all these studies, when the gold standard test (pulmonaryangiogram) is not undertaken or when the D-dimer test is used for low andmedium-risk patients, there is always a chance that a patient will be senthome with DVT or PE. Where we draw the line—that is, where we set ourstandard for risk tolerance with our patients—is very physician-specific and practice-specific. You should ensure that the risks and benefits of the various diagnostic strategies are explained thoroughly to your patients and they should be involved in the decision-making process for this highlychallenging disease.
References
1. Kearon, C., Julian, J.A., Newman, T.E., et al. (1998) Noninvasive diagnosis of deepvein thrombosis. Annals of Internal Medicine 128: 663–677.
2. Stein, P.D., Hull, R.D., Patel, K.C., et al. (2004) D-dimer for the exclusion of acutevenous thrombosis and pulmonary embolism. A systematic review. Annals ofInternal Medicine 140: 589–602.
3. Wells, P.S., Owen, C., Doucette, S., et al. (2006) Does this patient have deep veinthrombosis? Journal of the American Medical Association 295: 199–207.
4. Wells, P.S., Anderson, D.R., Rodger, M., et al. (2000) Derivation of a simple clinical model to categorize patients’ probability of pulmonary embolism: increas-ing the model’s utility with the SimpliRED D-dimer. Thrombosis and Haemostasis83: 416–420.
5. Wells, P.S., Hirsh, J., Anderson, D.R., et al. (1995) Accuracy of clinical assessmentof deep-vein thrombosis. Lancet 345(8961): 1326–1330.
6. Perrier, A., Roy, P.M., Aujesky, D., et al. (2004) Diagnosing pulmonary embolismin outpatients with clinical assessment, D-dimer measurement, venous ultrasound,and helical computed tomography: a multicenter management study. AmericanJournal of Medicine 116: 291–299.
7. Kline, J.A., Mitchell, A.M., Kabrhel, C., et al. (2004) Clinical criteria to preventunnecessary diagnostic testing in emergency department patients with suspectedpulmonary embolism. Journal of Thrombosis and Haemostasis 2: 1247–1255.
8. Righini, M., Le Gal, G., Perrier, A. and Bounameaux, H. (2005) More on: clinicalcriteria to prevent unnecessary diagnostic testing in emergency department
9781405154000_4_037.qxd 19/03/2008 10:53 Page 252

Chapter 37: Pulmonary Embolism 253
patients with suspected pulmonary embolism. Journal of Thrombosis and Haemo-stasis 3:188–189.
9. Perrier, A., Roy, P.M., Sanchez, O., et al. (2005) Multidetector-row computedtomography in suspected pulmonary embolism. New England Journal of Medicine352: 1760–1768.
10. van Belle, A., Buller, H.R., Huisman, M.V., et al. (2006) Effectiveness of managingsuspected pulmonary embolism using an algorithm combining clinical probabil-ity, D-dimer testing, and computed tomography. Journal of the American MedicalAssociation 295: 172–179.
11. Stein, P.D., Fowler, S.E., Goodman, L.R., et al. (2006) Multidetector computedtomography for acute pulmonary embolism. New England Journal of Medicine354: 2317–2322.
9781405154000_4_037.qxd 19/03/2008 10:53 Page 253

254
Chapter 38 Temporal Arteritis
Highlights
• Temporal arteritis typically presents as an acute unilateral headache in older
adults and can cause permanent visual impairment.
• Definitive diagnosis is achieved with temporal artery biopsy.
• An abnormal erythrocyte sedimentation rate (ESR) is highly sensitive and
serves as a good screening tool for this disease.
Background
Temporal arteritis is an inflammatory condition characterized by focal, granulomatous changes to branches of the carotid artery that leads to vesseldamage, stenosis, and occlusion. Histopathologic findings from temporalartery biopsies, considered the gold standard for diagnosis, include multi-nucleated giant cells, necrotic tissue, and lymphocytic and fibroblast infiltrationof the inflamed vessel wall. It is a disease seen primarily in the elderly and is reported as the most common systemic vasculitis in this age group. Whilethe mortality rate in individuals with temporal arteritis is no different to that in individuals without the condition, its principle morbidity is the risk for permanent visual impairment. Upwards of 20–25% of patients withtemporal arteritis suffer a permanent visual loss as a result. The prevalence oftemporal arteritis in the general population has been estimated at somewherebetween 22 and 24 per 100 000 women aged 50 years and older, while in men the prevalence is about one-third that value. The condition is consideredrare under the age of 50.
While treatments are available that markedly decrease the likelihood ofdeveloping permanent visual loss, a clinical conundrum arises in that it can
9781405154000_4_038.qxd 19/03/2008 10:52 Page 254
Evidence-Based Emergency Care: Diagnostic Testing and Clinical Decision Rules. J.M. Pines andW.W. Everett. 2008 Jesse M. Pines and Worth W. Everett, ISBN: 978-1-4051-5400-0.

Chapter 38: Temporal Arteritis 255
be difficult to determine who should get a biopsy, which enables a diagnosisto be made. The time from the start of symptoms until biopsy-proven diagnosis ranges from one week to 1.5 years. Thus research has been sought to help determine historic features, signs and symptoms, and laboratory datathat can be used to identify patients at high risk that should be referred fortemporal artery biopsy.
Clinical question
“Which factors in a patient’s history, physical examination, and laboratory valuesare predictive of having temporal arteritis?”A pseudo meta-analysis performed in 2002 by Smetana and Shmerling examined history, physical examination, and laboratory test (ESR) findingsthat would accurately predict a diagnosis of temporal arteritis.1 The authorsmaintained a strict requirement that only studies that enrolled patients that had undergone temporal artery biopsy to make the final diagnosis wereincluded. Twenty-one studies involving 2680 patients were included and theprevalence of temporal arteritis was found to be 39%.
Two historic factors were identified that would raise a pre-test probabilitysufficiently to prompt additional investigation: jaw claudication (likelihoodratio (LR)+ 4.2; 95% CI: 2.8–6.2) and diplopia (LR+ 3.4; 95% CI: 1.3–8.6).Other symptoms commonly assessed that were positively associated with adiagnosis of temporal arteritis included headache of any type, anorexia, fever,weight loss, fatigue, myalgias, any visual symptoms, vertigo, and polymyalgiarheumatica. However, none had LRs that were sufficiency greater than 1.0 tobe considered useful.
Two physical examination findings—beading of the temporal artery (LR+ 4.6; 95% CI: 1.1–18.4) and a prominent or enlarged temporal artery
Figure 38.1 Giant cell arteritis. The superficial temporal artery is prominent and onpalpation is found to be tender and pulseless, in an elderly male who has excruciatingheadaches and progressive impairment of vision. (Source: Wolff et al. Fitzpatrick’s Color Atlas and Synopsis of Clinical Dermatology 4th Edition © 2001. Reproduced withpermission of The McGraw-Hill Companies.)
9781405154000_4_038.qxd 19/03/2008 10:52 Page 255

256 Chapter 38: Temporal Arteritis
(Fig. 38.1) (LR+ 4.3; 95% CI: 2.1–8.9)—were associated with a high likeli-hood of having biopsy-proven temporal arteritis. The absence of any tem-poral artery abnormality on physical examination had a sufficiently lownegative LR to be clinically useful in lowering the suspicion of temporalarteritis (LR− 0.53; 95% CI: 0.38–0.75). Combinations of physical findingswere not considered.
Finally, ESR data was clinically useful when the value was abnormal, with a negative LR value of 0.2 (95% CI: 0.08–0.51). ESR values in excess of 50 mm/h were also associated with a clinically useful negative LR value of 0.35 (95% CI: 0.18–0.67).
A prediction rule for identifying high-risk and low-risk patients using clinical features was generated in a study out of the Mayo Clinic.2 The authorsretrospectively collected history and physical examination findings, as well asESR data, to build a predictive model for determining the need for a temporalartery biopsy. From 1988 to 1997 a total of 1113 patients suspected of havingtemporal arteritis underwent temporal artery biopsies. The diagnosis wasconfirmed in 33.5% of the cases. Table 38.1 shows the test characteristics forthe most useful clinical elements (note that the 95% CIs were not provided inthe original published report).
The authors used logistic regression modeling to derive a six-variablemodel to predict temporal arteritis, which included new headache, jaw claudication, scalp tenderness, ischemic optic neuropathy, age (in years), andESR (in mm/h). Dichotomous variables received a scored of one if present
Table 38.1 Clinical and laboratory findings in the diagnosis of temporal arteritis fromYounge et al.2
Clinical findings Sensitivity, % Specificity, % PPV NPV LR+ LR−
New headache 67 60 46 79 1.7 1.8Jaw claudication 40 94 78 76 6.7 1.6Scalp tenderness 33 89 61 73 3 1.3Jaw claudication + 17 99 90 70 17 1.2
scalp tendernessHeadache + jaw 15 99 90 70 15 1.2
claudication +scalp tenderness
Double vision 3.5 99 65 67 3.5 1.0Abnormal ESR 99.6 16 33 99 1.2 40Jaw claudication 2 100 100 67 n/a 0
+ double vision
ESR, erythrocyte sedimentation rate; LR, likelihood ratio; NPV, negative predictive value;PPV, positive predictive value.
9781405154000_4_038.qxd 19/03/2008 10:52 Page 256
Chapter 38: Temporal Arteritis 257
and zero if absent. A formula was generated to enable the risk to be stratifiedinto high, medium, and low categories as follows:
Score = −240 + 48*(headache) + 108*( jaw claudication) + 56*(scalptenderness) + 1*(ESR) + 70*(ischemic optic neuropathy) + 1*(age)
A score of less than −110 was classified as being low risk, a score between −110and 70 was classified as intermediate risk, and score above 70 was classified asbeing high risk. The authors report validating this scoring method on anindependent set of 289 patients who also underwent temporal artery biopsytesting, but did not include any statistical details of its performance. To ourknowledge, this scoring system has not been externally validated or replicated.
Comments
The diagnosis of temporal arteritis can be elusive and should be considered if a patient older than 50 years complains of any number of symptoms including headache, visual impairment or visual loss, scalp tenderness, or jawclaudication. Clinicians should maintain a cautious level of attentivenessgiven the long-term morbidity of permanent visual loss associated with temporal arteritis. Treatment considerations should be modified on theentirety of the clinicians’ suspicion, based on the timing of the symptoms andany competing alternative diagnoses.
Unfortunately, as evidenced by the discussion above, there is no uniform-ity in predicting who is likely to have temporal arteritis and who does not.One line of commonality that is maintained is the value of an ESR test. Whilenot highly specific, an abnormal ESR, as defined by the reference standard, ishighly sensitive and is associated with useful negative LRs. Therefore, as this is an inexpensive, widely available laboratory test, it would be a reasonableone to obtain.
The studies used to generate these associations were retrospective in nature,and the reported associations represent findings from a highly selective group of patients—specifically those who actually underwent temporal arterybiopsy. This form of verification bias, when only those patients in which therewas a sufficiently high suspicion of the disease underwent the gold standardprocedure, needs to be considered when applying and interpreting thefindings in relation to unselected patients in an ED setting. While it is reason-able to extrapolate the results in concept, we do not recommend utilizing thescoring system or the reported likelihood score alone. Unfortunately, the lowprevalence in the general population would require any prospective studyexamining predictive factors to enroll a prohibitive number of patients, manyof whom would not ultimately undergo temporal artery biopsy.
9781405154000_4_038.qxd 19/03/2008 10:52 Page 257
258 Chapter 38: Temporal Arteritis
Therefore, until a study using a large population database or registry canexternally validate these reported findings, emergency physicians will need torely on clinical judgment ultimately. However, a high suspicion of temporalarteritis in the presence of abnormal temporal artery findings, new headache,visual complaints, scalp tenderness, jaw claudication, or an abnormal ESRshould prompt the clinician to consider consultation or referral for furtherevaluation.
References
1. Smetana, G.W. and Shmerling, R.H. (2002) Does this patient have temporal arteritis? Journal of the American Medical Association 287(1): 92–101.
2. Younge, B.R., Cook, B.E., Bartley, G.B., Hodge, D.O. and Hunder, G.G. (2004)Initiation of glucocorticoid therapy: before or after temporal artery biopsy? MayoClinic Proceedings 79: 483–491.
9781405154000_4_038.qxd 19/03/2008 10:52 Page 258

259
Chapter 39 Intraocular Pressure
Highlights
• Elevated intraocular pressure (IOP) is associated with glaucoma, the leading
cause of blindness and visual impairment worldwide.
• The gold standard for measuring IOP in most studies is the Goldmann
applanation tonometry; however, this is usually unavailable in the
emergency department (ED)
• Schiotz and Tono-Pen tonometers are good screening tools in the ED
enabling elevated IOP to be detected. However, they perform with
variable accuracy compared to the gold standard and most commonly
they underestimate IOP.
Background
Glaucoma is a leading cause of blindness and visual impairment worldwide.Patients may seek acute care for symptoms related to elevated intraocularpressure (IOP), which include not only eye pain, but visual impairment, nausea, vomiting, headaches, and abdominal pain. Measuring IOP is anessential component of evaluating patients suspected of having glaucoma,including both acute closed-angle and open-angle types, as well as blunt eye trauma and iritis (Fig. 39.1). Measurements above 20–22 mmHg are suspect and should prompt evaluation by an eye specialist either in the acutecare setting or through urgent referral.
Different methods are available for measuring IOP and these are broadlydivided into applanation and indentation tonometry methods, and non-contact (air puff ) techniques. The Goldmann applanation tonometer ismounted on a slit lamp and consists of an applanation prism that comes into
9781405154000_4_039.qxd 19/03/2008 10:52 Page 259
Evidence-Based Emergency Care: Diagnostic Testing and Clinical Decision Rules. J.M. Pines andW.W. Everett. 2008 Jesse M. Pines and Worth W. Everett, ISBN: 978-1-4051-5400-0.

260 Chapter 39: Intraocular Pressure
contact with the patient’s fluorescein-stained cornea using a cobalt-blue lightfilter, creating lighted semicircles. Correct alignment of the semicircles istranslated into a pressure reading. The Goldmann applanation method hasbeen accepted as the gold standard for most studies. The main limitation isthat accurate readings are not possible with corneal irregularities, scarring, or edema. The most common indentation method uses the Tono-Pen XLtonometer. This is a handheld pen-like instrument that works by applyinggentle indentations to the cornea to give electronic averaged readings of IOP (Fig. 39.2). The Tono-Pen is portable and utilizes a disposable rubber-condom tip cover making it ideal for the acute-care setting and for rapidsequential uses. The Schiotz tonometer is another common indentationmethod that uses a small weighted device to indent the cornea in the supine
Aqueous vein
Conjunctiva
Episcleral vein
TrabecularmeshworkIris
Aqueous flow
Lens
Ciliary body
Zonules
Schlemm’s canal
(b)
(a)
Figure 39.1 (a) Normal flow of aqueous from the ciliary body, through the pupil andout through the trabecular meshwork and Schlemm’s canal, located in the anteriorchamber angle. (b) Angle-closure glaucoma with pupillary block. Iris leaflet bowsforward, blocking the chamber angle and prohibiting aqueous outflow. Meanwhile,aqueous production continues and intraocular pressure rises. (Source: Tintinalli et al.Tintinalli’s Emergency Medicine: A Comprehensive Study Guide 6th Edition © 2004.Reproduced with permission of The McGraw-Hill Companies.)
9781405154000_4_039.qxd 19/03/2008 10:52 Page 260

Chapter 39: Intraocular Pressure 261
(a)
(b)
Figure 39.2 Tono-Pen tonometer (a) and positioning of the patient in the uprightposition for measurement of intraocular pressure using the Tono-Pen (b).
Figure 39.3 A Schiotz tonometer in use. The tonometer is placed gently onto thecornea while the patient is in the supine position.
9781405154000_4_039.qxd 19/03/2008 10:52 Page 261
262 Chapter 39: Intraocular Pressure
patient (Fig. 39.3). The amount of indentation is measured against a calib-rated weight and the IOP is then determined. Finally, there are non-contactmethods that utilize puffs of air to flatten the cornea; the IOP is then cal-culated based on correlations of time to corneal flattening.
While the Goldmann applanation method has been accepted as the goldstandard for most studies, most of us are not trained to use it. The equipmentis bulky, non-portable, expensive, and is not widely available in acute care settings. Similarly, non-contact methods using puffs of air are cost prohibitive and not widely available in EDs. These limitations make thesearch for suitable alternatives to measure IOP in the acute care setting desir-able. Schiotz tonometers and Tono-Pens are widely available and are usuallywithin the budgetary constraints of most EDs.
Clinical question
“Are IOP measurements using the Schiotz tonometer or the Tono-Pen reliable andaccurate compared to IOP measurements using the gold standard Goldmannapplanation tonometry?”Several small studies have compared IOP measurements using Goldmanntonometry to those using a Schiotz tonometer, the Tono-Pen, or both.Jackson and colleagues in Australia performed and analyzed serial IOP mea-surements in 72 patients using the Tono-Pen and the Schiotz tonometer.1
Patients were recruited from a general practice, were over 50 years old, andhad no prior history of glaucoma. IOP was first assessed by an ophthalmo-logist using a Goldmann tonometer, followed by measurements using theSchiotz tonometer and the Tono-Pen. An independent observer recorded the pressure reading and the physicians were blinded to the results. A total of19 patients (26%) were found to have elevated IOP readings (≥21 mmHg), of which 18 received follow-up specialized eye care after the study. Only fiveof these had persistently elevated IOPs. The Schiotz tonometer was the mostreliable instrument with 64–76% of IOP values falling to within 4 mmHg ofthose recorded using the gold standard method. Results using the Tono-Penwere extremely variable with 10–95% of values falling within 4 mmHg ofthose recorded using a Goldmann tonometer. Most measurements using theTono-Pen tended to underestimate IOP. This study utilized three examiningphysicians and there was measurement variation by physicians with eachmethod examined.
A small study out of Missouri examined IOP measurements with severalportable tonometers, including the Tono-Pen and Schiotz tonometers, withGoldmann as the gold standard.2 A total of 31 patients from a glaucoma clinicwere enrolled and analyzed in the study (a total of 58 eyes were analyzed). The
9781405154000_4_039.qxd 19/03/2008 10:52 Page 262

Chapter 39: Intraocular Pressure 263
methods used for obtaining IOP measurements were standardized and theorder of examinations was randomized following initial IOP measurementsusing Goldmann tonometry. Physicians were not blinded to the individualresults from each method. Results shown in Table 39.1 illustrate that bothTono-Pen and Schiotz tonometers underestimated the IOP by 2–3 mmHgwhen compared to readings taken using the Goldmann tonometer.
In another small Australian study, researchers compared IOP measure-ments obtained using Tono-Pen and Goldmann tonometers to determine if measurements were similar (i.e. within 2 mmHg of each other).3 A total of 138 patients were recruited from a glaucoma clinic; a further 22 patientswere enrolled that had known elevated IOP. Among the 138 patients, IOPsranged from 3 to 47 mmHg. Reproducibility of the results was excellent, asreflected in an intraclass correlation coefficient of 0.97 for the Goldmanntonometer and 0.95 for the Tono-Pen. Analysis of paired IOP readingsrevealed no statistical difference between methods (mean difference: righteyes = −0.4 mmHg, 95% CI: −6–+5; left eyes = −0.3 mmHg, 95% CI: −5–+5).When results were compared within three pressure ranges (0–10, 11–20,20–≥30 mmHg), a divergence of agreement was shown for the high pressurereadings. Results of IOP measurements for the 22 patients with known elevated pressures (range 24–58 mmHg) revealed a significant differencebetween methods (mean difference: −4.2 mmHg, 95% CI: −13–+5), with theTono-Pen consistently yielding lower values. These researchers concludedthat while Tono-Pen measurements are reproducible, readings at higherIOPs may be underestimated.
British researchers compared IOP measurements using various methods in 105 patients from primary eye and glaucoma clinics.4 Among the methodstested, Goldmann tonometry was the gold standard and the Tono-Pen methodwas the comparator (see Table 39.2). Methods were standardized acrosspatients. The mean IOP reading obtained using the Tono-Pen tonometer wasfound to be 0.6 mmHg lower than Goldmann tonometry measurements, andthis difference was consistent across a range of pressure values.
Table 39.1 Results of intraocular pressure (IOP) measurement by tonometry (n = 58)from Wingert et al.2
Mean IOP 95% CI Standard Mean difference from Tonometer (mmHg) range (mmHg) error Goldmann (mmHg)
Goldmann 18.2 — 0.8 —Tono-Pen 15.8 7.7 0.6 2.5*Schiotz 15.3 9.7 0.8 2.9*
* P < 0.05.
9781405154000_4_039.qxd 19/03/2008 10:52 Page 263

264 Chapter 39: Intraocular Pressure
Comments
The clinical question of concern is whether portable, smaller, and morewidely available instruments can be used to reliably and accurately measureIOP. These four studies confirm that the reliability of the Tono-Pen methodis sound. That is, the results are reproducible across different users withacceptable minimal differences in the absolute pressure measurementsobtained. While the data is not overwhelmingly convincing with regard to the reliability of the Schiotz tonometer, it is our opinion that it is unlikely tobe worse than that of the Tono-Pen.
The issue of accuracy is more of a technical concern and appears to varyacross studies. One study presented measured agreement to within 4 mmHgof the gold standard, while another study used a 2 mmHg difference as mean-ingful. It appears in some of the earlier studies that the Tono-Pen pressurereadings were somewhat variable. More recent studies using the XL modelindicate that measurements are reasonably accurate and do not differ signi-ficantly from those obtained using Goldmann tonometry. A trend within moststudies, however, indicates that Tono-Pen measurements tend to under-estimate IOP at high pressures, although this also appears to be minimizedwith the use of the XL model. Similar to the discussion of reliability, the accuracy of the Schiotz tonometer is not thought to differ greatly from that ofthe Tono-Pen. The Schiotz also tends to underestimate IOP measurements,but deciding on what constitutes a clinically significant difference from thegold standard is always a concern in studies. A 2 mmHg difference is seem-ingly negligible. However a 4 or 5 mmHg difference could significantly affectboth the immediate and near future treatment.
Either the Tono-Pen or Schiotz tonometer should serve as a screening toolfor patients suspected of having abnormal IOPs. However, both methods systematically underestimate IOP measurements when compared to the goldstandard Goldmann tonometry method. Patients should be treated accord-ing to the timing, severity, and history of their symptoms as well as in relation
Table 39.2 Comparisons of intraocular pressure (IOP) measurements using Goldmannand Tono-Pen tonometry (n = 105) from Tonnu et al.4
Mean IOP Range Standard Mean difference from Tonometer (mmHg) (mmHg) deviation Goldmann (mmHg)
Goldmann 17.2 9–32 4.3 —Tono-Pen 16.6 7–29 4.4 0.6*
* P = 0.3.
9781405154000_4_039.qxd 19/03/2008 10:52 Page 264

Chapter 39: Intraocular Pressure 265
to the measured IOP values. However, the diagnosis of ocular hyperten-sion or glaucoma should not be excluded solely based on the IOP readingsobtained in the ED. An emergent ophthalmology consult should be obtainedwhen sufficient concern is raised by the treating physician and when elevatedIOP measurements are reported. Borderline or normal IOP measurementsshould be referred for urgent eye evaluation by a specialist.
References
1. Jackson, C., Bullock, J., Pitt, M., Keogh, J., Glasson, W. and Hirst, L. (1995)Screening for glaucoma in a Brisbane general practice—the role of tonometry.Australian and New Zealand Journal of Ophthalmology 23(3): 173–178.
2. Wingert, T.A., Bassi, C.J., McAlister, W.H. and Galanis, J.C. (1995) Clinical evalu-ation of five portable tonometers. Journal of the American Optometric Association65(11): 670–674.
3. Franzco, G.S.H., Byles, J., Franzco, J.L. and D’Este, C. (2004) Comparison of the Tono-Pen and Goldmann tonometer for measuring intraocular pressure inpatients with glaucoma. Clinical and Experimental Ophthalmology 32: 584–589.
4. Tonnu, P.A., Ho, T., Sharma, K., White, E., Bunce, C. and Garway-Heath, D.(2005) A comparison of four methods of tonometry: method agreement and inter-observer variability. British Journal of Ophthalmology 89: 847–850.
9781405154000_4_039.qxd 19/03/2008 10:52 Page 265
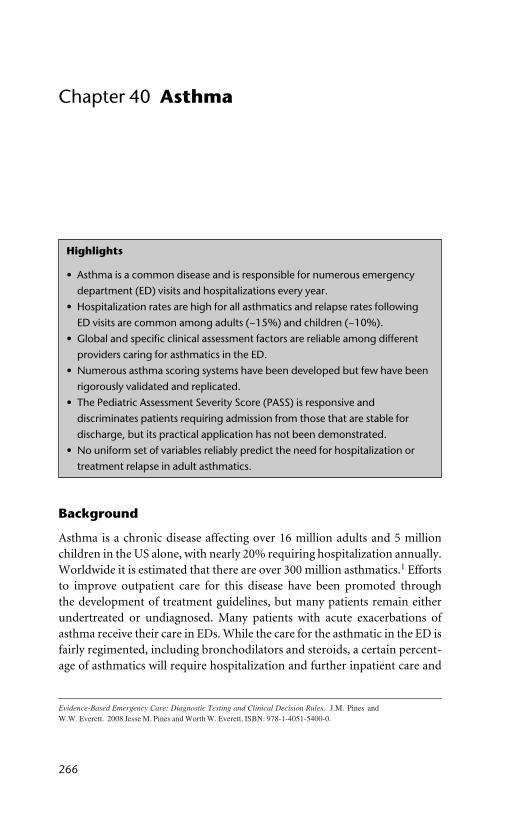
266
Chapter 40 Asthma
Highlights
• Asthma is a common disease and is responsible for numerous emergency
department (ED) visits and hospitalizations every year.
• Hospitalization rates are high for all asthmatics and relapse rates following
ED visits are common among adults (~15%) and children (~10%).
• Global and specific clinical assessment factors are reliable among different
providers caring for asthmatics in the ED.
• Numerous asthma scoring systems have been developed but few have been
rigorously validated and replicated.
• The Pediatric Assessment Severity Score (PASS) is responsive and
discriminates patients requiring admission from those that are stable for
discharge, but its practical application has not been demonstrated.
• No uniform set of variables reliably predict the need for hospitalization or
treatment relapse in adult asthmatics.
Background
Asthma is a chronic disease affecting over 16 million adults and 5 millionchildren in the US alone, with nearly 20% requiring hospitalization annually.Worldwide it is estimated that there are over 300 million asthmatics.1 Effortsto improve outpatient care for this disease have been promoted through the development of treatment guidelines, but many patients remain eitherundertreated or undiagnosed. Many patients with acute exacerbations ofasthma receive their care in EDs. While the care for the asthmatic in the ED isfairly regimented, including bronchodilators and steroids, a certain percent-age of asthmatics will require hospitalization and further inpatient care and
9781405154000_4_040.qxd 19/03/2008 10:51 Page 266
Evidence-Based Emergency Care: Diagnostic Testing and Clinical Decision Rules. J.M. Pines andW.W. Everett. 2008 Jesse M. Pines and Worth W. Everett, ISBN: 978-1-4051-5400-0.
Chapter 40: Asthma 267
monitoring for their asthma flare. There have been multiple studies per-formed to try and predict which patients would require inpatient admissionfor acute asthma exacerbations or to predict the failure of outpatient therapy.
Clinical question
“Are there scoring systems for ED patients that predict asthma severity, the needfor hospitalization, or relapses after treatment?”Much of the medical literature on this topic is divided into pediatric and adultpredictors and assessments for acute asthma. Therefore, the discussion willbe presented in this way except for studies that included all age ranges, whichwill be discussed where appropriate.
Reproducibility of the clinical examinationIn 2003 Stevens et al. examined the inter-rater reliability of the physical exam-ination in children with asthma in order to address the concern that findingsfrom clinical trials may not represent actual clinical practice because speciallytrained staff are usually involved.2 Reproducibility of key physical findingsand an overall global gestalt about the severity of the patient’s condition bydifferent people across different levels of training is the first step in establish-ing that a scoring system could be successfully developed and used clinically.The observers in this study included pediatric emergency physicians (n = 20),pediatric ED nurses (n = 50), and hospital respiratory therapists (n = 50). The observers received no prior specialized training on physical examinationassessment for this study. Patients with acute asthma from a large urban children’s hospital aged from 1 to 16 years were the examination subjects.Observers were asked to independently and simultaneously rate the followingaspects on a scale of 1–3 or 1–4 on a standardized form: work of breathing,wheezing, decreased air entry, increased expiratory time, breathlessness,mental status, and respiratory rate. A global question assessing ‘overall’ sever-ity with the options being asymptomatic, mild, moderate, or severe was alsoasked, and a composite score was calculated.
Weighted kappa statistics for each component of the examination for 230 pairs of examinations ranged from 0.61 to 0.74, while the overall severity(weighted kappa 0.80) and total scores (weighted kappa 0.82) had excellentagreement. Paired observers who were practitioners of the same professionhad slightly better agreement for all elements assessed. The authors felt thatthis supported the use of structured and standardized formats to assess asthmatic pediatric patients. More reassuring was that among a diverse groupof care providers a high level of agreement was found in the clinical assess-ment of acute asthmatics.
9781405154000_4_040.qxd 19/03/2008 10:51 Page 267
268 Chapter 40: Asthma
Severity scores in asthmatic childrenNumerous pediatric asthma scores have been developed to assess the severityof the condition, including discriminative scores (aimed at gauging the severity at a single point in time), predictive scores (predicting particular out-comes), and evaluative scores (reflecting changes over time). Unfortunately,many were developed using small numbers of selected subjects, which had animpact on the generalizability of the results. For instance, of the 16 pediatricasthma scores as of 1994, 11 had sample sizes of less than 100, and only oneincluded more than 300 study subjects.3 More concerning and critical is that most were not and have not since been thoroughly evaluated with respectto accepted validation and performance measures. The handful that haveundergone appropriate assessment usually included common sets of clinicalfindings with three to five items, with each item scored on a 0–2 or 0–3 scale.
In 2004 Gorelick et al. published a new pediatric asthma score—the PASS—that was developed and vigorously validated on a large, diverse pediatricasthma population with no exclusions based on severity or disposition (home or admission).4 The score was validated and tested for reliability andresponsiveness on a group of 1221 pediatric asthmatics in two EDs with anenrollment rate of 89% (out of 1379 eligible patients). Of these, 503 (41%)were admitted to an inpatient service. Clinical items examined during thestudy for inclusion in the final score had been included in prior clinicalasthma scores and were deemed acceptable and pertinent (i.e. to have facevalidity) by the clinicians at the study sites. The final three-item scoreincluded an assessment of wheezing (none/mild, moderate, or severe/absentdue to poor air exchange), work of breathing (none/mild, moderate, orsevere), and prolongation of expiration (normal/mildly prolonged, moder-ately prolonged, or severely prolonged). Items assessed but not included inthe final score were air entry, tachypnea, and mental status.
The three-item PASS score discriminated admitted versus dischargedpatients with a high level of confidence [area under the curve (AUC) valuesfor the receiver operating characteristic (ROC) curves for each of the two EDswere 0.83 (95% CI: 0.8–0.86) and 0.85 (95% CI: 0.81–0.89)]. The new scorewas also responsive to changes (e.g. improvements) with serial assessments.Scores changed by 51–79% among those discharged home, whereas in thoseasthmatics admitted for inpatient care the scores changed by 25–32%. Bycomparison, the peak expiratory flow rate (PEFR) also changed by 25–32%,but the change was similar between admitted and discharged patients.
The PASS score has yet to be used in any new published studies. Its con-cept basis, rigorous testing, and validation may make it a useful tool, but it awaits more vigorous assessment before it can gain widespread acceptancefor clinical use.
9781405154000_4_040.qxd 19/03/2008 10:51 Page 268

Chapter 40: Asthma 269
Predicting hospitalization in asthmatic childrenA large prospective multicenter study by the Multicenter Airway ResearchCollaboration (MARC) Investigators examined risk factors and predictorsfor hospital admission among children aged 2 to 17 years that were seen in 44 EDs in 1997 and 1998.5 Enrolling sites included 37 general hospitals andseven children’s hospitals across 18 US states and four Canadian provinces.Data were prospectively collected 24 h per day for a median of two weeks.Repeat ED visits and patients discharged from the ED against medical advicewere excluded.
A total of 1601 eligible children presenting to EDs with acute asthma wereidentified and 1178 patients were included in the analysis (74%). The admis-sion rate was 23% (95% CI: 21–26) with an interquartile range of 11–31%across the 44 EDs. Multivariate logistic regression modeling produced patient variables that were independently predictive of hospital admission (Table 40.1). PEFR was not included in the logistic regression model becauseit was only able to be measured in 23% of the children. However, in the 23%of children that had PEFR measurements, those that were admitted had lower initial PEFRs compared to those that were not admitted (% predicted:36 versus 50; mean difference: −13.7 (95% CI: −13.8–−13.6). Demographic factors were not predictive of admission.
The MARC Investigators also examined the initial room air oxygen satura-tion reading to determine if, as a single variable, it could predict hospitaladmission in asthmatic children.6 This study differed from prior studies in terms of both the number of enrolled patients and the multicenter studydesign, strengthening its generalizability. Initial oxygen saturation was docu-mented for 1040 children with a mean reading of 95%. Admitted childrenhad lower oxygen saturation levels compared to discharged patients (93 vs.96%). The authors then used the initial oxygen saturation level to construct
Table 40.1 Independent predictors of hospital admission in children with asthma frommultivariate logistic regression from Pollack et al.5
Odds ratio 95% CI
Oxygen saturation (per decrease of 5%) 2.2 1.6–3.0Number of inhaled beta-agonists during ED stay 2.1 1.8–2.4Prior admission for asthma within past year 1.7 1.1–2.8Pulmonary index score 1.3 1.1–1.4Not taking corticosteroids at time of ED visit 0.3 0.2–0.6No comorbidities 0.3 0.1–0.7
ED, emergency department.
9781405154000_4_040.qxd 19/03/2008 10:51 Page 269
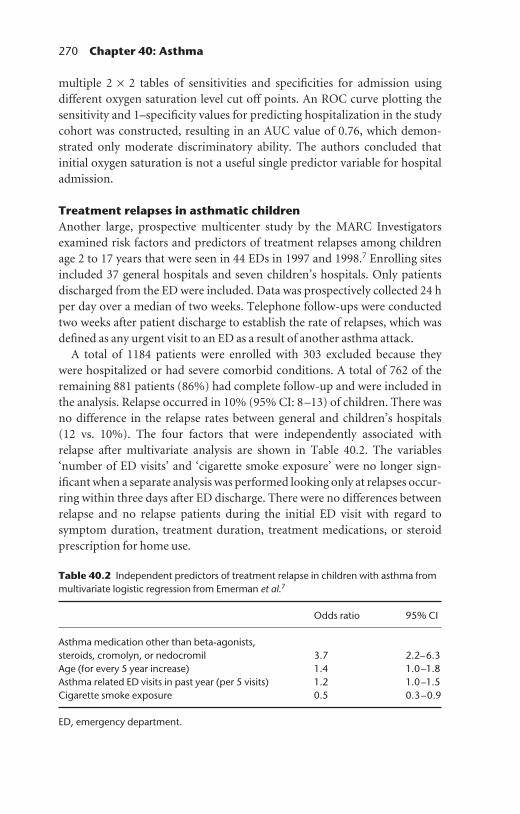
270 Chapter 40: Asthma
multiple 2 × 2 tables of sensitivities and specificities for admission using different oxygen saturation level cut off points. An ROC curve plotting thesensitivity and 1–specificity values for predicting hospitalization in the studycohort was constructed, resulting in an AUC value of 0.76, which demon-strated only moderate discriminatory ability. The authors concluded that initial oxygen saturation is not a useful single predictor variable for hospitaladmission.
Treatment relapses in asthmatic childrenAnother large, prospective multicenter study by the MARC Investigatorsexamined risk factors and predictors of treatment relapses among childrenage 2 to 17 years that were seen in 44 EDs in 1997 and 1998.7 Enrolling sitesincluded 37 general hospitals and seven children’s hospitals. Only patientsdischarged from the ED were included. Data was prospectively collected 24 hper day over a median of two weeks. Telephone follow-ups were conductedtwo weeks after patient discharge to establish the rate of relapses, which wasdefined as any urgent visit to an ED as a result of another asthma attack.
A total of 1184 patients were enrolled with 303 excluded because they were hospitalized or had severe comorbid conditions. A total of 762 of theremaining 881 patients (86%) had complete follow-up and were included inthe analysis. Relapse occurred in 10% (95% CI: 8–13) of children. There wasno difference in the relapse rates between general and children’s hospitals (12 vs. 10%). The four factors that were independently associated withrelapse after multivariate analysis are shown in Table 40.2. The variables‘number of ED visits’ and ‘cigarette smoke exposure’ were no longer sign-ificant when a separate analysis was performed looking only at relapses occur-ring within three days after ED discharge. There were no differences betweenrelapse and no relapse patients during the initial ED visit with regard tosymptom duration, treatment duration, treatment medications, or steroidprescription for home use.
Table 40.2 Independent predictors of treatment relapse in children with asthma frommultivariate logistic regression from Emerman et al.7
Odds ratio 95% CI
Asthma medication other than beta-agonists, steroids, cromolyn, or nedocromil 3.7 2.2–6.3Age (for every 5 year increase) 1.4 1.0–1.8Asthma related ED visits in past year (per 5 visits) 1.2 1.0–1.5Cigarette smoke exposure 0.5 0.3–0.9
ED, emergency department.
9781405154000_4_040.qxd 19/03/2008 10:51 Page 270
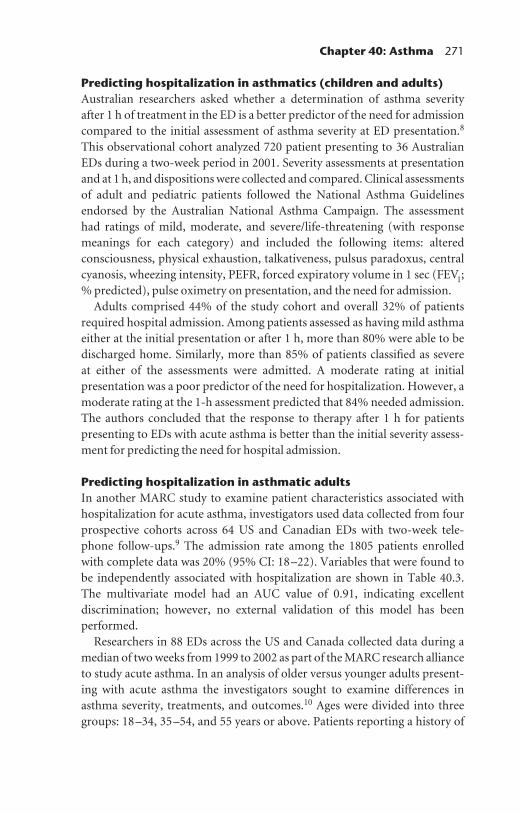
Chapter 40: Asthma 271
Predicting hospitalization in asthmatics (children and adults)Australian researchers asked whether a determination of asthma severity after 1 h of treatment in the ED is a better predictor of the need for admissioncompared to the initial assessment of asthma severity at ED presentation.8
This observational cohort analyzed 720 patient presenting to 36 AustralianEDs during a two-week period in 2001. Severity assessments at presentationand at 1 h, and dispositions were collected and compared. Clinical assessmentsof adult and pediatric patients followed the National Asthma Guidelinesendorsed by the Australian National Asthma Campaign. The assessment had ratings of mild, moderate, and severe/life-threatening (with responsemeanings for each category) and included the following items: altered consciousness, physical exhaustion, talkativeness, pulsus paradoxus, centralcyanosis, wheezing intensity, PEFR, forced expiratory volume in 1 sec (FEV1;% predicted), pulse oximetry on presentation, and the need for admission.
Adults comprised 44% of the study cohort and overall 32% of patientsrequired hospital admission. Among patients assessed as having mild asthmaeither at the initial presentation or after 1 h, more than 80% were able to bedischarged home. Similarly, more than 85% of patients classified as severe at either of the assessments were admitted. A moderate rating at initial presentation was a poor predictor of the need for hospitalization. However, amoderate rating at the 1-h assessment predicted that 84% needed admission.The authors concluded that the response to therapy after 1 h for patients presenting to EDs with acute asthma is better than the initial severity assess-ment for predicting the need for hospital admission.
Predicting hospitalization in asthmatic adultsIn another MARC study to examine patient characteristics associated withhospitalization for acute asthma, investigators used data collected from fourprospective cohorts across 64 US and Canadian EDs with two-week tele-phone follow-ups.9 The admission rate among the 1805 patients enrolledwith complete data was 20% (95% CI: 18–22). Variables that were found tobe independently associated with hospitalization are shown in Table 40.3.The multivariate model had an AUC value of 0.91, indicating excellent discrimination; however, no external validation of this model has been performed.
Researchers in 88 EDs across the US and Canada collected data during amedian of two weeks from 1999 to 2002 as part of the MARC research allianceto study acute asthma. In an analysis of older versus younger adults present-ing with acute asthma the investigators sought to examine differences inasthma severity, treatments, and outcomes.10 Ages were divided into threegroups: 18–34, 35–54, and 55 years or above. Patients reporting a history of
9781405154000_4_040.qxd 19/03/2008 10:51 Page 271
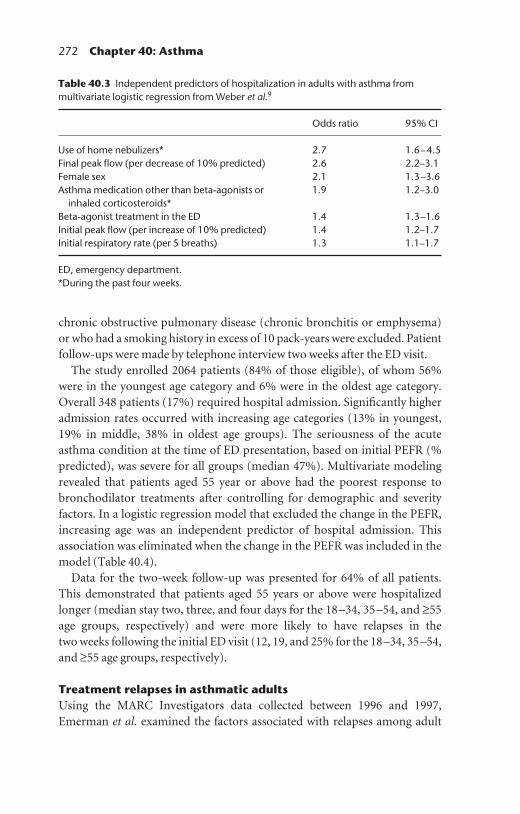
272 Chapter 40: Asthma
chronic obstructive pulmonary disease (chronic bronchitis or emphysema)or who had a smoking history in excess of 10 pack-years were excluded. Patientfollow-ups were made by telephone interview two weeks after the ED visit.
The study enrolled 2064 patients (84% of those eligible), of whom 56%were in the youngest age category and 6% were in the oldest age category.Overall 348 patients (17%) required hospital admission. Significantly higheradmission rates occurred with increasing age categories (13% in youngest,19% in middle, 38% in oldest age groups). The seriousness of the acuteasthma condition at the time of ED presentation, based on initial PEFR (%predicted), was severe for all groups (median 47%). Multivariate modelingrevealed that patients aged 55 year or above had the poorest response to bronchodilator treatments after controlling for demographic and severityfactors. In a logistic regression model that excluded the change in the PEFR,increasing age was an independent predictor of hospital admission. Thisassociation was eliminated when the change in the PEFR was included in themodel (Table 40.4).
Data for the two-week follow-up was presented for 64% of all patients.This demonstrated that patients aged 55 years or above were hospitalizedlonger (median stay two, three, and four days for the 18–34, 35–54, and ≥55age groups, respectively) and were more likely to have relapses in the two weeks following the initial ED visit (12, 19, and 25% for the 18–34, 35–54,and ≥55 age groups, respectively).
Treatment relapses in asthmatic adultsUsing the MARC Investigators data collected between 1996 and 1997,Emerman et al. examined the factors associated with relapses among adult
Table 40.3 Independent predictors of hospitalization in adults with asthma frommultivariate logistic regression from Weber et al.9
Odds ratio 95% CI
Use of home nebulizers* 2.7 1.6–4.5Final peak flow (per decrease of 10% predicted) 2.6 2.2–3.1Female sex 2.1 1.3–3.6Asthma medication other than beta-agonists or 1.9 1.2–3.0
inhaled corticosteroids*Beta-agonist treatment in the ED 1.4 1.3–1.6Initial peak flow (per increase of 10% predicted) 1.4 1.2–1.7Initial respiratory rate (per 5 breaths) 1.3 1.1–1.7
ED, emergency department.*During the past four weeks.
9781405154000_4_040.qxd 19/03/2008 10:51 Page 272
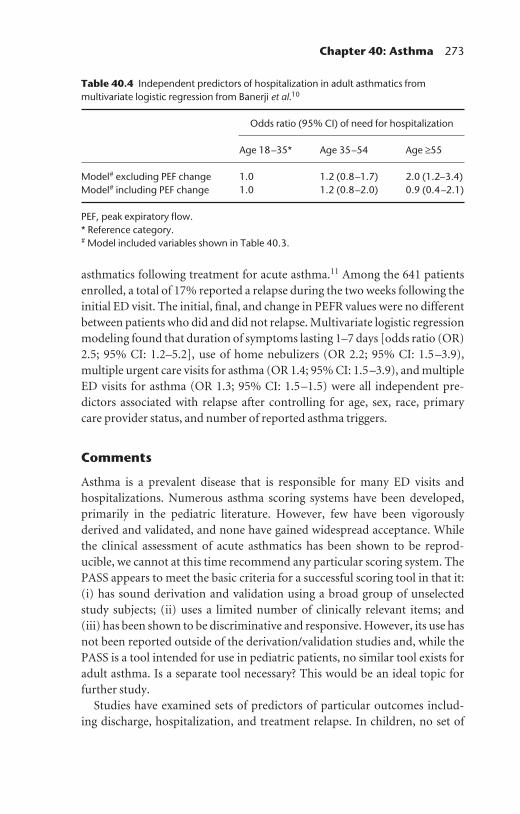
Chapter 40: Asthma 273
asthmatics following treatment for acute asthma.11 Among the 641 patientsenrolled, a total of 17% reported a relapse during the two weeks following theinitial ED visit. The initial, final, and change in PEFR values were no differentbetween patients who did and did not relapse. Multivariate logistic regressionmodeling found that duration of symptoms lasting 1–7 days [odds ratio (OR)2.5; 95% CI: 1.2–5.2], use of home nebulizers (OR 2.2; 95% CI: 1.5–3.9),multiple urgent care visits for asthma (OR 1.4; 95% CI: 1.5–3.9), and multipleED visits for asthma (OR 1.3; 95% CI: 1.5–1.5) were all independent pre-dictors associated with relapse after controlling for age, sex, race, primarycare provider status, and number of reported asthma triggers.
Comments
Asthma is a prevalent disease that is responsible for many ED visits and hospitalizations. Numerous asthma scoring systems have been developed,primarily in the pediatric literature. However, few have been vigorouslyderived and validated, and none have gained widespread acceptance. Whilethe clinical assessment of acute asthmatics has been shown to be reprod-ucible, we cannot at this time recommend any particular scoring system. ThePASS appears to meet the basic criteria for a successful scoring tool in that it:(i) has sound derivation and validation using a broad group of unselectedstudy subjects; (ii) uses a limited number of clinically relevant items; and (iii) has been shown to be discriminative and responsive. However, its use hasnot been reported outside of the derivation/validation studies and, while thePASS is a tool intended for use in pediatric patients, no similar tool exists foradult asthma. Is a separate tool necessary? This would be an ideal topic forfurther study.
Studies have examined sets of predictors of particular outcomes includ-ing discharge, hospitalization, and treatment relapse. In children, no set of
Table 40.4 Independent predictors of hospitalization in adult asthmatics frommultivariate logistic regression from Banerji et al.10
Odds ratio (95% CI) of need for hospitalization
Age 18–35* Age 35–54 Age ≥55
Model# excluding PEF change 1.0 1.2 (0.8–1.7) 2.0 (1.2–3.4)Model# including PEF change 1.0 1.2 (0.8–2.0) 0.9 (0.4–2.1)
PEF, peak expiratory flow.* Reference category.# Model included variables shown in Table 40.3.
9781405154000_4_040.qxd 19/03/2008 10:51 Page 273

274 Chapter 40: Asthma
demographic variables reliably predicts hospital admission. Historic andclinical factors found to be predictive of hospitalization include low initialoxygen saturation, the extent of beta-agonist use in the ED (i.e. total numberof nebulizer treatments given), prior admissions for asthma in the previousyear, and the absence of comorbidities or steroid use at the time of the EDvisit. Assessment of the need for hospitalization after 1 h of treatment in the ED appears to be a better predictor of hospitalization compared with theinitial assessment because some patients will improve rapidly following treat-ment. For patients that are treated and discharged, the relapse rate remainshigh (≥10% in children) and this is associated with the use of asthma medica-tions other than routine medications, as well as with the annual number ofasthma-related ED visits. Among adult asthmatics, several variables appear topredict hospitalization but none are consistent across studies. Similarly,relapse after treatment in adult asthmatics (>16%) is associated with durationof symptoms, self treatment at home, and the extent of prior urgent care andED visits related to asthma.
Overall, no uniform set of predictor variables is able to reliably predict theoutcomes of need for hospitalization or treatment relapse. Some variablessuch as prior admissions, extent of pharmacologic treatment prior to the EDvisit, and evaluation after a period of treatment in the ED are intuitive elements that should impact your decision to admit or discharge a patient.The largest diverse collection of studies examining acute asthmatics, from theMARC Investigators, as well as the promising development of the PASS, add breadth and depth to the discussion, yet further studies are certainly warranted. Perhaps sets of factors within subgroups of adult asthmatics canbe identified that will be predictive as well as responsive indictors for clinicaluse, much in the same way that pediatric scores have been developed separ-ately from adult predictors. Finally, improvements in therapy will necessitaterefinements in any prediction tool. We should continue to base patient disposition on the clinical assessment after a short period of intense treat-ment in the ED. But additional elements warrant consideration includingissues surrounding access to care, access to appropriate medications, andenvironmental factors, few of which have been incorporated into the clinicalstudies performed to date.
References1. Masoli, M., Fabian, D., Holt, S. and Beasley, R., and for the Global Initiative
for Asthma (GINA) Program. (2004) The global burden of asthma: executivesummary of the GINA Dissemination Committee report. Allergy 59: 469–478.
2. Stevens, M.W., Gorelick, M.H. and Schultz, T. (2003) Interrater agreement in theclinical evaluation of acute pediatric asthma. Journal of Asthma 40(3): 311–315.
9781405154000_4_040.qxd 19/03/2008 10:51 Page 274
Chapter 40: Asthma 275
3. van der Windt, D.A. (1994) Clinical scores for acute asthma in pre-school children– a review of the literature. Journal of Clinical Epidemiology 47(6): 635–646.
4. Gorelick, M.H., Stevers, M.W., Schultz, T.R. and Scribano, P.V. (2004) Perform-ance of a novel clinical score, the Pediatric Asthma Severity Score (PASS), in theevaluation of acute asthma. Academic Emergency Medicine 11(1): 10–18.
5. Pollack, C.V., Pollack, E.S., Baren, J.M., et al., and for the Multicenter AirwayResearch Collaboration Investigators. (2002) A prospective multicenter study ofpatient factors associated with hospital admission from the emergency depart-ment among children with acute asthma. Archives of Pediatrics and AdolescentMedicine 156: 934–940.
6. Keahey, L., Bulloch, L., Becker, A.B., Pollack, C.V., Clark, S. and Camargo, C.A.,and for the Multicenter Airway Research Collaboration (MARC) Investigators.(2002) Initial oxygen saturation as a predictor of admission in children presentingto the emergency department with acute asthma. Annals of Emergency Medicine40(3): 300–307.
7. Emerman, C.L., Cydulka, R.K., Crain, E.F., Rowe, B.H., Radeos, M.S. andCamargo, C.A., and for the MARC Investigators. (2001) Prospective multicenterstudy of relapse after treatment for acute asthma among children presenting to theemergency department. Journal of Pediatrics 138(3): 318–324.
8. Kelly, A.M., Kerr, D. and Powell, C. (2004) Is severity assessment after one hour of treatment better for predicting the need for admission in acute asthma?Respiratory Medicine 98: 777–781.
9. Weber, E.J., Silverman, R.A., Callaham, M.L., et al. (2002) A prospective multi-center study of factors associated with hospital admission among adults with acuteasthma. American Journal of Medicine 113: 371–378.
10. Banerji, A., Clark, S., Afilalo, M., Blanda, M.P., Cydulka, R.K. and Camargo, C.A.(2006) Prospective multicenter study of acute asthma in younger versus olderadults presenting to the emergency department. Journal of the American GeriatricsSociety 54(1): 48–55.
11. Emerman, C.L., Woodruff, P.G., Cydulka, R.K., Gibbs, M.A., Pollack, C.V. andCamargo, C.A., and for the MARC Investigators. (1999) Prospective multicenterstudy of relapse following treatment for acute asthma among adults presenting tothe emergency department. Chest 115(4): 919–927.
9781405154000_4_040.qxd 19/03/2008 10:51 Page 275

ascitic fluidsampling 181, 182, 184–5urine dipstick tests 182–4, 183, 184
aspartate aminotransferase (AST) 128asthma 266–74
predicting hospitalization in adults271–2, 272, 273
predicting hospitalization in children269, 269–70, 271
reliability of clinical examination 267severity scores in children 268treatment relapses in adults 272–3treatment relapses in children 270, 270vs. heart failure 116, 117
Aution sticks® 182–3, 183
bacteremia, occult, in children 143–7defined 144laboratory testing 146in vaccinated children 147
bacterial infections, serious see seriousbacterial infections
Bacterial Meningitis Score (BMS) 150–1band cell counts, febrile children 144, 145,
146Bayes’ theorem 28biomarkers, serum cardiac 128–32blinded assessment 35blood cultures, infective endocarditis 163,
164, 165BNP see brain natriuretic peptidebone scintigraphy (BS)
occult hip fractures 109occult scaphoid fractures 97, 98, 98–9
bowel obstruction 194–6, 195, 196see also abdominal pain, acute
brain natriuretic peptide (BNP) 117–18,118, 121
Bub et al. clinical prediction rule, cervicalspine fractures in older adults 55, 56,56, 57
Page numbers in italics refer to figures;those in bold to tables.
abdominal pain, acute 189–93acute appendicitis 201–6acute cholecystitis 208–11acute pancreatitis 198–9bowel obstruction 194–6diagnostic imaging 190, 190–3, 191
abdominal trauma, blunt 62–5diagnostic tests in adults 63, 63–5, 64FAST in children 65
acute coronary syndrome (ACS) 8, 127–38CT coronary angiography 136–8non-invasive cardiac testing 132–6risk statistics 24–5serum biomarkers 128–32, 130in women 134–5, 135
adenosine stress testing 132, 133, 133–4,134, 136
American Academy of Pediatrics (AAP),throat culture guidance 159
American College of Physicians/AmericanSociety of Internal Medicine (ACP-ASIM), adult pharyngitisguideline 158, 159
AMI see myocardial infarction, acuteamylase, serum 198–9angina, unstable see unstable anginaankle and foot injuries 91–5
in children 93, 94, 94–5developing decision rules 34, 35see also Ottawa ankle rules
antibioticssinusitis 172sore throat 156–7
aortic injury, traumatic 103, 104appendicitis, acute 201–7
imaging modalities 203–7, 204, 204, 206
WBC count 201–3, 202, 203, 206
Index
277
9781405154000_6_ind.qxd 19/03/2008 10:51 Page 277
Evidence-Based Emergency Care: Diagnostic Testing and Clinical Decision Rules. J.M. Pines andW.W. Everett. 2008 Jesse M. Pines and Worth W. Everett, ISBN: 978-1-4051-5400-0.

278 Index
Canadian C-spine rules (CCR) 41, 44–7,45, 47
age criterion 46, 57vs. NLC 47, 48, 49, 50–1
Canadian CT head rule (CCHR) 74–5, 76,80, 81
in elderly 81–2external validation studies 76–7, 78vs. NOC 75–6, 77
cardiac injury, blunt 104–5, 106CCHR see Canadian CT head ruleCCR see Canadian C-spine rulesCentor criteria, streptococcal pharyngitis
157–9, 158cerebral aneurysm, ruptured 229, 231cerebrospinal fluid (CSF)
high red blood cell count 230pleocytosis 149, 150–1xanthochromia 230
cervical spine fractures 41–52CCR see Canadian C-spine rulesin children 59–61clinical decision rules 42–7imaging modalities 41–2, 43NLC see NEXUS low-risk criteriain older adults 46, 53–7plain radiographs vs. CT 48–52
CHALICE 86–7, 88, 89chest pain 6–7, 128
see also acute coronary syndromechest trauma, blunt 101–6
diagnostic X-rays 102, 103troponin testing 104–5, 106X-rays vs. CT scans 103, 103–4, 106
chest X-raysblunt chest trauma 102–4, 103heart failure 117, 118–19, 119,
120–1children
ankle and foot injuries 93, 94, 94–5asthma see under asthmabacterial meningitis 149–51blunt abdominal trauma 65blunt head trauma 83–90cervical spine fractures 59–61, 60group A streptococcal pharyngitis 156,
157–8knee injuries 69–70serious bacterial infections/occult
bacteremia 143–7testicular torsion 222, 222–4, 224
children’s head injury algorithm for theprediction of important clinical eventssee CHALICE
cholecystitis, acute 208–11
chronic obstructive pulmonary disease(COPD) 116, 117
cirrhosis 181, 183, 185clinical decision rules 3, 5, 32–7
applying evidence 13–14assessing studies on 13derivation phase 35–6development process 34–7eliminating subjectivity 33validation 36, 36
color Doppler ultrasound (US), testiculartorsion 221, 221–4, 222, 224
computed tomography (CT)acute abdominal pain 190, 190–3, 191acute appendicitis 203–6, 204, 204, 206,
207acute cholecystitis 208–10, 209, 210,
211acute stroke 235, 235–8, 236angiography (CTA), pulmonary
embolism 251blunt abdominal trauma 62–5, 64blunt chest trauma 103, 103–4, 106blunt head injury 72–82, 73, 84–90bowel obstruction 194–6, 196cervical spine fractures 41–2, 48–52coronary angiography 136–8, 137deciding to order 5, 7, 8kidney stones 216, 216–19occult hip fractures 109–11, 111occult scaphoid fractures 97, 98pulmonary embolism 244, 245, 250–2sinusitis 173, 173–4subarachnoid hemorrhage 229–30, 230,
231–3venography (CTV), pulmonary
embolism 251confidence intervals (CI) 16, 29coronary angiography
vs. multi-detector CT (MDCT)angiography 136–8, 137
vs. non-invasive stress testing 133coronary artery disease (CAD) 127–8
multi-detector CT (MDCT)angiography 136–8, 137
non-invasive stress testing 132–6, 133,134, 135
see also acute coronary syndromeC-reactive protein (CRP), infective
endocarditis 164, 165creatine kinase (CK)-MB 128
acute coronary syndrome 130, 130blunt chest trauma 105
critical appraisal 11, 12–13CSF see cerebrospinal fluid
9781405154000_6_ind.qxd 19/03/2008 10:51 Page 278

Index 279
CT see computed tomographyCURB-65 score 176–8
D-dimer assay 4, 244, 250–1disadvantages 249risk statistics 23–4, 26–8, 29–30sensitivity and specificity 246, 247
decision rules, clinical see clinical decisionrules
deep vein thrombosis (DVT) 243–52diagnosis using ultrasound 244–6,
245Well’s criteria 246–8, 247, 248
diagnostic peritoneal lavage (DPL) 62–3,64
diagnostic testing 3–9applying evidence to 13–14assessing evidence 12–13epidemiology and statistics 16–31thresholds 6–8
diplopia 255, 256dipyridamole stress testing 132, 133,
133–4, 134, 136dobutamine stress testing 132, 133–5, 134,
135, 136Duke criteria, infective endocarditis
162–3, 162–5dyspnea, acute, heart failure 116–21
ECG see electrocardiogramechocardiography
blunt chest trauma 105infective endocarditis 161, 163, 164,
165stress 132, 133, 133–5, 134, 135
elderly (over 60 or 65 years)blunt head injury 81–2cervical spine fractures 46, 54–5, 55,
57occult hip fractures 108–11see also very elderly
electrocardiogram (ECG)acute coronary syndrome 128, 131–2blunt chest trauma 105exercise stress testing 132, 133, 136
endocarditis, infective 160–5clinical presentation 160–1, 161Duke criteria 162–3, 162–5
epidural hematoma 73erythrocyte sedimentation rate (ESR) 256,
256, 257evidence
applying 13–14critical appraisal 11, 12–13searching for 11–12, 15
evidence-based medicine (EBM) 8, 10–15defined 10four-step process 10–11
exercise stress testingECG 132, 133, 136echocardiography 133, 133–4in women 134–5, 135
fall on an outstretched hand (FOOSH) 96,97
FAST, in blunt abdominal trauma 62–3, 63
in children 65vs. CT in adults 63–5, 64
febrile children 143–7laboratory testing for occult bacteremia
146Philadelphia protocol and Rochester
criteria 144–6risk of pneumococcal bacteremia 147
fever of unknown origin, infectiveendocarditis 164
flank pain, acute see kidney stonesfocused assessment by sonography in
trauma see FASTfoot injuries see ankle and foot injuries
gender differences, non-invasive cardiactesting 134–5, 135
Geneva score 248–9, 249giant cell arteritis see temporal arteritisglaucoma 259, 260
see also intraocular pressureGoldmann applanation tonometry
259–60, 262–3, 263, 264gold standard test 12, 14group A streptococcal (GAS) pharyngitis
156–9clinical guidelines for adults 158, 159clinical prediction rules 157–8, 158physical examination findings 157
Haemophilus influenzae type b (HIB)vaccine 144, 147, 149
headachesubarachnoid hemorrhage 229–30, 231,
232–3temporal arteritis 255, 256
head injury, blunt 72–82Canadian CT head rule (CCHR) see
Canadian CT head rulein children 83–90clinical decision rules 73–81in elderly 81–2external validation studies 76–7, 78
9781405154000_6_ind.qxd 19/03/2008 10:51 Page 279
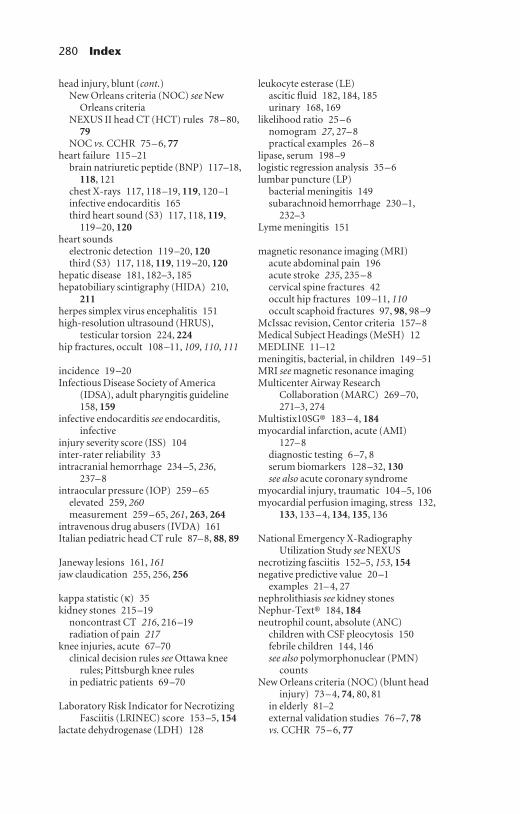
280 Index
head injury, blunt (cont.)New Orleans criteria (NOC) see New
Orleans criteriaNEXUS II head CT (HCT) rules 78–80,
79NOC vs. CCHR 75–6, 77
heart failure 115–21brain natriuretic peptide (BNP) 117–18,
118, 121chest X-rays 117, 118–19, 119, 120–1infective endocarditis 165third heart sound (S3) 117, 118, 119,
119–20, 120heart sounds
electronic detection 119–20, 120third (S3) 117, 118, 119, 119–20, 120
hepatic disease 181, 182–3, 185hepatobiliary scintigraphy (HIDA) 210,
211herpes simplex virus encephalitis 151high-resolution ultrasound (HRUS),
testicular torsion 224, 224hip fractures, occult 108–11, 109, 110, 111
incidence 19–20Infectious Disease Society of America
(IDSA), adult pharyngitis guideline158, 159
infective endocarditis see endocarditis,infective
injury severity score (ISS) 104inter-rater reliability 33intracranial hemorrhage 234–5, 236,
237–8intraocular pressure (IOP) 259–65
elevated 259, 260measurement 259–65, 261, 263, 264
intravenous drug abusers (IVDA) 161Italian pediatric head CT rule 87–8, 88, 89
Janeway lesions 161, 161jaw claudication 255, 256, 256
kappa statistic (κ) 35kidney stones 215–19
noncontrast CT 216, 216–19radiation of pain 217
knee injuries, acute 67–70clinical decision rules see Ottawa knee
rules; Pittsburgh knee rulesin pediatric patients 69–70
Laboratory Risk Indicator for NecrotizingFasciitis (LRINEC) score 153–5, 154
lactate dehydrogenase (LDH) 128
leukocyte esterase (LE)ascitic fluid 182, 184, 185urinary 168, 169
likelihood ratio 25–6nomogram 27, 27–8practical examples 26–8
lipase, serum 198–9logistic regression analysis 35–6lumbar puncture (LP)
bacterial meningitis 149subarachnoid hemorrhage 230–1,
232–3Lyme meningitis 151
magnetic resonance imaging (MRI)acute abdominal pain 196acute stroke 235, 235–8cervical spine fractures 42occult hip fractures 109–11, 110occult scaphoid fractures 97, 98, 98–9
McIssac revision, Centor criteria 157–8Medical Subject Headings (MeSH) 12MEDLINE 11–12meningitis, bacterial, in children 149–51MRI see magnetic resonance imagingMulticenter Airway Research
Collaboration (MARC) 269–70,271–3, 274
Multistix10SG® 183–4, 184myocardial infarction, acute (AMI)
127–8diagnostic testing 6–7, 8serum biomarkers 128–32, 130see also acute coronary syndrome
myocardial injury, traumatic 104–5, 106myocardial perfusion imaging, stress 132,
133, 133–4, 134, 135, 136
National Emergency X-RadiographyUtilization Study see NEXUS
necrotizing fasciitis 152–5, 153, 154negative predictive value 20–1
examples 21–4, 27nephrolithiasis see kidney stonesNephur-Text® 184, 184neutrophil count, absolute (ANC)
children with CSF pleocytosis 150febrile children 144, 146see also polymorphonuclear (PMN)
countsNew Orleans criteria (NOC) (blunt head
injury) 73–4, 74, 80, 81in elderly 81–2external validation studies 76–7, 78vs. CCHR 75–6, 77
9781405154000_6_ind.qxd 19/03/2008 10:51 Page 280

Index 281
NEXUS II head CT (HCT) rules 78–80, 79in children 84–5, 86, 89in elderly 82
NEXUS low-risk criteria (NLC) (cervicalspine injury) 41, 42–4, 44
in children 59–61, 60in elderly (over 65 years) 54–5, 55, 57in very elderly (over 80 years) 54, 54, 57vs. CCR 47, 48, 49, 50–1
nitrite, urinary 168, 169NLC see NEXUS low-risk criteriaNOC see New Orleans criteria
Occam’s razor 7–8odds 24–5
practical examples 26–8odds ratio 16, 24–5OESIL (Osservatorio Epidemiologico sulla
Sincope nel Lazio) risk score 123–4older adults see elderlyOttawa ankle rules (OAR) 91–2, 92
in children 93, 94, 94–5evidence supporting 93–4, 94
Ottawa foot rules 93Ottawa knee rules (OKR) 67–8, 70
in pediatric patients 69–70performance 68, 68vs. PKR 69, 69
Ottawa rules 33–4outcome, defining 34oxygen saturation 269–70
pancreatitis, acute 198–9paracentesis, spontaneous bacterial
peritonitis 181, 182, 184–5PE see pulmonary embolismpeak expiratory flow rate (PEFR) 268, 269,
272, 273Pediatric Asthma Severity Score (PASS)
268, 273pediatric patients see childrenperitoneal lavage, diagnostic (DPL) 62–3,
64peritonitis, spontaneous bacterial (SBP)
181–5, 182dipstick testing of ascitic fluid 182–4,
183, 184, 185paracentesis 181, 182, 184–5
pharyngitis 156–9Philadelphia protocol
febrile infants 144–6infants under 29 days 146
PICO format 11, 14–15Pittsburgh knee rules (PKR) 67, 68, 70
vs. OKR 69, 69
pneumococcal bacteremia, occult (OPB)144
laboratory testing 146in vaccinated children 147
pneumococcal vaccine 144, 147, 149pneumonia 176–80, 177
procalcitonin levels 179, 180scoring systems compared 178–9
Pneumonia Severity Index (PSI) 176, 177,178, 178–9
polymorphonuclear (PMN) countsascitic fluid 181, 182–3see also neutrophil count, absolute
positive predictive value 20–1examples 21–4
post-test odds 26post-test probability 8, 17
formula for calculating 28practical examples 24, 27, 27–8
predictive values 20–1predictor variables 34–5pre-test odds 26pre-test probability 6, 6, 13–14, 17
practical examples 21, 22–4, 26–8, 27prevalence 19–20
practical examples 21–2probability 24–5
practical examples 26–8procalcitonin
in infective endocarditis 164, 165in pneumonia 179, 180
PubMed 11–12pulmonary angiogram 244, 252pulmonary embolism (PE) 4, 243–52
chest CT 250–2D-dimer test performance 246, 247Geneva score 248–9, 249risk statistics 23–4, 28selecting patients who don’t require
testing 249–50, 251–2Well’s criteria 246–8, 247, 248
Pulmonary Embolism ResearchConsortium (PERC) rule 249–50,252
questionsformulating 10–11general medical 11PICO format 11, 14–15specific patient-based 11
radiography, plain filmacute abdominal pain 190, 190–3, 191ankle and foot injuries 91–5bowel obstruction 194–6, 195, 196
9781405154000_6_ind.qxd 19/03/2008 10:51 Page 281
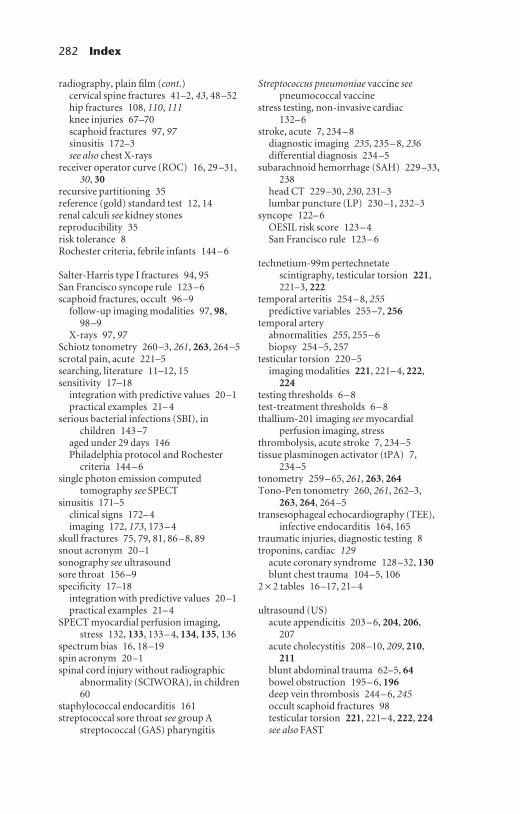
282 Index
radiography, plain film (cont.)cervical spine fractures 41–2, 43, 48–52hip fractures 108, 110, 111knee injuries 67–70scaphoid fractures 97, 97sinusitis 172–3see also chest X-rays
receiver operator curve (ROC) 16, 29–31,30, 30
recursive partitioning 35reference (gold) standard test 12, 14renal calculi see kidney stonesreproducibility 35risk tolerance 8Rochester criteria, febrile infants 144–6
Salter-Harris type I fractures 94, 95San Francisco syncope rule 123–6scaphoid fractures, occult 96–9
follow-up imaging modalities 97, 98,98–9
X-rays 97, 97Schiotz tonometry 260–3, 261, 263, 264–5scrotal pain, acute 221–5searching, literature 11–12, 15sensitivity 17–18
integration with predictive values 20–1practical examples 21–4
serious bacterial infections (SBI), inchildren 143–7
aged under 29 days 146Philadelphia protocol and Rochester
criteria 144–6single photon emission computed
tomography see SPECTsinusitis 171–5
clinical signs 172–4imaging 172, 173, 173–4
skull fractures 75, 79, 81, 86–8, 89snout acronym 20–1sonography see ultrasoundsore throat 156–9specificity 17–18
integration with predictive values 20–1practical examples 21–4
SPECT myocardial perfusion imaging,stress 132, 133, 133–4, 134, 135, 136
spectrum bias 16, 18–19spin acronym 20–1spinal cord injury without radiographic
abnormality (SCIWORA), in children60
staphylococcal endocarditis 161streptococcal sore throat see group A
streptococcal (GAS) pharyngitis
Streptococcus pneumoniae vaccine seepneumococcal vaccine
stress testing, non-invasive cardiac132–6
stroke, acute 7, 234–8diagnostic imaging 235, 235–8, 236differential diagnosis 234–5
subarachnoid hemorrhage (SAH) 229–33,238
head CT 229–30, 230, 231–3lumbar puncture (LP) 230–1, 232–3
syncope 122–6OESIL risk score 123–4San Francisco rule 123–6
technetium-99m pertechnetatescintigraphy, testicular torsion 221,221–3, 222
temporal arteritis 254–8, 255predictive variables 255–7, 256
temporal arteryabnormalities 255, 255–6biopsy 254–5, 257
testicular torsion 220–5imaging modalities 221, 221–4, 222,
224testing thresholds 6–8test-treatment thresholds 6–8thallium-201 imaging see myocardial
perfusion imaging, stressthrombolysis, acute stroke 7, 234–5tissue plasminogen activator (tPA) 7,
234–5tonometry 259–65, 261, 263, 264Tono-Pen tonometry 260, 261, 262–3,
263, 264, 264–5transesophageal echocardiography (TEE),
infective endocarditis 164, 165traumatic injuries, diagnostic testing 8troponins, cardiac 129
acute coronary syndrome 128–32, 130blunt chest trauma 104–5, 106
2 × 2 tables 16–17, 21–4
ultrasound (US)acute appendicitis 203–6, 204, 206,
207acute cholecystitis 208–10, 209, 210,
211blunt abdominal trauma 62–5, 64bowel obstruction 195–6, 196deep vein thrombosis 244–6, 245occult scaphoid fractures 98testicular torsion 221, 221–4, 222, 224see also FAST
9781405154000_6_ind.qxd 19/03/2008 10:51 Page 282
Index 283
University of California-Davis head CTrules 84, 85, 89
unstable angina (UA) 128serum biomarkers 128–32, 130see also acute coronary syndrome
ureteral calculi see kidney stonesurinalysis, urinary tract infections 167,
168–9urinary calculi see kidney stonesurinary tract infections (UTI) 167–70urine culture 167, 168–9urine dipstick tests
ascitic fluid, spontaneous bacterialperitonitis 182–4, 183, 184
urinary tract infections 167, 168–9UriSCAN® 183–4US see ultrasound
validation, clinical decision rules 36, 36
venous thromboembolism (VTE) see deepvein thrombosis; pulmonaryembolism
ventilation/perfusion (V/Q) scan 244verification bias 13very elderly (over 80 years), cervical spine
injuries 54, 54, 57
Well’s criteria 23, 246–8, 248white blood cell (WBC) count
acute appendicitis 201–3, 202, 203, 206CSF, raised (pleocytosis) 149, 150–1febrile children 144, 145
womennon-invasive cardiac testing 134–5, 135urinary tract infections 167–70
xanthochromia, CSF 230X-rays, plain film see radiography, plain
film
9781405154000_6_ind.qxd 19/03/2008 10:51 Page 283


