56
Evidence Based Practice Primer
Evidence Based Practice Primer
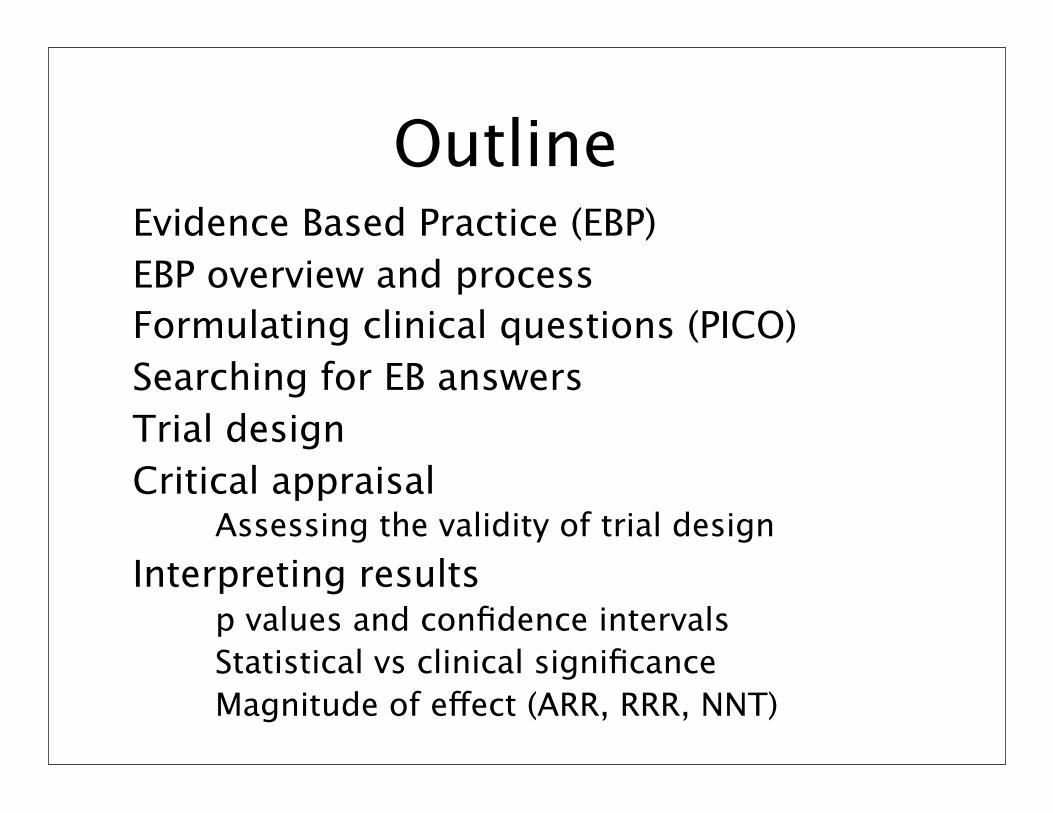
OutlineEvidence Based Practice (EBP)EBP overview and processFormulating clinical questions (PICO)Searching for EB answersTrial designCritical appraisal
Assessing the validity of trial design Interpreting results
p values and confidence intervalsStatistical vs clinical significanceMagnitude of effect (ARR, RRR, NNT)

What is Evidence-Based Practice?
“The integration of best research evidence with clinical expertise and patient values”
Sackett et al 2000When these three elements are integrated, clinicians and patients form a diagnostic and therapeutic alliance with optimized clinical outcomes and quality of life

EVIDENCE-BASED PRACTICE
INDIVIDUAL CLINICAL
EXPERTISE
BEST AVAILABLE EVIDENCE
‘COOKBOOK’ MEDICINE
OUTDATED PRACTICE
Patient Preferences\
Values
EVIDENCE-BASED
PRACTICE

What EBP is Not:EBP is not cook-book medicine
Evidence needs translation to patient’s unique features and values
EBP is not cost-cutting practiceMay actually result in increased costs for some patients and/or conditions

Why Sharpen your Critical Appraisal Skills?
Even highly reputable journals publish poor and/or misleading informationImproved decision making about the management of patientsTool to efficiently stay current with advancing health care knowledge while filtering out studies not worth your time A method of managing and utilizing the enormous amount of medical literatureHelp solve clinical problemsCan even be fun & make your practice more interesting

Knowledge’s Half Life:“My students are dismayed when I say to them, ‘Half of what you are taught as medical students will in 10 years have been shown to be wrong. And the trouble is, none of your teachers knows which half.’”
Dr. Burwell, Dean of Medicine, Harvard University

The Process
Clinical Question (PICO)
Clinical Scenario
Search
Critical Appraisal
Integrate & Apply

Barriers to EBPLimited awareness/knowledgeLimited timeLimited amount of well designed trials in your practice areaLack of motivation
Lack of skills or resourcesLack of financial incentives
Inadequate literature searching skillsAbundance of information

Clinical Questions (PICO)Patient
Description of the most important characteristics of the patient or target disorder
InterventionWhat do you want to do for the patient?Could include exposure, diagnostic test, prognostic factor, surgery, therapy or patient’s perception
Comparator (s)Relevant alternative(s) most often considered for this type of patient
OutcomeClinical outcome of interest to you and your patient

Why all the fuss about a good clinical question?
With limits on time, it is important to ask questions that by design focus on evidence that is directly relevant to the patient’s clinical needs and our knowledge needsThey can suggest high yield search strategiesQuestions suggest forms that useful answers might take

PICO: Case 1A 25 yo male comes into your office with symptoms of Major Depressive Disorder (that meet the criteria in the DSM IV TR. This is his second episode (in 2 yrs) and he has tried citalopram (with little benefit after 6 wks).
PatientInterventionComparisonOutcome
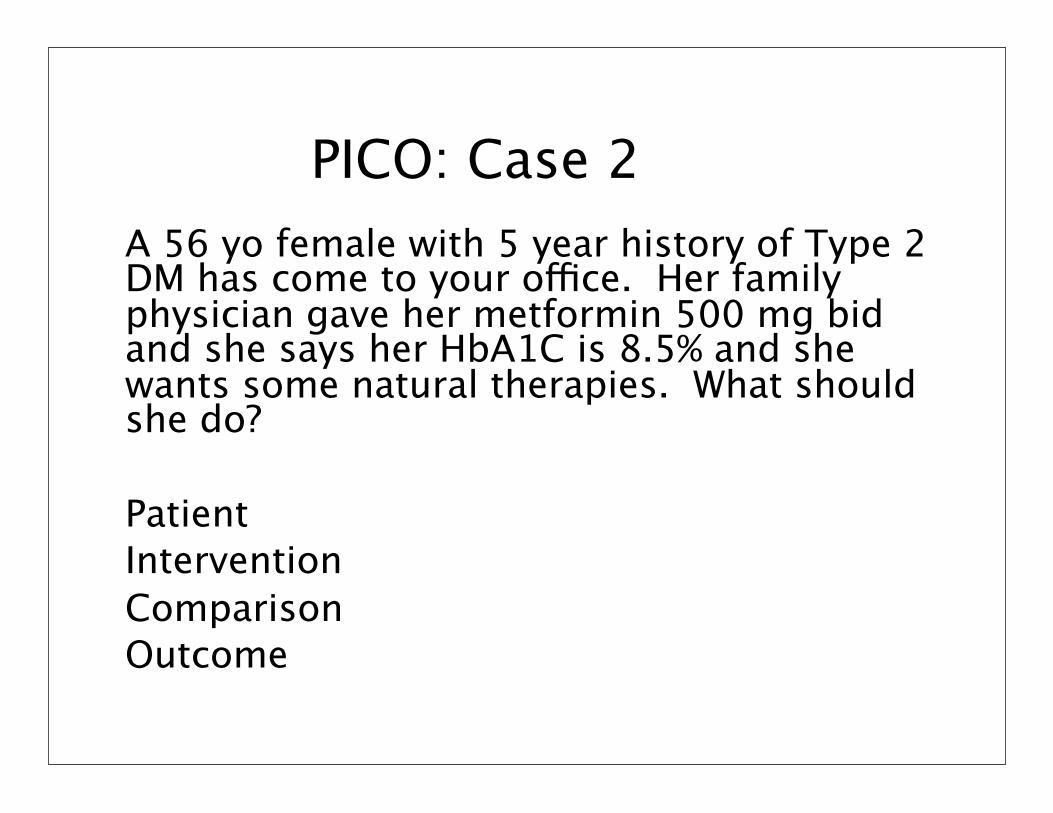
PICO: Case 2A 56 yo female with 5 year history of Type 2 DM has come to your office. Her family physician gave her metformin 500 mg bid and she says her HbA1C is 8.5% and she wants some natural therapies. What should she do?
PatientInterventionComparisonOutcome

The Question Defines the “Best Evidence”
Therapeutic interventionRCT or systematic review/meta-analysis
Rare side effectCase control study
Exposure to a potential toxinCohort study
Evaluation of a new drug by MedicarePharmacoeconomic analysis

Trial Designs for Therapy Questions
Randomized controlled trial (RCT)Systematic review (SR)
A systematic (and hopefully rigorous) process to identify, synthesis and evaluate the available literature
Studies are:Identified according to an explicit search strategy Selected by defined inclusion & exclusion criteria Evaluated against consistent methodological standards
Meta-analysis (MA)A statistical process for quantitatively estimating the net benefit/risk from the results of the included studies

Where do you begin?TextbooksJournalsPhone a friendMedlineThe Cochrane LibraryEvidenced based journals
ACP Journal Club, EBM Internet websites
Drug information websitesEvidence-based practice websites Therapeutic specialty websitesHealthcare websites
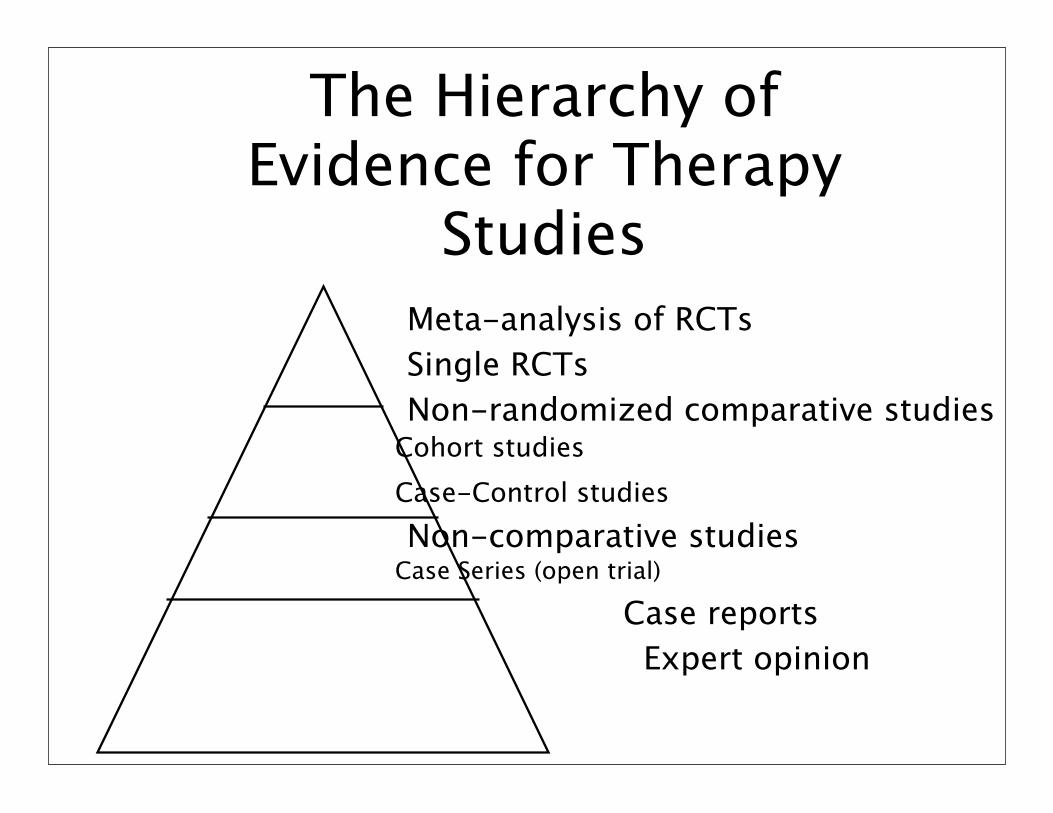
The Hierarchy of Evidence for Therapy
StudiesMeta-analysis of RCTsSingle RCTs Non-randomized comparative studies
Cohort studiesCase-Control studiesNon-comparative studies
Case Series (open trial)
Case reports Expert opinion

Synopses
Evidence-based journal abstracts and commentariesSummary of reviews or individual studiesEasy to interpret & digestHighly efficientDetailed information readily available

Where Would I Find a Synopses?
InfopoemsClinical Evidence on line BandolierEvidence-Based MedicineTherapeutics InitiativeACP journal club
http://therapeuticseducation.org/useful-links

Efficiently Appraising ‘Usable Evidence’
Right patient population (external validity)Study design (right for the question?)Internal validityResults are they meaningful and useful?outcome measure?can they be applied to my CQ?
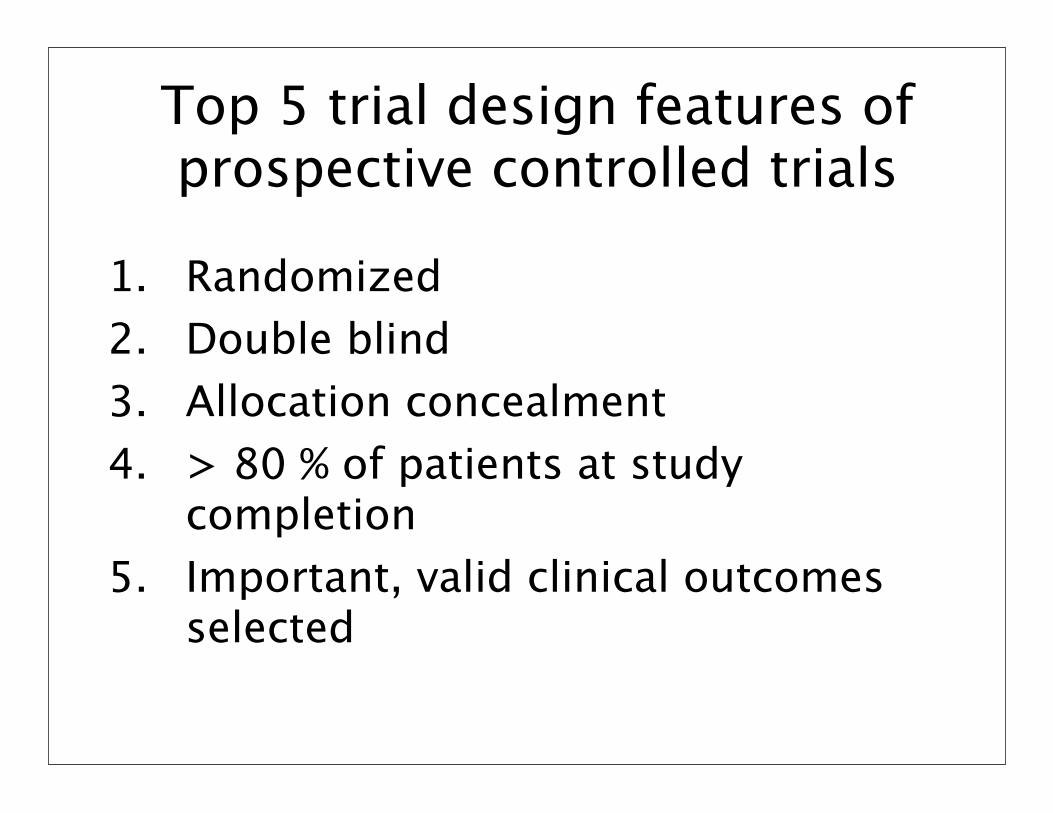
Top 5 trial design features of prospective controlled trials
1. Randomized2. Double blind3. Allocation concealment 4. > 80 % of patients at study
completion 5. Important, valid clinical outcomes
selected

Why randomize?Assessing the effectiveness of a treatment requires a comparison
In non-randomized comparisons, other factors may explain any differences observed (confounding)
Randomization controls for both known and unknown confounders
(Confounders ≈ risk factors)

Allocation Concealment Shields those who admit patients into a trial from knowing future assignmentsHappens before and during randomization process
“The decision to accept or reject a patient must be made, and informed consent obtained, without knowledge of the
treatment to be assigned” Schulz, 1995
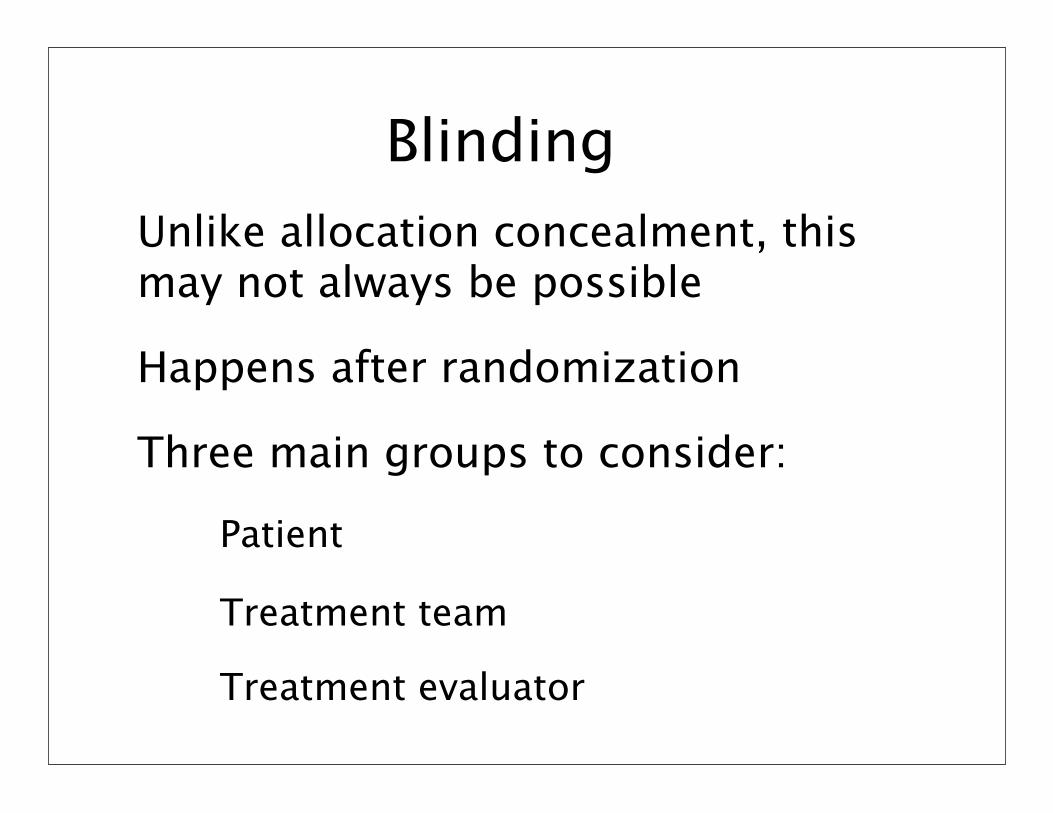
Blinding Unlike allocation concealment, this may not always be possible
Happens after randomization
Three main groups to consider:
Patient
Treatment team
Treatment evaluator

p-valueThe probability of the data, or more extreme data, occurring in the long run when there is NO treatment effect; i.e. how often this result or one more extreme will occur by chance alone
p-value
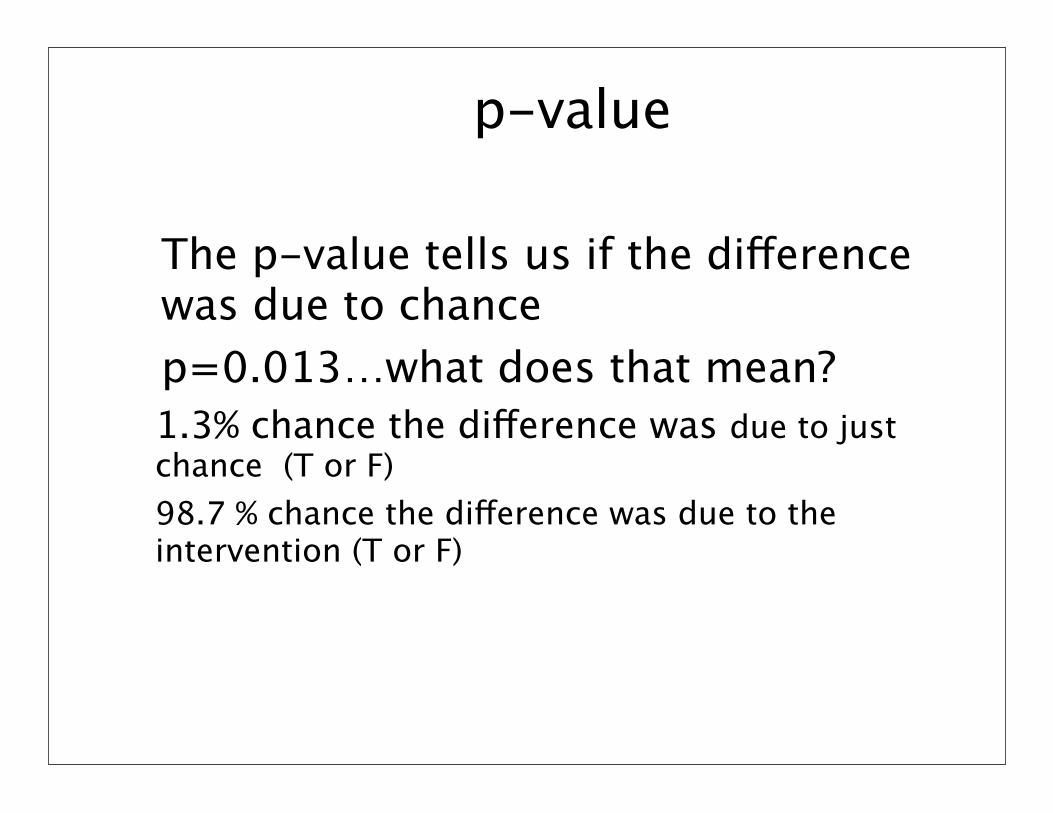
The p-value tells us if the difference was due to chancep=0.013…what does that mean?1.3% chance the difference was due to just chance (T or F)98.7 % chance the difference was due to the intervention (T or F)

What can account for the difference?
1. A true difference2. Bias3. Confounding factors4. Random error (chance)5. All of the above

p-value
The p-value does NOT tell us …If the difference is validIf the difference is clinically meaningfulIf the difference is realIf the drug worksEtc.

What is a Confidence Interval?
Quantifies the uncertainty in measurementA measure of the precession of the “effect estimate” from the study
Usually reported as 95% CIIn a very large number of repetitions of the study, 95% of all CIs obtained will contain the “true” value of the treatment effect in the population studied (assuming random sampling)
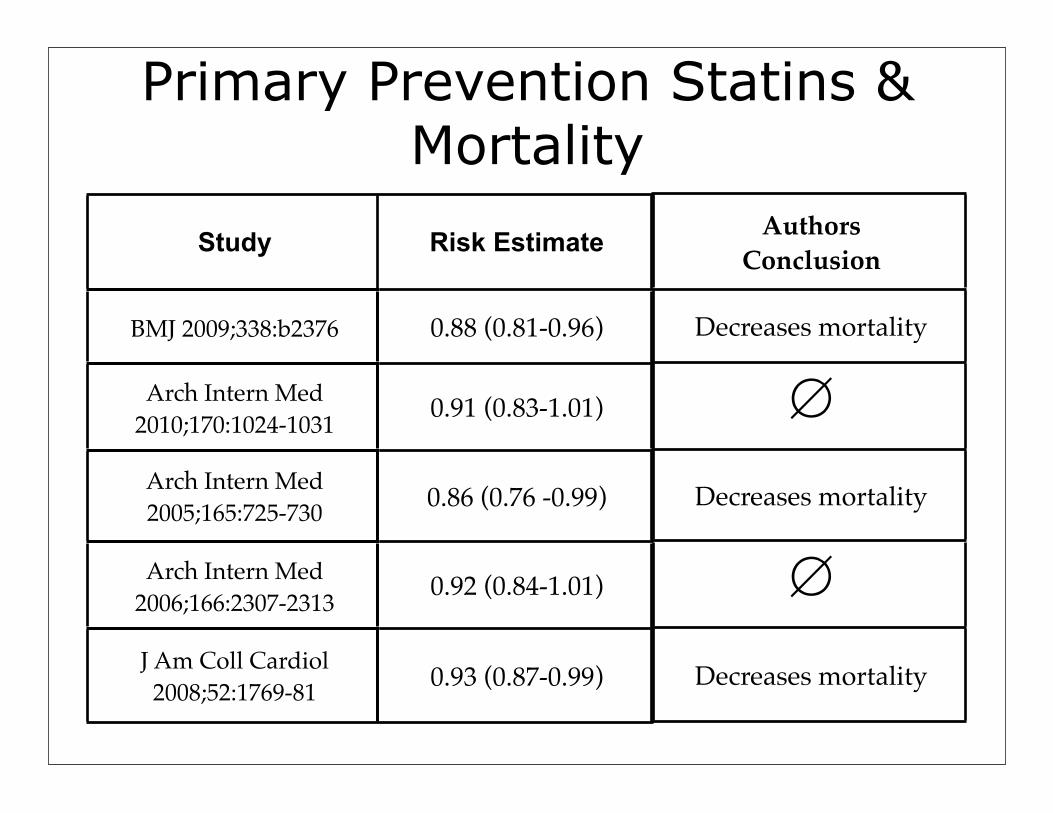
Study Risk Estimate
BMJ 2009;338:b2376 0.88 (0.81-0.96)
Arch Intern Med 2010;170:1024-1031 0.91 (0.83-1.01)
Arch Intern Med 2005;165:725-730 0.86 (0.76 -0.99)
Arch Intern Med 2006;166:2307-2313 0.92 (0.84-1.01)
J Am Coll Cardiol 2008;52:1769-81 0.93 (0.87-0.99)
Primary Prevention Statins & Mortality
AuthorsConclusion
Decreases mortality
∅
Decreases mortality
∅
Decreases mortality

Statistical vs. Clinical Significance:
Clinical relevance
Statistically significant & may be clinically relevant
Not statistically significant
Not statisticallysignificant
HgbA1C = + 0.7HgbA1C
HgbA1C = - 0.7
Statistically significantand clinically relevant

Typical Radio, TV, and Newspaper Reports“Aspirin produces a 30% reduction in
heart attacks”“Treating high blood pressure reduces
the chance of strokes by 40%”“Cholesterol lowering drug decreases
chance of heart attacks by 35%”“Vasectomies increase chance of
prostate cancer by 40%”

Imagine that you just found out you have a risk factor for cardiovascular disease (e.g., high blood pressure or high cholesterol). A drug that will treat this risk factor is available and it has no side effects and its cost is covered by a plan. Consider the following three scenarios. Would you be willing to take this drug every day for the next five years if it had been shown in a clinical trial that:
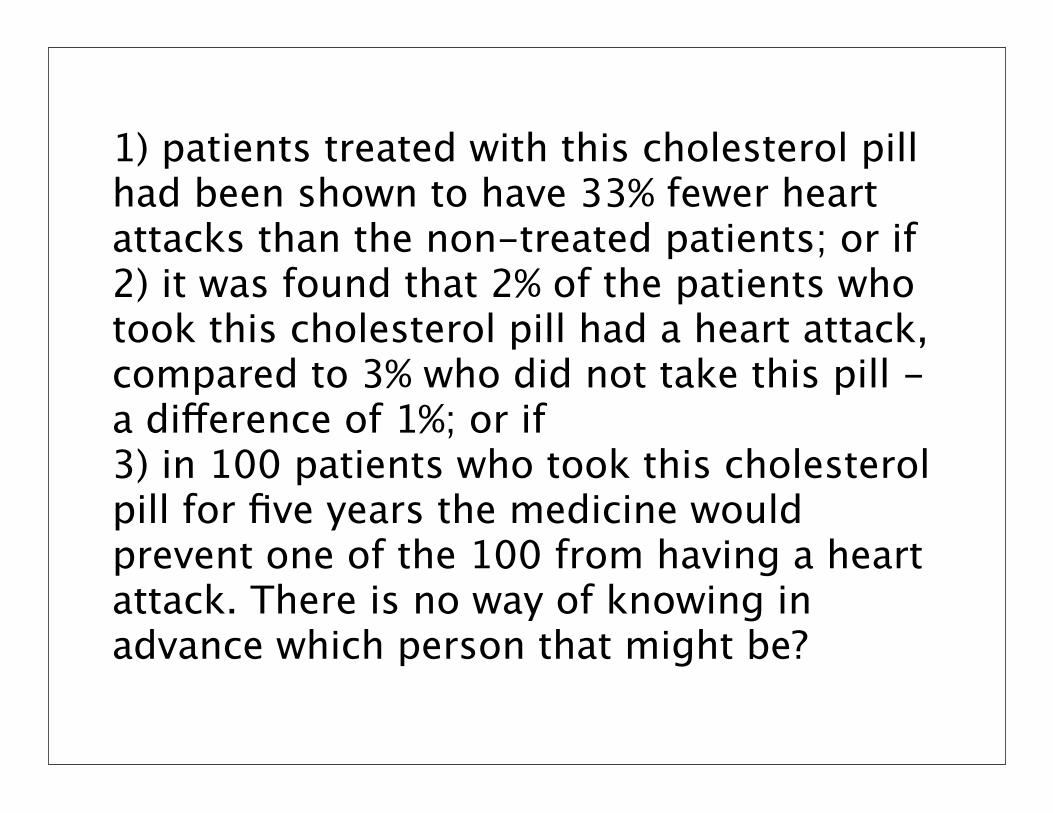
1) patients treated with this cholesterol pill had been shown to have 33% fewer heart attacks than the non-treated patients; or if2) it was found that 2% of the patients who took this cholesterol pill had a heart attack, compared to 3% who did not take this pill - a difference of 1%; or if 3) in 100 patients who took this cholesterol pill for five years the medicine would prevent one of the 100 from having a heart attack. There is no way of knowing in advance which person that might be?

RRR = 33% fewer heart attacksARR = 2% of patients on this drug had a heart attack compared to 3% on placebo – a difference of 1%NNT = Drug would prevent 1 of 100 from having a heart attack
0
23
45
68
90
Relative risk Absolute risk NNT
2631
87
Would you take a drug daily for 5 years if it was free with no side effects
% w
ho sa
id y
es

A 33% Reduction Can MeanEvents Were Reduced From:
3/million to 2/million0.3 % to 0.2 %
3 % to 2 %6 % to 4 %
30 % to 20 %100 % to 67 %
1,000,000100010050103
NNT
1/million0.1%1%2%
10%33%
Absolutereduction

Benefits Must Always Be Expressed Over a Period of Time
NNT (prevent a fatal heart attack) = 300Chew an aspirin at onset of chest pain - YESNNT (prevent a fatal heart attack/stroke/cancer) = 1Chew some poison hemlock now - NONNT (prevent a heart attack/stroke) = 50Take a drug for 5-10 years - side effects and cost - ????

“X” % of WHAT!!!!!!!!!
Up to
on selected items
SALE - 50 % OFF

“X” % of WHAT!!!!!!!!!
Up to
on selected items
SALE - 50 % OFF
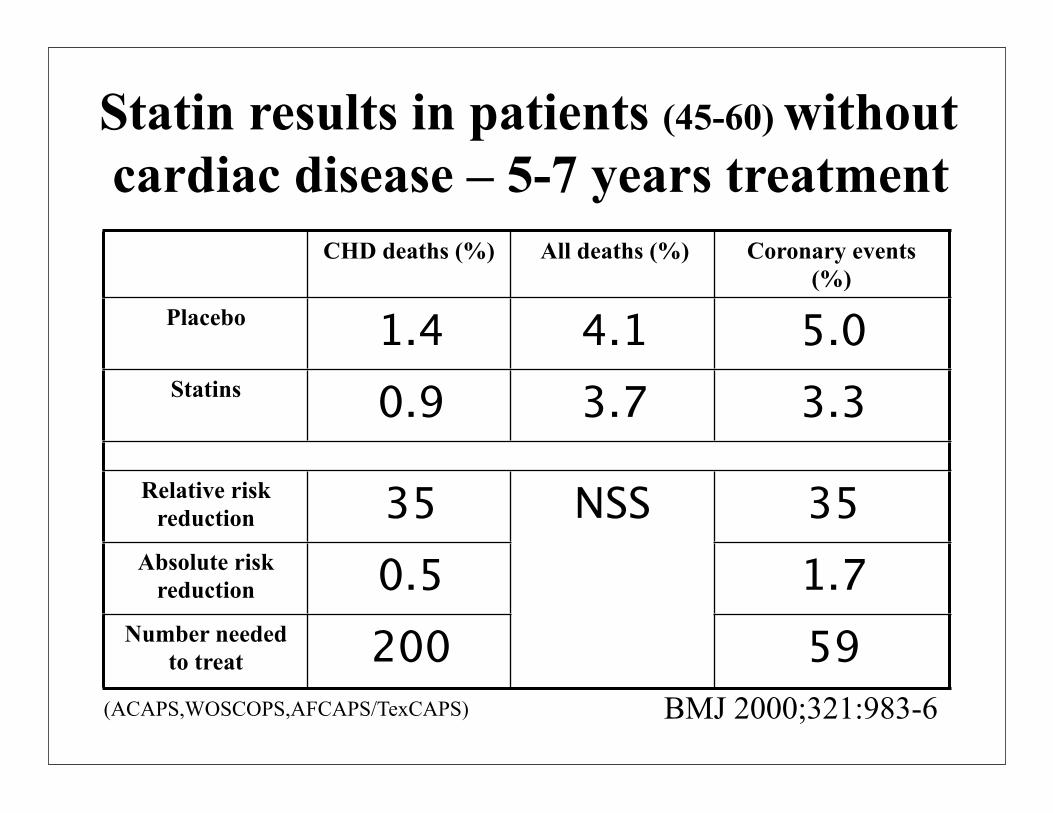
Statin results in patients (45-60) without cardiac disease – 5-7 years treatment
CHD deaths (%) All deaths (%) Coronary events (%)
Placebo 1.4 4.1 5.0Statins 0.9 3.7 3.3
Relative risk reduction 35 NSS 35
Absolute risk reduction 0.5
NSS1.7
Number needed to treat 200
NSS
59BMJ 2000;321:983-6(ACAPS,WOSCOPS,AFCAPS/TexCAPS)
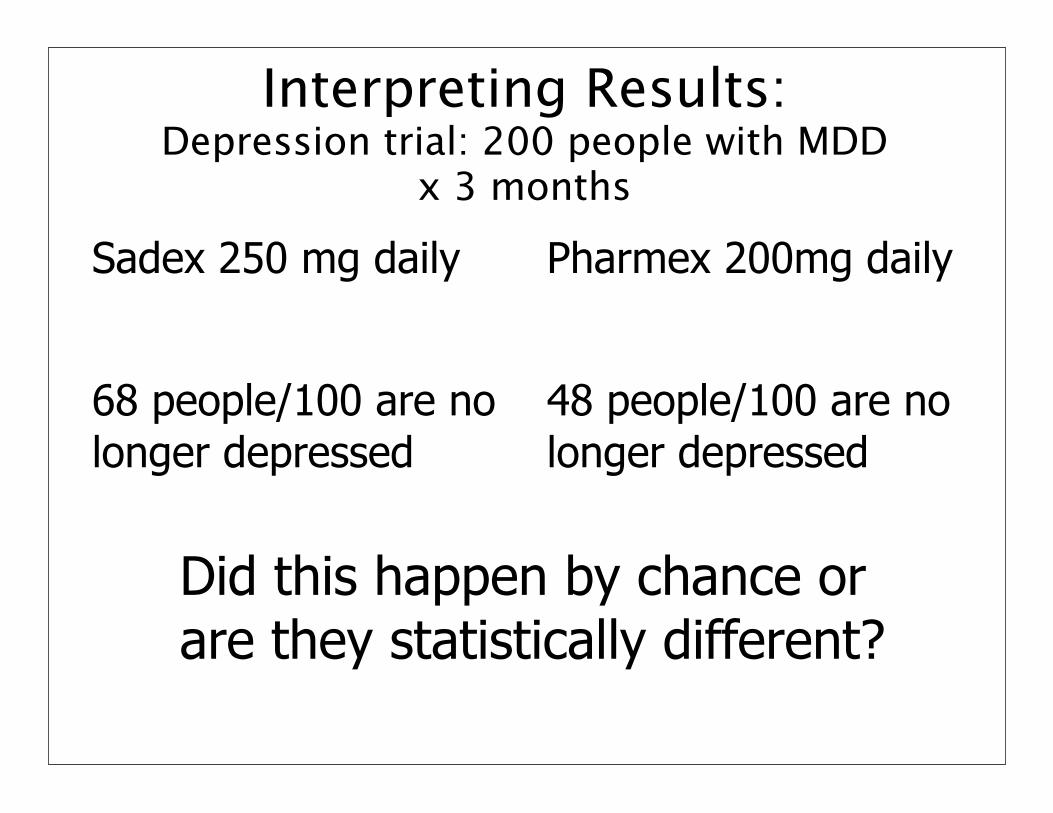
Interpreting Results:Depression trial: 200 people with MDD
x 3 months
Sadex 250 mg daily
68 people/100 are nolonger depressed
Pharmex 200mg daily
48 people/100 are no longer depressed
Did this happen by chance or are they statistically different?
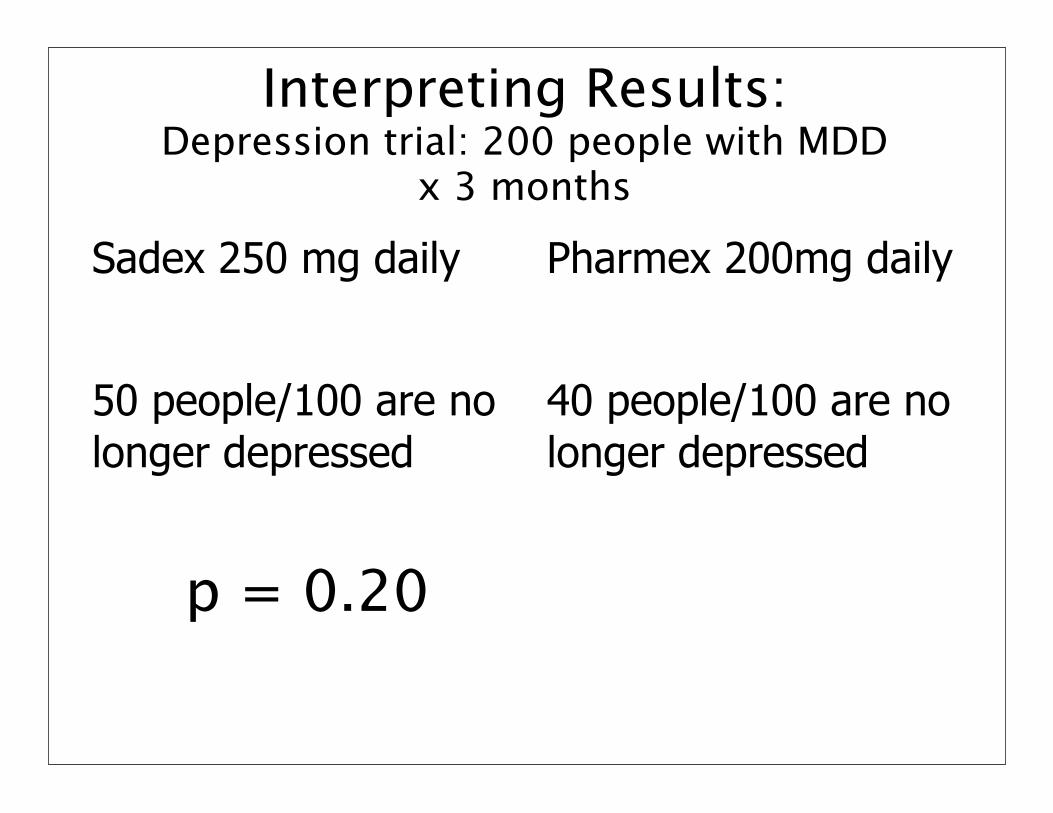
Interpreting Results:Depression trial: 200 people with MDD
x 3 months
Sadex 250 mg daily
50 people/100 are nolonger depressed
Pharmex 200mg daily
40 people/100 are no longer depressed
p = 0.20
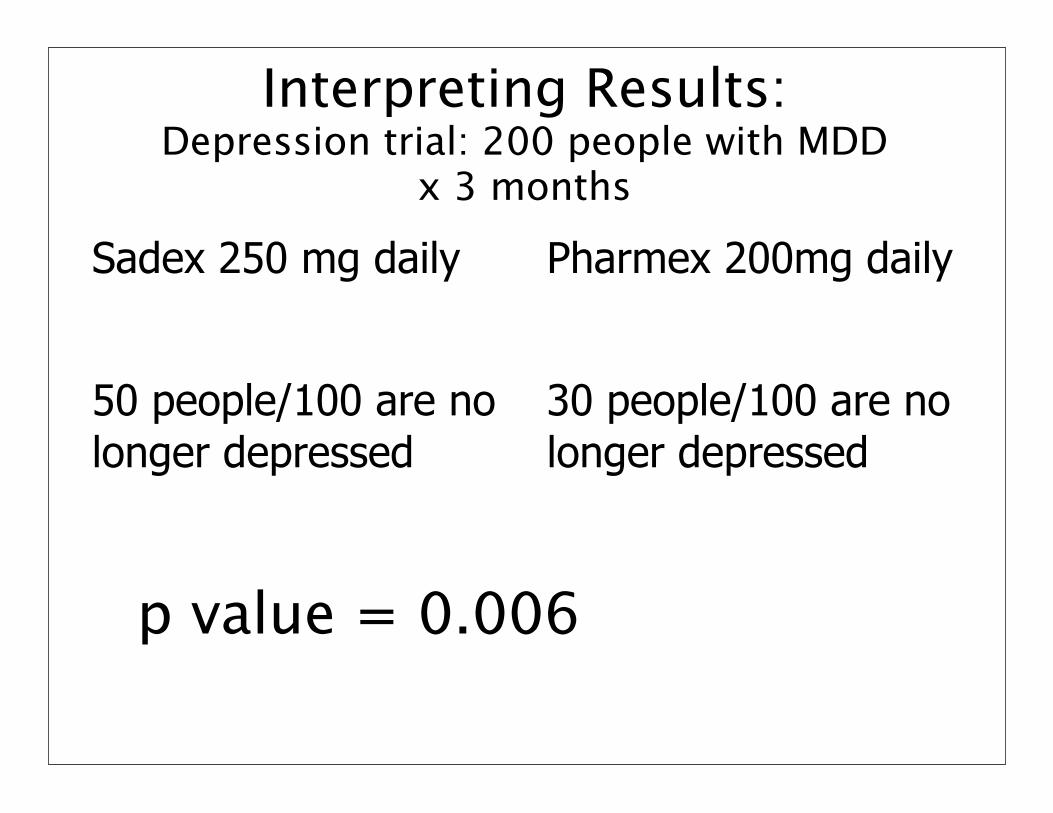
Interpreting Results:Depression trial: 200 people with MDD
x 3 months
Sadex 250 mg daily
50 people/100 are nolonger depressed
Pharmex 200mg daily
30 people/100 are no longer depressed
p value = 0.006

RRR, ARR, NNT…
RRR = rate A – rate B rate A ARR = rate A – rate B
NNT = 1/ARR

RRR, ARR, NNT…
RRR = 50 – 30 = 20 = 40% 50 50
ARR = 50% – 30% = 20%
NNT = 1/ARR = 5
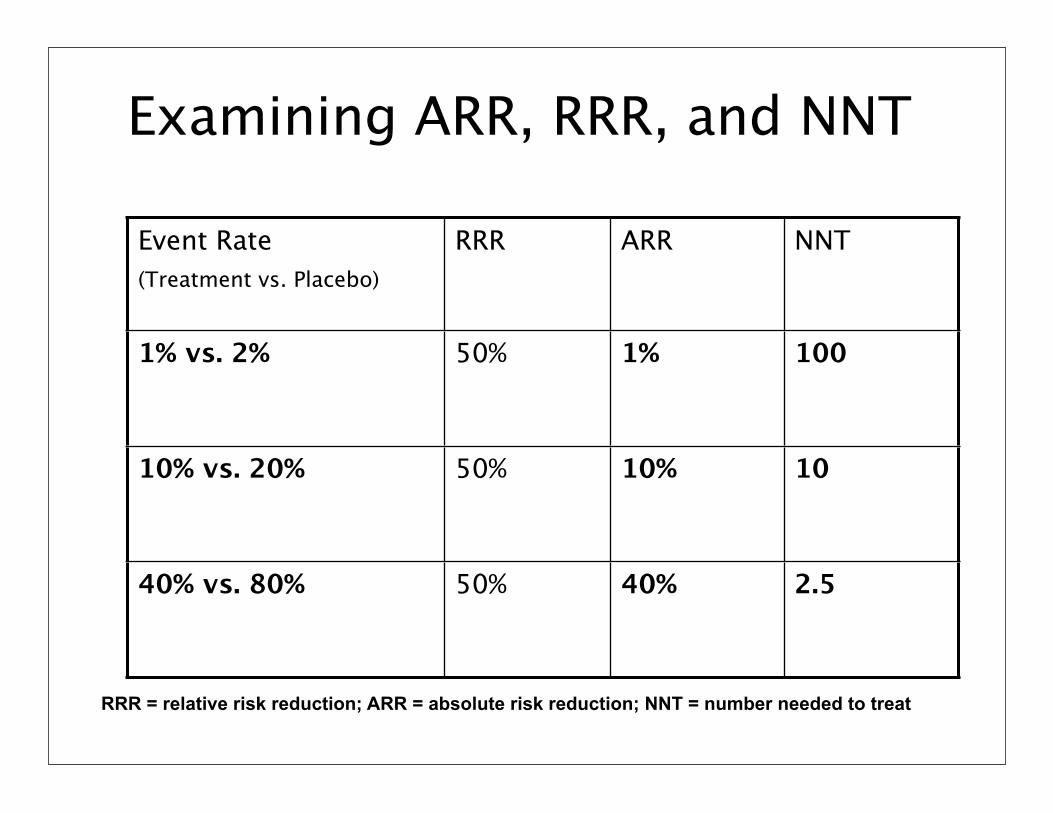
Examining ARR, RRR, and NNT
Event Rate(Treatment vs. Placebo)
RRR ARR NNT
1% vs. 2% 50% 1% 100
10% vs. 20% 50% 10% 10
40% vs. 80% 50% 40% 2.5
RRR = relative risk reduction; ARR = absolute risk reduction; NNT = number needed to treat

Important
Only calculate ARR/ARI/NNT/NNH if the result is statistically significant!!NOTE: NNT and NNH Studies have shown mixed results in terms of the usefulness of these statisticsClinicians and patients do not always find it useful to help choose therapyNNT of 30 may be good or bad depending on the situation
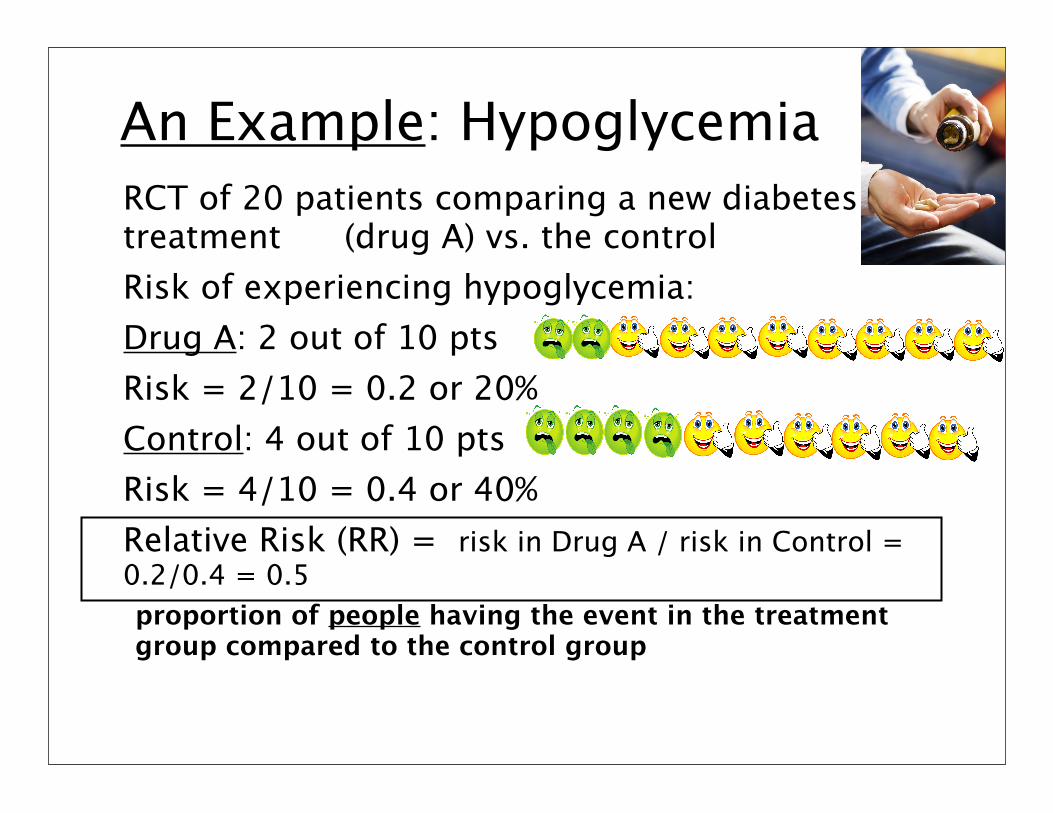
An Example: HypoglycemiaRCT of 20 patients comparing a new diabetes treatment (drug A) vs. the control Risk of experiencing hypoglycemia:Drug A: 2 out of 10 ptsRisk = 2/10 = 0.2 or 20%Control: 4 out of 10 ptsRisk = 4/10 = 0.4 or 40%Relative Risk (RR) = risk in Drug A / risk in Control = 0.2/0.4 = 0.5proportion of people having the event in the treatment group compared to the control group

Number Needed to Harm (NNH)
ExampleWeight gain (>7kg) with olanzapine =30%Weight gain with ziprasidone =5%The Absolute Risk Increase (ARI) 30-5= 25% increased risk with olanzapineNNH=100/25=4

What is an effect size?

Global Symptom Improvement (Meta-analysis: Atypicals vs. Conventionals)
0.0‒ 0.2
‒ 0.5‒ 0.8
0.80.50.2
0.49 0.25 0.21
Davis et al. Arch Gen Psych 2003N=124 trials, 18, 272 pts
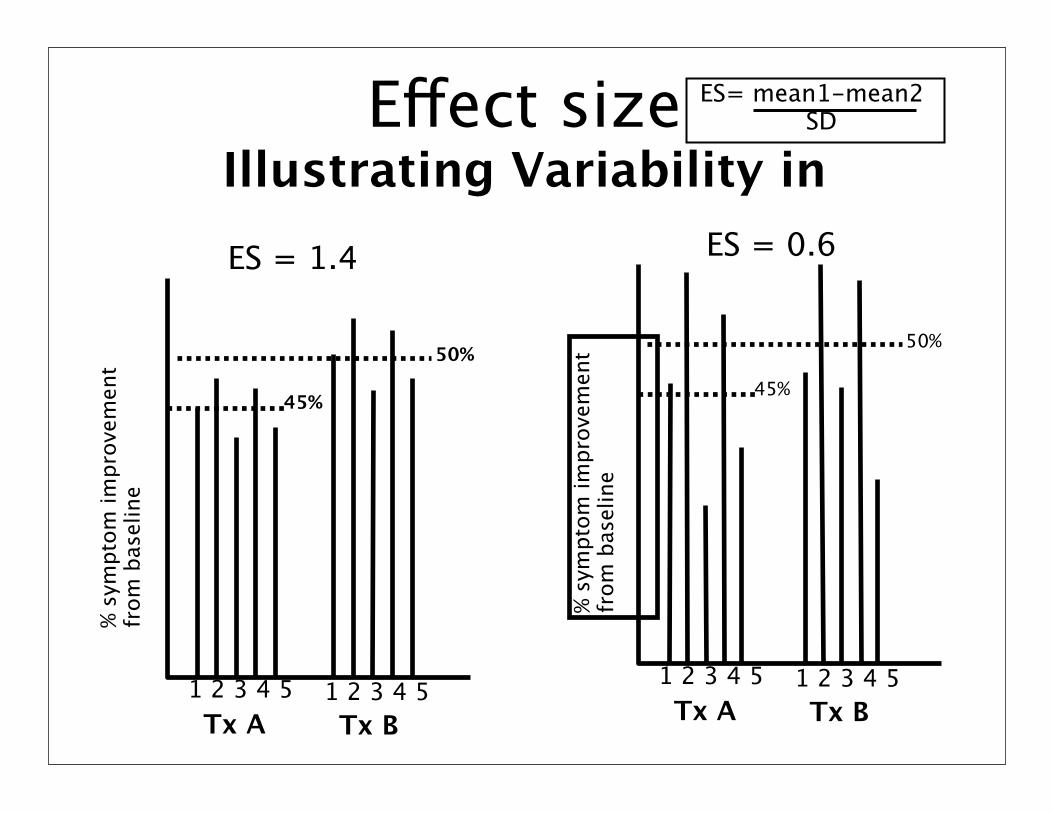
Effect sizeIllustrating Variability in
% sy
mpt
om im
prov
emen
t fr
om b
asel
ine
1 2 3 4 5 1 2 3 4 5Tx A Tx B
ES= mean1-mean2 SD
50%
45%
ES = 1.4
% sy
mpt
om im
prov
emen
t fr
om b
asel
ine
1 2 3 4 5 1 2 3 4 5Tx A Tx B
50%
45%
ES = 0.6

Global Symptom Improvement
Davis et al. Arch Gen Psych 2003
0.0‒ 0.2
‒ 0.5‒ 0.8
0.80.50.2
Large effect
Large effect
Small effect
Small effectNo effect

What is an Odds Ratio?Commonly used in systematic reviews and epidemiological studies that list the likelihood of harm an exposure may cause Calculated as the number of events divided by the number of non-events. Eg, 51 boys are born in every 100 birthsThe odds of a randomly chosen delivery being a boy is: (51 / 49)= 1.04
http://www.jr2.ox.ac.uk/bandolier/band25/b25-6.html

Odds Ratio (and relative risk)
OR = odds in the treated/exposed group divided by the odds in the control group
RR approximates OR when events are rare!