LETTER • OPEN ACCESS Evidence for a climate signal in trends of global crop yield variability over the past 50 years To cite this article: T M Osborne and T R Wheeler 2013 Environ. Res. Lett. 8 024001 View the article online for updates and enhancements. You may also like Predicting spatial and temporal variability in crop yields: an inter-comparison of machine learning, regression and process- based models Guoyong Leng and Jim W Hall - Time-varying impact of climate on maize and wheat yields in France since 1900 Andrej Ceglar, Matteo Zampieri, Nube Gonzalez-Reviriego et al. - Nutrient supply affects the yield stability of major European crops—a 50 year study Hella Ellen Ahrends, Stefan Siebert, Ehsan Eyshi Rezaei et al. - Recent citations Factors affecting the implementation of intercropping technology of food crops on upland C O I Hastuti et al - Interactions between drought and shade on the productivity of winter pea grown in a 25yearold walnutbased alley cropping system Guillaume Blanchet et al - Assessing the Sensitivity of Main Crop Yields to Climate Change Impacts in China Yuan Xu et al - This content was downloaded from IP address 180.71.97.179 on 18/12/2021 at 07:44
Transcript
LETTER • OPEN ACCESS
Evidence for a climate signal in trends of globalcrop yield variability over the past 50 yearsTo cite this article: T M Osborne and T R Wheeler 2013 Environ. Res. Lett. 8 024001
View the article online for updates and enhancements.
You may also likePredicting spatial and temporal variabilityin crop yields: an inter-comparison ofmachine learning, regression and process-based modelsGuoyong Leng and Jim W Hall
-
Time-varying impact of climate on maizeand wheat yields in France since 1900Andrej Ceglar, Matteo Zampieri, NubeGonzalez-Reviriego et al.
-
Nutrient supply affects the yield stability ofmajor European crops—a 50 year studyHella Ellen Ahrends, Stefan Siebert,Ehsan Eyshi Rezaei et al.
-
Recent citationsFactors affecting the implementation ofintercropping technology of food crops onuplandC O I Hastuti et al
-
Interactions between drought and shadeon the productivity of winter pea grown ina 25yearold walnutbased alley croppingsystemGuillaume Blanchet et al
-
Assessing the Sensitivity of Main CropYields to Climate Change Impacts in ChinaYuan Xu et al
-
This content was downloaded from IP address 180.71.97.179 on 18/12/2021 at 07:44
Environ. Res. Lett. 8 (2013) 024001 (9pp) doi:10.1088/1748-9326/8/2/024001
Evidence for a climate signal in trends ofglobal crop yield variability over the past50 years
T M Osborne1,2 and T R Wheeler2,3
1 National Centre for Atmospheric Science (NCAS), University of Reading, UK2 Walker Institute for Climate System Research, University of Reading, UK3 Department of Agriculture, University of Reading, UK
Received 6 December 2012Accepted for publication 19 March 2013Published 4 April 2013Online at stacks.iop.org/ERL/8/024001
AbstractLow variability of crop production from year to year is desirable for many reasons, includingreduced income risk and stability of supplies. Therefore, it is important to understand thenature of yield variability, whether it is changing through time, and how it varies betweencrops and regions. Previous studies have shown that national crop yield variability haschanged in the past, with the direction and magnitude dependent on crop type and location.Whilst such studies acknowledge the importance of climate variability in determining yieldvariability, it has been assumed that its magnitude and its effect on crop production have notchanged through time and, hence, that changes to yield variability have been due tonon-climatic factors. We address this assumption by jointly examining yield and climatevariability for three major crops (rice, wheat and maize) over the past 50 years. National yieldtime series and growing season temperature and precipitation were de-trended and relatedusing multiple linear regression. Yield variability changed significantly in half of thecrop–country combinations examined. For several crop–country combinations, changes inyield variability were related to changes in climate variability.
Keywords: crops climate variability
S Online supplementary data available from stacks.iop.org/ERL/8/024001/mmedia
1. Introduction
Low variability of crop production from year to year isdesirable for many reasons including reduced income riskand stability of supplies potentially leading to less volatilefood prices [1]. Variations in crop yield from one year to thenext are caused by numerous factors, including fluctuationsin weather, pest and diseases incidence, use of inputs, andthe uptake of technology. Chief amongst these is weather
Content from this work may be used under the terms ofthe Creative Commons Attribution 3.0 licence. Any further
distribution of this work must maintain attribution to the author(s) and thetitle of the work, journal citation and DOI.
and its importance for crop production is well recognizedand reflected in the increasing number of studies examiningthe impact of climate variability, over seasonal to decadaltimescales, on crop yield [2–8].
The green revolution led to increased average yieldlevels for many crops in most parts of the world overthe past 50 years [9], but its impact on the variabilityof crop production is less clear. It is possible that yieldvariability may have decreased due to the adoption of cropcultivars less susceptible to environmental stress and theincrease in levels of agricultural technology and management.Alternatively, the trend towards monoculture cultivationhas narrowed the genetic diversity potentially creating a
Environ. Res. Lett. 8 (2013) 024001 T M Osborne and T R Wheeler
widespread susceptibility to a single stress leading to greateryield variability from year to year.
Despite its importance only a handful of studieshave examined large-area yield time series for changes invariability [10–12]. There is some evidence that the yieldof maize has become more variable [10, 11], the yield ofwheat less variable [11, 12], and the variability of riceyields unchanged [11]. Each analysis uses a different measureof yield variability and data at different geographical andtime domains, making comparison difficult. Also they didnot extend their analysis to include climate. All studiesassumed that the environmental drivers of yield variability(e.g. climate) are random and stationary. Recently observedchanges to climate [13] means that this assumption shouldbe reassessed, especially given that such changes have beenattributed to increases in greenhouse gas concentrations [14]indicating that they may persist and are not only due tointernal variability of the climate system. It is clear that suchchanges in climate, in the mean, variability, or both, have thepotential to impact upon yield variability and the apparentsensitivity of yield to climate.
This study examines two questions. Firstly, whether thevariability of yield of the three most important crops globally(wheat, maize, and rice) has changed during the past 50 years,and secondly whether any such changes can be attributedto changes in the corresponding climate (growing seasontemperature and precipitation).
2. Methods
Country-level crop yield data for the period 1961–2010were obtained from the UN Food and Agriculture Organisa-tion [15]. The analysis focused on three of the most widelycultivated crops during the time period: wheat, maize and rice.For each crop, the ten largest producing countries in the 2000s,with the exception of the Soviet Union due to its dissolutionduring the time period, were examined, thereby focusingattention on the most important producers at the global scalewith the most reliable yield data (see supplementary table S1available at stacks.iop.org/ERL/8/024001/mmedia).
Climate data were obtained from the Climate ResearchUnit (CRU) at the University of East Anglia [16] and consistedof monthly mean surface temperature and precipitation at0.5◦ spatial resolution over land for the years 1901–2009.Therefore, the common period from 1961 to 2009 wasused in this study. The CRU dataset has been widelyused in crop impacts research and so was regarded assuitable for the purposes of this study. However, it shouldbe noted that it likely contains unknown errors whichmay bias subsequent analysis particularly the identificationof relationships between crop yield and climate [17]. Toderive climate indices associated with each crop grownin each country, the climate datasets were averaged overboth growing area and growing season months. The set of0.5◦ grid cells contributing to the crop growing area wasderived from published maps on growing area for the year2000 [18]. Growing season months were defined for eachcrop–country combination using crop-calendar information
of the USDA [19] and are shown in supplementary tableS1. Therefore, it is assumed that the relative distribution ofeach crop both in space and time has remained relativelyconstant over the time period. It is likely that for somecrop–country combinations this may not be valid due to shiftsin growing areas or seasons made possible by advances incrop technology or climate. For example, it has been reportedthat average planting date for maize in Central USA hasadvanced by two weeks between 1979 and 2005 most likelydue to the adoption of new crop genotypes and changes inmanagement practices [20], while in the North China Plainthe sowing time of wheat and the harvest time of maizehave been intentionally delayed as a response to regionalwarming [21]. Unfortunately, at the global scale detailedcrop-specific data over the historical period is not availableto permit a comprehensive analysis of the sensitivity to thechoice of growing areas and months.
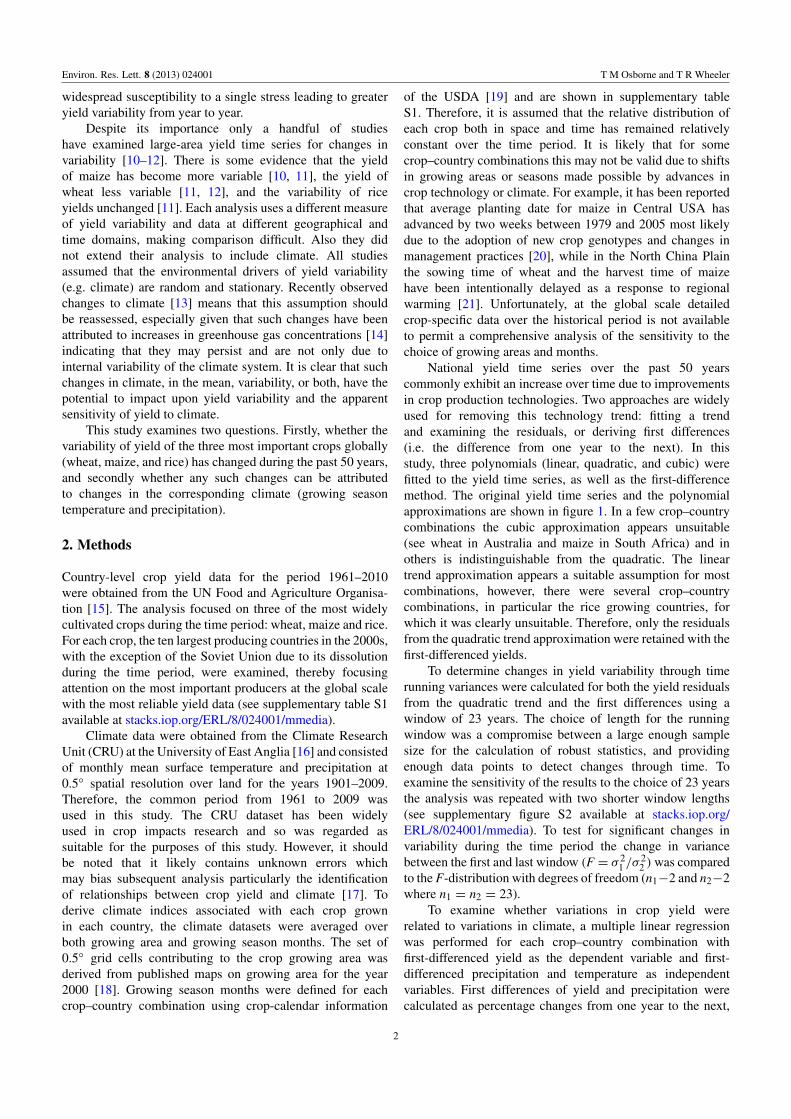
National yield time series over the past 50 yearscommonly exhibit an increase over time due to improvementsin crop production technologies. Two approaches are widelyused for removing this technology trend: fitting a trendand examining the residuals, or deriving first differences(i.e. the difference from one year to the next). In thisstudy, three polynomials (linear, quadratic, and cubic) werefitted to the yield time series, as well as the first-differencemethod. The original yield time series and the polynomialapproximations are shown in figure 1. In a few crop–countrycombinations the cubic approximation appears unsuitable(see wheat in Australia and maize in South Africa) and inothers is indistinguishable from the quadratic. The lineartrend approximation appears a suitable assumption for mostcombinations, however, there were several crop–countrycombinations, in particular the rice growing countries, forwhich it was clearly unsuitable. Therefore, only the residualsfrom the quadratic trend approximation were retained with thefirst-differenced yields.
To determine changes in yield variability through timerunning variances were calculated for both the yield residualsfrom the quadratic trend and the first differences using awindow of 23 years. The choice of length for the runningwindow was a compromise between a large enough samplesize for the calculation of robust statistics, and providingenough data points to detect changes through time. Toexamine the sensitivity of the results to the choice of 23 yearsthe analysis was repeated with two shorter window lengths(see supplementary figure S2 available at stacks.iop.org/ERL/8/024001/mmedia). To test for significant changes invariability during the time period the change in variancebetween the first and last window (F = σ 2
1 /σ22 )was compared
to the F-distribution with degrees of freedom (n1−2 and n2−2where n1 = n2 = 23).
To examine whether variations in crop yield wererelated to variations in climate, a multiple linear regressionwas performed for each crop–country combination withfirst-differenced yield as the dependent variable and first-differenced precipitation and temperature as independentvariables. First differences of yield and precipitation werecalculated as percentage changes from one year to the next,
Environ. Res. Lett. 8 (2013) 024001 T M Osborne and T R Wheeler
Figure 1. Normalized time series of national-average yield for the main producers of wheat, maize and rice, including linear (blue),quadratic (red) and cubic (green) polynomial fits to the time series.
while differences in temperature were absolute. Regressionusing first-difference time series assumes that only changes inclimate can influence changes in yield. Because the absolutetemperature or precipitation can be important for crop growth(i.e. their effects might be non-linear) an alternative regressionincluding the original time series of yield and climate was
considered. However, the coincidence of strong increasingtrends in yield (due to technology) and temperature (due toglobal warming) led to spurious associations, even if timewas included as an explanatory variable. Therefore, only theregression using first-differenced time series was retained. Toattribute changes in yield variance to climate the variance
3
Environ. Res. Lett. 8 (2013) 024001 T M Osborne and T R Wheeler
analysis was repeated on the predicted yield, but only forcrop–country combinations for which a significant (P < 0.1)model between yield and climate was found. Finally, theanalysis was repeated at the global level by aggregating thenational data of yield and climate weighting by each country’srelative contribution to production.
3. Results and discussion
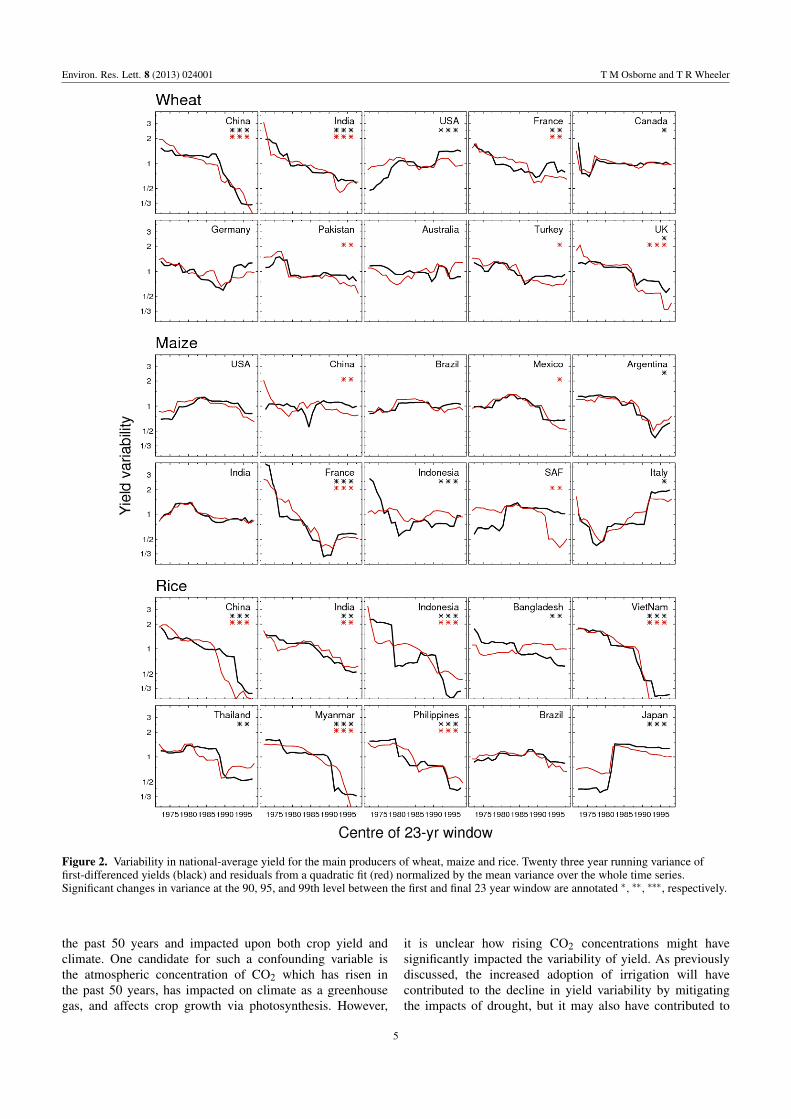
Yield variability significantly changed between 1961 and2009 in the majority of the world’s major crop producingcountries (figure 2). Analysis of the first-differenced yieldtime series identified 19 crop–country combinations (out ofa possible 30) with a significant (p < 0.1) change in variancebetween the start and the end of the time period, comparedto 16 when the residuals from a quadratic fit were used.For wheat, both methods identified significant declines inyield variability in China, India, France and the UK. Thefirst-differenced yields exhibited an increase in variability inthe USA and a decrease in Canada, whilst the yield residualsfor Pakistan and Turkey declined significantly. The trends invariability are not always even throughout the time period.For example, in China wheat yield variability declined overa number of years following a period of relatively constantvariability, in France it declined and then levelled off, whereasin the UK yield variability declined during the most recent20 years.
For maize greater inconsistency between the two yieldde-trending methodologies is apparent. Only in France didthe two methods agree on a significant decline. Analysis ofthe first-differenced yield time series identified significantdeclines in Argentina and Indonesia, and an increase in Italy,whilst the variability of residuals decreased in China, Mexicoand South Africa. Disagreement between the two methods indetermining significant changes does not necessarily meanthat the two methods have widely different evolution inthe variance of yield. For instance, there is strong visualagreement between the methods in the USA, Brazil, Mexico,Argentina, India and Italy. However, there are importantexceptions, namely Indonesia and South Africa, where thereis considerable disagreement on the evolution of yieldvariability.
Agreement between the two yield de-trending methodswas greatest for rice. Yield variability declined in six ofthe ten countries examined. Additionally, the first-differencedtime series exhibited significant declines in variability inBangladesh and Thailand, and an increase in Japan. Asubstantial fraction of rice production is supported by someform of irrigation [22]. Recent estimates of harvested areasunder rain-fed and irrigated cultivation [23], when aggregatedto national level, show that for the top ten producingcountries irrigated fraction ranges from around a third forMyanmar and Brazil, up to the entire cultivated area in Japan(supplementary table S2 available at stacks.iop.org/ERL/8/024001/mmedia). Increased use of irrigation to amelioratethe impact of water shortage on yield would potentially leadto a decrease in yield variability. To examine this availabledata on national irrigation was compared to the changes in
yield variability of all three crops (supplementary figure S3available at stacks.iop.org/ERL/8/024001/mmedia). Whilstthe overall area of irrigation has increased markedly for manycountries (not shown) the fraction of cultivated area equippedfor irrigation has not increased drastically for most crops. Forexample, irrigated fraction has increased most for Bangladesh(∼5–60%), India (20–40%) and Viet Nam (∼20–50%).
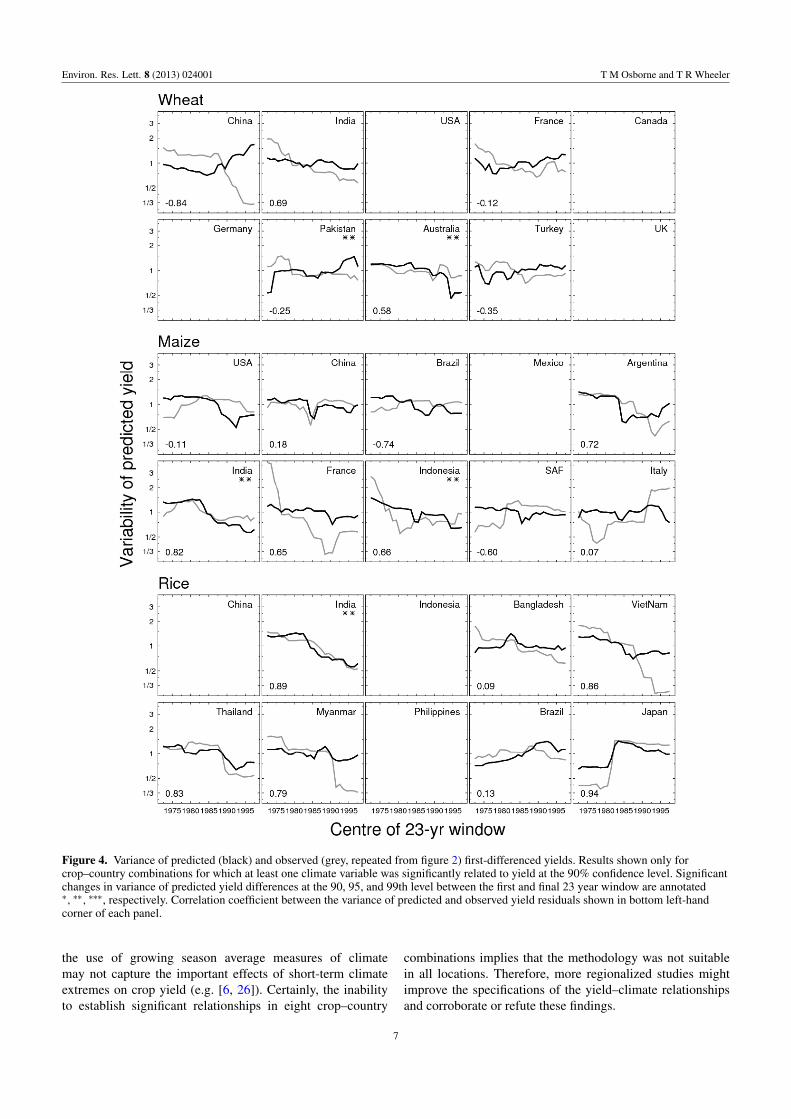
Significant changes in climate variability occurred forseveral of the crop–country combinations (figure 3). Yetthere is no general association between changes in yieldvariability (figure 2) and changes in climate variability acrossall crop–country combinations. However, by examiningthe variance of the predicted yield differences from ayield–climate regression, the importance of climate, orotherwise, in determining the observed changes in yieldvariability can be evaluated (figure 4). A relationship betweenclimate (temperature, precipitation, or both) and yieldresiduals was established for 22 out of the 30 crop–countrycombinations. These can be split in to a group of 9 forwhich yield variability did not change significantly duringthe time period (figure 2), and a group of 13 for whichsignificant change was detected. For this latter group, thestrictest criterion for attributing the observed change in yieldvariability to changes in climate is for the predictions fromthe yield–climate regression to exhibit the same significantchange in variability. This occurred in two instances: maizein Indonesia and rice in India where significant declines inrainfall variability have occurred (figure 3). Additionally, arole for climate can be inferred where there is good agreementbetween the observed and predicted yield residuals. Thiswas the case for seven combinations: wheat in India, maizein Argentina and France, and rice in Vietnam, Thailand,Myanmar and Japan. In the four remaining combinationsfor which there was no relationship between observed andpredicted yield differences (wheat in China and France,maize in Italy, rice in Bangladesh) climate had no impact onyield variability. For six of the 9 crop–country combinationswhere observed yield variability was constant the predictedyield differences also did not exhibit any significant change.For the remaining three combinations (wheat in Pakistanand Australia, maize in India) yield variability remainedunchanged despite changes in climate variability. Finally,there were six combinations (wheat in USA, Canada and UK,rice in China, Indonesia and Philippines) for which, in theabsence of a yield–climate relationships, it was not possible toattribute the observed changes in yield variability to climate.
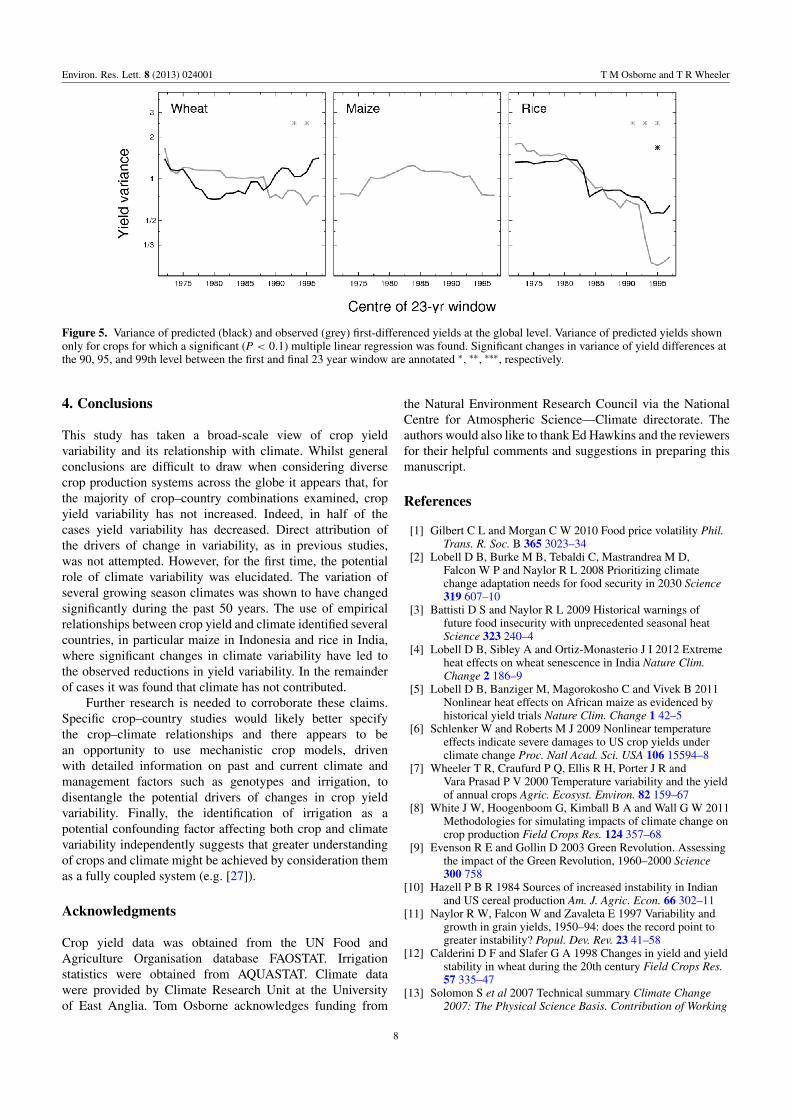
At the global scale the variability of wheat and rice yieldshave declined significantly between 1960 and 2009, whilstthe variability of maize peaked during the middle of the timeperiod (figure 5). Consideration of the observed relationshipbetween yield and climate suggests that a significant reductionin the variability of rainfall may have contributed to thereduction in rice yield variability, but that wheat yieldvariability declined despite an increase in the variability ofassociated climate.
A major caveat to the approach of attribution via thecoincidence of trends is the possible existence of externalfactors not considered which might have also changed during
Environ. Res. Lett. 8 (2013) 024001 T M Osborne and T R Wheeler
Figure 2. Variability in national-average yield for the main producers of wheat, maize and rice. Twenty three year running variance offirst-differenced yields (black) and residuals from a quadratic fit (red) normalized by the mean variance over the whole time series.Significant changes in variance at the 90, 95, and 99th level between the first and final 23 year window are annotated ∗, ∗∗, ∗∗∗, respectively.
the past 50 years and impacted upon both crop yield andclimate. One candidate for such a confounding variable isthe atmospheric concentration of CO2 which has risen inthe past 50 years, has impacted on climate as a greenhousegas, and affects crop growth via photosynthesis. However,
it is unclear how rising CO2 concentrations might havesignificantly impacted the variability of yield. As previouslydiscussed, the increased adoption of irrigation will havecontributed to the decline in yield variability by mitigatingthe impacts of drought, but it may also have contributed to
5
Environ. Res. Lett. 8 (2013) 024001 T M Osborne and T R Wheeler
Figure 3. Variability in crop growing season precipitation and temperature. Twenty three year running variance of first-differencedprecipitation (blue) and temperature (red) time series normalized by the mean variance over the whole time series. Significant changes invariance at the 90, 95, and 99th level between the first and final 23 year window are annotated ∗, ∗∗, ∗∗∗, respectively.
the observed changes in rainfall variability via changes tothe local hydrological cycle. Studies examining the role ofirrigation in altering local climate have largely focused onthe effects on temperature [24] and/or climate averages [25].Therefore, in order to discount its role as a confounding factor
greater understanding is needed of how rainfall variability hasresponded to expanding irrigation.
Finally, the use of national level monthly climateinformation raises the possibility that the relationship betweenyield and climate has not been fully captured. For instance,
6
Environ. Res. Lett. 8 (2013) 024001 T M Osborne and T R Wheeler
Figure 4. Variance of predicted (black) and observed (grey, repeated from figure 2) first-differenced yields. Results shown only forcrop–country combinations for which at least one climate variable was significantly related to yield at the 90% confidence level. Significantchanges in variance of predicted yield differences at the 90, 95, and 99th level between the first and final 23 year window are annotated∗, ∗∗, ∗∗∗, respectively. Correlation coefficient between the variance of predicted and observed yield residuals shown in bottom left-handcorner of each panel.
the use of growing season average measures of climatemay not capture the important effects of short-term climateextremes on crop yield (e.g. [6, 26]). Certainly, the inabilityto establish significant relationships in eight crop–country
combinations implies that the methodology was not suitablein all locations. Therefore, more regionalized studies mightimprove the specifications of the yield–climate relationshipsand corroborate or refute these findings.
7
Environ. Res. Lett. 8 (2013) 024001 T M Osborne and T R Wheeler
Figure 5. Variance of predicted (black) and observed (grey) first-differenced yields at the global level. Variance of predicted yields shownonly for crops for which a significant (P < 0.1) multiple linear regression was found. Significant changes in variance of yield differences atthe 90, 95, and 99th level between the first and final 23 year window are annotated ∗, ∗∗, ∗∗∗, respectively.
4. Conclusions
This study has taken a broad-scale view of crop yieldvariability and its relationship with climate. Whilst generalconclusions are difficult to draw when considering diversecrop production systems across the globe it appears that, forthe majority of crop–country combinations examined, cropyield variability has not increased. Indeed, in half of thecases yield variability has decreased. Direct attribution ofthe drivers of change in variability, as in previous studies,was not attempted. However, for the first time, the potentialrole of climate variability was elucidated. The variation ofseveral growing season climates was shown to have changedsignificantly during the past 50 years. The use of empiricalrelationships between crop yield and climate identified severalcountries, in particular maize in Indonesia and rice in India,where significant changes in climate variability have led tothe observed reductions in yield variability. In the remainderof cases it was found that climate has not contributed.
Further research is needed to corroborate these claims.Specific crop–country studies would likely better specifythe crop–climate relationships and there appears to bean opportunity to use mechanistic crop models, drivenwith detailed information on past and current climate andmanagement factors such as genotypes and irrigation, todisentangle the potential drivers of changes in crop yieldvariability. Finally, the identification of irrigation as apotential confounding factor affecting both crop and climatevariability independently suggests that greater understandingof crops and climate might be achieved by consideration themas a fully coupled system (e.g. [27]).
Acknowledgments
Crop yield data was obtained from the UN Food andAgriculture Organisation database FAOSTAT. Irrigationstatistics were obtained from AQUASTAT. Climate datawere provided by Climate Research Unit at the Universityof East Anglia. Tom Osborne acknowledges funding from
the Natural Environment Research Council via the NationalCentre for Atmospheric Science—Climate directorate. Theauthors would also like to thank Ed Hawkins and the reviewersfor their helpful comments and suggestions in preparing thismanuscript.
References
[1] Gilbert C L and Morgan C W 2010 Food price volatility Phil.Trans. R. Soc. B 365 3023–34
[2] Lobell D B, Burke M B, Tebaldi C, Mastrandrea M D,Falcon W P and Naylor R L 2008 Prioritizing climatechange adaptation needs for food security in 2030 Science319 607–10
[3] Battisti D S and Naylor R L 2009 Historical warnings offuture food insecurity with unprecedented seasonal heatScience 323 240–4
[4] Lobell D B, Sibley A and Ortiz-Monasterio J I 2012 Extremeheat effects on wheat senescence in India Nature Clim.Change 2 186–9
[5] Lobell D B, Banziger M, Magorokosho C and Vivek B 2011Nonlinear heat effects on African maize as evidenced byhistorical yield trials Nature Clim. Change 1 42–5
[6] Schlenker W and Roberts M J 2009 Nonlinear temperatureeffects indicate severe damages to US crop yields underclimate change Proc. Natl Acad. Sci. USA 106 15594–8
[7] Wheeler T R, Craufurd P Q, Ellis R H, Porter J R andVara Prasad P V 2000 Temperature variability and the yieldof annual crops Agric. Ecosyst. Environ. 82 159–67
[8] White J W, Hoogenboom G, Kimball B A and Wall G W 2011Methodologies for simulating impacts of climate change oncrop production Field Crops Res. 124 357–68
[9] Evenson R E and Gollin D 2003 Green Revolution. Assessingthe impact of the Green Revolution, 1960–2000 Science300 758
[10] Hazell P B R 1984 Sources of increased instability in Indianand US cereal production Am. J. Agric. Econ. 66 302–11
[11] Naylor R W, Falcon W and Zavaleta E 1997 Variability andgrowth in grain yields, 1950–94: does the record point togreater instability? Popul. Dev. Rev. 23 41–58
[12] Calderini D F and Slafer G A 1998 Changes in yield and yieldstability in wheat during the 20th century Field Crops Res.57 335–47
[13] Solomon S et al 2007 Technical summary Climate Change2007: The Physical Science Basis. Contribution of Working
Environ. Res. Lett. 8 (2013) 024001 T M Osborne and T R Wheeler
Group I to the Fourth Assessment Report of theIntergovernmental Panel on Climate Changeed S Solomon et al (Cambridge: Cambridge UniversityPress)
[14] Stott P A 2003 Attribution of regional-scale temperaturechanges to anthropogenic and natural causes Geophys. Res.Lett. 30 1728
[15] FAO (Food and Agriculture Organization of the UnitedNations) FAO Statistical Databases (http://faostat.fao.org)
[16] Mitchell T D and Jones P D 2005 An improved method ofconstructing a database of monthly climate observationsand associated high-resolution grids Int. J. Climatol.25 693–712
[17] Lobell D B 2013 Errors in climate datasets and their effects onstatistical crop models Agric. For. Meteorol. 170 58–66
[18] Leff B, Ramankutty N and Foley J A 2004 Geographicdistribution of major crops across the world Glob.Biogeochem. Cycles 18 GB1009
[19] USDA World Agricultural Outlook Board, US Department ofAgriculture Agricultural Handbook No. 664 Major WorldCrop Areas and Climatic Profiles (available at: www.usda.gov/oce/weather/pubs/Other/MWCACP/)
[20] Kucharik C 2006 A multidecadal trend of earlier corn plantingin the Central USA Agron. J. 98 1544–50
[21] Wang J, Wang E, Yang X, Zhang F and Tin H 2012 Increasedyield potential of wheat–maize cropping system in theNorth China Plain by climate change adaptation Clim.Change 113 1105–21
[22] FAO 1999 Irrigation in Asia in Figures (Water Report 18) (ftp://ftp.fao.org/agl/aglw/docs/wr18.pdf)
[23] Portmann F T, Siebert S and Doll P 2010MIRCA2000—global monthly irrigated and rainfed cropareas around the year 2000: a new high-resolution data setfor agricultural and hydrological modeling Glob.Biogeochem. Cycles 24 GB1011
[24] Lobell D B, Bonfils C J, Kueppers L M and Snyder M A 2008Irrigation cooling effect on temperature and heat indexextremes Geophys. Res. Lett. 35 L09705
[25] Puma M J and Cook B I 2010 Effects of irrigation on globalclimate during the 20th century J. Geophys. Res.115 D16120
[26] Hawkins E, Fricker T E, Challinor A J, Ferro C A T,Ho C K and Osborne T M 2013 Increasing influence of heatstress on French maize yields from the 1960s to the 2030sGlob. Change Biol. 19 937–47
[27] Osborne T M, Slingo J M, Lawrence D and Wheeler T R 2009Examining the interaction of growing crops with localclimate using a coupled crop–climate model J. Clim.22 1393–411