Evidence for a variable Archie porosity Evidence for a variable Archie porosity exponent exponent “ “ m m ” ” and impact on saturation and impact on saturation calculations for Mesaverde tight gas calculations for Mesaverde tight gas sandstones: Piceance, Uinta, Green River, sandstones: Piceance, Uinta, Green River, Wind River, and Powder River basins Wind River, and Powder River basins Robert M Cluff, The Discovery Group Inc. Robert M Cluff, The Discovery Group Inc. Alan P. Byrnes, Kansas Geological Survey Alan P. Byrnes, Kansas Geological Survey 1 1 1 1 presently with Chesapeake Energy presently with Chesapeake Energy Stefani Whittaker, The Discovery Group Inc. Stefani Whittaker, The Discovery Group Inc. Dan Krygowski, The Discovery Group Inc. Dan Krygowski, The Discovery Group Inc. AAPG Rocky Mountain Section meeting, Denver, Colorado AAPG Rocky Mountain Section meeting, Denver, Colorado 10 July 2008 10 July 2008
Transcript
Evidence for a variable Archie porosity Evidence for a variable Archie porosity exponent exponent ““mm”” and impact on saturation and impact on saturation
calculations for Mesaverde tight gas calculations for Mesaverde tight gas sandstones: Piceance, Uinta, Green River, sandstones: Piceance, Uinta, Green River,
Wind River, and Powder River basinsWind River, and Powder River basinsRobert M Cluff, The Discovery Group Inc.Robert M Cluff, The Discovery Group Inc.
Alan P. Byrnes, Kansas Geological SurveyAlan P. Byrnes, Kansas Geological Survey1111presently with Chesapeake Energypresently with Chesapeake Energy
Stefani Whittaker, The Discovery Group Inc.Stefani Whittaker, The Discovery Group Inc.Dan Krygowski, The Discovery Group Inc.Dan Krygowski, The Discovery Group Inc.
AAPG Rocky Mountain Section meeting, Denver, ColoradoAAPG Rocky Mountain Section meeting, Denver, Colorado10 July 200810 July 2008
US DOE Project SummaryUS DOE Project SummaryDOE Contract # DOE Contract # DEDE--FC26FC26--05NT4266005NT42660
completion date 30 June 2008completion date 30 June 2008Organizations Organizations
University of Kansas Center for Research, Inc.University of Kansas Center for Research, Inc.Kansas Geological Survey, Lawrence, KSKansas Geological Survey, Lawrence, KSThe Discovery Group Inc., Denver, COThe Discovery Group Inc., Denver, CO
Principal Investigators: Alan P. Byrnes, KGS; Principal Investigators: Alan P. Byrnes, KGS; Bob Cluff, Discovery GroupBob Cluff, Discovery Group
project website is project website is http://http://www.kgs.ku.edu/mesaverdewww.kgs.ku.edu/mesaverde
Objectives of this taskObjectives of this task
Characterize Mesaverde electrical Characterize Mesaverde electrical properties as a function of porosity and properties as a function of porosity and salinitysalinity
Archie porosity (cementation) exponent Archie porosity (cementation) exponent ““mm””Investigate behavior at low porosity end Investigate behavior at low porosity end (<6%) not previously studied(<6%) not previously studiedEvaluate excess conductivity effectsEvaluate excess conductivity effects
Methods to compute accurate Sw from Methods to compute accurate Sw from logslogs
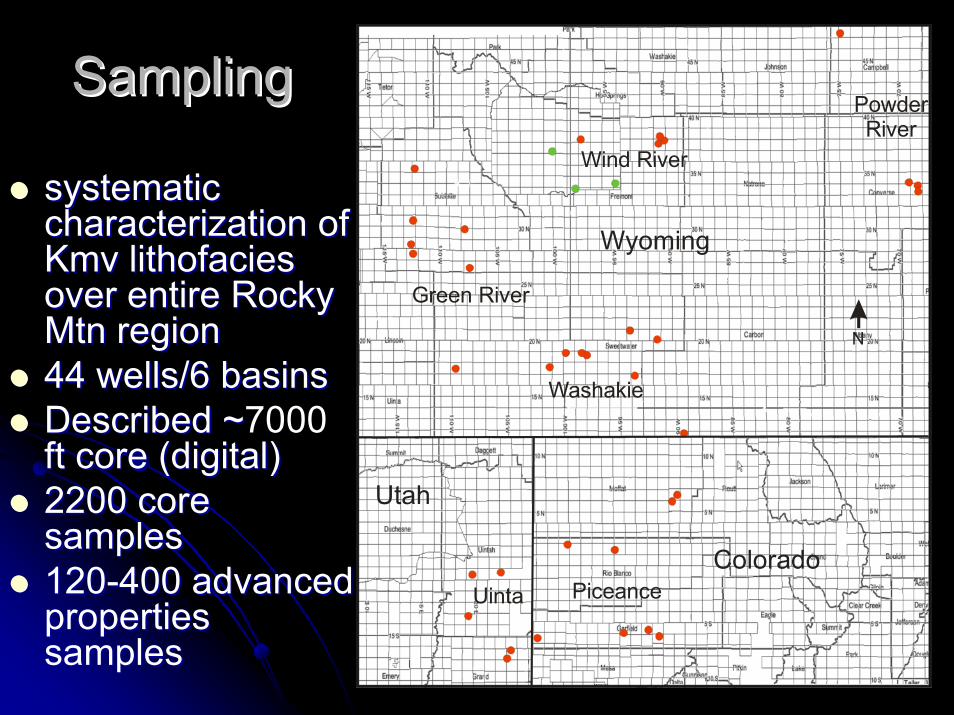
SamplingSampling
systematic systematic characterization of characterization of KmvKmv lithofacies lithofacies over entire Rocky over entire Rocky MtnMtn regionregion44 wells/6 basins44 wells/6 basinsDescribed ~Described ~7000 ft core (digital)ft core (digital)2200 core 2200 core samplessamples120120--400 advanced 400 advanced properties properties samplessamples
Green River
Wind River
Washakie
Piceance
PowderRiver
Uinta
Wyoming
Colorado
Utah
N
Permeability Permeability vsvs PorosityPorositySamples collected over a wide range of porosity and Samples collected over a wide range of porosity and permeability across 6 basinspermeability across 6 basins00--24% porosity, spanning 1 24% porosity, spanning 1 nDnD to >100 to >100 mDmD
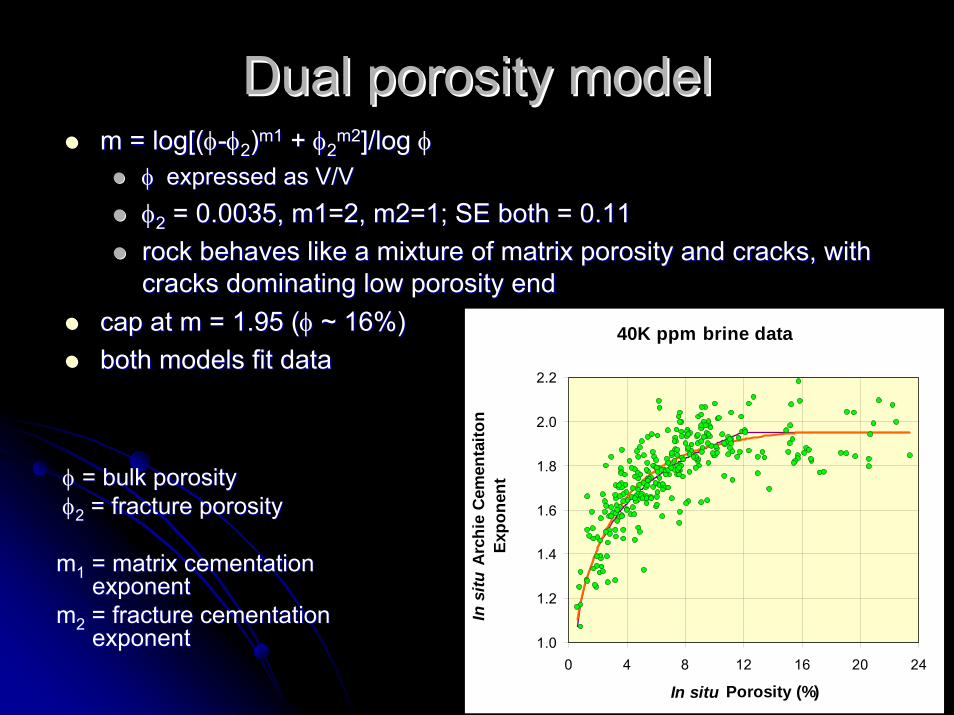
each salinity is differenteach salinity is different40Kppm dataset is largest and used for base case40Kppm dataset is largest and used for base casecap m at 1.95cap m at 1.95
m2m2]/log ]/log φφφ φ expressed as V/Vexpressed as V/Vφφ22 = 0.0035, m1=2, m2=1; SE both = 0.11= 0.0035, m1=2, m2=1; SE both = 0.11rock behaves like a mixture of matrix porosity and cracks, with rock behaves like a mixture of matrix porosity and cracks, with cracks dominating low porosity endcracks dominating low porosity end
cap at m = 1.95 (cap at m = 1.95 (φφ ~ 16%)~ 16%)both models fit data
And a third way to look at it....And a third way to look at it....Why is the minimum m ~ 1.2, instead of 1?A – for a distribution of cracks of different cross-sectional area, the largest (widest) cracks will dominate the conductivityThe high tail of the distribution determines the bulk conductivity,while the rest of the cracks act like “excess”porosity that do not participate (significantly) in the conductivity. Therefore m ↑
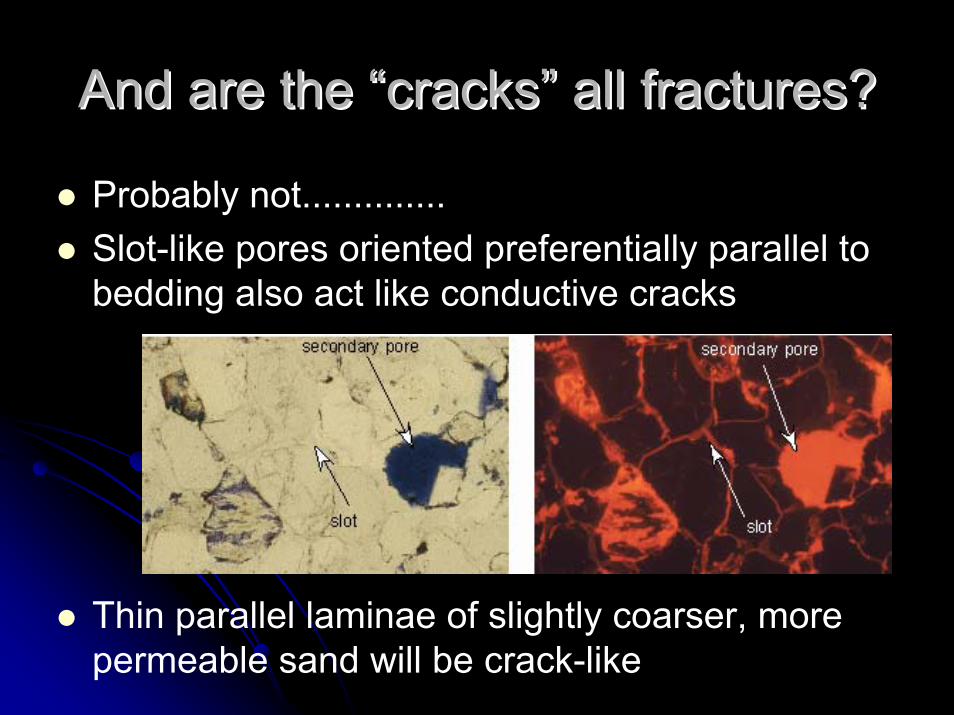
And are the And are the ““crackscracks”” all fractures?all fractures?
Probably not..............Slot-like pores oriented preferentially parallel to bedding also act like conductive cracks
Thin parallel laminae of slightly coarser, more permeable sand will be crack-like
Salinity dependence of Salinity dependence of ““mm””tested plugs with 20K, 40K, 80K, and 200K tested plugs with 20K, 40K, 80K, and 200K ppmppm brinesbrinesNearly all cores exhibit some salinity dependenceNearly all cores exhibit some salinity dependence
0.0
0.1
0.2
0.3
0.4
0.5
0.6
0.7
0.8
0.9
1.0
0 2 4 6 8 10 12 14 16 18 20 22
Brine Conductivity (mho/m)
Cor
e C
ondu
ctiv
ity (m
ho/m
)
1.0
1.1
1.2
1.3
1.4
1.5
1.6
1.7
1.8
1.9
2.0
2.1
2.2
2.3
0.01 0.1 1
Brine Resistivity (ohm-m)
In s
itu A
rchi
e C
emen
tatio
n Ex
pone
nt,
(m, A
=1)
n=335
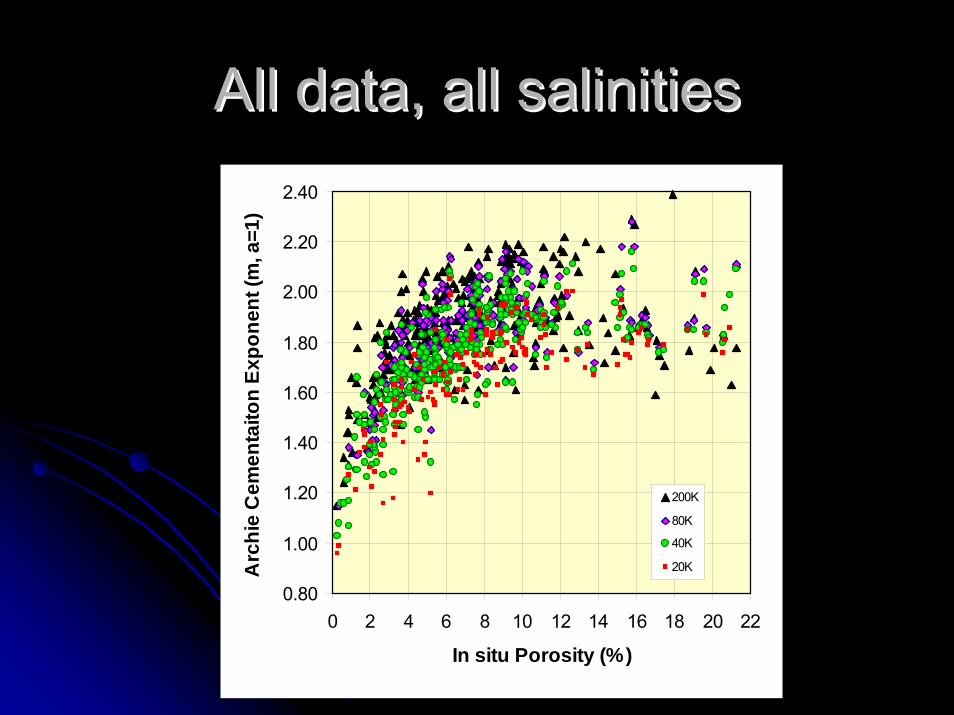
All data, all salinities All data, all salinities
0.80
1.00
1.20
1.40
1.60
1.80
2.00
2.20
2.40
0 2 4 6 8 10 12 14 16 18 20 22
In situ Porosity (%)
Arc
hie
Cem
enta
iton
Expo
nent
(m, a
=1)
200K
80K
40K
20K
Salinity dependence of Salinity dependence of ““mm””m = a log m = a log φ φ + b+ bintercept b drops with intercept b drops with decreasing salinitydecreasing salinityslope is ~ constantslope is ~ constant
20K ppm
y = 0.2267Ln(x) + 2.2979
R2 = 0.6619
0.00
0.50
1.00
1.50
2.00
2.50
0.000 0.050 0.100 0.150 0.200 0.250
insitu porosity (%)
Axis Title
Series1
Log. (Series1) 40K ppm
y = 0.2328Ln(x) + 2.409
R2 = 0.6547
0.00
0.50
1.00
1.50
2.00
2.50
3.00
0.000 0.050 0.100 0.150 0.200 0.250
insitu porosity (%)
Axis Title
Series1
Log. (Series1)
80K ppm
y = 0.2149Ln(x) + 2.4354
R2 = 0.5132
0.00
0.50
1.00
1.50
2.00
2.50
3.00
0.000 0.050 0.100 0.150 0.200 0.250
insitu porosity (%)
Axis Title
Series1
Log. (Series1)
200K ppm
y = 0.1621Ln(x) + 2.3222
R2 = 0.3633
0.00
0.50
1.00
1.50
2.00
2.50
3.00
0.000 0.050 0.100 0.150 0.200 0.250
insitu porosity (%)
Axis Title
Series1
Log. (Series1)
Simple procedure to compute SwSimple procedure to compute Sw
determine Rw @ Tf conventionallyPickett plots – focus on the lower porosity, wetter sandstonesproduced watersyour best guess.......
convert Rw to 75°F by chart lookup or Arps equation
Pickett Plot examplePickett Plot example
Rw = 0.306
pick m at low porosityend, where BVWirr ~ BVW
Williams PA 424Williams PA 424--3434Piceance basinPiceance basinKmvKmv above above ““top gastop gas””
Nominally, most of us use an m close to 2, but usually slightly less, for tight gas sand evaluations (e.g. 1.85, 1.90)Variable m that DECREASES with decreasing porosity leads to lower Sw’sTherefore, there is more gas in the tight rocks than we thought.Above 10% porosity there is very little difference
Example: Low porosity, wet zoneExample: Low porosity, wet zone
Moderate porosity, wetModerate porosity, wet
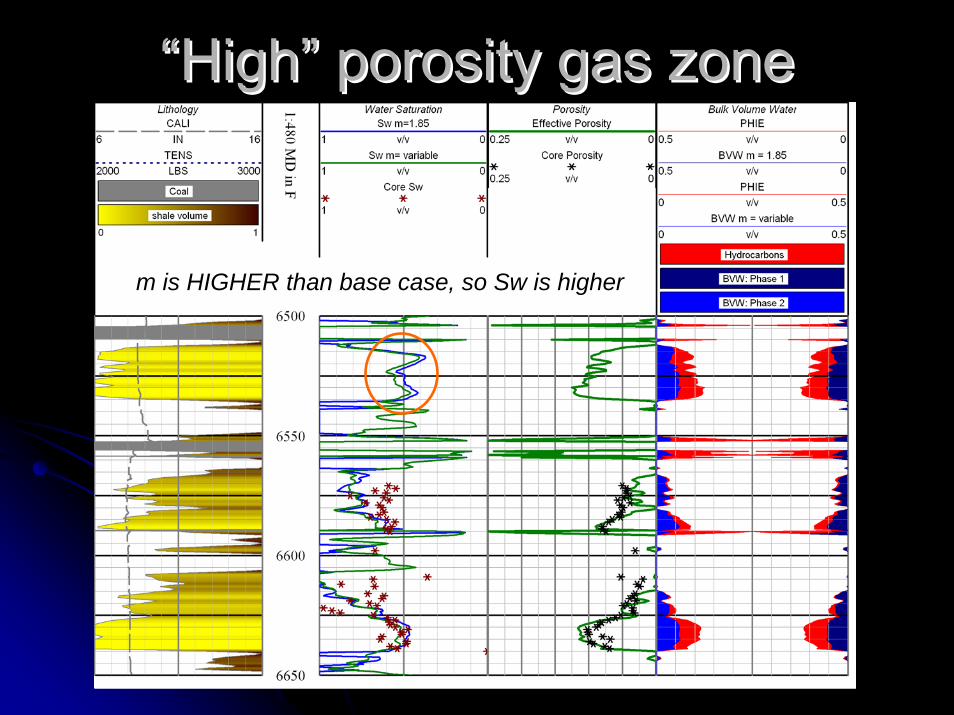
““HighHigh”” porosity gas zoneporosity gas zone
m is HIGHER than base case, so Sw is higher
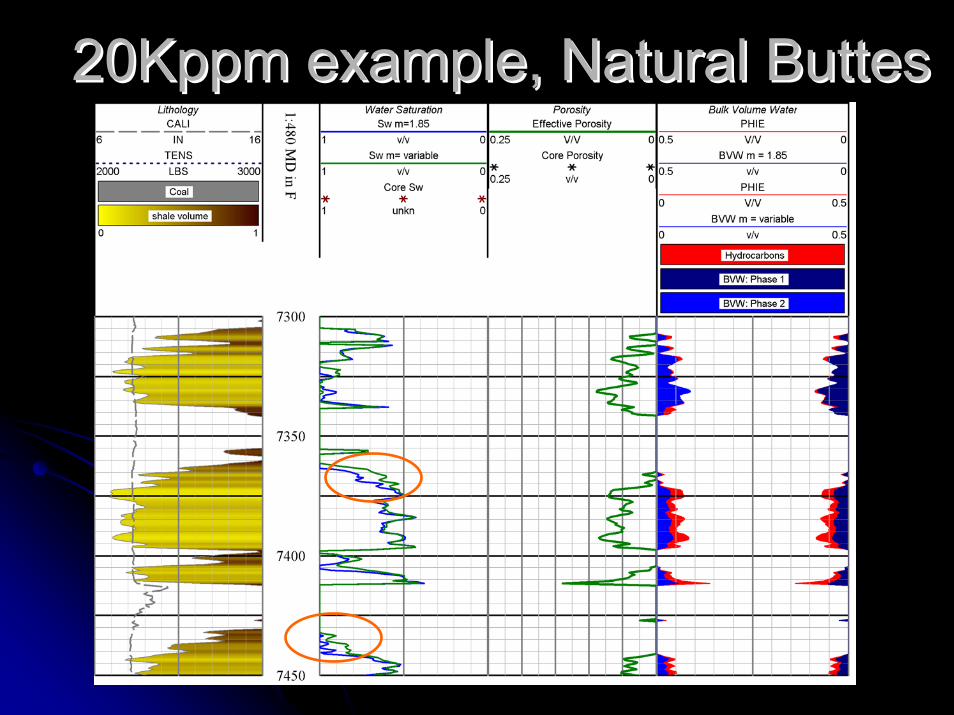
20Kppm example, Natural Buttes20Kppm example, Natural Buttes
30K 30K ppmppm example, Wamsutterexample, Wamsutter
Summary & ConclusionsSummary & Conclusions
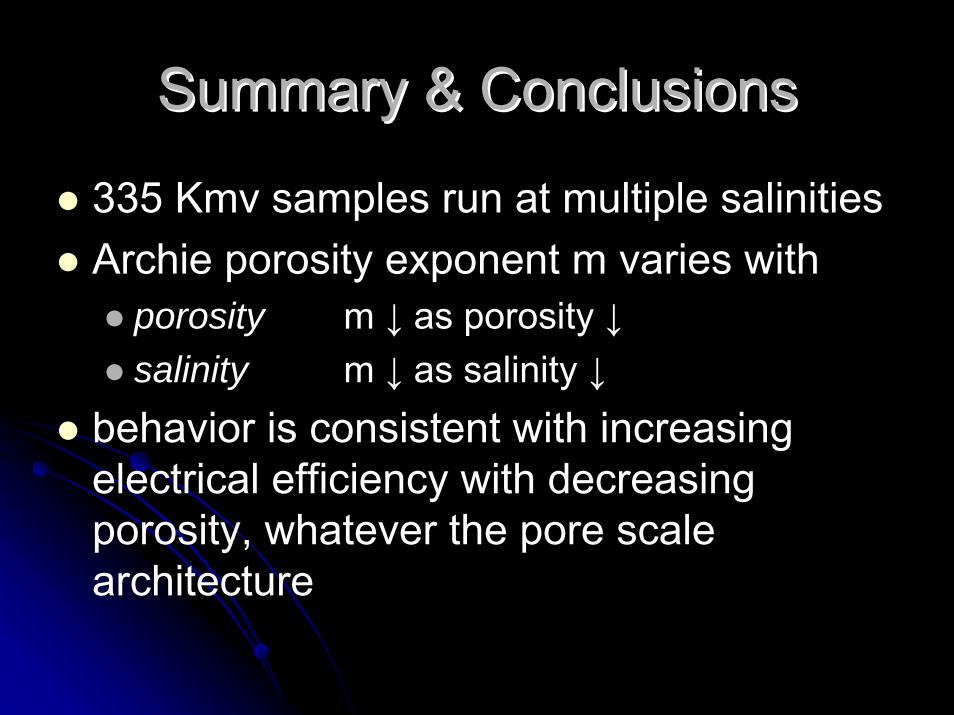
335 Kmv samples run at multiple salinitiesArchie porosity exponent m varies with
porosity m ↓ as porosity ↓salinity m ↓ as salinity ↓
behavior is consistent with increasing electrical efficiency with decreasing porosity, whatever the pore scale architecture
variable m model can be implemented with a simple equation relating m to porosity and formation water salinitym is constant above ~12% porosity at 1.95lowering m at 5-12% φ increases GIPsee no impact below ~5% porosity
BVWirr is typically 3-5%no longer calculate Sw’s >> 1Sw = 1 at low φ validates Rw


![Mineral precipitation-induced porosity reduction and its effect on … · 2017. 8. 27. · where m is a fitting factor often called the cementation exponent [14]. It has been shown](https://static.documents.pub/doc/80x56/60ae3d5d39041b51271df9f5/mineral-precipitation-induced-porosity-reduction-and-its-effect-on-2017-8-27.jpg)


