From financial to real economic crisis: Evidence from individual firm–bank relationships in Germany WP15/16 The paper is circulated for discussion purposes only, contents should be considered preliminary and are not to be quoted or reproduced without the author’s permission. September 2015 Frank M Fossen Freie Universitat Berlin, DIW and IZA Martin Simmler Oxford University Centre for Business Taxation and DIW Berlin Working paper series | 2015 Nadja Dwenger Universitat Hohenheim, CESifo
Transcript
From financial to real economic crisis:
Evidence from individual firm–bank
relationships in Germany
WP15/16
The paper is circulated for discussion purposes only, contents should be considered preliminary and are not to
be quoted or reproduced without the author’s permission.
September 2015
Frank M Fossen
Freie Universitat Berlin,
DIW and IZA
Martin Simmler
Oxford University Centre
for Business Taxation and
DIW Berlin
Working paper series | 2015
Nadja Dwenger
Universitat Hohenheim,
CESifo
From financial to real economic crisis:
Evidence from individual firm–bank relationships in Germany*
Nadja Dwenger
Universität Hohenheim,
CESifo
Frank M. Fossen†
Freie Universität Berlin,
DIW Berlin and IZA
Martin Simmler
Oxford Centre for
Business Taxation
and DIW Berlin
First version: February 14, 2015
This version: September 25, 2015
Abstract:
What began as a financial crisis in the United States in 2007–2008 quickly evolved into a
massive crisis of the global real economy. We investigate the importance of the bank lending
and firm borrowing channel in the international transmission of bank distress to the real
economy—in particular, to real investment and labor employment by nonfinancial firms. We
analyze whether and to what extent firms are able to compensate for the shortage in loan
supply by switching banks and by using other types of financing. The analysis is based on a
unique matched data set for Germany that contains firm-level financial statements for the
2004–2010 period together with the financial statements of each firm’s relationship bank(s).
We use instrumental variable estimations in first differences to eliminate firm- and bank-
specific effects. The first stage results show that banks that suffered losses due to proprietary
trading activities at the onset of the financial crisis reduced their lending more strongly than
non-affected banks. In the second stage, we find that firms whose relationship banks reduce
credit supply downsize their real investment and labor employment significantly. This effect
is larger for firms that are unable to provide much collateral. We document that firms partially
offset reduced credit supply by establishing new bank relationships, using internal funds, and
* Acknowledgments: We thank Gabriel Chodorow-Reich, Stefania Garetto, Jochen Hundsdoerfer, Raj Iyer,
Andrei Shleifer, Sascha Steffen, Jeremy Stein, Viktor Steiner, participants at the 2015 Annual Meeting of the
German Economic Association in Münster, and seminar participants at DIW Berlin, ETH Zurich, and Freie
Universität Berlin for valuable comments. Nadja Dwenger conducted part of this research as a Visiting
Researcher at Harvard University and Frank Fossen at the University of California, Santa Cruz. Both are grateful
to their host universities. Frank Fossen thanks the Fritz Thyssen Foundation for financial support of his research
visit and Nadja Dwenger the German Academic Exchange Service. We also thank DIW Berlin, LMU-ifo
Economics & Business Data Center and Oxford University for providing us with the data used in this paper.
Robert Stüber provided outstanding research assistance. † Corresponding author, address: Freie Universität Berlin, School of Business & Economics, Boltzmannstr. 20,
The 2007–2008 financial crisis led to a significant decline in economic output and left the
U.S. economy injured. In particular, the crisis caused a significant drop in aggregate
investment, resulting in a total capital stock well below its trend path (Hall 2010, 2014).
Because capital adjustment is sluggish, this shortfall in real investment during the time of
crisis has major long-term consequences for the economy, potentially impeding output and
employment for several years into the future.
There has been a vigorous debate about whether the U.S. financial crisis also propagated
to the banking sector of other countries and about the role of multinational banks in the
transmission process. Allen et al. (2012) and Popov and Udell (2012) show that the activities
of bank subsidiaries outside the United States are affected by the parent bank’s fragility, its
losses with respect to financial assets, and its reliance on interbank lending. However, because
of data restrictions, tracing these effects from the bank to the firm level was difficult. Thus,
knowledge of how the financial crisis impaired the real economy outside the United States is
still very limited. Understanding whether events such as the U.S. financial crisis affect the real
economy in other countries through the bank lending and firm borrowing channel has
important implications for both the design of financial regulation and crisis management as
well as the modeling of financial crises. In particular, it is important to understand the
implications of globalization in banking for firm investment and capital stock; a variable
through which the financial crisis has had the most enduring impact on growth of the
postcrisis economy (Hall 2014).
Thus, the goal of this paper is to understand whether a substantial shock to the financial
sector (e.g., the U.S. subprime mortgage crisis of 2007–2008) affects credit supply and firm
investment behavior in a foreign country with stable economic performance, even if the given
country’s real economy is not directly affected by the initial crisis. We dig deeper by also
studying the kinds of firms that are affected most by a potential credit rationing. For the first
time in the literature, we are able to assess whether firms are able to mitigate credit rationing
in such situations by switching banking partners, by using internal funds, or by issuing new
equity.
We address these questions by focusing on the German economy, which is ideally suited
to provide novel and substantive insights for various reasons. First, Germany did not undergo
a housing market bubble in the 2000s; unlike in the United States or other European countries,
there was no significant increase and rapid decline of German housing prices during this
2
period. Second, Germany experienced a period of stable economic performance with a record-
low level of unemployment until 2008, so we do not have to worry about negative domestic
demand effects at the beginning of the financial crisis. Third, some German banks had
significant exposure to the U.S. subprime market and were substantially affected by the
financial crisis (see, e.g., Bertaut et al. 2012). Last not least, Germany is relevant as the largest
single economy in Europe and the fifth largest economy in the world.
Our empirical strategy proceeds as follows. We exploit a unique matched database
containing firm-level financial statements for the 2004–2010 period along with the financial
statements of the bank(s) with which the given firm had a lending relationship. This enables
us to study whether banks that were affected at the onset of the financial crisis (because of
losses from proprietary trading activities) reduced lending to firms relatively more than
unaffected banks. We are able to distinguish the effect of credit supply from credit demand
using an instrumental variable (IV) approach, in which our instruments capture a bank’s
intensity of exposure to the 2007–2008 U.S. financial crisis. We then study whether a bank’s
contraction in loan supply translates into lower investment rates by the firms that have a
lending relationship with that bank, holding firms’ investment opportunities constant. The fact
that we observe each firm’s banking relationships and financial statements enables us to study
whether and how firms mitigate the shortage in loan supply by establishing new banking
relationships and by using alternative sources of financing.
Our data cover firms of all sizes, including small and medium-sized enterprises, which
are of major importance to the German economy. This broad coverage benefits our analysis in
two ways: First, the data allow us to identify the kinds of firms for which external debt and
equity are imperfect substitutes and which are thus affected most by a contraction in credit
supply.3 We explore three dimensions of firm characteristics suggested as important drivers of
firms becoming financially constrained: firm size, age (Hadlock and Pierce 2010), and
tangibility of assets (Hart and Moore 1994; Almeida and Campello 2007). Our analysis sheds
light on the role of informational asymmetries in explaining the importance of relationship
bank lending. Whether relationship lending has made German firms more vulnerable to
shocks to the banking sector in the aftermath of the U.S. financial crisis is an open question
that deserves further inquiry (Ivashina and Scharfstein 2010). Second, we can study the
various adjustment channels firms might use to mitigate credit rationing by their relationship
3 For the different reasons of imperfect capital substitutability see, e.g., Modigliani and Miller (1958), Myers
(1977), Jensen and Meckling (1976), Myers and Majluf (1984), and Jensen (1986). The relevance of imperfect
substitutability of debt and equity for firms’ investment decision is highlighted by, e.g., Fazzari et al. (1988),
Hoshi et al. (1991), Kaplan and Zingales (1997), Lamont (1997), and Rauh (2006), and for the impact of
corporate payout taxation by Becker et al. (2013).
3
banks. In particular, the wide variety of firms in our data allows us to document important
differences across firms in the ability to compensate for a loss in bank credit by switching to
other banks or resorting to internal funds and new equity.
Our analysis yields five main empirical findings. First, banks with large losses from
proprietary trading and significant exposure to the 2007–2008 U.S. financial crisis reduced
their loan supply in Germany. Thus, the U.S. financial crisis propagated to the German
economy through multinational banks. Second, a contraction in overall loan supply from a
firm’s relationship bank(s) translates into lower firm borrowing. This suggests that
relationship lending is important in Germany and cannot easily be replaced with loans from
other banks. We estimate that from 2007 to 2008, the financial crisis caused a decrease in the
growth rate in debt financing of firms by half due to relationship banks’ losses from
proprietary trading. Moreover, we find that the effects of a reduction in banks’ long term
credit supply on firms’ capital structure is even three times stronger than is the impact of a
change in banks’ overall credit supply.
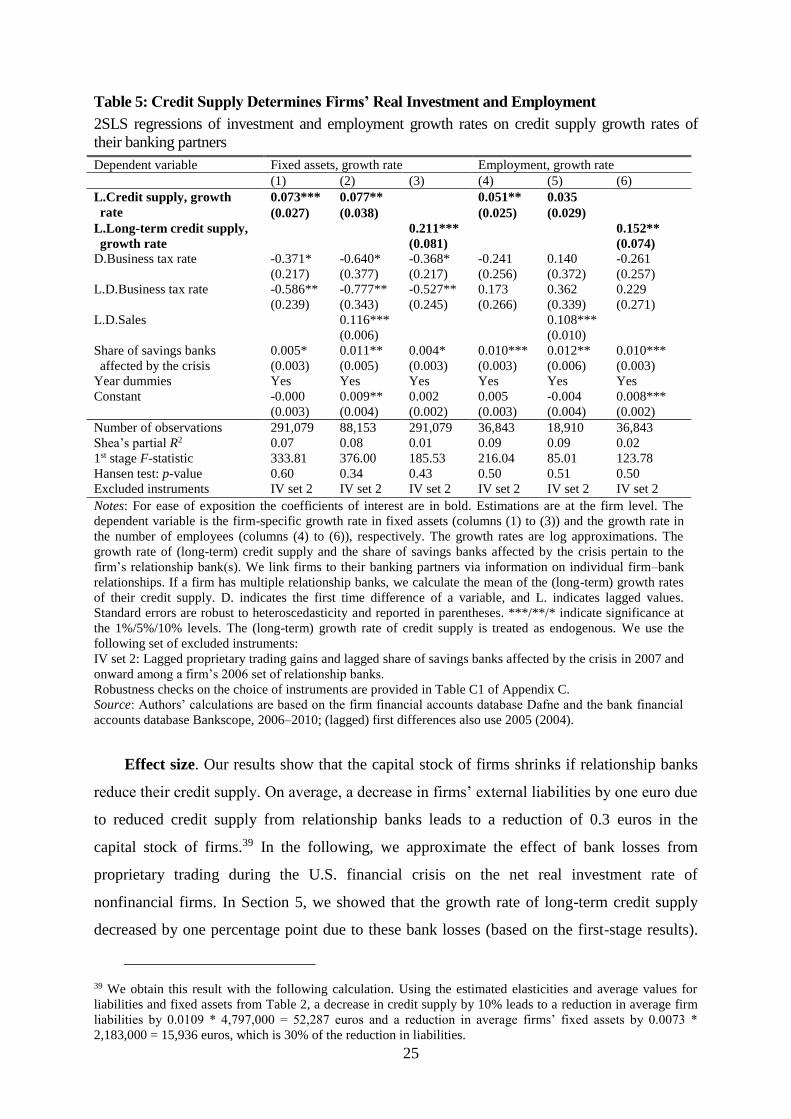
Third, firm investment rates respond to a contraction in credit supply: if firms’
relationship banks decrease their credit supply, firms have to reduce their real investment.
Because our IV approach purges any demand effects on the part of the firm from the
regression, this response shows that shocks in the financial sector transmit to the real
economy. Overall, the mean net real investment rate of nonfinancial firms in Germany
decreased by one-fifth in 2008 because of losses from proprietary trading that their
relationship banks suffered during the financial crisis. Fourth, firms with a lower tangibility of
assets are more strongly affected by a reduction of loan supply, ceteris paribus, because they
cannot provide as much collateral. Fifth, firms partly mitigate the contraction in loan supply
by establishing new bank relationships and by resorting to self-financing. More specifically,
firms are able to offset almost half of the reduction in debt financing by using their
accumulated liquid assets (this accounts for 49% of the overall adjustment), reducing dividend
payments (46%), and increasing nominal capital (5%). Firms differ in their ability to mitigate
contractions in loan supply and in the adjustment channels they use. Dividend paying firms
cut back their dividends. Large firms and firms with high asset tangibility are more likely to
establish new bank relationships, and the former are also more likely to issue new equity.
Small firms instead rely on accumulated cash. A firm’s ability to establish new bank
relationships thus appears to positively depend on the quality of information available about
the firm. Thereby, our findings speak to the question of why firms incur stricter publication
requirements and become public. All of our results are robust to specification choices.
4
Our first contribution to the literature is to show the partial substitutability of banking
partners and the ability of firms to switch between different sources of finance such as
external and internal funds. We also provide evidence for firm heterogeneity in the capacity to
compensate for a loss in loan supply. To the best of our knowledge this is the first study to
provide comprehensive micro-data evidence on this issue.4
As a second contribution, our paper adds to the nascent literature on the relationship
between banks’ securities trading and their lending behavior during a crisis (Shleifer and
Vishny 2010; Diamond and Rajan 2011; Abbassi et al. 2015). We show that banks suffering
losses from proprietary trading cut down their loan supply more heavily than other banks.
Our third contribution to the literature is in presenting evidence on the effects of the
2007–2008 financial crisis on corporate lending.5 While it is documented that banks sharply
curtailed lending to the corporate sector during the financial crisis (e.g., in the U.S. context,
see Ivashina and Scharfstein 2010; in the European context, see Popov and Udell 2012), we
show the importance of relationship lending in this transmission. Firms cannot fully offset a
contraction in credit supply from their relationship banks by switching to other banks.
As a fourth contribution we document the effects of the 2007–2008 financial crisis on the
real economy.6 Data limitations made it difficult to show that shocks to financial markets
transmit to the real economy.7 In particular, micro data for many countries are only released
with long time lags and usually contain either bank-level information on credit supply or
borrower-level information on real outcomes. A number of papers use matched loan data.8
4 In a working paper, Jensen and Johannesen (2015) provide evidence on the effects of the financial crisis on
consumer behavior and show that individuals respond to a tightening of credit by switching to banks that have
not been exposed to the crisis. 5 The financial crisis also renewed interest in the effects of monetary policy on banks’ credit supply and credit
risk-taking (see, e.g., Jiménez et al. 2012, 2014). 6 This strand of research builds on earlier papers interested in how financial shocks to banks affect their
borrowers. For example, Gan (1997) and Amiti and Weinstein (2011) exploit the bursting of the Japanese real
estate bubble, Ongena et al. (2003) examine the Norwegian bank crisis, Schnabl (2012) looks at the 1998
Russian default, and Khwaja and Mian (2008) consider how unanticipated nuclear tests in Pakistan affect bank
liquidity. Ashcraft (2005) shows that bank failures of healthy banks lead to a significant and permanent decline
in real county income within Texas but is not able to study the effect at the firm level. 7 There are several papers relating credit supply and the market evaluation of borrowers. For example, Slovin et
al. (1993) and Baur (2012) find that financial crises lead to an increased co-movement of returns between
financial sector stocks and the stocks of their borrowers, thereby providing indirect evidence that financial crises
affect the real economy. A survey of chief financial officers in the United States, Europe, and Asia suggests that
firms forewent profitable investment opportunities during the crisis as a result of binding external financial
constraints (Campello et al. 2010), while Claessens et al. (2012) do not find evidence that the 2007–2008
financial crisis affected the investment levels of firms in advanced and emerging economies. Bricongne et al.
(2012) examine the effect on international trade and find the overall impact of the financial crisis to be limited. 8 Amiti and Weinstein (2013) exploit a large sample of matched bank–firm loan data for Japan for the 1990–
2010 period. They trace loan movements back to bank, firm, industry, and common shocks, finding that bank
supply shocks explain about 40% of aggregate loan and investment fluctuations. Acharya et al. (2014)
investigate real effects of the sovereign debt crisis in Europe using a matched sample of loan and accounting
information.
5
However, loan data and loan application data have the limitation that firms expecting not to
obtain credit are discouraged from applying for credit and are thus missing in the data
(Chodorow-Reich 2014), so this approach may ignore the most troubled firms. Chodorow-
Reich (2014) addresses this problem by jointly observing employment outcomes of firms and
the financial information of their banks and finds contractions in employment by firms that
had precrisis banking relationships with less healthy lenders.
For lack of similar data on firms’ bank relationships and capital stock, previous studies
on the effects of the 2007–2008 financial crisis on investment resort to variation in firms’
financial liquidity. In particular, they exploit ex ante variation in firms’ long-term debt
maturity (Almeida et al. 2012) and variation in firms’ internal financial resources (Duchin et
al. 2010) to document adverse effects of the 2007–2008 financial crisis on corporate
investment. Our paper differs from these studies in three important dimensions: First, we
exploit a database that contains both bank-related and firm-related information. Therefore, we
can compare the investment behavior of firms that had borrowed from banks before the crisis
that were similar except for their level of affectedness from the financial crisis. Our IV
approach allows us to determine that the crisis was spread through the bank lending channel
(the causal transmission of bank health to reduced firm borrowing and investment). This is a
major advantage over prior literature in which it was difficult to separate the bank lending
channel from the firm balance-sheet channel.9 Second, we also observe unlisted, small and
medium-sized firms. Prior investment studies (e.g., Lemmon and Roberts 2010) focus on
large, public, firms that may find it easier to compensate for bank credit contraction by issuing
bonds or stocks; in addition, the investment behavior of public firms may be distorted by
short-termism (Asker et al. 2015). Third, we document that the U.S. financial crisis also
caused real effects beyond the U.S. economy, in Germany.10
We thereby also speak to the literature on the effects of the globalization of banking on
the international transmission of financial shocks (Peek and Rosengren 1997; Chava and
Purnanandam 2011). Relatively little research exists on how financial crises in one specific
country transmit to the corporate sector and the real economy in other countries (Peek and
Rosengren 2000). Our study advances this literature by showing how a large shock to the U.S.
financial markets affected real investment and employment in Germany.
9 The latter is relevant when an economic downturn devalues assets in firms’ balance sheets and thus their
collateral and creditworthiness (see the discussion in Jiménez et al. 2012). 10 Puri et al. (2011) examine the cross-border effects of the 2007–2008 U.S. financial crisis on retail bank lending
in Germany. They show that savings banks that were indirectly affected by the U.S. financial crisis through their
holdings in Federal State Banks (Landesbanken) with substantial subprime exposure rejected substantially more
loan applications than unaffected banks.
6
Finally, this paper adds to the strand of literature that examines the cash flow sensitivity
of investment of capital-constrained and capital-unconstrained firms (cf. Lamont 1997; Rauh
2006; Almeida and Campello 2007; Dell’Ariccia et al. 2008; Farre-Mensa and Ljungqvist
forthcoming). We shed light on this question from a different angle by focusing on whether
investment decisions are determined by loan supply shocks and by providing evidence on
adjustment channels used to mitigate credit supply contractions by different types of firms.
We organize the rest of this paper as follows. Section 2 discusses relevant features of the
financial system in Germany. Section 3 introduces our data, and Section 4 describes the
empirical methodology we use. Section 5 presents our empirical results on the impact of
credit supply by relationship banks on firm borrowing. Section 6 presents results on the real
economy effects: firms’ investment and employment decisions as well as heterogeneity in
responses. Section 7 explores potential adjustment channels of firms. Section 8 offers some
concluding remarks. Appendices A, B and C contain additional empirical results.
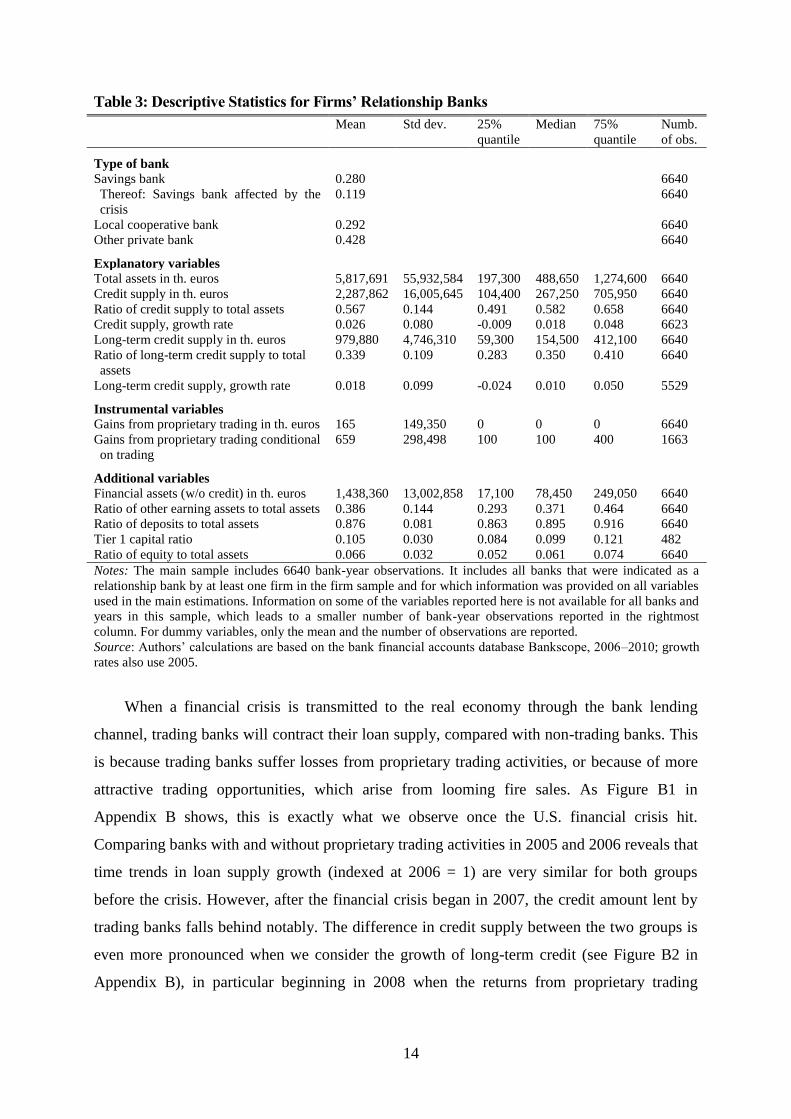
2 German banks, the U.S. financial crisis, and lending
Three features of the German financial system are central to our study: First, it is bank based
rather than capital-market based and relationship lending is important. Second, many German
banks engaged in proprietary trading activities and were affected by the U.S. financial crisis.
Third, like in other countries, banking regulation puts limits on credit supply to bank
customers on the basis of bank balance sheet indicators. In the following, we describe each of
these three institutional features in greater detail.
2.1 The predominant role of bank financing and relationship lending
In Germany, domestic banking sector assets exceeded 300% of gross domestic product (GDP)
before the financial crisis (compared with approximately 70% in the United States), thus
demonstrating the importance of banks for the German economy. In contrast, equity markets
have traditionally been less important for financing businesses: The ratio of stock market
capitalization to GDP was only about one-third (45%) of that observed in the United States
(130%) before the crisis.11 The predominant role of bank financing is also reflected in firms’
balance sheets: Bank loans account for 60% of total long-term corporate debt in Germany12
(only 20% in the United States) and represent the lion’s share of newly borrowed capital,
11 See Deutsche Börse (2003). 12 See Deutsche Bundesbank (2010), extrapolated results from financial statements of German enterprises from
1997 to 2009 (Table I).
7
while the issuance of corporate bonds plays a minor role (the share of bonds issued in newly
borrowed capital is 10%13 compared with 50% in the United States).
These differences in financing can be explained partly by the importance of small and
medium-sized enterprises in Germany (the German Mittelstand). Access to financial markets
for these firms is more limited due to their smaller size (Petersen and Rajan 1994; Harhoff and
Körting 1998). Usual information asymmetries are aggravated between small and medium-
sized firms and investors because these firms are (1) less likely to be monitored by rating
agencies; (2) younger, thus having a shorter track record; and (3) subject to weaker disclosure
requirements. All these factors increase the importance of sticky bank–borrower relationships
as a way to mitigate information asymmetries (Diamond 1991; Hoshi et al. 1991; for an
overview of the theoretical foundations, see Petersen and Rajan 1994). Therefore, German
firms have traditionally maintained stable, long-term business relationships with one (or
several) relationship bank(s) (Hausbank).14 If bank–borrower relationships matter for the
lending process, borrowers cannot easily switch banks when their relationship bank becomes
liquidity constrained (Slovin et al. 1993). While banking relationships remain important
during a financial crisis, sticky bank–borrower relationships make firms vulnerable if their
particular relationship banks get into distress (Sette and Gobbi 2015).
2.2 German banks engaged in trading and were affected by the U.S. financial crisis
Most German banks are universal banks, i.e., they are active as both commercial and
investment banks (in addition to providing insurance and other financial services). Universal
banks in Germany account for 97% of all institutions and 75% of assets (Hüfner 2010). The
combination of different banking activities under one roof makes the lending activities of
German banks particularly susceptible to liquidity and equity shocks from investment
activities.
The German banking system is highly fragmented. There are three kinds of banks (“three
pillars”): public sector banks, local cooperative banks, and private banks. All these banks
usually operate as universal banks and many of them engage in proprietary trading. Some
specifics of public sector banks are important for our analysis. They include savings banks
(owned by municipalities)15 and Federal State Banks (Landesbanken, which are owned by the
13 See Deutsche Börse (2001). 14 Puri and Rocholl (2008) and Puri et al. (2013) provide evidence on the importance of retail banking
relationships in Germany. 15 Six (out of 431) savings banks are not owned by municipalities: Bordesholmer Sparkasse AG, Die Sparkasse
Bremen AG, Hamburger Sparkasse AG, Sparkasse zu Lübeck AG, Sparkasse Mittelholstein AG, and Sparkasse
Westholstein.
8
regional savings banks and by the federal state in which they are located).16 Federal State
Banks act as a central institution for the regional savings banks (e.g., financing infrastructure
projects) and as main bank for the federal state in which they are located. Together, public
banks accounted for approximately 40% of total assets before the crisis.17
The importance of the aforementioned roles as a public institution, however, has tapered
off, and Federal State Banks have increasingly operated on an international scale (Puri et al.
2011). These business operations are backed up by the public founding entities, which have
guaranteed that the bank can meet its financial obligations at all times (by providing liquidity
support and capital injections if needed). Among several Federal State Banks, the guarantees
have caused excessive risk taking and significant exposure to international financial risks.
German banks were severely hit at the onset of the U.S. financial crisis because they had
invested heavily in structured credit products in the United States. Columns (2) and (3) in
Table 1 show the investment of selected German banks in toxic conduit- and special
investment vehicle–financed assets before the crisis. In total, the investment of German banks
in toxic assets was estimated to be 230 billion euros (Hüfner 2010). These investments led to
significant write-downs of several billions of euros in 2007 and 2008 (see column (4) of Table
1). According to Bloomberg18, 7% of global write-downs on such assets between 2007 and
2009 can be attributed to German banks.19
The write-downs over the course of the U.S. financial crisis significantly burdened the
result of banks’ proprietary trading activities and caused massive problems for several
German banks. As such, the U.S. financial crisis directly affected banks’ financial scope for
supplying credit to customers. Furthermore, several private banks and Federal State Banks
needed to be rescued by owner or government interventions to prevent default. Because the
affected Federal State Banks are partly owned by savings banks, which had to make
guarantees or equity injections, the write-downs in the wake of the crisis also indirectly
narrowed the financial scope for some of the savings banks.
In addition, firm lending also became less attractive to healthy banks due to potentially
high returns from investment in fire sales. Anticipating a potential fire sale, banks with
liquidity and with the ability to identify attractive trading opportunities thus had an incentive
16 Savings banks also offer universal services but are limited in their regional lending activity to the municipality
in which they are located (“regional principle”). Their legal mandate is not to maximize profits but rather to
provide financial services to their region and to strengthen competition in the banking sector. 17 World Bank Financial Regulation Database, values for 2005. 18 Values from Bloomberg series WDCI. 19 In 2010, German banks’ portfolios still contained substantial amounts of structured products (total of more
than 200 billion euros; Deutsche Bundesbank 2010).
9
to reduce credit supply on their part (Vishny and Shleifer 2010; Diamond and Rajan 2011;
Abbassi et al. 2015).20
Table 1: Exposure of Selected German Banks to U.S. Structured Credit Products
Ownership Conduit- and special
investment vehicle–financed
assets before the crisis
Asset write-
downs 2007-
08
… in % of
capital
… in % of
assets
… in bn. US$
(1) (2) (3) (4)
Sachsen LB Public (Federal State Bank) 1126 30.3 2.5
WestLB Public (Federal State Bank) 542 12.7 4.6
IKB Deutsche
Industriebank AG
Private 494 20.5 14.8
Dresdner Bank AG Private 364 9.9 3.9
Landesbank Berlin Public (Federal State Bank) 179 2.2 unknown
Bayern LB Public (Federal State Bank) 170 5.1 6.9
HSH Nordbank Public (Federal State Bank) 126 4 3.5
Deutsche Bank AG Private 114 3.3 10.4
HypoVereinsbank AG Private 105 6.6 unknown
Nord LB Public (Federal State Bank) 89 2.9 unknown
Commerzbank AG Private 85 2.2 2.3
Helaba Public (Federal State Bank) 68 1.1 unknown
DZ-Bank AG Co-operative 61 1.3 2.6
LB Baden-Württemberg Public (Federal State Bank) 59 1.7 4.7
KfW Public 58 2.6 unknown
Notes: Comparability is limited by different dates and varying definitions.
Source: See Hüfner (2010), Table 1 (which is based on Fitch Ratings (2007), “ABCP Concerns Trigger
Liquidity Issues for German Banks,” Germany Special Report, August) and Onaran/Pierson, Bloomberg,
September 29, 2008 (http://www.bloomberg.com/apps/news?pid=newsarchive&sid=aSlW.imTKzY8, last
accessed on April 13, 2015).
2.3 Banking regulation sets limits to money creation and credit supply
The Eurosystem and banking regulation set certain limits on bank money creation and credit
supply by banks. First, the European Central Bank (ECB) requires credit institutions to hold
compulsory deposits on accounts with the national central banks.21 Second, banking
regulation requires a bank to hold a certain amount of equity capital for every credit risk or
other risk it takes.22 The regulations imply that banks suffering losses may not be able to
20 For our IV strategy, we rely on a non-zero correlation of gains and losses from proprietary trading with credit
supply to firms, but we do not require assumptions about the specific nature of this correlation. 21 In the period of the current analysis, the minimum reserve requirement was 2% of the sight deposits that
nonbanks hold at a bank. Thus, banks cannot lend more than 50 times the amount they hold as central bank
money. To obtain central bank money in central bank credit operations, banks have to provide collateral. During
the financial crisis, the ECB extended the range of assets it accepted as collateral several times to sustain
liquidity in the financial market (European Central Bank 2013). 22 According to the rules of the Basel I accord, which were in place through the end of 2006, credit lent to
business customers had to be backed by 8% equity capital. Since 2007, according to the refined rules of the Basel
II accord, the 8% equity capital requirement is weighted by the default risk of the credit (i.e., the
creditworthiness of the customer). Subsequently, the financial crisis led to the development of stricter
regulations. According to the “Basel 2.5” rules of 2009, certain securities have to be backed by more equity
capital than before. Since 2014, after the period of this analysis, the Basel III accord requires banks to provide
provide further credit if their equity falls below the capital adequacy requirement. Even if the
equity is still above the threshold, internal risk management may induce banks to restrict
lending when losses occur because the smaller equity buffer implies a larger risk of falling
below the threshold in the future. In the case of universal banks active in both proprietary
trading and commercial banking, large losses from proprietary trading may thus spill over
through the impact to the common equity base, resulting in a reduction of their commercial
lending activity.23
3 Individual matched firm and bank panel data
3.1 Linking bank and firm data via individual bank relationships
Our database consists of financial statements of nonfinancial German firms linked with the
financial statements of each firms’ relationship bank(s). Both data sources are provided by
Bureau van Dijk. Dafne, the financial statements database of nonfinancial firms, includes
information for the 2004–2010 period, and since 2006, it covers more than 85% of all
incorporated firms in Germany, the majority of which are unlisted.24 Because small firms are
not required to publish their income statements, sales and profit information are only available
for a subsample.25 Besides the unconsolidated balance sheet and income statements, the
database includes further information such as the set of bank(s) a firm reports as its
relationship bank(s). We observe the names and bank identification codes of the relationship
banks but not the amount borrowed from them. All this information is updated regularly,
usually at the end of the financial year.
Using the identification codes of the relationship banks, we merge unconsolidated
financial statements of each relationship bank with each single firm. The bank financial
statements stem from the Bankscope database of banks active in Germany from 2004 to
generally more equity capital and has also introduced new liquidity standards (for details on the Basel
regulations, see, e.g., Blundell-Wignall and Atkinson 2010). The overall Tier 1 capital ratio must not fall below
4%. 23 More than 99.9% of the firms and banks in our sample publish their financial statements according to the
German Commercial Code (HGB). Because we use gains and losses from proprietary trading as reported in the
income statement according to the German Commercial Code, these gains and losses affect regulatory capital. In
contrast to the German Commercial Code, according to US-GAAP or IFRS, losses from the valuation of
available for sale-securities would usually belong to Other Comprehensive Income (cf. Lachnit 2005). 24 The coverage of financial statements of incorporated firms is very high due to strict publication requirements. 25 According to Art. 267 of the German Commercial Code valid until 2008 (since 2009), small firms fulfill at
least two of the following three conditions: (1) total assets do not exceed 4.015 (4.84) million euros, (2) sales do
not exceed 8.03 (9.68) million euros, and/or (3) the number of employees is equal to or less than 50.
11
2010.26 It includes balance sheets and income statements as well as information on ownership,
affiliated companies, and branches. A comparison with the German Bank Statistics provided
by the German Central Bank shows that Bankscope covers, on average, 83% of all banks in
Germany over this period.27
3.2 Firm and bank characteristics and time trends
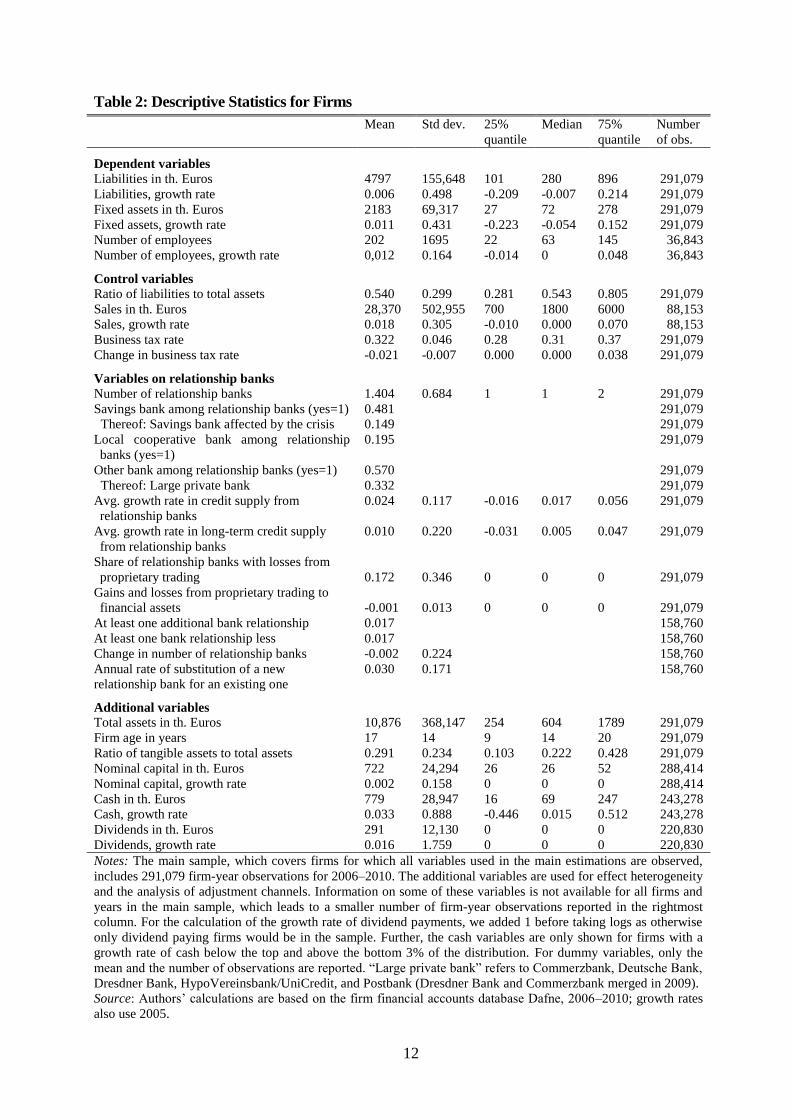
Firm characteristics. Table 2 shows descriptive statistics for the firms in our sample. The
average firm has a balance sheet total (total assets) of 10.9 million euros, fixed assets of 2.2
million euros, and liabilities of 4.8 million euros.28 The annual growth rates of fixed assets
and liabilities are, on average, 1.1% and 0.6%, respectively, and exhibit substantial variation
between and within firms. Based on the smaller sample of firms for which sales information is
available, the average turnover amounts to 28 million euros, with an average annual growth of
1.8%.
The firms in our sample have, on average, 1.4 relationship banks. Almost half of the
firms have at least one savings bank as a banking partner, 20% have a local cooperative bank,
and 33% have one of the large private banks.
Of the firms in our sample, 1.7% establish an additional bank relationship in a given year,
and about the same percentage terminate an existing bank partnership, such that the average
change in the number of relationship banks is close to zero. Altogether, 3% of firms swap a
relationship bank for another in any given year, keeping the number of relationship banks
constant. Overall, these descriptive statistics suggest that firm–bank relationships are stable
over time, presumably because establishing a new banking relationship is costly for firms, as
it involves developing a reputation for nonopportunistic behavior to counteract informational
asymmetries (Harhoff and Körting 1998).
26 The data also include subsidiaries of foreign banks but excludes branches of foreign banks. Fillat et al. (2015)
shed light on the question how branches and subsidiaries differ in their response to regulation and in the
diffusion of financial shocks. 27 Our estimations focus on the period from 2006 to 2010. Because our regressions are based on first differences
(see Section 4.1) and include lagged control variables in first differences, we exploit data from 2004 to 2010. Our
raw sample of firms with at least three consecutive years of observations includes approximately 900,000 firm-
year observations. We drop the smallest firms with total assets worth less than 10,000 euros (US$ 6960 on
January 1, 2010) as well as firms in the real estate industry because these firms might be directly affected by the
subprime market crisis in the United States. For 507,457 of the 699,104 firm-year observations left after applying
this first sample restriction, we are able to match bank statements for all relationship banks at least from 2007
and onward. Our last sampling step concerns the availability of information on long-term lending by all
relationship banks of a firm, which leaves us with 291,079 firm-year observations in the final sample. From the
1700 banks, on average, in Bankscope per year, almost 90% have a lending relationship with at least one firm
covered in our final sample. For approximately 70% of the banks covered in Bankscope, we also observe
information on long-term lending. 28 For both the growth rates of fixed assets and liabilities, we exclude the bottom and top 1% from the sample to
avoid a situation in which outliers drive the estimated coefficients. Regarding the number of employees, we only
include firms with more than 5 employees in the analysis.
12
Table 2: Descriptive Statistics for Firms
Mean Std dev. 25%
quantile
Median 75%
quantile
Number
of obs.
Dependent variables
Liabilities in th. Euros 4797 155,648 101 280 896 291,079
where i indicates firms, t indicates years, and bold letters indicate vectors. In the main
estimations, the outcome variable yit is one of the following: i.) a firm’s amount of liabilities;31
ii.) a firm’s stock of fixed assets (book values); or iii.) a firm’s number of employees. We
define the main explanatory variable credit supplyit as the book value of all loans that a firm’s
relationship banks grant to their customers (excluding inter-bank credits). We also include the
first time lag of credit supplyit in the model to account for possible dynamic effects.
The coefficients 1 and 2 are of primary interest. If consistently estimated, they can be
interpreted as elasticities, and 1, 2 > 0 imply that a reduction in the amount of credit
supplied by a firm’s relationship bank(s) reduces the firm’s outcome variable yit. The
contemporaneous and lagged growth rates of credit supplyit are endogenous, and we apply an
IV approach to consistently estimate the coefficients, as we explain in the following
subsection.
The vector of time-varying control variables xit includes the tax rate on business profits
and its first time lag to account for possibly dynamic effects of taxation on investment. As we
mention in Section 3.2, there is substantial time-series and regional variation in the tax rate,
which makes it a potentially important control variable. In robustness checks based on a
subsample, xit additionally includes a firm’s total value of sales as a measure of firm size
31 Our notion of liabilities does not include pension commitments, which play a minor role in Germany because
of the statutory pension insurance system. It does contain non-interest bearing liabilities such as trade payables.
17
(income statements and thus sales are available for less than one-third of the firms in our main
sample).
Time-invariant observable characteristics are collected in the vector wi. This vector
includes the shares of two specific bank types in an individual firm’s set of banking partners
in 2006. Specifically, this is the share of savings banks that were financially affected by the
crisis (due to the capital injections they needed to provide to their Federal State Banks) and
the share of banks with U.S. affiliates. We discuss this further below when we introduce our
instrumental variables. We control for linear time trends that may differ by the values of these
time-invariant firm characteristics by including interactions of t and wi. Furthermore, we
account for time effects t that are common to all firms to pick up business cycle effects.
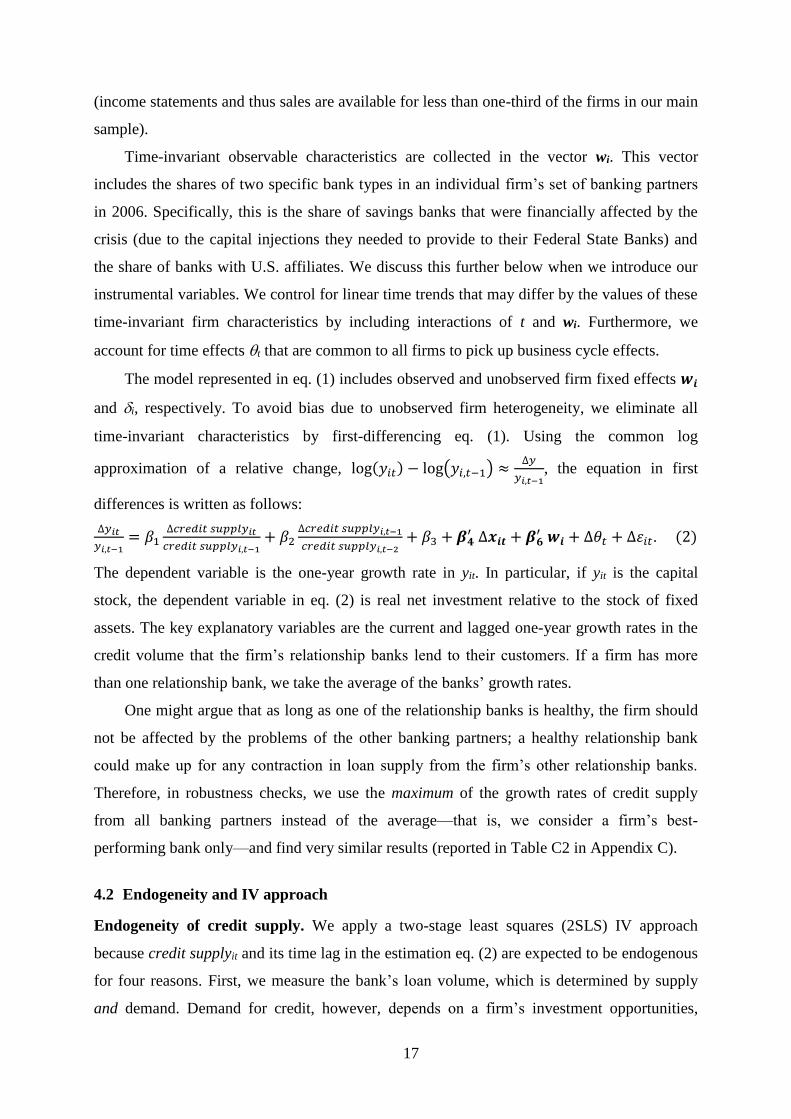
The model represented in eq. (1) includes observed and unobserved firm fixed effects 𝒘𝒊
and i, respectively. To avoid bias due to unobserved firm heterogeneity, we eliminate all
time-invariant characteristics by first-differencing eq. (1). Using the common log
approximation of a relative change, log(𝑦𝑖𝑡) − log(𝑦𝑖,𝑡−1) ≈∆𝑦
𝑦𝑖,𝑡−1, the equation in first
differences is written as follows:
∆𝑦𝑖𝑡
𝑦𝑖,𝑡−1= 𝛽1
∆𝑐𝑟𝑒𝑑𝑖𝑡 𝑠𝑢𝑝𝑝𝑙𝑦𝑖𝑡
𝑐𝑟𝑒𝑑𝑖𝑡 𝑠𝑢𝑝𝑝𝑙𝑦𝑖,𝑡−1+ 𝛽2
∆𝑐𝑟𝑒𝑑𝑖𝑡 𝑠𝑢𝑝𝑝𝑙𝑦𝑖,𝑡−1
𝑐𝑟𝑒𝑑𝑖𝑡 𝑠𝑢𝑝𝑝𝑙𝑦𝑖,𝑡−2+ 𝛽3 + 𝜷𝟒
′ ∆𝒙𝒊𝒕 + 𝜷𝟔′ 𝒘𝒊 + ∆𝜃𝑡 + ∆휀𝑖𝑡. (2)
The dependent variable is the one-year growth rate in yit. In particular, if yit is the capital
stock, the dependent variable in eq. (2) is real net investment relative to the stock of fixed
assets. The key explanatory variables are the current and lagged one-year growth rates in the
credit volume that the firm’s relationship banks lend to their customers. If a firm has more
than one relationship bank, we take the average of the banks’ growth rates.
One might argue that as long as one of the relationship banks is healthy, the firm should
not be affected by the problems of the other banking partners; a healthy relationship bank
could make up for any contraction in loan supply from the firm’s other relationship banks.
Therefore, in robustness checks, we use the maximum of the growth rates of credit supply
from all banking partners instead of the average—that is, we consider a firm’s best-
performing bank only—and find very similar results (reported in Table C2 in Appendix C).
4.2 Endogeneity and IV approach
Endogeneity of credit supply. We apply a two-stage least squares (2SLS) IV approach
because credit supplyit and its time lag in the estimation eq. (2) are expected to be endogenous
for four reasons. First, we measure the bank’s loan volume, which is determined by supply
and demand. Demand for credit, however, depends on a firm’s investment opportunities,
18
which are likely reduced during the crisis. Thus, we would expect positive coefficients in an
ordinary least squares regression even if there was no causal effect of credit supply, e.g., on
the firms’ capital stock. To isolate the supply effect from the demand effect, we require supply
shifters as IVs, which are correlated with the bank’s credit supply but are independent from
credit demand.
Second, we do not observe the growth rate of the loans a bank grants to a specific firm
but rather the growth rate of the bank’s total loans supplied to all its customers. This
corresponds to the growth rate of loans granted to a specific firm measured with error. The IV
method econometrically accounts for measurement error.
Third, we aim to identify the bank lending channel—that is, the causal transmission from
bank credit supply to reduced firm borrowing and investment—isolated from the firm balance
sheet channel. The firm balance sheet channel describes reduced credit flow due to a
devaluation of a firm’s assets and, thus, of the collateral the firm can provide. Prior literature
finds it difficult to separate the channels because bank distress and devaluation of firms’
assets often occur simultaneously in an economic downturn. We thus require instruments that
are related to the bank’s credit supply and independent of the balance sheets of the firms.
Fourth, firms may change their relationship banks because they do not obtain the desired
credit from their initial banking partners. This endogenously changes the explanatory variable
of interest, namely, the credit supply of the current relationship banks. Therefore, we require
instruments that are independent of changes in the firm-specific set of relationship banks.
Gains and losses from proprietary trading as IV. Our first excluded instrument is the
amount of gains and losses from proprietary trading of the banks that the firm had a banking
relationship with in 2006 (before the crisis), normalized by financial assets (excluding credit
supplied).32 We consider the average value of all banking partners if a firm has more than one
relationship bank. We expect the two requirements for the validity of the IV to hold, relevance
and exogeneity. First, the IV likely explains a bank’s lending behavior (relevance): Banks
suffering losses from proprietary trading experience a decline in their equity and are,
consequently, likely to reduce lending (see Sections 2.3 and 3.2). We measure the strength of
the IV in first-stage regressions, in which we empirically explore the relationship between
proprietary trading gains and lending.
32 To avoid endogeneity from firms changing their relationship banks, we fix the firm-specific set of relationship
banks as observed in 2006 (before the U.S. financial crisis hit) for all subsequent years when we construct the
IVs. Thus, changes in the set of banking partners do not affect the instruments. If the information on the
relationship banks is missing for a firm in 2006, we use the information from 2007 instead.
19
Second, the assumption that a bank’s gains and losses from proprietary trading are
exogenous to the firm and can be excluded from the firm’s borrowing, investment and
employment equations, controlling for credit supply, is highly plausible (exogeneity
assumption). Gains and losses from proprietary trading are independent of a bank’s
customers’ business, by definition: Proprietary trading activities are defined as the financial
trading activities that a bank conducts on its own account with the aim of generating profits
and that are unrelated to business with its customers. Especially in the context of the
unexpected and sudden financial crisis, a specific bank’s losses from proprietary trading in
securities in the U.S. are clearly unrelated to their specific German firm customers’ business.
Nevertheless, exogeneity of this instrument could be compromised if the changes in a
firm’s outcome variables differed between firms with trading and nontrading relationship
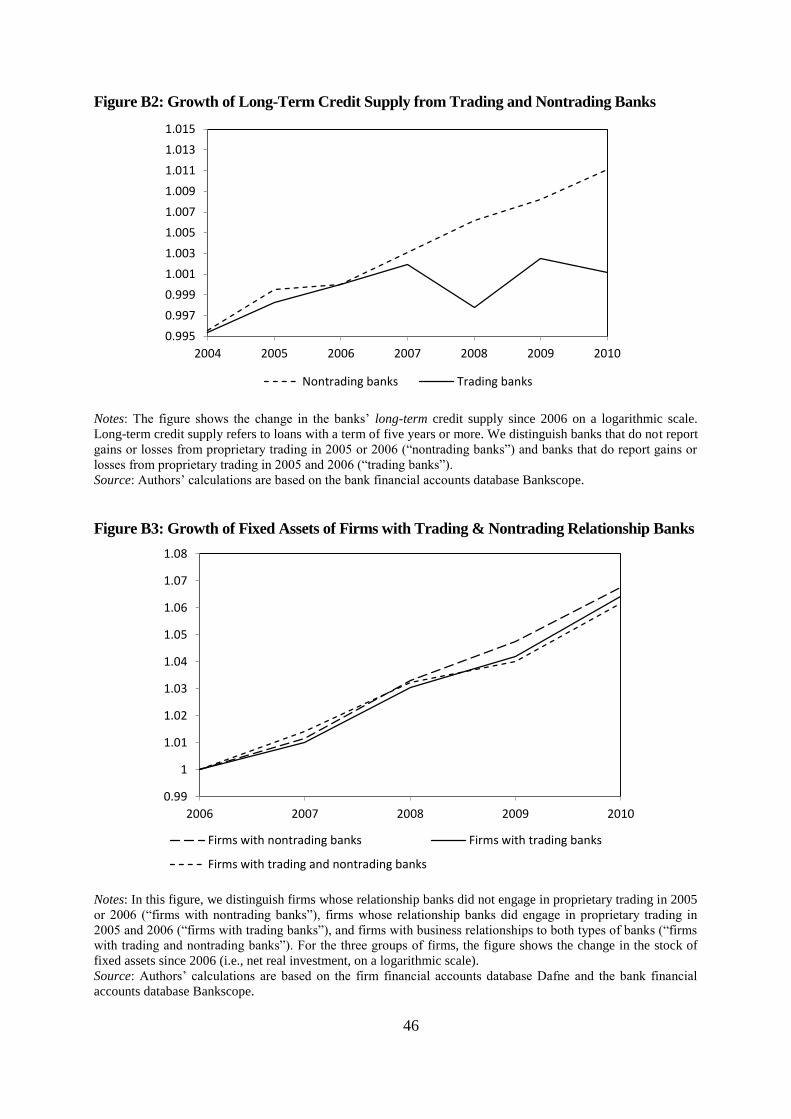
banks for reasons other than the change in credit supply. However, Appendix B shows that
precrisis trends in overall credit (Figure B1) and long-term credit (Figure B2) were similar for
the two types of banks, and investment trends by firm customers of the two types of banks
were also similar before the crisis (Figure B3). This suggests that there is no systematic
difference between the two types of banks from the perspective of the firm customers apart
from the asymmetric shock to credit supply during the financial crisis that we exploit.
Furthermore, descriptive statistics show that the industry compositions of the firm customers
of trading and non-trading banks are similar.33,34
In summary, there is no reason to expect a bank’s gains and losses from proprietary
trading activities to directly influence firms’ investment and employment decisions; we only
expect an indirect effect through the bank lending and firm borrowing channel that we are
explicitly modelling. Thus, proprietary trading gains of banks are exogenous from the
viewpoint of individual firms, so the exclusion restriction required for the IV approach holds.
Affected savings banks as second IV. As a second excluded instrument, we adopt Puri
et al.’s (2011) idea and exploit the notion that certain savings banks were affected by the
33 On average, trading banks are larger than nontrading banks (see Table A1 in Appendix A). This is due to a
small number of very large private banks among the trading banks. To assess whether certain types of firms
select certain types of banking partners, we report firm characteristics by bank type in Table A2. Trading banks
have larger firm customers on average, which is due to a selection of large firms to large banks. Apart from
average firm size, however, firm characteristics across types of banking partners are very similar, for example, in
terms of the industry composition. Moreover, not only large private banks, but also significant numbers of saving
banks and local cooperative banks engage in proprietary trading (see Table A1). Also note that any differences in
the levels of the outcome variables between customers of trading and nontrading banks leave our estimation
results unaffected as they are controlled by first-differencing. 34 Furthermore, the isolation of the bank lending channel from the firm balance sheet channel through our IV
approach would fail if firms invested in similar financial assets as their relationship banks in their proprietary
trading activities because shocks to a firm’s value of assets would be correlated with its banks’ trading losses.
However, this is highly unlikely because structured credit market products such as collateralized debt obligations
were predominantly held by banks, insurance companies, mutual funds, and investment trusts, not by firms.
20
financial crisis while other savings banks were not. The affected savings banks have
substantial holdings in certain Federal State Banks, which had significant exposure to the U.S.
subprime market and were deeply impacted by the financial crisis.35 As discussed in Section
2.2, the affected savings banks had to make guarantees or equity injections into the distressed
Federal State Banks, which reduced their willingness and ability to lend to business
customers. Following Puri et al. (2011), we identify these savings banks by their location in
the same federal state as the affected Federal State Banks. We compute the share of affected
savings banks in a firm’s set of relationship banks in 2006, before the crisis hit. Although we
fix this variable to a precrisis year, the initial choice of relationship banks might be
nonrandom, so we include this characteristic in the vector of time-invariant controls wi. The
excluded IV is an interaction of this characteristic with a dummy variable indicating the
period starting in 2007, when we expect the financial crisis to have affected the savings banks
(cf. Puri et al. 2011). Thus, identification in the IV approach only exploits the changed
lending behavior of the affected savings banks during the crisis.36 This second IV adds
information to the first IV because the indirect exposure of the savings banks to the financial
crisis through their holdings in Federal States Banks does not appear in the gains and losses
from their proprietary trading.
The availability of two excluded IVs for one endogenous explanatory variable allows us
to test statistically whether the IV is valid under the assumption that the other IV is
uncorrelated with the error term (overidentification test). The test is passed in all
specifications, which suggests that the excluded instruments are indeed exogenous.
Robustness checks. Another candidate for an excluded IV is the share of banks in a
firm’s 2006 set of relationship banks that have subsidiaries or branches in the United States,
where the financial crisis originated. These banks are likely to be exposed to the financial
crisis through their U.S. affiliates. Again, we acknowledge the initial choice of such a bank as
a relationship bank as potentially nonrandom and thus include their share in the vector of
time-invariant controls wit whenever we use the additional IV. The IV is an interaction of this
share with a year dummy for 2008, the climax of the banking crisis in the United States
(Lehman Brothers collapsed in fall 2008). Unfortunately, our bank data only provide
information on affiliates for 2012; we assume that a bank’s structure of affiliates in earlier
years corresponds with that observed in 2012, which implies some measurement error.
35 The affected Federal State Banks are Bayern LB, Sachsen LB (acquired by Landesbank Baden-Württemberg
in 2008), and West LB (Puri et al. 2011). 36 In robustness checks, we interact a firm’s share of savings banks in 2006 affected by the financial crisis with a
time dummy for 2008 only, when the affected savings banks were most strongly hit by the crisis.
21
Because of this data limitation, we use this third IV in additional robustness checks only.
Another robustness check exploits membership to Eurex Exchange as an indicator for active
presence in securities markets (cf. Abbassi et al. 2015). The overidentification test is still
passed with the additional instruments, and the estimation results (reported in Appendix C.1)
remain very similar.
5 Effect of relationship banks’ credit supply on firm borrowing
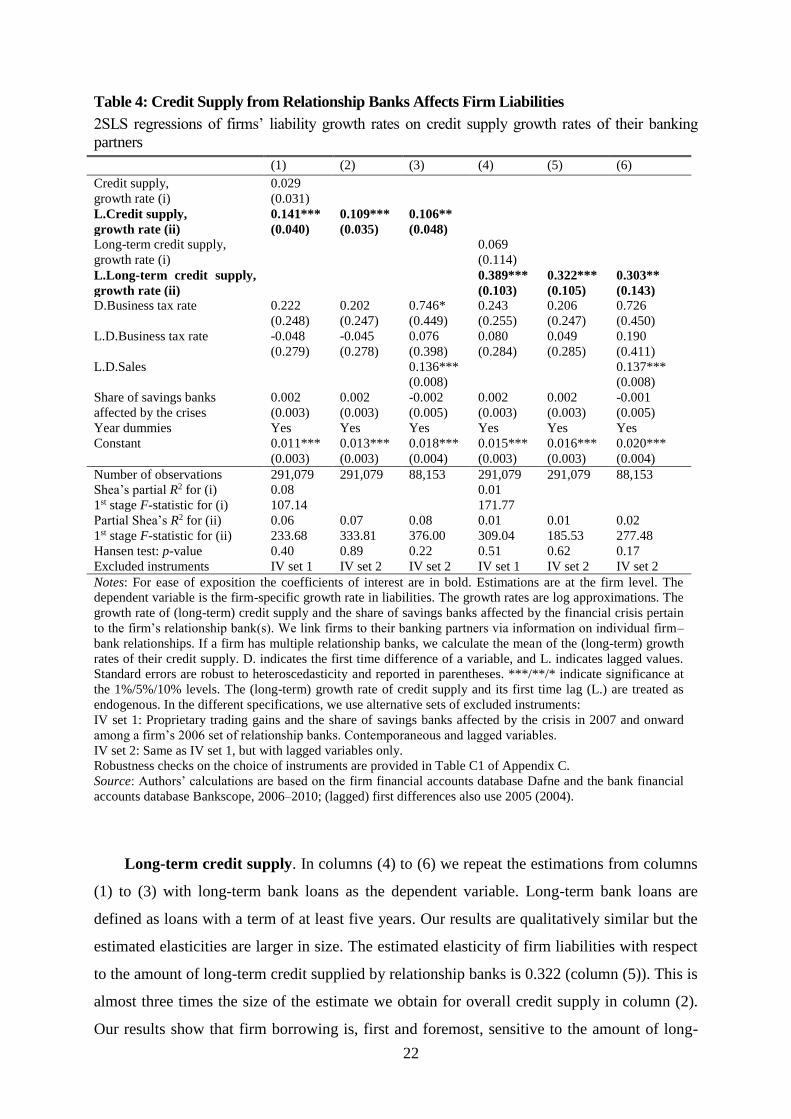
Elasticity of firm liabilities. Table 4 reports the results from estimating eq. (2) when we use
the amount of a firm’s liabilities as the outcome yit. In column (1), the coefficient 1 of the
contemporaneous credit supply from a firm’s relationship banks is positive, but small and
insignificant, whereas the coefficient of the first time lag 2 is much larger and significant at
the 1% level. This indicates that the credit supply of relationship banks indeed propagates to
the liabilities of their business customers, but with a time lag.37 Because we empirically detect
this lag structure in column (1), in the following regressions, we omit the insignificant
contemporaneous growth rate of credit supply and concentrate on 2. Interpreting 2 as the
elasticity in eq. (1), we find that the elasticity of the firm’s liabilities with respect to the credit
supply of its banking partners in column (2) is 0.109 and significant at the 1% level. Thus, if a
firm’s relationship banks contract credit supply by 1%, this causes the firm’s liabilities to
decrease by about 0.1%. This indicates that firms’ borrowing is affected by the lending policy
of their relationship banks and that firms cannot fully substitute credit from other banks for
credit from their relationship banks. As a robustness check we include lagged sales (in first
differences) as an additional control variable (column (3)) and find our estimated elasticity
virtually unchanged. Because sales are observed only in the subsample of firms that report
income statements, the sample size drops significantly in this estimation (N = 88,153 instead
of N = 291,079).
The results for bank lending and firm borrowing imply that firm–bank lending
relationships are a relevant determinant of firms’ access to external capital. We thereby
contribute to a nascent literature on the role of relationship banking for the transmission of
monetary shocks (Hachem 2011; Bolton et al. 2013) and to the scant empirical literature
examining relationship banking (for the United States, cf. Petersen and Rajan 1994; for
Germany, cf. Harhoff and Körting 1998).
37 The time lag is probably due to the time lag between the date of negotiation and agreement about a bank loan
and the date when the loan is actually paid out. While the bank loan appears on a bank’s balance sheet
immediately after agreement (loan commitment), it only shows up on the firm’s balance sheet once the loan is
paid out.
22
Table 4: Credit Supply from Relationship Banks Affects Firm Liabilities
2SLS regressions of firms’ liability growth rates on credit supply growth rates of their banking
Share of savings banks affected 0.007* 0.001 0.002 0.012***
(0.004) (0.003) (0.004) (0.004)
Year dummies Yes Yes Yes Yes
Constant 0.014*** -0.015*** -0.001 -0.000
(0.004) (0.003) (0.004) (0.003)
Number of observations 145,510 145,929 144,554 146,525
Shea’s partial R2 0.08 0.06 0.06 0.08
1st stage F-statistic 415.23 128.86 135.83 423.74
Hansen test: p-value 0.79 0.72 0.80 0.92
Excluded IV IV set 2 IV set 2 IV set 2 IV set 2
Notes: For ease of exposition the coefficients of interest are in bold. Estimations are at the firm level. The
dependent variable is the firm-specific growth rate in fixed assets. The growth rates are log approximations. The
growth rate of credit supply and the share of savings banks affected by the crisis pertain to the firm’s relationship
bank(s). We link firms to their banking partners via information on individual firm–bank relationships. If a firm
has multiple relationship banks, we calculate the mean of the bank variables for each firm-year observation. D.
indicates the first time difference of a variable, and L. indicates lagged values. “Above the median” is short for
weakly above the median here. Standard errors are robust to heteroscedasticity and reported in parentheses.
***/**/* indicate significance at the 1%/5%/10% level. The growth rate of credit supply is treated as
endogenous. We use the following set of excluded instruments:
IV set 2: Lagged proprietary trading gains and lagged share of savings banks affected by the crisis in 2007 and
onward among a firm’s 2006 set of relationship banks.
Source: Authors’ calculations are based on the firm financial accounts database Dafne and the bank financial
accounts database Bankscope, 2006–2010; (lagged) first differences also use 2005 (2004).
7 Adjustment channels
In the previous sections, we provide evidence that firm borrowing, investment and
employment react significantly to changes in credit supplied by their relationship banks.
43 A related dimension of heterogeneity is firm age. Information asymmetries are usually found to be more severe
for younger firms (with less track record), which may therefore be more dependent on relationship banks.
Splitting the sample at the median age of firms (14 years) or, alternatively, at age 6, indeed yields larger point
estimates of the investment elasticity for younger firms than for older firms. But again the difference is small and
not statistically significant (results available upon request).
29
Further, we find evidence for differences in the investment response of firm types to changes
in credit supply by relationship banks, which suggests that firms are in the position to partly
compensate a contraction in loan supply, and that the ability to do so varies between firms. In
the following, we focus on two major adjustment channels: first, a change in banking partners,
and second, substitution of external debt financing with self-financing by means of using
accumulated cash holdings, reducing dividend payments, or issuing new equity.44
7.1 Change of banking partners
We start out by analyzing the role of new bank relationships. We do so by estimating eq. (2)
with different dependent variables. In columns (1) and (2) of Table 7, we use a dummy
variable as the dependent variable, which is one if a change in the set of banking partners
occurs while the number of banking partners remains constant and zero otherwise.45 We
expect the likelihood of a change in the set of banking partners to be a function of the initial
number of banking partners. We therefore include dummy variables to control for the number
of banking partners in 2006, before the crisis (baseline category: one banking partner in
2006). The point estimate of interest of -0.024 (column (1)) indicates that the probability of
switching a banking partner increases by 0.24 percentage points or 8 percent (evaluated at the
baseline probability of 3 percent) when the growth rate of credit supply from the prior
relationship banks decreases by 10 percent.
In columns (3) and (4), we use the change in the number of banking partners as the
dependent variable. We again use dummy variables to control for the initial number of
banking partners (in pre-crisis year 2006). Estimation results in column (3) show that the
average number of banking partners significantly grows by 0.004 when prior relationship
banks contract their lending by 10%. This is economically significant, given that the average
change in banking partners is -0.002.
44 Becker and Ivashina (2014) report that firms in the USA switch from loans to corporate bonds at times of
depressed lending or poor bank performance. However, our data confirm that in Germany as a bank-based
economy, issuing bonds is a negligible source of financing in the nonfinancial sector. 45 In Table 7, as the key explanatory variable, we use the contemporaneous growth rate in the credit supply of the
relationship banks instead of the first time lag because a new lending relationship is already established at the
time of the credit negotiations.
30
Table 7: Change of Banking Partners
2SLS regressions
Dependent variable Change of
banking partners
Change in the number
of banking partners
(1) (2) (3) (4)
Credit supply, growth rate -0.024* -0.040**
(0.015) (0.016)
Share of banks with proprietary trading losses 0.005* 0.008**
Excluded IVs IV set 2 IV set 2 IV set 2 IV set 2 IV set 2 IV set 2 IV set 2 IV set 2 IV set 2
Notes: For ease of exposition the coefficients of interest are in bold. Estimations are at the firm level. The growth rate of credit supply and the share of savings banks affected by
the crisis pertain to the firm’s relationship bank(s). We link firms to their banking partners via information on individual firm–bank relationships. If a firm has multiple
relationship banks, we calculate the mean of the bank variables for each firm-year observation. D. indicates the first time difference of a variable, and L. indicates lagged values.
Standard errors are robust to heteroscedasticity and reported in parentheses. ***/**/* indicate significance at the 1%/5%/10% level. The number of observations is smaller in
some columns because of missing data and because the dependent variables are zero (before taking logs) for some firm-year observations. For the calculation of the growth rate in
dividends, we added 1 before taking logs as otherwise only dividend paying firms would be in our sample. In specifications (6) to (9), we exclude firms with a growth rate of cash
in the top and bottom 3% of the distribution. Although the point estimates are not affected by the censoring, the estimates are more precisely estimated. The growth rate of credit
supply and the share of banking partners with proprietary trading losses are treated as endogenous. We use the following set of excluded instruments:
IV set 2: Lagged proprietary trading gains and lagged share of savings banks affected by the crisis in 2007 and onward among a firm’s 2006 set of relationship banks.
Source: Authors’ calculations are based on the firm financial accounts database Dafne and the bank financial accounts database Bankscope, 2006–2010; (lagged) first differences
also use 2005 (2004).
35
The pecking order theory suggests that new equity is the most expensive source of
financing. We therefore expect firms able to compensate a reduction in credit supply by using
other (less costly) sources of funds to be less likely to issue new equity, compared to those
that cannot resort to other sources. Column (3) provides evidence for this presumption. We
find a stronger reaction of nominal capital for the subsample of firms which are unable to
increase internal funds by cutting dividends because they do not pay out any (we use dividend
payment in 2007 as the splitting criterion). Among these firms, those with low asset
tangibility even more resort to external equity, because their lack of collateral makes it hard to
obtain credit from new banking partners (column (4)). Furthermore, smaller non-dividend-
paying firms are less likely to issue new equity than larger ones (column (5)). This finding is
in line with the argument that large firms have better access to the equity market.
Last, we test whether firms use accumulated cash to mitigate a reduction in credit supply.
For this analysis we use the growth rate of cash (held in the form of liquid bank deposits)47 as
dependent variable. As shown by Almeida et al. (2004) and Hadlock and Pierce (2010), firms
that are financially constrained are more likely to accumulate cash in high cash flow times.
We expect these firms to use the accumulated cash to mitigate the reduction in credit supply.
The average elasticity of cash with respect to the credit supply from the relationship banks is
0.159 (significant at the 10% level, column (6)).
Column (7) shows that accumulated cash of firms which do not pay dividends reacts
more sensitively to a change in credit supply, in line with our expectations. Among these
firms, we assess differences with respect to the tangibility of a firm’s assets (column (8)). Our
estimations suggest that firms with low asset tangibility are less likely to use accumulated
cash to mitigate shocks to the firms’ credit supply than the average non-dividend-paying firm.
This result is consistent with our previous finding that firms with asset tangibility below the
median exhibit high investment sensitivity with respect to bank loan supply (see Table 6,
column (1)), while firms with high tangibility show little investment sensitivity (see Table 6,
column (2)). However, this result raises the question why firms with low asset tangibility do
not use accumulated cash to mitigate reductions in credit supply−in particular as these firms
should be more likely to hold cash for precautionary saving motives (Almeida et al. 2004).
Uncertainty about future credit supply could be a potential explanation: If such financially
constrained firms expect the change in credit supply to be more permanent, they probably are
reluctant to quickly use up their cash reserves. In column (9) we focus on small non-dividend-
47 We do not include marketable securities because their value might have been affected by the financial crisis.
36
paying firms. The point estimate increases to 0.355 (significant at the 5% level). Our results
thus show that both large and small firms are able to partly mitigate a contraction in credit
supply but differ in the way of doing so: Large firms cut dividends (as they are more likely to
pay out dividends), establish new bank relationships, and issue new equity; small firms resort
to cash accumulated for this purpose.
We gauge the relative importance of the different adjustment channels for firms in our
sample by calculating the average funds obtained from each channel. When relationship banks
reduce their credit supply by 10%, firms decrease their cash holdings, on average, by 12,386
euros (0.1 0.159 779,000 euros; cf. Table 9 and Table 2), they reduce their dividend
payments by 11,524 euros (0.1 0.396 291,000), and they externally raise new equity
amounting to 1372 euros (0.1 0.019 722,000). In total, the additional self-financing
amounts to 25,282 euros on average. In comparison, liabilities are reduced by 52,287 euros on
average (0.1 0.109 4,797,000). Thus, firms are able to mitigate 48% of the reduction in
debt financing through additional self-financing—more specifically, by using (accumulated)
cash (49%), reducing dividends (46%), and issuing new equity (5%).48
8 Conclusion
This paper contributes to the literature on the transmission of financial shocks to the real
economy and, more specifically, to the international propagation of financial crises through
globalized banking. We explore these issues by exploiting a unique database in which we can
observe a firm’s borrowing, investment and labor employment decisions together with
information on its relationship banks. The database contains financial statements of individual
firms and their relationship banks in Germany over the 2004–2010 period. It includes small
and medium-sized firms, which might be hit hardest by a contraction in loan supply. Our
analysis exploits exogenous variation in the individual exposure of banks in Germany to the
2007–2008 U.S. financial crisis.
We find that banks in Germany that were affected by the U.S. financial crisis reduced
their loan supply and thus internationally propagated the crisis. German firms whose
relationship banks became distressed during the crisis (and thus contracted their credit supply)
reduced overall borrowing. This indicates that relationship banking is important because firms
cannot easily substitute loans from a relationship bank with loans from other banks.
48 The calculation assumes that the average values of dividends, cash holdings and new equity, which we only
observe in subsamples, are representative.
37
Furthermore, these firms significantly reduced their real investment and labor employment,
which suggests that other sources of financing cannot fully make up for the reduction in credit
supply. Overall, the mean net real investment rate of nonfinancial firms in Germany was
reduced by one-fifth in 2008 due to losses from proprietary trading that their relationship
banks suffered during the financial crisis.
For the first time we identify how firms mitigate a causal contraction in loan supply
based on comprehensive micro data from a developed country. We document that firms with
more tangible assets are less dependent on their relationship banks and establish new bank
relationships if needed. This is consistent with the view that these firms can provide more
collateral and can, therefore, borrow from other banks more easily. We further show that the
average firm in our sample can offset almost half of a contraction in credit supply by using
internal funds, by reducing dividend payments, and by issuing new equity (to a smaller
extent).
Overall, our results show the importance of relationship lending and point to the risks of
globalization of banking in the international transmission of monetary shocks. This is a timely
insight given the current debate on banking regulation. One implication of our results is that a
separation of investment banking from commercial banking could reduce the contagion risk
from a financial crisis to a crisis of the real economy. The transmission channel analyzed here
would be disrupted: Losses from proprietary trading would not reduce the common equity
base of a universal bank and would not impede the ability of commercial banks to lend to
nonfinancial firms. These considerations lend support to banking separation initiatives, such
as the Volcker Rule in the United States and the Liikanen Report in the European Union. On
the other hand, one can argue that universal banking facilitates the diversification of risks in
other economic situations.
For the economic modeling and policy management of crises, our results document the
importance of the bank lending and firm borrowing channel in the development of a real
economic crisis. Distress on the side of banks causally spills over to real investment and labor
employment of nonfinancial firms. This implies that monetary and fiscal policy should aim to
maintain credit supply during a crisis.
38
References
Abbassi, Puriya, Rajkamal Iyer, José-Luis Peydró, and Francesc R. Tous, 2015, Securities
Trading by Banks and Credit Supply: Micro-Evidence, mimeo.
Acharja, Viral V., Tim Eisert, Christian Eufinger, and Christian Hirsch, 2015, Real Effects of
the Sovereign Debt Crisis in Europe: Evidence from Syndicated Loans,
http://dx.doi.org/10.2139/ssrn.2612855.
Allen, Franklin, Aneta Hryckiewicz, Oskar Kowalewski, and Günseli Tumer-Alkan, 2012,
Transmission of Bank Liquidity Shocks in Loan and Deposit Markets: The Role of
Interbank Borrowing and Market Monitoring, Wharton Financial Institutions Center
Working Paper No. 10-28.
Almeida, Heitor, and Murillo Campello, 2007, Financial Constraints, Asset Tangibility, and
Corporate Investment, Review of Financial Studies, 20: 1429-1460.
Almeida, Heitor, Murillo Campello, Bruno Laranjeira, and Scott Weisbenner, 2012, Corporate
Debt Maturity and the Real Effects of the 2007 Credit Crisis, Critical Finance Review, 1:
3-58.
Almeida, Heitor, Murillo Campello, and Michael S. Weisbach, 2004, The Cash Flow
Sensitivity of Cash, Journal of Finance, 59: 1777-1804.
Amiti, Mary, and David Weinstein, 2011, Exports and Financial Shocks, Quarterly Journal of
Economics, 126: 1841-1877.
Amiti, Mary, and David Weinstein, 2013, How Much Do Bank Shocks Affect Investment?
Evidence from Matched Bank-Firm Loan Data, NBER Working Paper No. 18890.
Ashcraft, Adam B., 2005, Are Banks Really Special? New Evidence from the FDIC-Induced
Failure of Healthy Banks, American Economic Review, 95: 1712-1730.
Asker, John, Joan Farre-Mensa, and Alexander Ljungqvist, 2015, Corporate Investment and
Stock Market Listing: A Puzzle? Review of Financial Studies, 28: 342-390.
Baur, Dirk G., 2012, Financial Contagion and the Real Economy, Journal of Banking and
Finance, 36: 2680-2692.
Becker, Bo, and Victoria Ivashina, 2014, Cyclicality of Credit Supply: Firm Level Evidence,
Journal of Monetary Economics, 62: 76-93.
Becker, Bo, Marcus Jacob, and Martin Jacob, 2013, Payout Taxes and the Allocation of
Investment, Journal of Financial Economics, 107: 1-24.
Bertaut, Carol, Laurie Pounder DeMarco, Steven Kamin, and Ralph Tyron, 2012, ABS
Inflows to the United States and the Global Financial Crisis, Journal of International
Excluded instruments IV set 5 IV set 5 IV set 5 IV set 6 IV set 5
Notes: For ease of exposition the coefficients of interest are in bold. Estimations are at the firm level. D.
indicates the first time difference of a variable, and L. indicates lagged values. Standard errors are robust to
heteroscedasticity. ***/**/* indicate significance at the 1%/5%/10% level. The growth rate of credit supply is
treated as endogenous. We use the following set of excluded instruments:
IV set 5: Proprietary trading gains and share of savings banks affected by the crisis in 2007 and onward among
a firm’s 2006 set of relationship banks.
IV set 6: Same as IV set 5, additionally including the interaction term between the indicator for publicly listed
firms and the proprietary trading gains among a firm’s 2006 set of relationship banks.
Summary: The table presents estimations like in Table 8 of the main paper, but using the growth rate in credit
supply instead of the share of banks with proprietary trading losses as the explanatory variable of interest. The
results are qualitatively similar.
Source: Authors’ calculations are based on the firm financial accounts database Dafne and the bank financial
accounts database Bankscope, 2006–2010; (lagged) first differences also use 2005 (2004).
Oxford University Centre for Business Taxation Working Paper series recent papers
WP 15/15 Giorgia Maffini and John Vella Evidence-based policy-making? The Commission's proposal for an FTT WP 15/14 Clemens Fuest and Jing Xing How can a country 'graduate' from procyclical fiscal policy? Evidence from China? WP 15/13 Richard Collier and Giorgia Maffini The UK international tax agenda for business and the impact of the OECD BEPS project WP 15/11 Irem Guceri Tax incentives and R&D: an evaluation of the 2002 UK reform using micro data WP 15/10 Rita de la Feria and Parintira Tanawong Surcharges and penalties in UK tax law WP 15/09 Ernesto Crivelli, Ruud de Mooij, Michael Keen Base erosion, profit-shifting and developing countries WP 15/08 Judith Freedman Managing tax complexity: the institutional framework for tax policy-making and oversight
WP 15/07 Michael P Devereux, Giorgia Maffini and Jing Xing Corporate tax incentives and capital structure: empirical evidence from UK tax returns WP 15/06 Li Liu and Ben Lockwood VAT notches WP 15/05 Clemens Fuest and Li Liu Does ownership affect the impact of taxes on firm behaviour? Evidence from China. WP 15/04 Michael P Devereux, Clemens Fuest and Ben Lockwood The taxation of foreign profits: a unified view WP 15/03 Jitao Tang and Rosanne Altshuler The spillover effects of outward foreign direct investment on home countries: evidence from the United States WP 15/02 Juan Carlos Suarez Serrato and Owen Zidar Who benefits from state corporate tax cuts? A local labour markets approach with heterogeneous firms WP 15/01 Ronald B Davies, Julien Martin, Mathieu Parenti and Farid Toubal Knocking on Tax Haven’s Door: multinational firms and transfer pricing WP 14/27 Peter Birch Sørensen Taxation and the optimal constraint on corporate debt finance WP 14/26 Johannes Becker, Ronald B Davies and Gitte Jakobs The economics of advance pricing agreements
WP 14/25 Michael P Devereux and John Vella Are we heading towards a corporate tax system fit for the 21st century? WP 14/24 Martin Simmler Do multinational firms invest more? On the impact of internal debt financing on capital accumulation WP 14/23 Ben Lockwood and Erez Yerushalmi Should transactions services be taxed at the same rate as consumption? WP 14/22 Chris Sanchirico As American as Apple Inc: International tax and ownership nationality WP 14/19 Jörg Paetzold and Hannes Winner Taking the High Road? Compliance with commuter tax allowances and the role of evasion spillovers WP 14/18 David Gamage How should governments promote distributive justice?: A framework for analyzing the optimal choice of tax instruments WP 14/16 Scott D Dyreng, Jeffrey L Hoopes and Jaron H Wilde Public pressure and corporate tax behaviour WP 14/15 Eric Zwick and James Mahon Do financial frictions amplify fiscal policy? Evidence from business investment stimulus WP 14/14 David Weisbach The use of neutralities in international tax policy WP 14/13 Rita de la Feria Blueprint for reform of VAT rates in Europe WP 14/12 Miguel Almunia and David Lopez Rodriguez Heterogeneous responses to effective tax enforcement: evidence from Spanish firms WP 14/11 Charles E McLure, Jack Mintz and George R Zodrow US Supreme Court unanimously chooses substance over form in foreign tax credit WP 14/10 David Neumark and Helen Simpson Place-based policies WP 14/09 Johannes Becker and Ronald B Davies A negotiation-based model of tax-induced transfer pricing WP 14/08 Marko Koethenbuerger and Michael Stimmelmayr Taxing multinationals in the presence of internal capital markets WP 14/07 Michael Devereux and Rita de la Feria Designing and implementing a destination-based corporate tax WP 14/05 John W Diamond and George R Zodrow The dynamic economic effects of a US corporate income tax rate reduction
WP 14/04 Claudia Keser, Gerrit Kimpel and Andreas Oesterricher The CCCTB option – an experimental study WP 14/03 Arjan Lejour The foreign investment effects of tax treaties WP 14/02 Ralph-C. Bayer Harald Oberhofer and Hannes Winner The occurrence of tax amnesties: theory and evidence WP14/01 Nils Herger, Steve McCorriston and Christos Kotsogiannisz Multiple taxes and alternative forms of FDI: evidence from cross-border acquisitions WP13/25 Michael Devereux, Niels Johannesen and John Vella Can taxes tame the banks?
Evidence from European bank levies
WP13/24 Matt Krzepkowski Debt and tax losses: the effect of tax asymmetries on the
cost of capital and capital structure
WP13/23 Jennifer Blouin, Harry Huizinga, Luc Laeven, Gaëtan Nicodème Thin
capitalization rules and multinational firm capital structure
WP13/22 Danny Yagan Capital tax reform and the real economy: the effects of the 2003
dividend tax cut
WP13/21 Andreas Haufler and Christoph Lülfesmann Reforming an asymmetric union: on
the virtues of dual tier capital taxation
WP13/20 Michael Blackwell Do the haves come out ahead in tax litigation? An empirical
study of the dynamics of tax appeals in the UK
WP13/19 Johannes Becker and Ronald B Davies Learning and international policy diffusion:
the case of corporate tax policy
WP13/18 Reuven S Avi-Yonah And yet it moves: taxation and labour mobility in the 21st
century
WP13/17 Anne Brockmeyer The investment effect of taxation: evidence from a corporate
tax kink
WP13/16 Dominika Langenmayr and Rebecca Lesterz Taxation and corporate risk-taking
WP13/15 Martin Ruf and Alfons J Weichenrieder CFC legislation, passive assets and the
impact of the ECJ’s Cadbury-Schweppes decision
WP13/14 Annette Alstadsæter and Martin Jacob The effect of awareness and incentives
on tax evasion
WP13/13 Jarkko Harju and Tuomos Matikka The elasticity of taxable income and income-
shifting between tax bases: what is “real” and what is not?
WP13/12 Li Liu and Andrew Harper Temporary increase in annual investment allowance
WP13/11 Alan J Auderbach and Michael P Devererux Consumption and cash-flow taxes in
an international setting
WP13/10 Andreas Haufler and Mohammed Mardan Cross-border loss offset can fuel tax
competition
WP13/09 Ben Lockwood How should financial intermediation services be taxed?
WP13/08 Dominika Langenmayr, Andreas Haufler and Christian J bauer Should tax policy
favour high or low productivity firms?
WP13/07 Theresa Lohse and Nadine Riedel Do transfer pricing laws limit international
income shifting? Evidence from European multinationals
WP13/06 Ruud de Mooij and Jost Heckemeyer Taxation and corporate debt: are banks any
different?
WP13/05 Rita de la Feria EU VAT rate structure: towards unilateral convergence?
WP13/04 Johannes Becker and Melaine Steinhoff Conservative accounting yields excessive
risk-taking - a note
WP13/03 Michael P.Devereux, Clemens Fuest, and Ben Lockwood The Taxation of Foreign
Profits: a Unified View
WP13/02 Giorgia Maffini Corporate tax policy under the Labour government 1997-2010
WP13/01 Christoph Ernst, Katharina Richter and Nadine Riedel Corporate taxation and the