Evidence of Creative Destruction in the U.S. Economy Author(s): Edgar Norton Source: Small Business Economics, Vol. 4, No. 2 (Jun., 1992), pp. 113-123 Published by: Springer Stable URL: http://www.jstor.org/stable/40228798 . Accessed: 15/06/2014 14:35 Your use of the JSTOR archive indicates your acceptance of the Terms & Conditions of Use, available at . http://www.jstor.org/page/info/about/policies/terms.jsp . JSTOR is a not-for-profit service that helps scholars, researchers, and students discover, use, and build upon a wide range of content in a trusted digital archive. We use information technology and tools to increase productivity and facilitate new forms of scholarship. For more information about JSTOR, please contact [email protected]. . Springer is collaborating with JSTOR to digitize, preserve and extend access to Small Business Economics. http://www.jstor.org This content downloaded from 195.34.79.20 on Sun, 15 Jun 2014 14:35:17 PM All use subject to JSTOR Terms and Conditions
Transcript
Evidence of Creative Destruction in the U.S. EconomyAuthor(s): Edgar NortonSource: Small Business Economics, Vol. 4, No. 2 (Jun., 1992), pp. 113-123Published by: SpringerStable URL: http://www.jstor.org/stable/40228798 .
Accessed: 15/06/2014 14:35
Your use of the JSTOR archive indicates your acceptance of the Terms & Conditions of Use, available at .http://www.jstor.org/page/info/about/policies/terms.jsp
.JSTOR is a not-for-profit service that helps scholars, researchers, and students discover, use, and build upon a wide range ofcontent in a trusted digital archive. We use information technology and tools to increase productivity and facilitate new formsof scholarship. For more information about JSTOR, please contact [email protected].
.
Springer is collaborating with JSTOR to digitize, preserve and extend access to Small Business Economics.
http://www.jstor.org
This content downloaded from 195.34.79.20 on Sun, 15 Jun 2014 14:35:17 PMAll use subject to JSTOR Terms and Conditions
Evidence of Creative Destruction in the U.S. Economy Edgar Norton
ABSTRACT. Schumpeter discusses the importance of in- novation and new firm entry in a capitalistic economy as a means to "creatively destruct" oligopolies and generate new economic wealth. He warns of R&D becoming the arena of professional engineers in large corporations; Schumpeter feared the obsolescence of entrepreneurship would result in an increasing concentration of wealth among large corpora- tions and toward socialism.
Using a longitudinal data base of U.S. corporations over the period 1961-1980, this paper statistically tests several aspects of Schumpeter's analysis. Overall our results give some support to Schumpeter's creative destruction hypothe- sis, though there exists some sensitivity to the measure of size used. We find most of the firms exiting the ranks of the largest 500 firms (as measured by assets) are those with ranks in the 401-500 range; there is also evidence of "churning" as the same firms enter and exit the top 500 over time. Addi- tionally, we find that merger has gained prominence as the reason why firms exit the top 500. Among our conclusions is that further work is needed on the role of mergers in the growth - and decline - of entrepreneurial firms.
1. Introduction
Joseph Schumpeter argued that continual entre- preneurial innovation and firm entry is necessary for a dynamic capitalistic economy to continue to exist. He feared the "routinization" of R&D and innovation among large corporations would stifle entrepreneurial activity, allow big corporations to grow larger, and ultimately lead to socialism.
Schumpeter's thoughts have led many research- ers to examine influences affecting innovation as
well as firm entry and exit. But such evidence is rather limited in scope; by nature it focuses on a limited number of industries in a limited time frame. To better capture evidence regarding Schumpeter's thoughts, longitudinal studies over sufficiently long time frames are necessary.
Loveman and Senbenberger (1991) (hereafter LS) and Aiginger and Tichy (1991) (hereafter AT) shed some light on trends among industrialized economies. Both papers report that long run trends in large firm and small firm employment shares apparently reversed in the 1980s, as the small firm's share rose relative to the large firm's share. Both LS and AT conclude that environ- mental changes have led to a small firm revival. Prior to the 1980s, the consensus view was that industrialized economies were becoming more centralized as a result of mass production of standardized products and economies of scale. In the 1980s, LS and AT note, small firms grew more quickly as demand became more diversified, new technologies arose to help increase the cost efficiency of the small producer, and business leaders realized the advantages of flexibility in uncertain markets.
Schumpeter feared rising wealth concentration if newer entrepreneurial firms could not displace older (and probably oligopolistic) firms. The focus of the analysis in this paper is on this facet of Schumpeter's thoughts. This paper examines trends in size and wealth concentration over a 10 and 20 year time frame.
This paper extends and improves the empirical foundation laid by Kirchhoff (1989). Kirchhoff's attempts to find evidence of rising wealth concen- tration lack statistical rigor and may not be robust with respect to different measures of wealth or size. Using Kirchhoff s "project file," this paper constructs appropriate statistical tests regarding wealth concentration and creative destruction.
Final version accepted on July 22, 1991
Department of Economics and Finance Fairleigh Dickinson University 285 Madison A venue Madison, NJ 07940 U.S.A.
The format of the paper is as follows. The next section reviews Schumpeter's perspectives on the entry, growth, and death of firms. Section three discusses several extensions of the literature in an attempt to better test for evidence of Schumpeter's theories. The remainder of the paper reports the results of our statistical tests and discusses their implications for Schumpeter's views.
2. Schumpeter's perspectives As set forth in his Theory of Economic Develop- ment, Schumpeter (1934) argues that innovation (the commercialization of an invention) is the driving force behind a dynamic capitalistic eco- nomy. Through a process of "creative destruc- tion," entrepreneurs, attracted by the high profits of existing oligopolies, seek to develop and market inventions. If successful, demand for the entre- preneur's innovation (and for those of similar innovations) will rise; demand for the output of the oligopoly will fall. Schumpeter argues that this process creates new wealth and destroys the old oligopolistic market structure. This process of "creative destruction" results in the decline of older, established firms through new firm entry and growth. Over time, the new firms themselves become part of an oligopolistic market structure and become targets for new entrepreneurs and new innovations. Therefore creative destruction is a never-ceasing process in a well-functioning capitalistic economy.
Schumpeter's Capitalism, Socialism, and De- mocracy (1950) presents a more pessimistic view of the future of capitalistic economies. In this work Schumpeter warns against the "routiniza- tion" of technical innovation and the obsolescence of entrepreneurship. R&D and innovation, Schumpeter feared, may become centered in the large corporations, as only they would have the financial wherewithal and the patience to develop new inventions and market them. By exercising their market power, the oligopolies would be able to reap the benefits of past innovations and use their market power profits to finance new R&D and commercialize new inventions. Any entre- preneurial activity could be stopped by either the exercise of the large firm's market power or by buying out the upstart firm. Under this scenario, large corporations will come to dominate innova-
tion; new entry and "creative destruction" would decline, and wealth would become concentrated in a few large firms. Ultimately, Schumpeter feared, this wealth concentration would result in the socialization of property and socialism.
By its nature, it is difficult to gather evidence for or against the conflicting Schumpeterian view- points. Much empirical research is limited to testing for a relationship between innovative activity and market structure variables. Resulting from a paucity of longitudinal data on innovative and entrepreneurial activity, such studies do not provide the long run perspective necessary to adequately test Schumpeter's perspectives (for an interesting review of such studies, and for an interesting test of Schumpeter's view using innova- tion data, see Acs and Audretsch (1988)).
Nelson and Winter (1978, 1982) and Winter (1984) sought to work around the difficulty of inadequate data. They construct Schumpeterian models of economic activity and run computer simulations using different initial conditions and parameter values in an attempt to test several of Schumpeter's conclusions. By running simulations over 100 "quarters," up to 25 years of simulated economic experience is analyzed in the papers by Nelson and Winter. Nelson and Winter find that R&D may be more efficient in a relatively con- centrated industry; imitators of innovation can gain market share vis-a-vis the original innovators; and industries experiencing a high rate of technical progressiveness (which may even be arising from outside the industry, from university or govern- ment research) may be more likely to develop concentrated market structures than industries with lower rates of technical progressiveness.
Winter (1984) updates the earlier Nelson and Winter models to allow for firm entry. Among his findings is that exogenous factors affecting the economy can result in either entrepreneurship or Schumpeter's feared "routinization." Such a result appears to be validated by the empirical analysis of Loveman and Senbenberger (1991) and Aiginger and Tichy (1991), who argue that large firm and small firm relative employment shares may be affected by factors outside the control of an industry.
are perhaps the best means to gather evidence regarding Schumpeter's concepts. Such analyses are important, as evidence for or against Schumpeter's ideas may have public policy im- plications, e.g., in the areas of merger policy and government sponsorship of R&D. Additional empirical analysis of Schumpeter's views is war- ranted, and such is the purpose of this paper.
Schumpeter's conflicting views can be stated in the form of hypotheses; the direction of the hypothesized relationships depends upon which of Schumpeter's views are being tested. Kirchhoff (1989) states and tests two such hypotheses. Kirchhoff's proposition one states that wealth concentration should not be increasing; if true, evidence supporting Schumpeter's creative de- struction view may exist; otherwise, the evidence may favor Schumpeter's routinization view. A second proposition is that there should exist some evidence of creative destruction in the form of turnover among the largest firms in the economy; evidence favoring this hypothesis supports the early Schumpeterian view, whereas evidence against this supports the fears in the later Schumpeterian perspective.
This paper seeks to provide evidence on the existence or non-existence of rising wealth con- centration and creative destruction in the U.S. economy through appropriate statistical testing of these two hypotheses. As a secondary objective, the paper examines the use of several different size measures to determine if the results are robust with regard to the size measure used.
3. Kirchhoff's findings and the need for additional analysis
Kirchhoff (1989) is the only work which attempts a longitudinal study of the impact of creative destruction and wealth concentration. Kirchhoff reports the construction of a "project file" which contains micro data on U.S. firms from the period 1961-1980. Of special interest is that the file, developed from COMPUSTAT data, contains information on nearly 4000 publicly traded firms in the U.S., including the appearance/disappear- ance of firms - i.e., entry and exit. The importance of Kirchhoff's micro data is that it can be used to provide evidence of Schumpeter's concepts of
creative destruction and wealth concentration over a long time period.
In this paper, as in Kirchhoff, wealth concentra- tion is used as a proxy for market concentration ratios "in the absence of clear market boundaries among multi-establishment large firms" (Kirchhoff, 1989). We examine the concentration trends of the largest 500 firms. We assume the 500 largest firms is an appropriate sample for examining wealth concentration in the U.S. economy. The number "500" has been popularized as a charac- teristic of a large firm from the Fortune 500 rankings. Our analysis also focuses mainly on the largest 500 firms so our results will be more easily compared with Kirchhoff's, but portions of our analysis use other collections of firms to seek additional evidence regarding concentration and firm turnover.
Reviewing the empirical results from his analy- sis, Kirchhoff concludes that "evidence of creative destruction appears among the 500 largest indus- trial firms from 1961 to 1980. Specifically, there is no evidence of increasing concentration, there is a firm displacement rate of 16 to 17 percent every ten years, and new entries grow very fast until they become large at which time their growth rate declines significantly" (Kirchhoff, 1989, p. 171).
We will extend Kirchhoff's previous analyses four ways. First, we adjust assets (a frequently used measure in previous research) for the impact of inflation; second, other measures of size besides total assets are examined; third, we use more data points than did Kirchhoff, i.e., 1970-1980 inclu- sive, to conduct statistical tests; and fourth, we examine the reasons why firms exited the top 500 from 1970-1980 and comment on the applica- bility of creative destruction to the exit process.
Need to control for inflation Kirchhoff's finding of no increase in asset concen- tration of the largest 500 U.S. firms may be true as a result of the effects of historical cost accounting under U.S. generally accepted accounting prin- ciples (GAAP). GAAP results in the understate- ment of asset book values under conditions of inflation or rising replacement cost (Bernstein 1989; Brealey and Myers, 1988). Newer firms have "younger" asset bases and their book values may better reflect (higher) current market values.
This content downloaded from 195.34.79.20 on Sun, 15 Jun 2014 14:35:17 PMAll use subject to JSTOR Terms and Conditions
It is true that newer, higher-valued assets will also result in larger levels of accounting depreciation expense;1 thus the "book" asset base of the newer firms may be depreciating more quickly than that of older firms. The net effect of newer, higher- valued assets and larger depreciation expense on the book value of assets is unknown. However, Kirchhoff 's finding of no net change in the share of the largest firms' book assets between 1970 and 1980 may result from GAAP rather than creative destruction. This same conclusion also applies to some of the wealth concentration studies pres- ented in Scherer (1980).
We adjust firm assets in Kirchhoff 's project file for the effects of inflation as follows. First, we identify the first year (say, year T) in which the firm appears in the project file. We assume that the first year's observation of total assets reflects current market value.2 To adjust the firm's total assets for inflation in year T 4- 1, we compute ATA (year T 4- 1) = TA (year T) *PI(T + 1)/PI(T)
+ TA(T + 1) - TA(T), (1) where ATA denotes adjusted total assets; TA denotes book value total assets; and PI denotes the level of the GNP price deflator index. ATA for succeeding years is computed as in Equation 2:
ATA (year T + K + 1 ) - ATA (yr T + K) *PI((T + K + 1)/PI(T 4- K)) + (TA(T + K + 1) - TA(T + K)). (2)
That is, to compute adjusted total assets, the previous year's adjusted total assets is increased by a factor reflecting the latest year's inflation; added to this is the change in book assets from one year to the next, which is assumed to reflect current costs.
Need to control for other measures of size It is of interest to determine if studies of the creative destruction hypothesis are robust with respect to other measures of size or wealth. As first discovered by Smyth, Boyes, and Peseau (1975) and later clarified by Shalit and Sankar (1977), empirical studies which include a "size" variable may be sensitive to the size measure used in hypothesis tests. Various measures of firm size may result in different conclusions.
Fortunately the project file contains three other useful measures of firm size for which inflation
adjustments are not needed, namely sales, number of employees, and market value of common stock.
Three reasons exist for using sales as a measure of wealth or size. First, concentration ratios published by the U.S. Department of Commerce are based on firm sales. Second, several empirical studies of firm growth (e.g., Kumar, 1985) use sales data. Third, the Fortune 500 is based on firm sales. As Kirchhoffs analysis emulates the Fortune 500 by examining the wealth concentra- tion of the largest 500 firms in the project file, sales is an appropriate measure to use to replicate some of Kirchhoffs analyses. Sales revenues will reflect inflation and are less subject to the dis- parities in U.S. GAAP than are total assets.
A second useful measure of size is the number of employees. As differences in operating lever- age, industry product, and productivity can lead to firms with the same number of employees having greatly different sales or asset levels, using number of employees may result in a "purer" measure of size. As a measure of size, the number of em- ployees is frequently used in small business research (Evans, 1987; Audretsch and Acs, 1990; Revelli and Tenga, 1989; Storey, 1989). By its nature, the number of employees is not affected by accounting principles or inflation.
A measure of size popular in financial studies is shareholder wealth, i.e., the market value of the firm's common stock. Shareholder wealth reflects the current market view of the value of the com- pany; it ideally reflects the amount of money to be received by shareholders if assets were sold at current market prices and liabilities retired at market value. Thus shareholder wealth incor- porates the current market value of the firm as well as the impact of economic trends (including inflation) on the value of the firm. Virtually all corporate finance texts stress that the goal of a firm should be to maximize shareholder wealth (Brealey and Myers, 1988). The project file includes both year-end closing common stock price and the number of common shares outstand- ing. By multiplying these two together, the market value of equity can be calculated and used in our analysis as an additional measure of wealth.
4. Statistical analysis
Using the COMPUSTAT data in the project file, Table I compares the number of firms ranked in
This content downloaded from 195.34.79.20 on Sun, 15 Jun 2014 14:35:17 PMAll use subject to JSTOR Terms and Conditions
Panel 1: Number of firms ranked in the top 500 by total assets that are also ranked in the top 500 by other size measures
ATA SALES EMPLS MV total assets number of market value adjusted for employees of common inflation equity
1970 492 446 423 391 1980 484 456 430 431
Panel 2: Number of firms ranked between 501-1000 by total assets that are also ranked 501 - 1000 by other size measures
ATA SALES EMPLS MV
1970 478 373 316 276 1980 454 406 349 338
Panel 3: Number of firms ranked in the top 1000 by total assets that are also ranked in the top 1 000 by other size measures.
ATA SALES EMPLS MV
1970 986 921 880 860 1980 970 949 900 905
the top 500 by 1970 total assets that are also ranked in the top 500 by other size measures. Apparently adjusting assets for inflation has little impact on the composition of the largest 500 firms as only eight firms in the total asset top 500 are not in the adjusted asset top 500.
Larger differences occur when the second tier of 500 firms is examined. The second panel of Table I compares the numbers of firms ranked from 501 to 1000 by total assets that are similarly ranked by the other size measures. Adjusted total assets shows the greatest agreement with the total assets rankings, but only 55.2% of the firms ranked by total assets in the second 500 are similarly ranked by the market value measure.
However, examination of the third panel of Table I indicates the low numbers in the second panel result from a "crossing effect." That is, some firms ranked in the top 500 by assets are ranked in the second 500 by some of the other measures, and vice versa. The third panel compares the number of firms ranked in the top 1000 by total assets that are also in the top 1000 when ranked by the other size measures. Table I also does a
comparison using the 1980 rankings. Results similar to the 1970s occur.
Rank correlations show great similarities be- tween the relative rankings among the five size measures. Table II shows the Spearman rank order correlation coefficients for firms that had data available for all five size measures in 1970 (top panel, with 1337 firms having the necessary data) and in 1980 (bottom panel, with 1113 firms having data available). Rankings using assets adjusted for inflation have the highest correlation with the book value of asset rankings, but the rankings based upon sales, employees, and market value are also highly correlated with the book asset rankings. All the correlations presented in Table II have significance levels that are zero to three decimal places.
By comparing rankings over time and across different size measures, we can make several conclusions. First, the need to adjust assets for inflation appears to be of little practical use in the 20 year period examined. Rankings by total assets and total assets adjusted for inflation were very
TABLE II Spearman rank order correlations for firms with non-missing
data for the size measures, 1 970 and 1 980
Panel 1: 1970 rankings Adjusted Sales Employment Market assets value
similar, both in the number of firms ranked in the first and second 500 by each measure and by overall rank correlations.3
A second conclusion from our analysis is that the size measure used in the analysis of the project file may have an impact on the results. Table II indicates high rank correlations between the size measures. However, differences do occur in the rankings, specifically as a result of the "crossover effect" between the first and second 500 as reported in Table I.
Testing proposition one
We test Kirchhoffs (1989) proposition one using data from the project file. Proposition one states:
Total assets of the largest 500 industrial firms will not increase as a percent of total industrial assets over the 1970-1980 time period. The rationale for this proposition is that if
creative destruction is a meaningful economic force there should be no evidence of increasing wealth concentration among the largest firms in the economy. To examine this hypothesis, Kirch- hoff uses only two years of data: 1970 and 1980. As discussed in his paper and reported in his Table I, there was no clear evidence of increasing asset concentration between 1970 and 1980. But as he used only two end points, no statistical tests can be done to determine if indeed that is the case.
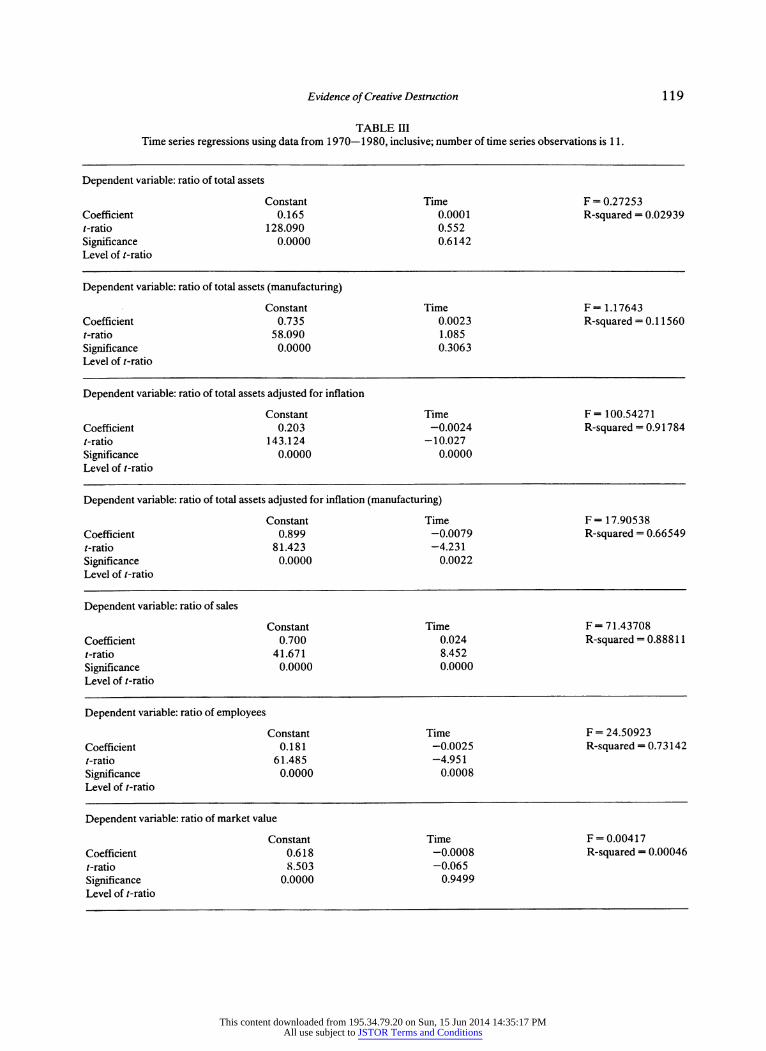
To examine proposition one statistically, more years of data are needed; given the scope of the project file, data from 1970-1980 inclusive are available for the firms ranked among the 500 largest in each year. Data on aggregate corporate assets, corporate assets adjusted for inflation, sales, employees, and market value of equity are available from several different sources from 1970- 1980.4 Ratios of largest 500 firm size divided by the corresponding national size meas- ure were constructed for our five measures of size. By examining the sign and significance level of the slope coefficient from time series regressions for the period 1970-1980 we can obtain statistical evidence for or against Kirchhoffs proposition one. Our null hypothesis is that the time series coefficient is equal to or less than zero. Evidence counter to proposition one would imply a slope coefficient significantly greater than zero.
The results of the time series regressions are presented in Table EQ. Seven regression equations were computed; five involved ratios using our five measures of size as dependent variables. As Kirchhoff (1989, p. 168) points out, one reason why the results may support his proposition is the shift in business activity away from manufacturing into services. Thus two of the seven regression equations involve ratios using manufacturing var- iables rather than corporate variables.
As indicated in Table IE, all the regression results, except for one, lend some, albeit weak, empirical support to proposition one. The slope coefficient is significantly negative - indicating a decline in largest 500 firm concentration - when employees, adjusted total assets, and adjusted total assets (manufacturing) ratios are used as depend- ent variables. However, in these regressions, the size of the slope coefficient is quite small when compared to the estimated intercept term. Thus, the slope coefficient is statistically significant, but practically little change has occurred in wealth or size concentration.
The time series slope coefficient is not signifi- cantly different from zero when market value, total assets, and total assets (manufacturing) ratios are the dependent variables. This implies, as measured by these variables, that there was no discernable trend in concentration from 1970 through 1980.
When the dependent variable is the sales ratio, the slope coefficient is positive and significant, indicating increasing sales concentration among the largest 500 industrial firms. The magnitude of the coefficient is such that the increase in concen- tration is not negligible. One explanation for this result is that COMPUSTAT sales data include international sales by multinational companies. As many of the largest U.S.-based corporations are multinational in scope, an increasing level of foreign sales may explain this increase in concen- tration over time.5
Thus, as stated, proposition one is supported by the data. It should be noted, however, that clear evidence does not exist regarding a decline in wealth concentration.
Testing proposition 2
In his paper Kirchhoff (1989) proposes and tests the following hypothesis (proposition two):
This content downloaded from 195.34.79.20 on Sun, 15 Jun 2014 14:35:17 PMAll use subject to JSTOR Terms and Conditions
At least a fifth of the firms within the ranks of the 500 largest industrial firms will exit from the group and be replaced by other firms.
Kirchhoff does no statistical testing to provide evidence for or against this proposition. Proposi- tion two can be statistically tested, however, using the proportion test statistic.6
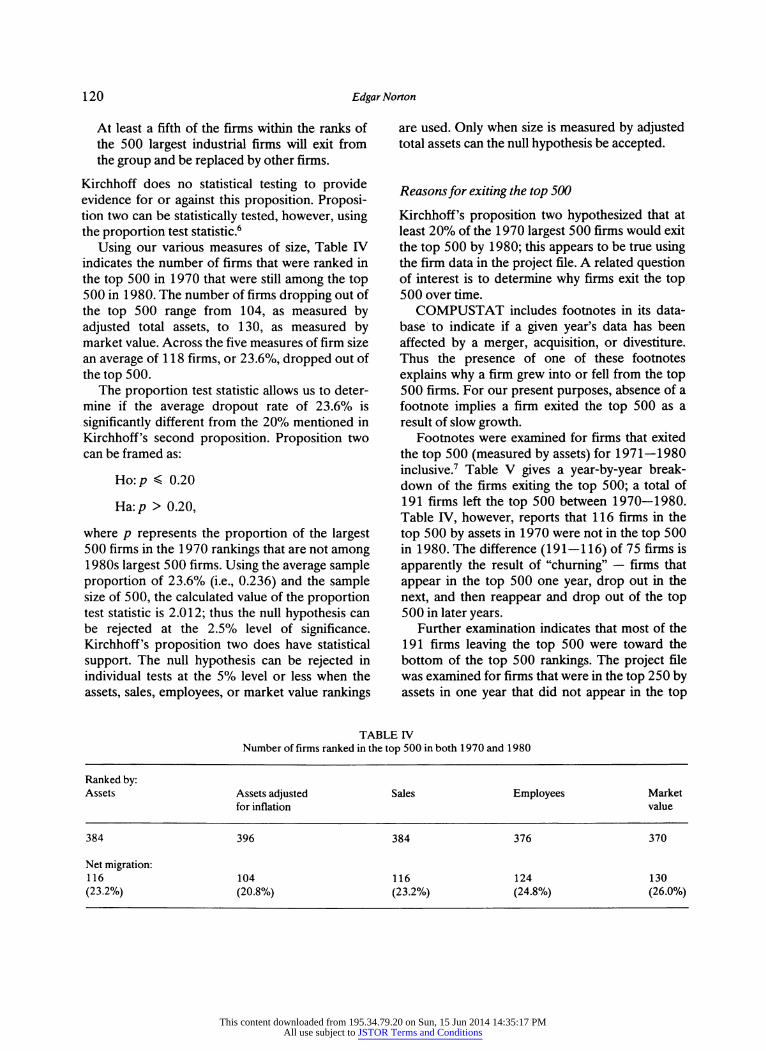
Using our various measures of size, Table IV indicates the number of firms that were ranked in the top 500 in 1970 that were still among the top 500 in 1 980. The number of firms dropping out of the top 500 range from 104, as measured by adjusted total assets, to 130, as measured by market value. Across the five measures of firm size an average of 1 18 firms, or 23.6%, dropped out of the top 500.
The proportion test statistic allows us to deter- mine if the average dropout rate of 23.6% is significantly different from the 20% mentioned in KirchhofPs second proposition. Proposition two can be framed as:
Ho:/? < 0.20
Ha:/? > 0.20,
where /? represents the proportion of the largest 500 firms in the 1970 rankings that are not among 1980s largest 500 firms. Using the average sample proportion of 23.6% (i.e., 0.236) and the sample size of 500, the calculated value of the proportion test statistic is 2.012; thus the null hypothesis can be rejected at the 2.5% level of significance. KirchhofPs proposition two does have statistical support. The null hypothesis can be rejected in individual tests at the 5% level or less when the assets, sales, employees, or market value rankings
are used. Only when size is measured by adjusted total assets can the null hypothesis be accepted.
Reasons for exiting the top 500
Kirchhoff's proposition two hypothesized that at least 20% of the 1970 largest 500 firms would exit the top 500 by 1980; this appears to be true using the firm data in the project file. A related question of interest is to determine why firms exit the top 500 over time.
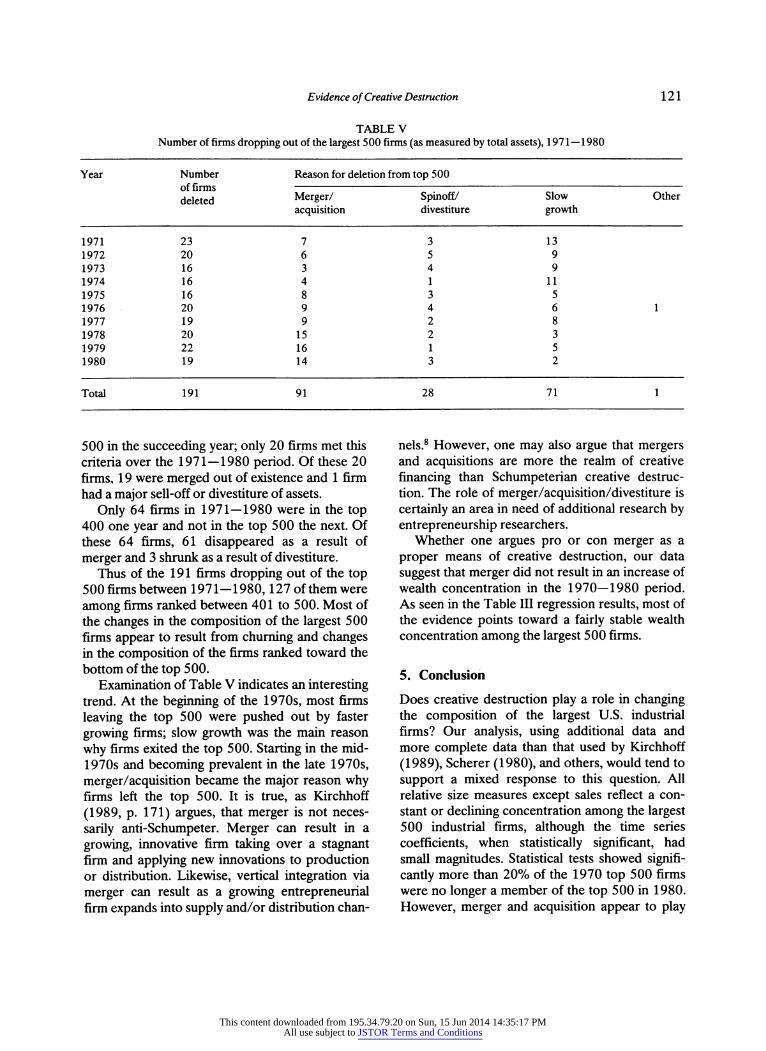
COMPUSTAT includes footnotes in its data- base to indicate if a given year's data has been affected by a merger, acquisition, or divestiture. Thus the presence of one of these footnotes explains why a firm grew into or fell from the top 500 firms. For our present purposes, absence of a footnote implies a firm exited the top 500 as a result of slow growth.
Footnotes were examined for firms that exited the top 500 (measured by assets) for 1971-1980 inclusive.7 Table V gives a year-by-year break- down of the firms exiting the top 500; a total of 191 firms left the top 500 between 1970-1980. Table IV, however, reports that 116 firms in the top 500 by assets in 1970 were not in the top 500 in 1980. The difference (191-116) of 75 firms is apparently the result of "churning" - firms that appear in the top 500 one year, drop out in the next, and then reappear and drop out of the top 500 in later years.
Further examination indicates that most of the 191 firms leaving the top 500 were toward the bottom of the top 500 rankings. The project file was examined for firms that were in the top 250 by assets in one year that did not appear in the top
TABLE IV Number of firms ranked in the top 500 in both 1 970 and 1 980
500 in the succeeding year; only 20 firms met this criteria over the 1971-1980 period. Of these 20 firms, 19 were merged out of existence and 1 firm had a major sell-off or divestiture of assets.
Only 64 firms in 1971-1980 were in the top 400 one year and not in the top 500 the next. Of these 64 firms, 61 disappeared as a result of merger and 3 shrunk as a result of divestiture.
Thus of the 191 firms dropping out of the top 500 firms between 1971-1980, 127 of them were among firms ranked between 401 to 500. Most of the changes in the composition of the largest 500 firms appear to result from churning and changes in the composition of the firms ranked toward the bottom of the top 500.
Examination of Table V indicates an interesting trend. At the beginning of the 1970s, most firms leaving the top 500 were pushed out by faster growing firms; slow growth was the main reason why firms exited the top 500. Starting in the mid- 1970s and becoming prevalent in the late 1970s, merger/acquisition became the major reason why firms left the top 500. It is true, as Kirchhoff (1989, p. 171) argues, that merger is not neces- sarily anti-Schumpeter. Merger can result in a growing, innovative firm taking over a stagnant firm and applying new innovations to production or distribution. Likewise, vertical integration via merger can result as a growing entrepreneurial firm expands into supply and/or distribution chan-
nels.8 However, one may also argue that mergers and acquisitions are more the realm of creative financing than Schumpeterian creative destruc- tion. The role of merger/acquisition/divestiture is certainly an area in need of additional research by entrepreneurship researchers.
Whether one argues pro or con merger as a proper means of creative destruction, our data suggest that merger did not result in an increase of wealth concentration in the 1970-1980 period. As seen in the Table III regression results, most of the evidence points toward a fairly stable wealth concentration among the largest 500 firms.
5. Conclusion
Does creative destruction play a role in changing the composition of the largest U.S. industrial firms? Our analysis, using additional data and more complete data than that used by Kirchhoff (1989), Scherer (1980), and others, would tend to support a mixed response to this question. All relative size measures except sales reflect a con- stant or declining concentration among the largest 500 industrial firms, although the time series coefficients, when statistically significant, had small magnitudes. Statistical tests showed signifi- cantly more than 20% of the 1970 top 500 firms were no longer a member of the top 500 in 1980. However, merger and acquisition appear to play
This content downloaded from 195.34.79.20 on Sun, 15 Jun 2014 14:35:17 PMAll use subject to JSTOR Terms and Conditions
major roles in the entrance into and the exit from the largest 500 firms. These conclusions are fairly robust, given the high rank correlations between the measures of size used in this study - total assets, assets adjusted for inflation, sales, em- ployees, and market value of equity. The impact of inflation on the composition of the top 500 appears to be small, as results using inflation- adjusted assets were little different from those developed from book value assets.
Some anomalies did arise that add some degree of doubt to our conclusions and that encourage additional future research in the area of creative destruction and wealth concentration. The results, though generally robust, are somewhat sensitive to the size measure used. For example, sales of the largest 500 firms (ranked by sales) relative to total manufacturing sales significantly rose over the 1970-1980 period. Net migration of the top 500 from 1970 to 1980 ranged from a low of 20.6% (as measured by adjusted total assets) to a high of 26.0% (as measured by market value) - a varia- tion of almost 30%. The number of firms ranked in the top 500 by total assets that were also ranked in the top 500 by other size measures ranged from a low of 391 (market value of equity) to 492 (adjusted total assets). Thus, despite overall high rank correlations between the five size measures differences do exist in the rankings that may affect the results of statistical analyses. For example, if this study had used sales as the only proxy for size, the hypothesis of no increase in wealth concentra- tion would have been rejected.
Future examinations of firm growth, decline, and the concept of creative destruction would do well to examine more than one measure of size. By using two or more measures, stronger results may occur to support/contradict hypotheses. Or, if mixed results occur, an impetus is created to explain the unusual results and glean additional knowledge from available data.
Additionally, future research should also exam- ine the role of merger and acquisition in the process of creative destruction, firm growth, and firm decline. Kirchhoff (1989) found that merger/ acquisition played a major role in the entry of new firms into the largest 500 firms. This paper has shown that merger and acquisition was also a major force behind the exit of firms from the top
500 during the 1970-1980 period. The net impact of merger and acquisition activity and its effect on creative destruction and wealth concen- tration is an empirical and a public policy question needing further study.
Acknowledgements The author wishes to thank Bruce Kirchhoff for giving him access to his project file and for his helpful suggestions on prior versions of this paper. The assistance of Glenn Cates and Todd Korol in getting the data tape up and running on the FDU computer system is also gratefully acknowledged. The author also acknowledges helpful comments from one of the editors and two anonymous referees. The usual disclaimer applies.
Notes
1 This will be true even if straight-line depreciation is used. Many firms use accelerated depreciation methods only for tax purposes. Shareholder reports, upon which the COMPUSTAT data base is built, typically use straight-line depreciation methods. 2 This assumption will probably be a relatively good approxi- mation to reality for firms that enter the project file after 1961. For firms existing in the project file in 1961 this assumption may not be accurate, depending on the age of the firm's asset base as of 1961. Of the 3895 firms in the project file, 1 136 have data for their 1961 assets. 3 There are at least two explanations why inflation may not play an important role in the ranking of firms in the project file. First, while the younger firms have assets which may closely approximate market value, their higher depreciation expense decreases book asset value by a larger amount than for the older firms. Second, the size of the large, established firms may reduce the chances of a smaller, fast-growing firm from replacing them from the top 500. 4 Total asset data can be obtained from the IRS Statistics of Income, various years. It can be adjusted for inflation using the procedure outlined in equations 1 and 2 of this paper. Total employees (employed persons in the labor force) is available from the Economic Report of the President. Manu- facturing sales figures are also available from the Economic Report of the President. The market value of U.S. equities for the years 1959-1980 is reported in R. Ibbotson and L. Siegel, "The World Market Wealth Portfolio," Journal of Portfolio Management, Winter 1983. 5 Indeed, if asset and employee data are also contaminated by consolidated foreign subsidiaries, the empirical evidence presented in Table III is even more strongly in favor of proposition one.
This content downloaded from 195.34.79.20 on Sun, 15 Jun 2014 14:35:17 PMAll use subject to JSTOR Terms and Conditions
6 Kirchhoff (1989) gives no rationale for using a 20% turnover rate in the null hypothesis. From examining available empirical evidence, however, an hypothesized rate of 20% appears reasonable.
Kirchhoff and Phillips (1989) found that single establish- ment firms born in 1976-78 had a survival rate through 1986 of 38.4%. This translates into a 10 year exit rate of approximately 60%. An examination of Kirchhoff s COM- PUSTAT project file finds that 39.5% of the firms existing in 1970 did not exist as independent public entities in 1980.
Thus, if start-up firms have a ten year exit rate of 60%, and all project file firms (which are large enough to have public equity outstanding) have a ten year exit rate of 40%, it is not unreasonable to believe the largest firms may have a ten year exit rate of 10%- 20%. The hypothesized exit rate of 20% between 1970-1980 is at the upper end of this range and is therefore an optimistic perspective on Schumpeter's creative destruction hypothesis. 7 That is, firms that were among the top 500 in 1970 but were not in the top 500 in 1971; firms that were among the top 500 in 1971 but not 1972; and so on. Assets were used as the size measure so our examination of exit would use the same size measure as Kirchhoff s analysis of entry. 8 However, merger may be a concern if merger is used to stifle innovative entrepreneurial activity. A large firm may merge with a smaller, innovative firm in a pre-emptive attempt to protect their market power. Such merger activity may be a pre-cursor to Schumpeter's (1950) analysis of the "routinization" of R&D by professional engineers in large corporations.
References
Acs, Z. and D. Audretsch, 1988, Testing the Schumpeterian Hypothesis', Eastern Economic Journal 14(2), 129-140.
Aiginger, K. and G. Tichy, 1991, 'Small Firms and the Merger Mania', Small Business Economics 3(2), 83-101.
Audretsch, D. and Z. Acs, 1990, 'The Entrepreneurial Regime, Learning, and Industry Turbulence', Small Busi- ness Economics 2(2), 119-128.
Bernstein, L., 1989, Financial Statement Analysis, fourth edition, Homewood, IL: Richard D. Irwin, Inc.
Brealey, R. and S. Myers, 1988, Principles of Corporate Finance, third edition, New York: McGraw-Hill.
Evans, D., 1987, Tests of Alternative Theories of Firm Growth', Journal of Political Economy 95(4), 657-674.
Kirchhoff, B., 1989, 'Creative Destruction Among Industrial Firms in the United States', Small Business Economics 1(3), 161-174.
Kirchhoff, B. and B. Phillips, 1989, 'Innovation and Growth Among New Firms in the U.S. Economy', Frontiers of Entrepreneurial Research 9, 173-188.
Kumar, M., 1985, 'Growth, Acquisition Activity and Firm Size: Evidence from the United Kingdom', Journal of Industrial Economics 33(3), 327-338.
Loveman, G. and W. Senbenberger, 1991, 'The Re-emer- gence of Small-Scale Production: An International Com- parison', Small Business Economics 3(1), 1-37.
Nelson, R. and S. Winter, 1978, 'Forces Generating and Limiting Concentration Under Schumpeterian Competi- tion', Bell Journal of Economics 9(2), 524-548.
Nelson, R. and S. Winter, 1982, 'The Schumpeterian Tradeoff Revisited', American Economic Review 72(1 ), 1 1 4-1 32.
Revelli, R. and S. Tenga, 1989, 'The Determinants of New Firm Formation in Italian Manufacturing', Small Business Economics 1(3), 181-192.
Scherer, F., 1980, Industrial Market Structure and Economic Performance, Chicago IL: Rand McNally College Publish- ing Company.
Schumpeter, J., 1934, The Theory of Economic Development, Cambridge, MA: Harvard University Press.
Schumpeter, J., 1950, Capitalism, Socialism, and Democracy, New York: Harper and Row.
Shalit, S. and U. Sankar, 1977, 'The Measurement of Firm Size', Review of Economics and Statistics 59(3), 290- 298.
Smyth, D., W. Boyes and D. Peseau, 1975, The Measurement of Firm Size: Theory and Evidence for the United States and the United Kingdom', Review of Economics and Statistics 57(1), 111-114.
Storey, D., 1989, 'Firm Performance and Size: Explanations from the Small Firm Sectors', Small Business Economics 1(3), 175-180.
Winter, S., 1984, 'Schumpeterian Competition in Alternative Technological Regimes', Journal of Economic Behavior and Organization 5, 287-320.
This content downloaded from 195.34.79.20 on Sun, 15 Jun 2014 14:35:17 PMAll use subject to JSTOR Terms and Conditions