28
Using Competitor’s Products as a Primary Intelligence Source Evolution of a competitive analysis & benchmarking program 1
| Date post: | 10-Apr-2017 |
| Category: |
Documents |
| Upload: | rayner-jonathan |
| View: | 325 times |
| Download: | 3 times |

Using Competitor’s Products as a Primary Intelligence SourceEvolution of a competitive analysis & benchmarking program
1

Jonathan Rayner - Profile
Jon has worked at HP for 16 years in a variety of supply chain functions focusing on cost, quality and delivery. He has worked across a variety of HP’s portfolio –servers, storage, networking, ink-jet printers and personal computers.
He is currently an engineering program manager working in HP’s Operations leading a portfolio of programs focused on competitive analysis & cost analytics.
He has a bachelors in Engineering Physics from Miami University (Ohio) and a masters in Mechanical engineering from SUNY Binghamton.
https://www.linkedin.com/in/rayner-jonathan-a1681825
2

Case study disclaimer
• The following slides are representative case studies. The values, where present, do not reflect actual or modeling results.
• Numbers and product and component descriptions are provided for discussion purposes only and do not necessarily represent actual product specifications or performance. No qualitative statement about any company’s products, including those of HP Inc, or its competitors is express or implied.
3

Key ‘best practices’
4
Program has saved double digit millions over past 5 years. Here’s what I’ve learned.
Measurable program goals (in dollars) are critical.
• Goals should be high level, but reasonable (X% of spend).
• How you measure savings needs to be defined (cost avoidance vs. cost savings, timeframe, etc).
• Money isn’t everything.
Executive sponsorship is critical. Support from employees is (equally) critical.
• Regular engagement with executive sponsors (1x per month for us) is critical.
• Savings goals for the entire team/organization. We are often challenging assumptions/decisions that haven’t been reviewed in a long time/are difficult to review.
• Be nice.
Getting the right people in the right job is critical.
• Questions are easy (‘how much should that cost’). The answers are simple (some series of numbers). Quality of the answers will depend on the quality of the analysis, which is dependent on the right people.
• Analytical skills. Problem solvers. Math/engineering oriented.
• Hire people that can be nice.
This is hard work. What’s harder is embracing that there’s now more you don’t know.

Question: ‘What are our competitors doing differently than we are’?
Teardown program started:
• Identify feature, speeds/feeds differences.
• Architecture differences.
• Benchmark competitor’s product to ours.
5
0
5
10
15
20
25
30
0
50
100
150
200
250
300
350
2003 2004 2005 2006 2007 2008 2009
Gro
wth
(p
ct.)
Un
its
(M)
Axis Title
Unit sales to global PC market*
Units (M) Growth (pct.)
*Data from Gartners via Wikipedia: https://en.wikipedia.org/wiki/Market_share_of_personal_computer_vendors

© Copyright 2014 Hewlett-Packard Development Company, L.P. The information contained herein is subject to change without notice. System 2 Confidential
Category Basic Specifications
System Specifications
System
Brand/Model System 1 System 2
GBU / Type Commercial Desktops Commercial Desktops
Current street price
$549.00 $549.00
OS Microsoft Windows 7 Professional Service Pack 1 Build 7601 64-bit Microsoft Windows 7 Professional Service Pack 1 Build 7601 64-bit
Keyboard/ Mouse Wired USB Keyboard & Optical mouse Wired USB Keyboard & Optical mouse
Power Supply240W Internal standard ATX Power Supply; Input 100-240 Vac; 4.6 Amp; 180W Internal standard ATX Power Supply; Input 100-240 Vac; 3.6 Amp;
Output +12 Vdc, 14 Amp; +12 Vdc, 13 Amp, +12 Vsb, 1.67 Amp;Delta Electronics Inc.
Outputs +5.08 Vdc, 10 Amp; +3.3 Vdc, 7 Amp; +12 Vdc, 15 Amp; +5.08 Vsb, 1.5 Amp;Delta Electronics Inc. 80+ bronze versus standard efficiency
HDD/SDD 500GB 7200 rpm 20mm SATA Hard Drive (Seagate) 500GB 7200 rpm 20mm SATA Hard Drive (Seagate)
Warranty 3-year limited hardware warranty 3-year limited hardware warranty
CPU (Processor) Intel® Core™ i3-4160 CPU @ 3.60GHz, 22nm Intel® Core™ i3-4170 CPU @ 3.70GHz, 22nm
Memory 4 GB 1Rx8 PC3-12800U DDR3 SDRAM 1600 MHz (1 x 4GB) (Sky Hynix) 4 GB 1Rx8 PC3L-12800S DDR3 SDRAM 1600 MHz (1 x 4GB) (Samsung)
ChipsetIntel® DH82H81 PCH 4.1W, supports 2 displays Intel® DH82H81 PCH 4.1W, supports 2 displays
6x PCIe 2.0, 2x USB 3.0, 8x USB 2.0, 6x SATA (2-6Gbps) 6x PCIe 2.0, 2x USB 3.0, 8x USB 2.0, 6x SATA (2-6Gbps)
Ports2x USB 3.0; 1x Mic – In; 1x Headset – In; 1x VGA; 6x USB 2.0; 1x Display Port; 2x USB 3.0; 1x Mic – In; 1x Headset – In; 1x VGA; 1x Serial Port; 6x USB 2.0;
1x RJ45; 1x Stereo audio – Out; 1x Line - In 1x Display Port; 2x PS/2 Port; 1x RJ45; 1x Stereo audio – Out; 1x Line - In
Grapichs Intel® HD Graphics 4400 Intel® HD Graphics 4400
ODD Super Multi CD/DVD Writer Super Multi CD/DVD Writer
Flash Bios 64Mbit (8MB SPI Flash) 64Mbit (8MB SPI Flash)
Security ST Microelectronics ST33ZP24AR28PVSP InfineonSLB9660TT1.2

Main Chipset and ASSP Comparison
Main Chipset System 1 System 2
CPU*Intel Corei3-4160
Intel Corei3-4170
PCH*Intel DH82H81
Intel DH82H81
Audio CodecRealtek ALC3220-GR
Realtek ALC221-VA3-CG
Super I/OMicrochipSCH5553-NU-TR
NuvotonNPCD379HAKFX
Ethernet CtlrRealtekRTL8151GD-CG
RealtekRTL8111HSH-CG
VRD CtlrON Semi NCP81102MNTXG
IntersilISL95816HRZ-T
Flash FWHMacronixMX25L6473EM2I-10G
MacronixMX25L6473EM2I-10G
TPMST MicroST33ZP24AR28PVSP
InfineonSLB9660TT1.2
RS-232 XCVR N/AUTC75185G-P20-R
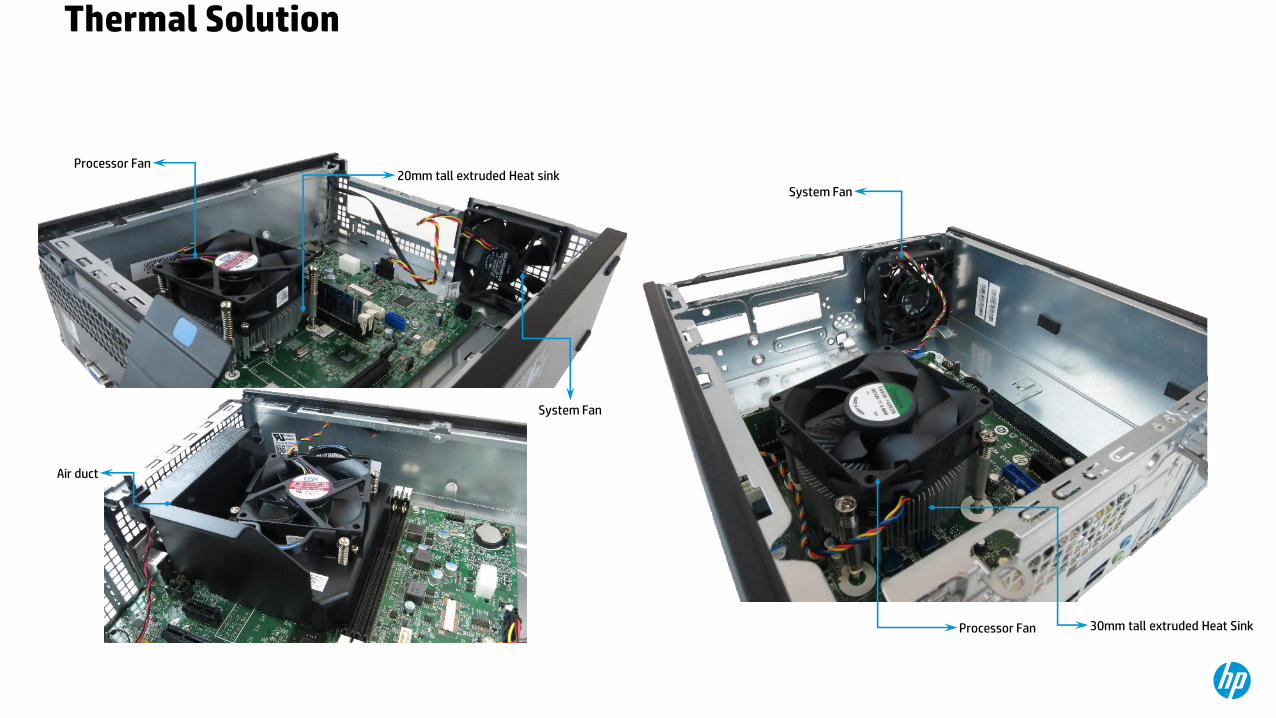
Thermal Solution
Processor Fan
System Fan20mm tall extruded Heat sink
30mm tall extruded Heat Sink
Processor Fan
Air duct
System Fan

Questions remained
• What’s the implication to cost?
• How much do we think their box costs?
• Estimate of their box cost will be compared to our box cost (actual).
• Estimate vs. actual: apples vs. oranges.
• Estimate vs. Estimate: unbiased analysis.
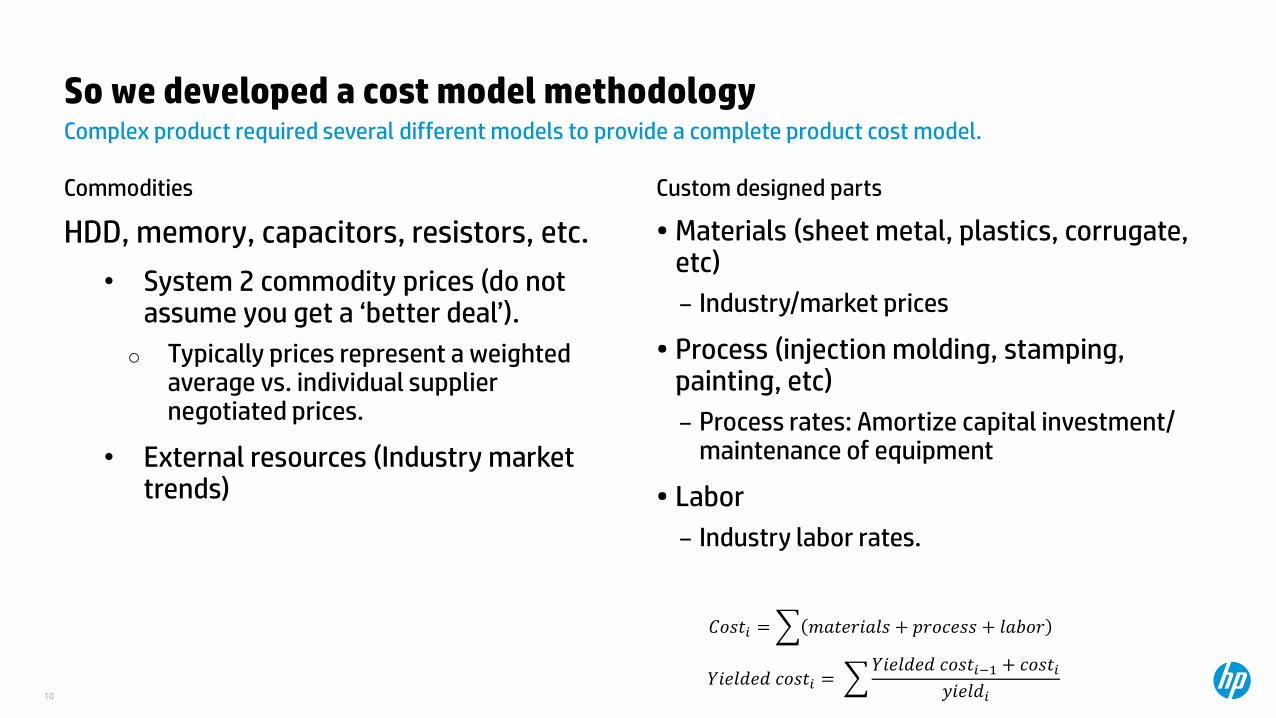
Complex product required several different models to provide a complete product cost model.
So we developed a cost model methodology
Commodities
HDD, memory, capacitors, resistors, etc.
• System 2 commodity prices (do not assume you get a ‘better deal’).
o Typically prices represent a weighted average vs. individual supplier negotiated prices.
• External resources (Industry market trends)
Custom designed parts
• Materials (sheet metal, plastics, corrugate, etc)
– Industry/market prices
• Process (injection molding, stamping, painting, etc)
– Process rates: Amortize capital investment/ maintenance of equipment
• Labor
– Industry labor rates.
10
𝐶𝑜𝑠𝑡𝑖 = 𝑚𝑎𝑡𝑒𝑟𝑖𝑎𝑙𝑠 + 𝑝𝑟𝑜𝑐𝑒𝑠𝑠 + 𝑙𝑎𝑏𝑜𝑟
𝑌𝑖𝑒𝑙𝑑𝑒𝑑 𝑐𝑜𝑠𝑡𝑖 = 𝑌𝑖𝑒𝑙𝑑𝑒𝑑 𝑐𝑜𝑠𝑡𝑖−1 + 𝑐𝑜𝑠𝑡𝑖
𝑦𝑖𝑒𝑙𝑑𝑖

Commodities
• CPU, Graphics, ASSP, Memory, HDD, ODD, LCD
PCAs
• Motherboard, I/O Ports, Card Readers, etc.
Mechanical• Chassis, bezel,
keyboards, etc.
Power supplies
• Internal & External power supplies
Commodities
• CPU, Graphics, ASSP, Memory, HDD, ODD, LCD
PCAs
• Motherboard, I/O Ports, Card Readers, etc.
Mechanical• Chassis, bezel,
keyboards, etc.
Power supplies
• Internal & External power supplies
Competitor System 2
Applied on System 2 & competition for unbiased comparison.

System 1vs. System 2System 1 design cost estimate $5.78 lower than System 2
Design Differences • Mechanical: System 1 had higher chassis cost due
larger blank size(driving $1.09 cost delta)• Electrical: System 1 had 221 fewer components and
was $3.50 less expensive than System 2. • Packaging/Docs: System 1 higher packaging cost and
System 2 higher document cost driving a cost delta of $0.87
Feature Differences• System 2 has 2x PS/2 ports, System 1 does not • System 2 has 1x Serial port, System 1 does not • Location of USB 3.0:
• System 1: 0 front/ 2 rear• System 2: 2 front/0 rear
System 1 System 2 Delta
Commodities $237.27 $241.64 ($4.37)
Mechanical $20.91 $19.82 $1.09
Electrical $22.01 $25.51 ($3.50)
Packaging /Docs $5.23 $4.36 $0.87
ODM Overhead/Profit $16.80 $16.67 $0.13
Total $302.22 $308.00 ($5.78)
ODM
Street Price $519.00 $519.99

System 1 vs. System 2Connectors Comparison
5
6
2
11
Connector System 1 System 2 Delta
1 uP Socket $2.50 $2.50 $0.00
2 DIMM $1.04 $1.04 $0.00
3 PCI-Express 16x $0.45 $0.45 $0.00
4 PCI-Express 1x $0.08 $0.08 $0.00
5 SATA $0.30 $0.30 $0.00
6 VGA port $0.40 $0.40
7 VGA/Serial Combo $0.49 ($0.49)
8 PS2 KBM ports $0.32 ($0.32)
9 Display Port $0.45 $0.52 ($0.07)
10 RJ45 Ethernet $1.15 $1.15 $0.00
11 USB 3.0 $0.40 $0.50 ($0.10)
12 USB 2.0 $0.55 $0.60 ($0.05)
13 Audio Jack $0.80 $0.80 $0.00
14 Switches* $0.72 $0.30 $0.42
4
1
3
12
9
12
2
10 7
5
6
2
11
1
3
10
9
13
14
12
2
4
8
*cabled, cable assembly cost is not shown
Front* Front*
5
5
1111
12 12
12
12
13 1313
14
12
13 1312
12
12
12
14
813 13

Item System 1 System 2 Delta
Processor Fan $1.90 $1.90 $0.00 Both System 1 and System 2 has processor heat sink cooling fan
Processor Heat sink $0.45 $0.53 ($0.08) System 1 has a 20mm tall extruded aluminum heat sink; System 2 has a 30mm tall aluminum extruded Heat sink
System Fan $2.30 $2.30 $0.00 Both systems provide system fans
Air Duct $0.40 $0.40 System 1 with PC+ABS Air duct; System 2 without air duct
Total $5.05 $4.73 $0.32 System 1 higher thermal cost with addition plastic air duct
System 2 with a lower cost on thermal solution
Thermal Solution
Processor Fan
System Fan20mm tall extruded Heat sink
30mm tall extruded Heat Sink
Processor Fan
Air duct
System Fan
System 1 3020 SFF vs System 2 ProDesk 2.5 SFF (Modena)

Potential cost reduction opportunities.
More questions: How do we action this competitive insight?
Need additional analysis
• Not an ‘end to end’ view of cost.
• Not an analysis of value.
• No process for reviewing value of competitive opportunities
– Product development process may not be location for this type of analysis.
– Complex products/ complex organizations.
– Portfolio level decisions
– Complex analysis
– Effects P&L
Value analysis of opportunities.
• Framework for analysis of opportunities.
• Formal process to review.
• Partnership across Supply chain, R&D, marketing, Industrial Design, Quality, etc.
– End to end view of cost.
– Value analysis of opportunity.
• Executive sponsorship
– Cut thru complex organization.
– Support for portfolio level decisions.
– Broader view of P&L
15

Project framework: Value Analysis
Analysis discipline founded at G.E. by Lawrence D. Miles in 1947.
“…an organized creative approach that has for its purpose the efficient identification of unnecessary cost, i.e., cost that provides neither quality nor use nor life nor appearance nor customer features.”
Opportunity Project description.
• Why is our material different?
• What work needs to be done to evaluate the opportunity?
• Where on the roadmap is the opportunity applicable?
• When can the change be implemented?
• Who is needed to drive the change?
• How much would we save?
– Verify the material cost difference.
16

Process to review.
Competitive Analysis & Benchmarking
• Teardown• Team provides
unbiased analysis of cost.
• Opportunities are identified.
Value Analysis
• Partnership between functional groups
• End to end view of cost
• Value analysis of opportunity
• Recommendations made
Executive review
• VP level review of recommendations
• Approve of or decline recommendation.
• Next steps defined.
Execution
• Recommendations implemented in product development
17
ID R&D
Quality Marketing
Cost Supply Chain

Program structure to review
VP Level program sponsorship
Director level program leadership
Competitive Analysis &
Benchmarking core team
Value Analysis core team
18
Provides funding & direction for
program.
Executes on direction,
coordinates program work.
Review & analysis of cost
opportunities from competitive
analysis
Unbiased cost analysis of System
2 & competitive products
ID R&D
Quality Marketing
Cost Supply Chain

TCE/Q
Decision Owner: Decision:Savings Est.:
Material Cost Marketing
SC/ODM ID R&D
Key Factors evaluated
Det
ails
AnalysisOpportunity Description
Reduce Heatsink Thickness$0.08 savings per unit, estimated lifetime savings of $80k
• With two heatsinks, there are management and inventory excess issues that would create costs that outweigh savings. (Supply Chain)
• Currently the HS are shipped with the chassis. If this continued, we may see additional complexity, excess and inventory costs outweigh cost savings/unit.
• If shipped separately we would incur an extra cost of $0.10/unit. ($100k total) (R&D)
• $0.08 cost savings/unit
• N/A • N/A
• Having 2 heatsinkswould affect our current L4 shipping model and create inventory excess issues.
• N/A • Having 2 heatsinkswould affect our current L4 shipping model and create inventory excess issues.
System 2’s heatsink thickness was 30mm. System 1’s was 20mm.
• Product volume of 1M
• Estimated lifetime material savings of $80k for reducing the heatsink thickness.
• Heatsink can accommodate different wattage CPUs (35W, 65W)
• Director Supply Chain
• Declined• $0.08 savings / unit
System 2 System 1
TCE/Q
Decision Owner: Decision:Savings Est.:
Material Cost Marketing
SC/ODM ID R&D
Key Factors evaluated
Det
ails
AnalysisOpportunity Description
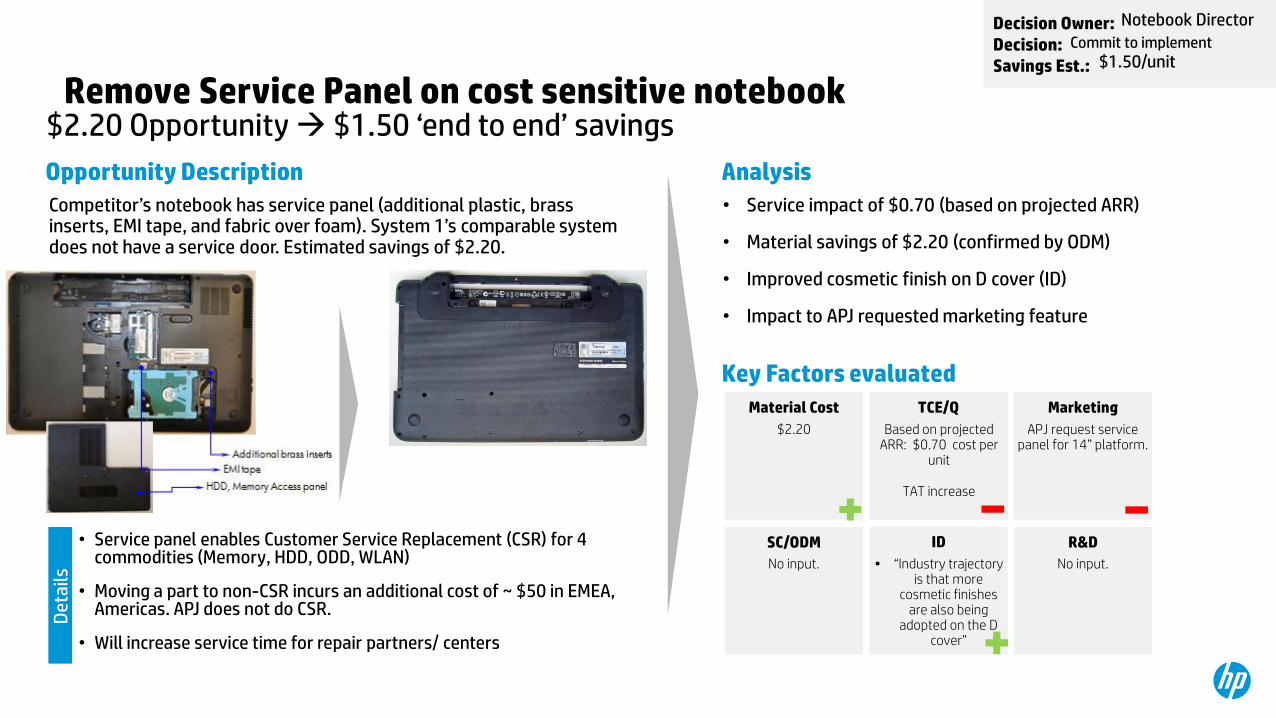
$2.20 Opportunity $1.50 ‘end to end’ savings
• Service impact of $0.70 (based on projected ARR)
• Material savings of $2.20 (confirmed by ODM)
• Improved cosmetic finish on D cover (ID)
• Impact to APJ requested marketing feature
$2.20 Based on projected ARR: $0.70 cost per
unit
TAT increase
APJ request service panel for 14” platform.
No input. • “Industry trajectory is that more
cosmetic finishes are also being
adopted on the D cover”
No input.
Competitor’s notebook has service panel (additional plastic, brass inserts, EMI tape, and fabric over foam). System 1’s comparable system does not have a service door. Estimated savings of $2.20.
• Service panel enables Customer Service Replacement (CSR) for 4 commodities (Memory, HDD, ODD, WLAN)
• Moving a part to non-CSR incurs an additional cost of ~ $50 in EMEA, Americas. APJ does not do CSR.
• Will increase service time for repair partners/ centers
Notebook Director
Commit to implement$1.50/unit
Remove Service Panel on cost sensitive notebook

TCE/Q
Decision Owner: Decision:Savings Est.:
Material Cost Marketing
SC/ODM ID R&D
Key Factors evaluated
Det
ails
AnalysisOpportunity Description
($3.00) est. savings per unit (before HDD costs)
• Net $2 savings for 500GB units.
• Net $0 to $2 cost increase for 1TB / 2TB units (respectively)
• Based on current attach rates, weighted average $1.6/unit savings (estimated)
Cost up:500GB……………….$1.001TB……………………$3.002TB……………....... $5.00
Might reduce warranty costs by up to $0.60/unit
Attach Rates:
500GB…………………50%1TB……………………..30%2TB……………………..20%
$0.10 cost savings/unit on packaging$0.05 cost savings/unit on logistics
May reduce AiOthickness by up to 15mm.
Reduce mechanical costs by ($2.00)
Reduce electrical costs by ($0.25)
System 2 system has a 3.5” 500Gb HDD. System 1’s AiO has a 2.5” 500Gb HDD. This smaller HDD enables lower mechanical/electrical design cost.
• Projected yearly volume of 1M for all System 2 OPP AiO.
• 2.5” HDD reduces system wattage by ~5W.
• 500Gb has the highest attach rates in this product category.
Desktop Director
Commit to implement$1.6/unit
Switch to 2.5” (vs 3.5”) HDD for cost sensitive All in One

TCE/Q
Decision Owner: Decision:Savings Est.:
Material Cost Marketing
SC/ODM ID R&D
Key Factors evaluated
Det
ails
AnalysisOpportunity Description
Estimate average $2.50/ unit
• RD confirmed fan-less solution meets specs.
• Different thermal design strategy implemented on applicable next generation products.
• Fanless solution reduces system noise.
$2.50 average saving per unit
No input. Confirmed System 2 PDD CPU SDP
marketing spec of Buckfast is 4.5W
No input. No input. Confirmed System 1 unit CPU SDP is 4.5W
HP’s thermal design consists of heatsink, heatpipe, cooling fins, and DC blower. Competitor’s thermal solution consists of heatsink with dummy blower housing.
• Competitor has equivalent spec as System 1. Processor power spec is 4.5W.
• Dummy DC blower suggests product developed with blower.
• Notebook Director
• Implemented
$2.50 /unit
Change Thermal Design in cost sensitive notebooks
aluminum heat sink
dummy DC blower
DC blower54 cooling fins
220mm heat pipe
aluminum heat sink

Your cost analysis show a different number than what we pay. Why?
Your number is wrong.
“all models are wrong, but some are useful” - George P. Box
How does our cost model compare to what we pay?

CAB- Mechanical Estimation cost model.
Custom parts/Mechanical Estimation
Example – comparison to quotes.Focus on parameters for Material, molding ($2.66)
$1.67
$4.02
$1.03
$4.63
$1.56
$2.66
Finishing (polish, painting)
Other (inspection, etc)
$15.57
-$2.68
Overhead/profit (12%)
Material, molding
Yield (62%)
Additional process (CNC, trimming)
Cost Model Estimate
Preliminary Supplier Quote
$18.25
𝐶𝑜𝑠𝑡𝑖 = 𝑚𝑎𝑡𝑒𝑟𝑖𝑎𝑙𝑠 + 𝑝𝑟𝑜𝑐𝑒𝑠𝑠 + 𝑙𝑎𝑏𝑜𝑟
𝑌𝑖𝑒𝑙𝑑𝑒𝑑 𝑐𝑜𝑠𝑡𝑖 = 𝑌𝑖𝑒𝑙𝑑𝑒𝑑 𝑐𝑜𝑠𝑡𝑖−1 + 𝑐𝑜𝑠𝑡𝑖
𝑦𝑖𝑒𝑙𝑑𝑖
Die casting
Material • AZ91D die cast material• 125g + 148g of scrap material• $2.96/kg (@ 1.25% material markup)
Process Molding• 650T Thixomolding• 50 sec. cycle time, 1 cavity• $95/hour machine rate
Yield • 97% yield (per supplier discussion)
Plastic insert molding
Material • PPS+45%GF• 28g + 6g of scrap material• $9.82/kg (@1.25% material markup)
Process • 350T injection molding• 45 sec. cycle time, 1 cavity• $15.96/hour
Yield • 90% yield (per quality goals on insert molding)
Yield loss is a key driver for the part cost
PBM team can work to negotiate down
Two Takeaways for Supply chain

Leveraging our Technical Know-How into Cost Modeling
Injecting Cost Insight into Two new AreasBeyond traditional CAB program usage
• 20 models, 450 parameters (to date)
• Leveraging cost models from experts in HP & outside industry benchmarks.
Where we are focusingDeveloping PS mechanical cost model
Product Design with Cost in Mind
Equipping design teams with tools to understand impact of cost on design decisions.
Cost Estimate Info for Negotiations
Equipping our supply chain with benchmarks and analytics for negotiations.
Typical Product Cost
1
2
ODM Material & Manufacturing
Logistics
Commodities
Processor
OS Royalty
Our Focus
Category percentages are illustrative

Injecting Cost Insight into Two new Areas
• Product Design with Cost in Mind
– Optimize design for cost?
– Maximize design value?
– Value = Function/Cost
• Cost Estimate Info for Negotiations
– Where to focus our energy during cost negotiations?
– When is yield an issue and how will improvements impact cost?
– Are we getting a good deal on product a, but not b?
– How do changes in market prices (raw materials, labor) effect our product cost?
– Can we use this to understanding cost for a new technology/material so that we can effectively negotiate?
26

Cost Model Process proposal
Build model
• input from:• Supplier• DFM/process
documents• engineering• CAB team• Previous
(similar) models
Use model/ analysis
• Use model analysis for intended purpose
• Understand impact of cost on design decisions.
• benchmarks and analytics for negotiations.
Analysis feedback
• Document results from analysis
• Initiate feedback loop to verify parameters used.
• Archive project
Parameter feedback/validation during product (SQE/ others?). Model accuracy, parameter feedback, use for negotiation, build up engineering expertise

Key ‘best practices’
28
Program has saved double digit millions over past 5 years. Here’s what I’ve learned.
Measurable program goals (in dollars) are critical.
• Goals should be high level, but reasonable (X% of spend).
• How you measure savings needs to be defined (cost avoidance vs. cost savings, timeframe, etc).
• Money isn’t everything.
Executive sponsorship is critical. Support from employees is (equally) critical.
• Regular engagement with executive sponsors (1x per month for us) is critical.
• Savings goals for the entire team/organization. We are often challenging assumptions/decisions that haven’t been reviewed in a long time/are difficult to review.
• Be nice.
Getting the right people in the right job is critical.
• Questions are easy (‘how much should that cost’). The answers are simple (some series of numbers). Quality of the answers will depend on the quality of the analysis, which is dependent on the right people.
• Analytical skills. Problem solvers. Math/engineering oriented.
• Hire people that can be nice.
This is hard work. What’s harder is embracing that there’s now more you don’t know.


