Evolution of fluoroquinolone resistance in Burkholderia cepacia
A thesis submitted to University College London in fulfilment of the requirement for the degree o f Doctor o f Philosophy
Centre for Medical Microbiology,Royal Free and University College Medical School,Hampstead Campus,Rowland Hill Street,London NW3 2PF
Cassie Francesca Pope
UMI Number: U592601
All rights reserved
INFORMATION TO ALL USERS The quality of this reproduction is dependent upon the quality of the copy submitted.
In the unlikely event that the author did not send a complete manuscript and there are missing pages, these will be noted. Also, if material had to be removed,
a note will indicate the deletion.
Dissertation Publishing
UMI U592601Published by ProQuest LLC 2013. Copyright in the Dissertation held by the Author.
Microform Edition © ProQuest LLC.All rights reserved. This work is protected against
unauthorized copying under Title 17, United States Code.
ProQuest LLC 789 East Eisenhower Parkway
P.O. Box 1346 Ann Arbor, Ml 48106-1346
Declaration
‘I, Cassie Pope, confirm that the work presented in this thesis is my own. Where information has been derived from other sources, I confirm that this has been indicated in the thesis’.
2
Abstract
Abstract
This study investigates the evolution of fluoroquinolone resistance in Burkholderia
cepacia and assesses fitness of clinical isolates of the B. cepacia complex. B. cepacia
was chosen as a clinically relevant model of antibiotic resistance because these
bacteria cause chronic infections in cystic fibrosis patients, are highly resistant to
killing by many antimicrobials and consequently require long term antibiotic
treatment.
Fluoroquinolones are a widely used class of antimicrobials, increasingly used in
medical and veterinary practice. A method was optimised and used to determine the
rate of mutation occurring in topoisomerase genes that confer resistance to
fluoroquinolones. The fitness cost associated with fluoroquinolone resistance
mutations was assessed as a measure of the stability of resistance in the bacterial
population. Clinical isolates were assessed for hypermutability using mutation to
fluoroquinolone resistance as a selective tool.
In Gram-negative bacteria resistance to fluoroquinolones occurs via three major
mechanisms; drug efflux, reduced permeability and target alteration. The spectrum of
fluoroquinolone resistance mutations occurring in vitro, the rate at which they arise,
and the fitness costs of characterised topoisomerase mutations was investigated, using
models relevant to transmission of the Burkholderia cepacia complex. Previous
studies have shown that single point mutations in DNA gyrase, conferring resistance,
have no or low cost. Only double mutations in gyrA and parC conferred a fitness cost.
Second step mutations occur at a faster rate than first step mutations. Mutation in
gyrA, therefore, may predispose the genome to mutation in topoisomerase genes.
3
Acknowledgments
I am indebted to many people who have either helped me personally or have
contributed to the work in this thesis.
I gratefully acknowledge the support of my supervisors Dr. Timothy McHugh and
Prof. Stephen Gillespie and thank them for having faith in me. I am indebted to Dr.
Tim McHugh for his kindness, generosity and positivity and to Prof. Stephen
Gillespie for his encouragement.
Dr Bambos Charalambous assisted me with statistical analysis and I am grateful for
his advice. Additionally I am grateful to Dr. Jonathan Pratten for help with biofilm
work and his patience and good humour. Also to Dr. John Moore for providing
clinical isolates.
I thank Fitzroy Hall and Betty Thaine for providing an autoclave service. Also thanks
to Anne Dickens and Marina Bogovac for ordering of reagents. Among other things
Clare Ling and Claire Jenkins have provided sequencing training and I am grateful to
them both. My colleagues have provided daily support and have provided a fun
working environment. In this regard I am grateful to the clinical scientists and
research staff in the department. In particular I have relied on Dr Denise O’Sullivan
for advice and friendship. I thank Marcus for his patience and support. I am grateful
to all for making this experience a happy one.
4
LIST OF CONTENTS
Title Page 1Declaration 2Abstract 3Acknowledgements 4List of Contents 5List of Figures 12List of Tables 13Abbreviations 15
CHAPTER ONE: INTRODUCTION 16
1.0 General Introduction 16
1.1 Antibiotic Resistance 161.1.1 Significance of antibiotic resistance 161.1.2 Mechanisms of antibiotic resistance 17
1.1.2.1 Alteration of target 171.1.2.2 Modification of antibiotic 181.1.2.3 Reduction in permeability 201.1.2.4 Efflux 211.1.2.5 Metabolic bypass 22
1.1.3 Genetic basis of antibiotic resistance 221.1.3.1 Transformation 231.1.3.2 Conjugation 231.1.3.3 Transduction 241.1.3.4 Stability of acquired elements 251.1.3.5 Persister Cells 26
1.1.4 Use of antibiotics and antibiotic resistance 26
1.2 Mutation Rates 281.2.1 Mutations and mutagens 281.2.2 Mutation rate versus mutation frequency 301.2.3 The fluctuation test of Luria and Delbriick 301.2.4 Determination of mutation rate 321.2.5 Fluctuation Analysis 3 3
1.2.5.1 The po method 351.2.5.2 Lea and Coulsons method of the median 36
1.2.6 Parameters 361.2.7 Assumptions of fluctuation analysis 381.2.8 Directed mutation controversy 391.2.9 Deviations from the assumptions 401.2.10 Detection of resistant mutants 431.2.11 Hypermutability 441.2.12 High mutation rate leads to adaptation 44
5
1.2.13 Mutator phenotypes select for antibiotic resistance 451.2.14 Fitness of mutators 461.2.15 Stability of mutators 47
1.3 Fitness 471.3.1 Importance o f fitness 471.3.2 Fitness and antibiotic resistance 481.3.3 Measuring fitness 481.3.4 Cost of fitness 50
1.3.4.1 Chromosomal mutations 501.3.4.2 Plasmids 511.3.4.3 Other genetic elements 521.3.4.4 Compensatory mutations 53
1.3.5 Fitness Landscapes 541.3.6 Muller’s Ratchet 54
1.4 Bacterial Biofilms 551.4.1 Definition 551.4.2 Biofilms in human disease 561.4.3 Biofilm development 561.4.4 Adhesion 571.4.5 Quorum sensing 581.4.6 P. aeruginosa grows as a biofilm in the CF fibrosis lung 591.4.7 Biofilm resistance to antimicrobial killing 601.4.8 Genetic diversity in biofilms 62
1.6 Fluoroquinolone antibiotics 631.5.1 Fluoroquinolones 631.5.2 History of the fluoroquinolones 641.5.3 Mechanisms of action 671.5.4 Induction of the SOS response 681.5.5 Resistance mechanisms 69
1.5.5.1 Target alteration 691.5.5.1.1 GyrA 701.5.5.1.2 GyrB 711.5.5.1.3 ParC 721.5.5.1.4 ParE 72
1.5.5.2 Efflux 731.5.5.3 Multiple Antimicrobial Resistance Phenotype (MAR) 731.5.5.4 Plasmid mediated resistance 741.5.5.5 Inactivation 75
1.6 The Burkholderia cepacia complex 751.6.1 Taxonomy of Burkholderia 751.6.2 The Burkholderia cepacia complex 771.6.3 Burkholderia pseudomallei and Burkholderia mallei 78
6
1.6.4 Clinical significance 791.6.4.1 Cystic fibrosis 791.6.4.2 Bcc species distribution 811.6.4.3 Chronic granulomatous disease 82
1.6.5 Transmission 831.6.5.1 Environmental transmission 831.6.5.2 Person to person transmission 831.6.5.3 Transmissible strains of the Bcc 84
1.6.6 Identification 8 51.6.7 Treatment 881.6.8 Immunity 891.6.9 Resistance to human antimicrobial peptides 901.6.10 Genome 911.6.11 Virulence o f the Bcc 92
1.6.11.1 Invasion 921.6.11.2 Quorum sensing 931.6.11.3 Exopolysaccharide 941.6.11.4 Proteases 941.6.11.5 Type III Secretion 951.6.11.6 Siderophores 961.6.11.7 Virulence models 97
1.6.12 Use in agriculture 97
1.7 Aims of thesis 99
CHAPTER 2: GENERAL MATERIALS AND METHODS 100
2.1 Culture Conditions 100
2.2 Preparation of media 1012.2.1 Muller Hinton broth 1012.2.2 Luria Bertani broth 1012.2.3 Muller Hinton Agar 1012.2.4 Commercially available agar plates 101
2.3 Preparation of buffers and solutions 1022.3.1 lM T ris 1022.3.2 0.5 M EDTA 1022.3.3 Tris-Borate EDTA buffer (TBE) 1022.3.4 5M NaCl 1022.3.5 Phosphate buffered saline 1022.3.6 Ciprofloxacin 1032.3.7 Clinafloxacin 103
2.4 Growth Curve 103
7
2.5 Miles and Misra viable cell count 103
2.6 Determination of Minimum Inhibitory Concentration (MIC) 1042.6.1 E-test 1042.6.2 Agar dilution 1042.6.3 Method for determination of mutation rate by
the method of the median 1052.6.5 Detection of efflux 106
2.7 DNA Extraction 1072.7.1 Crude extraction 1072.7.2 DNA extraction 107
2.8 Polymerase Chain Reaction (PCR) and sequencing 1082.8.1 Polymerase chain reaction 10 82.8.2 Agarose gel electrophoresis 1082.8.3 Gel photography 1092.8.4 PCR product purification 1092.8.5 Cycle sequencing 1092.8.6 Ethanol precipitation 110
2.9 Fitness assays 1112.9.1 Biofilm growth 111
2.9.1.1 Constant depth film fermenter (CDFF) 1112.9.1.1.1 Conditions 1112.9.1.1.2 Inoculum 1112.9.1.1.3 Sampling 1112.9.1.1.4 Confocal laser scanning microscopy (CLSM) 112
2.9.1.2 Crystal Violet Assay 1132.9.2 Planktonic growth 1132.9.3 Competition assay 1142.9.4 Survival in water 1152.9.5 Survival on dry surfaces 116
CHAPTER 3: ESTIMATION OF MUTATION RATE IN 117TOPOISOMERASE GENES OF B. CEPACIA
3.0 Introduction 1173.1 Fluoroquinolone resistance
3.1.1 Fluoroquinolone resistance in B. cepacia 1173.1.2 Double mutation in topoisomerase genes 117
8
3.1.3 Applications of mutation rate estimation experiments 118
3.2 Aims of chapter 119
3.3 Materials and Methods 1193.3.1 Bacterial strains 1193.3.2 Choice of selective antibiotic 1203.3.3 MIC determination 1203.3.4 Sequence Analysis of the QRDR of fluoroquinolone
resistant mutants 1203.3.5 Detection of efflux 121
3.4 Results 1213.4.1 Development of methodology 121
3.4.1.1 Inoculum 1213.4.1.1.1 Cell Number 1213.4.1.1.2 Growth Phase 1223.4.1.1.3 Incubation period 123
3.4.1.2 Selective antibiotic concentration 1243.4.1.3 Choice of mutation rate method 125
3.4.1.3.1 Lea and Coulsons method of the median 1253.4.1.3.2 po method 126
3.4.1.4 Optimised method for determination 127 of mutation rate by the po method
3.4.1.5 Selection of second step mutants 128
3.4.2 Estimated mutation rate 1283.4.3 Characterisation of ciprofloxacin resistant mutants 1293.4.4 Confirmation of QRDR mutations 1323.4.5 Detection o f efflux pumps 135
3.5 Discussion 136
CHAPTER 4: MEASUREMENT OF FITNESS USING A 144BIOFILM ASSAY
4.0 Introduction 144
4.1 Biofilms4.1.1 Biofilms of B. cepacia 1444.1.2 Multispecies biofilms 1444.1.3 Biofilm models 1454.1.4 Quantification of biofilm growth 1464.1.5 Examples of biofilm models 147
9
4.1.5.1 Constant depth film fermenter 1474.1.5.2 Sorborods filter 1494.1.5.3 Drip flow reactors 1504.1.5.4 Flow cells 1504.1.5.5 Crystal violet microtitre plate assay 150
4.1.6 Effect of incubation conditions 151
4.2 Aims of chapter 151
4.3 Materials and Methods 1524.3.1 Constant depth film fermenter 1524.3.1 Crystal violet microtitre plate assay 152
4.4 Results 1524.4.1 Growth of B. cepacia biofilm 1524.4.2 Confocal scanning laser microscopy of the B. cepacia biofilm 1534.4.3 Effect of incubation period on biofilm formation 155
4.5 Discussion 155
CHAPTER 5: FITNESS COST OF FLUOROQUINOLONE 158 RESISTANCE IN B.CEPACIA
5.0 Introduction 158
5.1 Determination of fitness5.1.1 Choosing appropriate fitness models 1585.1.2 Semi automated liquid culture systems 159
5.2 Aims of chapter 160
5.3 Materials and Methods 1605.3.1 Culture conditions 1605.3.2 MIC determination 1615.3.3 Selection of resistant mutants 1615.3.4 Miles and Misra viable cell count 1615.3.5 Fitness assays 161
5.3.5.1 Biofilm growth 1615.3.5.2 Planktonic growth 1625.3.5.3 Competition assays 1625.3.5.4 Environmental survival 162
10
5.3.5.4.1 Statistical Analysis 162
5.4 Results 1634.4.1 Fitness assays 163
5.5 Discussion 166
CHAPTER 6: CHARACTERISATION OF CLINICAL 172ISOLATES OF BURKHOLDERIA CEPACIA COMPLEX
6.0 Introduction 172
6.1 Hypermutability 1726.1.1 Hypermutability of P. aeruginosa in lungs of cystic fibrosis 172
patients6.1.2 Detection of hypermutability by E-test 172
6.2 Aims of chapter 173
6.3 Materials and Methods 1746.3.1 Clinical strains 1746.3.2 Isolation of Bcc from sputum 1746.3.3 MIC determination 1756.3.4 Sequence Analysis of the QRDR of gyrA 1756.3.5 Detection of hypermutability 1756.3.6 Assay development for determination of mutation rate 176
of clinical Bcc isolates6.3.6.1 Choice of selective antibiotic 1766.3.6.2 Selective antibiotic concentration 1766.3.6.3 Method for determination of mutation rate for the clinical 177
Bcc isolates by the method of the median using 2 x MIC clinafloxacin.
6.3.7 Fitness of clinical Bcc isolates 1786.3.8 Statistical analysis 178
6.3.8.1 Calculation of tl/2 178
6.4 Results 1806.4.1 Antibiotic susceptibility testing 1806.4.2 Biofilm growth 1816.4.3 Environmental survival 182
6.4.3.1 Survival during drying 1826.4.3.2 Survival in water 183
11
6.4.4 Growth rate 1846.4.5 Hypermutability 184
6.4.5.1 E-test 1846.4.5.2 Mutation rate 185
6.4.6 Sequence Analysis of the QRDR of gyrA
6.5 Discussion 186
CHAPTER 7: FINAL DISCUSSION AND FUTURE WORK 193
REFERENCES 202
APPENDIX - PUBLISHED PAPERS 247
LIST OF FIGURES
CHAPTER 1
Figure 1.1: Stages of biofilm development 57Figure 1.2: Development of fluoroquinolones 66Figure 1.3: Phylogenetic tree of Burkholderia species 76
CHAPTER 3
Figure 3.1: Growth curve of B. cepacia 123Figure 3.2: Map of mutations 131Figure 3.3: Alignment of susceptible parent and mutant gyrA 132
nucleotide sequencesFigure 3.4: A comparison of the amino acid sequences of the 133
QRDR of characterised B. cepacia gyrA susceptible parent and resistant mutant
Figure 3.5: Alignment of susceptible and mutantparC sequences 134Figure 3.6: Alignment of susceptible and mutant gyrB sequences 134Figure 3.7: Alignment of susceptible and mutant parE sequences 135
CHAPTER 4
Figure 4.1: Photograph of constant depth film fermenter 148Figure 4.2: Photograph of PFTE scraper blades 148Figure 4.3: Photograph of sample pan 149Figure 4.4: Growth curve of B. cepacia 153Figure 4.5: Image of biofilm at 4 hours 155Figure 4.6: Image of biofilm at 72 hours 155Figure 4.7: Biofilm growth at 0, 1, 2, 4, 7, 24 and 48 hours 156
12
CHAPTER 5
Figure 5.1: Effect o f topoisomerase mutations on ability of B. cepacia 164to form biofilms
Figure 5.2: Effect o f topoisomerase mutations on survival of B. cepacia 165in water
Figure 5.3: Effect of topoisomerase mutations on survival of B. cepacia on 166dry surfaces
CHAPTER 6
Figure 6.1: Comparison of biofilm formation between clinical isolates 181Figure 6.2: Survival during drying of clinical Bcc isolates 182Figure 6.3: Survival in water of clinical Bcc isolates 183Figure 6.4: Amino acid sequences of QRDRs of gyrA of clinical Bcc isolates 185
LIST OF TABLES
CHAPTER 1
Table 1.1: Mode of action of mutagens 29Table 1.2: Definition of terms 32Table 1.3: Mutation rate estimation methods which are appropriate 34
for different numbers of mutation per culture Table 1.4: Assumptions of mutation rate estimation 38
CHAPTER 2
Table 2.1: Sources of B. cepacia isolates 100
CHAPTER 3
Table 3.1: Primers used to amplify the Quinolone Resistance Determining 121Region of gyrA, gyrB, parC and parE
Table 3.2: Estimated mutation rates in B. cepacia using method of the median 126Table 3.3: Estimated mutation rates in B. cepacia using po method 129Table 3.4: Mutations, MIC and selection step of FQ resistant mutants 130Table 3.5: Mutation rates of fluoroquinolone resistance 131Table 3.6: MICs in presence and absence of reserpine 136
CHAPTER 4
Table 4.1: Models that have been used to quantify bacterial biofilm growth 147
13
CHAPTER 5
Table 5.1: Generation times of susceptible parent and topoisomerase mutants 163
CHAPTER 6
Table 6.1: Antibiotic susceptibilities of clinical Bcc isolates 180Table 6.2: Association of generation times of clinical Bcc isolates
and antibiotic resistance 184Table 6.3: Median mutation rates of clinical Bcc isolates determined 185
by method of the medianTable 6.4: Comparison of ciprofloxacin and clinafloxacin MIC 186
of clinical Bcc isolates
14
Abbreviations
Abbreviations
AFLP: amplified fragment length polymorphismAHLs: acyl homoserine lactonesAPI: analytical profiling indexANOVA: analysis of variance between groupsBcc: Burkholderia cepacia complexC: number of parallel culturesCCCP: carbonyl cyanide m-chloro phenylhydrazoneCDFF: constant Depth Film FermenterCF: cystic fibrosiscfu/mL: colony forming units/mLCLSI: Clinical and Laboratory Standards Institutecm: centimetresC02: carbon dioxideDNA: deoxyribonucleic acidEM: electron microscopyFQ: fluoroquinolonekbp: kilobase pairLB: Luria BertaniLPS: lipopolysaccharidem: number of mutationsMATE: multidrug and toxic compound extrusion familyMDR: multi drug resistantMFS: major facilitation familyMIC: minimum inhibitory concentrationmin: minutesMRSA: methicillin resistant Staphylococcus aureusMPC: mutant prevention concentrationp: mutation rateNCTC: National Collection of Type CulturesN0: initial inoculumNt: final cell number0 2: oxygenOD: optical densityORF: open reading framePBS: phosphate buffered salinePCR: polymerase chain reactionPFTE: polytetrafluoroethylenePMF: proton motive forcePVC: polyvinyl chloriderpm: revolutions per minuteQRDR: quinolone resistance determining regionRND: resistance nodulation cell division familySCLM: scanning confocal laser microscopySEM: standard error of the meanSDS PAGE: sodium dodecyl sulphate polyacrylamide gel electrophoresisSDW: sterile distilled waterSHV: sulfhydryl variableSMR: small multidrug resistance familySSCP: single strand conformation polymorphismSPS: sodium polyanetholesulfonateTBE: Tris Borate EDTATIFF: tagged image format fileVRE: vancomycin resistant Enterococci
15
Chapter 1 General Introduction
1.0 General Introduction
1.1 Antibiotic Resistance
1.1.1 Significance of antibiotic resistance
The number of infections caused by antibiotic resistant bacteria has been increasing
worldwide, resulting in decreased efficacy of antimicrobial therapy. This problem has
been exacerbated by the limited number of new antibiotics developed. The increase in the
frequency of antibiotic resistance can be attributed to a number of factors, including the
increase in immunocompromised patients and invasive procedures, the overuse and
misuse of antibiotics in healthcare and animal husbandry (Witte, Klare, & Werner 1999)
and breaches in infection control. This results in raised healthcare costs and increased
patient mortality. For example, in the intensive care setting the widespread use of
antibiotics for treatment of immunocompromised patients has allowed the selection of
drug resistant bacteria e.g. Acinetobacter baumannii (Wroblewska et al. 2006).
The primary aim of in vitro susceptibility testing of clinical isolates is to assess the
susceptibility to an antibiotic in order to guide therapy. A pathogen is classed as resistant
if the Minimal Inhibitory Concentration (MIC) is greater than the defined breakpoint; the
discriminatory antibiotic concentration used to define isolates as susceptible, intermediate
and resistant. In most infections the in vitro susceptibility values correlate with the
effectiveness of therapy. However in some situations such as infection of the cystic
fibrosis (CF) lung by Pseudomonas aeruginosa the correlation is poor. The results of
susceptibility testing, therefore, should be treated with caution.
The community and nosocomial spread of antibiotic resistance in numerous bacterial
pathogens is causing concern. These include methicillin resistant Staphylococcus aureus
16
Chapter 1 General Introduction
(Fluit et al. 2001), vancomycin-resistant Enterococci (VRE) (Courvalin 2006; Kolar et al.
2006), extended spectrum P-lactamase producing Enterobacteriacae (ESBLs) (Bedenic &
Zagar 1998; Gangoue-Pieboji et al. 2005) and non-fermentative Gram-negative bacilli,
including P. aeruginosa, A. baumannii and Stenotrophomonas maltophilia (McGowan, Jr.
2006). A number of European and worldwide studies and surveillance programmes
monitor the frequency of infections caused by antibiotic resistant pathogens. Examples of
these are the SENTRY antimicrobial resistance surveillance programme (Fluit et al. 2001)
and the European Network for Antimicrobial Resistance and Epidemiology (ENARE)
(Voss et al. 1994).
1.1.2 Mechanisms of Antibiotic Resistance
Clinically meaningful levels of resistance arise via a number of mechanisms that enable
bacteria to survive the effects of antimicrobial agents. These include the alteration of
antibiotic targets (e.g. penicillin binding proteins or DNA gyrase), production of enzymes
that inactivate the antibiotic (e.g. p-lactamases and aminoglycoside modifying agents),
reduction of permeability and active efflux to reduce the antibiotic concentration in the
bacterial cell and bypass of the metabolic pathway (e.g. resistance to trimethoprim and
sulphonamides; Neu 1989; Dever & Dermody 1991).
1.1.2.1 Alteration of Target
Resistance to a number of antibiotic classes including P-lactams, glycopeptides,
fluoroquinolones, aminoglycosides, rifampicin and fusidic acid occurs due to alteration of
target molecules. These alterations occur via nucleotide mutations which result in a
modification of the protein structure of the target so that the antibiotic can no longer bind
and exert an effect, resulting in decreased susceptibility. For example, resistance to
17
Chapter 1 General Introduction
rifampicin occurs due to mutation within the rpoB gene that alters the p-subunit of RNA
polymerase. Rifampicin, therefore, cannot bind to the ribosome and large increases in
resistance occur. Fluoroquinolone resistance is another example of target alteration
conferring resistance. The primary mechanisms of resistance to fluoroquinolones are
target alteration mediated by point mutations in DNA gyrase (encoded by the genes gyrA
and gyrB) and topoisomerase IV (encoded by the genes parC and parE). These enzymes
are essential for DNA replication as they alleviate topological stresses associated with
progression of the replication fork (Drlica & Zhou 1997). These mutations occur in the
conserved quinolone resistance determining regions (QRDR) of these genes.
1.1.2.2 Modification of Antibiotic
Antibiotics can be inactivated so that they can no longer have an effect on their target by
hydrolysis of the antibiotic or addition of chemical groups (e.g. an acetyl group is added to
chloramphenicol by acetyltransferase). These mechanisms are generally specific for a
single drug or drug class.
P-lactamases achieve hydrolytic cleavage of the P-lactam ring of cephalosporins and
penicillins by binding via the serine present at the active site of the enzyme. This was the
first reported example of an antibiotic resistance mechanism (Abraham & Chain 1940).
p-lactamases that render bacteria resistant to first, second and third generation
cephalosporins, aztreonam and penicillins by hydrolysis are known as extended spectrum
p-lactamases and were first described in 1983 (Knothe et al. 1983). These enzymes are
produced by single or double mutations within the sulfhydryl variable (SHV) encoding
gene.
18
Chapter 1 General Introduction
A further example of antibiotic modification is the inactivation of macrolides, which exert
an antimicrobial effect by interfering with protein synthesis. Macrolide esterases that
cleave the ester bond of the lactone ring and inactivate the antibiotic were first described
in Escherichia coli in 1984 (Barthelemy et al. 1984). Although not a common resistance
mechanism, this results in very large increases in MIC. Another example is fosfomycin, an
epoxide antibiotic that alters a gene essential for the production of N-acetylmuramic acid,
can also be deactivated by epoxidases.
Modification by group transfer is a common way by which bacteria inactivate antibiotics.
These enzymes modify antibiotics by addition of a chemical group e.g. phosphate and
acetyl groups. This alters the antibiotic structure, impairing binding, thereby inactivating
the antibiotic. For example, aminoglycoside modifying enzymes include
acetyltransferases, phoshotransferases and nucleotidyl transferases (Mingeot-Leclercq,
Glupczynski, & Tulkens 1999). These enzymes alter the structure of the antibiotic so that
it can no longer bind to the ribosome. One or more enzymes may be expressed and the
resistance conferred and spectrum of activity can vary.
A further enzymatic mechanism, other than hydrolysis and group transfer, is oxidation of
antibiotics, although this is a rare mechanism among pathogens. An example of this is the
oxidation of tetracycline by TetX. This gene was initially found in a plasmid in
Bacteroides and can confer tetracycline resistance to E. coli (Speer & Salyers 1988; Speer
& Salyers 1989).
19
Chapter 1 General Introduction
1.1.2.3 Reduction in Permeability
The cell wall of Gram-positive bacteria is more permeable to antibiotics than the Gram-
negative cell wall. This is because the Gram-positive cell wall is a structure made of
peptidoglycan attached to teichoic acid and lipoteichoic acid and this alone does not
restrict the entry of antibiotics by diffusion. However the cell wall of Gram-negative
bacteria is comprised of a thinner layer of peptidoglycan but additionally contains an outer
membrane and the periplasmic space. The outer membrane lipopolysaccharides and
phospholipids prevent penetration of antibiotics. The degree of impermeability varies
between species.
Most antibiotics need to pass through outer membrane porins as they are hydrophilic in
nature. Spontaneous mutations that prevent expression of porins can occur during therapy
and some resistance in Gram-negative bacteria is attributable to altered expression of these
porins. Imipenem resistant P. aeruginosa, for example, are deficient in the OprD porin,
which facilitates uptake of imipenem and amino acids, preventing penetration of the cell
(Wang & Mi 2006). Furthermore reduction in the permeability of the outer membrane of
Burkholderia cepacia can confer high level resistance to chloramphenicol (Bums et al.
1989).
The cytoplasmic membrane does not restrict the entry of lipophilic agents such as
fluoroquinolones, chloramphenicol, trimethoprim and rifampicin but does restrict
hydrophilic antibiotics such as erythromycin, clindamycin, sulfonamides and
aminoglycosides. The ingress of hydrophobic antibiotics is dependent on the active uptake
via transport proteins and resistance can be caused by alterations in their action. For
20
Chapter 1 General Introduction
example aminoglycoside resistance can be conferred by inactivation of the pumps that
require proton motive force (PMF) (Mingeot-Leclercq, Glupczynski, & Tulkens 1999).
1.1.2.4 Efflux
Efflux pumps are proteins that are involved in the extrusion of toxic substances from
within the cell and are found in Gram-positive and Gram-negative bacteria (Van
Bambeke, Balzi, & Tulkens 2000). Efflux is dependent on the proton motive force (PMF)
or the hydrolysis of ATP. Efflux systems that have a role in antibiotic resistance have been
described in many pathogenic bacteria including P. aeruginosa, Campylobacter jejuni,
Streptococcus pneumoniae, Salmonella typhi, S. aureus and E. coli (Lin, Michel, & Zhang
2002; Poole 2000).
Genes encoding efflux pumps, that extrude toxic compounds from the cell, have been
found in all sequenced bacterial genomes and confer antibiotic resistance in many
pathogenic bacteria. Efflux pumps can be categorised into five superfamilies. These are
the major facilitation family (MFS), small multidrug resistance family (SMR; Paulsen et
al. 1996b, resistance nodulation cell division family (RND; Saier et al 1994) and
multidrug and toxic compound extrusion family (MATE; Li & Nikaido 2004). The MFS
and SMR are more common in Gram-positive organisms while most efflux pumps in
Gram-negative bacteria are of the RND type. Antibiotic efflux pumps use the proton
motive force to generate ATP to export antibiotics out of the cell and are members of the
resistance nodulation cell division, major facilitation and multi drug and toxic compound
extrusion superfamilies (Pao, Paulsen, & Saier, Jr. 1998; Paulsen, Brown, & Skurray
1996; Poole 2000).
21
Chapter 1 General Introduction
P. aeruginosa and E. coli contain two of the most well studied efflux pump systems; the
MexAB-OprM system of P. aeruginosa (Li, Nikaido, & Poole 1995) and the AcrB system
of E. coli (Ma et al. 1995). Increased expression of these pumps can occur by mutation in
structural genes, regulatory genes or horizontal acquisition of plasmids or transposons.
1.1.2.5 Metabolic Bypass
Some antibiotics target enzymes in metabolic pathways. Resistance to antibiotics can be
mediated by use of alternative metabolic pathways that the antibiotic can not inhibit.
Resistance to sulphonamide and trimethoprim antibiotics occurs via metabolic bypass by
production of altered dihydropteroate synthetase and dihydrofolate reductase, respectively
(Then 1982).
1.1.3 Genetic Basis of Antibiotic Resistance
The genetic mechanisms whereby bacteria become resistant to antibacterial agents develop
by three ways: acquisition of resistance genes via plasmids and other transposable
elements (Guiney, Jr. 1984; Lacey 1984; Maiden 1998; Ochman, Lawrence, & Groisman
2000; Shapiro 1997), recombination of foreign DNA into the genome (Campbell 1962)
and spontaneous mutational events in chromosomal genes (Davies 1994).
In the absence of a selective pressure mutations in the chromosome are stochastic in that
the rates of beneficial mutations do not occur at higher frequencies than those that are
neutral or disadvantageous. However there has been some controversial evidence to
suggest that mutations can be directed to enhance growth (Cairns, Overbaugh, & Miller
1988). This is discussed later (section 1.2.3 and 1.2.8). For bacterial cells there is a finite
22
Chapter 1 General Introduction
probability that a mutation will occur conferring the resistant phenotype, and unless a
revertant mutation occurs, all the progeny of such a cell will also be resistant.
Spontaneously occuring mutations occur in the range of 10'6 to 10'8 mutations/ cell
division (Drake 1991). Resistance to streptomycin, rifampicin, fusidic acid,
fluoroquinolones and oxazolidinones occurs via mutation.
1.1.3.1 Transformation
Transformation is the uptake of naked DNA and is dependent on bacteria being
competent, a state in which they are able take up extraneous DNA. This ability was first
demonstrated in S. pneumoniae by Fred Griffiths in 1928 (Griffiths 1928). In 1944 Avery,
McCarty and Macleod showed that DNA was the vehicle for transformation (Avery,
MacLeod, & McCarty 1944). Some bacteria are naturally competent e.g. Streptococcus
pneumoniae, Bacillus subtilis, Neisseria gonorrhoeae and Haemophilus influenzae and
others can be induced to take up DNA by calcium chloride or heat shock treatment
(Johnsborg, Eldholm & Havarstein 2007).
1.1.3.2 Conjugation
Conjugation is a process by which DNA is transferred from the donor cell to the recipient
cell via the conjugation apparatus when cell surfaces are in contact. Conjugative transfer
of plasmids or transposons is responsible for the majority of bacterial gene transfer in the
environment and therefore the horizontal transfer of genes conferring antibiotic resistance.
However this process is not restricted to resistance genes. These processes have a wide
host range and allow the transfer of resistance genes across bacterial genera to remote
taxa. The same resistance gene has been found in varied bacterial species sampled from
23
Chapter 1 General Introduction
the gastrointestinal tract and from the environment. For example, alleles of TetM have
been found in a variety of Gram-positive and Gram-negative bacterial species (Roberts,
Chung, & Roe 1996; Salyers et al. 1995).
Conjugative transposons are DNA segments of 18 to 150 k.b.p. that are integrated in the
chromosome. These elements can excise to form non-replicating circular intermediates,
which can integrate into the recipient genome.
The importance o f these mechanisms is emphasised by the fact that between 10% and
16% of the E. coli chromosomal genome is foreign DNA arising from horizontal transfer
(Lawrence & Ochman 1997).
1.1.3.3 Transduction
During transduction DNA is transferred from a donor bacterium to a recipient through the
lifecycle of bacteriophages and this occurs in many pathogenic bacteria (Davison 1999).
This genetic transfer can occur in two ways. In the first, known as generalised
transduction, any portion of donor DNA can replace bacteriophage genetic material.
However the second, known as specialised transduction, involves replacement of
bacteriophage genes by a specific region of the host chromosome adjacent to the phage
attachment site. The transducing bacteriophages in both generalised and specialised
transduction are likely to be defective and cannot cause infection as essential genes have
been replaced. Not all bacteria are transducible and not all bacteriophages can transduce.
Bacteriophages may encode virulence factors, including shiga toxin in E. coli (Waldor &
Mekalanos 1996). Transduction of imipenem, cefotaxime and kanamycin resistance
24
Chapter 1 General Introduction
determinants has been described in nosocomial isolates of P. aeruginosa (Blahova,
Kralikova & Krcery 1992).
1.1.3.4 Stability of Acquired Elements
Many strains found in the environment carry resistance genes even if these strains are not
exposed to antibiotics (Andersen & Sandaa 1994; Gotz et al. 1996). A plasmid will be
maintained in a bacterial population if it contains genes that confer an added advantage in
addition to the resistance genes, e.g. genes that promote colonisation. Antibiotic genes can
also be propagated by integrons and transposons. Integrons are promoterless genes that
can be carried on conjugative plasmids and transposons, containing an integrase gene and
a cassette integration site into which gene cassettes can insert (Stokes et al. 1997). A gene
cassette usually contains a promoterless gene with a recombination site known as the 59
base element. Presence of integrons has been shown to be associated with increased
probability of the multidrug resistant phenotype in the Enterobacteriaceae (Leverstein-van
Hall et al. 2003). Transposons are mobile genetic elements found on plasmids or
integrated into the chromosome. These genes are composed of an attachment site, an
integrase and a promoter (Maiden 1998). Transposons frequently contain heavy metal
resistance genes in addition to antibiotic resistance genes and therefore increase the
likelihood of the antibiotic resistance genes being maintained in the population.
Acquisition of multiple antibiotic resistance determinants, including aminoglycoside
modifying enzymes, in strains of Acinetobacter calcoaceticus during a nosocomial
outbreak has been attributed to transposon transfer (Devaud, Kayser & Bachi 1982).
25
Chapter 1 General Introduction
1.1.3.5 Persister Cells
Within bacterial populations a small number of cells can survive exposure to antibiotic
concentrations that kill the majority of the cells. Survivors are known as persister cells and
were first described in Staphylococcus spp. exposed to penicillin by Bigger in 1944
(Bigger 1944). At this time Bigger proposed that these cells were dormant and it has since
been confirmed that these cells, when exposed to antibiotics, have limited growth with
downregulation of biosynthetic pathways (Balaban et al. 2004). Although the majority of
cells are not persisters their presence may allow the survival of a population following
antibiotic exposure and are likely to have a role in recalcitrant bacterial infections.
Surprisingly, unlike resistant mutants, this resistance is nonheritable and cultures grown
from persister cells have the same antibiotic susceptibility as the non-persister parent cells.
Persistence genes, such as the high persistence mutant gene (hip), have been identified that
result in an increased proportion of persisters (Moyed & Bertrand 1983; Moyed &
Broderick 1986). Biofilms favour formation of persister cells where the proportion of
9 5persister cells has been reported to be 10' (Spoering & Lewis 2001), as opposed to 10’ -
10'6 in planktonic cultures (Moyed & Bertrand 1983). As well as S. aureus persister cells
have been identified in P. aeruginosa, E. coli and Candida albicans biofilms (Brooun,
Liu, & Lewis 2000; Spoering & Lewis 2001; Lafleur, Kumamoto & Lewis 2006).
1.1.4 Use of Antibiotics and Antimicrobial Resistance
Few studies have investigated the effect of reduction in antibiotic use in humans, and
subsequent levels of resistance in bacterial populations. Reduction in antibiotic use results
in an observed decrease in the frequency of penicillin resistance in pneumococci (Nowak
26
Chapter 1 General Introduction
1994). However resistance in the population does not disappear and some resistant
organisms will persist. If the selective pressure of the antibiotic is restored then these
resistant strains can take over the previously susceptible population. This has been
demonstrated by Gerding and colleagues during their study of the return to use of
gentamicin in a hospital and observed the rapid increase gentamicin resistant isolates
(Gerding ^ al. 1991).
Reduction in macrolide use within an outpatient population in Finland during the 1990s
resulted in a decline in erythromycin resistance in Group A streptococci isolated from
throat swabs and pus samples (Seppala et al. 1997). However a series of studies that
evaluated the effect of antimicrobial use on penicillin resistant S. pneumoniae carriage in
children demonstrated that carriage of penicillin resistant isolates increased despite
reduction in antibiotic use for respiratory tract infection (Arason et al. 2002; Arason et al.
2006). A similar pattern of increased resistance despite reduced antibiotic use has been
observed in Sweden (Hogberg et al. 2006).
An increase of 16% in fluoroquinolone use in Spain between 1997 and 2001, due to the
introduction of levofloxacin and moxifloxacin, did not result in the expected
corresponding increase in ciprofloxacin resistance in S. pneumoniae (Garcia-Rey, Martin-
Herrero, & Baquero 2006). No significant association between fluoroquinolone use in
hospitals and fluoroquinolone resistance in P. aeruginosa and S. aureus has been
demonstrated (MacDougall et al. 2005).
Austin et al attempted to quantify the relationship between antibiotic use and frequency of
resistance using epidemiological models. Their findings suggested that significant
27
Chapter 1 General Introduction
reduction in antibiotic use is required to cause a significant decline in resistance. This
decline in resistance is likely to occur at a lower rate than the initial emergence of the
resistance (Austin, Kristinsson, & Anderson 1999).
1.2 Mutation Rates
1.2.1 Mutation and Mutagens
A mutant organism is defined as a bacterium that varies in a characteristic from its
parental strain and that can pass on this new characteristic to its progeny. For this variation
to be inherited, a change, or a mutation, must occur in the genome of the organism.
Variation in bacteria can also be by the acquisition or loss of genetic elements, such as
plasmids and transposons but bacterial genotypes are generally stable. Selection may lead
to predominance of the new variant characteristic. Of all the genes present in a genome
only a subset will be expressed in any given set of conditions. These expressed genes will
represent the phenotype of the organism as this confers the detectable characteristics of the
organism. Therefore the phenotype of an organism may be very variable.
Mutations occur without any transitional state and arise continuously at low frequencies
even in favourable growth conditions. Induction of mutation may be due to cellular
function, interaction with the environment or exposure to a mutagenic agent (mutagen).
Many spontaneous mutations occur following errors during replication and repair. Cellular
repair systems remove most of the erroneous bases but a small proportion will remain
without being corrected. Many mutagens are encountered by bacteria and mutagenic
activity often occurs by production of reactive oxygen species (OH radicals, superoxide
anions and hydrogen peroxide) that result in damage to DNA (table 1.1).
28
Chapter 1 General Introduction
Mutagenic Agent MethodIonizing Radiation Causes breakage of the phosphate-deoxyribose of DNA. Single or
double stranded breaks produced.Ultraviolet Light Formation of thymine dimers. Cause DNA distortion. Mostly base
substitutions.Deaminating agents e.g. nitrous acid
Modify bases. DNA polymerase will not recognise base causing erroneously pairing and mutation.
Base analogues e.g. 5-bromouracil and 2-aminopurine
Integrated into DNA by polymerase. Different pairing capacities with bases depending on the tautomeric form.
Alkylating Agentse.g. ethylmethanesulphonate
Covalently bind alkyl residues to bases, causing random pairing.
Intercalating agents e.g. ethidium bromide, acrid ine orange
Flat molecules intercalate between bases. Causes frameshift mutations.
Cross linking agents e.g. mitomycin C
Covalent binding of bases on opposite strands of DNA helix. Stop unwinding of helix and block DNA synthesis
Table 1.1 Modes of action of mutagens (Griffiths et al. 2000)
The consequences of single point mutations depend on the nature and location of the base
substitution within the codon. These mutations can cause alterations in the amino acid
residue encoded (missense mutation) or may leave the amino acid unchanged (silent
mutation). There are two types of base pair substitution; transitions (purine to purine or
pyrimidine to pyrimidine) or transversions (purine to pyrimidine or pyrimidine to purine).
Deletions and inversions may also occur and can have a greater effect. These mutations
can change the phenotype of the cell by causing changes in the reading frame, and these
are termed frameshift mutations.
An antibiotic resistant mutant may occur due to mutation in a resistance conferring gene
of a susceptible strain. The initial isolate is referred to the ‘wild type’ or susceptible
parent. The term ‘wild type’ is arbitrary and should be used to describe the first observed
state of the gene in question, in this case susceptibility to an antibiotic. Subculture of this
29
Chapter 1 General Introduction
‘wild type’ may allow mutations to arise causing deviation from the initial state. Therefore
efforts should be made to maintain the genotype of the characterised reference strains.
1.2.2 Mutation Rate versus Mutation Frequency
A mutation rate is an estimation of the probability of a point mutation occurring at each
cell division and corresponds to the probability of a mutation occurring in the lifetime of a
bacterial cell. A mutation frequency is simply the proportion of mutant bacteria in a
culture. These two terms are often wrongly used interchangeably, causing confusion.
Mutation frequency gives no indication of when the mutation occurred in the lifetime of
the cell; if a mutation occurred early in the lifetime of the cell then a large number of
mutant clones will be present, resulting in a high mutation frequency. This is known as a
'Jackpot Culture' and is a rare event. This phenomenon was first described in 1943 by
Luria and Delbriick during their classic set of experiments on bacterial mutation (Luria &
Delbriick 1943).
1.2.3 The Fluctuation Test of Luria and Delbriick
Luria and Delbriick demonstrated that bacteriophage resistant mutant colonies of E. coli
arise from a sensitive culture if T1 bacteriophage was present in excess (Luria & Delbriick
1943). The E. coli culture was grown up in either nutrient broth (containing 0.5% NaCl) or
asparagin-glucose synthetic medium. Their initial inocula contained between 50 and 500
bacteria. Resistance was detected by lack of clearing of the culture. Resistant colonies
appeared from sensitive cultures, in which there was clearing within a couple of hours.
These bacteria were resistant to bacteriophage T1 but sensitive to other viruses active on
30
Chapter 1 General Introduction
that strain of E. coli. They showed that reversion to sensitivity must be a rare event as
when the bacteriophage was mixed with resistant bacteria no increase in the titre of the
bacteriophage occurred. In a growing culture the proportion of resistant bacteria will then
increase with time. If the presence of the phage was needed to trigger the change to
resistance then the distribution of mutant colonies should demonstrate a Poisson
distribution. However the high variance in the mutant numbers led Luria and Delbriick to
hypothesize that resistant mutants were present in the culture before bacteriophage
exposure and that the mutation arose independently (Luria & Delbriick 1943). At the time
this settled the issue of whether such resistant bacteria arise via random mutation or
directed mutation from a selective pressure as it proved that mutations occur randomly
during non selective growth. If mutations are random, the mutational events that are
occurring are random in the sense that they do not occur at a higher rate if they are
advantageous and that natural selection occurrs. If mutations are directed this would mean
that the mutation rate conferring an advantage to a cell would be higher. For both of the
hypotheses the resistance is inherited. If mutations are random, i.e. are not directed, then
mutations will be clustered within a small subset of the population. If mutations are
directed, the mutants will be more evenly spread throughout the whole population.
However there has since been much debate over whether mutations can be directed
towards being advantageous to the cell (see section 1.2.8).
Luria and Delbriick assumed that, for a bacterium, there was a small fixed chance that a
resistance conferring mutation could occur per unit of time, if the bacteria are ‘in an
identical state’. The numbers of mutated cells in a culture depend on how early the
mutation occurred during growth of the bacterial population. If mutation occurs early in
the culture, the number o f mutated cells will be higher than if it occurs later. This makes
31
Chapter 1 General Introduction
mutation frequencies inaccurate as it does not reflect the stochastic nature of mutant
accumulation. Mutation rates, on the other hand, are more accurate and reproducible.
1.2.4 Determination of Mutation Rate
Broadly, there are two methods for determination of mutation rate. These are the mutation
accumulation method and fluctuation analysis (Rosche & Foster 2000). The mutant
accumulation method can be very accurate but is involved and time consuming. This is
because the culture needs to be sampled at a series of time points. In this method cultures
are grown exponentially until probability dictates that a mutant will be present. If we
assume that the growth rate of wild type bacteria and mutant bacteria is the same then the
proportion of mutants will increase linearly with time. Furthermore if the number of
mutants and the total number of bacterial cells is known, at various time points, then the
mutation rate (ju) is the gradient of the line of number of mutants against generation
number. Terms are defined in Table 1.2.
Term Definitionm Number of mutations per culture
P Mutation rater Observed number of mutants
r Median number of mutantsC Number of cultures
Po Proportion of cultures without mutantsNo Initial Number of Cellsf Mutant frequencyn Number of generations
Table 1.2 Definition of Terms
32
Chapter 1 General Introduction
For this method, a very large total cell number is needed with a long time period between
Nj (number of cells at first time point) and N2 (number of cells at second time point)
Serial dilutions would make this easier to perform but this introduces sampling errors. If
available, continuous culture would be an alternative but this would allow selection of
waves of bacteria, each better suited than the generation before, to take over the culture.
Moreover Billington et al have shown that single point mutations can impose a significant
fitness deficit which undermines one of the basic premises of the mutant accumulation
method (Billington, McHugh, & Gillespie 1999). For these reasons a fluctuation analysis
method is more commonly used. The introduction of this technique was a pivotal event in
mutational research.
1.2.5 Fluctuation Analysis
A fluctuation analysis involves estimating the mutation rate from the distribution of
mutants in a number of parallel cultures. This method was pioneered by Luria and
Delbriick (Luria & Delbriick 1943). Briefly an initial inoculum of cells (of known culture
volume) from a growing culture is added to a broth, which is then incubated at appropriate
conditions in the absence of selective pressure. The cultures are then centrifuged to
concentrate the cells. Screening for antibiotic resistant cells is performed by plating the
cell deposit onto solid media containing a concentration of antibiotic, usually at 2 - 4 times
that of the MIC. This will kill all sensitive cells and only the resistant mutants will remain.
A plate count is performed on a proportion of the culture, as a measure of the number of
cells in the cell deposit. A series of log dilutions of the cell deposit are performed and
inoculated on agar not containing the test antibiotic. The number of colony forming units
per mL of the deposit can then be determined. Luria and Delbriick then suggested two
33
Chapter 1 General Introduction
methods for estimating the overall mutation rate for the population: the po method which
is based on the proportion of cultures in which no mutants are observed and the method of
the mean which relies on the determination of the mean number of mutants. Both methods
assume a Poisson distribution with a mean and variance equal to the product of the
probability of a mutation and the number of bacteria i.e. the ratio of variance of the mean
is one. All of the methods described (Table 1.3) utilise the fluctuation analysis and use an
estimate of the probable number of mutations that are the responsible for the distribution
of mutations (m). This m is the number of mutations, not mutants, and will be controlled
by the amount of growth and the mutation rate (ju) itself. The estimated value of m can be
divided by the total number of cells to give the mutation rate. There are a number of
different methods available for the estimation of mutation rate. Different methods are
appropriate depending on the predicted number of mutations per culture (m).
Method Value of m (number of mutations per culture)
References
Po Method 0.3 < m < 2.3 Luria & Delbriick 1943Method of the Mean None Luria & Delbriick 1943Lea and Coulson Method of the Median
1.5 < m < 15 Lea & Coulson 1949
Drake Formula m >30 Drake 1991MSS Maximum Likelihood Method
AH Sarkar, Ma, & Sandri 1992
Koch's Quartiles Method
2 < m < 14 (See Koch et al for values outside range)
Koch 1982
Jones Mediator Method
UnknownWorks when 1.5 < m > 10
Jones et al. 1994
Table 1.3 Mutation rate estimation methods which are appropriate for different numbers
of mutations per culture
34
Chapter 1 General Introduction
1.2.5.1 The po method
The po can be used for selection of mutants on either liquid or solid media. This is the
simplest method to calculate and was originally described by Luria and Delbriick (Luria and
Delbriick, 1943). It is most suitable when the number of mutational events in a culture is
low. This was initially apparent as few cultures (if any) exhibited resistant colonies. The
proportion of cultures without mutants (po) is the zero term of the Poisson distribution given
by equation 1.
Po - Eq [1]
This method should only be used if the proportion of cultures without mutants is between
0.1 and 0.7 i.e. the number of mutations per culture (m) is between 0.3 and 2.3. The formula
can be rearranged to give the number of mutations (Equation 2).
m= -In po Eq [2]
As cultures are scored as positive or negative there is no need to enumerate the number of
colonies (Foster, 2004).
The precision of m (number of mutations per culture) varies depending on the value of p 0.
Compared with other methods the po method requires more cultures for the same level of
precision. The method is not affected if the mutant growth rate is slower than that of the
wildtype. However this is only true if each clone of mutants gives rise to a colony, post
selection. If the clone does not give rise to a colony then that mutant will contribute to the
proportion of cultures without mutants. Conditions need to be chosen so that the
35
Chapter 1 General Introduction
proportion of resistant colonies is not too large or too small. When the proportion of
mutants detected is known then the actual value of m can be calculated. When this method
is chosen the investigator should design the experiments so that 10-70 % of the cultures
have no mutants and the number of mutations is between 0.3 and 2.3. This can be
achieved by limiting the volume of the culture or by plating only a proportion of the
culture.
1.2.5.2 Lea and Coulsons Method of the Median
Median methods should not be used if more than half the plates are devoid of mutants.
Such methods are of most use when all or most of the cultures give rise to visible mutant
colonies. Numbers of mutations per culture (m) is determined by equation 3.
r/m-ln(m) - 1.24 = 0 [3]
1.2.6 Parameters
For each mutation rate experiment there are three main parameters which need to be
considered (Rosche & Foster 2000). The first of these is that the expected number of
mutations (not mutants!) per culture (m) should not be less than 0.3. The number of
mutations depends on the mutation rate itself and the amount of growth. The value of m
can be varied by plating different volumes of culture but this can introduce errors. The
method chosen will depend on the expected value of m.
36
Chapter 1 General Introduction
The second parameter is the number of parallel cultures chosen to represent the bacterial
population. For all methods the precision of m is a function of 1 / V c and increases as C
increases. Therefore if more cultures are tested then precision is increased. For the po
method a precision level of 20 % is considered necessary to estimate the number of
mutations per culture (Rosche & Foster 2000).
The final parameter is the size of the initial inoculum (No). As this inoculum should not
contain any pre-existing mutants or generate too many mutants, the initial inoculum
should be small. This inoculum, however, needs to be large enough to represent the
bacterial population. For example Luria and Delbriick used an initial inoculum of between
50 and 500 bacteria. The smaller the initial inoculum, the longer the incubation period that
is required. This is especially important when working with slow growing cultures e.g.
Mycobacterium tuberculosis. There are other complications involved in growing small
numbers of organisms. For example many organisms monitor the density of cells via
‘quorum sensing’ and only switch on virulence genes after a certain cell density of
bacteria are present (Parsek & Greenberg 2000). They do this by the production and
detection of moieties such as N-acyl-L-homoserine lactones (AHLs). In M. tuberculosis
resuscitation promoting factors, originally identified in Micrococcus luteus (Mukamolova
et al. 1998; Mukamolova et al. 2002), have been identified that promote recovery from a
non replicating phase and increase cell growth. Therefore it may be necessary to stimulate
the growth of small numbers of cells by stimulatory proteins. In each parallel culture the
final cell number (Nt) should be the same. No should always be negligible compared to Nt
(a ratio of at least <1/1000 is desirable). However a culture started from a small number of
cells will take longer to grow. In addition a small inoculum may produce a reduction in
viability resulting in greater variation in the final number of cells. Variations in Nt can be
37
Chapter 1 General Introduction
eliminated be using a large initial inoculum. Rosche and Foster have found that in their
experiments a good rule of thumb is to use an initial inoculum of total cells of mNtl 104
(Rosche & Foster 2000). This represents a compromise between the above factors.
In order to observe a mutation, it is necessary to have a large enough volume of cells,
therefore the volume of the broth used will depend on the mutation frequency. If the
frequency is high then a small broth culture can be used. However if the rate is low then
large cultures should be used. To avoid inclusion of pre-existing mutants in the initial
inoculum counterselectable markers or fluorescence-activated cell sorting methods can be
used (Rossman, Goncharova, & Nadas 1995). The initial inoculum of cells should contain
cells that are in the same phase of the growth cycle.
All of the above parameters should be kept constant between experiments.
1.2.7 Assumptions of Fluctuation Analysis
There are a number of assumptions that are made in order to perform a fluctuation
analysis. These assumptions are summarised (Table 1.4).
The probability of a mutation occurring is constant per cell lifetime
The probability of this mutation occurring does not vary between growth phases
There is no cell death
Revertants occur at a negligible rate
Mutation occurs only during cell division and results in only one mutant
Growth rates of mutants and non mutants are the same
Initial cell numbers are negligible compared to final cell numbers,
All mutants are detected and no mutants occur after selection is imposed.
Table 1.4 Assumptions of mutation rate estimation
38
Chapter 1 General Introduction
It should be remembered that all of the available methods only provide a way of
estimating mutation rates. Each method relies on a set of pragmatic assumptions that are
made in order to make estimations possible and therefore each mutation rate is only an
estimate and can not represent exactly what is happening in vivo.
1.2.8 Directed Mutation Controversy
Strategies that are used to estimate mutation rates assume that mutagenesis is spontaneous
and random in the sense that it is not directed. Mutations in the chromosome are therefore
stochastic in that the rates of beneficial mutations do not occur at higher frequencies than
those that are neutral or disadvantageous.
Luria and Delbriick’s experiments provided evidence that mutations do not occur in a
directed manner (Luria and Delbriick 1943). However this has since been an area of
controversy. Experiments have been performed that provide evidence on both sides,
although the evidence suggests that directed mutation is unlikely. In 1952 Lederberg and
Lederberg used replica plating from non selective media to selective media as way to
indirectly select mutants (Lederberg & Lederberg 1952). They noted that the location of
mutants on the replica plate corresponded to the location on the master plate. Therefore
these mutants must have been present prior to the selection. This provided further
evidence for random mutation. However in 1988, it was observed mutations from Lac" to
Lac+ in E. coli occur more frequently if lactose is present than if there is no lactose present
(Cairns, Overbaugh, & Miller 1988). Subsequently it was pointed out that the low
variance to mean ratio noted by Cairns, Overbaugh and Miller may have been due to
deviations from the underlying assumptions (Lenski, Slatkin, & Ayala 1989). For example
resistant mutants that grow on selective media may exhibit slower growth on non selective
39
Chapter 1 General Introduction
media. This will result in fewer progeny cells and would decrease the variance to mean
ratio. This may become a problem if mutations are directed. However this can be
overcome. If mutations occur after plating then the rate of mutation will reflect not only
the mutations occur during growth in the aliquots but also those appearing on the solid
media. This risk can be reduced by counting the number of mutants soon after plating and
post plating mutations can be considered negligible.
Hendrickson et al have proposed a mechanism by which apparent directed mutation can
be explained by natural selection (Hendrickson et al. 2002). During growth limitation
bacterial cells are selected that contain an amplification of a mutant lac gene that enables
the cells to utilise the available lactose. This selection increases the probability of a
reversion occuring to lac +. This appears to direct mutation to allow bacterial growth.
1.2.9 Deviations from the Assumptions
Mutation rates may be higher during the growth phases where there is a faster rate of
replication i.e. in the exponential phase. Resistant mutants may have a lower growth rate
than the wild types due to a physiological fitness costs (Andersson & Levin 1999;
Billington, McHugh, & Gillespie 1999; Gillespie & McHugh 1997). The net effect of this
is to increase the variance of distribution. It is also possible that not all mutations are
detected. For example mutations that occur late in the culture may not give rise to visible
colonies and these mutants will not be included in the estimation. This phenomenon is
known as phenotypic lag. It is also conceivable that mutations may occur after selection
has been imposed i.e. mutants may arise on the antibiotic containing solid media.
40
Chapter 1 General Introduction
Reversions to the sensitive phenotype are assumed to be negligible. In the absence of
selective pressure reversion mutations can and do occur, however. For example reversion
to linezolid susceptibility in clinical isolates of S. aureus has been shown to occur (Meka
et al. 2004). Reversion to wildtype may occur by mutation, loss of a gene or by a
compensatory mutation in a resistance gene (Bjorkman et al. 2000).
There are a number of other factors that complicate calculation of mutation rates. For
example mutation rates are not constant in a population of cells. They can vary depending
on antibiotic concentration (Kohler, 1997), availability of the carbon source (Hughes &
Anderson 1997) and whether the bacterium is under stress or not (Shapiro 1997). Under
stress the mutation rate is likely to be higher (O'Sullivan, McHugh, & Gillespie 2005).
Additionally the presence of cells prone to mutation (containing mutations in repair genes)
(LeClerc et al. 1998) and so will exhibit an increased mutation rate of the whole
population. Such mutator phenotypes can be beneficial to bacteria as variation may
provide an advantage in changing conditions. However once the bacterium has adapted to
the selective pressure then cells with high mutation rates may lose their advantage as some
important function that is not needed for immediate survival may be lost (Giraud et al
2001). Classical evolutionary theory would consider bacterial cells with the highest rates
of replication as the fittest organisms. However a slow replication rate may still increase
fitness as in the presence of a selective pressure, e.g. an antibiotic, a mutation may confer
enough of a benefit to the slower replicator so that it can displace the fast replicator
(Burch & Chao 2000). This has been confirmed using ‘digital organisms’ where at high
mutation rates, faster replicating organisms were outcompeted by organisms with the
lower replication rate with a selective advantage (Wilke et al. 2001). Some antibiotics can
also increase the frequency of mutations in the genome (Mamber et al. 1993). For
41
Chapter 1 General Introduction
example fluoroquinolones have been shown to induce the SOS response in E. coli and
Salmonella (Mamber et al. 1993). During the SOS response, which is controlled by
products of lexA and RecA, the expression of polymerases is upregulated but these have a
higher error rate as gaps, which are opposite thymidine dimers, are filled in by replication
and not recombination. This increases the mutation rate (Gillespie et al 2005).
Sarkar et al attempted to improve the Luria and Delbriick model by considering the effect
of nonsynchronous division and the effect of cell death (Sarkar 1991). It was proposed that
mutants have a lower mutation frequency than wildtype cells. This may be due to a
reduction in fitness or a reversion to the susceptible phenotype. It was suggested that this
could be addressed by plating only a proportion of the final culture and calculating
moments of the distribution. However Sarkar failed to consider the concept of phenotypic
lag, which caused discrepancies between calculated mutation rates and in vivo rates.
Phenotypic lag, describes the observation that mutations that occur late in the culture may
not give rise to colonies. Armitage et al (Armitage 1952) identified the existence of
phenotypic delay for the mutation described by Luria and Delbriick. Most methods do not
take this factor into account, but Armitage et al subsequently introduced this extra
parameter into the Lea and Coulson model (Armitage 1953). The results of this approach
indicate that the outcome of fluctuation analysis tests may depend on the size of the
original inoculum, however Armitage did not address this. A possible explanation is that a
small proportion of cells in the inoculum may result in progeny that have a different
mutation rate than the average cell. Therefore smaller inocula may not contain such cells.
Phenotypic lag will increase the variance of the final distribution and will affect the lower
end of the distribution more than the upper end. This alters the shape of the distribution as
mutants that arise near the end of the culture period will not be expressed and will
42
Chapter 1 General Introduction
therefore be underestimated in the culture. Koch has suggested estimating the duration of
the lag in generations (n) and calculating the values of m using values of r in quartiles that
are lowered to 2n of the values which are observed (Koch 1982). The value of m is then
multiplied by 2n-l to give the final estimated number of mutations.
It is assumed that all mutants are detected. However Ma et al (Ma & Sandri 1992) and
Jones et al (Jones et al. 1994) have altered their fluctuation analysis method to allow for
only an aliquot of the culture volume to be plated. Crane et al have proposed a modified
fluctuation assay for estimation of mutation rates where small increases in mutation rate
are expected (Crane, Thomas, & Jones 1996). In their method a proportion of large broth
is examined as opposed to the original method of using a small culture. This allows the
detection of small increases in mutation rate using small numbers of cultures.
1.2.10 Detection of Resistant Mutants
For all mutation rate estimation methods a number of parallel cultures are inoculated with
a small number of wildtype bacteria i.e. no resistant mutants will be present in the initial
inoculum. The culture is incubated and the number of cells in the culture at Nt is calculated
by plating out the culture onto non selective media. To determine the number of resistant
mutants the aliquots are cultured onto solid selective media containing the antibiotic.
Antibiotic resistance of mutants is used as a selective marker for estimation of mutation
rate but there may be other markers that could be used (see section 6.5). Using an
antibiotic as a tool is distinct from the examination of the effect of antibiotics on the
mutation rate.
43
Chapter 1 General Introduction
No satisfactory solution of the Luria and Delbriick distribution has been found that
effectively describes the distribution numerically. Therefore extensive attempts have been
made to improve the accuracy of the estimates (Asteris & Sarkar 1996; Kepler & Oprea
2001). It is important to note that mutation rates estimated via different methods cannot be
compared.
1.2.11 Hypermutability
Within populations of pathogenic bacteria, some bacterial clones have a higher
spontaneous mutation rate than the majority of the population. These variants exhibit the
mutator phenotype and are therefore known as ‘mutators’ and owe their high mutation
rates to defects in proof reading and repair mechanisms. These defects are likely to be in a
methyl directed mismatch repair system that is encoded by mutH , mutL, mutS, dam and
uvrD and defects causing an increase in mutation rate are commonly due to loss of activity
in mutS (LeClerc, Li, & Payne 1996; Matic et al. 1997; Miller 1996; Sniegowski, Gerrish,
& Lenski 1997). Mutation rates may be between 10 - 10,000 fold higher than the non
mutator wildtype but this depends on the nature of the mutator allele. Mutator bacteria
exist in populations of pathogenic bacteria and have been described in E. coli, (LeClerc,
Li, & Payne 1996; Matic et al. 1997) Salmonella spp. and P. aeruginosa (Oliver et al.
2000; Oliver et al. 2004).
1.2.12 High Mutation Rate leads to Adaptation
As stress is ever present for bacteria in the environment an organism that can adapt to
changes is more likely to survive. Therefore it can be beneficial for the bacterial
44
Chapter 1 General Introduction
population to be heterogenous, increasing the probability that a subset of cells will
survive. This ‘bet-hedging’ may be a useful strategy in uncertain environments and may
promote survival. However few mutations are beneficial, most are deleterious. Therefore
the mutation rate that has evolved represents a compromise between allowing adaptation
and avoiding excessive deleterious mutations. Bacteria that have a higher spontaneous
mutation rate than the majority of the population are more likely to gain resistance via
mutation in chromosomal genes.
Mutation rates may be higher for individual mutants within a bacterial population as a
whole. Genotypes with lower mutation rates than the mutator may also exist in the
population but these mutation rates are still higher than rates in the wild-type (Giraud et
al. 2001). During colonisation of the mouse gastrointestinal tract by E. coli a higher
mutation rate was observed. This could prove advantageous as initial adaptation to a new
environment may occur more readily. However deleterious mutations that occur after
colonisation may accumulate and become problematic (Giraud et al. 2001).
1.2.13 Mutator Phenotypes Select for Antibiotic Resistance
Homology in DNA sequence is required to allow recombination to occur between
bacteria. This prerequisite acts as a barrier to exchange between species. However it has
been shown that recombination can occur between E. coli and S. typhimurium in mutants
defective in the mismatch repair genes mutL, mutS and mutH (Rayssiguier, Thaler, &
Radman 1989). Therefore mutators that are defective in their methyl-directed mismatch
repair genes display both a hypermutable phenotype and are more likely to transfer genetic
elements across species barriers. This may result in increased selection and spread of
45
Chapter 1 General Introduction
antibiotic resistance genes. These mutators are also more likely to accumulate
compensatory mutations which may reduce the physiological cost of the target site
modifications that decrease susceptibility (Andersson, Bjorkman, & Hughes 1998;
Bjorkman et al. 2000). These bacteria therefore represent a challenge for reducing rates of
antimicrobial resistance.
1.2.14 Fitness of Mutators
It is possible that mutators may have an increased growth rate due to reduced use of cell
resources on repair of damaged DNA. However there is very limited evidence for this
increased fitness (Sniegowski et al. 2000). Through the use of competition assays between
the mutator and non-mutator phenotypes Chao and Cox demonstrated that mutators have a
small but measurable decrease in growth rate (Chao & Cox 1983). Progeny will also have
defects in repair mechanisms and may accumulate further costly mutations. However
mutators can be at an advantage due to increased rate of mutations that confer some
advantage to the cell. There may be a selective pressure for mutators that increase the
frequency of the phenotype in the population as the long term fate of the mutator allele is
linked to the mutations that occur as a result. If beneficial mutations occur the mutator
phenotype may ‘hitch-hike’ on the back of the beneficial mutation that provides a
selective advantage (Chao & Cox 1983). For this to occur the beneficial mutations must
occur in the mutator population before they occur in the wild type population. As the
numbers of mutators is lower than non-mutators then the mutation rate must be increased
to the point that allows for this. Relative numbers of mutators are unlikely to exceed 1 O'
compared to the rest of the population. Therefore the mutation rate must be at least 1000
fold than the wild-type for the mutators to be maintained in the general population (de
46
Chapter 1 General Introduction
Visser, 2002). Certain loci in the genome may have an increased mutation rate while
housekeeping genes may be expected to have a lower rate (Moxon et al. 1994). This
allows the exploitation of adaptability but minimises the detrimental effects of
accumulation of costly mutations.
1.2.15 Stability of Mutators
If a mutator allele is eventually fixed in a population then it is possible that all cells in the
population will have increased mutation rates. It is unlikely that reversion to fully
functional repair genes will occur. Horizontal acquisition of functional genes is more
likely (Brown et al. 2001). It has been shown that the mutator phenotype is retained in E.
coli following 11500 generations of growth (Sniegowski, Gerrish, & Lenski 1997).
Therefore it is unlikely that mutators will be lost from the population.
1.3 Fitness
1.3.1 Importance of fitness
Fitness is a complex characteristic that encompases the ability of a genotype to reproduce
within a host, be transmitted and survive in defined environments.
When bacteria are exposed to antibiotics a mutation conferring resistance to that antibiotic
is likely to give the bacterium an advantage in the presence of the antibiotic. However it is
accepted dogma that a resistant organism pays a physiological price for resistance,
particularly resistance mediated by chromosomal mutations (Levin, Perrot, & Walker
2000). It is believed that following rational use of antibiotics, antimicrobials are removed
47
Chapter 1 General Introduction
from the environment and in the absence of a selective pressure, resistant mutants will be
out-competed by their susceptible counterparts and will be lost from the population.
Although studies have shown that acquisition of antibiotic resistance can incur a
biological cost (Andersson & Levin 1999; Gillespie & McHugh 1997) there is evidence
that some mutations conferring resistance may result in low or no fitness deficit (Gillespie
2001; Gillespie, Voelker, & Dickens 2002; Kugelberg et al. 2005). Thus, quantification of
fitness costs is important when determining the stability of antibiotic resistance in a
population.
1.3.2 Fitness and Antibiotic Resistance
The major factors that influence the frequency of antibiotic resistance in a population of
bacteria are the extent of antibiotic exposure, the cost of resistance and the extent that the
bacteria can compensate for this cost. Within a population of bacteria different genotypes
must compete with each other to fill a niche. Therefore, the incidence of resistance can be
reduced by the rational use of antibiotics as resistant bacteria can be selected against in the
absence of antibiotics due to a fitness cost. However, resistance will not disappear from
the population, if mutations conferring resistance have a low fitness cost, or no cost, then
these mutants may remain at high levels in the bacterial population if antibiotic use is
withdrawn or may return to high frequencies if antibiotic pressure is reintroduced.
1.3.3 Measuring Fitness
In vitro models of fitness have been used in order to investigate the evolution of antibiotic
resistance and to assess the physiological price associated with acquisition of resistance.
The growth rate of bacteria in liquid culture medium is a commonly used model for
evaluating fitness (Bennett, Dao, & Lenski 1990; Kugelberg et al. 2005; Lenski et al.
48
Chapter 1 General Introduction
1998; Lenski, Simpson, & Nguyen 1994; Nguyen et al. 1989). Relative fitness of a
resistant mutant compared to the susceptible parent is often determined by assay of
competition between isogenic antibiotic susceptible and antibiotic resistant bacteria in
culture or in animal models. Fitness costs have been measured in a number of ways.
Growth rate in culture media is a good model for evaluating fitness, as are paired
competition experiments (Billington, McHugh, & Gillespie 1999; Davies et al. 2000;
Gillespie et al. 2002; Komp et al. 2005). In liquid culture relative fitness is defined by the
difference in number of generations that have occurred between the susceptible parent and
the mutant. These methods minimise observed variation and allow fitness costs to be
calculated in terms of generations.
The models selected should aim to reflect growth and environmental survival conditions
of the bacterial species of interest, and can be confounded by variations in measurements
in experimental procedures. No one method in isolation is likely to be sufficient to
describe in vivo fitness and multiple models are required. The models selected will depend
on the organism and its mode of transmission. Fitness deficits will vary depending on the
resistance mutation, the organism and the model used to quantify the cost. For example
Sanchez et al assessed the fitness costs associated with overproduction of multidrug efflux
pumps in P. aeruginosa using survival in water, maintenance on dry surfaces, biofilm
formation, nematode killing, production of pyocyanin and pyoverdin and quantification of
proteases (Sanchez et al. 2002). Mutants were shown to have fitness costs in terms of
resistance to dessication, survival in water, loss of quorum sensing response and loss of
virulence in the nematode killing model. However the nalB mutant exhibited greater
biofilm formation than the wild type (Sanchez et al. 2002).
49
Chapter 1 General Introduction
Most studies investigating fitness costs use in vitro models while few have used animal or
human in vivo models. These in vivo studies commonly use competitive colonisation to
measure fitness (Johnson et al. 2005). Fitness of fluoroquinolone resistant C. jejuni, was
assessed via colonisation and persistence in chickens in the absence of antibiotic selective
pressure (Luo et al. 2005). It is unrealistic to assume that in vitro assays, using biological
rich media, will accurately reflect the fitness costs experienced by the pathogen during
infection. Fitness deficits may be affected by growth conditions (Durso, Smith, & Hutkins
2004; Remold & Lenski 2001). Therefore use of minimal media may be more appropriate
if in vivo models are not possible. Competitive colonisation of human skin by
Staphylococcus epidermidis has been used to measure fitness costs associated with
fluoroquinolone and fusidic acid resistance (Gustafsson, Cars, & Andersson 2003).
1.3.4 Cost of Fitness
1.3.4.1 Chromosomal Mutations
Antibiotic targets that are altered by chromosomal mutations to confer resistance include
DNA gyrase, RNA polymerase, the cell wall or the ribosome and these alterations can
cause a reduction in fitness (Andersson & Levin 1999; Gillespie & McHugh 1997; Levin,
Perrot, & Walker 2000). Mutations in rpsL confer streptomycin resistance in Salmonella
typhimurium due to changes in the ribosomal protein S I2. These mutants have been
shown to be less fit than the wild type due to a decrease in peptide elongation rate,
resulting in decreased protein synthesis and growth rate (Bjorkman, Hughes, & Andersson
1998). Chromosomal mutations in RNA polymerase (rpoB) that confer resistance to
rifampicin are associated with a fitness cost in S. aureus and M. tuberculosis (Billington,
McHugh, & Gillespie 1999; Moorman & Mandell 1981; Wichelhaus et al. 2002). The
50
Chapter 1 General Introduction
extent of this fitness cost depends on the nature of the resistance mutation (Billington,
McHugh, & Gillespie 1999).
In 1953, Barnett and colleagues showed that resistance to isoniazid in M. tuberculosis
ameliorated disease in a guinea pig model (Barnett, Busby, & Mitchison 1953). Molecular
tools have since shown that point mutations in katG confer isoniazid resistance. Functional
katG, integrated to the genome, restored virulence to wild type levels (Wilson, de Lisle, &
Collins 1995). In the mouse model, resistant strains of M. tuberculosis vary in virulence
(Ordway et al. 1995), however the degree of drug resistance was not correlated with a
reduction in virulence.
A number of mutations, conferring antibiotic resistance, which do not incur measurable
fitness costs have been described. These include mutations in topoisomerase genes
conferring fluoroquinolone resistance in S. pneumoniae (Gillespie, Voelker, & Dickens
2002), vancomycin resistance in Enterococci (Ramadhan & Hegedus 2005) and ribosomal
mutations conferring aminoglycoside and spectinomycin resistance in Borrelia
burgdorferi (Criswell et al. 2006).
1.3.4.2 Plasmids
The carriage of plasmids has been shown to reduce the fitness of bacteria (Lee & Edlin
1985; Nguyen et al. 1989; Wames & Stephenson 1986). Insertion of a plasmid reduced
fitness of the strain compared to the plasmid free strain. However, this fitness deficit was
reduced following 500 generations (Nguyen et al. 1989). Restoration of fitness may be
due to loss of plasmid containing bacteria from the population as plasmid free bacteria
outgrow them (Lenski & Bouma 1987). This would suggest that following rational
51
Chapter 1 General Introduction
antibiotic use the frequency of resistant bacteria may decline, reducing the spread of
antibiotic resistance. Subsequently, it has been demonstrated that, with time, chromosomal
changes occur that increase the fitness of the plasmid carrying bacteria (Lenski, Simpson,
& Nguyen 1994). Over many generations of association the effects of fitness can be
decreased extensively by compensatory mutations which restore reproductive potential
(Bouma & Lenski 1988; Modi et al. 1991).
1.3.4.3 Other Genetic Elements
In S. aureus methicillin resistance occurs due to acquisition of the Staphylococcal
Chromosomal Cassette (SCCMec) element and this incurs a fitness cost. Fitness cost was
measured via transformation of SCCMec into the susceptible parent strain. Growth rates
were determined in paired competition assays. The generation time of S. aureus
containing SCCMec was 29 +/- 0.1 min compared to 40 +/- 0.1 min to the parent strain
(Ender et al. 2004). Lee et al measured fitness costs of type I and type IV SCCmec
elements in glucose limited continuous culture. A fitness cost was measured for type I as
measured by growth rate and cell yield but no similar cost was found for type IV (Lee et
al. 2007).
The bla sm e-i P-lactamase is only found in carbapenem resistant Serratia marcescens
strains and has not been identified on mobile genetic elements. However its mode of
horizontal transfer is unknown. Using growth competition assays a fitness cost was
associated with presence of this element and this may limit dissemination of the p-
lactamase among S. marcescens isolates (Marciano, Karkouti & Palzkill 2007).
52
Chapter 1 General Introduction
1.3.4.4 Compensatory Mutations
A deleterious mutation may be lost from the population, revert to susceptibility or be
compensated for by another mutation. In bacteria which are less fit, selection of mutations
which compensate for this deficit may occur and restore reproductive potential. These
mutations occur at another site and ameliorate the cost incurred by the initial resistance
mutation without the loss of the resistance. These mutations can accumulate and restore
fitness, stabilising the population of resistant bacteria. The compensated strain may then
outcompete the wildtype strain. These mutations have been observed in a number of
bacterial species. For example, compensation of fluoroquinolone resistance in S. aureus
occurs by decreased expression of topoisomerase IV (Ince & Hooper 2003). It has also
been demonstrated that the fitness cost of mutations in rpsL, conferring streptomycin
resistance in E. coli, can be compensated to a restored rate of protein synthesis following
adaptation (Schrag, Perrot, & Levin 1997). Similarly, adaptation experiments in M.
tuberculosis have demonstrated that rifampicin resistant rpoB mutants lose the fitness
deficit following serial passage (Billington, McHugh, & Gillespie 1999).
Most compensatory mutations that restore fitness are not revertants to susceptibility. This
may be because the mutation rate for other mutations is higher due to multiple targets
(Levin, Perrot, & Walker 2000).
Isoniazid resistant M. tuberculosis with mutation in katG, resulting in loss of a functional
catalase, accumulates compensatory mutations that result in increased expression of the
ahpC promoter. The ahpC gene encodes an alkyl hydroperoxidase reductase and it has
been proposed that these mutations increase the expression of this enzyme which protects
53
Chapter 1 General Introduction
M. tuberculosis from oxidative stress and compensates for the loss of catalase (Sherman et
a l 1996).
There is evidence to suggest that antibiotic resistance may reduce the ability of an
organism to be transmitted and cause disease in another host. Drug resistant strains of M.
tuberculosis have been shown to cause fewer secondary cases of tuberculosis than
susceptible strains (Burgos et al. 2003). Some drug resistant strains have been shown to be
as likely to occur in clusters, as compared to the wildtype and others less likely (van
Soolingen et al. 1999).
1.3.5 Fitness Landscapes
Fitness or adaptive landscapes can be used to visualise relationships between genotypes
and replication rates (Wright 1932). The fitness of all mutants can be compared via
construction of a topographical map with fitness on the ordinate and genomes/phenotypes
on the abscissa. A single large peak indicates that a single genotype has optimum fitness
and that any deviations result in a decrease in fitness. Multiple peaks indicate that a
number of possible genotypes may have similar fitness values.
1.3.6 Mullers Ratchet
In a culture a deleterious mutation is more likely to occur than a favourable mutation.
Therefore, over numerous generations, an irreversible decline in fitness will be observed
and the fittest individuals can be lost from the population. This has been referred to as
‘Muller’s ratchet’ (Muller 1964) and occurs in RNA virus populations; the effect is
exacerbated in asexual populations where populations are small and mutation rates are
54
Chapter 1 General Introduction
high. However Andersson and Hughes showed that Muller’s ratchet also operates in S.
typhimurium (Andersson & Hughes 1996).
1.4 Bacterial Biofilms
1.4.1 Definition
Bacteria may exist in sessile or planktonic states. It is accepted that planktonic cells are
necessary for replication and colonisation of new habitats and adherent cells are important
for perseverance. Classic planktonic laboratory culture experiments have elucidated many
aspects of bacterial physiology and molecular biology. Although planktonic cells are
convenient to study, it is now commonly recognized that bacteria grow as biofilms both
within the human body and in natural environments (Costerton et al. 1987). Bacterial
biofilms have been isolated from 3.2 billion year old deep sea hydrothermal rocks and
therefore represent an ancient mode of existence (Rasmussen 2000). Purely planktonic
populations of bacteria are likely to be rare. In order to guide treatment of infections
caused by biofilms, bacteria should be studied as biofilms because planktonic and biofilm
cells are inherently different. The definition of a microbial biofilm has evolved over the
last twenty years and may now be regarded as a complex community of interdependent
microbial cells enclosed within a self produced extracellular polymer matrix that are
associated with a biotic or abiotic surface or interface that express a distinct phenotype.
55
Chapter 1 General Introduction
1.4.2 Biofilms in Human Disease
Although it is accepted that biofilms are common in natural environments the significance
of biofilms in infectious diseases is not yet clear. However, it is estimated that 65% of
infections in the developed world are caused by biofilm forming organisms (Potera 1999).
Many chronic bacterial infections, including otitis media (Fergie et al. 2004), endocarditis
(Hyde, Darouiche, & Costerton 1998), dental caries (Marsh 1995), peridontitis (Darveau,
Tanner, & Page 1997), biliary tree infection (Leung, Sung, & Costerton 1989) and lung
infection in cystic fibrosis patients (Singh et al. 2000) owe their persistence, in part, to the
formation of biofilms and the intrinsic resistance of these biofilms cells to antimicrobial
killing and to the immune response of the host (Costerton, Stewart, & Greenberg 1999).
Many nosocomial infections are associated with colonisation of indwelling medical
devices include those relating to urinary catheters (Morris, Stickler, & McLean 1999),
central venous catheters (Passerini et al. 1992), orthopaedic devices and prosthetic heart
valves.
1.4.3 Biofilm Development
Biofilm development is a complex process and five stages have been suggested (Stoodley
et al. 2002), see figure 1.1.
56
Chapter 1 General Introduction
Figure 1.1 Stages of Biofilm Development (obtained from Stoodley et al. 2002). Stage 1
involves reversible initial attachment to a surface. Stage 2 involves irreversible binding via
exopolysaccharide (EPS) production. Stages 3 and 4 represent differentiation of an initial
biofilm to a mature biofilm. During stage 5, dispersion of single planktonic cells from the
biofilm occurs.
Mature biofilms consist of 3D mushroom and pillar structures separated by water channels
and the shape of these structures is affected by nutrient status (Stoodley et al. 1999). This
allows the transport of oxygen and nutrients and the removal of metabolic waste products.
Flow within these channels has been documented (Stoodley, Debeer, & Lewandowski
1994).
1.4.4 Adhesion
Bacteria initially adhere to the surface in a reversible, then irreversible manner to form a
structured community. Adhesion triggers changes in gene expression. For example
attachment of P. aeruginosa cells during the initial stages of biofilm formation stimulates
production of alginate from the algC promoter (Davies, Chakrabarty, & Geesey 1993;
57
Chapter 1 General Introduction
Hoyle, Williams, & Costerton 1993). Alginate is a biofilm matrix polymer that plays an
important role in pathogenicity in P. aeruginosa lung infection in cystic fibrosis (CF)
patients.
On abiotic surfaces reversible attachment is mediated by electrostatic, hydrophobic and
van der Waals interactions but on tissue surfaces, specific binding of lectins and adhesins
occurs (Dunne, Jr. 2002). High shear environments can promote biofilm formation. It is
hypothesized that this represents a survival strategy as planktonic cells will be removed
(Donlan & Costerton 2002).
1.4.5 Quorum Sensing
Quorum sensing is the regulation of cell density dependent expression of genes and allows
coordination of virulence factor expression by the release of small molecules. Motility,
production of antibiotics, exchange of DNA, and biofilm production have been shown to
be controlled by quorum sensing systems. Quorum sensing was first described over 25
years ago in the light producing marine bacteria Vibrio fischeri and Vibrio harveyi
(Nealson & Hastings 1979). The luxCDABE luciferase operon encodes the enzymes
responsible for light production. Emission of light was dependent on the accumulation of
signalling molecules and only occurred at high population densities (Nealson & Hastings
1979). The quorum sensing circuits identified in Gram-negative bacteria contain
homologues of the luxl and luxR genes. The lux I gene encodes the autoinducer
homoserine lactone signalling molecules (AHLs). These are small diffusible molecules
that accumulate with increases in cell population until a threshold is reached. The luxR
gene binds autoinducers and can then activate expression of target genes (Hanzelka &
58
Chapter 1 General Introduction
Greenberg 1995). Quorum sensing has been described in a number of Gram-negative
pathogens including P. aeruginosa (Passador et al. 1993), which contains two systems,
lasRI and rhlRl (Latifi et al. 1995). The quorum sensing systems of P. aeruginosa activate
the expression of a number of virulence factors including; elastase, encoded by lasB\
exotoxin A, encoded by toxA; alkaline phosphatase, encoded by aprA; siderophores and is
involved in biofilm formation (Parsek & Greenberg 2000; Pearson, Pesci, & Iglewski
1997; Whiteley, Lee, & Greenberg 1999).
1.4.6 P. aeruginosa grows as a biofilm in the CF lung
There are three separate lines of evidence to support the observation that P. aeruginosa
grows as a biofilm in the lungs of CF patients (Lam et al. 1980; Singh et al. 2000). Cells
isolated from CF sputum form microcolonies surrounded by a matrix that are visible using
electron microscopy (Lam et al. 1980). Furthermore the ratio of quorum sensing acyl
homoserine lactones expressed supports the role of the biofilm phenotype in infection of
CF patients (Singh et al. 2000). This is because biofilm cells of P. aeruginosa produce
more butryl (C4) acyl homoserine lactone than oxyodecanoyl (C l2) acyl homoserine
lactone, while planktonic cells produce more of the C12 signal (Singh et al. 2000) and this
is also observed in the CF lung. B. cepacia grow as biofilms in vitro (Al Bakri, Gilbert, &
Allison 2004; Conway, Venu, & Speert 2002; Tomlin et al. 2005; Tomlin, Clark, & Ceri
2004; Tomlin, Coll, & Ceri 2001) and therefore it is likely that growth within the lung is
as the biofilm phenotype.
59
Chapter 1 General Introduction
1.4.7 Biofilm Resistance to Antimicrobial Killing
Biofilms growing in association with epithelial cells in the lungs of CF patients can cause
persistent infections that are difficult to eradicate, partially because biofilms are highly
resistant to killing to bactericidal antibiotics. Various mechanisms have been proposed to
account for the increased resistance to antimicrobials and it is likely that multiple
mechanisms act synergistically. However the reasons for increased tolerance to
antimicrobials remain unclear. The cells that persist exhibit increased resistance to
antibiotics (Stewart & Costerton 2001) have been shown to be up to 1000 fold more
resistant than planktonic cells (Ceri et al. 1999). Accepted resistance mechanisms such as
mutation in antibiotic target genes, modification enzymes and efflux pumps (Walsh 2000)
are unlikely to be responsible as cells sacrificed from biofilms regain their susceptibility
(Anwar et al. 1989). This implies that genetic events have not occurred. However
derepression of a chromosomal P-lactamase in P. aeruginosa has been shown to occur
over time (Bagge et al. 2004), suggesting although conventional mechanisms alone do not
explain resistance, they may contribute to persistence.
There are three resistance mechanisms that have been proposed for cells growing in a
biofilm. These are reduced penetration of the antibiotic, development of an altered
environment and formation of a protected, resistant phenotype (Mah & O'Toole 2001).
The first mechanism is more likely to be due to the deactivation of the antibiotic in the
biofilm or by binding of positively charged antibiotics, e.g. aminoglycosides, to the
negatively charged matrix (Kumon et al. 1994; Shigeta et al. 1997) than reduced
penetration. It has been shown that some antibiotics readily penetrate biofilms, in
particular the fluoroquinolones (Anderl, Franklin, & Stewart 2000; Ishida et al. 1998;
60
Chapter 1 General Introduction
Stewart 1996; Vrany, Stewart, & Suci 1997) and that reduced transport has only a minor
effect on biofilm antibiotic resistance. In addition the biofilm matrix readily allows
antibiotic sized molecules to pass through (Stewart 1998). The second hypothesis relies on
the development of an altered environment and nutrient gradients within the biofilm.
Antibiotic action could be antagonised by accumulation of acidic waste products or
reduced in zones of depleted oxygen levels, inhibiting action of antibiotics such as the
aminoglycosides which have less activity in anaerobic conditions. Conditions within the
biofilm, such as nutrient limitation may cause the bacterial cells to enter a non-growing
state and so antibiotics that target the bacterial cell wall are likely to have reduced
efficacy. This hypothesis has been supported by visualisation of P. aeruginosa biofilms,
which has shown that the majority of the biofilm consists of metabolically inactive cells
with metabolically active cells being only at the biofilm/liquid interface (Xu, McFeters, &
Stewart 2000). Planktonic cells in the stationary phase are more tolerant to antibiotics than
biofilm cells (Spoering & Lewis 2001). This is most likely due to slow growth and the
presence of microbial persister cells. Antibiotic exposure kills the majority of the biofilm
and planktonic cells, leaving a proportion that are protected by being in the biofilm state,
as the concentration of antibiotic declines persister cells grow and repopulate the biofilm.
There may be a genetic basis for biofilm recalcitrance to antimicrobials. Whiteley et al
used microarrays to compare gene expression in planktonic and biofilm cells of P.
aeruginosa. Approximately 1% of all genes were differentially expressed in the biofilm
(Whiteley et al. 2001). Exposure of the biofilm to tobramycin resulted in differential
expression of 20 genes, several of which are known to have a role in increased
aminoglycoside resistance. Thus it is likely that during biofilm growth alteration in gene
expression induces resistance to many antibiotic classes. The P. aeruginosa nvdB gene is
61
Chapter 1 General Introduction
required for synthesis of periplasmic glucans which may prevent tobramycin from
exerting an effect via sequestration of the antibiotic. P. aeruginosa containing a mutant
ndvB gene, resulting in less glucan production has been identified that can form biofilms
but does not develop high level antibiotic resistance (Mah et al. 2003).
1.4.8 Genetic Diversity in Biofilms
Biofilm communities consist of distinct subpopulations. The diversity of biofilms
increases the range of environmental conditions that the bacteria can survive. This is
known as the ‘insurance hypothesis’ (Boles, Thoendel, & Singh 2004). Boles et al
demonstrated that heritable variation in colony morphology, swimming capacity, biofilm
formation, detachment, metabolism and hydrogen peroxide resistance occurs during
biofilm growth of P. aeruginosa. A proportion of biofilm bacteria overproduced
pyomelanin, which has a protective function against radiation and oxidants (Nosanchuk &
Casadevall 2003). This variation is likely to be dependent on RecA, which can produce
genetic change in the chromosome by recombination and can induce error prone DNA
polymerases (Little & Mount 1982). Inactivation of RecA reduced colony variation.
Bacteria are continuously exposed to changing environmental conditions. Biofilms serve
to buffer bacteria from these changes by offering protection from antimicrobial killing and
the host immune system. These protected communities of cells select for genetic diversity.
Increased diversity will not necessarily result in altered fitness of any one subpopulation
as fitness will depend on the prevailing conditions. The existence of these subpopulations
may enable a proportion of the population to survive environmental change.
62
Chapter 1 General Introduction
1.5 Fluoroquinolone Antibiotics
1.5.1 Fluoroquinolones
The fluoroquinolone (FQ) class of antibiotics contains synthetic broad spectrum
antibacterial compounds that have been widely used to treat human infections, especially
respiratory and urinary tract bacterial infections (Hooper 1998). FQs are a widely
prescribed class of antibiotic, and this use continues to increase. Between 2003 and 2005,
dispensed prescriptions of ciprofloxacin, the most widely used FQ, rose by 10%
(www.publications.doh.gov/uk/prescriptionstatistics/index). The FQs are also commonly
used for veterinary treatment and in animal husbandry (Chiu et al. 2002; Nelson et al.
2007).
FQ compounds contain a 4-quinolone ring in their structure and exert bactericidal activity
by inhibition of DNA synthesis, through action on DNA gyrase (topoisomerase II) and
topoisomerase IV (Drlica & Zhou 1997; Drlica & Hooper 2003). The topoisomerases are
essential in resolving topological problems encountered by the cell and allow DNA to be
packaged within cells. Most bacteria have two types of topoisomerases, type I and II. Type
II enzymes mediate alterations in topology by introducing double stranded DNA breaks
and allow subsequent re-joining. The type I enzymes cause single stranded breaks only.
There is little conservation in amino acid sequence between these two types of
topoisomerase. These enzymes are not present in human cells which are therefore not
affected by FQs. In Gram-negative bacteria the primary target is gyrase and in Gram-
positive bacteria it is topoisomerase IV (Drlica & Zhou 1997).
63
Chapter 1 General Introduction
1.5.2 History of the Fluoroquinolones
The quinolones have been classified into four generations on the basis of their activity.
An antibacterial compound derived from a preparation of the antimalarial agent
chloroquine was used to develop the first quinolone, nalidixic acid, which was synthesized
in 1962. The use of this compound was limited due to low plasma levels, limited oral
absorbance, high toxicity and a narrow spectrum of activity (Goss, Deitz, & Cook 1964).
Resistance develops quickly to nalidixic acid. However there are now many derivatives of
this compound, see figure 1.2. Following the addition of a fluorine atom at the carbon 6
position to produce the agent flumequine the resulting second generation compounds had
increased activity. Additional of a piperazinyl side chain at position 7 improved activity
against Gram-negative bacteria. The resulting compound, pipemidic acid had activity
against Pseudomonas and can penetrate cells more efficiently. The second generation
compound, ciprofloxacin has a fluorine atom added at the C-6 position, an N 1 cyclopropyl
group, a piperazinyl ring at the C-7 position and a nitrogen atom at the C-8 position. The
introduction of ciprofloxacin increased the therapeutic value of the FQs and there are now
many derivatives of this compound. The combination of a fluorine atom at position 6 with
a piperazine ring at position 7 to produce norfloxacin formed a cornerstone for the
development of recent FQs. The majority of subsequent compounds contain a 4-oxo-l, 8-
naphthyridin-3-carboxylic acid moiety. Compounds containing this structure are known as
4-quinolones due to the exocyclic oxygen at position 4. Two types of ring structures exist;
a naphthyridone nucleus, containing a nitrogen atom at position 1 and 8 or a quinolone
nucleus, containing only one nitrogen atom at position 1. Third generation compounds
include clinafloxacin, moxofloxacin, gatifloxacin, levofloxacin and sparfloxacin.
Trovafloxacin is a fourth generation compound and has increased streptococcal and
64
Chapter 1 General Introduction
anaerobe coverage. Most licensed quinolones contain a quinolone nucleus while
gemifloxacin, trovafloxacin, enofloxacin and sufloxacin contain a naphthyridone nucleus.
Modification of the nucleus effects pharmokinetics, activity, drug interactions and adverse
reactions. Subsequent compounds have a broader spectrum of activity are easily absorbed
orally and can be used to treat systemic infections (Appelbaum & Hunter 2000).
65
Chapter 1 General Introduction
O
COOH
H,C
CH3Nalidixic acid
FIRST GENERATION
.c o 2h
HN
I
Ciprofloxacin
H N
Norfloxacin
SECOND GENERATION
IHN floxacin
Levofloxacin
THIRD GENERATION
ISparfloxacin
n h 2
■CO,H
h 3c ,
HN
FOURTH GENERATION
Moxifloxacin
Figure 1.2 Development of 4th generation fluoroquinolones
66
Chapter 1 General Introduction
The recent third and fourth generation FQ compounds have greater activity against Gram-
positive cocci, anaerobes and atypical pathogens than the preceding compounds.
Sitafloxacin and clinafloxacin, in particular, have improved activity against anaerobic
bacteria (Tanlan 2001). However these compounds are not as active as ciprofloxacin
against Gram-negative non fermenters. FQs can be administered orally once or twice daily
and therefore are an attractive choice for treatment of infections in the hospital and the
community. New FQs continue to be developed and moxifloxacin and gatifloxacin, two of
the most recent, are used for treatment of respiratory tract infection, as they have activity
against Gram-positive cocci, in particular S. pneumoniae (Tanlan 2001).
1.5.3 Mechanism of Action
FQs act by forming complexes with DNA gyrase and DNA, which consequently block
cell growth. DNA gyrase passes a region of DNA through another and in doing so traps a
quinolone/DNA/drug reaction intermediate. This blocks replication and produces double
stranded breaks that are lethal to bacteria (Drlica 2003). DNA gyrase produces negative
supercoils so that initiation proteins can bind to the origin of replication. It also relaxes
positive supercoils that occur as the replication fork progresses. DNA gyrase is essential
for the cell to efficiently process DNA. FQs bind to the DNA/gyrase complex and stabilise
the strand breaks in the DNA. DNA gyrase relieves topological stresses encountered
during DNA replication and supercoils DNA so that the genetic material can be packed
into the bacterial cell by twisting DNA in the opposite direction to the normal turn of the
molecule. DNA gyrase was discovered and characterised in 1976 (Gellert et al. 1976) and
is a type II DNA topoisomerase that is composed of two A and two B subunits gyrA and
gyrB respectively (Wang 1985). The A subunit is responsible for breakage and rejoining
67
Chapter 1 General Introduction
of DNA while the B subunit is the site of ATP hydrolysis (Gellert et al. 1976). The Tyr-
122 residue in the N terminal of GyrA is considered the active site of the quinolone
resistance determining region. The protein can also catenate and decatenate covalently
closed circular DNA (Drlica & Zhou 1997).
The primary function of topoisomerase IV is to decatenate daughter chromosomes
following DNA replication. Topoisomerase IV, which is involved in chromosomal
segregation shares significant homology with DNA gyrase and consists of 2 ParC and 2
ParE subunits, encoded by parC and parE which are homologous to gyrA and gyrB
respectively. In E. coli the gyrA gene shares 60 % amino acid similarity with parC while
gyrB has 62 % similarity with parC (Huang 1996; Kato et al. 1990; Peng & Marians
1993). Most bacteria contain genes encoding DNA gyrase and topoisomerase IV.
However some bacteria e.g. Treponema pallidum lack genes encoding topoisomerase IV
(Fraser et al. 1998).
1.5.4 Induction of the SOS Response
The SOS response is a post replication DNA repair system that is induced by DNA
damage. The SOS response increases the dissemination of antibiotic genes. Beaber et al
demonstrated that in E. coli induction of this response increases transfer of the Vibrio
cholerae derived intregating conjugative factor SXT conferring resistance to
chloramphenicol, sulphamethoxazole, trimethoprim and streptomycin and that this was
also induced by exposure to ciprofloxacin (Beaber, Hochhut, & Waldor 2004).
68
Chapter 1 General Introduction
Microarray technology has demonstrated that SOS genes are induced during exposure to
fluoroquinolones in E. coli, H. influenzae and S. typhimurium (Piddock, Walters, & Diver
1990; Shaw et al. 2003; Ysem et al. 1990). Piddock et al have also used 2D gel
electrophoresis to investigate the response of S. enterica exposed to fluoroquinolone at 0.5
and 2 x MIC. Exposure to FQs increased expression of the efflux pump AcrAB/TolC
(Coldham et al. 2006).
1.5.5 Resistance Mechanisms
There has been a large increase in fluoroquinolone resistance since these drugs were
introduced in the late 1980s due to extensive use in many organisms including S.
pneumonie, S. typhimurium and C. jejuni (Aguiar et al. 1992; Chen et al 1999; Hakanen
et al 1999; Kresken & Wiedemann 1988; Linares, de la Campa & Palla 1999; Tanaka et
al. 2000) and this now restricts their use.
1.5.5.1 Target Alteration
Alteration in target genes and alterations that affect access of the drugs to targets e.g.
increased expression of efflux pumps in Gram-negative bacteria, are the primary
mechanisms of resistance to fluoroquinolones (Hooper 2003; Ruiz 2003). Bacteria become
increasingly resistant to fluoroquinolones by accumulation of mutations in topoisomerase
genes. This reduces the affinity of the drug for the targets and decreases susceptibility.
These mutations occur in a stepwise manner, increasing the level of resistance with each
successive mutation (Chen & Lo 2003; Hooper 2003). The result of this gradual increase
in resistance may cause isolates that contain resistance mutations but are classed as
69
Chapter 1 General Introduction
susceptible to be missed by resistance surveillance studies. Mutations in the quinolone
resistance determining regions (QRDR) within topoisomerase II (GyrA and GyrB) and
topoisomerase IV (ParC and ParE) confer resistance to FQs (Everett et al. 1996). In E. coli
the primary target of FQs is DNA gyrase (Gellert et a l 1977). Additional mutations in
gyrA and parC are required for high level fluoroquinolone resistance in E. coli, A.
baumannii, P. aeruginosa and S. maltophilia (Mouneimne et al. 1999; Valdezate et al.
2002; Vila et al. 1995). Mutations in parE and gyrB, conferring a decrease in
susceptibility, occur less commonly (Akasaka et al. 2001; Lee et al. 2005; Oh et al. 2003).
Double mutations in topoisomerase II genes are associated with higher level resistance
than individual mutations. The primary target of fluoroquinolones in S. aureus and other
Gram-positive bacteria is topoisomerase IV (Drlica 2003; Ferrero et al. 1994; Ferrero,
Cameron, & Crouzet 1995; Gellert et al. 1976; Gellert et al. 1977).
1.5.5.1.1 GyrA
Of the gyrA mutations that cause fluoroquinolone resistance in vitro in Gram-negative
bacteria those that occur at codons 83 and 87 occur most frequently (Dessus-Babus et al.
1998; Mouneimne et al. 1999). Codon 83 and 87, found within the QRDR, encode amino
acids which form an a helical domain in the DNA gyrase protein. These codons encode
the DNA binding region of gyrase and therefore fluoroquinolones are less able to form a
complex with the DNA and gyrase, when mutated. Double mutants containing two gyrA
mutations have been described in E. coli (McDonald et al. 2001). There is a 10 fold
reduction in affinity of the gyrase/DNA complex for ciprofloxacin in isolates which
contain Ser83Ala Asp87Asn double mutation within gyrA (Barnard & Maxwell 2001).
Other mutations between codon 67-106 can also confer resistance. Resistance mutations in
70
Chapter 1 General Introduction
gyrA have been found outside the QRDR, such as Ala51Val but are less common
(Yoshida et a l 1990). Alteration at codon 106 has been reported in E. coli and P.
aeruginosa (Hallett & Maxwell 1991; Lee et al. 2005; Ruiz 2003). Mutations in gyrA are
found more frequently than those in gyrB (Zhou et a l 2000). This can be explained by the
larger MIC increases that result following gyrA mutation (Hooper 2003).
Mutations in gyrA have been detected by single strand conformation polymorphism
(SSCP) analysis in a number of organisms (Takenouchi, Sakagawa, & Sugawara 1999;
Vila et a l 1995). This technique utilises the altered migration in a nondenaturing
polyacrylamide gel of isolates with changes in DNA conformation by nucleotide
substitution to detect mutations (McHugh, 2000).
1.5.5.1.2 GyrB
Alterations in gyrA are reported more often than alterations in gyrB, this may be because
gyrB mutations confer lower levels of resistance than gyrA. In E. coli common mutations
are Asp426Val and Lys447Glu (Drlica & Malik 2003). Both result in decreased
susceptibility to nalidixic acid but differ in extent of resistance conferred to FQ containing
a piperazinyl moiety at position 7 (e.g. ciprofloxacin, norfloxacin). This may be due to
electrostatic interactions between gyrB and drugs either containing or not containing the
positively charged piperazinyl moiety (Yoshida et al. 1991). In P. aeruginosa substitution
of Ser467 and Glu469 have been documented in norfloxacin resistant mutants selected in
vitro (Kugelberg et al 2005).
71
Chapter 1 General Introduction
1.5.5.13 ParC
Mutations in parC and parE in isolation do not confer resistance but contribute to further
elevations in MIC when gyrA and gyrB mutations are also present (Ruiz 2003).
Common mutations are Ser80Phe/Tyr and Glu84Lys/Leu E. coli (Drlica 2003). ParC has a
secondary role in fluoroquinolone resistance and mutations in parC or parE only cause
resistance in E. coli in the presence of mutant gyrA. ParC mutations have been found in
high level resistance in combination with mutations in gyrA in many Gram-negative
bacteria including E. coli (Vila et al. 1996), P. aeruginosa (Kugelberg et al. 2005; Lee et
al. 2005), S. enterica (Eaves et al. 2004), Klebsiella pneumoniae (Brisse et al. 1999),
Klebsiella oxytoca (Brisse et al. 1999) and Enterobacter aerogenes (Brisse et al. 1999).
1.5.5.1.4 ParE
Mutations in parE have been found less commonly in clinical resistant isolates and
mutants selected in vitro than mutations selected in the other topoisomerase genes but
have not been evaluated as extensively as other mutations. Most mutations that have been
reported are in Gram-positive bacteria. Few cases of parE mutations have been described
in Gram-negative bacteria but include Ala425Val in P. aeruginosa (Kugelberg et al. 2005)
and Leu445His in E. coli (Breines et al. 1997).
72
Chapter 1 General Introduction
1.5.5.2 Efflux
Efflux is a major mechanism of fluoroquinolone resistance. Efflux mediated
fluoroquinolone resistance confers resistance to other classes of antimicrobial with
different structures e.g. chloramphenicol (Poole 2000).
1.5.5.3 Multiple Antimicrobial Resistance Phenotype (MAR)
Mutations in genes other than topoisomerase genes can have a role in the development of
FQ resistance (Kern et al. 2000). For example mutations in regulatory genes can result in
expression of the Multiple Antimicrobial Resistance Phenotype (MAR). This involves
expression of porins and efflux pumps to confer chromosomally encoded low level cross
resistance to FQs and other classes of antibiotics. These include p-lactams, tetracyclines,
chloramphenicol (George & Levy 1983), agents causing oxidative stress (Ariza et al.
1994), disinfectants (McMurry, Oethinger, & Levy 1998; Moken, McMurry, & Levy
1997) and organic solvents (Asako et al. 1997). Mutation in mar A increases expression of
micF, which decreases expression of the OmpF porin and decreases permeability of the
cell (Cohen, McMurry, & Levy 1988). The Mar operon has been identified in E. coli
(Hachler, Cohen, & Levy 1991), Klebsiella, Citrobacter, Hafnia, Enterobacter (Cohen,
Yan, & Levy 1993) and S. enterica (Randall & Woodward 2001).
Mutations in acrR, the repressor gene of the AcrAB multidrug efflux pump, also have a
role in fluoroquinolone resistance in E. coli (Wang et al. 2001). If the acrAB is inactivated
in E. coli strains that also contain topoisomerase mutations then all strains become
susceptible (Oethinger et al. 2000).
73
Chapter 1 General Introduction
1.5.5.4 Plasmid Mediated Resistance
The major mechanisms of FQ resistance are target alteration and overexpression of efflux
pumps however plasmid mediated low level quinolone resistance has been described and
was first documented in K. pneumoniae (Martinez-Martinez, Pascual, & Jacoby 1998).
This gene, qnr, encoding a member of the pentapeptide repeat family, prevents
fluoroquinolones from inhibiting DNA gyrase by binding to GyrA and GyrB before
formation of the gyrase/DNA/quinolone complex. This has been hypothesised to reduce
binding of gyrase to DNA thereby reducing the number of targets available to the
fluoroquinolone molecules (Tran, Jacoby, & Hooper 2005). The mechanism by which this
occurs is not known. The Qnr protein has similarity to gyrase protecting proteins, which
protect gyrase from self produced microcin B17 (Garrido et al. 1988). Microcins are small
inhibitory molecules that target DNA gyrase (Lomovskaya, Kawai, & Matin 1996).
Before 2003 the qnr gene was thought to be a rare and had been found in one E. coli
isolate, four K. pneumoniae isolates and one Klebsiella spp. isolate despite screening of
350 isolates of Gram-negative bacteria in the United States (Jacoby, Chow, & Waites
2003; Wang et al. 2003). However the qnr gene has been found in 78 unrelated strains of
E. coli in a Shanghai hospital and subsequently in further K. pneumoniae strains in the
United States (Wang et al. 2003; Wang et al. 2004). It has been postulated that these
strains are now spreading across the United States (Wang et al. 2004). Plasmid mediated
resistance may complement topoisomerase mutations and efflux mediated resistance by
increasing the level at which resistance mutations can be selected. Other plasmid mediated
quinolone resistance genes, qnrB and qnrS, have also been found in K. pneumoniae and
Shigella flexneri respectively (Hata et al. 2005; Jacoby et al. 2006).
74
Chapter 1 General Introduction
1.5.5.5 Inactivation
Degradation of quinolones by the brown rot fungus Gloeophyllum striatum, has been
described (Wetzstein, Schmeer, & Karl 1997). In 2006 the first evidence for FQ
inactivation by bacterial enzymes was presented. Robicsek et al unexpectedly found that a
variant of a previously reported plasmid mediated aminoglycoside modifying enzyme
could also modify ciprofloxacin and norfloxacin by N-acetylation of the amino nitrogen
on the piperazinyl substituent. This conferred a small increase in resistance. Other FQ
antibiotics were not affected (Robicsek et al. 2006).
1.6 The Burkholderia cepacia complex
1.6.1 Taxonomy of Burkholderia
The genus Burkholderia consists of non spore-forming, motile, aerobic, Gram-negative
bacilli that are pathogens of animals, plants and humans. In 1992 Pseudomonas cepacia
and six other pseudomonads (.Pseudomonas pseudomallei, Pseudomonas mallei,
Pseudomonas solanacearum, Pseudomonas gladioli, Pseudomonas picketti and
Pseudomonas caryophylli) were transferred to the new genus of Burkholderia in the (3-
subdivision of the phylum Proteobacteria (Yabuuchi et al. 1992).
Following increased scientific interest, the genus Burkholderia now contains at least 40
species. The taxonomy of this group of organisms is shown in figure 1.3.
75
Chapter 1 General Introduction
r Burkholderiactpacia ATCC 25416* (M22518): Burkholderia anthina R-4183 (AJ420880)" Burkholderia ombijaria AMMD* (AF043302)i j Burkholderia stab Ms LMG 14294r (AF097533)
: Burkholderia pyrrocima ATCC 15958* (ABQ21369) r Burkholderia ubonensis EY 3383* (AB03Q584)1: Burkholderia dolosa LMG 18941 (AF17S314)
; ” Burkholderia mutih'omnsLMG I301(f (Y18703)I I "!_r Burkholderia cenocepacia LMG 16656* (AF148556)
1 Burkholderia nemamiensa T W 75* (U96928)j Burkholderia lhailandensisEl&k' (U91838)] 1 . Burkholderia mallei ATCC 23344* (AFl 10188)
Burkholderia pseudomalfei 1026b (U91839) u l — Burkholderia glumae LMG 2196* (U96931)
’ • Burkholderiaplaiuarii LMG 9035* (U96933)1 Burkholderia gtacBolipv. glaeSoii ATCC 10248 (X67038)Burkholderia oklahomencis C6786*
:-------------- _ burkholderia andropogonis ATCC 23061* (X67037) Burkholderia caryophrlli ATCC 25418* (X67039)
Burkholderia sordidicola S5-B* (AF512826), Burkholderia glathei ATCC 29195* (Y17052)j |------------------ ”Candidatus Burkholderia calm ’ “ 19620512“ (AY277697)
1 € "CaneSdatus Burkholderia ktrkii" ”19536779“ (AF475063)“Candidatus Burkholderia nigropunctataw " 19750521 “ (AY277698)
Burkholderia tuberum STM678* (AJ302311)"Burkholderia brasilensis" “M130“ (AJ238360)
Burkholderia kururiensis KP23* (AB024310)* Burkholderia sifwriamica SRMrh-20* (AY965240)I Burkholderia mimosorum PAS44* (AY752958)
' Burkholderia tropica Pp«8* (AJ420332)Burkholderia sacchari 1PT101* (AF26327S)
- Burktoideria unamae MTl-t41[ (AY221956)- Burkholderia phenazinmm LMG 2247* (U96936)
• Burkholderia hospita LMG 20598* (AY040365)1 j ‘ ■ Burkholderia terrae KMYQ2* (AB201285)
Burkholderia caribensis MWAP64* (Y17009) Burkholderia phymatum STM815* (AJ 302312)
Burkholderiaphenoliruptrix AC 1100* (AY435213)- Burkholderia terricola LMG 20594* (AY040362 )
1 i [ : Burkholderia xenowrans LB400* (U86373)Burkholderia grammis C4D1M* (U96939)
- Burkholderia koreensis KMYQ3* (AB201286) j 1 Burkholderia caledanica LMG 19076* (AF215704)
j - Burkholderia fitngorum LMG 16225* (AF2157Q5)-— Burkholderia phytcfirmans PsIN* (AY497470)
Pandome a op is fa CCUG 38412* (AY268172)Ralsvnia pickettii ATCC 27512 (X67042)
Cupriaridus ne color ATCC 43291* (AF191737)- Atcaligenes jbecedis *ub*p faecalis ATCC 8750* (M22508)
Figure 1.3 Phylogenetic tree of Burkholderia species. Based on 16S rRNA gene
sequences. Scale bar represents dissimilarity. Species names in quotation marks have not
been validated (Vandamme, Go van & LiPuma 2007).
76
Chapter 1 General Introduction
1.6.2 The Burkholderia cepacia complex (Bcc)
The Burkholderia cepacia complex (Bcc) consists of at least 10 species (previously
known as genomovars) that were originally thought to be a single species. However
different groups of bacteria within this complex are genotypically heterogenous but are
hard to differentiate on the basis of their phenotypic properties. In 1997, Vandamme et al
proposed that these strains comprised five distinct genomovars (Coenye et al. 2001;
Vandamme et al. 1997) that can be identified using genotypic and phenotypic methods
(Vandamme et al. 1997). The complex now consists of 10 species; B. cepacia (genomovar
I; Vandamme et al. 1997; Yabuuchi et al. 1992), B. multivorans (genomovar II;
Vandamme et al. 1997), B. cenocepacia (genomovar III; Vandamme et al. 2003), B.
stabilis (genomovar IV; Vandamme et al. 2000), B. vietnamensis (genomovar V; Gillis et
al. 1995; Vandamme et al. 1997), B. dolosa (genomovar VI; Vermis et al. 2004), B.
ambifaria (genomovar VII; Coenye et al. 2001), B. anthinia (genomovar VIII; Vandamme
et al. 2002), B. pyrrocinia (genomovar IX; Vandamme et al. 2002) and B. ubonensis
(genomovars X; Yabuuchi et al 2000). Genomovar I contains the type strain (the species
chosen as the one that best represents the complex) and retains the name B. cepacia.
B. cepacia (formerly Pseudomonas cepacia) was first described by Burkholder as the
causative agent of soft rot in onions (Burkholder 1950). In 1970 the similarity of a
pseudomonad with metabolic versatility known as P. multivorans (Stanier & Doudoroff
1966) to the previously described P. cepacia was noted (Ballard R.W. et al. 1970). Other
names that have been assigned in the past are the eugenic oxidider group I, Pseudomonas
kingii (Jonsson 1970) and Pseudomonas multivorans (Stanier & Doudoroff 1966).
77
Chapter 1 General Introduction
Vandamme et al proposed that within a species there is a high degree of DNA relatedness
(70% or higher), low but significant DNA relatedness below the species level and no
significant DNA relatedness (30%) or less (Vandamme et al. 1996) between unrelated
species. This is demonstrated within Burkholderia. Different species within the Bcc have
DNA-DNA hybridization values of 30-60%, isolates within the same species have a value
of greater than 70%. Other Burkholderia spp. have a value of less than 30% (Coenye et al.
1999; Coenye et al. 2001; Gillis et al. 1995; Vandamme et al. 1997).
1.6.3 Burkholderia pseudomallei and Burkholderia mallei
Many species of the genus Burkholderia are primarily plant pathogens or saprophytes.
However two species; Burkholderia pseudomallei and Burkholderia mallei can cause life
threatening human disease in patients that are not immunocompromised. B. pseudomallei
is a soil saprophyte, causing meliodosis in humans and is endemic in the Far East and
northern Australia. Transmission occurs via exposure of wounds to contaminated water or
soil or by inhalation. The most common clinical manifestation is septicaemia with abscess
formation, although it is also a major cause of pneumonia (Chaowagul et al. 1989).
Asymptomatic infections occur and progression to disease depends on the immune status
of the host and can manifest many years after exposure (Kingston 1971).
B. mallei is the causative agent of glanders in equines and can cause disease in humans
exposed to infected animals. B. pseudomallei and B. mallei are closely related and no
differences were found in the 16S rRNA genes of the two species (Gee et al. 2003). Both
B. mallei and B. pseudomallei are considered potential biological weapons (USA CDC,
Category B; Rotz et al. 2002) due to their mode of transmission and worldwide
availability of these agents in the environment.
78
Chapter 1 General Introduction
1.6.4 Clinical Significance
1.6.4.1 Cystic Fibrosis (CF)
CF is an autosomal recessive disorder and is one of the most common genetic disorders in
humans, affecting 1 in 2,500 live births in the Caucasian population (Ratjen & Doring
2003). CF results from mutations in the cystic fibrosis transmembrane regulator (CFTR)
gene, found on the long arm of chromosome 7. This protein is a chloride ion channel
protein and patients homozygous for the mutant allele have defective electrolyte transport
across the epithelial cell membrane, resulting in the production of thick, dehydrated mucus
in organs, especially in ducts of the male genital tract, pancreas and in the airways. These
secretions impair mucociliary clearance leading to the formation of mucus plugs in the
lungs and pancreas and progressive decline in organ function. This thick mucus layer
provides a protected niche within the lungs, for bacteria such as Bcc and P. aeruginosa.
Over 1000 CFTR mutations have been identified that result in CF (Govan & Deretic
1996). These mutations may occur at different loci, resulting in a variation of CF
phenotypes (Hart & Winstanley 2002). Over 70% of patients have a codon alteration
resulting in loss of a phenylalanine residue at position 508 (AF-508) (Govan & Deretic
1996; Hart & Winstanley 2002). CF genotype appears to affect the type and frequency of
bacterial infection. For example in patients with the AF508 mutation, there is increased
likelihood of infection with P. aeruginosa and the Bcc. Patients wih the R117H mutation
are less likely to be colonisied with these organisms (McManus et al. 2005).
Death often results following lung infection by a number of bacterial species. These
include P. aeruginosa, S. aureus, H. influenzae and the Bcc. As patients are surviving
79
Chapter 1 General Introduction
longer, other non-traditional pathogens are emerging. These include pathogens Aspergillus
spp., S. maltophilia, MRSA, Alcaligenes xylosoxidans, Achromobacter xylosoxidans,
Klebsiella spp., Pandoraea, Scedosprium apiospermum (Nagano et al. 2007) and
mycobacteria other than tuberculosis (MOTT; Devine et al. 2004; Jordan et al. 2007; Hart
& Winstanley 2002). In a retrospective study of 54 adult CF patients P. aeruginiosa was
present in 48%, H. influenzae in 34%, Aspergillus sp. in 7%, mycobacteria other than
tuberculosis in 11%, S. maltophilia in 9%, Acinetobacter sp. in 7% and B. cepacia
complex in 2% (Paschoal et al. 2007).
There is a continuing improvement in the survival of CF patients; a child bom in 1990
with CF has a life expectancy of 40 years whereas a child bom in 2000 with CF will have
a life expectancy of approximately 50 years (Colten 1990; Dodge et al. 2007).
Approximately 80% of CF patients now survive into adulthood (Elbom, Shale, & Britton
1991).
Members of the Burkolderia cepacia complex are opportunistic pathogens and rarely
cause disease in immunocompetent hosts. Immunocompromised hosts, especially patients
with CF are at risk from B. cepacia lung infection (Isles et al. 1984) via person to person
transmission (Govan et al. 1993). Nosocomial outbreaks of Bcc bacteraemia have also
been described in non CF patients (Holmes et al 1999; Bressler et al 2007). In CF patients
the most common clinical scenarios are asymptomatic carriage following colonization of
the airways, or chronic infection resulting in decline in lung function. However in
approximately 20% of colonized individuals a rapidly progressing necrotizing pneumonia
occurs that often leads to death (Govan & Deretic 1996). This outcome has been termed
‘cepacia syndrome’ (Isles et al. 1984) and is not observed with P. aeruginosa infection.
80
Chapter 1 General Introduction
Eradication of B. cepacia occurs very rarely once a CF patient becomes colonized. Bcc
bacteria are acquired late in the disease course, following colonization by S. aureus, non
encapsulated H. influenzae and P. aeruginosa. B. cepacia complex infection in CF has
been associated with lower life expectancy, longer hospital stay and a poor prognosis
(Isles et al. 1984; Mahenthiralingam et al. 2001; Tablan et al. 1987b). Long term
colonisation can occur in some CF patients with no decline in lung function (Gilligan
1991).
Colonisation of the CF lung by the Bcc is considered a contraindication to lung transplant
by many transplant centres (Barlow et al. 2000). However lung transplant may be the final
option for CF patients and can be beneficial. The survival rates for CF patients who have
undergone lung transplants are 81%, 58% and 49% after 1, 3 and 5 years respectively
(Aris et al. 2001). These survival rates are higher than those for CF patients with end stage
disease that do not receive a lung transplant (Hosenpud et al. 1998). Reviews of the
outcome following lung transplantation in CF patients demonstrated high mortality
following lung transplantation in Bcc colonised CF patients (Chaparro et al. 2001; Snell et
al. 1993). In contrast Egan et al reported that no significant difference in survival rates
were observed between Bcc colonised and non colonised CF patients following
transplantation (Egan et al. 1994). This group suggested that colonisation with Bcc alone
was not sufficient to refuse lung transplantation.
1.6.4.2 Bcc species Distribution
B. multivorans and B. cenocepacia are the most commonly isolated species from CF
patients, although B. multivorans is now the most prevalent in the UK (Mahenthiralingam,
81
Chapter 1 General Introduction
Baldwin, & Vandamme 2002; Mahenthiralingam, Urban, & Goldberg 2005; Vandamme et
al. 1997; Baldwin et al 2008). In contrast the prevalence of B. cepacia, B. stabilis, B.
anthina and B. pyrrocinia (Mahenthiralingam, Baldwin, & Vandamme 2002; Vandamme
et al. 2002) among CF patients is low, while B. vietnamensis and B. ambifaria are rarely
found (Mahenthiralingam, Baldwin, & Vandamme 2002; Mahenthiralingam, Urban, &
Goldberg 2005). Further studies to assess incidence of each species among CF patients
have supported the initial observations regarding species prevalence (Agodi et al. 2001;
LiPuma et al. 2001; Speert 2002). For example Speert et al examined 905 isolates from
447 CF patients in Canada and found that 83% of isolates were B. cenocepacia and 9.6%
were B. multivorans. LiPuma et al demonstrated that 50% of Bcc isolates from CF
patients in treatment centres across the United States were B. cenocepacia, 38% were B.
multivorans and 5% were B. vietnamensis. The remaining 5% was comprised of all other
species (LiPuma et al. 2001). Infection with B. cenocepacia is associated with a worse
outcome than other species (Jones et al 2004) although the effect of the less commonly
isolated species on prognosis is unclear.
1.6.4.3 Chronic Granulomatous Disease
Patients with chronic granulomatous disease are also at risk from infection with Bcc
bacteria. These patients suffer recurrent, life threatening infections with catalase positive
bacteria and fungi due to defects in oxidative killing in polymorphonuclear lymphocytes
(Speert et al. 1994). Infection with Bcc is the second most common cause of death in this
patient group, causing pneumonia and sepsis (Johnston, Jr. 2001).
82
Chapter 1 General Introduction
1.6.5 Transmission
1.6.5.1 Environmental Transmission
Outbreaks of Bcc have been attributed to contamination of disinfectants, antiseptics, dyes,
nebulizers and medical devices (Hutchinson et al. 1996; Kaitwatcharachai et al. 2000; Oie
& Kamiya 1996; van Laer et al. 1998). The ability of bacteria to survive drying allows
their maintenance on environmental surfaces (Smith, Eng, & Padberg, Jr. 1996) and the
possibility of transmission between hosts. B. cepacia complex bacteria can survive for
extended periods in respiratory droplets on surfaces at room temperature (Drabick et al.
1996). Bcc organisms were detected in air from patient rooms following physiotherapy
and therefore this represents a risk for transmission to patients from the environment
(Moore et al 2002).
1.6.5.2 Person to Person Transmission
Person to person infection was first documented in 1990 (LiPuma et al. 1990). However
retrospective analysis of stored strains has shown that the first recorded case of patient to
patient transmission of Burkholderia cepacia was in fact caused by a strain of B. dolosa
(LiPuma et al 1990). Contact with respiratory secretions from CF patients infected with
Bcc represents a risk for transmission (Moore et al. 2004). Highly transmissible epidemic
lineages have been documented that have caused outbreaks. Social contact between CF
patients has been associated with transmission at clinics and at Summer camp (Govan et
al. 1993; Pegues et al. 1994). Segregation of colonised individuals ensued and CF
Summer camps were closed. This has had an adverse psychological and social impact
effect on CF patients and their families (Govan & Nelson 1993).
83
Chapter 1 General Introduction
1.6.5.3 Transmissible Strains of the Bcc
Epidemic B. cepacia, B. cenocepacia and B. dolosa have been described (Biddick et al.
2003). However most cases of documented cases of transmission occur with B.
cenocepacia (Mahenthiralingam, Baldwin, & Vandamme 2002). Infection with B.
cenocepacia can replace B. multivorans during CF infection (Mahenthiralingam et al.
2001). Vandamme et al have demonstrated by analysis of the recA gene that there are 4
distinct B. cenocepacia lineages (Vandamme et al 2003).
B. cenocepacia ET-12 is the most studied transmissible Bcc strain which caused
epidemics across Canada and the UK in the 1980s and 1990s. It is believed to have spread
by person to person transmission (Clode et al. 2000; Ledson et al. 2002; Sun et al. 1995).
This lineage was isolated from 50% of UK CF centres and from 38% of Bcc colonised
patients (Pitt et al. 1996).
The enhanced capacity for spread of B. cenocepacia ET-12 is not fully understood.
However this is the only strain that contains all three putative transmissibility markers,
cable pili (Sajjan et al. 1995), the 22 kDa adhesin (Sajjan & Forstner 1993) and the B.
cepacia epidemic strain marker (BCESM; Mahenthiralingam, Simpson, & Speert 1997).
Cable pili are encoded by the cblA gene and mediate adherence to respiratory mucin (Sun
et al. 1995). Although associated with epidemic strains of B. cenocepacia a variant form
has been documented in B. cepacia (LiPuma et al. 2001). This lineage is highly resistant
to antibacterials and is resistant to meropenem (Nzula, Vandamme, & Govan 2002).
84
Chapter 1 General Introduction
The BCESM, otherwise known as esmR, is a 1.4 kb putative ORF with homology to
negative transcriptional regulators (Mahenthiralingam, Simpson, & Speert 1997). The role
of BCESM in transmissibility is unclear. Other epidemic B. cenocepacia lineages that are
causing outbreaks in CF patients include the PDHC clone and the Midwest clone. The
PDHC clone causes infection in the Mid Atlantic region of the USA (Chen et al. 2001)
while the Midwest clone causes infection of CF patients in the Midwest region of the USA
(LiPuma et al. 1988). These isolates described do not contain BCESM or the cblA gene
(Chen et al. 2001). Isolates of the PHDC clone have been isolated form soil, suggesting
that transmission of epidemic clones from the environment can occur (LiPuma et al.
2002).
Clinical outcomes following infection of CF patients by PHDC isolates and strains of the
ET-12 lineage are variable. While a proportion of patients develop cepacia syndrome
others are chronically infected with little effect on clinical status.
1.6.6 Identification
In the clinical laboratory, the Bcc are identified using a combination of selective media
and biochemical tests. Bcc bacteria can be difficult to isolate in the clinical laboratory as
these bacteria may be overgrown by other bacteria in a patient sample. The taxonomy of
the Bcc is still changing and the potential of some of the newly recognized species to
cause disease is not clear. There are variations in protocol for identification of Bcc
between laboratories. Prior to the routine use of selective media only 32% of laboratories
correctly identified B. cepacia from mock CF sputum (Tablan et al. 1987a). Members of
the Bcc have been misidentified as a number of organisms including Alcaligenes spp,
85
Chapter 1 General Introduction
Pseudomonas spp., S. maltophilia, Flavobacterium spp. and Chryseobacterium (Kiska et
al 1996). As some of these organisms can also cause disease in CF patients, the effects of
these misidentifications can be serious. Identification of B. cepacia may be complicated as
phenotypic changes can occur following long term colonization. Auxotrophic isolates of
P. aeruginosa (Barth & Pitt 1995a), S. aureus (Gilligan et al. 1987) and B. cepacia (Barth
& Pitt 1995b) have been found in the lungs of CF patients but not from non CF patients.
Auxotrophic bacteria cannot synthesize compounds required for growth therefore these
must be provided by the medium. Within the CF lung auxotrophic B. cepacia obtain
necessary nutrients from sputum and are selected from the prototrophic population (Barth
& Pitt 1995b). Colonies will grow on nutrient or blood agar and vary in appearance from
grey, white and yellow to brown, red or purple.
Selective media are used to isolate Bcc bacteria from specimens as other bacteria are also
likely to be present in greater numbers. The selective media employed make use of the
high intrinsic resistance of the Bcc as other less resistant bacteria are killed. A number of
selective agars are available that can be used to isolate B. cepacia from respiratory
specimens. Oxidation-fermentation polymixin bacitracin lactose agar (OFPBL) contains
lactose, polymixin and bacitracin. B. cepacia selective agar (BCSA) contains lactose,
sucrose in a base of casein and yeast extract containing polymixin, gentamicin and
vancomycin. Henry et al reported that this medium was superior to commercially
available plates and the oxidation fermentation agar (Henry et al. 1997). Pseudomonas
cepacia medium (PCA) contains polymixin and ticaricillin. However other Gram negative
bacteria that are polymixin resistant are also able to grow on selective media. Further
identification tests should follow.
86
Chapter 1 General Introduction
Most species cannot be identified phenotypically. A number of Polymerase Chain
Reaction (PCR) based assays were developed, that amplified the 16S gene, to identify
Bcc. However the majority of these assays were developed before it was recognized that
organisms identified as B. cepacia, consisted of a complex of species and utilized
sequence data that may not have been representative of the whole complex (Campbell, III
et al. 1995; Karpati & Jonasson 1996; O'Callaghan, Tanner, & Boulnois 1994). The
usefulness of 16S rDNA gene sequencing for species identification is limited because
there is a high degree of sequence similarity between 16s rRNA genes of Bcc and
discrimination of all members of the Bcc is difficult (LiPuma et al. 1999). Amplification
of the 16S rRNA gene followed by restriction enzyme mediated fragmentation produces a
Burkholderia species specific RFLP banding pattern (Segonds et al. 1999).
Mahenthiralingam used species specific primers that amplified the recA gene and a recA
based RFLP approach, to identify the Bcc (Mahenthiralingam et al. 2000).
Other techniques that have been used to identify members of the Bcc include sodium
dodecyl sulphate polyacrylamide gel electrophoresis (SDS PAGE) of whole cell proteins
(Vandamme et al. 1997), amplified fragment length polymorphism (AFLP) fingerprint
typing (Coenye et al. 1999) and whole cell fatty acid analysis (Vandamme et al. 1997).
Isolates survive well when stored in frozen tap water or as glycerol suspensions on beads.
However viability is not maintained on plates or refrigerated slopes. The oxidase reaction
is slow, nitrate is not reduced and members of the complex are lysine and ornithine
decarboxylase positive.
87
Chapter 1 General Introduction
1.6.7 Treatment
Bcc bacteria are highly resistant to many individual antibacterial agents and as a result are
difficult to eradicate. Prognosis is improved if transmission can be prevented. These
bacteria are intrinsically resistant to aminoglycosides due to low permeability of the outer
membrane as a result of an unusual structure of the core oligosaccharide of LPS (Cox &
Wilkinson 1991). Lipopolysaccharide is unusual in that the core oligosaccharide contains
less phosphate or 3-deoxy-D-manno-oct-2-ulosonic acid than other Gram-negative
bacteria (Cox & Wilkinson 1991). Strains also exhibit high levels of resistance to P-lactam
antibiotics due to altered penicillin binding proteins and inducible chromosomal P-
lactamases (Hancock 1998). The ability of B. cepacia to use pencillin G as a carbon
source is a well recognised example of its intrinsic resistance (Beckman & Lessie 1979).
Semisynthetic penicillins, carbapenems, fluoroquinolones, ceftazidime and trimethoprim
sulfamethoxazole can have activity against Bcc (Lewin, Doherty, & Govan 1993; LiPuma
1998). Nzula et al investigated the antibiotic susceptibility patterns of 65 Bcc isolates
including the B. cepacia complex strain panel (Mahenthiralingam et a l 2000) and B.
cenocepacia isolates cultured from soil (Nzula, Vandamme, & Govan 2002). All strains
were resistant to polymixin and colistin; this is unsurprising as incorporation of these
antibiotics into agar plates is used to allow selective growth of Bcc bacteria isolated from
clinical samples. Most strains were resistant to tetracycline and all strains were susceptible
to meropenem. Most strains were susceptible to ciprofloxacin (88%) and ceftazidime
(97%; Nzula, Vandamme, & Govan 2002).
CLSI (Clinical and Laboratory Standards Institute) recommends susceptibility testing to
ticaricillin plus clavulanic acid, ceftazidine, levofloxacin, minocycline, meropenem and
trimethoprim-sulfamethoxazole (CLSI, 2006) as these antibacterials can have activity
88
Chapter 1 General Introduction
against the Bcc. Treatment options include meropenem, ciprofloxacin, minocycline,
chloramphenicol and trimethoprim-sulfamethoxazole.
Two agents are recommended for exacerbations of CF (Gibson, Bums, & Ramsey 2003).
Double antibiotic combinations have more effect and are therefore used as treatment
(LiPuma 1998). Combinations including meropenem are particularly effective but
combinations including co-trimoxazole, tetracyclines and chloramphenicol also exhibit
activity.
1.6.8 Immunity
In the lungs of cystic fibrosis patients inflammation and deterioration is characteristic due
to infiltration of inflammatory cells, primarily neutrophils and production of cytokines
found in bronchial lavage samples of these patients. Compared to non CF patients lung
inflammation is increased with an elevated neutrophil response in CF patients (Hendry et
al. 1999). The response to infection with Bcc bacteria within the CF lung is undefined.
However certain virulence factors have been implicated. These include LPS and flagellin.
Differences in the abilities of Bcc isolates to cause inflammation have been observed. B.
cenocepacia isolates have the greatest propensity to cause inflammation through release of
TNF and IL-1. Within isolates of the ET lineage, the potential of whole cell lysates to
induce cytokine production from human monocytic cells has been shown to vary between
strains (De Soyza et al 2004).
89
Chapter 1 General Introduction
It has been demonstrated that the supernatants from strains of B. cepacia, stimulate release
of interleukin-8 (IL-8) from lung epithelial cells and peripheral blood monocytes
(Palfreyman et al. 1997). This has been shown to be due to flagellin of B. cepacia
interacting through a Toll-like receptor to initiate a signalling cascade that results in IL-8
secretion and results in inflammation of the lung (Urban et al. 2004).
B. cenocepacia LPS produces increased amounts of TNFa and IL-6 compared to B.
multivorans (Shaw et al 1995). Differences within the lipid A portion of LPS are likely to
account for the differences in cytokine production as this component is the main
determinant of induction of inflammation (Khan et al 1998). Cytokine induction from B.
cepacia LPS is nine times greater than from P. aeruginosa LPS.
The genomes of Burkholderia spp. contain large numbers of these CpG motifs because of
the large genome size (Coenye & Vandamme 2005). It has been shown that bacterial DNA
containing unmethylated CpG motifs stimulate lymphocytes to produce an inflammatory
response (Schwartz et al. 1997). It is likely, therefore, that CpG rich Burkholderia DNA
can initiate an inflammatory response in the host, although it is not clear how this
contributes to inflammation observed in CF patients.
1.6.9 Resistance to human antimicrobial peptides
Cationic antimicrobial peptides are produced by all organisms. (3 defensins 1 and 2 have
an important role in the innate immune system and have antibacterial action against Gram-
negative bacteria but not against Gram-positive bacteria (Raj & Dentino 2002; Schroder
1999). Genes encoding P defensins 1 and 2 are expressed throughout the respiratory
90
Chapter 1 General Introduction
epithelia. However the bactericidal activity of these defensins is thought to be inactivated
by the high salt concentrations that are found in the CF lung (Goldman et al. 1997).
Human P defensin (hBD-3) is active against both Gram-negative and Gram-positive
bacteria and is not inactivated by high concentrations of salt. However Burkholderia spp.
are unusual in that isolates are resistant to P defensins 1, 2 and 3 (Baird et al. 1999; Sahly
et al. 2003).
The protegrins are also antimicrobial peptides. Protegin-1 is bactericidal, is not inactivated
by high salt concentration and has a broad spectrum of activity (Harwig et al. 1996;
Steinberg et al. 1997). Five isolates of B. cenocepacia investigated were more resistant to
the bactericidal activity of protegrin-1 than P. aeruginosa. The increased resistance may
be due to the reduced number of protegrin binding sites on the lipid A moiety of the LPS
(Albrecht et al. 2002).
1.6.10 Genome
Members of the Bcc complex have large and unusual genomes which allow ecological and
nutritional diversity. The genome sizes range from 6MB to 9MB and have a GC content of
approximately 67%, a similar proportion to Pseudomonas spp. (Yabuuchi et al. 1992).
The genomes are unusual in that they contain more than one chromosome and contain
many insertion sequences and genomic islands (Mahenthiralingam, Urban, & Goldberg
2005). The number of chromosomes and genome size can vary between strains of the
same species (Parke 2001). Nine Burkholderia genomes have been sequenced. These
completed genomes represent strains of B. pseudomallei, B. mallei, B. thailandensis, B.
xenovorans, B. cenocepacia, B. cepacia complex Group K and B. dolosa. The genome
91
Chapter 1 General Introduction
sequences of strains of B. pseudomallei, B. mallei (Holden et a l 2004; Nierman et al.
2004) have been published. B. cenocepacia J2315 is currently being annotated.
Bacteriophages with interspecies host ranges have been found in soil and could contribute
to genetic transfer within the Bcc (Langley et al. 2003).
1.6.11 Virulence of the Bcc
Members of the Bcc exhibit a number of virulence determinants. These include
siderophore production (Sokol et a l 1999; Visser et a l 2004), expression of flagellar
proteins (Hales et al. 1998; Urban et al. 2004), biofilm formation (Conway, Venu, &
Speert 2002), quorum sensing (Venturi et a l 2004; Sokol et al 2003), type III secretion
(Glendinning et al. 2004; Tomich et al. 2003) and production of extracellular proteases
(Corbett et a l 2003).
1.6.11.1 Invasion
There is evidence that B. cepacia can invade respiratory epithelial cells (Bums et al. 1996)
and pulmonary macrophages to evade the immune response of immunocompromised
patients. Using a modified protection assay, Bums et al demonstrated that invasion of a
human alveolar epithelial carcinoma cell line (A549) monolayer occurs (Bums et al.
1996).
The ET strain J2315 causes apoptosis via production of a haemolytic toxin in
macrophages (Hutchison, Poxton, & Govan 1998). Bcc bacteria express one of two types
of flagellin which can be distinguished by size (55 kDa and 45 kDa) and by RFLP analysis
92
Chapter 1 General Introduction
of the fliC gene (Hales et al. 1998). Non motile J2315 strains are deficient in the ability to
adhere to and invade epithelial cells in vitro (Tomich et al. 2003).
1.6.11.2 Quorum Sensing
At present members of the B. cepacia complex are known to contain at least two quorum
sensing systems. The first pathway identified was the CepIR system, a homologue of the
lasIR/systems of P. aeruginosa (Lewenza et al. 1999) and is widely distributed throughout
species of the Bcc (Lutter et a l 2001). Analysis of gene expression of this system controls
expression of virulence factors including production of chitinase, proteases and
siderophores, swarming motility and maturation of biofilm (Aguilar et al. 2003; Huber et
al. 2001; Lewenza et al. 1999; Lewenza & Sokol 2001). Mutations in these genes cause
decreased virulence in infection models including killing of Caenorhabditis elegans
(Kothe et al. 2003; Lewenza et al. 1999; Sokol et al. 2003), infection of rats and
maceration of onion tissue (Aguilar, Bertani, & Venturi 2003). The autoinducer synthase
is encoded the cepl gene and is responsible for the production of the two signalling
molecules, A-hexanoyl-acylhomoserine lactone (C6-HSL) and TV-octanoyl-acylhomoserine
lactone (Cs-HSL). The increase in cell density and signal concentration allows CepR to
control expression of target genes. The second quorum sensing system was found within a
pathogenicity island carried by epidemic strains of B. cenocepacia, designated ccilR,
during random polymorphic DNA typing (Baldwin et al. 2004). The ceil gene is
responsible for production of the same two signalling molecules as the cepIR system, N-
hexanoyl-acylhomoserine lactone (C6-HSL) and small amounts of TV-octanoyl-
acylhomoserine lactone (Cs-HS). Mutants in ceil demonstrated reduced protease
production and swarming motility (Malott et al. 2005). In general Bcc bacteria produce
two signalling molecules, N-octanoylhomoserinelactone (Cg-HSL) and N-
93
Chapter 1 General Introduction
hexanoylhomoserine lactone (C6-HSL). Some strains of B. vietnamiensis produce other
long chain AHL molecules. The most common of the long chain AHL molecules was
confirmed as N-decanoylhomoserine lactone (Cio-HSL).
1.6.11.3 Exopolysaccharide
Production of exopolysaccharide (EPS) has a role in biofilm formation in P. aeruginosa
(Hoyle, Williams, & Costerton 1993). Overproduction of the polysaccharide alginate in
the lungs affects long term survival of CF patients infected by P. aeruginosa (Govan &
Deretic 1996). Approximately 80-90 % of CF Bcc isolates at a Portuguese centre were
found to produce the polysaccharide cepacian (Richau et al. 2000), suggesting a role in the
pathogenesis of Bcc in the CF lung. Cepacian consists of a branched acetylated
heptasaccharide repeating unit made up of D-glucose, D-rhamnose, D-mannose, D-
galactose and D-glucuronic acid (Sist et al. 2003). Random plasposon insertion
mutagenesis was used to create mutants defective in EPS production and these mutants
were unable to form thick biofilms. It is likely that cepacian is required for development
of mature biofilms (Cunha et al. 2004).
1.6.11.4 Proteases
Between 69 and 88 % of clinical Bcc isolates produce extracellular proteases (Gessner &
Mortensen 1990; Gilligan 1991; McKevitt & Woods 1984; Nakazawa, Yamada, &
Ishibashi 1987). Gotschlich et al have reported that strains of B. cepacia, B. cenocepacia
and B. stabilis have been shown to have extracellular protease activity while B.
multivorans, B. dolosa and B. vietnamensis do not (Gotschlich et al. 2001). Two
metalloproteases have been described in B. cepacia (McKevitt et al. 1989).
94
Chapter 1 General Introduction
The 36 kDa protease, described in B. cenocepacia, has been identified as a zinc
metalloprotease (ZmpA; McKevitt et al. 1989). This protease had been shown to not
cleave elastin (McKevitt & Woods 1984), unlike P. aeruginosa which can cleave elastin.
Purified protease causes bronchopneumonia in rats with polymorphonuclear leukocyte
infiltration and airway exudate. Sokol et al demonstrated that zinc metalloprotease
peptides given as vaccines offer some protection against lung damage in lungs of rats
(Sokol et a l 2000). At 109 CFU or higher, the ZymA protease is lethal in mice (Gonzalez
& Vidaver 1979). Nonproteolytic strains colonised skin of burned mice and persisted at
7 0 t t c10 - 10 CFU for 3 weeks after injection of 10 CFU. No organ invasion was observed
(Stover, Drake, & Montie 1983). A second metalloprotease (ZmpB) has recently been
identified in Bcc that can cleave immunoglobulins, lactoferrins and transferrin while
ZmpA can not (Kooi et al. 2006).
1.6.11.5 Type III Secretion
Type III secretion is a mechanism by which Gram-negative bacteria translocate proteins
from the bacterial cytoplasm into the host cell cytoplasm. When inside the host cell, these
effector proteins subvert the host cell machinery to the advantage of the bacterium. Type
III secretion dependent delivery of effector proteins is associated with invasion with S.
typhimurium (Collazo & Galan 1996), lesion formation by enteropathogenic E. coli (Jarvis
et al. 1995), cytotoxicity caused by P. aeruginosa (Finck-Barbancon et al. 1997), evasion
of phagocytosis by Yersinia (Comelis & Wolf-Watz 1997) and intracellular survival by S.
enterica (Cirillo et al. 1998).
95
Chapter 1 General Introduction
Burkholderia spp. possess TTS machinery. B. pseudomallei (Rainbow, Hart, &
Winstanley 2002; Stevens et al. 2002) and B. mallei (Ulrich & DeShazer 2004) contain
putative TTS gene clusters. TTS systems are present in all Bcc species, except B. cepacia
(Parsons et al. 2001). A TTS mutant of B. cenocepacia J2315 was attenuated in a murine
model, it is therefore likely that TTS have a role in virulence of the Bcc (Tomich et al.
2003).
1.6.11.6 Siderophores
Iron is required as a co-factor for redox dependent enzymes in bacteria. However in many
environments the concentration of soluble iron is insufficient to allow bacterial growth
(Ratledge & Dover 2000). Siderophores are small molecules with high affinity for iron
that compete with the host proteins to chelate iron molecules. Siderophore chelated iron
can then be recognized by specific cell receptors and taken up by the cell, where iron is
released. Bcc bacteria produce four types of siderophores; pyochelin, salicyclic acid,
cepabactin and omibactin (Meyer, Hohnadel, & Halle 1989; Sokol 1986; Sokol, Lewis, &
Dennis 1992; Stephan et al. 1993; Visca et al. 1993). In a study by Sokol et al pyochelin
producers were associated with severe pulmonary disease while pyochelin negative strains
were associated with mild disease (Sokol 1986). Addition of pyochelin to a pyochelin
negative strain increased virulence in the rat lung model (Sokol & Woods 1988).
Omibactins were found to be the most frequently produced siderophore in a study of 61
Bcc isolates (Darling et al. 1998).
96
Chapter 1 General Introduction
1.6.11.7 Virulence Models
Animal models have been used to elucidate roles of virulence factors. However alternative
models are required as using animal models is time consuming, labour intensive and
expensive. Alternative model systems that have been described in other species, include
Arabidopsis thaliana (Rahme et al. 1995; Rahme et al. 1997; Rahme et al. 2000), C.
elegans (Tan & Ausubel 2000; Tan, Mahajan-Miklos, & Ausubel 1999), Drosophila
melanogaster (D'Argenio et al. 2001) and Galleria mellonella (Jander, Rahme, & Ausubel
2000). Alfalfa has been used successfully to measure virulence in Bcc (Bernier et al.
2003).
One of the most commonly used animal models used for studying Bcc lung infections is
the mouse agar bead model. This involves intratracheal inoculation of mice with an agar
bead containing 105 CFU organisms (Cieri et al. 2002). Intranasal or intraperitoneal
administration of Bcc to immunosupressed mice are also used (Chu et al. 2002; Speert et
al. 1999).
1.6.12 Use in Agriculture
Bcc bacteria are some of the most common culturable microorganisms in the plant
rhizosphere (Tsuchiya et al. 1995). Some members of the genus are also bio-degraders of
chlororganic pesticides and polychlorinated biphenyls. Burkholderia species have been
used in agriculture as biodegraders and plant-growth-promoting rhizobacteria. The risks of
transmission to immunocompromised patients are as yet unclear (Govan & Vandamme
1998). The production of antibiotics can control soil borne plant pathogens. Bcc bacteria
97
Chapter 1 General Introduction
have been used to prevent damping off disease caused by Phythium sp., Rhizoctania solani
and Fusarium sp. (Parke & Gurian-Sherman 2001). This offers an alternative to treatment
to fungicides, which have adverse effects on the environment and human health. Strains of
B. vietnamensis and B. ambifaria are favoured as biopesticides as these species are not
commonly isolated from CF patients (Parke & Gurian-Sherman 2001). Isolates of B.
vietnamensis are more susceptible to ceftazidime compared to isolates of other species
(Nzula, Vandamme, & Govan 2002). B. vietnamensis, therefore, may be the most
appropriate species for use as a bio-control agent. However the risk to CF patients of using
strains in this way is unclear.
98
Chapter 1 General Introduction
1.7 Aims of thesis
The aims of this thesis were to investigate the evolution of fluoroquinolone resistance in
Burkholderia cepacia complex bacteria. Fluoroquinolone antibiotic use is increasing and
Bcc bacteria can be susceptible to this drug class. A method for estimation of mutation
rate in topoisomerase genes was standardised and is described in chapter 3.
Fluoroquinolone resistant B. cepacia, containing single and double topoisomerase
mutations, were selected in vitro and characterised. Acquisition of resistance mutations
may or may not incur a fitness cost and the extent of this cost may affect the ability of
resistant bacteria to survive in the bacterial population. Fitness costs may be ameliorated
by reversions or compensatory mutations that restore reproduction potential. Models,
relevant to the transmission of B. cepacia, were used to assess the fitness cost of these
characterised topoisomerase mutations and described in chapter 5. A method for
quantifying biofilm formation is described in chapter 4. Application of tools developed in
this thesis, have been used to investigate clinical isolates in chapter 6. Methods of
detecting hypermutability of clinical B. cepacia complex bacteria isolated from CF
patients isolates are described, also in chapter 6.
99
Chapter 2 Materials and Methods
2.0 General Materials and Methods
2.1 Culture Conditions
To ensure that strains did not undergo further mutation all strains and antibiotic
resistant mutants were stored at -70°C using the Microbank system, consisting of
cryovials containing beads and cryopreservative solution (Pro-lab Diagnostics,
Neston, UK). All FQ resistant mutants were derived from the NCTC 10661 B.
cepacia strain. All clinical isolates were isolated from adult cystic fibrosis patients
with well characterised infection attending a CF clinic at Belfast City Hospital,
Northern Ireland (kindly provided by Dr J.E. Moore; Table 2.1).
To culture the strain, a bead was inoculated onto a Columbia blood agar plate (Oxoid,
Basingstoke, UK), spread with a disposable loop and incubated at 37°C for 18 hours.
Isolate SourceNCTC 10661 National Type Culture Collection, Health
Protection Agency, ColindaleBCH 1 Belfast City HospitalBCH 2 Belfast City HospitalBCH 3 Belfast City HospitalBCH 4 Belfast City HospitalBCH 5 Belfast City HospitalBCH 6 Belfast City HospitalBCH 7 Belfast City HospitalBCH 8 Belfast City Hospital
Table 2.1 Sources of B. cepacia isolates
100
Chapter 2 Materials and Methods
2.2 Preparation of Media
2.2.1 Muller Hinton broth
22 g Muller Hinton broth powder (BD, Le Pont de Claix, France) was dissolved in 1 L
distilled water and autoclaved, according to the manufacturer’s instructions.
2.2.2 Luria-Bertani (LB) broth
25 g of Luria Bertani broth powder was dissolved in distilled water and autoclaved,
according to the manufacturer’s instructions.
2.2.3 Muller Hinton agar
38 g Muller Hinton agar powder (BD, Le Pont de Claix, France) was dissolved in 1 L
distilled water and autoclaved, according to the manufacturer’s instructions. The agar
was allowed to equilibrate to 50°C in a water bath. 20 mL of liquid media was poured
into sterile disposable Petri dishes (Sterilin, Supplied by Western Laboratory Service,
Aldershot, Hampshire, UK) using sterile technique. Plates were allowed to set and
stored upside down in plastic bags at 4°C. Plates were dried before use at 37°C for 15
min.
2.2.4 Commercially Available Agar Plates
Ready prepared Nutrient agar, Columbia agar with horse blood and Isosensitest agar
plates (Oxoid, Hampshire, UK) were used.
101
Chapter 2 Materials and Methods
2.3 Preparation of Buffers and Solutions
2.3.1 1M Tris
121.1 g Tris base (Promega, Hampshire, UK), 42 mL of concentrated HCL stock was
dissolved in 1 L of distilled water and adjusted to pH 8.0.
2.3.2 0.5 M EDTA
1.86 g EDTA disodium salt was dissolved in 800 mL distilled water and adjusted to
pH 8.0 with NaOH (Sigma Aldrich, Steinheim, Germany) and stirred vigorously.
2.3.3 Tris-Borate EDTA (TBE) buffer
A 5 x solution was prepared by mixing of 54 g Tris base (Promega, Hampshire, UK),
27.5 g boric acid (BDH, Leicestershire, UK) and 20 mL 0.5M EDTA pH 8.0 in 1 L of
distilled water. This was dissolved using a magnetic hot plate stirrer and flea.
2.3.4 5M NaCl
146.1 g sodium chloride (VWR International Ltd., Poole, UK) was dissolved in 500
mL distilled water.
2.3.5 Phosphate Buffered Saline (PBS)
1 x PBS solution was prepared by dissolving 1 PBS tablet (BDH, Leicestershire, UK)
in 100 mL distilled water. PBS was then autoclaved.
102
Chapter 2 Materials and Methods
2.3.6 Ciprofloxacin
0.025 g ciprofloxacin powder (98.4 % purity) (CellGro, Herndon, Virginia, USA) was
dissolved in 24.61 mL sterile distilled water (SDW) to produce a 1000 mg/L stock
solution. 1 mL aliquots were stored for later use at -70°C for no more than 4 weeks.
2.3.7 Clinafloxacin
0.025 g clinafloxacin powder (98%) (Sequoia Research Products, Pangboume, UK)
was dissolved in 24.5 mL SDW to produce a 1000 mg/L stock solution. 1 mL aliquots
were stored for later use at -70°C for no more than 4 weeks.
2.4 Growth Curve
A 25 mL conical flask containing 5 mL of Muller Hinton broth was inoculated with
100 pi of an overnight Muller Hinton broth culture and sealed with a cotton wool
bung. This was incubated at 37°C in an orbital shaker (200 r.p.m) (Barloworld
Scientific, Staffordshire, UK). Samples (0.5 mL) were removed aseptically at 30 min.
intervals
2.5 Miles and Misra Viable Cell Count (Miles & Misra 1938)
Muller Hinton agar plates were dried at 37°C for 15 min. prior to inoculation. 100 pi
of Muller Hinton broth culture was diluted in 900 pi PBS, this was then vortexed and
used to produce a bacterial dilution series (1 0 1 to 10'6). Each dilution was vortexed
103
Chapter 2 Materials and Methods
briefly and three replicate 20 pL volumes of diluted broth culture were spotted onto
three segments of blood agar plates from approximately 1 cm above the surface of the
plate. Plates were then incubated at room temperature for 30 min. to allow the drops
to soak into the agar and incubated at 37°C overnight. Colonies were counted using
the dilution that yielded between approximately 20 and 40 colonies. The mean
number of colonies used to calculate the number of colony forming units per mL in
the neat broth culture.
2.6 Determination of Minimum Inhibitory Concentration (MIC)
2.6.1 E-test
Minimum Inhibitory Concentrations (MIC) of parent and mutant strains were
determined by E-test (AB Biodisk, Solna, Sweden), following the manufacturer’s
guidelines. Organisms were suspended in 3 mL sterile distilled water to a turbidity of
0.5 MacFarland. A cotton wool swab was immersed into this suspension and excess
fluid removed and was swabbed three ways across an Isosensitest plate (Oxoid,
Basingstoke, UK) an E-test strip was applied and the plate incubated (37°C, 18 hours)
to obtain semi-confluent growth. Results were interpreted by recording the point of
intersection between the ellipse of inhibition and the strip.
2.6.2 Agar Dilution
MIC was determined according to the CLSI guidelines for susceptibility testing of
aerobic organisms (CLSI, 2006).
104
Chapter 2 Materials and Methods
For the agar incorporation method 1 mL of ciprofloxacin of a range of concentrations
was added to 19 mL of molten agar. Approximately 104 organisms were spotted onto
the surface of an agar plate using a multi prong inoculator. The lowest dilution that
completely inhibited growth was recorded as the MIC.
2.6.3 Method for determination of mutation rate by the method of the median.
Isolates were removed from the -70°C freezer and one bead was used to sub culture B.
cepacia onto a blood agar plate and incubated aerobically at 37°C. One colony of Bcc
was suspended in 5 mL of Muller Hinton Broth in a 25 mL conical flask. This was
sealed with a cotton wool bung and incubated at 37°C on a rotary shaker (200 r.p.m.)
(Barloworld Scientific, Staffordshire, UK) for 2.5 hours until an optical density
(OD60o) of approximately 0.1 OD units was reached (ensured that 100 pL of the 10'3
dilution of this culture would contain approximately 10 cells. Serial dilutions of this
broth culture were performed in PBS (neat to 10‘6). A 100 pL aliquot of the 10‘3
dilution (containing approximately 103 cells) was added to each of 28 microcentrifuge
tubes, containing Muller Hinton Broth (1 mL). These cultures were incubated at 37°C,
200 r.p.m 18 hours (Barloworld Scientific, Staffordshire, UK). Muller Hinton Agar
plates (Oxoid, Basingstoke) containing 2 x MIC of ciprofloxacin were prepared and
inoculated the following day. Antibiotic free agar plates were also prepared (section
2.2.3). Before inoculation, plates were allowed to dry at 37°C with the lids removed
for 20 min. This ensured that drops were absorbed by the agar. At the end of the
incubation period, a Miles and Misra plate count was performed on 3 randomly
selected broths, section 2.5 (Miles 1938). Dilutions of 10'1 to 10'6 were prepared.
Twenty microlitres of the 10'3, 10-4, 10'5 and 10'6 dilutions were spotted in triplicate
onto duplicate drug free Muller Hinton plates.
105
Chapter 2 Materials and Methods
The microcentrifuge tubes were centrifuged at 4000 g , 3 min. and the supernatant
discarded. Using a fine tipped pastette, the deposit was resuspended in residual broth
(approximately 40 pL). The total volume was then inoculated onto ciprofloxacin
containing Muller Hinton plates, spread with a plastic spreader and allowed to dry.
All plates were incubated (37°C, 48 hours). Colony forming units per mL were
calculated from the Miles and Misra drug free plates. The number of visible colonies
on each plate were counted by eye and recorded. The median number of colonies was
determined. The number of mutations per culture was calculated using the following
equation 4.
r /m-ln(m) - 1.24 = 0 [Eq 4]
The mutation rate (ju) was calculated using Equation 5.
mju = [Eq 5]
average cfu/mL
This experiment was repeated 4 times to give a median mutation rate.
2.6.4 Detection of Efflux
The ciprofloxacin MIC of the fluoroquinolone resistant strains was determined in the
absence and presence of reserpine (25 mg/L) in Muller Hinton agar (Beyer et al.
2000). Reserpine (25 mg) was dissolved in 250 pi chloroform and immediately added
to 1 L molten agar. Molten agar containing reserpine was mixed by agitation. Isolates
were considered positive for reserpine inhibited efflux if there was a fourfold or
greater decrease in the ciprofloxacin MIC in the presence of reserpine (Sigma
106
Chapter 2 Materials and Methods
Chemical Co., St. Louis, Mo., USA). The addition of the 250 pi chloroform alone did
not affect MIC.
2.7 DNA Extraction
2.7.1 Crude Extraction
A loopful of B. cepacia was emulsified in 0.5 mL PCR grade water and heated at
95°C for 10 min. Cellular debris was removed by centrifugation (3 min., 8000 g ).
Supernatant was removed, using a fine tipped pastette, and transferred to a clean
microcentrifuge tube.
2.7.2 DNA Extraction
DNA was extracted using the Promega Wizard DNA extraction kit (Promega,
Hampshire, UK), following the manufacturers’ guidelines. 1 mL of an overnight
culture was centrifuged in a microcentrifuge tubes at 16,000 g for 2 min. and the
supernatant discarded. Cells were resuspended in 600 pL of lysis buffer and mixed by
pipetting. Tubes were incubated at 80°C for 5 min. and cooled to room temperature. 3
pL of RNAse solution was added and the tubes were incubated at 37°C for 15-30 min.
and cooled to room temperature. 200 pL of protein precipitation solution was added
and the tubes vortexed for 20 seconds and incubated on ice for 5 min. Cell debris was
precipitated by centrifugation at 16,000 g for 3 min. and the supernatant transferred to
a fresh microcentrifuge tube containing 600 pL of room temperature isopropanol
(BDH, Leicestershire, UK). The suspension was mixed by gentle inversion until
strands of DNA could be seen. Microcentrifuge tubes were centrifuged for 10 min.
and the pellet washed in 70 % ethanol and dried for 15 min. at room temperature. 100
107
Chapter 2 Materials and Methods
pL of DNA rehydration solution was added and the tubes were incubated at 65°C in a
water bath for 60 min, mixing by inversion every 20 min. Extracted DNA was stored
at 4°C for no longer than 1 week.
2.8 Polymerase Chain Reaction and sequence analysis
2.8.1 Polymerase chain reaction (PCR)
PCR primers were rehydrated and diluted with PCR quality water (Royal Free
Hospital Pharmacy) to 100 mM stock solutions and stored at -70°C. PCR water was
exposed to UV light, in 1 mL aliquots, for 10 min. to eliminate DNA contamination.
Working primer stocks were diluted to 10 mM and stored at 4°C. Bacterial DNA was
diluted 1:10 in PCR quality water and 10 pL was added to each PCR reaction. This
represented approximately 40 ng of DNA. The PCR mastermix contained 1.5 mM
MgCl in KCL buffer (Bioline, London, UK), 10 pL of each primer at a 1 pM
concentration (Sigma Aldrich, Steinham, Germany), 10 pM of deoxynucleoside
triphosphates (Promega, Hampshire, UK) and 1 U of Taq polymerase (Bioline,
London, UK). Cycling conditions consisted of 95°C for 3 min followed by 35 cycles
of 95°C for 1 min, 55°C for 1 min and 72°C for 1 min. This was followed by strand
elongation at 72°C for 7 min (GeneAmp PCR system 9700).
2.8.2 Agarose Gel Electrophoresis
Agarose gel electrophoresis was used to visualise PCR products. 1.5 % agarose gels
were prepared by addition of 0.45 g agarose powder (Bioline, London UK) to
108
Chapter 2 Materials and Methods
30 mL Tris Borate EDTA (TBE) buffer. This was mixed, melted by heating until
boiling in a microwave oven and allowed to cool. Ethidium bromide (Sigma Aldrich,
Steinheim, Germany) was then added to give a final concentration of 0.05 pg/mL. On
each gel, 5 pL of 100 base pair ladder (Invitrogen, Paisley, UK) was loaded in order
to determine size of PCR amplicons.
2.8.3 Gel Photography
Gels were photographed with a digital camera (DC 120 Kodak Digital) on a UV
transilluminator (UVL Inc, California, USA) using camera software version 2.0
(Kodak, California, USA). Images were stored as JPEG files.
2.8.4 PCR Product Purification
PCR products were purified using the MinElute Purification Kit (Qiagen, Crawley,
West Sussex, UK) according to the manufacturer’s instructions. PCR products were
then quantified by agarose gel electrophoresis. Intensity of the band was compared to
lambda DNA of known concentrations to quantify the amount of DNA present.
2.8.5 Cycle Sequencing
Forward and reverse cycle sequencing reactions were performed in duplicate using
the Big Dye Terminator Cycle sequencing ready reaction DNA sequencing kit v 2.0.
(Applied Biosystems, Inc., Foster City, California, USA) according to the
manufacturer’s instructions. Purified PCR products (approximately 40 ng), were
added per cycle sequencing reaction. Each reaction consisted of 1 pL ready reaction
mix, 10.8 pL PCR quality water and 3.2 pL mmol primer. PCR products were
sequenced using an ABI Prism 377 DNA sequencer (Applied Biosystems, Foster
109
Chapter 2 Materials and Methods
City, CA, USA). Sequences were analysed using Bionumerics Version 2.0 (Applied
Maths, Kortrijk, Belgium) and compared to the QRDR sequences of the susceptible
parent.
2.8.6 Ethanol Precipitation
Labelled DNA was precipitated by the addition of 62.5 pL of 95 % ethanol (Royal
Free Hospital Pharmacy), 3 pL sodium acetate (pH 4.6, 2.3 mol/L) (Sigma Aldrich,
Steinheim, Germany) and 14.5 pL PCR quality water (RFH Pharmacy). The solution
was vortexed and centrifuged at 13,000 g for 15 min at 4°C and the supernatant was
discarded using a fine tipped pastette (Western Laboratories, Hampshire, UK).
Ethanol (200 pL, 70 %; RFH Pharmacy) was added to clean the DNA pellet and the
sample was centrifuged at 13,000 g for 5 min. at 4°C. The supernatant was removed
with a fine tipped pastette and the tubes were dried at 37 °C for 30 min. Formamide (4
pL) and loading buffer (1 pL) was added to each sample (Sigma Aldrich, Steinheim,
Germany) and 1.7 pL of the resulting mixture was loaded into each well. Samples
were sequenced using an ABI 377 Applied Biosystems sequencer (Applied
Biosystems, Foster City, California, USA).
110
Chapter 2 Materials and Methods
2.9 Fitness Assays
2.9.1 Biofilm Growth
2.9.1.1 Constant Depth Film Fermenter
2.9.1.1.1 Conditions
The constant depth film fermenter (CDFF) was maintained at a constant temperature
of 37°C by housing it in an incubator. An aerobic atmosphere was maintained by
exposure to the environment via a filtered air inlet in the top plate. Muller Hinton
Broth was delivered to the fermenter at a flow rate of 0.5 litres/day.
2.9.1.1.2 Inoculum
The inoculum used was 10 mL of an overnight, shaken culture (200 r.p.m.) of B.
cepacia grown in Muller Hinton Broth (37°C) taken from a single colony from a
blood agar plate. A 10 mL volume of the overnight culture was aseptically added to 1
L of autoclaved Muller Hinton Broth. This inoculum was pumped into the CDFF
overnight via sterile tubing at the sampling port. Time point zero was taken as the
time that this pump was activated.
2.9.1.1.3 Sampling
At 4 h and then every subsequent 24 h, from time point zero, a pan was sacrificed
from the CDFF, using a sterile sampling tool. A Miles and Misra plate count was
performed on Muller Hinton agar plates on three plugs and each dilution was plated in
triplicate (section 2.5). To avoid contamination a surgical face mask was used during
sampling and the port was ethanol flamed, using a portable Bunsen burner. A growth
curve for the wildtype isolate and images of the developing biofilm were obtained.
I l l
Chapter 2 Materials and Methods
2.9.1.1.4 Confocal Laser Scanning Microscopy (CLSM)
Biofilms were analysed by CLSM using a modification of methods described
previously (Hope & Wilson 2003). The discs were placed onto a petri dish 5 cm in
diameter (held in place by vacuum grease) biofilm side up, then carefully submerged
in itocLight™ LIVE/DEAD stain (Molecular Probes, Oregon, USA) which comprised
of 2 pL each of component A and B in 8 mL of SDW, allowing minimum disruption
and desiccation of the biofilms. This stain contains the two dyes SYTO 9 and
propidium iodide. Viable cells appear green while non-viable cells appear red, due to
damaged membranes. After incubation in the dark for 10 min., the biofilm was
examined on a fixed stage microscope (BX51 stereomicroscope, Olympus UK
limited, Southall, UK) with a Radiance 3000 laser scan head (Biorad, Jena, Germany)
mounted on a vibration free platform. Lasers used were Helium Neon (543 nm) and
Argon (488 nm). Image acquisition was performed using Biorad LASERSHARP
2000.
The procedure was optimised for viewing of the cells. The settings selected, using the
x 60 water objective were zoom 1.8, speed 166 lps, pixels x lines 1024 x 1024. Filter
set 2 was used for visualisation via the microscope eye piece. The prism refractor was
removed in order to scan and an empty filter case used. Captured images were
visualised and a 3D representation of the spatial visualisation of the biofilm produced
using the java based ImageJ software (National Institute of Health). The 3D images
were created from live and dead colour channels using the 3D project option. These
were combined to create a single RGB stack using the RGB Merge function.
112
Chapter 2 Materials and Methods
2.9.1.2 Crystal Violet Assay
Quantification of biofilm growth was achieved by spectrophotometric measurement
of crystal violet binding using a previously published method (O'Toole & Kolter
1998). Briefly 100 pL of a 1:100 overnight LB broth (BD, Le Pont de Claix, France)
culture containing 0.5 % casamino acids (BD, Le Pont de Claix, France) was used to
inoculate 8 independent wells of a 96 well polyvinyl chloride microtitre plate (Falcon
3911 Microtest III flexible assay plate, Becton Dickinson LabWare, Becton
Dickinson, Oxford, UK). Negative control wells contained broth only. This was
incubated for 24 hours at 30°C in a humid atmosphere. The medium was gently
removed and the wells washed 3 times with 200 pL SDW using a multi channel
pipette. The microtitre plate wells were stained with 200 pL of 1 % (w/v) crystal
violet for 15 min. at room temperature (Sigma Chemical Co., St. Louis, Mo., USA).
Unbound crystal violet was removed by repeated washing with water. Bound crystal
violet was solubilised with 2 x 200 pL of 95% ethanol, transferred to a
microcentrifuge tube and the volume made up to 1 mL. The resulting absorbance was
determined at wavelength 590 nm using a spectrophotometer (Pharmacia Biotech
Ultraspec 2000). Each experiment was repeated in triplicate.
2.9.2 Planktonic Growth
The method of Youmans and Youmans (Youmans & Youmans 1949) was modified to
determine growth rate.
The Bactec 9240 continuous, blood culture system with standard aerobic medium
(Plus Aerobic/F) was used (Becton Dickinson, Oxford, UK). Aliquots of 100 pL of
113
Chapter 2 Materials and Methods
diluted exponentially growing culture (1/10 and 1/1000), were removed using a 0.5
mL syringe and a needle and were aseptically inoculated into duplicate culture vials.
The vials were then loaded immediately into the system. The length of time to
detection (time to positivity) was measured for all strains. Gram stain and a purity
plate were performed to confirm absence of contaminants. The growth rate constant k
can be determined using the following equation (equation 6), where A is the largest
inoculum employed, B is the smallest inoculum and t is the difference in time to
positivity in hours. Generation time can then be determined by dividing log of 2 by
the growth rate constant (equation 7). This experiment was repeated in triplicate.
k = log/4 - logB [Eq.6] t
G = log2 [Eq.7]k
2.9.3 Competition Assays
The optical densities of wild type and mutant overnight 1 pL Muller Hinton broth
cultures were adjusted to the same value (1.0 OD600 units) using a spectrophotometer
(Pharmacia Biotech Ultraspec 2000). Then 250 pL of each culture was inoculated into
15 mL of LB broth, in the absence of antibiotics and this mixed culture was incubated
for 10 hours, (200 r.p.m; Barloworld Scientific, Staffordshire, UK). The culture was
then plated onto both drug free Muller Hinton plates and Muller Hinton plates
containing twice the MIC of the susceptible parent. The number of parent susceptible
cells was determined by subtracting the number of viable cells growing on drug
containing plates from the total number of viable cells on drug free plates.
114
Chapter 2 Materials and Methods
The fitness of the strains was determined by calculation of the number of generations
grown by the parent and resistant strains using the equation 8 (Gillespie, Voelker, &
Dickens 2002):
G = logB-logA [Eq. 8] log2
where G is the number of generations, A is the number of CFU at time 0 and B is the
number of CFU per mL after the incubation period. The relative fitness of each strain
was calculated from the ratio of the number of generations grown by the resistant to
susceptible strains. Five independent pair wise cultures were performed for each
mutant.
2.9.4 Survival in water
Survival in water was assessed using the method employed by Sanchez et al (Sanchez
et al. 2002). Overnight Muller Hinton 1 mL broth cultures were pelleted by
centrifugation (13,000 g, 3 min.), washed three times in PBS (1 mL) and an inoculum
of approximately 1 x 10⁸ CFU was added to duplicate duran bottles, each containing
19 mL of autoclaved tap water. Aliquots were aseptically removed at time intervals
(Day 0, 1,2, 5, 7, 8, 9 and 13) and the viable CFU/mL determined, using the Miles
and Misra technique (section 2.5). Each experiment was repeated in triplicate.
115
Chapter 2 Materials and Methods
2.9.5 Survival on dry surfaces
Survival on dry surfaces was assessed using the method employed by Sanchez et al
(Sanchez et al. 2000). Overnight Muller Hinton 1 mL broth cultures were pelleted by
centrifugation, washed three times in 1 mL PBS and concentrated 10 fold to a final
cell concentration of approximately lx 109. Using a pipette aliquots (10 pL) of the
concentrated culture were spotted into duplicate wells of a 96 well flat bottomed
microtitre plate (Western Laboratories, Hampshire, UK) and allowed to dry at room
temperature. Survival was determined by sampling at hourly intervals for 7 hours by
the addition of 100 pL of PBS containing 0.25 % v/v Triton x 100 (BDH,
Leicestershire, UK) to the wells, followed by mixing to form a bacterial suspension.
The 100 pL was then added to 900 pL of PBS, vortexed, and numbers of viable
bacteria were determined by the Miles and Misra technique (section 2.5). The addition
of Triton x 100 to PBS did not reduce numbers of viable cells. Each experiment was
repeated in triplicate.
116
Chapter 3: Estimation of mutation rate in topoisomerase genes of B. cepacia
3.0 Introduction
3.1 Fluoroquinolone resistance
3.1.1 Fluoroquinolone Resistance in B. cepacia
The molecular mechanisms of fluoroquinolone resistance in B. cepacia have not previously
been reported. Amino acid substitutions in the quinolone resistance determining regions
(QRDR) of topoisomerase genes have been described in other Gram-negative bacteria
including Proteus mirabilis, S. enterica, Chlamydia trachomatis, E. coli and P. aeruginosa
(Chen & Lo 2003; Dessus-Babus et al. 1998; Eaves et al. 2004; Rafii, Park, & Novak 2005;
Weigel, Anderson, & Tenover 2002).
Evidence from related organisms suggests that mutation in gyrA is most likely to be the
primary resistance mechanism in B. cepacia. Amino acid substitutions at codon 83 in gyrA
have been identified in oxolinic acid resistant strains of Burkholderia glumae (Maeda et al.
2004). Mutations at codon 83 and 87 of gyrA were identified in nalidixic acid resistant B.
vietnamensis mutants (Miche & Balandreau 2001) and mutation in gyrA is the most primary
cause of fluoroquinolone resistance in P. aeruginosa (Cambau et al. 1995; Kugelberg et al.
2005; Yonezawa et al. 1995).
3.1.2 Double mutation in topoisomerase genes
Single mutations in subunit A of DNA gyrase are the most common cause of low to
moderate increases in resistance in Gram negative organisms (Chen & Lo 2003; Hooper
2003). To obtain high level FQ resistance a second mutation is required in parC or gyrA.
117
Chapter 3: Estimation of mutation rate in topoisomerase genes of B. cepacia
Double mutations in DNA gyrase/topoisomerase IV have been characterised in clinical and
in vitro isolates of E. coli (Truong et al. 1997; Vila et al. 1994) and in isolates of P.
aeruginosa and S. pneumoniae that have been selected in vitro (Gillespie et al. 2003;
Gillespie, Voelker, & Dickens 2002; Kugelberg et al. 2005). A limited number of amino
acid substitutions conferring resistance, have been reported and in Gram-negative bacteria
the most common occurs at codon 83 (Drlica 2003; Ruiz 2003; Vila et al. 1995) and the
second most common at codon 87 (Everett et al. 1996; Vila et al. 1994). Substitutions at
these codons are also found in Gram-positive bacteria, including S. aureus and S.
pneumoniae (Jones et al. 2000; Schmitz et al. 1998). Substitutions in gyrB conferring
resistance in E. coli that have been described occur at codons 426 and 447 (Nakamura et al.
1989; Yoshida et al. 1990a).
3.1.3 Applications of Mutation Rate Estimation Experiments
Oliver et al used the Crane method, (see section 1.2.9) (Crane, Thomas, & Jones 1996) to
show that antibiotic resistant isolates of P. aeruginosa were present prior to antibiotic
therapy due to the existence of hypermutable bacteria (Oliver et al. 2004). Mutation rate
experiments have been used in S. pneumoniae to show that mutations in the gyrA gene occur
at a lower rate than parC mutations and that mutation in either gene predisposes to further
mutation (Gillespie et al, 2003). There is a pressing need to develop or adapt methods to
investigate mutation rate in Bcc.
118
Chapter 3: Estimation of mutation rate in topoisomerase genes of B. cepacia
3.2 Aims of Chapter
The aims of this chapter were to generate FQ resistant mutants, optimise a method to
estimate the mutation rate to fluoroquinolone resistance in B. cepacia and to characterise the
genetic basis of resistance. The presence of mutations conferring resistance to
fluoroquinolones was confirmed by MIC determination and sequence analysis of
topoisomerase genes. Resistant mutants were screened for reserpine inhibited
fluoroquinolone efflux to assess involvement of an efflux pump in observed resistance.
Reserpine is a plant alkaloid that inhibits active efflux and has been used in assays to
determine the contribution of efflux pumps to antibiotic resistance (Baranova & Neyfakh
1997; Beyer et al. 2000; Brenwald, Gill, & Wise 1997; Markham 1999).
3.3 Materials and Methods
3.3.1 Bacterial Strain
All optimisation experiments were performed using B. cepacia NCTC 10661 which was
obtained from the National Collection of Type Cultures, Centre for Infections, HPA,
Colindale, UK. This isolate had a ciprofloxacin MIC of 1.0 mg/L. The bacteria were stored
at -70°C in a tube containing storage media and beads (Prolab, Preston, UK). The inoculum
for each mutation rate experiment was prepared by inoculation of one bead onto Columbia
Blood Agar (Oxoid, Basingstoke, UK), which was spread and incubated at 37°C for 18
hours.
119
Chapter 3: Estimation of mutation rate in topoisomerase genes of B. cepacia
3.3.2 Choice of Selective Antibiotic
Ciprofloxacin was chosen as the selective antibiotic as fluoroquinolone resistance mainly
occurs due to point mutations in the subunit A of gyrase in Gram-negative bacteria and
because the type strain used was sensitive to this drug.
3.3.3 MIC Determination
The MIC of B. cepacia 10661 was determined by E-test (2.6.1) and by the agar dilution
method, according to the CLSI guidelines for susceptibility testing of aerobic organisms
(section 2.6.2).
3.3.4 Sequence Analysis of the QRDR of Fluoroquinolone Resistant Mutants
DNA was extracted from wild type and fluoroquinolone resistant mutants using either a
crude extraction method (section 2.7.1) or the Promega Extraction Kit (section 2.7.2).
Mutants were characterised by sequence analysis of the QRDRs of gyrA, gyrB, parC and
parE. Primers were designed using the sequenced genome of Burkholderia cenocepacia AU
1054 chromosome 1 (accession number CP000378) (Markowitz et al. 2006) and the primer
design programme, Primer3, (Rozen & Skaletsky 2000) to amplify gyrA, gyrB, parC and
parE and nucleotide sequences of the primers are shown in Table 3.1. In E. coli the QRDR
comprises codons 67-106 of gyrA, therefore the primers were designed to amplify codons
38-122 (Yoshida et al. 1990a). Mutations conferring resistance in E. coli, within gyrB are
commonly found at codon positions 426 and 447 (Yoshida et al. 1990b; Yoshida et al.
1991). Therefore primers were designed to amplify codons 400-500. PCR reaction
120
Chapter 3: Estimation of mutation rate in topoisomerase genes of B. cepacia
composition, cycling conditions and amount of DNA added to reactions were optimised
(data not shown). PCR and sequencing of topoisomerase genes were performed (section 2.8)
Gene Primer Position Sequence (5’-3*) Amplicon Size (b.p.)(B. cenocepacia numbering)
gyrA 62-81493-511
5’ ATCTCGATTACGCGATGAGC 5’ GCCGTTGATCAGCAGGTT
449
gyrB 1127-11461502-1520
5’ GAGGAAGTTGTGGCGAAGG 5’ AGTCTTCCTTGCCGATGC
400
parC 98-118295-315
5’ ATTGGTCAGGGTCGTGAAGA 5' GTAGCGCAGCGAGAAATCCT
229
parE 1178-11981557-1577
5' CAGGGCAAGGTAGTCGAAAA 5’ GTGAGCAGCAAGGTCTGGAT
380
Table 3.1. Primers used to amplify the Quinolone Resistance Determining Region (QRDR)
of gyrA, gyrB, parC and parE o f B. cepacia.
3.3.5 Detection of Efflux
The ciprofloxacin MIC of the fluoroquinolone resistant mutants was determined in the
absence and presence of reserpine in Muller Hinton agar, (section 2.6.4) (Beyer et al. 2000).
3.4 Results
3.4.1 Development of Methodology
3.4.1.1 Inoculum
3.4.1.1.1 Cell Number
The assumptions of all mutation rate estimations require that in each parallel culture the
final cell number (Nt) should be the same and that the number of cells at time zero (No)
should always be negligible compared to Nt (section 1.2.6) and so an inoculum size of 10
121
Chapter 3: Estimation of mutation rate in topoisomerase genes of B. cepacia
cells was used initially in this study. The number of colony forming units per mL was
determined using the Miles and Misra plate count technique (section 2.5) (Miles & MisraA ' ̂ y
1938). The 10 dilution was found to contain 10 CFU per 100 pL and this was therefore
used as the initial inoculum. An inoculum of 102 cells was added to 1 mL aliquots of Muller
Hinton Broth (Oxoid, Basingstoke, UK) and incubated for 18 hours using an orbital shaker
(37°C, 200 r.p.m,) (Barloworld Scientific, Staffordshire, UK). This resulted in a final
number of cells of approximately 1-2 x 10⁸ CFU/mL. Using 108 cells as the final cell
number the proportion of cultures with mutations was below the level for the po to be
considered valid i.e. the proportion of cultures without mutants was above the valid range of
0.1 and 0.7. In five experiments, using this inoculum, the average number of plates with
ciprofloxacin resistant mutants was zero or one. The initial inoculum was subsequently
changed to an inoculum of 10 cells. This was achieved by the addition of 100 pL of the 10'
dilution (of the original culture) to each mutation rate estimation culture aliquot. Upon
selection at 2 x and 4 x MIC all plates contained ciprofloxacin resistant colonies. However
no topoisomerase mutations (0/45 colonies sequenced) were found in colonies growing on
plates containing 2 x MIC. At 4 x MIC colonies from one plate only (2/55) contain
topoisomerase mutations (section 3.4.3). At 6 x MIC all colonies contained confirmed
mutations in gyrA (section 3.4.3). In conclusion the final inoculum used was 10 cells.
3.4.1.1.2 Growth phase
A second assumption requires that cells added to a mutation rate estimation experiment
should be in exponential phase. A growth curve experiment was performed to determine the
time period that the initial broth should be incubated before inoculation of the mutation rate
estimation to ensure cells were in exponential phase (figure 3.1). It was apparent that cells
122
Chapter 3: Estimation of mutation rate in topoisomerase genes of B. cepacia
will be in mid exponential phase at 2-3 hours, following incubation of a 5 mL Muller Hinton
broth (3 hour, 200 rpm), inoculated with a single colony.
10 n
o>
0.01
Time (hours)
Figure 3.1 Growth curve of B. cepacia
In order for inoculated cells to be in exponential phase the initial inoculum was incubated
for 2.5 hours to an OD600 of approximately 0.1 OD units (Pharmacia Biotech Ultraspec
2000).
3.4.1.1.3 Incubation Period
The final number of cells (Nt) was optimised so that the proportion of cultures with mutants
(plates with resistant colonies) was high enough for the po method to be valid. This involved
optimisation of the size of the initial inoculum and of the incubation conditions. Initially
aliquots were incubated for 18 hours. Subsequently this was changed to 22 hours, increasing
the final number of cells (Nt) and therefore increasing the proportion of cultures with
mutants. Following the increase in incubation time, the average final number of cells, in a
123
Chapter 3: Estimation of mutation rate in topoisomerase genes of B. cepacia
culture aliquot, increased from approximately 2 x 10⁸ CFU to approximately 6 x 10⁹ CFU.
In summary the incubation period was increased to 22 hours.
3.4.1.2 Selective Antibiotic Concentration
The selective antibiotic concentration is an important parameter because it influences the
numbers of observed resistant colonies and therefore will govern which method is most
appropriate. Ciprofloxacin stock solution was prepared as described in section 2.3.6.
Selective agar plates were used containing 2 x and 4 x the MIC of ciprofloxacin. The
nucleotide sequences of the topoisomerase QRDR regions were determined (section 3.3.4).
Following selection at 4 x MIC only one plate contained colonies. These colonies were
confirmed as having a gyrase mutation in the QRDR, an Asp87Asn mutation. At 4 x MIC
53/55 colonies did not contain QRDR mutations. No colonies (0/45) selected at 2 x MIC
contained mutations within the QRDRs of gyrA, gyrB, parC and parE. The observed
increase in resistance of these colonies was due to increased FQ efflux (see section 3.4.5).
The MIC of each mutant was determined. The Asp87Asn gyrase mutant, selected at 4 x
MIC, has an MIC of 12 mg/L compared to approximately 5 mg/L for the bacterial colonies
not containing mutations in topoisomerase genes. The mutation rate calculated using a low
concentration of selective antibiotic (2 x - 4 x MIC) is not a measure of the rate of
mutations that occur in topoisomerase genes only because other mechanisms may be
contributing to the observed resistance. To address this, the selective antibiotic
concentration was increased to 6 x and 8 x MIC. As the majority of plates did not exhibit
resistant colonies upon selection 6 x and 8 x MIC then the po method was the most
appropriate method. To be valid the po method requires that >25 % of plates must contain
resistant colonies, at 6 x MIC this criteria was met (42 % of plates contained colonies) and
124
Chapter 3: Estimation of mutation rate in topoisomerase genes of B. cepacia
therefore this method was used to determine the mutation rate. Upon selection at 8 x MIC
1/25 plates contained resistant colonies, 5/5 colonies sequenced contained a Thr83Ile
mutation. All of the 50 mutants selected at 6 x MIC and sequenced contained the same
Thr83Ile mutation.
The final estimate is a mean of four replicate mutation rate experiments. Each replicate was
performed from different initial broth inoculums. The isolated mutant colonies were stored
at -70°C (section 2.1) for measurement of fitness costs associated with topoisomerase
mutations (chapter 5).
To ensure that colonies growing would be as a result of mutations that occurred prior to
plating, plates were incubated for 24 hours at 37°C. A longer incubation may allow the
occurrence of post plating mutation which would confound the calculation of the true
mutation rate.
In conclusion resistant mutants were selected on 6 x MIC of ciprofloxacin.
3.4.1.3 Choice of mutation rate calculation method
3.4.1.3.1 Lea and Coulsons Method of the Median
Upon selection at 2 x and 4 x MIC each plate contained between 30 and 400 colonies.
These colonies varied in size and colour. Confirmation as B. cepacia was performed on 24
representative colonies (2 colonies from each of 12 plates) by Gram stain and API 20 NE,
using the manufacturer’s instructions. This excluded the possibility of contaminants that
could have been mistaken as B. cepacia colonies. At 24 hours it was difficult to distinguish
and count colonies by eye and so colonies were counted at 48 hours. A median method was
125
Chapter 3: Estimation of mutation rate in topoisomerase genes of B. cepacia
used to estimate the mutation rate (Lea & Coulson 1949) because all plates contained
mutants, see section 2.6.3 for method. From each plate at least 2 colonies were picked, sub
cultured and stored at -70°C (section 2.1). The QRDR sequence of gyrA, gyrB, parC and
parE was sequenced for the mutant colonies to confirm their identity as topoisomerase
mutants. However at 2 x and 4 x MIC the majority of resistant mutants did not contain
topoisomerase mutations (section 3.4.3). Estimated mutation rates using the method of the
median, from three rounds of selection at 4 x MIC, are shown in table 3.2. At 2 x MIC there
were too many colonies to enumerate and data is not shown. Selection at 6 x MIC using the
p 0 method was therefore used. The Method of the Median could not be used at 6 x MIC
because approximately half of the plates did not contain mutants.
Replicate Estimated Mutation rate (mutations/division)
1 2 x 10'82 6.1 x l6_/3 5.9 x 10''
Median 6.1 x 10'7
Table 3.2 Estimated mutation rates in B. cepacia using the method of the median. Each
replicate consisted of 25 culture aliquots. Mutation rate was estimated by the Method of the
Median at 4 x MIC.
3.4.1.3.2 p 0 method
For the purpose of these experiments the method used to estimate the mutation rate is the po
method (section 1.2.5.1). Estimated mutation rates were the median value of four replicate
experiments (see section 3.4.1.4 for optimised method).
126
Chapter 3: Estimation of mutation rate in topoisomerase genes of B. cepacia
3.4.1.4 Optimised Method for Determination of Mutation Rate using the po method
Isolates were removed from the -70°C freezer and one bead was used to sub culture B.
cepacia onto a blood agar plate and was incubated aerobically at 37°C. One colony of B.
cepacia was suspended in 5 mL of Muller Hinton Broth in a 25 mL conical flask. This was
sealed with a cotton wool bung and incubated at 37°C on an orbital shaker (200 r.p.m.)
(Barloworld Scientific, Staffordshire, UK) for 2.5 hours until an optical density (OD460) of
approximately 0.1 OD units was reached. Serial dilutions of this broth culture were
performed in PBS (neat to 10'6). A 100 pL aliquot of the 10'3 dilution (containing
approximately 10 cells) was added to each of 28 bijoux tubes, containing Muller Hinton
Broth (3 mL). These cultures were incubated at 37°C, 200 r.p.m., 22 hours (Barloworld
Scientific, Staffordshire, UK). Muller Hinton Agar plates (Oxoid, Basingstoke, UK)
containing 6 x MIC of ciprofloxacin were prepared and inoculated the following day.
Antibiotic free agar plates were also prepared, (section 2.2.3). Before inoculation, plates
were allowed to dry at 37°C with the lid removed for 20 min. This ensured that drops were
absorbed by the agar. At the end of the incubation period, a Miles and Misra plate count was
performed on 3 randomly selected broths (Miles & Misra 1938), (section 2.5). Dilutions of
10'1 to 10‘6 were prepared. Twenty microlitres of the 10‘3, 10"4, 10‘5 and 10'6 dilutions were
spotted in triplicate onto duplicate drug free Muller Hinton agar plates. The contents of the
remaining bijoux tubes were transferred to 10 mL centrifuge tubes and centrifuged (MSE
centrifuge) at 4000 g. for 10 min. and the supernatant discarded. Using a fine tipped pastette
the deposit was resuspended in 300 mL PBS. The total volume was then inoculated onto
ciprofloxacin containing Muller Hinton plates, spread with a plastic spreader and allowed to
dry.
127
Chapter 3: Estimation of mutation rate in topoisomerase genes of B. cepacia
All plates were incubated (37°C, 24 hours) and colony forming units per mL were calculated
from the Miles and Misra drug free plates. The proportion of cultures with no mutants (no
growth on ciprofloxacin) was calculated (p0) using equation 9.
po = number of cultures with no mutants [Eq 9]total number of culture aliquots
The number of mutations per culture was calculated using equation 10
m = -\n(p0) [Eq. 10]
The mutation rate (ju) was calculated using equation 11
mM = ------------------------ [Eq . 11]
average cfu/mL
This was repeated 4 times to produce a median mutation rate
3.4.1.5 Selection of Second Step Mutants
Second step fluoroquinolone resistant mutants were selected by inoculating first step
mutants onto plates containing 2 x MIC of the mutants in a mutation rate experiment
(section 3.4.1.4). All mutants were stored as previously described (section 2.1).
3.4.2 Estimated Mutation Rate
Estimated mutation rates of B. cepacia to ciprofloxacin resistance at 6 x MIC were
determined by the po method (section 3.4.1.4) (Table 3.3). The mutation rate to
ciprofloxacin resistance by mutation in gyrA was estimated by selecting mutants on 6 mg/L
and was determined as 9.6 x 10'11.
128
Chapter 3: Estimation of mutation rate in topoisomerase genes of B. cepacia
Replicate Estimated Mutation rate (mutations/division)
1 7.4 x 10 "2 1.0 x 10'103 9.2 x 10'“4 1.0 x 10'“
Median 9.6 x 10'“
Table 3.3 Estimated mutation rates in B. cepacia using po method. Each replicate
consisted of 25 culture aliquots. Mutation rate was estimated by the po method at 6 x MIC.
3.4.3 Characterization of Ciproflox'acin Resistant Mutants
Ciprofloxacin resistant colonies were isolated using selection at 2 x, 4 x, 6 x and 8 x MIC
and characterised. During three independent rounds of selection at 2 x MIC 45 colonies
were isolated and characterised, at 4 x MIC 55 colonies were isolated and characterised and
during three rounds of selection at 6 x MIC 50 colonies were isolated and characterised. At
8 x MIC 5 colonies were isolated and characterised.
Mutants containing second step mutations were selected at twice the MIC of the single step
topoisomerase mutation. All FQ resistant mutants that were selected had an MIC of at least
five-fold higher than the susceptible parent. At 4 x MIC an Asp87Asn mutation, conferring
a 12 fold increase in MIC, was found in one mutant on one plate only. All other mutants
selected at this concentration contained no mutations in QRDRs of gyrA, gyrB, parC or
parE. These colonies had small increases in MIC (less than five-fold differences as
compared to the parent strain). At 4 x MIC only 2/53 colonies contained a Thr83Ile
mutation in gyrA. All mutants (50/50) selected at 6 x MIC contained the Thr83Ile mutation
in the QRDR of gyrA. All mutants selected (5/5) at 8 x MIC contained the Thr83Ile
129
Chapter 3: Estimation of mutation rate in topoisomerase genes of B. cepacia
mutation. No mutations in the QRDRs of gyrB, parC or parE were identified and no silent
mutations were observed. Mutations, MIC and selection step information is shown in Table
3.4. Mutation rates for second step mutations (F3 and F4) were higher than for the first step
mutations and are shown in table 3.4. A map of mutations observed is shown in figure 3.2.
QRDR Sequence
Mutant MIC (mg/L) Selection Step gyrA gyrB parC parE
Wildtype 1FI 12 1st Asp87Asn wt wt wtF2 64 1st Thr83Ile wt wt wtF3 >256 2nd Asp87Asn wt Ser80Leu wtF4 >256 2nd Thr83Ile wt Ser80Leu wt
Table 3.4 Mutations, MIC and selection step of fluoroquinolone resistant mutants. Strain
FI isolated on 4 mg/L ciprofloxacin (4 x MIC) using the wildtype as the starting point, F2
isolated on 6 mg/L (6 x MIC) using the wildtype as the starting point, F3 isolated on 24
mg/L ciprofloxacin using FI as the starting point, F4 isolated on 128 mg/L ciprofloxacin
using F2 as the starting point.
130
Chapter 3: Estimation of mutation rate in topoisomerase genes of B. cepacia
Wildtype
C iprofloxacin 2 X MIC Ciprofloxacin 4 X MIC Ciprofloxacin 6 X MIC
FirstSelection Step
2 mg/L I ^ 4 mg/L 6 mg/L ^
Efflux M utan t F1 Efflux Mutant F2
Second Selection Step 24 mg/L 128 mg/L
F3 F4
Figure 3.2 Relationship of B. cepacia mutants selected stepwise with ciprofloxacin.
Antibiotic concentration used in each selection step is shown
Isolate Median Mutation Rate per cell division (Range)
Wildtype 9.6 x 10'" (9.2 x 1 0 " - 1 x 1 0 10)
FI 6.8 x 10‘10 (9.2 x 10 '°-1 x 10'9)
F2 1.1 x 10⁻¹⁰ (1.1 x 10 " -1 x 10'9)
Table 3.5 Mutation rates of fluoroquinolone resistance. Median mutation rates, estimated by
the po method of first step mutations of wildtype to FQ resistance and second step mutations
from Asp87Asn (FI) and Thr83Ile (F2) to additional Ser80Leu mutation in parC, using
ciprofloxacin as the selective agent. Median mutation rates represent four po replicate
experiments.
131
Chapter 3: Estimation of mutation rate in topoisomerase genes of B. cepacia
3.4.4 Confirmation of QRDR mutation
The QRDRs of gyrA, gyrB, parC and parE were sequenced. The QRDR of 45 resistant
mutants selected at 2 x MIC were sequenced but no isolates selected at this concentration
contained a gyrA mutation. At 4 x MIC 2/55 colonies contained an Asp87Asn mutation. All
fluoroquinolone resistant mutants selected at 6 x (50) and 8 x (5) MIC contained a gyrA
mutation (Thr83Ile). Throughout the most commonly selected mutant was Thr83Ile, see
figure 3.3. The consensus nucleotide sequence of the quinolone resistance determining
region of gyrase A of the susceptible B. cepacia parent was determined. The translated
amino acid sequence from this consensus is shown in figure 3.4.
195190190
247247247
349349349
AATCGCCGCGTATCGTCGGTGACGTGATCGGTAAGTACCATCCTCACGGCG P a r e n t
ACAAGAATCGGCGCGTATCGTCGGTGACGTGATCGGTAAGTACCATCCTCACGGCG A s p 8 7 A s n
ACAAGAATCGGCGCGTATCGTCGGTGACGTGATCGGTAAGTACCATCCTCACGGCG T h r 8 3 I l e ********************************************************
AC ACC 3CGGTGTA'
AC ATC GCGGTGTA'
AC ACC 3CGGTGTA'
:gac a c g a t c g t g c g g a t g g c g c a a g a c t t c t c g c t g c g t t a c P a r e n t
;gac a c g a t c g t g c g g a t g g c g c a a g a c t t c t c g c t g c g t t a c A s p 8 7 A s n
:aac a c g a t c g t g c g g a t g g c g c a a g a c t t c t c g c t g c g t t a c T h r 8 3 I l eIf ★ 1 ' k ' k ' k i c ' k ' k ' k ' k ' k ' k ' k ' k ' k ' k ' k + r ' k ' k ' k ' k ' k ' k ' k ' k ' k ' k - k ' k ' k ' k ' k ' k ' k ' k i c i c ' k ' k ' k
ATGCTGATCGACGGGCAAGGCAACT-------------------------------------------------------------------P a r e n t
ATGCTGATCGACGGGCAAGGCAACTTCGGCTCGATCGACGGCGACAATGCCGCGGC A s p 8 7 A s n
ATGCTGATCGACGGGCAAGGCAACTTCGGCTCGATCGACGGCGACAATGCCGCGGC T h r 8 3 I l e
Figure 3.3 Alignment of susceptible parent and mutant gyrA nucleotide sequences.
Mutations shown in boxes (Thr83Ile) and (Asp87Asn).
132
Chapter 3: Estimation of mutation rate in topoisomerase genes of B. cepacia
C o d o n 66 SARIVGDVTGKYHPHGI JIVRMAQDFSLRYMLIDGQG P a r e n t
C odon 66 SARIVGDVT GKYHPHGI >
C odon 66 SARIVGDVIGKYHPHGI >TAVYN
IVRMAQDFSLRYMLIDGQG A sp87A sn
IVRMAQDFSLRYMLIDGQG T h r 8 3 l le
Figure 3.4 A comparison of the translated amino acid sequences of the QRDR of the
characterised B. cepacia gyrA mutant and susceptible parent.
Only one mutant (2/55) selected at 4 x MIC contained a mutation in DNA gyrase subunit A.
This mutant Asp87Asn had a corresponding MIC of 12 mg/L. All other colonies
characterised at this ciprofloxacin concentration had MIC levels of 4-5 mg/L and no
topoisomerase QRDR mutations were found by sequencing. The elevated MIC of these
mutants was attributed to alteration in efflux activity, because incorporation of reserpine
into the media reduced the MIC to wild type levels. Reserpine is an inhibitor of efflux and
therefore the MIC of isolates exhibiting increased resistance to FQs will decrease in the
presence of reserpine. However it is possible that topoisomerase mutations occurred outside
the QRDR of the topoisomerase genes. Upon selection at 6 and 8 x MIC a change at
position 83 from threonine to isoleucine was observed. The corresponding MIC for these
mutants was 64 mg/L. No mutations were found in gyrB, parC and parE in the single step
mutants. Second step mutants containing high level resistance additionally contained a
Ser80Leu mutation in parC , see figure 3.5.
133
Chapter 3: Estimation of mutation rate in topoisomerase genes of B. cepacia
165 GGATGCCGATTCCAAGCACAAGAAGTCGGCGCGGCACCGTCGGCGACGTGCTCGGCAAGTTCC P a r e n t :
165 GGATGCCGATTCCAAGCACAAGAAGTCGGCGCGGCACCGTCGGCGACGTGCTCGGCAAGTTCC S e r 8 0 L e U* * * * * * * * * * * * * * * * * * * * * * * * * * * * * * * * * * * * * * * * * * * * * * * * * * * * * * * * * * * * * * *
23 0 ACCCGCACGGCGAC TCG<5CCTGCTACGAGGCCATGGTGCTGATGGCGCAGCCGTTCTCTCCTA P a r e n t
23 0 ACCCGCACGGCGAC TTG'JCCTGCTACGAGGCCATGGTGCTGATGGCGCAGCCGTTCTCTCCTA S©r80LeU* * * * * * * * * * * * * * * * * * * * * * * * * * * * * * * * * * * * * * * * * * * * * * * * * * * * * * * * * * * * * *
29 5 t c g c t a t P a r e n t295 t c g Ser80L eu
* * * * * * *
Figure 3.5 Alignment of susceptible parent and mutant parC sequences. Mutation shown in
box (Ser80Leu).
1 1 8 0 GGCGCGCACGCGCGCCGGCCAGAAGGTCGAGAAGCGCAAGAGCTCGGGCGTCGCGGTGCTGCCCGGC P a r e n t
1 1 8 0 GGCGCGCACGCGCGCCGGCCAGAAGGTCGAGAAGCGCAAGAGCTCGGGCGTCGCGGTGCTGCCCGGC FI' k ' k ' k ' k ' k ' k ' k ' k ' k ' k ' k - k ' k ' k i t i c ' k ' k ' k ' k ' k i c ' k ' k ' k ' k - i r ' k - k ' k ' k ' k ' k ' k ' k ' k ' k ' k ' k ' k ' k - k ' k i r ' k ' k ' k ' k ' k - k ' k i c ' k ' k ' k ' k ' k - k ' k - k ' k j c ' k ' k ' k ' k ' k
12 5 0 AAGCTGACCGATTGCGAGACGGAAGATATCGCGCGCAACGAACTGTTCCTGGTCGAGGGCGACTCGG P a r e n t 12 5 0 AAGCTGACCGATTGCGAGACGGAAGATATCGCGCGCAACGAACTGTTCCTGGTCGAGGGCGACTCGG FI
1 3 0 0 CGGGCGGCTCCGCGAAGATGGGCCGCGACAAGGAATACCAGGCGATCCTGCCGCTGCGCGGCAAGGT P a r e n t 13 0 0 CGGGCGGCTCCGCGAAGATGGGCCGCGACAAGGAATACCAGGCGATCCTGCCGCTGCGCGGCAAGGT FI
13 5 0 GCTGAATACGTGGGAAACCGAGCGCGACCGCCTGTTCGCGAACAACGAGGTGCACGACATCTCGGTC P a r e n t
13 5 0 GCTGAATACGTGGGAAACGCGCGACCGCCTGTTCGCGAACAACGAGGTGCACGACATCTCGGTC FI
Figure 3.6 Alignment of susceptible parent and resistant mutants for gyrB sequences. No
mutations were found in the QRDR of gyrB. Presumptive QRDR (codon 426) shown in red.
134
Chapter 3: Estimation of mutation rate in topoisomerase genes of B. cepacia
1 2 1 0 GTCGGTCGAACGTGAATCGGCGGAAATCGCCTTCGAACAGCGGGATCAGCAGTTCGCTGC P a r e n t :
1 2 1 0 TCGAACGTGAATCGGCGGAAATCGCCTTCGAACAGCGGGATCAGCAGTTCGCTGC FI
1 2 7 0 CCGTTGCTTTCGTCGAGCAGGCGCTGTAGCCGCGCAGGCCGTCTTCATACTTCCACGTCT P a r e n t
1 2 7 0 CCGTTGCTTTCGTCGAGCAGGCGCTGTAGCCGCGCAGGCCGTCTTCATACTTCCACGTCT FI★ ★★★★★★★★★★★★★★★★★★★★★★★★★★★★★★★★★★★★★★★★★★★★★★★★★★★★★★★★★•it*
1 330 GGCGCTTGCCGGTCTTCTCGTTGACGAGCACGACCTCGACGCCCGGCAGCAGCACGGCCT P a r e n t
1 3 3 0 GGCGCTTGCCGGTCTTCTCGTTGACGAGCACGACCTCGACGCCCGGCAGCAGCACGGCCT FI
1 3 9 0 TCGAGCGCAGCAGGCGCTGCAGCTCGCCGAGCGGCAGGTTCGGCGAATCGAAGTACTTCG P a r e n t
1 3 9 0 TCGAGCGCAGCAGGCGCTGCAGCTCGCCGAGCGGCAGGTTCGGCGAATCGAAGTACTTCG FI
14 5 0 GATTCGGCCACACCTGCACGCGCGTGC—
14 5 0 GATTCGGCCACACCTGCACGCGCGTGCCG
P a r e n tFI
Figure 3.7 Alignment of susceptible parent and resistant mutants for parE sequences. No
mutations were found in parE. Presumptive QRDR (codon 425 and 445) shown in red.
3.4.5 Detection of Efflux Pumps
The MICs of all mutants, selected at 2 x MIC and the majority selected at 4 x MIC,
decreased five-fold in the presence of reserpine to the level of the wild type, shown in Table
3.6. Presence of reserpine did not affect the ciprofloxacin MIC of mutants containing
topoisomerase mutations. It is likely therefore that these mutants exhibit increased
expression of ciprofloxacin extruding efflux pumps.
135
Chapter 3: Estimation of mutation rate in topoisomerase genes of B. cepacia
QRDR genotypeIsolate gyrA parC MIC(mg/L) MIC+ Res<
WT wt wt 1 1
El wt wt 5 1E2 wt wt 5 1E3 wt wt 5 1E4 wt wt 5 1E5 wt wt 5 1
FI Asp87Asn wt 12 12F2 Thr83Ile wt 64 64F3 Asp87Asn Ser80Leu >256 >256F4 Thr83Ile Ser80Leu >256 >256
Table 3.6 MICs (mg/L) of ciprofloxacin in the presence and absence of reserpine (25 mg/L)
for representative FQ resistant mutants. E1-E5 were selected at 2 x and 4 x MIC and
contained no topoisomerase mutations.
3.5 Discussion
Most previous studies have measured mutation frequency as opposed to mutation rate
(Bjorkholm et al. 2001; Gustafsson et al. 2003; Henderson-Begg, Livermore, & Hall 2006).
This measure provides no information on when the mutation occurred or of the rate at which
mutants occur. Mutations that occur early in the culture, known as ‘Jackpot’ mutations,
produce large numbers of progeny and will cause large variance in results. Mutation rate
methods, as used here, are more reproducible and can be used to predict how rapidly
antibiotic resistance will develop.
136
Chapter 3: Estimation of mutation rate in topoisomerase genes of B. cepacia
Ideally mutation rates should be estimated using an antibiotic to which resistance arises via
a single amino acid substitution caused by a change in a single base pair. This allows
methods to be adapted between organisms. Antibiotics which are susceptible to point
mutations that occur in chromosomal genes include the fluoroquinolones, rifampicin,
pyrazinamide and isoniazid. Resistance to fluoroquinolones occurs mainly due to
chromosomal mutations in target genes. Therefore the mutation rate contributes to the
proportion of a bacterial population that are resistant to fluoroquinolones. It is unlikely that
a mutation will occur in a population if the size of the population is less than the inverse of
the mutation rate. As the population increases the probability of a resistance mutation
occurring that increases the MIC to the antibiotic in question also increases. The mutation
rate estimated here implies that a B. cepacia infection must involve at least 9.6 x 10 11 cells
for one cell to mutate to resistance.
Of the gyrA mutations that cause bacterial fluoroquinolone resistance in vitro those that
occur at codons 83 and 87 in gyrA occur most frequently (Bachoual et al. 2001; Dessus-
Babus et a l 1998; Mouneimne et al. 1999; Ruiz et al. 1998; Vila et al. 1995). These codons
encode the amino acids that form the DNA binding region of gyrase and therefore changes
here result in a reduced capacity for fluoroquinolones to form a complex with the DNA and
gyrase. Of the two amino acid changes observed one was at codon 83 and the other at 87. At
codon 83 the change was from a hydrophilic threonine residue to a hydrophobic isoleucine
residue. Mutation of codon 83 to a hydrophobic amino acid generally confers more
resistance than mutation at codon 87 (Drlica & Zhou 1997). This data shows substitution at
position 83 confers a greater level of resistance than substitution at position 87 and therefore
supports this interpretation. Most fluoroquinolone susceptible organisms have an aspartic
137
Chapter 3: Estimation of mutation rate in topoisomerase genes of B. cepacia
acid residue at codon 87. If the amino acid at this position is not negatively charged then
there will be increased resistance to fluoroquinolones. The change at codon 83 conferred a
64 fold change in MIC while alteration at codon 87 conferred a 12 fold increase in MIC.
The substitution Thr83Ile in gyrA was the mutation most commonly identified in the in vitro
mutants. Previous studies have also found this mutation to be the most common in clinical
isolates of P. aeruginosa (Akasaka et al. 2001; Mouneimne et al. 1999; Oh et al. 2003). A
common double mutation Thr83Ile and Asp87Asn, previously reported in E. coli and P.
aeruginosa (Akasaka et al. 2001; Oh et al. 2003; Saenz et al. 2003) was not detected in
these in vitro isolates. Changes at both of these codons have previously been described in
other Gram-negative bacteria but the Thr83Ile mutation has only been described in P.
aeruginosa (Drlica 2003).
When selection with lower concentrations of fluoroquinolone (2 x MIC) was used no
mutations were found in the QRDRs of gyrA , gyrB , parC and parE. It is possible that
mutations occurred outside the QRDR. However the MIC of these mutants was reduced to
levels comparable to that of the wildtype following incorporation of reserpine into the agar.
Therefore it is likely that the observed resistance is due to altered expression of an efflux
pump. Similar results have been obtained by Zhou et al who found that low concentrations
of fluoroquinolone selected non gyrase mutants in M. smegmatis (Zhou et al. 2000). These
isolates may contain other mutations that confer resistance to other antibiotics as these
mutants additionally exhibit decreased susceptibility to chloramphenicol and ampicillin
(Zhou et al. 2000). It has previously been reported that at low plating concentrations
colonies growing usually do not contain mutations in the QRDR of mycobacteria (Sindelar
et al. 2000). On exposure to higher drug concentrations mutants conferring low levels of
138
Chapter 3: Estimation of mutation rate in topoisomerase genes of B. cepacia
resistance are unable to grow. Mutations that interfere significantly with gyrase may cause
cell death and so will not contribute to the observed mutation rate.
At higher selection concentrations of ciprofloxacin (4, 6 and 8 x MIC) mutations in the
topoisomerase genes were found. Moderate level resistance (12-64 mg/L) was caused by
single mutations in gyrA that occurred during the initial selection step at 6 x MIC. High
level resistance (256 mg/L), achieved following second step selection, was associated with
double mutation in gyrA and parC.
Second step mutations were selected, using Asp87Asn and Thr83Ile as the respective
starting points, on high concentrations of ciprofloxacin. The second round of mutant
selection resulted in the occurrence of a mutation at codon 80 of parC, irrespective of the
starting point. This mutation has previously been implicated in conferring fluoroquinolone
resistance in clinical isolates of P. aeruginosa (Akasaka et al. 2001; Mouneimne et al. 1999;
Oh et al. 2003). This mutation has been also been described in P. aeruginosa resistant
isolates, selected in vitro (Kugelberg et al. 2005). O f the gyrA mutations that cause bacterial
fluoroquinolone resistance in vitro those that occur at codons 83 and 87 in gyrA occur most
frequently in other bacterial species (Bachoual et al. 2001; Dessus-Babus et al. 1998;
Mouneimne et al. 1999; Ruiz et al. 1998; Vila et al. 1995). There is evidence that single
mutations in gyrase or topoisomerase IV may predispose the genome to further mutation. As
described previously Gillespie et al investigated the mutation rates of S. pneumoniae using
ciprofloxacin and gemifloxacin as the selective agents. The mutation rate of second step
mutations in isolates already containing a gyrA or parC alteration was higher than the first
step mutation rates (Gillespie et al. 2003). In Bcc mutation rates of second step mutants are
higher than the mutation rate of the first step mutation confirming this original observation.
139
Chapter 3: Estimation of mutation rate in topoisomerase genes of B. cepacia
The rate of mutation occurring in B. cepacia topoisomerase genes estimated by the
experimental procedures described here is 9.6 x 10'11. This is a lower rate than those
estimates already published for related organisms but is of the same order of magnitude.
There are no reported mutation rates in B. cepacia. Published measurements of mutation
rate in other organisms are higher and range from of 10'6 to 10'8. Published estimates
include those in E. coli (Boe et al, 1994), S. pneumoniae (Gillespie et al, 2003), P.
aeruginosa (Oliver et al. 2000) and M. tuberculosis (Billington, McHugh & Gillespie,
1999).
Mutation frequencies are reported more commonly than mutation rates. Mutation
frequencies of single step spontaneous mutations resistant to FQs are low in comparison to
nalidixic acid, which are typically > 10'9 when selected at 8 x MIC. Mutation frequencies of
10 8Gram-negative bacteria selected at 4 x and 8 x MIC ranged from >10' to 5.3 x 10" for
temafloxacin, lomefloxacin and flerofloxacin (Chin et al. 1988; Chin, Novelli, & Neu
1988). Mutation frequency to tosufloxacin resistance at 8 x MIC for S. aureus, E. coli and P.
aeruginosa were < 10'10 (Espinoza et al. 1988). Phenotypic mutation frequency to
-8ciprofloxacin resistance in C. jejuni is approximately 1 x10 ' (Gootz & Martin 1991).
Mutation rate experiments (estimated using alteration in phenotype from susceptible to
resistance) have estimated a mutation rate of 1.1 x 1 O’9 using ciprofloxacin as the selective
antibiotic and 1.6 x 10'11 using gemifloxacin (Gillespie et al, 2003) for S. pneumoniae.
Similarly in M. tuberculosis the estimated mutation rate in rpoB, conferring rifampicin
resistance, was found to be 1 x 10'10 divisions per generation (Billington, McHugh, &
Gillespie 1999). However phenotypic increases in MIC can occur due to induction of efflux
140
Chapter 3: Estimation of mutation rate in topoisomerase genes of B. cepacia
pumps that reduce accumulation of antibiotic within the cell. These changes are not due to
point mutations in topoisomerase genes. Thus an estimated phenotypic mutation rate may
result from numerous genotypic changes in different genes and at different loci within these
genes. A mutation rate calculated including confirmed mutations in a single target gene
only, is likely to be lower than a phenotypic mutation rate. For example the mutation rate in
B. cepacia in gyrA, using the Lea and Coulson method of the median (Lea & Coulson 1949)
at 4 x MIC without genotypic confirmation gives an estimate of 2 x 10"8 compared to 9.6 x
10'11 as measured by the po on agar containing 6 x MIC with genotypic confirmation.
Genotypic mutation rate could not be determined at 4 x MIC because the number of cultures
in which a topoisomerase mutation occurred was very small. This may be due to the
presence of multiple target genes and non heritable changes. Both approaches are valid but
are essentially different measures. Previous measurements of mutation rates vary depending
on the selective antibiotic concentration and the fluoroquinolone agent tested.
Increase in efflux activity results in smaller elevations of MIC than mutations in
topoisomerase genes. If incorporation of reserpine into agar reduces the MIC of a drug then
it can be concluded that efflux pumps have a role in the observed increase in resistance. In
this thesis it is hypothesised that the low level increase in antibiotic resistance in mutants not
containing topoisomerase mutations is due to altered expression of efflux pumps. Bast et al
considered strains to contain active efflux if there was a four fold or greater decrease in MIC
to the drug in question in the presence of reserpine (Bast et al. 2000). The advantages of this
assay are that it is convenient and does not rely on measurement of fluorescence. However
reserpine is labile and should be used immediately once in solution (Brenwald, Gill, & Wise
1998). Neyfakh et al demonstrated that reserpine can be inactivated by incorporation into
agar (Neyfakh, Bidnenko, & Chen 1991). However Brenwald et al found no difference in
141
Chapter 3: Estimation of mutation rate in topoisomerase genes of B. cepacia
the effect of reserpine on MIC between MICs determined in broth or by agar incorporation
(Brenwald, Gill, & Wise 1998).
Exclusion of antibacterial agents from the cell by efflux pumps is a major cause of antibiotic
resistance in bacteria. In Gram- negative bacteria multi drug efflux pumps can extrude
antibiotics from multiple classes to cause multiple resistance (Nikaido 1996). Increase in
fluoroquinolone accumulation in a resistant strain that was promoted following addition of
energy inhibitor such as carbonyl cyanide m-chloro phenylhydrazone (CCCP) has been used
to identify efflux. However increase in accumulation following CCCP treatment can occur
in the absence of efflux mechanisms (Furet, Deshusses, & Pechere 1992). Therefore in order
to demonstrate efflux reduced accumulation of fluoroquinolone must occur in the resistant
cell compared to the susceptible cell.
The estimated mutation rate in topoisomerase genes in B. cepacia is low. This would mean
that large numbers of bacteria will be required for a mutation to resistance to occur during
infection. However this experimental protocol would tend to result in low estimates and
higher values would have been observed if a phenotypic mutation rate estimating method
was chosen instead. All of the available methods only give an estimate of mutation rate.
Each method relies on a set of pragmatic assumptions that are made in order to make
estimations possible and therefore each mutation rate is only an estimate and can not
represent exactly what is happening in vivo. Mutation rates in the same system estimated by
separate groups via different methods can give very different estimates. For example it was
noted that estimated mutation rates of purine analogue resistance in a Chinese Hamster V79
cell line by two groups differed by more than 1000 times (Chu & Mailing 1968; Harris
1971; Kendal & Frost 1988).
142
Chapter 3: Estimation of mutation rate in topoisomerase genes of B. cepacia
In conclusion a standardised protocol for estimation of mutation rate in B. cepacia has been
developed. The mutation rate in topoisomerase genes in the Bcc is low, although the
mutation rate to phenotypic resistance is higher and this most likely occurs due to
fluoroquinolone efflux from the cell. These studies provide important data that assist in the
understanding of resistance development in this important organism.
143
Chapter 4 Measurement of fitness using a biofilm assay
4.0 Introduction
4.1 Biofilms
4.1.1 Biofilms of B. cepacia
It is likely that the ability of bacteria of the Bcc complex to form biofilms limits
eradication by antimicrobial therapy and promotes long term persistence in the CF lung.
For example, in a study of 21 cystic fibrosis patients those patients that died were
colonised by biofilm forming isolates of Bcc bacteria (Cunha et al. 2004). The extent of
biofilm formation varies between genomovars of the Bcc. B. multivorans and B.
cenocepacia are capable of greater biofilm formation than B. cepacia, B. stabilis and B.
vietnamensis (Conway, Venu, & Speert 2002). However B. dolosa has since been
demonstrated to be comparable to B. cenocepacia and B. multivorans in biofilm formation
(Caraher et al. 2006).
B. cepacia has been shown to form biofilms in vitro and it is likely that this occurs in the
cystic fibrosis lung as has been demonstrated for P. aeruginosa (Mathee et al. 1999).
4.1.2 Multispecies Biofilms
Most biofilms in nature are undoubtedly composed of more than one species (Stoodley et
al. 2002). However single species biofilms are important clinically. Polymicrobial
biofilms tend to more stable and thicker than single species biofilms (Allison, McBain, &
Gilbert 2000). In the CF lung, P. aeruginosa colonisation of the cystic fibrosis lung
occurs before colonisation by B. cepacia (Govan & Deretic 1996; Koch & Hoiby 1993)
leading to the conclusion that Bcc bacteria are able to adhere to the P. aeruginosa biofilm.
144
Chapter 4 Measurement of fitness using a biofilm assay
P. aeruginosa colonisation occurs before Bcc colonisation. B. cepacia must therefore be
able to adhere to a P. aeruginosa biofilm. Dual species biofilms can develop following
continuous challenge irrespective of the species forming the primary biofilm. However P.
aeruginosa is always dominant and this may be due to the production of a substance that
is inhibitory to B. cepacia (Al Bakri, Gilbert, & Allison 2004). Communication between
these organisms has been documented; B. cepacia can detect and respond to acyl
homoserine lactones produced by P. aeruginosa. Addition of supernatant from stationary
phase P. aeruginosa culture fluid to B. cepacia culture increased siderophore, lipase and
protease production (McKenney, Brown, & Allison 1995). This communication is
unidirectional as P. aeruginosa cannot respond to the B. cepacia signals (Riedel et al.
2001). As many Gram-negative bacteria produce acyl homoserine lactones and inhabit
similar niches, it is likely that further interspecies communication occurs.
4.1.3 Biofilm Models
There are numerous systems that have been developed and used to model growth of
bacterial biofilms. These include growth on sorborod filters (Hodgson et al. 1995), the
constant depth film fermenter (Peters & Wimpenny 1987), microtitre plates (O'Toole &
Kolter 1998), flow cells and rotating disc bioreactors (Zelver et al. 1999). No single
model is ideal for all experimental scenarios as each has been designed for a specific
purpose. For bacteria that grow as biofilms during infection, a biofilm quantification
assay should be included as a measure of fitness. This is because the propensity to form
biofilms is likely to affect fitness. For use as a fitness assay, the model of biofilm growth
should be simple and reproducible with sufficient replicate biofilms to allow statistical
analysis. However, other criteria are important in selection of a model. It is desirable that
145
Chapter 4 Measurement of fitness using a biofilm assay
the biofilm is grown in as steady a state as possible. Depending on the question being
asked of the system, the conditions of the biofilm should mimic the environmental
conditions of the in vivo biofilm, therefore the ability to control the environment should
exist. Simplicity of operation is advantageous. Capacity to substitute the substrata and
vary the depth of the biofilm allows flexibility. Aseptic conditions are required with a
means of inoculating the biofilm without contamination. Other factors that should be
considered while selecting a model include incubation temperature, presence of
antibiotics, organism and cell numbers required, flow rate, sheer and presence of a
conditioning film.
4.1.4 Quantification of biofilm growth
Growth within a biofilm can be measured by sacrificing cells from the biofilm by
sonication and/or vortexing before determining viable cell numbers estimated by plate
counting, although using this method biofilm specific characteristics may be lost. No
difference in bacterial counts was observed between P. fluorescens and B. subtilis
biofilms disrupted by vortexing, sonication or shaking with beads (Lindsay & von Holy
1997). Biofilm growth can also be visualised in situ with fluorescent probes and reporter
genes (Geesey 2001) as well as using imaging software to estimate biofilm coverage of
the surface. Bioluminescence is particularly useful in vitro and in vivo as it allows
biofilms to be monitored in real time (Kadurugamuwa et al. 2003; Kadurugamuwa et al.
2003). Selected models used for quantifying biofilm formation, are shown in table 4.1.
146
Chapter 4 Measurement of fitness using a biofilm assay
Model Organisms Flow Substratum Method of
quantifying
biofilm
Reference
ConstantDepthFilmFermenter(CDFF)
B. cepacia,P. aeruginosa, oral bacteria
Continuous Variable Vortex plug, viable count. Can be observed directly by SEM and CLSM
(Hengtrakool, Pearson, & Wilson 2006; Hope & Wilson 2006; Peters & Wimpenny 1987; Pratten, Barnett & Wilson 1998)
CDCBiofilmReactor
Gram negative bacteria
Continuous Plasticconnectors
Sonicate, vortex, homogenise, viable count
(Murga, Miller, & Donlan 2001)
ModifiedRobbinsdevice
B.pseudomallei, P. aeruginosa
Batch Variable Viable count (Honraet & Nelis 2006; Mikuniya et al. 2005; Vorachit et al. 1993)
Calgarybiofilmdevice
P. aeruginosa, S. aureus,E. coli
Batch Plastic pegs Sonicate peg, viable count
(Ceri et al. 1999)
SorboradsFilter
S. aureus,P. aeruginosa
Continuous Filter paper Vortex, viable count (Hodgson et al. 1995)
Table 4.1 Models that have been used to quantify bacterial biofilm growth
4.1.5 Examples of biofilm models
4.1.5.1 Constant Depth Film Fermenter
A constant depth film fermenter (CDFF; University of Wales, Cardiff) was used to grow a
B. cepacia biofilm. A photograph of the apparatus is shown below (figure 4.1). The CDFF
was originally chosen for use as a fitness assay for a number of reasons. Firstly this model
allows the growth of many replicate biofilms (up to 75) that can be maintained in a semi
147
Chapter 4 Measurement of fitness using a biofilm assay
steady state, the environmental conditions can be controlled and the fermenter can be
incubated in an aerobic or anaerobic atmosphere. Media can be supplied at a constant rate,
effluent removed and inoculum can be added aseptically. The CDFF consists of an
autoclavable, enclosed, stainless steel turntable which rotates underneath
polytetrafluoroethylene (PFTE) scraper blades (figure 4.2) (Peters & Wimpenny 1987).
This action removes excess growth and media. This model has previously been used to
study mixed biofilms of B. cepacia and P. aeruginosa (Al Bakri, Gilbert, & Allison
2004), Candida albicans (Lamfon et al. 2003) and oral bacteria (Hengtrakool, Pearson, &
Wilson 2006; Hope & Wilson 2003; Hope & Wilson 2006; Pratten, Barnett & Wilson
1998).
Figure 4.1 Photograph of a Constant Depth Film Fermenter
Figure 4.2 Photograph of PFTE Scraper Blades
148
Chapter 4 Measurement of fitness using a biofilm assay
The turntable contains 15 holes that contain PFTE pans, which can be removed via a
sampling port. Each pan in turn contains 5 plugs (figure 4.3).
Figure 4.3 Photograph of Sample Pan
The depth of these plugs and therefore the depth of the biofilm can be set to a
predetermined level. Media enters the apparatus through a port in the stainless steel top
and is delivered via a peristaltic pump at a constant rate.
4.1.5.2 Sorborods Filter
The sorborods filter consist of a cylindrical paper sleeve encasing a concertina of
cellulose fibres. Single filters are inserted into lengths of PVC and sterilized by
autoclaving (Maira-Litran, Allison, & Gilbert 2000). Sorborods filters can be incubated
and media is supplied at a constant rate via a peristaltic pump. In order to enumerate cell
numbers, filters can be sacrificed and vortexed in saline and a plate count can be
performed. This system has been used to model mixed biofilms of B. cepacia and P.
aeruginosa (Al Bakri, Gilbert, & Allison 2004).
149
Chapter 4 Measurement of fitness using a biofilm assay
4.1.5.3 Drip Flow Reactors
This biofilm model consists of petri dishes containing stainless steel slides onto which
media drips onto at a constant rate (Huang et al. 1998).
4.1.5.4 Flow Cells
Flow cells are small continuous flow systems that allow direct observation of the intact
biofilm via a viewing port. Media may be recycled or may be ‘once flow’, meaning that
media enters the system, passes through the cell, and is then collected as waste. Flow cells
are often used for short term colonization studies because adhesion can be observed in
real time.
4.1.5.5 Crystal Violet Microtitre Plate Method
The crystal violet microtitre plate biofilm assay is a simple and rapid method which
quantifies biofilm formation indirectly via the extent of crystal violet binding to bacterial
peptidoglycan to the wells of a microtitre plate. Bacteria are grown in wells of a microtitre
plate that contain media. Wells are washed to remove planktonic cells and incubated with
crystal violet. Unbound crystal violet is removed by repeated washing with water. Bound
crystal violet is solubilised with ethanol and the resulting optical density determined.
O’Toole et al initially used the assay to assess the impact of growth conditions and as a
screen for mutants deficient in biofilm formation in P. fluorescens (O'Toole & Kolter
1998). Modifications of this assay have been used to study biofilm formation in a number
of bacteria including E. coli (Pratt & Kolter 1998), V. cholerae (Watnick & Kolter 1999),
S. aureus (Stepanovic et al. 2003) Listeria monocytogenes (Djordjevic, Wiedmann, &
150
Chapter 4 Measurement of fitness using a biofilm assay
McLandsborough 2002) and Streptococcus gordonii (Loo, Corliss, & Ganeshkumar
2000). This method has also been used to quantify biofilm growth in B. cepacia mutants
that are defective in biofilm formation and of a panel of Bcc strains of different
genomovars (Conway, Venu, & Speert 2002; Huber et al. 2001).
A novel assay, the BioFilm Ring Test, has been described that measures biofilm
formation based on the immobilization of magnetic beads embedded in the bacterial
aggregate. Biofilm formation has been measured in L. monocytogenes, E. coli,
Staphylococcus carnosus and S. xylosus (Chavant et al. 2007). This method gives faster
comparable results to the crystal violet assay and does not include any washing or staining
steps, which can lead to poor reproducibility.
4.1.6 Effect of Incubation Conditions
Incubation atmosphere may affect biofilm formation. For example, S. aureus forms less
biofilm in CO2 than in aerobic incubation (Stepanovic et al. 2003). Different
environmental conditions may stimulate different development pathways. O’Toole et al
demonstrated that in P. fluorescens there are multiple biofilm development pathways that
are regulated by nutrient status (O'Toole 2003).
4.2 Aims of chapter
Aims were to select and optimize a model of biofilm growth which could be used as a
fitness assay to measure fitness costs associated with topoisomerase mutations, selected in
vitro and characterized in chapter 3.
151
Chapter 4 Measurement of fitness using a biofilm assay
4.3 Materials and Methods
4.3.1 Constant Depth Film Fermenter
Biofilms were grown in a CDFF, (section 2.10.1.1.) Viable CFU counts were performed
at 4, 24, 48, 72 and 120 hours, (section 2.10.1.1.3.) Biofilms and visualized using
Confocal Scanning Laser Microscopy (CSLM), (section 2.10.1.1.4).
4.3.2 Crystal Violet Microtitre Plate Assay
Quantification of biofilm growth was facilitated by spectrophotometric measurement of
crystal violet binding using a previously published method (O'Toole & Kolter 1998) and
has previously been used to quantify biofilm growth in Bcc bacteria (Conway, Venu, &
Speert 2002), (section 2.9.1.2). Microtitre plates were incubated for 0, 1,4, 7, 24 and 48
hours in order to optimize incubation period, see figure 5.7. For each time point 8
replicate wells were used. Three replicate experiments were performed.
4.4 Results
4.4.1 Growth of B. cepacia biofilm
Viable CFU counts were used to construct a growth curve of the B. cepacia biofilm
(figure 4.4).
152
Chapter 4 Measurement of fitness using a biofilm assay
12
10 -
-a .
14 28 42 56 70 84
T im e (hours )
Figure 4.4 Growth curve of B. cepacia 10661. Mean colony forming units for four
replicate runs. Error bars show 1 standard deviation at each sample point.
4.4.2 Confocal laser scanning microscopy of the B. cepacia biofilm
Sample plugs were removed at 4, 24, 48, 72 and 120 hours. Confocal images
demonstrating development of the B. cepacia biofilm at 4 and 72 hours are shown below.
Images at other time points are not shown. A single slice of a completed 3D project was
saved as a TIFF file and these are shown below. These images show progression of the B.
cepacia biofilm. At 4 hours there is approximately 5% coverage and at 24 hours 25%
coverage. At 48 hours coverage was approximately 40%. However the biofilm was less
dispersed than at 24 hours. At 72 hours coverage was approximately 90% and 100% at
120 hours. At 72 and 120 hours water channels throughout the biofilm were visible.
153
Chapter 4 Measurement of fitness using a biofilm assay
Figure 4.5 Image of biofilm at 4 hours. Single slice of a 3D representation of the biofilm,
using ImageJ software. Viable cells appear green and non viable cells appear red.
WaterChannels
Figure 4.6 Image of biofilm at 72 hours
154
Chapter 4 Measurement of fitness using a biofilm assay
4.4.3 Effect of incubation period on biofilm formation
0 .2-1
0 .1-
0.00 1 2 4 7 24 48
Time (h)
Figure 4.7 Biofilm growth at 0, 1, 2, 4, 7, 24 and 48 hours measured using the crystal
violet microtitre plate method. Error bars represent SEM. Each experiment consisted of 8
replicare wells and the experiment was repeated three times.
4.5 Discussion
Although there is a limited understanding of biofilm biology, P. aeruginosa, P.
fluorescens, E. coli and V cholerae have been used extensively as models in biofilm
research. For other bacterial species, less is known.
Scanning confocal laser microscopy (SCLM) is well suited to the study of biofilms
(Shotton 1989) and has elucidated their three dimensional structure. The technique lacks
resolution compared to electron microscopy but has the advantage of being able to
155
Chapter 4 Measurement of fitness using a biofilm assay
visualise living, hydrated biofilms. Biofilms of B. cepacia, visualized by SCLM,
contained visible water channels between microcolonies (figure 4.6). These permeable
water channels have been compared to primitive circulatory circuits and allow of
exchange nutrients and toxic metabolites (Stoodley, Debeer & Lewandowski 1994).
Biofilm architecture is affected by flow conditions (Stoodley et al. 1999). P. aeruginosa
biofilms in turbulent flow form streamlined patches while in laminar flow monolayers
interspersed with small circular microcolonies are formed (Purevdorj, Costerton, &
Stoodley 2002).
Despite precautions taken, including ethanol flaming of the sampling port each time that a
sample was taken, use of a surgical mask to prevent contamination during sampling and
overnight inoculation through sterile tubing, contamination was a problem using the
CDFF. Together with laborious and time consuming nature of the CDFF it does not
appear to be suitable for use as a fitness assay in the context of these studies.
The crystal violet assay involves multiple washing steps resulting in loss of cells and
variability was observed between wells using this assay. A fixation step has not been
included in assays used to quantify biofilm formation in the Bcc (Conway, Venu, &
Speert 2002; Huber et al. 2001) and was not included here. However a fixation step has
been included in some crystal violet biofilm assays (Stepanovic et al. 2003) and this step
may increase reproducibility between assays. Reflectance assays have been developed to
measure biofilm formation, utilizing changes in optical reflectance. Various surfaces
(opaque or non opaque) can be used and biofilm samples can be fixed and stored before
taking a measurement (Broschat et al. 2005). The ability to form biofilms of 14 strains of
Enterococcus was assessed using both the crystal violet assay and the reflectance assay.
156
Chapter 4 Measurement of fitness using a biofilm assay
Similar results were obtained independently with both assays as the same isolates were
identified as the highest and lowest biofilm producers. However 2 isolates forming
abundant biofilms in the crystal violet assay, did not form biofilms in the reflectance
assay (Broschat et al. 2005).
Huber et al used the crystal violet assay to assess the ability of B. cepacia H i l l to form
biofilms containing cepl and cepR genes that had been inactivated by random transposon
mutagenesis (Huber et al. 2001). Biofilm formation was not affected by composition of
the media or incubation temperature (30°C or 37°C). Although biofilms grew on
polystyrene microtitre plates, B. cepacia cells could not form a biofilm on polypropylene.
The cepl and cepR mutants were defective in their ability to form AHLs and in biofilm
formation. Addition of AHLs to the media restored biofilm formation (Huber et al. 2001).
It is likely that the cep quorum sensing system has a role in biofilm formation in B.
cepacia.
In this study LB broth (0.5% casamino acids) was used with incubation at 30°C for 24
hours. Following longer incubation, the amount of biofilm detected decreased, see figure
4.7. It is likely that this is due to dispersal of the cells from the biofilm following a
reduction in available nutrients in the LB broth.
In this thesis the crystal violet binding assay was adopted as a biofilm model to measure
fitness. This method was chosen as it is simple, rapid and allows investigation of large
numbers of isolates.
157
Chapter 5 Fitness cost of fluoroquinolone resistance in B. cepacia
Chapter 5: Fitness cost of fluoroquinolone resistance in B. cepacia
5.0 Introduction
5.1 Determination of fitness
5.1.1 Choosing appropriate fitness models
The probability of resistance mutations occurring in target genes and any fitness deficit
associated with them are important as these factors affect the likelihood of resistance
developing and being maintained in the population. Growth rate is an accepted measure of
fitness to measure fitness deficits associated with antibiotic resistance (Billington, McHugh,
& Gillespie 1999; Gillespie, Voelker, & Dickens 2002). Laboratory growth conditions
usually involve growth in rich media and these conditions may vary dramatically from
natural growth conditions in the environment or human body. Growth in rich media provides
a selective advantage to fast growing strains and therefore faster growing strains may be
selected for in the laboratory. No single measure of fitness is sufficient to describe the
impact of resistance on the survival ability of bacterial strains. Hence, models have been
selected that represent growth and survival conditions for B. cepacia to increase the clinical
relevance (Conway, Venu, & Speert 2002; O'Toole & Kolter 1998; Sanchez et al. 2002).
Fitness models can be adapted for use in many bacterial species by changing growth
conditions.
P. aeruginosa is known to form biofilms within the human body, for example within the CF
lung (Govan & Deretic 1996; Singh et al. 2000) and it is likely that Bcc bacteria also grow as
biofilms in the CF lung. In these cases a biofilm model may be included when measuring
fitness in order to reflect growth and environmental survival conditions of the species of
interest. Similarly environmental survival e.g. resistance to drying or survival in water is
158
Chapter 5 Fitness cost of fluoroquinolone resistance in B. cepacia
relevant for nosocomial pathogens which can be transmitted via contaminated surfaces. Bcc
bacteria are introduced into the environment by cystic fibrosis patients during physiotherapy
and this may allow cross infection to occur (Ensor et al. 1996). The risk of transmission
remains unclear but the ability of bacteria to survive drying allows their maintenance on
environmental surfaces (Smith, Eng, & Padberg, Jr. 1996) and also the possibility of
transmission between hosts. Bcc bacteria can survive for extended periods in respiratory
droplets on surfaces at room temperature (Drabick et al. 1996). These bacteria have also been
identified in shower drains, soil (Nelson et al. 1991) and homes of CF patients (Butler et al.
1995).
5.1.2 Semi automated liquid culture system
Viable cell count estimation is subjective and dependent on enumeration of colonies that
grow under the growth conditions provided, introducing sampling error. In using an
automated system which is less time consuming and less prone to operator variation, it is
possible to perform replicate growth rate estimations for large numbers of strains.
In this study the Bactec 9240 continuous, blood culture system with standard aerobic medium
(Plus Aerobic/F) was used to determine growth rate. The Bactec 9000 (9240/9120/9050)
series of automated blood culture systems are used to rapidly detect viable microorganisms in
clinical specimens. Bactec Plus Aerobic vials, contain 25 mL of enriched soybean-caesin
digest broth, 0.05% sodium polyanetholesulfonate (SPS), resins, C 0 2, 0 2 and a sensor. This
sensor, within each vial, responds to changes in oxygen and carbon dioxide levels as a result
of bacterial metabolism. These changes are measured by an increase in the fluorescence of
159
Chapter 5 Fitness cost of fluoroquinolone resistance in B. cepacia
the sensor which is monitored every ten minutes. A positive fluorescence reading indicates
an increase in CO2 or decrease in oxygen and the presence of microorganisms in that vial.
5.2 Aims of chapter
B. cepacia was used as a model to assess the fitness costs of FQ resistance mutations as these
bacteria are highly resistant to many antibacterial agents, form biofilms within the lungs and,
due to the chronic nature of cystic fibrosis infection, are exposed to long term antibiotic
treatment. The fitness costs of single and double topoisomerase mutations, selected in vitro
and characterised in chapter 3 were assessed using fitness models relevant to transmission.
These included models of biofilm and planktonic growth and environmental survival. A
method using a semi-automated liquid based culture system to measure growth rates was
developed.
5.3 Materials and Methods
5.3.1 Culture Conditions
The strain used in these studies was B. cepacia 10661 (National Collection of Type Cultures,
HP A, Colindale, UK) and subsequent mutants of this strain. The ciprofloxacin MIC of this
strain was 1.0 mg/L as determined by E-test (see section 2.6.1). To ensure uniformity of
strains the isolate was stored at -70°C using Cryobank cryogenic beads (Pro-lab Diagnostics,
Neston, UK). For each fitness assay the culture was initiated by inoculating a bead, from a
stored culture, onto nutrient agar (Oxoid, Basingstoke, UK) then incubated at 37°C for 18
hours.
160
Chapter 5 Fitness cost of fluoroquinolone resistance in B. cepacia
5.3.2 MIC Determination
The MIC of parent and mutant strains were determined by ciprofloxacin E-test (AB Biodisk,
Solna, Sweden; section 2.6.1) and by the agar doubling dilution method, according to the
CLSI guidelines for susceptibility testing of aerobic bacteria (CLSI, 2006; section 2.6.2).
5.3.3 Selection of Resistant Mutants
Fluoroquinolone resistant mutants of B. cepacia, containing single and double mutations
were selected in vitro (see chapter 3). First step spontaneous ciprofloxacin resistant mutants
were selected at 2, 4, 6 and 8 x MIC, as described in chapter 3. Colonies were stored at
-70°C for subsequent study using Microbank beads (Prolab Diagnostics, Neston, UK).
5.3.4 Miles and Misra Viable Cell Count
The number of CFU in 20 pi drops of diluted broth culture was determined using the Miles
and Misra method, as described previously in section 2.5 (Miles & Misra 1938).
5.3.5 Fitness Assays
5.3.5.1 Biofilm Growth
Quantification of biofilm growth was achieved by spectrophotometric measurement of
crystal violet binding using a previously published method (O'Toole & Kolter 1998). This
method has been used to quantify biofilm growth in Bcc bacteria (Conway, Venu, & Speert
2002) and is described in detail in section 2.9.1.2.
161
Chapter 5 Fitness cost of fluoroquinolone resistance in B. cepacia
5.3.5.2 Planktonic Growth
The method of Youmans and Youmans was modified (Youmans & Youmans 1949) to
determine growth rate (as described previously in section 2.9.2).
5.3.5.3 Competition Assays
Fitness of the fluoroquinolone resistant mutants, containing single and double topoisomerase
mutations, was compared to the susceptible parent using a modification of a previously
published method (section 2.9.3) (Billington, McHugh, & Gillespie 1999; Gillespie, Voelker,
& Dickens 2002).
5.3.5.4 Environmental survival
The ability of the resistant mutants to survive in water and survive drying was compared to
the susceptible parent, described in sections 2.9.4 and 2.9.5
5.3.5.4.1 Statistical Analysis
The statistical significance of differences in survival in water and during drying between the
clinical isolates was assessed by one way ANOVA, using GraphPad software version 3.00
for Windows (GraphPad Software, California, USA). Differences in generation time were
assessed by Student’s t-test.
162
Chapter 5 Fitness cost of fluoroquinolone resistance in B. cepacia
5.4 Results
5.4.1 Fitness Assays
Using the modified Youmans and Youmans method, relative fitness of Asp87Asn (FI) and
Thr83Ile (F2) compared to the susceptible parent were 1.01 +/- 0.01 SEM and 1.01 +/- 0.152
SEM, respectively using paired competitive cultures. Differences in relative growth rates of
the single gyrA mutants found during paired competition assays were not significant, as
determined by Students t-test. Relative fitness of the double mutants F3 and F4 was 0.88 +/-
0.12 and 0.78 +/- 0.18 respectively. Double mutation in topoisomerase genes, therefore, did
incur a fitness deficit as measured by competitive growth culture.
Strain Generation Time (min) (+/- 95%
confidence interval)
Generation Time
P value (Students T
test)
Relative Fitness (+/-
S.E.M)
Relative fitness P value
(Students T test)
WT 38.0(37 .06-38 .94)FI Asp87Asn 37.0 (36.77 - 37.23) 0.331 1.01 +/-0.01 0.831F2 Thr83Ile 37.1 (36.90 - 37.3) 0.377 1.01 +/-0.152 0.868F3 Asp87Asn
Ser80Leu43.0 (41.85-44 .15) 0.004 0.88+/- 0.12 0.003
F4 Thr83Ile Ser80Leu
45.7 (44.2 - 47.2) 0.001 0.78+/- 0.18 0.002
Table 5.1 Generation times (+/- 95% confidence intervals) and relative fitness (+/- S.E.M) of
the susceptible parent and topoisomerase mutants FI and F2 are the single gyrA mutants,
Asp87Asn and Thr83Ile respectively. F3 contains Asp87Asn and the additional Ser80Leu
parC mutation. F4 contains Thr83Ile and Ser80Leu. Differences in growth rate between wild
type, FI and F2 are not significant, as determined by Students t test and therefore do not have
a measurable fitness cost. However F3 and F4 exhibit significantly slower growth.
163
Chapter 5 Fitness cost of fluoroquinolone resistance in B. cepacia
Mutation in gyrA andparC did not affect biofilm formation in B. cepacia, see figure 5.1.
The transmissibility of B. cepacia isolates could be affected by the ability to survive in water
and survive during drying. A decrease in viability over time was observed for the susceptible
parent and the fluoroquinolone resistant mutants but there were no statistically significant
differences between the mutants and the susceptible parent.
As shown in figure 5.2 and figure 5.3, no significant differences were found at any time point
in the ability of the gyrA and parC mutants to survive in water or survive drying, as
compared to the parent B. cepacia strain.
c3QO
0 .1-
0.0Parent F1 F2 F3 F4
Isolate
Figure 5.1 Effect o f topoisomerase mutations on ability of B. cepacia to form biofilms.
Mutation in gyrA and parC did not affect biofilm formation in B. cepacia. Error bars
represent SEM. Differences are not significant, determined by one way ANOVA using the
GraphPad Prism software.
164
Chapter 5 Fitness cost of fluoroquinolone resistance in B. cepacia
1.00E+09
_ 1.00E+08O 2f IO)o4 1.00E+07
Parent
F2F3F4
LL
1.00E+06
1.00E+05
Time (hours)
Figure 5.2 Effect of topoisomerase mutations on the survival of B. cepacia in water.
Sampled at 0, 1, 2, 5, 7, 8, 9 and 13 days. Survival of B. cepacia in water was not affected by
mutation in gyrase subunit A or topoisomerase IV. Error bars demonstrate SEM. Differences
in survival are not significant.
165
Chapter 5 Fitness cost of fluoroquinolone resistance in B. cepacia
1 .0 0 E + 0 8
1 .0 0 E + 0 7
1 .0 0 E + 0 6
1 .0 0 E + 0 5
1 .0 0 E + 0 4
1 .0 0 E + 0 3
1 .00E + 02
1.00E+01
1 .0 0 E + 0 0
0 1 2 3 4 5 6 7 8
T im e (h o u r s )
— Par e nt F1 F2
— F3 F4
]
Figure 5.3 Effect of topoisomerase mutations on the survival of B. cepacia on dry surfaces.
Survival of B. cepacia on dry surfaces was not affected by mutation in gyrase subunit A or
topoisomerase IV. Error bars demonstrate the standard error of the mean. Error bars are not
shown if obscured by the symbol. Differences in survival are not significant.
5.5 Discussion
No fitness cost was found in fluoroquinolone resistant mutants containing a single
topoisomerase mutation as measured by growth rate, biofilm growth and environmental
survival. A significant fitness cost was found in gyrA and parC double mutants, in growth
rate and competitive culture only. Fitness was not impaired in any other assay (Pope et al.
2007).
166
Chapter 5 Fitness cost of fluoroquinolone resistance in B. cepacia
The cost of mutations conferring fluoroquinolone resistance depends on the bacterial species,
the number of resistance gene mutations and the level of resistance conferred as reported in
E. coli (Bagel et al. 1999), S. pneumoniae, (Gillespie, Voelker, & Dickens 2002) S.
typhimurium (Giraud et al. 2003) and P. aeruginosa (Kugelberg et al. 2005). Single
topoisomerase mutations in S. pneumoniae incur no or low cost while double mutations in
gyrA and parC incur a significant cost of approximately 0.85 relative to the susceptible
parent (Gillespie, Voelker, & Dickens 2002). Topoisomerase mutations in S. typhimurium
(Giraud et al. 2003), conferring small increases in resistance, are also associated with either
no reduction in fitness or a small loss. In E. coli the cost varies between strains (Bagel et al.
1999). The fitness cost has been shown to vary between organisms and depends on the
resistance mutations present.
Common mutations in rpoB, conferring resistance to rifampicin in clinical isolates of M.
tuberculosis, incur a lower cost than mutations that occur more rarely (Billington, McHugh,
& and Gillespie 1999; Gagneux et al. 2006; Mariam et al. 2004). The most common rpoB
mutations, His481Asn and Ser529Leu, found in clinical isolates of S. aureus do not exhibit a
fitness cost (O'Neill et al. 2006). Moderate level fluoroquinolone resistance in P. aeruginosa,
conferred by single mutations in gyrA and gyrB, incurs a fitness cost depending on the
location and identity of the mutation in P. aeruginosa (Kugelberg et al. 2005).
Multiple mutations in topoisomerase genes, associated with high levels of resistance exhibit
reduced fitness in other organisms. High level fluoroquinolone resistant P. aeruginosa
mutants (>256 mg/L) containing double mutations in topoisomerase genes or other genes, all
demonstrate reduced fitness (relative fitness of approximately 0.5, compared to wildtype), as
measured by growth rate (Kugelberg et al. 2005). In E. coli double mutations in gyrA
167
Chapter 5 Fitness cost of fluoroquinolone resistance in B. cepacia
(Ser83Leu and Asp87Gly), had a decrease in fitness as measured by increase in generation
time of 33% (Bagel et al. 1999). These measurements of fitness cost are greater than the
fitness costs of gyrA and parC mutations in B. cepacia that have been measured in this study.
Triple mutations in topoisomerase genes are required for high level fluoroquinolone
resistance (256 mg/L) in S. typhi (Turner, Nair, & Wain 2006). The MIC of mutants
containing Ser83Phe/Tyr, Asp87Asn and Glu84Lys mutations was 32-64 mg/L. However
this is a lower level of resistance than conferred by the Asp87Asn Ser83Ile double mutation
in B. cepacia. Mutations in parC did not affect MIC without existing mutation in gyrA
(Turner, Nair, & Wain 2006). The fitness cost depends on the resistance conferring mutation,
the genetic background of the strain and the presence of compensatory mutations.
In vitro resistance to antibacterial agents, other than the fluoroquinolones, occurs via
stepwise accumulation of mutations in target genes. Chromosomal resistance to mupiricin in
S. aureus is attributed to mutations in isoleucyl tRNA synthetase, the most common
mutations being Val588Phe and Val631Phe (Hurdle, O'Neill, & Chopra 2004). In agreement
with the results reported in this thesis, first step mutations confer no measurable cost while
second step mutations confer a fitness cost in vitro and in vivo. Hurdle et al reported relative
growth rates of second step mutations range from 0.24-0.63 compared to wildtype. Fitness
was restored following compensatory mutation occurring during sub culture (Hurdle, O'Neill,
& Chopra 2004).
Expression of many genes is dependent on appropriate supercoiling (Steck et al. 1993). It has
been reported that the observed fitness cost of fluoroquinolone resistance mutations is
associated with alterations in supercoiling efficiency (Bagel et al. 1999). Growth rates of
resistant mutants may be reduced as positive coils may accumulate in front of the replication
168
Chapter 5 Fitness cost of fluoroquinolone resistance in B. cepacia
fork due to the decreased supercoiling activity of the altered DNA gyrase (Drlica & Zhou
1997). Compensatory mutations may occur that restore supercoiling activity of gyrase and
may restore growth rates to levels comparable to the susceptible parent. This has been
demonstrated in P. aeruginosa (Kugelberg et al. 2005). Alterations in supercoiling were
measured by separation of topoisomers on agarose gels containing chloroquine. Variations
exist in the electrophoretic mobilities depending on the extent of supercoiling (Bagel et al.
1999).
No cost resistance mutations have been reported in a number of organisms, conferring
resistance to various antimicrobial agents. These include; fluoroquinolone resistance in S.
pneumoniae (Gillespie, Voelker, & Dickens 2002), glycopeptide resistance in Enterococci
(Ramadhan & Hegedus 2005) and aminoglycoside and spectinomycin resistance in Borrelia
burgdorferi (Criswell et al. 2006).
However fitness assays lack sensitivity, failing to detect fitness costs of <1% (Andersson &
Levin 1999). Small but significant deficits may therefore not be detected. These ‘no cost’
mutations may vary in impact in different environments. It is possible that mutation in gyrA
did have an associated fitness deficit that could not be measured by these methods. For
example due to large values of error in the biofilm assay, only large fitness costs could be
detected. During the paired competition assays relative fitness was assessed after 10 hours.
Small differences in relative growth between two strains may have been detected if
successive cycles of pairwise competitive cultures were performed. It is unlikely that
compensatory mutations have occurred that ameliorate fitness costs as mutants were
immediately stored at -70°C following selection.
169
Chapter 5 Fitness cost of fluoroquinolone resistance in B. cepacia
Youmans and Youmans measured the difference in time to positivity of cultures of M.
tuberculosis inoculated with serial dilutions of a culture to calculate the growth constant k
and generation time (Youmans & Youmans 1949). A liquid based automated culture system
has been used in this thesis to determine growth rate and generation time, avoiding time
consuming and laborious standard growth curve techniques. This has proved to be a reliable,
reproducible and simple method for measurement of growth rate (Pope et al. 2007). It is
possible that differences in lag time result in a delayed time to positivity. Cells were therefore
added when they were in exponential phase to minimise the affect of differences in lag time.
Laurent et al have also used an automated liquid culture system (MS2 Research System,
Abbott Laboratories, Dallas, Tx, USA) and paired competitive cultures to determine growth
rate, as a measure o f fitness in MRSA. Epidemic MRSA clones that are susceptible to
gentamicin have been increasing in France and these clones have a fitness advantage over
MRSA clones that are gentamicin resistant (Laurent et al. 2001). The growth rate differences
provide an explanation for the predominance of nosocomial gentamicin susceptible MRSA
clones in France.
Growth rates determined in the laboratory using rich media may not correspond to growth
rates during infection. However it is reasonable to assume that if there is a measurable cost
for bacteria in rich media then there is likely to be a cost in vivo. Gustavson et al
demonstrated that fitness costs associated with antibiotic resistance in Staphylococcus
epidermidis were similar for in vitro growth rates and the ability to survive on the skin of
healthy human volunteers (Gustafsson, Cars, & Andersson 2003). Fitness measurements may
differ for the same bacterium when measured in different conditions (Remold & Lenski
2001) and may be affected in stressful environments (Kishony & Leibler 2003).
170
Chapter 5 Fitness cost of fluoroquinolone resistance in B. cepacia
Few studies have used human colonization or infection to measure fitness cost. Andersson et
al have assessed the fitness costs conferred by parC and fusR mutations, conferring
resistance to fluoroquinolones and fusidic acid respectively, in S. epidermidis using a human
competition model (Gustafsson, Cars, & Andersson 2003). Susceptible and resistant bacteria
were inoculated onto human skin and relative numbers monitored. No loss of fitness
associated with parC mutation was found. However fusA mutations resulted in a considerable
loss of fitness as compared to the susceptible isogenic strain during competition (Gustafsson,
Cars, & Andersson 2003).
In this chapter assays to measure fitness costs in the Bcc were optimised and used to
investigate the fitness cost of single and double topoisomerase mutations. No measurable
cost was associated with single mutations while double mutation occuring in gyrA and parC
conferred a fitness cost as measured by growth rate. These methods will be used to measure
the fitness of clinical Bcc isolates.
171
Chapter 6 Characterisation of Clinical isolates of Burkholderia cepacia complex
Chapter 6 Characterisation of clinical isolates of Burkholderia cepacia complex
6.0 Introduction
6.1 Hyper mutability
6.1.1 Hyper mutability of P, aeruginosa in Lungs of Cystic Fibrosis Patients
Oliver et al have described a correlation has been found that links high mutation rate with
increased antibiotic resistance in isolates of P. aeruginosa from lungs of CF patients (Oliver
et al. 2000). Strains exhibiting the mutator phenotype were found in the lungs of 37% of CF
patients and in these patients 43% of the total P. aeruginosa population were mutators. This
group have also shown that hypermutable strains of P. aeruginosa exist in the CF lung
before initiation o f antimicrobial therapy (Oliver et al. 2004). Resistant mutants can readily
occur in P. aeruginosa within the lungs o f CF patients before or during treatment. This
would imply that treatment of chronic infections of this type should include multiple
antimicrobials rather than a single agent. This environment is indeed unstable characterised
by changing host immune responses and varying antibiotic levels. Although conditions for
B. cepacia growing in the lungs of cystic fibrosis patients are likely to be similar to those for
P. aeruginosa, no evidence of hypermutable populations of B. cepacia has been reported to
date.
6.1.2 Detection of Hyper mutability by E-test
Associations have previously been demonstrated between high levels of antibiotic resistance
and hypermutability (Oliver et al. 2000). These hypermutable strains have defects in DNA
repair systems, most commonly in the mismatch repair system (Miller 1996), (section
172
Chapter 6 Characterisation of Clinical isolates of Burkholderia cepacia complex
1.3.13). Macia et al. used E-test and disc diffusion to detect hypermutable strains of P.
aeruginosa isolated from sputum of CF patients (Macia et a l 2004). It is assumed that
resistant mutant colonies which appear within the E-test inhibition ellipse are unlikely to
occur in bacterial populations which are non hypermutable. This also allows MIC
determination of both the susceptible and resistant subpopulations. Strains were defined as
hypermutable if resistant colonies were observed to three or more antibiotics of ceftazidime,
imipenem, meropenem, tobramycin and ciprofloxacin. Hypermutable strains were
associated with higher MICs (Macia et al. 2004). E-tests are expensive but have the
advantage of providing precise MICs, as compared to disc diffusion which do not.
Estimation of mutation rate and mutation frequency are time consuming and labour
intensive procedures and would not be possible to incorporate into diagnostic clinical
microbiology laboratories.
6.2 Aims of chapter
Hypermutability has been demonstrated in a number of pathogenic bacteria but has not been
described in B. cepacia. However hypermutability has been described in P. aeruginosa
isolated from the CF lung. As both organisms have a similar niche and lifestyle it is likely
that hypermutability occurs in Bcc bacteria. Clinical CF isolates of Bcc bacteria, were
collected in order to determine if mutator bacteria exist in these populations. The mutation
rate method, discussed in chapter 3, was modified because the clinical isolates were resistant
to ciprofloxacin and an alternative selective agent was required. A mutation rate estimation
method was therefore optimised using clinafloxacin as the selective agent as the Bcc isolates
were susceptible to this agent and this method was used to estimate the mutation rate in
these bacteria.
173
Chapter 6 Characterisation of Clinical isolates of Burkholderia cepacia complex
The fitness of these clinical isolates was determined as measured by growth rate, biofilm
formation, survival in water and survival to drying. Antimicrobial susceptibility of these
isolates was determined and the sequence of the gyrA QRDR determined to assess the role
of gyrA mutations in the development of FQ resistance.
6.3 Materials and Methods
6.3.1 Clinical Strains
Clinical strains of Bcc complex bacteria including isolates of B. multivorans (genomovar II)
and B. cenocepacia (genomovar III) were obtained from Dr. John Moore, Belfast City
Hospital. These bacteria were isolated from sputum samples from CF patients (see section
6.3.2 for recovery o f Bcc from sputum).
6.3.2 Isolation of Bcc from sputum
Sputum containing Bcc was diluted with Sputasol (Oxoid, Basingstoke, UK) and spread
onto B. cepacia selective agar (Mast Diagnostic, Bootle, UK) containing ticarcillin and
polymixin, to obtain single colonies. On this medium, B. cepacia grows as 1-2 mm colonies
and turns the medium pink within 48 hours. Plates were incubated aerobically (48 hours at
37°C). Isolates were confirmed as B. cepacia by Gram stain and API 20 NE as it is reliable
in identification of the Bcc (van Pelt et al. 1999). Isolates were previously identified as Bcc
and the species status determined at Belfast City Hospital. In brief expectorated sputum
(50:50 sputasol; sputum) was inoculated onto B. cepacia selective agar (Mast Diagnostic,
Bootle, UK). Bcc confirmed by API 20 NE and species status was previously determined by
recA sequence typing (Mahenthiralingam et al 2000).
174
Chapter 6 Characterisation of Clinical isolates of Burkholderia cepacia complex
Colonies were stored at -70°C on beads, as described previously (section 2.1).
6.3.3 MIC determination
MICs were determined using E-test, for the following antibiotics; amoxicillin-clavulanic
acid, ceftazidime, ciprofloxacin, colistin, gentamicin, meropenem, piperacillin-tazobactam,
temocillin, tetracycline, tigecycline and trimethoprim sulphamethoxazole, using the
manufacturer’s instructions (section 2.6.1). CLSI interpretive breakpoints for non
Enterobacteriacea were used if Burkholderia breakpoints were unavailable. Isolates were
recorded as resistant, intermediate or susceptible.
6.3.4 Sequence analysis of the QRDR of gyrA
The QRDR o f the subunit A of DNA gyrase was sequenced (section 2.7 and 2.8) using
primers described in Table 3.1.
6.3.5 Detection of Hypermutability
The presence of hypermutability was measured using mutation rate (section 6.3.6.3).
Alternatively, the presence of hypermutability was determined using the E-test method
(section 2.6.1) which identifies hypermutators by the presence of resistant colonies observed
within the inhibition ellipse to determine if resistant colonies are observed within the
inhibition ellipse. The antibiotics used were ceftazidime, meropenem, ciprofloxacin,
imipenem and gentamicin (Macia et al. 2004).
175
Chapter 6 Characterisation of Clinical isolates of Burkholderia cepacia complex
6.3.6 Assay development for determination of mutation rate of clinical Bcc isolates
6.3.6.1 Choice of selective antibiotic
The clinical Bcc isolates (BCH1-BCH8) exhibited variable susceptibility to ciprofloxacin.
Isolates BCH2, BCH3, BCH6, BCH7 and BCH8 (5/8) had ciprofloxacin MIC values of >32
mg/L (Figure 6.4). An alternative agent was therefore required in order to estimate mutation
rates from susceptibility to resistance in these isolates. The clinical Bcc isolates were tested
for susceptibility to clinafloxacin. Clinafloxacin was more active against the Bcc isolates
than ciprofloxacin (Table 6.4).
6.3.6.2 Selective Antibiotic Concentration
Using NCTC strain 10661 as the test isolate, at 4 x and 6 x MIC of clinafloxacin, no
resistant mutants grew irrespective of incubation conditions and final cell numbers. A 1 mL
culture, inoculated with 102 cells, that was spread onto plates containing 2 x MIC of
clinafloxacin, gave rise to single colonies that were visible at 48 hours of plate incubation.
When higher broth culture volumes were used a film of growth covered every antibiotic
plate. Between 3 and 90 colonies were present on each plate. Therefore the Lea and Coulson
method of the median was used to determine mutation rate (section 6.3.6.3). All mutants
selected at 2 x MIC had an MIC of 0.5 mg/L. This represents a 2 fold increase in MIC.
However mutants selected at 2 x MIC (25/25) did not contain mutations in gyrA. MIC was
reduced in the presence of reserpine. Therefore the observed increase in resistance is likely
to be due to an increase in efflux, as was the case with in vitro ciprofloxacin resistant
mutants selected at 2 x MIC.
176
Chapter 6 Characterisation of Clinical isolates of Burkholderia cepacia complex
6.3.6.3 Method for determination of mutation rate for the clinical Bcc isolates by the
method of the median using 2 x MIC clinafloxacin.
Isolates were removed from the -70°C freezer and one bead was used to sub culture Bcc
onto a blood agar plate and incubated aerobically at 37°C. One colony of Bcc was
suspended in 5 mL o f Muller Hinton Broth in a 25 mL conical flask. This was sealed with
a cotton wool bung and incubated at 37°C on a rotary shaker (200 r.p.m.) (Barloworld
Scientific, Staffordshire, UK) for 2.5 hours until an optical density (OD6oo) of
approximately 0.1 OD units was reached. Serial dilutions of this broth culture were
performed in PBS (neat to 10’6). A 100 pL aliquot of the 10'3 dilution (containing
approximately 103 cells) was added to each of 28 microcentrifuge tubes, containing Muller
Hinton Broth (1 mL). These cultures were incubated at 37°C, 200 r.p.m 18 hours
(Barloworld Scientific, Staffordshire, UK). Muller Hinton Agar plates (Oxoid,
Basingstoke, UK) containing 2 x MIC of clinafloxacin were prepared and inoculated the
following day. Antibiotic free agar plates were also prepared (section 2.2.3). Before
inoculation, plates were allowed to dry at 37°C with the lids removed for 20 min. This
ensured that drops were absorbed by the agar. At the end of the incubation period, a Miles
and Misra plate count was performed on 3 randomly selected broths, section 2.5 (Miles
1938). Dilutions of 10'1 to 10'6 were prepared. Twenty microlitres of the 10'3, 10“4, 10'5
and 1 O'6 dilutions were spotted in triplicate onto duplicate drug free Muller Hinton plates.
The microcentrifuge tubes were centrifuged at 4000 g , 3 min and the supernatant
discarded. Using a fine tipped pastette, the deposit was resuspended in residual broth
(approximately 40 pL). The total volume was then inoculated onto clinafloxacin
containing Muller Hinton plates, spread with a plastic spreader and allowed to dry. All
plates were incubated (37°C, 48 hours). Colony forming units per mL were calculated
from the Miles and Misra drug free plates. The number of colonies on each plate were
177
Chapter 6 Characterisation of Clinical isolates of Burkholderia cepacia complex
counted and recorded. The median number of colonies was determined. The number of
mutations per culture was calculated using equation 10:
r/m-\n(m) - 1.24 = 0 [Eq 10]
The mutation rate (ju) was calculated using equation 11:
m [Eq 11]H = -------------------
average cfu/mL
This was repeated 4 times to give a median mutation rate.
6.3.7 Fitness of Clinical Bcc Isolates
As previously, a comprehensive approach to measuring the fitness of clinical isolates was
adopted and biofilm formation (section 2.10.1.2), growth rate (section 2.10.2), survival in
water (section 2.10.4) and survival to desiccation (section 2.10.5), was determined for each
isolate.
6.3.8 Statistical Analysis
6.3.8.1 Calculation of t XA
Data was entered into GraphPad software version 3.00 for Windows (GraphPad Software,
California, USA) and statistical analysis was performed. The mean and standard error values
were calculated from the three experiments for each clinical isolate. The t lA (time at which
half of the cells will have died) was calculated using non-linear regression analysis with a
178
Chapter 6 Characterisation of Clinical isolates of Burkholderia cepacia complex
monophasic exponential decay curve. Exponential decay curves were calculated for each
clinical isolate.
The correlation coefficient (r ) was calculated as an estimate of goodness of fit using
GraphPad Prism by the following equation:
r2 = (sum of squares of the distance from the best fit curve)(sum of squares of distance from the mean Y value)
The Global comparison of fits was used to determine if the survival of the isolates to drying
were significantly different to each other. A two way ANOVA, followed by the Bonferroni
multiple comparison test, was performed in order to determine if survival in water between
isolates was different at time points.
179
Chapter 6 Characterisation of Clinical isolates of Burkholderia cepacia complex
6.4 Results
6.4.1 Antibiotic Susceptibility Testing
MIC mg/LAntibiotic BCH 1 B CH 2 BCH 3 BCH 4 B CH 5 BC H 6 BC H 7 B CH 8
Amoxicillin- clavulanic acid
>256 >256 >256 >256 >256 >256 >256 >256
Ceftazidime 3 6 4 1 1 64 24 12Ciprofloxacin 6 >32 >32 1.5 3 >32 >32 >32Colistin 128 >1024 >1024 >1024 192 >1024 >1024 >1024Gentamicin 24 96 96 16 32 >256 >256 >256Meropenem 2 4 12 2 0.75 >32 12 >32Piperacillin-Tazobactam
64 >256 3 16 16 >256 >256 >256
Temocillin 12 4 32 24 32 24 8 12Tetracycline >32 >32 >32 >32 >32 >32 >32 >32Tigecycline 6 8 24 128 32 24 8 6Trimethoprimsulfmethoxazole
>32 >32 >32 >32 >32 >32 >32 >32
Table 6.1 Antibiotic susceptibilities of clinical Bcc isolates. Isolates BCH 2, BCH 3, BCH 5,
BCH 6, BCH 7 and BCH 8 are isolates of B. cenocepacia. BCH 1 and BCH 4 are isolates of B.
multivorans. MICs to amoxicillin-clavulanic acid, ceftazidime, ciprofloxacin, colistin,
gentamicin, meropenem, piperacillin-tazobactam, temocillin, tetracycline, tigecycline and
trimethoprim sulfamethoxazole of clinical Bcc isolates, as determined by E-test according to
the manufacturer’s instructions.
180
Chapter 6 Characterisation of Clinical isolates of Burkholderia cepacia complex
6.4.2 Biofilm Growth
Isolate
Figure 6.1 Comparison of biofilm formation between clinical isolates. Mean OD units
obtained in the crystal violet assay are plotted to represent biofilm formation. Error bars
represent SEM.
181
Chapter 6 Characterisation of Clinical isolates of Burkholderia cepacia complex
6.4.3 Environmental Survival
6.4.3.1 Survival during drying
1.00B-09 1.00E+08 1
^ 1.00E+07 |
1.00E+06o— 1.00E+-05E 1.00EHJ4£ 1.00E+03O
1.00EHJ21.00EHJ11.00E+00
1
Figure 6.2 A comparison between the fitness of different Bcc isolates using survival during
drying as a measure. The survival curve is obtained by plotting the mean viable count
Sampled at 0, 1, 2, 3, 4, 5, 6 and 7 hours. Error bars represent the SEM. Error bars are not
shown if obscured by the symbol. No significant differences found by F test of survival
curves, using Graph Pad Prism.
To test the hypothesis that clinical isolates varied in their ability to survive drying, the tl/2
was calculated for each clinical isolate using non linear regression analysis. No significant
difference was found in the ability of the clinical isolates to survive drying (global p value
0.2394). Because the viable cell count of Bcc isolates in water did not decline significantly
after 3 days (figure 6.3) the tl/2 was not calculated for survival in water.
2 3 4 5 6
Time (h o u rs)
BCH 1
a BCH 2
- BCH 3
■ — BCH 4
-•— BCH 5
-a BCH 6~ k — BCH 7
- — BCH 8
182
Chapter 6 Characterisation of Clinical isolates of Burkholderia cepacia complex
6.4.3.2 Survival in water
1.00E+09
^ 1.00E+08U)
-i 1.00E+07
° 1.00E+06
1.00E+050 2 4 6 8 10 12 14
Time (days)
BCH 1
BCH 2
BCH 3
BCH 4
BCH 5
BCH 6
BCH 7
BCH 8
Figure 6.3 A comparison between the fitness of different Bcc isolates using survival in
water as a measure. The survival curve is obtained by plotting the mean viable count.
Survival in water of the clinical Bcc isolates. Sampled at 0, 1, 3, 5, 8 and 13 days. Error
bars demonstrates SEM. Error bars are not shown if obscured by the symbol. For the
survival in water data, there was a trend to declining CFU with time. However the
difference in CFU between isolates at time points was found to be not significant (p value
0.0714) by two way ANOVA, using GraphPad Prism.
183
Chapter 6 Characterisation of Clinical isolates of Burkholderia cepacia complex
6.4.4.1 Growth Rate
Isolate Generation Time (min +/- S.E.M)
Antibiotics to which resistant
BCH 1 54.8 +/- 0.61 5/10BCH 2 76.4 +/- 0.93 8/10BCH 3 83.1 +/- 0.48 8/10BCH 4 54.7 +/- 1.12 6/10BCH 5 54.6 +/- 0.63 5/10BCH 6 120.7+/- 1.13 10/10BCH 7 71.6 +/- 0.76 10/10BCH 8 85.07 +/-1.25 8/10
Table 6.2 Association between generation times of clinical Bcc isolates (min +/- S.E.M) and
antibiotic resistance. Shows proportion of antibiotics tested (amoxicillin-clavulanic acid,
ceftazidime, ciprofloxacin, colistin, gentamicin, meropenem, piperacillin-tazobactam,
temocillin, tetracycline, tigecycline and trimethoprim sulphamethoxazole) to which each
strain is resistant.
6.4.4 Hypermutability
6.4.5.1 E-test
No resistant colonies were visible within the E-test ellipse for any clinical Bcc isolate tested.
184
Chapter 6 Characterisation of Clinical isolates of Burkholderia cepacia complex
6.4.5.2 Mutation rate
Isolate Mutation rate (mutation per division)
Range
BCH 1 4 .9 x 1 O'5 3.4 x 1 O'8 - 5.5 x 10"8BCH 2 1.9 x 10'8 1.8 x 10’* - 7.0 x 10'8BCH 3 4.2 x 10'* 2.6 x 10'" - 6.9 x 10"8BCH 4 2.3 x 10'8 1.7 x 10 2.6 x 10""BCH 5 2.2 x KT8 2.2 x 10'8- 8.2 x 10"8BCH 6 5.0 x 10'* 2.3 x 10'8 - 5.8 x lO'"BCH 7 3.8 x 10'" 2.7 x 10'5 - 4.2 x 10""BCH 8 2.6 x 10'" 1.1 x 10"*-2.7x10'"
Table 6 3 Median mutation rates of Bcc isolates of three independent experiments.
Determined by Lea and Coulsons method of the median (Lea & Coulson, 1949) using
clinafloxacin as the selective antibiotic at 2 x MIC (section 2.3.6).
6.4.5 Sequence Analysis of the QRDR of gyrA
C o d o n 5 4 C o d o n 5 4 C o d o n 5 4 C o d o n 5 4 C o d o n 5 4 C o d o n 5 4 C o d o n 5 4 C o d o n 5 4
C o d o n 1 1 4 C o d o n 1 1 4 C o d o n 1 1 4 C o d o n 1 1 4 C o d o n 1 1 4 C o d o n 1 1 4 C o d o n 1 1 4 C o d o n 1 1 4
K LN N D W N R A Y K K SA R IV G D V IG K Y H P H G 3T A V Y D T ] K L N N D W N R A Y K K SA R IV G D V IG K Y H PH G 3A A V Y G T]K L N N D W N R A Y K K SA R IV G D V IG K Y H PH G 3 S A V Y D T ]V R M A Q D F S L R Y M L ID G Q G N F G S ID K LN N D W N R A Y K K SA R IV G D V IG K Y H PH G 3 S A V Y D T ]V R M A Q D F S L R Y M L ID G Q G N F G S ID-------------- N R A Y K K S A R IV G D V IG K Y H P H G 3SA V Y D T]K L N N D W N R A Y K K SA R IV G D V IG K Y H PH G 5T A V Y G T ]V R M A Q D F S L R Y M L ID G Q G N F G S ID-------------- N R A Y K K S A R IV G D V IG K Y H P H G 3T A V Y D T ]V R M A Q D F S L R Y M L ID G Q G N F G S IDK LN N D W N R A Y K K SA R IV G D V IG K Y H PH G 3T A V Y D T ]
k ★ ★ ★ ★ i
V R M A Q D F S L R Y M L ID G Q G N F G S ID V R M A Q D F S L R Y M L ID G Q G N F G S ID
V R M A Q D F S L R Y M L ID G Q G N F G S ID
G D N A A A M R Y T E IR M A K IG H E L L A D ID -----------------------------G D N A A A M R Y T E IR M A K IG H E L L A D ID -----------------------------G D N A A A M R Y T E IR M A K IG H E L L A D ID K E T ----------------------G D N A A A M R Y T E IR M A K IG H E L L A D ID -----------------------------G D N A A A M R Y T E IR M A K IG H E L L A D ID -----------------------------G D N A A A M R Y T E IR M A K IG H E L L A D ID K E T V D FE PN Y D GG D N A A A M R Y T E IR M A K IG H E L L A D ID -----------------------------G D N A A A M R Y T E IR M A K IG H E L L A D ID K E T V D FE PN Y D G
BCHBCHBCHBCHBCHBCHBCHBCH 8
Figure 6.4 Amino acid sequences of QRDRs of gyrA of clinical isolates. Polymorphisms
found at codon 83 (shown in red) and 87 (shown in blue). At codon 83 a serine residue
would be expected in a susceptible isolate. Isolates BCH 4 and BCH 5 contain a serine
residue at codon 83. Isolate BCH 2 contains a mutation to alanine residue at codon 83, while
BCH 1, BCH 3, BCH 6, BCH 7, and BCH 8 contain mutations to threonine. At codon 87 an
185
Chapter 6 Characterisation of Clinical isolates of Burkholderia cepacia complex
BCH 4, BCH 5, BCH 7 and BCH 8 contain an aspartic acid at this position while BCH 2
and BCH 6 contain a glycine mutation. No synonymous mutations were found.
Isolate Ciprofloxacin MIC (mg/L)
ClinafloxacinMIC(mg/L)
BCH 1 6 2BCH 2 128 16BCH 3 64 8BCH 4 1.5 1BCH 5 3 8BCH 6 32 8BCH 7 256 16BCH 8 32 2
Table 6.4 Comparison of ciprofloxacin and clinafloxacin MIC of clinical Bcc isolates
Ciprofloxacin and ciprofloxacin solutions were prepared (sections 2.3.6 and 2.3.7).
MICs were determined in duplicate using the agar incorporation method (section 2.6.2)
according to the CLSI guidelines (CLSI, 2006).
6.5 Discussion
To characterise the pattern of resistance and the potential for resistance to be fixed in the
bacterial population a series of clinical isolates were compared for mutation rate, antibiotic
susceptibility and fitness as measured by planktonic growth rate, biofilm growth rate and
environmental survival.
Isolates did exhibit variation in growth rate. Growth rates of the different isolates were
statistically significant, as measured by a modified Youmans and Youmans method (Table
6.2). There appeared to be an intriguing association between generation time and the relative
resistance of each isolate (Table 6.2). However isolate numbers were not large enough to
determine if there was a relationship between extent of antibiotic resistance and growth rate.
186
Chapter 6 Characterisation of Clinical isolates of Burkholderia cepacia complex
Isolate BCH 6, a B. cenocepacia strain, has the longest generation time (120.7 min. +/- 1.13)
and is also the most resistant of the eight strains studied and is resistant to all antibiotics
tested. Isolates BCH 1, BCH 4 and BCH 5 have the shortest generation times 54.8 min. +/-
0.63, 54.7 +/- 0.61 and 54.6 min. +/- 1.12 respectively but these are also the most
susceptible strains. Caraher et al demonstrated differences in growth rate and that generation
times in B. cepacia, B. multivorans, B. cenocepacia, B. stabilis, B. vietnamensis and B.
dolosa ranged from 70 - 186 min. (Caraher et a l 2006) and that there was no association
between generation time and genomovar status. However this study did not examine the
association between antimicrobial susceptibility and growth rate. This thesis lends support
to the idea that multidrug resistance does incur fitness costs in the Bcc. The mechanisms of
this resistance were not investigated in this thesis.
No significant differences in biofilm formation were found between the majority of the Bcc
isolates, as measured by the crystal violet assay (Figure 6.1). However isolate BCH 1
produced extensive biofilm in the crystal violet assay, compared to the other Bcc isolates.
The reasons for the propensity of this isolate for forming biofilms are unclear. Conway et al
also demonstrated differences in ability to form biofilms between isolates of the Bcc and
found that there was no correlation between the ability to form biofilms and growth rate.
However the correlation between biofilm formation, growth rate and virulence was not
explored (Conway, Venu, & Speert 2002). However recA type A organisms formed more
biofilms than type B organisms (Conway, Venu, & Speert 2002).
However in this study, no significant difference was found in environmental survival, as
measured by survival during drying and survival in water, between the clinical Bcc isolates.
Drabick et al demonstrated Bcc strain to strain differences in survival on environmental
187
Chapter 6 Characterisation of Clinical isolates of Burkholderia cepacia complex
surfaces and differences in survival on different surfaces with the greatest survival occurring
on PVC (Drabick et al. 1996). Isolates survived longer if suspended in sputum (Drabick et
a l 1996).
Zhou et al reported the in vitro activity of antimicrobial agents that were tested in synergy,
using checkerboard testing. The most active antibiotics were minocycline, meropenem and
ceftazidime, inhibiting 38%, 26%, 23% of strains respectively, while 18% were resistant to
all agents tested (Zhou et al. 2007). Aaron et al performed in vitro synergy studies for the
Bcc using multiple combination bactericidal tests (MCBT). This measures the activity of
peak serum concentrations of antibiotics (Aaron et al. 2000). Meropenem combined with
minocycline, amikacin or ceftazidime was bactericidal against 76%, 73% and 73% of
isolates, respectively. Triple antibiotic combinations such as tobramycin, meropenem and
other agents exhibited bactericidal activity against 81-93% of isolates (Aaron et al. 2002). In
this study all isolates were resistant to colistin. This is unsurprising as colistin is
incorporated into B. cepacia selective media to isolate Bcc. Additionally all isolates were
resistant to trimethoprim-sulfamethoxazole, tetracycline and gentamicin. Variable
susceptibility was found for tigecycline, piperacillin-tazobactam, and temocillin. The most
active antibiotics against Bcc are meropenem, ciprofloxacin and ceftazidime.
The nucleotide sequences of the gyrA QRDRs of the isolates were determined (Figure 6.4).
Clinical isolates of the Bcc contain polymorphisms within the gyrA QRDR at positions 83
and 87 and there appears to be a correlation between MIC and the identity of amino acids at
codon 83 and 87. The direct effect of QRDR polymorphisms in Bcc clinical isolates on
growth rate was not assessed in this thesis and therefore. It is not possible to comment on
whether differences in observed growth rate were directly related to the identity of amino
188
Chapter 6 Characterisation of Clinical isolates of Burkholderia cepacia complex
acids within the QRDR. At codon 83 a serine residue would be expected in a susceptible
isolate, while at codon 87 an aspartic acid residue would be expected in a susceptible
isolate. Isolates of P. aeruginosa and C. jejuni are 10 fold less susceptible to
fluoroquinolones than wildtype E. coli because they contain a threonine residue rather than
serine at codon 83 (Chen & Lo 2003; Okazaki et al. 1991). Codons 83 and 87 encode the
hydrophilic a helical domain of DNA gyrase. When mutations occur at these positions
fluoroquinolones are less able to form a complex with DNA and DNA gyrase, reducing
susceptibility to the drug. Isolates BCH 4 and BCH 5 contain Ser83 and Asp87, the most
common genotype in susceptible isolates. Isolates BCH 1, BCH 5 and BCH 4 exhibited low
level FQ resistance (Table 6.5). However isolate BCH 1 contains Thr83 and Asp87 and has
a higher MIC (6 mg/L) than BCH 5 (3 mg/L) and BCH 4 (1.5 mg/L). Mutations in gyrA
initially result in substitution o f Ser83 and subsequently by substitution of Asp87 (Chen &
Lo 2003; Hooper 2003). The altered gyrase reduces binding of fluoroquinolones, even if
only one resistance mutation is present (Willmott & Maxwell 1993). Although it might be
expected that BCH 6 exhibit the highest level of resistance since this strain contains both
Thr83 and Gly87, the ciprofloxacin MIC is 32 mg/L. Of the eight clinical strains isolate
BCH 7 exhibited the highest level of resistance at 256 mg/L. This isolate contains Thr83 and
Asp87 and it is therefore likely that other resistance mechanisms are contributing to the
observed resistance. The BCH 2 isolate contained an alanine residue at codon 83 and is
highly resistant to ciprofloxacin (128 mg/L). This resistance mutation is not common but
has been documented in fluoroquinolone resistant E. coli (Tavio et al. 1999). The isolate
BCH 2 also contains a Gly87 mutation. It is likely that differences in the QRDR sequence of
gyrB, parC and parE would have been found in the clinical isolates if sequenced and that
these mutations may have contributed to FQ resistance. However the primers used in this
thesis to amplify gyrA failed to amplify gyrB, parC and parE genes of the clinical isolates,
189
Chapter 6 Characterisation of Clinical isolates of Burkholderia cepacia complex
despite further optimisation of annealing temperatures and MgCh concentration. These
regions have, therefore, not been sequenced in the clinical Bcc isolates. Differences in
nucleotide sequences between the primer and the parC region of the clinical isolates may
have prevented the primers from annealing. It is likely that other fluoroquinolone resistance
mechanisms will be contributing to the observed levels of resistance.
Varied aspects of fitness may be more important depending on growth conditions and mode
of growth. An isolate which is more able to survive environmental conditions may have an
advantage over other isolates during transmission from the environment to patients.
Similarly isolates that are capable of forming abundant biofilms may have an advantage in
the lungs of CF patients. However it is possible that an isolate fittest one assay may not be
fittest in all assays that have been selected.
Large SEM values were observed for the environmental survival experiments. Therefore
these assays would only be able to detect reliably large differences in fitness.
Clinafloxacin is a broad spectrum FQ, contains a chlorine atom at C8, and is more active
against Gram-positive bacteria than ciprofloxacin. Activity of clinafloxacin against 354
Gram-positive and Gram-negative organisms was compared to ciprofloxacin, levofloxacin,
sparfloxacin, trovafloxacin, piperacillin, piperacillin-tazobactam, trimethoprim-
sulfamethoxazole, ceftazidime and imipenem (Brisse et al. 1999). MICs of clinafloxacin
were lowest of the FQ drugs tested and had the lowest overall MICs of compounds tested.
Clinafloxacin was also the most active against B. cepacia (Ednie, Jacobs, & Appelbaum
1998). Resistance to clinafloxacin was used to determine mutation rate in the clinical
isolates. In this study mutants selected at low selective concentrations (2 x MIC) of
190
Chapter 6 Characterisation of Clinical isolates of Burkholderia cepacia complex
clinafloxacin did not contain mutations in the QRDR of gyrA. MIC values were reduced in
the presence of reserpine, therefore it is likely that this low level resistance was due to an
increase in efflux activity. No mutants were selected at 4 x and 6 x MIC of clinafloxacin. It
was not possible to select clinafloxacin resistant mutants that contained confirmed
topoisomerase mutations.
The pattern of clinafloxacin resistance is different to that of other FQ antibiotics. A
combination of gyrA and parC mutations is required for clinically significant FQ resistance
to emerge (Nagai et al. 2000; Pan & Fisher 1998). This is because single step mutations in
gyrA or parC confer a two fold increase in clinafloxacin MIC. This does not raise the MIC
above the susceptibility breakpoint. Mutation frequencies of this initial mutation were very
low and have been reported to be in the region of 10'10 to 10'11. Pan et al also found that it
was difficult to select clinafloxacin resistant mutants and proposed that clinafloxacin had no
target preference and targeted both gyrase and topoisomerase IV equally (Pan & Fisher
1998). As spontaneous acquisition of two mutations is required for significant resistance, the
o
mutation rate would therefore be very low. If an average mutation rate is 10'
mutations/division the mutation rate of two spontaneous mutations occurring would be 10~16,
which is unlikely to occur. Nagai et al selected FQ resistant mutants by sequential
subculture in sub inhibitory concentrations of clinafloxacin, ciprofloxacin and trovafloxacin
(Nagai et al. 2000). Observed clinafloxacin mutation frequencies for each mutation step
were lower than ciprofloxacin and trovafloxacin. This suggests that clinafloxacin would be
less likely than trovafloxacin or ciprofloxacin to result in the development of resistance.
Most clinafloxacin mutations did not raise the MIC above the susceptibility breakpoint. The
mutation frequency o f initial resistance mutation to low level resistance in clinical isolates
191
Chapter 6 Characterisation of Clinical isolates of Burkholderia cepacia complex
of S. pneumoniae, which were fully susceptible (MIC 0.06 mg/L), ranged from 8.8 x 10'10-
1.0 x 10"11 (Nagai et al. 2000).
Alternative selective tools that could have been used to detect point mutations are heavy
metals e.g. copper, mercury, lead, boron, cadmium and tungsten. Bacteria have a number of
resistance mechanisms that allow survival in the presence of heavy metals. These include
sequestration of heavy metals, reduction of the metal to a less toxic species and efflux (Nies
1999; Nies & Silver 1995). Heavy metal resistance has been described in Acinetobacter spp,
Staphylococci, P. aeruginosa and S. typhi (Dhakephalkar & Chopade 1994; Du Bois,
Davison, & Pinney 1995; Harnett et al. 1998; Nucifora et al. 1989; Teitzel & Parsek 2003).
Hypermutability was not observed in this limited panel of clinical Bcc isolates investigated
by E-test or estimation of mutation rate but this does not preclude the possibility of
observing hypermutability in a wider screen. In this chapter, the necessary methods to
determine mutation rate in clinical Bcc isolates have been optimised and used to screen for
hypermutability in a small number of isolates that could be applied to screen larger numbers
of isolates.
Between the isolates, differences in growth rates were observed. However the isolate
numbers were not large enough to determine if there was a relationship between species
status or extent of antibiotic resistance in growth rate.
192
Chapter 7 Final Discussion
7.0 Final Discussion
The extensive use of antimicrobial compounds has led to the emergence and dissemination
of multidrug resistant pathogens (Rogues et al 2007; Mutnick et al 2004). Additionally the
lack of new antimicrobials being developed and introduced into clinical use (Norrby et al
2005) has limited treatment options. Approval of new antimicrobials by the U.S. Food and
Drug administration decreased by 56% from 1983-1987 to 1998-2002. Since 1998 only 10
new antibiotics have been developed. Of these only linezolid, daptomycin and tigecycline
have novel mechanisms of action (Spellberg et al 2004). Antibiotic resistant Gram-negative
pathogens that are resistant to treatment by almost all available drugs are becoming a
particular problem, especially due to their involvement in nosocomial outbreaks (Canton,
Coque, & Baquero 2003). Members of the B. cepacia complex are highly antibiotic
resistant opportunistic pathogens causing lung infection in cystic fibrosis patients.
Resistance to fluoroquinolones in the Bcc emerges via mutation in topoisomerase genes
and by upregulation of efflux pathways which extrude antimicrobial compounds from the
cell.
Most resistance acquisitions, occuring by chromosomal point mutations, are associated
with a fitness cost (Andersson & Levin 1999). When this is the case a resistant strain will
be outcompeted by a susceptible strain in the absence of the antibiotic selective pressure.
Mutants with a low or non existent fitness cost, as described in chapter 5, are therefore
more likely to become fixed in the population than those with large fitness deficits.
Mutations that confer no cost in vitro, with moderate levels of resistance, commonly occur
in B. cepacia while high level resistant mutants (less common) incur a significant fitness
deficit, as measured by growth rate. Programmes to restrict use of antibiotics in order to
reduce rates of resistance are based on the assumption that antibiotic resistance has an
193
Chapter 7 Final Discussion
associated cost. Where there are no or low cost mutations these strains may remain in the
population following the cessation or judicious control of fluoroquinolone use in the
community, hospital (Shlaes et al. 1997) and within animal husbandry (Nawaz et al. 2003;
Wallmann 2006). These pre-existing mutants may then re-emerge rapidly in the bacterial
population as a consequence of resumed prescribing of fluoroquinolone, as illustrated by
Cohen and Murray in their studies of multidrug-resistant tuberculosis (Cohen & Murray
2004). Exposure of a bacterial population already containing resistance conferring
mutations to the antibiotic will select subsequent mutations that will further increase MIC
and will select in favour of the pre-existing resistant mutants rather than the wildtype. The
extent to which the resistant subpopulation will take over the population will depend on
three factors; the level of resistance conferred by the genetic change, the fitness deficit
associated with the mutation and the level of antibiotic exposure. The probability of
resistance mutations occurring and the extent of the associated fitness deficit are important
as these factors affect the likelihood of resistance emerging and being maintained in the
population. This thesis addresses these factors.
In this thesis novel methods for measuring fitness in the Bcc have been developed.
Measures of fitness are context specific and appropriate models of fitness should be
relevant to the organism, simple to perform and able to detect small fitness deficits.
Growth rate is an accepted method for measuring fitness deficits and has been used
previously both as monocultures, or in paired competition assays (Billington, McHugh, &
and Gillespie 1999; Gillespie, Voelker, & Dickens 2002), to measure fitness deficits.
However no single measure of fitness is sufficient. As Bcc bacteria are likely to form
biofilms within the CF lung a biofilm assay was included as a fitness assay, described in
chapter 4. Models have been selected for this study, described in chapter 5, that represent
194
Chapter 7 Final Discussion
growth and survival conditions for B. cepacia (Conway, Venu, & Speert 2002; O'Toole &
Kolter 1998; Sanchez et al. 2002). These were planktonic growth rate, pair wise
competitive culture (Gillespie, Voelker, & Dickens 2002), biofilm growth (Conway, Venu,
& Speert 2002; O'Toole & Kolter 1998), survival in water and resistance to drying
(Sanchez et al. 2002). To measure planktonic growth rate a liquid based semi automated
growth rate determination method, modified from the method of Youmans and Youmans
(Youmans & Youmans 1949) has been used. This method avoids the use of laborious
growth curve techniques and has been shown to be reproducible in this study (Pope et al.
2007).
No measurable fitness cost was associated with single mutations in gyrA. As these models
can not detect fitness costs of <1% it is not possible to conclude that gyrA mutations were
‘no cost’ and are likely to be ‘no cost or low cost’. It was notable that mutants containing
mutations in both gyrA and parC were significantly impaired in fitness compared to the
susceptible parent (chapter 4). Cystic fibrosis patients are frequently colonised by Bcc
bacteria that exhibit high level FQ resistance (Zhou et al) even when there is not an FQ
selective pressure. As described in chapter 6, clinical Bcc isolates often exhibit moderate to
high level fluoroquinolone resistance and exhibit polymorphisms with in the QRDR
regions of gyrA As multiple mutations are required for moderate and high level resistance it
is likely that the fitness costs measured in this thesis do not impair the ability of Bcc to
cause clinical disease. Additionally the isolates studied in this thesis were obtained from
CF patients with chronic Bcc infection. The size of fitness cost that would be required to
have an effect clinically is not known and may be hard to investigate as these are likely to
be the isolates that do not survive.
195
Chapter 7 Final Discussion
Mutants selected in vitro or mutations that occur during treatment may have an undefined
genetic background. In order to interpret the effect of resistance on fitness the nucleotide
sequence of the susceptible parent and resistant mutants should be determined.
Consecutively isolated isogenic clinical strains, containing successive resistance mutations,
may be available. It is not possible to establish with confidence the contribution to
resistance of topoisomerase mutations selected in vitro because it is not possible to exclude
the presence of other mutations that may have occurred and contributed to the observed
resistance. In this study only the QRDR regions of the topoisomerase genes of mutants
selected in vitro were sequenced. The possibility of mutations affecting fitness outside
these regions cannot be excluded. Use of directed mutagenesis could overcome this
limitation. Bagel et al. examined the effects of point mutations, created by directed
mutagenesis, on fluoroquinolone resistance and found that extent of the fitness cost varied
depending on the gyrA and parC mutations present (Bagel et al. 1999). Different gyrA
mutations had different effects on the degree of supercoiling. It is therefore likely that
supercoiling alterations affect growth rate (Bagel et al. 1999). Compensatory mutations
may occur that restore supercoiling activity of gyrase and may restore growth rates to
levels comparable to the susceptible parent therefore restoring the fitness deficit.
Restoration of growth rate by compensatory mutation has been demonstrated in P.
aeruginosa (Kugelberg et al. 2005).
During drug development the likelihood of resistance arising is affected by mutation rate.
The cost of these mutations may be relevant as even if the mutation rate is high resistant
mutants will not proliferate in the population if the fitness cost is high. Novel
antimicrobials to which only resistance mechanisms that incur large fitness costs are likely
would be promising agents to develop. Previous data show that use of low dose
196
Chapter 7 Final Discussion
fluoroquinolone as therapy may increase the rate of resistance mutations occurring in other
pathogens that may have colonised the cystic fibrosis lung due to ability of
fluoroquinolones to increase mutation rate at sub inhibitory concentrations (Gillespie et al.
2005).
Previous treatment with fluoroquinolones may allow amplification of a mutant
subpopulation to over 70% resistance if fluoroquinolone treatment is re-initiated (Peloquin
et al. 1989). It is accepted that fitter more susceptible bacteria can out compete resistant
bacteria when the antibiotic selective pressure is removed. However it is apparent that
resistance may persist in the population for longer than previously thought. Resistant S.
epidermidis were found on human skin 4 years after single course of clarithromycin
(Sjolund et al. 2005). Resistant bacteria are unlikely to disappear even if antibiotic use is
reduced and can persist due to no cost mutations, compensatory mutations and co-selection
of resistance markers. In the UK a 97% reduction in sulphonamide use was observed
during the 1990s as a consequence of a national prescribing restriction prompting a switch
from trimethoprim-sulfamethoxazole to trimethoprim. The prevalence of sulphonamide
resistance in E. coli remained at 40-45% (Enne et al. 2001). Antibiotic resistance
determinants responsible for resistance to a drug which is no longer in use can be linked to
genes conferring resistance to antibiotics still in use. The sul2 plasmid, containing genes
conferring sulphonamide resistance, did not disappear during decreased sulphonamide use,
even though these plasmids reduce fitness (Enne et al. 2004).
The risk of resistance arising depends on the mutagenicity of the fluoroquinlone, the dose
and length of treatment. Use of antimicrobial agents in the hospital and the community can
be rationalised. However we can not control the remaining factors. Rational use of
197
Chapter 7 Final Discussion
antibiotics will not alone reduce the rate of infections caused by resistant bacteria as
resistant bacteria may already have become fixed in the population. This could include
prescribing an antibiotic dose that does not select resistant mutants and effective methods
for reducing transmission.
A method for measurement of mutation rate has been standardised in this thesis. In
bacterial populations some clones may have a higher mutation rate than the rest of the
population due to defects in proof reading and repair mechanisms. Hypermutability in
populations of pathogenic bacteria has been described in E. coli (LeClerc, Li, & Payne
1996; Matic et al. 1997), Salmonella spp. and P. aeruginosa isolated from the lungs of CF
patients (Oliver et al. 2000; Oliver et al. 2004). Although Bcc inhabit a similar niche to P.
aeruginosa within the CF lung hypermutability has not been reported in the Bcc. In this
study no evidence for hypermutability in the Bcc has been found (chapter 6).
Although the rate of mutation in topoisomerase genes conferring FQ resistance in B.
cepacia is low (chapter 3) the mutants containing a single mutation in gyrA which arise, are
not associated with a fitness cost (chapter 5). Mutants are likely therefore to persist in the
population. The mutation rate of the second step mutation is higher than the mutation rate
of the first step mutation (chapter 3). Our group have previously found that the mutation
rate of second step mutations in S. pneumoniae isolates already containing a gyrA or parC
alteration was higher than the first step mutation rates, using ciprofloxacin and
gemifloxacin as the selective agents (Gillespie et al. 2003). This is evidence that single
mutations in gyrase or topoisomerase IV may predispose the genome to further mutation.
198
Chapter 7 Final Discussion
Differences in antibiotic susceptibility were observed between the clinical Bcc isolates.
Polymorphisms at codons 83 and 87 of the gyrA QRDR were found and the identity of the
amino acids affects level of FQ resistance (chapter 6). Variation in generation times was
observed for the Bcc clinical isolates. The determinants responsible for the reduced growth
are unknown. One isolate was an abundant biofilm producer, compared to the other isolates
(chapter 6). However no statistically significant differences in environmental survival were
found between clinical isolates.
In this thesis appropriate methods were developed to measure fitness and mutation rate in
the Bcc. The path to fluoroquinolone resistance in B. cepacia is initially by an efflux
mechanism at low selective concentrations, the genetic basis of which was not elucidated.
At higher selective concentrations mutations in gyrA occur, conferring moderate level
resistance, that incur no fitness cost. Second step mutants contain mutation in gyrA and
parC, conferring step wise increases in resistance with significant fitness deficits. No
evidence for hypermutability in the Bcc was found.
F u tu re W o rk
In this thesis appropriate methods have been developed to measure fitness and mutation
rate in the Bcc. The isolates investigated in this thesis represented a small number of B.
cenocepacia and B. multivorans CF strains. To build on the experience gained in this
study the tools standardised in this thesis can now be used to investigate mechanisms of
fluoroquinolone resistance and fitness and to screen for hypermutability in a larger panel
of isolates to include isolates from other genomovars.
199
Chapter 7 Final Discussion
Mutation rate in planktonic culture in Bee was determined in this thesis. It would be
interesting to determine the mutation rate of Bcc cells growing as a biofilm and to
compare this to the planktonic rate as the biofilm mutation rate may be higher and there
may be a link between increased mutation rate and antibiotic resistance in biofilms. The
maximum final inoculum of bacterial cells growing as a biofilm in the CDFF that could be
obtained was too low to enable estimation of mutation rate. Use of the microtitre plate
would not have been suitable for measurement of biofilm mutation rate because this model
may not adequately represent an in vivo biofilm. Therefore this was not pursued in this
thesis.
Creation of genetically defined topoisomerase and efflux mutations in isogenic strains
would have allowed the fitness costs of each mutation to be measured without the
possibility of other mutations occurring elsewhere in the genome. Additionally this would
allow the contribution of each mutation on MIC to be elucidated.
Efflux mechanisms were not a primary focus of this thesis. However FQ efflux has
emerged as an important mechanism of FQ resistance in Bcc. Fitness of the FQ resistant in
vitro mutants where resistance was presumptively conferred by increase in efflux activity
was not measured and therefore the fitness cost of increased efflux is not known.
Additionally the mechanism of FQ efflux in these isolates was not characterised.
Characterisation of the quinolone resistance determining regions of topoisomerase genes
from a larger number of clinical Bcc isolates from all genomovars could be performed and
correlated with the level of fluoroquinolone MIC. This would enable clarification of the
200
Chapter 7 Final Discussion
role of topoisomerase point mutations in FQ resistance and would serve to enhance our
understanding of the evolution of antibiotic resistance in Bcc.
201
References
REFERENCES
Aaron, S. D., Ferris, W., Henry, D. A., Speert, D. P., & Macdonald, N. E. 2000, "Multiple combination bactericidal antibiotic testing for patients with cystic fibrosis infected with Burkholderia cepacia", Am.J.Respir.Crit Care M ed, vol. 161, no. 4 Pt 1, pp. 1206-1212.
Aaron, S. D., Ferris, W., Ramotar, K., Vandemheen, K., Chan, F., & Saginur, R. 2002, "Single and combination antibiotic susceptibilities of planktonic, adherent, and biofilm- grown Pseudomonas aeruginosa isolates cultured from sputa of adults with cystic fibrosis", J.Clin.Microbiol, vol. 40, pp. 4172-4179
Abraham, E. P. & Chain. E. 1940, "An enzyme from bacteria able to destroy penicillin", Nature, vol. 146, p. 837.
Agodi, A., Mahenthiralingam, E., Barchitta, M., Giannino, V., Sciacca, A., & Stefani, S. 2001, "Burkholderia cepacia complex infection in Italian patients with cystic fibrosis: prevalence, epidemiology, and genomovar status", J.Clin.Microbiol, vol. 39, no. 8, pp. 2891-2896.
Aguiar, J. M., Chacon, J., Canton, R., & Baquero, F. 1992, "The emergence of highly fluoroquinolone-resistant Escherichia coli in community-acquired urinary tract infections", J.Antimicrob.Chemother., vol. 29, no. 3, pp. 349-350.
Aguilar, C., Bertani, I., & Venturi, V. 2003, "Quorum-sensing system and stationary- phase sigma factor (rpoS) of the onion pathogen Burkholderia cepacia genomovar I type strain, ATCC 25416", Appl.Environ.Microbiol, vol. 69, no. 3, pp. 1739-1747.
Aguilar, C., Friscina, A., Devescovi, G., Kojic, M., & Venturi, V. 2003, "Identification of quorum-sensing-regulated genes of Burkholderia cepacia", J.Bacteriol., vol. 185, no. 21, pp. 6456-6462.
Akasaka, T., Tanaka, M., Yamaguchi, A., & Sato, K. 2001, "Type II topoisomerase mutations in fluoroquinolone-resistant clinical strains of Pseudomonas aeruginosa isolated in 1998 and 1999: role of target enzyme in mechanism of fluoroquinolone resistance", Antimicrob.Agents Chemother., vol. 45, no. 8, pp. 2263-2268.
A1 Bakri, A. G., Gilbert, P., & Allison, D. G. 2004, "Immigration and emigration of Burkholderia cepacia and Pseudomonas aeruginosa between and within mixed biofilm communities", J.Appl.Microbiol., vol. 96, no. 3, pp. 455-463.
Albrecht, M. T., Wang, W., Shamova, O., Lehrer, R. I., & Schiller, N. L. 2002, "Binding of protegrin-1 to Pseudomonas aeruginosa and Burkholderia cepacia", Respir.Res., vol. 3,p. 18.
Allison, D. G., McBain, A. J., & Gilbert, P. 2000, "Biofilms: problems of control" in Community structure and cooperation in Biofilms, D. G. Allison et al., eds., University Press, Cambridge, pp. 309-327.
202
References
Anderl, J. N., Franklin, M. J., & Stewart, P. S. 2000, "Role of antibiotic penetration limitation in Klebsiella pneumoniae biofilm resistance to ampicillin and ciprofloxacin", Antimicrob.Agents Chemother., vol. 44, no. 7, pp. 1818-1824.
Andersen, S. R. & Sandaa, R. A. 1994, "Distribution of tetracycline resistance determinants among Gram-negative bacteria isolated from polluted and unpolluted marine sediments", Appl.Environ.Microbiol, vol. 60, no. 3, pp. 908-912.
Andersson, D. I., Bjorkman, J., & Hughes, D. 1998, "[Antibiotic resistance here to stay? Compensatory mutations restore virulence of resistant bacteria]", Lakartidningen, vol. 95, no. 37, pp. 3940, 3943-3940, 3944.
Andersson, D. I. & Hughes, D. 1996, "Muller's ratchet decreases fitness of a DNA-based microbe", Proc.Natl.Acad.Sci. U.S.A, vol. 93, no. 2, pp. 906-907.
Andersson, D. I. & Levin, B. R. 1999, "The biological cost of antibiotic resistance", Curr.Opin. Microbiol, vol. 2, no. 5, pp. 489-493.
Anwar, H., van Biesen, T., Dasgupta, M., Lam, K., & Costerton, J. W. 1989, "Interaction of biofilm bacteria with antibiotics in a novel in vitro chemostat system", Antimicrob.Agents Chemother., vol. 33, no. 10, pp. 1824-1826.
Appelbaum, P. C. & Hunter, P. A. 2000, "The fluoroquinolone antibacterials: past, present and future perspectives", Int. J.Antimicrob.Agents, vol. 16, no. 1, pp. 5-15.
Arason, V. A., Gunnlaugsson, A., Sigurdsson, J. A., Erlendsdottir, H., Gudmundsson, S., & Kristinsson, K. G. 2002, "Clonal spread of resistant pneumococci despite diminished antimicrobial use", Microb.Drug Resist., vol. 8, no. 3, pp. 187-192.
Arason, V. A., Sigurdsson, J. A., Erlendsdottir, H., Gudmundsson, S., & Kristinsson, K. G. 2006, "The role of antimicrobial use in the epidemiology of resistant pneumococci: A 10-year follow up", Microb.Drug Resist., vol. 12, no. 3, pp. 169-176.
Aris, R. M., Routh, J. C., LiPuma, J. J., Heath, D. G., & Gilligan, P. H. 2001, "Lung transplantation for cystic fibrosis patients with Burkholderia cepacia complex. Survival linked to genomovar type", Am.J.Respir.Crit Care Med., vol. 164, no. 11, pp. 2102-2106.
Ariza, R. R., Cohen, S. P., Bachhawat, N., Levy, S. B., & Demple, B. 1994, "Repressor mutations in the marRAB operon that activate oxidative stress genes and multiple antibiotic resistance in Escherichia coli", J.Bacteriol., vol. 176, no. 1, pp. 143-148.
Armitage, P. 1952, "The statistical theory of bacterial populations subject to mutation", J.R.Statist.Soc., vol. 14, pp. 1-40.
Armitage, P. 1953, "Statistical concepts in the theory of bacterial mutation", J.Hyg, vol. 51, pp. 162-184.
Asako, H., Nakajima, H., Kobayashi, K., Kobayashi, M., & Aono, R. 1997, "Organic solvent tolerance and antibiotic resistance increased by overexpression of marA in Escherichia coli", Appl.Environ.Microbiol, vol. 63, no. 4, pp. 1428-1433.
203
References
Asteris, G. & Sarkar, S. 1996, "Bayesian procedures for the estimation of mutation rates from fluctuation experiments", Genetics, vol. 142, no. 1, pp. 313-326.
Austin, D. J., Kristinsson, K. G., & Anderson, R. M. 1999, "The relationship between the volume of antimicrobial consumption in human communities and the frequency of resistance", Proc.Natl.Acad.Sci. U.S.A, vol. 96, no. 3, pp. 1152-1156.
Avery, O. T., MacLeod, C. M., & McCarty, M. 1944, "Studies on the chemical nature of the substance inducing transformation of pneumococcal types: induction of transformation by a desoxyribonucleic acid fraction isolated from pneumococcus type III", Journal o f Experimental Medicine, vol. 79, no. 2, pp. 137-158.
Bachoual, R., Ouabdesselam, S., Mory, F., Lascols, C., Soussy, C. J., & Tankovic, J. 2001, "Single or double mutational alterations of gyrA associated with fluoroquinolone resistance in Campylobacter jejuni and Campylobacter coli", Microb. Drug Resist., vol. 7, no. 3, pp. 257-261.
Bagel, S., Hullen, V., Wiedemann, B., & Heisig, P. 1999, "Impact of gyrA and parC mutations on quinolone resistance, doubling time, and supercoiling degree of Escherichia coW, Antimicrob.Agents Chemother., vol. 43, no. 4, pp. 868-875.
Bagge, N., Schuster, M., Hentzer, M., Ciofu, O., Givskov, M., Greenberg, E. P., & Hoiby, N. 2004, "Pseudomonas aeruginosa biofilms exposed to imipenem exhibit changes in global gene expression and beta-lactamase and alginate production", Antimicrob.Agents Chemother., vol. 48, no. 4, pp. 1175-1187.
Baird, R. M., Brown, H., Smith, A. W., & Watson, M. L. 1999, "Burkholderia cepacia is resistant to the antimicrobial activity of airway epithelial cells", Immunopharmacology, vol. 44, no. 3, pp. 267-272.
Balaban, N. Q., Merrin, J., Chait, R., Kowalik, L., & Leibler, S. 2004, "Bacterial persistence as a phenotypic switch", Science, vol. 305, no. 5690, pp. 1622-1625.
Baldwin, A., Mahenthiralingam, E., Drevinek, P, Pope, C., Waine, D.J., Henry, D.A., Speert, D. P., Carter, P., Vandamme P., LiPuma, J. J. & Dowson, C.G. 2008. "Elucidating global epidemiology of Burkholderia multivorans in cases of cystic fibrosis by multilocus sequence typing". J. Clin.Micro, vol. 46, pp. 290-295.
Baldwin, A., Sokol, P. A., Parkhill, J., & Mahenthiralingam, E. 2004, "The Burkholderia cepacia epidemic strain marker is part of a novel genomic island encoding both virulence and metabolism-associated genes in Burkholderia cenocepacia", Infect. Immun., vol. 72, no. 3, pp. 1537-1547.
Ballard R.W., Palleroni, N. J., Doudoroff, M., & Stanier, R. Y. 1970, "Taxonomy of the aerobic pseudomonads: Pseudomonas cepacia, P.marginata, P.alliicola and P.caryophlli", Journal o f General Microbiology, vol. 60, pp. 199-214.
Baranova, N. N. & Neyfakh, A. A. 1997, "Apparent involvement of a multidrug transporter in the fluoroquinolone resistance of Streptococcus pneumoniae", Antimicrob.Agents Chemother., vol. 41, no. 6, pp. 1396-1398.
204
References
Barlow, C. W., Robbins, R. C., Moon, M. R., Akindipe, O., Theodore, J., & Reitz, B. A. 2000, "Heart-lung versus double-lung transplantation for suppurative lung disease", J. Thorac. Cardiovasc.Surg., vol. 119, no. 3, pp. 466-476.
Barnard, F. M. & Maxwell, A. 2001, "Interaction between DNA gyrase and quinolones: effects of alanine mutations at GyrA subunit residues Ser(83) and Asp(87)", Antimicrob.Agents Chemother., vol. 45, no. 7, pp. 1994-2000.
Barnett, M., Busby, S. R., & Mitchison, D. A. 1953, "Tubercle bacilli res to isoniazid: virulence and response to treatment with isoniazid in guinea pigs", Br.J.Exp.Pathol., vol. 34(5), pp. 568-581.
Barth, A. L. & Pitt, T. L. 1995, "Auxotrophic variants of Pseudomonas aeruginosa are selected from prototrophic wild-type strains in respiratory infections in patients with cystic fibrosis", J.Clin.Microbiol., vol. 33, no. 1, pp. 37-40.
Barth, A. L. & Pitt, T. L. 1995, "Auxotrophy of Burkholderia {Pseudomonas) cepacia from cystic fibrosis patients", J.Clin.Microbiol., vol. 33, no. 8, pp. 2192-2194.
Barthelemy, P., Autissier, D., Gerbaud, G., & Courvalin, P. 1984, "Enzymic hydrolysis of erythromycin by a strain of Escherichia coli. A new mechanism of resistance", J.Antibiot. (Tokyo), vol. 37, no. 12, pp. 1692-1696.
Bast, D. J., Low, D. E., Duncan, C. L., Kilbum, L., Mandell, L. A., Davidson, R. J., & de Azavedo, J. C. 2000, "Fluoroquinolone resistance in clinical isolates of Streptococcus pneumoniae: contributions of type II topoisomerase mutations and efflux to levels of resistance", Antimicrob.Agents Chemother., vol. 44, no. 11, pp. 3049-3054.
Beaber, J. W., Hochhut, B., & Waldor, M. K. 2004, "SOS response promotes horizontal dissemination of antibiotic resistance genes", Nature, vol. 427, no. 6969, pp. 12-1 A.
Beckman, W. & Lessie, T. G. 1979, "Response of Pseudomonas cepacia to beta-Lactam antibiotics: utilization of penicillin G as the carbon source", J.Bacteriol., vol. 140, no. 3,pp. 1126-1128.
Bedenic, B. & Zagar, Z. 1998, "Extended-spectrum beta-lactamases in clinical isolates of Klebsiella pneumoniae from Zagreb, Croatia", J.Chemother., vol. 10, no. 6, pp. 449-459.
Bennett, A. F., Dao, K. M., & Lenski, R. E. 1990, "Rapid evolution in response to high- temperature selection", Nature, vol. 346, no. 6279, pp. 79-81.
Bemier, S. P., Silo-Suh, L., Woods, D. E., Ohman, D. E., & Sokol, P. A. 2003, "Comparative analysis of plant and animal models for characterization of Burkholderia cepacia virulence", Infect.Immun., vol. 71, no. 9, pp. 5306-5313.
Beyer, R., Pestova, E., Millichap, J. J., Stosor, V., Noskin, G. A., & Peterson, L. R. 2000, "A convenient assay for estimating the possible involvement of efflux of fluoroquinolones by Streptococcus pneumoniae and Staphylococcus aureus: evidence for diminished moxifloxacin, sparfloxacin, and trovafloxacin efflux", Antimicrob.Agents Chemother., vol. 44, no. 3, pp. 798-801.
205
References
Biddick, R., Spilker, T., Martin, A., & LiPuma, J. J. 2003, "Evidence of transmission of Burkholderia cepacia, Burkholderia multivorans and Burkholderia dolosa among persons with cystic fibrosis", FEMSMicrobiol.Lett., vol. 228, no. 1, pp. 57-62.
Bigger, J. W. 1944, "Treatment of staphylococcal infections", Lancet pp. 497-500.
Billington, O. J., McHugh, T. D., & Gillespie, S. H. 1999, "Physiological cost of rifampin resistance induced in vitro in Mycobacterium tuberculosis", J.Antimicrob.Chemother., vol. 43, pp. 1866-1869.Bjorkman, J., Hughes, D., & Andersson, D. I. 1998, "Virulence of antibiotic-resistant Salmonella typhimurium", Proc.Natl.Acad.Sci. U.S.A, vol. 95, no. 7, pp. 3949-3953.
Bjorkman, J., Nagaev, I., Berg, O. G., Hughes, D., & Andersson, D. I. 2000, "Effects of environment on compensatory mutations to ameliorate costs of antibiotic resistance", Science, vol. 287, no. 5457, pp. 1479-1482.
Bjorkholm, B., Sjolund, M., Falk, P. G., Berg, O. G., Engstrand, L., & Andersson, D. I. 2001, "Mutation frequency and biological cost of antibiotic resistance in Helicobacter pylori", Proc.Natl.Acad.Sci. U.S.A, vol. 98, no. 25, pp. 14607-14612.
Blahova, J., Kralikova, K & Krcmery, V. 1992 "Imipenem and cefotaxime resistance: transduction by wild-type phages in hospital strains of Pseudomonas aeruginosa", J.Chem., vol. 4, no. 6, pp. 335-7.
Boles, B. R., Thoendel, M., & Singh, P. K. 2004, "From the Cover: Self-generated diversity produces "insurance effects" in biofilm communities", Proceedings o f the National Academy o f Sciences, vol. 101, no. 47, pp. 16630-16635.
Bouma, J. E. & Lenski, R. E. 1988, "Evolution of a bacteria/plasmid association", Nature, vol. 335, no. 6188, pp. 351-352.
Breines, D. M., Ouabdesselam, S., Ng, E. Y., Tankovic, J., Shah, S., Soussy, C. J., & Hooper, D. C. 1997, "Quinolone resistance locus nficD of Escherichia coli is a mutant allele of the parE gene encoding a subunit of topoisomerase IV", Antimicrob.Agents Chemother., vol. 41, no. 1, pp. 175-179.
Brenwald, N. P., Gill, M. J., & Wise, R. 1998, "Prevalence of a putative efflux mechanism among fluoroquinolone-resistant clinical isolates of Streptococcus pneumoniae", Antimicrob.Agents Chemother., vol. 42, no. 8, pp. 2032-2035.
Brenwald, N. P., Gill, M. J., & Wise, R. 1997, "The effect of reserpine, an inhibitor of multi-drug efflux pumps, on the in-vitro susceptibilities of fluoroquinolone-resistant strains of Streptococcus pneumoniae to norfloxacin", J.Antimicrob. Chemother., vol. 40, no. 3, pp. 458-460.
Bressler, A.M, Keith, Kaye, K.S., LiPuma, M.D., Alexander, M.D., Moore, C.M., Reller, B.R. & Woods, C.W. 2007. "Risk factors for Burkholderia cepacia complex bacteremia among intensive care unit patients without cystic fibrosis: a case control study" Infection. Con. and Hosp.Epidem., vol 28, no. 8, pp. 951-958.
Brisse, S., Milatovic, D., Fluit, A. C., Verhoef, J., Martin, N., Scheuring, S., Kohrer, K., & Schmitz, F. J. 1999, "Comparative in vitro activities of ciprofloxacin, clinafloxacin,
206
References
gatifloxacin, levofloxacin, moxifloxacin, and trovafloxacin against Klebsiella pneumoniae, Klebsiella oxytoca, Enterobacter cloacae, and Enterobacter aerogenes clinical isolates with alterations in GyrA and ParC proteins", Antimicrob.Agents Chemother., vol. 43, no. 8, pp. 2051-2055.
Brooun, A., Liu, S., & Lewis, K. 2000, "A dose-response study of antibiotic resistance in Pseudomonas aeruginosa biofilms", Antimicrob.Agents Chemother., vol. 44, no. 3, pp.640-646.
Broschat, S. L., Loge, F. J., Peppin, J. D., White, D., Call, D. R., & Kuhn, E. 2005, "Optical reflectance assay for the detection of biofilm formation", J.Biomed.Opt., vol. 10, no. 4, p. 44027.
Brown, E. W., LeClerc, J. E., Li, B., Payne, W. L., & Cebula, T. A. 2001, "Phylogenetic evidence for horizontal transfer of mutS alleles among naturally occurring Escherichia coli strains", J.Bacteriol., vol. 183, no. 5, pp. 1631-1644.
Brown, M. H., Paulsen, I. T., & Skurray, R. A. 1999, "The multidrug efflux protein NorM is a prototype of a new family of transporters", Mol.Microbiol., vol. 31, no. 1, pp. 394- 395.
Burch, C. L. & Chao, L. 2000, "Evolvability of an RNA virus is determined by its mutational neighbourhood", Nature, vol. 406, no. 6796, pp. 625-628.
Burgos, M., DeRiemer, K., Small, P. M., Hopewell, P. C., & Daley, C. L. 2003, "Effect of drug resistance on the generation of secondary cases of tuberculosis", J.Infect.Dis., vol. 188, no. 12, pp. 1878-1884.
Burkholder, W. H. 1950, "Sour skin, a bacterial rot of onion bulbs.", Phytopathology, vol. 40, pp. 115-117.
Bums, J. L., Jonas, M., Chi, E. Y., Clark, D. K., Berger, A., & Griffith, A. 1996, "Invasion of respiratory epithelial cells by Burkholderia (.Pseudomonas) cepacia", Infect.Immun., vol. 64, no. 10, pp. 4054-4059.
Bums, J. L., Hedin. L. A. & Lien., D. M. 1989, "Chloramphenicol resistance in Pseudomonas aeruginosa because of decreased permeability.", Antimicrob.Agents Chemother., vol. 33, pp. 136-141.
Butler, S. L., Doherty, C. J., Hughes, J. E., Nelson, J. W., & Govan, J. R. 1995, "Burkholderia cepacia and cystic fibrosis: do natural environments present a potential hazard?", J.Clin.Microbiol., vol. 33, no. 4, pp. 1001-1004.
Cairns, J., Overbaugh, J., & Miller, S. 1988, "The origin of mutants", Nature, vol. 335, no. 6186, pp. 142-145.
Campbell, A. 1962, "Episomes", Adv. Genetics, vol.. 11, pp. 101-146.
Campbell, P. W., Ill, Phillips, J. A., Ill, Heidecker, G. J., Krishnamani, M. R., Zahorchak, R., & Stull, T. L. 1995, "Detection of Pseudomonas (.Burkholderia) cepacia using PCR", Pediatr.Pulmonol., vol. 20, no. 1, pp. 44-49.
207
References
Cambau, E., Perani, E., Dib, C., Petinon, C., Trias, J., & Jarlier, V. 1995, "Role of mutations in DNA gyrase genes in ciprofloxacin resistance of Pseudomonas aeruginosa susceptible or resistant to imipenem", Antimicrob.Agents Chemother., vol. 39, no. 10, pp. 2248-2252.
Canton, R., Coque, T. M., & Baquero, F. 2003, "Multi-resistant Gram-negative bacilli: from epidemics to endemics", Curr. Opin.Infect.Dis., vol. 16, no. 4, pp. 315-325.
Caraher, E., Duff, C., Mullen, T., Me, K. S., Murphy, P., Callaghan, M., & McClean, S. 2006, "Invasion and biofilm formation of Burkholderia dolosa is comparable with Burkholderia cenocepacia and Burkholderia multivorans", J.Cyst.Fibros.
Ceri, H., Olson, M. E., Stremick, C., Read, R. R., Morck, D., & Buret, A. 1999, "The Calgary Biofilm Device: new technology for rapid determination of antibiotic susceptibilities of bacterial biofilms", J.Clin. Microbiol., vol. 37, no. 6, pp. 1771-1776.
Chao, L. & Cox. E. C. 1983, "Competition between high and low mutating strains of E. coli", Evolution, vol. 37, pp. 125-134.
Chaowagul, W., White, N. J., Dance, D. A., Wattanagoon, Y., Naigowit, P., Davis, T. M., Looareesuwan, S., & Pitakwatchara, N. 1989, "Melioidosis: a major cause of community- acquired septicemia in northeastern Thailand", J.Infect.Dis., vol. 159, no. 5, pp. 890-899.
Chaparro, C., Maurer, J., Gutierrez, C., Krajden, M., Chan, C., Winton, T., Keshavjee, S., Scavuzzo, M., Tullis, E., Hutcheon, M., & Kesten, S. 2001, "Infection with Burkholderia cepacia in cystic fibrosis: outcome following lung transplantation", Am.J.Respir.Crit Care M ed, vol. 163, no. 1, pp. 43-48.
Chavant, P., Gaillard-Martinie, B., Talon, R., Hebraud, M., & Bemardi, T. 2007, "A new device for rapid evaluation of biofilm formation potential by bacteria", J.Microbiol.Methods, vol. 68, no. 3, pp. 605-612.
Chen, D.K., McGeer, A, de Azavedo, J.C. & Low, P.E, 1999. Decreased susceptibility of S. pneumoniae to fluoroquinolones in Canada. N. Engl.J.Med'., vol. 341, pp. 233-235.
Chen, F. J. & Lo, H. J. 2003, "Molecular mechanisms of fluoroquinolone resistance", J.Microbiol.Immunol.Infect., vol. 36, no. 1, pp. 1-9.
Chen, J. S., Witzmann, K. A., Spilker, T., Fink, R. J., & LiPuma, J. J. 2001, "Endemicity and inter-city spread of Burkholderia cepacia genomovar III in cystic fibrosis", J.Pediatr., vol. 139, no. 5, pp. 643-649.
Chin, N. X., Figueredo, V. M., Novelli, A., & Neu, H. C. 1988, "In vitro activity of temafloxacin, a new difluoro quinolone antimicrobial agent", Eur. J.Clin.Microbiol.Infect.Dis., vol. 7, no. 1, pp. 58-63.
Chin, N. X., Novelli, A., & Neu, H. C. 1988,"In vitro activity of lomefloxacin (SC-47111; NY-198), a difluoroquinolone 3-carboxylic acid, compared with those of other quinolones", J.Antimicrob.Chemother., vol. 32, no. 5, pp. 656-662.
208
References
Chiu, C. H., Wu, T. L., Su, L. H., Chu, C., Chia, J. H., Kuo, A. J., Chien, M. S., & Lin, T. Y. 2002, "The emergence in Taiwan of fluoroquinolone resistance in Salmonella enterica serotype choleraesuis", N.Engl.J.Med., vol. 346, no. 6, pp. 413-419.
Chu, E. H. & Mailing, H. V. 1968, "Mammalian cell genetics. II. Chemical induction of specific locus mutations in Chinese hamster cells in vitro", Proc.Natl.Acad.Sci. U.S.A, vol. 61, no. 4, pp. 1306-1312.
Chu, K. K., Davidson, D. J., Halsey, T. K., Chung, J. W., & Speert, D. P. 2002, "Differential persistence among genomovars of the Burkholderia cepacia complex in a murine model of pulmonary infection", Infect. Immun., vol. 70, no. 5, pp. 2715-2720.
Cieri, M. V., Mayer-Hamblett, N., Griffith, A., & Bums, J. L. 2002, "Correlation between an in vitro invasion assay and a murine model of Burkholderia cepacia lung infection", Infect.Immun., vol. 70, no. 3, pp. 1081-1086.
Cirillo, D. M., Valdivia, R. H., Monack, D. M., & Falkow, S. 1998, "Macrophage- dependent induction of the Salmonella pathogenicity island 2 type III secretion system and its role in intracellular survival", Mol.Microbiol., vol. 30, no. 1, pp. 175-188.
Clinical and Laboratory Standards Institute. 2006. Methods for dilution antimicrobial susceptibility tests fo r bacteria that grow aerobically. Approved standard. Seventh edition M7-A6. Villanove, PA, USA. NCCLS.
Clode, F. E., Kaufmann, M. E., Malnick, H., & Pitt, T. L. 2000, "Distribution of genes encoding putative transmissibility factors among epidemic and nonepidemic strains of Burkholderia cepacia from cystic fibrosis patients in the United Kingdom", J.Clin.Microbiol, vol. 38, no. 5, pp. 1763-1766.
Coenye, T., Mahenthiralingam, E., Henry, D., LiPuma, J. J., Laevens, S., Gillis, M., Speert, D. P., & Vandamme, P. 2001, "Burkholderia ambifaria sp. nov., a novel member of the Burkholderia cepacia complex including biocontrol and cystic fibrosis-related isolates", Int.J.Syst.Evol.Microbiol., vol. 51, no. Pt 4, pp. 1481-1490.
Coenye, T., Schouls, L. M., Govan, J. R., Kersters, K., & Vandamme, P. 1999, "Identification of Burkholderia species and genomovars from cystic fibrosis patients by AFLP fingerprinting", Int.J.Syst.Bacteriol., vol. 49 Pt 4, pp. 1657-1666.
Coenye, T. & Vandamme, P. 2005, "Overrepresentation of immunostimulatory CpG motifs in Burkholderia genomes", J.Cyst.Fibros., vol. 4, no. 3, pp. 193-196.
Coenye, T., Vandamme, P., Govan, J. R., & LiPuma, J. J. 2001, "Taxonomy and identification of the Burkholderia cepacia complex", J.Clin. Microbiol., vol. 39, no. 10, pp. 3427-3436.
Cohen, S. P., McMurry, L. M., & Levy, S. B. 1988, "marA locus causes decreased expression of OmpF porin in multiple-antibiotic-resistant (Mar) mutants of Escherichia coli", J.Bacteriol., vol. 170, no. 12, pp. 5416-5422.
Cohen, S. P., Yan, W., & Levy, S. B. 1993, "A multidrug resistance regulatory chromosomal locus is widespread among enteric bacteria", J.Infect.Dis., vol. 168, no. 2, pp. 484-488.
209
References
Cohen, T. & Murray, M. 2004, "Modeling epidemics of multidrug-resistant M. tuberculosis of heterogeneous fitness", Nat. Med., vol. 10, no. 10, pp. 1117-1121.
Coldham, N. G., Randall, L. P., Piddock, L. J., & Woodward, M. J. 2006, "Effect of fluoroquinolone exposure on the proteome of Salmonella enterica serovar Typhimurium", J.Antimicrob.Chemother., vol. 58, no. 6, pp. 1145-1153.
Collazo, C. M. & Galan, J. E. 1996, "Requirement for exported proteins in secretion through the invasion-associated type III system of Salmonella typhimurium", Infect.Immun., vol. 64, no. 9, pp. 3524-3531.
Colten, H. R. 1990, "Screening for cystic fibrosis; public policy and personal choices", N.Engl.J.Med., vol. 322, no. 5, pp. 328-329.
Conway, B. A., Venu, V., & Speert, D. P. 2002, "Biofilm formation and acyl homoserine lactone production in the Burkholderia cepacia complex", J.Bacteriol., vol. 184, no. 20, pp. 5678-5685.
Corbett, C. R., Burtnick, M. N., Kooi, C., Woods, D. E., & Sokol, P. A. 2003, "An extracellular zinc metalloprotease gene of Burkholderia cepacia", Microbiology, vol. 149, no. Pt 8, pp. 2263-2271.
Comelis, G. R. & Wolf-Watz, H. 1997, "The Yersinia Yop virulon: a bacterial system for subverting eukaryotic cells", Mol.Microbiol., vol. 23, no. 5, pp. 861-867.
Costerton, J. W., Cheng, K. J., Geesey, G. G., Ladd, T. I., Nickel, J. C., Dasgupta, M., & Marrie, T. J. 1987, "Bacterial biofilms in nature and disease", Annu.Rev.Microbiol., vol. 41, pp. 435-464.
Costerton, J. W., Stewart, P. S., & Greenberg, E. P. 1999, "Bacterial biofilms: a common cause of persistent infections", Science, vol. 284, no. 5418, pp. 1318-1322.
Courvalin, P. 2006, "Vancomycin resistance in Gram-positive cocci", Clin.Infect.Dis., vol. 42 Suppl 1, p. S25-S34.
Cox, A. D. & Wilkinson, S. G. 1991, "Ionizing groups in lipopolysaccharides of Pseudomonas cepacia in relation to antibiotic resistance", Mol Microbiol, vol. 5, no. 3, pp.641-646.
Crane, G. J., Thomas, S. M., & Jones, M. E. 1996, "A modified Luria-Delbruck fluctuation assay for estimating and comparing mutation rates", Mutat.Res., vol. 354, no. 2, pp. 171-182.
Criswell, D., Tobiason, V. L., Lodmell, J. S., & Samuels, D. S. 2006, "Mutations conferring aminoglycoside and spectinomycin resistance in Borrelia burgdorferi", Antimicrob.Agents Chemother., vol. 50, no. 2, pp. 445-452.
Cunha, M. V., Sousa, S. A., Leitao, J. H., Moreira, L. M., Videira, P. A., & Sa-Correia, I. 2004, "Studies on the involvement of the exopolysaccharide produced by cystic fibrosis- associated isolates of the Burkholderia cepacia complex in biofilm formation and in persistence of respiratory infections", J. Clin. Microbiol, vol. 42, no. 7, pp. 3052-3058.
210
References
D'Argenio, D. A., Gallagher, L. A., Berg, C. A., & Manoil, C. 2001, "Drosophila as a model host for Pseudomonas aeruginosa infection", J.Bacteriol., vol. 183, no. 4, pp. 1466-1471.
Darling, P., Chan, M., Cox, A. D., & Sokol, P. A. 1998, "Siderophore production by cystic fibrosis isolates of Burkholderia cepacia", Infect. Immun., vol. 66, no. 2, pp. 874-877.
Darveau, R. P., Tanner, A., & Page, R. C. 1997, "The microbial challenge in periodontitis", Periodontol.., vol. 14, pp. 12-32.
Davies, A. P., Billington, O. J., Bannister, B. A., Weir, W. R., McHugh, T. D., & Gillespie, S. H. 2000, "Comparison of fitness of two isolates of Mycobacterium tuberculosis, one of which had developed multi-drug resistance during the course of treatment", J.Infect., vol. 41, no. 2, pp. 184-187.
Davies, D. G., Chakrabarty, A. M., & Geesey, G. G. 1993, "Exopolysaccharide production in Biofilms: substratum activation of alginate gene expression in Pseudomonas aerugiosa", Appl. Environ. Microbiol., vol. 59, pp. 1181-1186.
Davies, J. 1994, "Inactivation of antibiotics and the dissemination of resistance genes", Science, vol. 264, no. 5157, pp. 375-382.
Davison, J. 1999. "Genetic exchange between bacteria and environment", Plasmid, vol. 42, pp. 73-91.
De Soyza, A., Ellis, C.D., Khan, C.M., Corns, P.A. & Dermarco de Hormaeche, R, 2004, "B. cenocepacia lipopolysaccharide, lipid A and proinflammatory ability". Am. J. Respir. Crit. Care Med. vol. pp. 170, 70-77.
Dessus-Babus, S., Bebear, C. M., Charron, A., Bebear, C., & de Barbeyrac, B. 1998, "Sequencing of gyrase and topoisomerase IV quinolone-resistance-determining regions of Chlamydia trachomatis and characterization of quinolone-resistant mutants obtained in vitro", Antimicrob.Agents Chemother., vol. 42, no. 10, pp. 2474-2481.
Devaud, M., Kayser, F.H & Bachi, B. 1982. "Transposon mediated antibiotic resistance in Acinetobacter strains", Antimicrob. Agents. Chem., vol. 22, no. 2, pp. 323-329.
Dever, L.A. & Dermody, T.S. 1991. "Mechanisms of bacterial resistance to antibiotics", Arch.Intern.Med., vol. 151, no.6, pp. 886-95.
Devine, M., Moore, J.E., Xu, J., Millar, B.C., Dunbar, K., Stanley, T., Murphy, P.G., Redmond, A.O. & Elborn, J.S. 2004. "Detection of mycobacterial DNA from sputum of patients with cystic fibrosis", Ir.J.Med.Sci., vol. 173, no.2, pp. 96-98.
de Visser, J.AG.M. 2002. "The fate of microbial mutators", Microbiology, vol. 148, pp. 1247-1252.
Dhakephalkar, P. K. & Chopade, B. A. 1994, "High levels of multiple metal resistance and its correlation to antibiotic resistance in environmental isolates of Acinetobacter", Biometals, vol. 7, no. 1, pp. 67-74.
211
References
Djordjevic, D., Wiedmann, M., & McLandsborough, L. A. 2002, "Microtiter plate assay for assessment of Listeria monocytogenes biofilm formation", Appl.Environ.Microbiol., vol. 68, no. 6, pp. 2950-2958.
Dodge, J. A., Lewis, P. A., Stanton, M., & Wilsher, J. 2007, "Cystic fibrosis mortality and survival in the UK: 1947-2003", European Respiratory Journal, vol. 29, no. 3, pp. 522- 526.
Donlan, R. M. & Costerton, J. W. 2002, "Biofilms: survival mechanisms of clinically relevant microorganisms", Clin.Microbiol Rev., vol. 15, no. 2, pp. 167-193.
Drabick, J. A., Gracely, E. J., Heidecker, G. J., & LiPuma, J. J. 1996, "Survival of Burkholderia cepacia on environmental surfaces", J.Hosp.Infect., vol. 32, no. 4, pp. 267- 276.
Drake, J. W. 1991, "Constant rate of spontaneous muations in DNA based microbes", Proc.Natl.Acad.Sci.USA no. 88, pp. 7160-7164.
Drlica, K. & Hooper, D.C. 2003, "Mechanisms of Quinolone Action," in Quinolone Antimicrobial Agents, 3 edn, Hooper, D. C. & Rubenstein, E., ASM Press, WashingtonD.C., pp. 19-40.
Drlica, K. 2003, "The mutant selection window and antimicrobial resistance", J.Antimicrob. Chemother., vol. 52, no. 1, pp. 11-17.
Drlica, K. & Malik M. 2003 "Fluoroquinolones:Action and Resistance". Current Topics in Med. Chem., vol. 3, pp. 249-282.
Drlica, K. & Zhou, X 1997, "DNA gyrase, topoisomerase IV, and the 4-quinolones", Microbiol. Mol. Biol. Rev., vol. 61, no. 3, pp. 377-392.
Du Bois, S. K., Davison, A. L., & Pinney, R. J. 1995, "Epidemiology and susceptibilities to mercury preservatives of staphylococci isolated from used eye-drops preserved with thiomersal", J.Pharm.Pharmacol., vol. 47, no. 3, pp. 193-196.
Dunne, W. M., Jr. 2002, "Bacterial adhesion: seen any good biofilms lately?", Clin.Microbiol.Rev., vol. 15, no. 2, pp. 155-166.
Durso, L. M., Smith, D., & Hutkins, R. W. 2004, "Measurements of fitness and competition in commensal Escherichia coli and E. coli 0157:H7 strains", Appl.Environ.Microbiol., vol. 70, no. 11, pp. 6466-6472.
Eaves, D. J., Randall, L., Gray, D. T., Buckley, A., Woodward, M. J., White, A. P., & Piddock, L. J. 2004, "Prevalence of mutations within the quinolone resistance-determining region of gyrA, gyrB, parC, and parE and association with antibiotic resistance in quinolone-resistant Salmonella enterica", Antimicrob.Agents Chemother., vol. 48, no. 10, pp. 4012-4015.
Ednie, L. M., Jacobs, M. R., & Appelbaum, P. C. 1998, "Comparative activities of clinafloxacin against Gram-positive and negative bacteria", Antimicrob. Agents Chemother., vol. 42, no. 5, pp. 1269-1273.
212
References
Egan, J. J., McNeil, K., Bookless, B., Gould, K., Corris, P., Higenbottam, T., Webb, A. K., & Woodcock, A. A. 1994, "Post-transplantation survival of cystic fibrosis patients infected with Pseudomonas cepacia", Lancet, vol. 344, no. 8921, pp. 552-553.
Elbom, J. S., Shale, D. J., & Britton, J. R. 1991, "Cystic fibrosis: current survival and population estimates to the year 2000", Thorax, vol. 46, no. 12, pp. 881-885.
Ender, M., McCallum, N., Adhikari, R., & Berger-Bachi, B. 2004, "Fitness cost of SCCmec and methicillin resistance levels in Staphylococcus aureus", Antimicrob.Agents Chemother., vol. 48, no. 6, pp. 2295-2297.
Enne, V. I., Bennett, P. M., Livermore, D. M., & Hall, L. M. 2004, "Enhancement of host fitness by the sul2-coding plasmid p9123 in the absence of selective pressure", J.Antimicrob.Chemother., vol. 53, no. 6, pp. 958-963.
Enne, V. I., Livermore, D. M., Stephens, P., & Hall, L. M. 2001, "Persistence of sulphonamide resistance in Escherichia coli in the UK despite national prescribing restriction", Lancet, vol. 357, no. 9265, pp. 1325-1328.
Ensor, E., Humphreys, H., Peckham, D., Webster, C., & Knox, A. J. 1996, "Is Burkholderia (Pseudomonas) cepacia disseminated from cystic fibrosis patients during physiotherapy?", J. Hos. Inf., vol. 32, no. 1, pp. 9-15.
Espinoza, A. M., Chin, N. X., Novelli, A., & Neu, H. C. 1988, "Comparative in vitro activity of a new fluorinated 4-quinolone, T-3262 (A-60969)", Antimicrob.Agents Chemother., vol. 32, no. 5, pp. 663-670.
Everett, M. J., Jin, Y. F., Ricci, V., & Piddock, L. J. 1996, "Contributions of individual mechanisms to fluoroquinolone resistance in 36 Escherichia coli strains isolated from humans and animals", Antimicrob.Agents Chemother., vol. 40, no. 10, pp. 2380-2386.
Fergie, N., Bayston, R., Pearson, J. P., & Birchall, J. P. 2004, "Is otitis media with effusion a biofilm infection?", Clin.Otolaryngol.AlliedSci., vol. 29, no. 1, pp. 38-46.
Ferrero, L., Cameron, B., & Crouzet, J. 1995, "Analysis of gyrA and grlA mutations in stepwise-selected ciprofloxacin-resistant mutants of Staphylococcus aureus", Antimicrob.Agents Chemother., vol. 39, no. 7, pp. 1554-1558.
Ferrero, L., Cameron, B., Manse, B., Lagneaux, D., Crouzet, J., Famechon, A., & Blanche, F. 1994, "Cloning and primary structure of Staphylococcus aureus DNA topoisomerase IV: a primary target of fluoroquinolones", Mol.Microbiol., vol. 13, no. 4, pp. 641-653.
Finck-Barbancon, V., Goranson, J., Zhu, L., Sawa, T., Wiener-Kronish, J. P., Fleiszig, S. M., Wu, C., Mende-Mueller, L., & Frank, D. W. 1997, "ExoU expression by Pseudomonas aeruginosa correlates with acute cytotoxicity and epithelial injury", Mol.Microbiol., vol. 25, no. 3, pp. 547-557.
Fluit, A. C., Wielders, C. L., Verhoef, J., & Schmitz, F. J. 2001, "Epidemiology and susceptibility of 3,051 Staphylococcus aureus isolates from 25 university hospitals participating in the European SENTRY study", J.Clin.Microbiol, vol. 39, no. 10, pp. 3727-3732.
213
References
Fraser, C. M., Norris, S. J., Weinstock, G. M., White, O., Sutton, G. G., Dodson, R., Gwinn, M., Hickey, E. K., Clayton, R., Ketchum, K. A., Sodergren, E., Hardham, J. M., McLeod, M. P., Salzberg, S., Peterson, J., Khalak, H., Richardson, D., Howell, J. K., Chidambaram, M., Utterback, T., McDonald, L., Artiach, P., Bowman, C., Cotton, M. D., Fujii, C., Garland, S., Hatch, B., Horst, K., Roberts, K., Sandusky, M., Weidman, J., Smith, H. O., & Venter, J. C. 1998, "Complete genome sequence of Treponema pallidum, the syphilis spirochete", Science, vol. 281, no. 5375, pp. 375-388.
Furet, Y. X., Deshusses, J., & Pechere, J. C. 1992, "Transport of pefloxacin across the bacterial cytoplasmic membrane in quinolone-susceptible Staphylococcus aureus", Antimicrob.Agents Chemother., vol. 36, no. 11, pp. 2506-2511.
Gagneux, S., Long, C. D., Small, P. M., Van, T., Schoolnik, G. K., & Bohannan, B. J. 2006, "The competitive cost of antibiotic resistance in Mycobacterium tuberculosis", Science, vol. 312, no. 5782, pp. 1944-1946.
Gangoue-Pieboji, J., Bedenic, B., Koulla-Shiro, S., Randegger, C., Adiogo, D., Ngassam, P., Ndumbe, P., & Hachler, H. 2005, "Extended-spectrum-beta-lactamase-producing Enterobacteriaceae in Yaounde, Cameroon", J.Clin.Microbiol, vol. 43, no. 7, pp. 3273- 3277.
Garcia-Rey, C., Martin-Herrero, J. E., & Baquero, F. 2006, "Antibiotic consumption and generation of resistance in Streptococcus pneumoniae: the paradoxical impact of quinolones in a complex selective landscape", Clin.Microbiol.Infect., vol. 12 Suppl 3, pp. 55-66.
Garrido, M. C., Herrero, M., Kolter, R., & Moreno, F. 1988, "The export of the DNA replication inhibitor Microcin B17 provides immunity for the host cell", EMBO J., vol. 7, no. 6, pp. 1853-1862.
Gee, J. E., Sacchi, C. T., Glass, M. B., De, B. K., Weyant, R. S., Levett, P. N., Whitney, A. M., Hoffmaster, A. R., & Popovic, T. 2003, "Use of 16S rRNA gene sequencing for rapid identification and differentiation of Burkholderia pseudomallei and B. mallei", J.Clin.Microbiol., vol. 41, no. 10, pp. 4647-4654.
Gellert, M., Mizuuchi, K., O'Dea, M. H., Itoh, T., & Tomizawa, J. I. 1977, "Nalidixic acid resistance: a second genetic character involved in DNA gyrase activity",Proc.Natl.Acad.Sci. U.S.A, vol. 74, no. 11, pp. 4772-4776.
Gellert, M., Mizuuchi, K., O'Dea, M. H., & Nash, H. A. 1976, "DNA gyrase: an enzyme that introduces superhelical turns into DNA", Proc.Natl.Acad.Sci.U.S.A, vol. 73, no. 11, pp. 3872-3876.
George, A. M. & Levy, S. B. 1983, "Amplifiable resistance to tetracycline, chloramphenicol, and other antibiotics in Escherichia coli: involvement of a non-plasmid- determined efflux of tetracycline", J.Bacteriol., vol. 155, no. 2, pp. 531-540.
Gerding, D. N., Larson, T. A., Hughes, R. A., Weiler, M., Shanholtzer, C., & Peterson, L. R. 1991, "Aminoglycoside resistance and aminoglycoside usage: ten years of experience in one hospital", Antimicrob.Agents Chemother., vol. 35, no. 7, pp. 1284-1290.
214
References
Gessner, A. R. & Mortensen, J. E. 1990, "Pathogenic factors of Pseudomonas cepacia isolates from patients with cystic fibrosis", J.Med.Microbiol., vol. 33, no. 2, pp. 115-120.
Geesey, G. G. 2001, "Bacterial behavior at surfaces", Curr.Opin.Microbiol., vol. 4, no. 3, pp. 296-300.
Gibson, R. L., Bums, J. L., & Ramsey, B. W. 2003, "Pathophysiology and management of pulmonary infections in cystic fibrosis", Am.J.Respir.Crit Care Med., vol. 168, no. 8, pp. 918-951.
Gillespie, S. H. 2001, "Antibiotic resistance in the absence of selective pressure", Int. J.Antimicrob.Agents, vol. 17, no. 3, pp. 171-176.
Gillespie, S. H., Basu, S., Dickens, A. L., O'Sullivan, D. M., & McHugh, T. D. 2005, "Effect of subinhibitory concentrations of ciprofloxacin on Mycobacterium fortuitum mutation rates", J.Antimicrob.Chemother., vol. 56, no. 2, pp. 344-348.
Gillespie, S. H., Billington, O. J., Breathnach, A., & McHugh, T. D. 2002, "Multiple drug- resistant Mycobacterium tuberculosis: evidence for changing fitness following passage through human hosts", Microb.Drug Resist., vol. 8, no. 4, pp. 273-279.
Gillespie, S. H. & McHugh, T. D. 1997, "The biological cost of antimicrobial resistance",Trends Microbiol, vol. 5, no. 9, pp. 337-339.
Gillespie, S. H., Voelker, L. L., Ambler, J. E., Traini, C., & Dickens, A. 2003,"Fluoroquinolone resistance in Streptococcus pneumoniae:Q\idence that gyrA mutationsarise at a lower rate and that mutation in gyrA or parC predisposes to further mutation", Microbial Drug Resistance, vol. 9, pp. 17-24.
Gillespie, S. H., Voelker, L. L., & Dickens, A. 2002, "Evolutionary barriers to quinolone resistance in Streptococcus pneumoniae", Microb.Drug Resist., vol. 8, no. 2, pp. 79-84.
Gilligan, P. H. 1991, "Microbiology of airway disease in patients with cystic fibrosis", Clin.Microbiol.Rev., vol. 4, no. 1, pp. 35-51.
Gilligan, P. H., Gage, P. A., Welch, D. F., Muszynski, M. J., & Wait, K. R. 1987, "Prevalence of thymidine-dependent Staphylococcus aureus in patients with cystic fibrosis", J.Clin.Microbiol., vol. 25, no. 7, pp. 1258-1261.
Gillis, M., Van Van, T., Bardin, R., Goor, M., Hebbar, P., Williams, A., Segers, P., & Kersters, K. 1995, "Polyphasic taxonomy in the genus Burkholderia leading to an amended description of the genus and proposition of Burkholderia vietnamensis sp. nov for nitrogen fixing isolates from rice in Vietnam", International Journal o f Systemic and Evolutionary Microbiology, vol. 45, pp. 274-289.
Giraud, E., Cloeckaert, A., Baucheron, S., Mouline, C., & Chaslus-Dancla, E. 2003, "Fitness cost of fluoroquinolone resistance in Salmonella enterica serovar Typhimurium", J.Med.Microbiol, vol. 52, no. Pt 8, pp. 697-703.
Giraud, A., Matic, I., Tenaillon, O., Clara, A., Radman, M., Fons, M., & Taddei, F. 2001, "Costs and benefits of high mutation rates: adaptive evolution of bacteria in the mouse gut", Science, vol. 291, no. 5513, pp. 2606-2608.
215
References
Glendinning, K. J., Parsons, Y. N., Duangsonk, K., Hales, B. A., Humphreys, D., Hart, C.A., & Winstanley, C. 2004, "Sequence divergence in type III secretion gene clusters of the Burkholderia cepacia complex", FEMSMicrobiol Lett., vol. 235, no. 2, pp. 229-235.
Goldman, M. J., Anderson, G. M., Stolzenberg, E. D., Kari, U. P., Zasloff, M., & Wilson, J. M. 1997, "Human beta-defensin-1 is a salt-sensitive antibiotic in lung that is inactivated in cystic fibrosis", Cell, vol. 88, no. 4, pp. 553-560.
Gonzalez, C. F. & Vidaver, A. K. 1979, "Bacteriocin, plasmid and pectolytic diversity in Pseudomonas cepacia of clinical and plant origin", J.Gen.Microbiol, vol. 110, no. 1, pp. 161-170.
Gootz, T. D. & Martin, B. A. 1991, "Characterization of high-level quinolone resistance in Campylobacter jejuni", Antimicrob.Agents Chemother., vol. 35, no. 5, pp. 840-845.
Goss, W. A., Deitz, W. H., & Cook, T. M. 1964, "Mechanism of action of nalidixic acid on Escherchia coli", J.Bacteriol., vol. 88, pp. 1112-1118.
Gotschlich, A., Huber, B., Geisenberger, O., Togl, A., Steidle, A., Riedel, K., Hill, P., Tummler, B., Vandamme, P., Middleton, B., Camara, M., Williams, P., Hardman, A., & Eberl, L. 2001, "Synthesis of multiple N-acylhomoserine lactones is wide-spread among the members of the Burkholderia cepacia complex", Syst.Appl.Microbiol., vol. 24, no. 1, pp. 1-14.
Gotz, A., Pukall, R., Smit, E., Tietze, E., Prager, R., Tschape, H., van Elsas, J. D., & Smalla, K. 1996, "Detection and characterization of broad-host-range plasmids in environmental bacteria by PCR", Appl.Environ.Microbiol., vol. 62, no. 7, pp. 2621-2628.
Govan, J. R., Brown, P. H., Maddison, J., Doherty, C. J., Nelson, J. W., Dodd, M., Greening, A. P., & Webb, A. K. 1993, "Evidence for transmission of Pseudomonas cepacia by social contact in cystic fibrosis", Lancet, vol. 342, no. 8862, pp. 15-19.
Govan, J. R. & Deretic, V. 1996, "Microbial pathogenesis in cystic fibrosis: mucoid Pseudomonas aeruginosa and Burkholderia cepacia", Microbiol.Rev., vol. 60, no. 3, pp. 539-574.
Govan, J. R. & Nelson, J. W. 1993, "Microbiology of cystic fibrosis lung infections: themes and issues", J.R.Soc.Med., vol. 86 Suppl 20, pp. 11-18.
Govan, J. R. & Vandamme, P. 1998, "Agricultural and medical microbiology: a time for bridging gaps", Microbiology, vol. 144, pp. 2373-2375.
Griffiths, A. J. F., Gelbert, W. M., Lewontin, R. C., Wessler, S. R., Suzuki, D. T. and Miller J. H. 2000. "An Introduction to Genetic Analysis", 7th ed, W.H. Freeman and Company.
Griffiths, F. 1928, "The significance of pneumococcal types", Journal o f Hygiene (Lond), vol. 27, pp. 113-159.
Guiney, D. G., Jr. 1984, "Promiscuous transfer of drug resistance in Gram-negative bacteria", J.Infect.Dis., vol. 149, no. 3, pp. 320-329.
216
References
Gustafsson, I., Cars, O., & Andersson, D. I. 2003, "Fitness of antibiotic resistant Staphylococcus epidermidis assessed by competition on the skin of human volunteers", J.Antimicrob.Chemother., vol. 52, no. 2, pp. 258-263.
Gustafsson, I., Sjolund, M., Torell, E., Johannesson, M., Engstrand, L., Cars, O., & Andersson, D. I. 2003, "Bacteria with increased mutation frequency and antibiotic resistance are enriched in the commensal flora of patients with high antibiotic usage", J.Antimicrob. Chemother., vol. 52, no. 4, pp. 645-650.
Hachler, H., Cohen, S. P., & Levy, S. B. 1991, "marA, a regulated locus which controls expression of chromosomal multiple antibiotic resistance in Escherichia coli", J.Bacteriol., vol. 173, no. 17, pp. 5532-5538.
Hales, B. A., Morgan, J. A., Hart, C. A., & Winstanley, C. 1998, "Variation in flagellin genes and proteins of Burkholderia cepacia", J.Bacteriol., vol. 180, no. 5, pp. 1110-1118.
Hall-Stoodley, L., Hu, F. Z., Gieseke, A., Nistico, L., Nguyen, D., Hayes, J., Forbes, M., Greenberg, D. P., Dice, B., Burrows, A., Wackym, P. A., Stoodley, P., Post, J. C., Ehrlich, G. D., & Kerschner, J. E. 2006, "Direct detection of bacterial biofilms on the middle-ear mucosa of children with chronic otitis media", JAMA, vol. 296, no. 2, pp. 202-211.
Hallett, P. & Maxwell, A. 1991, "Novel quinolone resistance mutations of the Escherichia coli DNA gyrase A protein: enzymatic analysis of the mutant proteins", Antimicrob.Agents Chemother., vol. 35, no. 2, pp. 335-340.
Hakanen, A., Siitonen, A., Kotilainen, P. & Huonnen, P. 1999. Increasing fluoroquinolone resistance in Salmonella serotypes in Finland during 1995-1997. J.Antimicrob. Agents., vol. 43, pp. 145-148.
Hancock, R. E. 1998, "Resistance mechanisms in Pseudomonas aeruginosa and other nonfermentative gram-negative bacteria", Clin.Infect.Dis., vol. 27 Suppl 1, p. S93-S99.
Hanzelka, B. L. & Greenberg, E. P. 1995, "Evidence that the N-terminal region of the Vibrioflscheri LuxR protein constitutes an autoinducer-binding domain", J.Bacteriol., vol. 177, no. 3, pp. 815-817.
Harnett, N., McLeod, S., AuYong, Y., Wan, J., Alexander, S., Khakhria, R., & Krishnan,C. 1998, "Molecular characterization of multiresistant strains of Salmonella typhi from South Asia isolated in Ontario, Canada", Can. J.Microbiol., vol. 44, no. 4, pp. 356-363.
Harris, M. 1971, "Mutation rates in cells at different ploidy levels", J.Cell Physiol, vol. 78, no. 2, pp. 177-184.
Hart, C. A. & Winstanley, C. 2002, "Persistent and aggressive bacteria in the lungs of cystic fibrosis children", Br.Med.Bull., vol. 61, pp. 81-96.
Harwig, S. S., Waring, A., Yang, H. J., Cho, Y., Tan, L., & Lehrer, R. I. 1996, "Intramolecular disulfide bonds enhance the antimicrobial and lytic activities of protegrins at physiological sodium chloride concentrations", Eur.J.Biochem., vol. 240, no. 2, pp. 352- 357.
217
References
Hata, M., Suzuki, M., Matsumoto, M., Takahashi, M., Sato, K., Ibe, S., & Sakae, K. 2005, "Cloning of a novel gene for quinolone resistance from a transferable plasmid in Shigella flexneri", Antimicrob.Agents Chemother., vol. 49, no. 2, pp. 801-803.
Henderson-Begg, S. K., Livermore, D. M., & Hall, L. M. 2006, "Effect of subinhibitory concentrations of antibiotics on mutation frequency in Streptococcus pneumoniae", J.Antimicrob.Chemother., vol. 57, no. 5, pp. 849-854.
Hendrickson, H., Slechta, E. S., Bergthorsson, U., Andersson, D. I., & Roth, J. R. 2002, "Amplification-mutagenesis: evidence that "directed" adaptive mutation and general hypermutability result from growth with a selected gene amplification", Proc.Natl.AcadSci.U.S.A, vol. 99, no. 4, pp. 2164-2169.
Hendry, J., Elbom, J.S., Nixon, L., Shale, D.J. & Webb, A.K. 1999. "Cystic fibrosis: inflammatory response to infection with Burkholderia cepacia and Pseudomonas aeruginosa". Eur. Respir. J., vol. 14, pp. 435-438.
Hengtrakool, C., Pearson, G. J., & Wilson, M. 2006, "Interaction between GIC and S. sanguis biofilms: antibacterial properties and changes of surface hardness", J.Dent., vol. 34, no. 8, pp. 588-597.
Henry, D. A., Campbell, M. E., LiPuma, J. J., & Speert, D. P. 1997, "Identification of Burkholderia cepacia isolates from patients with cystic fibrosis and use of a simple new selective medium", J.Clin.Microbiol., vol. 35, no. 3, pp. 614-619.
Hogberg, L., Ekdahl, K., Sjostrom, K., Olsson-Liljequist, B., Walder, M., Melander, E., Ringberg, H., & Normark, B. H. 2006, "Penicillin-resistant pneumococci in Sweden 1997- 2003: increased multiresistance despite stable prevalence and decreased antibiotic use", Microb.Drug Resist., vol. 12, no. l,p p . 16-22.
Hodgson, A. E., Nelson, S. M., Brown, M. R., & Gilbert, P. 1995, "A simple in vitro model for growth control of bacterial biofilms", J.Appl.Bacteriol., vol. 79, no. 1, pp. 87- 93.
Holden, M. T., Titball, R. W., Peacock, S. J., Cerdeno-Tarraga, A. M., Atkins, T., Crossman, L. C., Pitt, T., Churcher, C., Mungall, K., Bentley, S. D., Sebaihia, M., Thomson, N. R., Bason, N., Beacham, I. R., Brooks, K., Brown, K. A., Brown, N. F., Challis, G. L., Cherevach, I., Chillingworth, T., Cronin, A., Crossett, B., Davis, P., DeShazer, D., Feltwell, T., Fraser, A., Hance, Z., Hauser, H., Holroyd, S., Jagels, K., Keith, K. E., Maddison, M., Moule, S., Price, C., Quail, M. A., Rabbinowitsch, E., Rutherford, K., Sanders, M., Simmonds, M., Songsivilai, S., Stevens, K., Tumapa, S., Vesaratchavest, M., Whitehead, S., Yeats, C., Barrell, B. G., Oyston, P. C., & Parkhill, J. 2004, "Genomic plasticity of the causative agent of melioidosis, Burkholderia pseudomallei", Proc.Natl.Acad.Sci. U.S.A, vol. 101, no. 39, pp. 14240-14245.
Holmes, A., Nolan, R., Taylor, R., Finley R., Riley, M., Jiang, R.Z., Steinbach, S. & Goldstein, R. 1999. "An epidemic of Burkholderia cepacia transmitted between patients with and without cystic fibrosis". J. Infect. Dis., vol 179, pp. 1197-1205.
Hooper, D. C. 1998, "Clinical applications of quinolones", Biochim.Biophys.Acta, vol. 1400, no. 1-3, pp. 45-61.
218
References
Honraet, K. & Nelis, H. J. 2006, "Use of the modified robbins device and fluorescent staining to screen plant extracts for the inhibition of S. mutans biofilm formation", J.Microbiol.Methods, vol. 64, no. 2, pp. 217-224.
Hope, C. K. & Wilson, M. 2006, "Biofilm structure and cell vitality in a laboratory model of subgingival plaque", J.Microbiol.Methods, vol. 66, no. 3, pp. 390-398.
Hope, C. K. & Wilson, M. 2003, "Measuring the thickness of an outer layer of viable bacteria in an oral biofilm by viability mapping", J.Microbiol.Methods, vol. 54, no. 3, pp. 403-410.
Hooper, D. C. 2003, "Resistance to Quinolones," in Quinolone Antimicrobial Agents, 3 edn, E. Hooper D.C.& Rubenstein, ed., ASM Press, Washington, D.C.
Hoyle, B. D., Williams, L. J. and Costerton, J.W. 1993, "Production of mucoid exopolysaccharide during development of Pseudomonas aeruginosa biofilms", Infect.Immun. vol. 61, no. 2, pp. 777-780.
Huang, C. T., Xu, K. D., McFeters, G. A., & Stewart, P. S. 1998, "Spatial Patterns of Alkaline Phosphatase Expression within Bacterial Colonies and Biofilms in Response to Phosphate Starvation", Applied and Environmental Microbiology, vol. 64, no. 4, pp. 1526- 1531.
Huber, B., Riedel, K., Hentzer, M., Heydom, A., Gotschlich, A., Givskov, M., Molin, S., & Eberl, L. 2001, "The cep quorum-sensing system of Burkholderia cepacia H i l l controls biofilm formation and swarming motility", Microbiology, vol. 147, no. Pt 9, pp. 2517-2528.
Hughes, D. & Anderssen D.I. 1997. "Carbon starvation of Salmonella typhimurium does not cause a general increase of mutation rates", J. Bacteriol., vol. 11, pp. 6688-6691.
Hurdle, J. G., O'Neill, A. J., & Chopra, I. 2004, "The isoleucyl-tRNA synthetase mutation V588F conferring mupirocin resistance in glycopeptide-intermediate Staphylococcus aureus is not associated with a significant fitness burden", J.Antimicrob. Chemother., vol. 53, no. 1, pp. 102-104.
Hurdle, J. G., O'Neill, A. J., Ingham, E., Fishwick, C., & Chopra, I. 2004, "Analysis of mupirocin resistance and fitness in Staphylococcus aureus by molecular genetic and structural modeling techniques", Antimicrob.Agents Chemother., vol. 48, no. 11, pp. 4366- 4376.
Hutchinson, G. R., Parker, S., Pryor, J. A., Duncan-Skingle, F., Hoffman, P. N., Hodson, M. E., Kaufmann, M. E., & Pitt, T. L. 1996, "Home-use nebulizers: a potential primary source of Burkholderia cepacia and other colistin-resistant, gram-negative bacteria in patients with cystic fibrosis", J.Clin.Microbiol., vol. 34, no. 3, pp. 584-587.
Hutchison, M. L., Poxton, I. R., & Govan, J. R. 1998, "Burkholderia cepacia produces a hemolysin that is capable of inducing apoptosis and degranulation of mammalian phagocytes", Infect.Immun., vol. 66, no. 5, pp. 2033-2039.
219
References
Hyde, J. A., Darouiche, R. O., & Costerton, J. W. 1998, "Strategies for prophylaxis against prosthetic valve endocarditis: a review article", J.Heart Valve Dis., vol. 7, no. 3, pp. 316-326.
Ince, D. & Hooper, D. C. 2003, "Quinolone resistance due to reduced target enzyme expression", J.Bacteriol., vol. 185, no. 23, pp. 6883-6892.
Ishida, H., Ishida, Y., Kurosaka, Y., Otani, T., Sato, K., & Kobayashi, H. 1998, "In vitro and in vivo activities of levofloxacin against biofilm-producing Pseudomonas aeruginosa", Antimicrob.Agents Chemother., vol. 42, no. 7, pp. 1641-1645.
Isles, A., Maclusky, I., Corey, M., Gold, R., Prober, C., Fleming, P., & Levison, H. 1984, "Pseudomonas cepacia infection in cystic fibrosis: an emerging problem", J.Pediatr., vol. 104, no. 2, pp. 206-210.
Jacoby, G. A., Chow, N., & Waites, K. B. 2003, "Prevalence of plasmid-mediated quinolone resistance", Antimicrob.Agents Chemother., vol. 47, no. 2, pp. 559-562.
Jacoby, G. A., Walsh, K. E., Mills, D. M., Walker, V. J., Oh, H., Robicsek, A., & Hooper,D. C. 2006, "qnrB, another plasmid-mediated gene for quinolone resistance", Antimicrob.Agents Chemother., vol. 50, no. 4, pp. 1178-1182.
Jander, G., Rahme, L. G., & Ausubel, F. M. 2000, "Positive correlation between virulence of Pseudomonas aeruginosa mutants in mice and insects", J.Bacteriol., vol. 182, no. 13, pp. 3843-3845.
Jarvis, K. G., Giron, J. A., Jerse, A. E., McDaniel, T. K., Donnenberg, M. S., & Kaper, J.B. 1995, "Enteropathogenic Escherichia coli contains a putative type III secretion system necessary for the export of proteins involved in attaching and effacing lesion formation", Proc.Natl.Acad.Sci. U.S.A, vol. 92, no. 17, pp. 7996-8000.
Johnsborg, O., Eldholm, V & Havarstien, L.S. 2007 "Natural genetic transformation: prevalence, mechanisms and function", Res.Micobiol., In press.
Johnson, C. N., Briles, D. E., Benjamin, W. H., Jr., Hollingshead, S. K., & Waites, K. B. 2005, "Relative fitness of fluoroquinolone-resistant Streptococcus pneumoniae", Emerg.Infect.Dis., vol. 11, no. 6, pp. 814-820.
Johnston, R. B., Jr. 2001, "Clinical aspects of chronic granulomatous disease", Curr.Opin.Hematol., vol. 8, no. 1, pp. 17-22.
Jones, A., Dodd, M., Govan, J., Barcus, V., Doherty, C., Morris, J., & Webb, A. 2004."Burkholderia cenocepacia and Burkholderia multivorans: influence on survival in cystic fibrosis", Thorax, vol 59, no 11, pp 948-951.
Jones, M. E., Sahm, D. F., Martin, N., Scheuring, S., Heisig, P., Thomsberry, C., Kohrer, K., & Schmitz, F. J. 2000, "Prevalence of gyrA, gyrB, parC, and parE mutations in clinical isolates of Streptococcus pneumoniae with decreased susceptibilities to different fluoroquinolones and originating from Worldwide Surveillance Studies during the 1997- 1998 respiratory season", Antimicrob.Agents Chemother., vol. 44, no. 2, pp. 462-466.
220
References
Jones, M. E., Thomas, S. M. & Rogers, A. 1994, "Luria-Delbruck fluctuation experiments: design and analysis", Genetics, vol. 136, no. 3, pp. 1209-1216.
Jonsson, V. 1970, "Proposal of a new species of Pseudomonas kingii", Int.JSyst.Bacteriol., vol. 20, pp. 255-257.
Jordon, P.W, Stanley, T., Donnelly, F.M., Elbom, J.S., McClurg, R.B., Millar, B.C., C.E. Goldsmith & Moore, J.E. 2007. "Atypical mycobacterial infection in patients with cystic fibrosis: update on clinical microbiology methods", Letters in Applied Microbiology, vol 44, pp. 459-466.
Kadurugamuwa, J. L., Sin, L., Albert, E., Yu, J., Francis, K., DeBoer, M., Rubin, M., Bellinger-Kawahara, C., Parr, J. T., Jr., & Contag, P. R. 2003, "Direct continuous method for monitoring biofilm infection in a mouse model", Infect.Immun., vol. 71, no. 2, pp. 882-890.
Kadurugamuwa, J. L., Sin, L. V., Yu, J., Francis, K. P., Kimura, R., Purchio, T., & Contag, P. R. 2003, "Rapid direct method for monitoring antibiotics in a mouse model of bacterial biofilm infection", Antimicrob.Agents Chemother., vol. 47, no. 10, pp. 3130- 3137.
Kaitwatcharachai, C., Silpapojakul, K., Jitsurong, S., & Kalnauwakul, S. 2000, "An outbreak of Burkholderia cepacia bacteremia in hemodialysis patients: an epidemiologic and molecular study", Am. J.Kidney Dis., vol. 36, no. 1, pp. 199-204.
Karpati, F. & Jonasson, J. 1996, "Polymerase chain reaction for the detection of Pseudomonas aeruginosa, Stenotrophomonas maltophilia and Burkholderia cepacia in sputum of patients with cystic fibrosis", Mol. Cell Probes, vol. 10, no. 6, pp. 397-403.
Kato, J., Nishimura, Y., Imamura, R., Niki, H., Hiraga, S., & Suzuki, H. 1990, "New topoisomerase essential for chromosome segregation in E. coli", Cell, vol. 63, no. 2, pp. 393-404.
Kendal, W. S. & Frost, P. 1988, "Pitfalls and practice of Luria-Delbruck fluctuation analysis: a review", Cancer Res., vol. 48, no. 5, pp. 1060-1065.
Kepler, T. B. & Oprea, M. 2001, "Improved inference of mutation rates: I. An integral representation for the Luria-Delbruck distribution", Theor.Popul.Biol., vol. 59, no. 1, pp. 41-48.
Kern, W. V., Oethinger, M., Jellen-Ritter, A. S., & Levy, S. B. 2000, "Non-target gene mutations in the development of fluoroquinolone resistance in Escherichia coli", Antimicrob.Agents Chemother., vol. 44, no. 4, pp. 814-820.
Khan, S.A., Everest, P, Serves, S, Foxwell, N, Zahrige, U., Brade, H., Rietschel, E.T., Dougan, G., Charles, I.G. Masked, D.J. "A lethal role for lipid A in Salmonella infections". Mol. Microbiol. 1998; 571-529.
Kingston, C. W. 1971, "Chronic or latent melioidosis", Med.J.Aust., vol. 2, no. 12, pp. 618-621.
221
References
Kishony, R. & Leibler, S. 2003, "Environmental stresses can alleviate the average deleterious effect of mutations", J.Biol., vol. 2, no. 2, pp. 14.
Kiska, D. L., Kerr, A., Jones, M. C., Caracciolo, J. A., Eskridge, B., Jordan, M., Miller, S., Hughes, D., King, N., & Gilligan, P. H. 1996, "Accuracy of four commercial systems for identification of Burkholderia cepacia and other gram-negative nonfermenting bacilli recovered from patients with cystic fibrosis", J.Clin.Microbiol., vol. 34, no. 4, pp. 886-891.
Knothe, H., Shah, P., Krcmery, V., Antal, M., & Mitsuhashi, S. 1983, "Transferable resistance to cefotaxime, cefoxitin, cefamandole and cefuroxime in clinical isolates of Klebsiella pneumoniae and Serratia marcescens", Infection, vol. 11, pp. 315-317.
Koch, A. L. 1982, "Mutation and growth rates from Luria-Delbruck fluctuation tests 28", Mutat.Res., vol. 95, pp. 129-143.
Koch, C. & Hoiby, N. 1993, "Pathogenesis of cystic fibrosis", Lancet, vol. 341, no. 8852, pp. 1065-1069.
Kohler, T., M. Michea-Hamzehpour, P. Plesiat, A. L. Kahr, & Pechere, J.C. 1997. "Differential selection of multidrug efflux systems by quinolones in Pseudomonas aeruginosa". Antimicrob. Agents Chemother., vol. 141, pp. 2540-2543
Kolar, M., Urbanek, K., Vagnerova, I., & Koukalova, D. 2006, "The influence of antibiotic use on the occurrence of vancomycin-resistant enterococci", J.Clin.Pharm.Ther., vol. 31, no. 1, pp. 61-12.
Komp, L. P., Marcusson, L. L., Sandvang, D., Frimodt-Moller, N., & Hughes, D. 2005, "Biological cost of single and multiple norfloxacin resistance mutations in Escherichia coli implicated in urinary tract infections", Antimicrob.Agents Chemother., vol. 49, no. 6, pp. 2343-2351.
Kooi, C., Subsin, B., Chen, R., Pohorelic, B., & Sokol, P. A. 2006, "Burkholderia cenocepacia ZmpB is a broad-specificity zinc metalloprotease involved in virulence", Infect.Immun., vol. 74, no. 7, pp. 4083-4093.
Kothe, M., Anti, M., Huber, B., Stoecker, K., Ebrecht, D., Steinmetz, I., & Eberl, L. 2003, "Killing of Caenorhabditis elegans by Burkholderia cepacia is controlled by the cep quorum-sensing system", Cell Microbiol., vol. 5, no. 5, pp. 343-351.
Kresken, M. & Wiedemann, B. 1988, "Development of resistance to nalidixic acid and the fluoroquinolones after the introduction of norfloxacin and ofloxacin", Antimicrob.Agents Chemother., vol. 32, no. 8, pp. 1285-1288.
Kugelberg, E., Lofmark, S., Wretlind, B., & Andersson, D. I. 2005, "Reduction of the fitness burden of quinolone resistance in Pseudomonas aeruginosa", J.Antimicrob.Chemother., vol. 55, no. 1, pp. 22-30.
Kumon, H., Tomochika, K., Matunaga, T., Ogawa, M., & Ohmori, H. 1994, "A sandwich cup method for the penetration assay of antimicrobial agents through Pseudomonas exopolysaccharides", Microbiol Immunol., vol. 38, no. 8, pp. 615-619.
222
References
Lacey, R. W. 1984, "Evolution of microorganisms and antibiotic resistance", Lancet, vol. 2, no. 8410, pp. 1022-1025.
Lafleur, M., Kumamoto, C & Lewis, K. 2006. "Candida albicans biofilms produce antifungal-tolerant persister cells", Antimicrob. Agents Chemo., vol. 50., pp. 3839-3846.
Lam, J., Chan, R., Lam, K., & Costeron, J. W. 1980, "Production of mucoid microcolonies by Pseudomonas aeruginosa within infected lungs in cystic fibrosis", Infect.Immun., vol. 28, pp. 546-556.
Lamfon, H., Porter, S. R., McCullough, M., & Pratten, J. 2003, "Formation of Candida albicans biofilms on non-shedding oral surfaces", Eur.J.Oral Sci., vol. 111, no. 6, pp. 465- 471.
Langley, R., Kenna, D. T., Vandamme, P., Ure, R., & Govan, J. R. 2003, "Lysogeny and bacteriophage host range within the Burkholderia cepacia complex", J.Med.Microbiol., vol. 52, no. Pt 6, pp. 483-490.
Latifi, A., Winson, M. K., Foglino, M., Bycroft, B. W., Stewart, G. S., Lazdunski, A., & Williams, P. 1995, "Multiple homologues of LuxR and LuxI control expression of virulence determinants and secondary metabolites through quorum sensing in Pseudomonas aeruginosa PAOl", Mol.Microbiol., vol. 17, no. 2, pp. 333-343.
Laurent, F., Lelievre, H., Cornu, M., Vandenesch, F., Carret, G., Etienne, J., & Flandrois, J. P. 2001, "Fitness and competitive growth advantage of new gentamicin-susceptible MRSA clones spreading in French hospitals", J.Antimicrob.Chemother., vol. 47, no. 3, pp. 277-283.
Lawrence, J. G. & Ochman, H. 1997, "Amelioration of bacterial genomes: rates of change and exchange", J.Mol Evol., vol. 44, no. 4, pp. 383-397.
Lea, D. & Coulson, C. 1949, "The distribution of the number of mutants in bacterial populations", Genetics, vol. 49, pp. 264-285.
LeClerc, J. E., Li, B., & Payne, W. L. 1996, "High mutation frequencies among Escherichia coli and Salmonella pathogens", Science, vol. 274, pp. 1208-1211.
LeClerc, J. E., Payne, W. L., Kupchella, E., & Cebula, T. A. 1998, "Detection of mutator subpopulations in Salmonella typhimurium LT2 by reversion of his alleles", Mutat.Res., vol. 400, no. 1-2, pp. 89-97.
Lederberg, J. & Lederberg, E.M. 1952. "Replica plating and indirect selection of bacterial mutants", J.Bacteriol. vol. 63, no 3 pp. 399-406.
Ledson, M. J., Gallagher, M. J., Jackson, M., Hart, C. A., & Walshaw, M. J. 2002, "Outcome of Burkholderia cepacia colonisation in an adult cystic fibrosis centre", Thorax, vol. 57, no. 2, pp. 142-145.
Lee, J. K., Lee, Y. S., Park, Y. K., & Kim, B. S. 2005, "Alterations in the GyrA and GyrB subunits of topoisomerase II and the ParC and ParE subunits of topoisomerase IV in ciprofloxacin-resistant clinical isolates of Pseudomonas aeruginosa", Int. J.Antimicrob.Agents, vol. 25, no. 4, pp. 290-295.
223
References
Lee, S. M., Ender, M., Adhikari, R., Smith, J. M., Berger-Bachi, B., & Cook, G. M. 2007, "Fitness cost of staphylococcal cassette chromosome mec in methicillin-resistant Staphylococcus aureus by way of continuous culture", Antimicrob.Agents Chemother., vol. 51, no. 4, pp. 1497-1499.
Lee, S. W. & Edlin, G. 1985, "Expression of tetracycline resistance in pBR322 derivatives reduces the reproductive fitness of plasmid-containing Escherichia coli", Gene, vol. 39, no. 2-3, pp. 173-180.
Lenski, R. E. & Bouma, J. E. 1987, "Effects of segregation and selection on instability of plasmid pACYC184 in Escherichia co li", J.Bacteriol., vol. 169, no. 11, pp. 5314-5316.
Lenski, R. E., Mongold, J. A., Sniegowski, P. D., Travisano, M., Vasi, F., Gerrish, P. J., & Schmidt, T. M. 1998, "Evolution of competitive fitness in experimental populations of E. coli: what makes one genotype a better competitor than another?", Antonie Van Leeuwenhoek, vol. 73, no. 1, pp. 35-47.
Lenski, R. E., Simpson, S. C., & Nguyen, T. T. 1994, "Genetic analysis of a plasmid- encoded, host genotype-specific enhancement of bacterial fitness", J.Bacteriol., vol. 176, no. 11, pp. 3140-3147.
Lenski, R. E., Slatkin, M., & Ayala, F. J. 1989, "Mutation and selection in bacterial populations: alternatives to the hypothesis of directed mutation",Proc.Natl.Acad.Sci. U.S.A, vol. 86, no. 8, pp. 2775-2778.
Leung, J. W., Sung, J. Y., & Costerton, J. W. 1989, "Bacteriological and electron microscopy examination of brown pigment stones", J.Clin.Microbiol., vol. 27, no. 5, pp. 915-921.
Leverstein-van Hall, M. A., Block ,M., Paauw, A., Fluit, A. C., & Verhoef, J. 2003, "Multidrug resistance among Enterobacteriaceae is strongly associated with the presence of integrons and is independent of species or isolate origin", J.Infect.Dis., vol. 187, no. 2, pp. 251-259.
Levin, B. R., Perrot, V., & Walker, N. 2000, "Compensatory mutations, antibiotic resistance and the population genetics of adaptive evolution in bacteria", Genetics, vol. 154, no. 3, pp. 985-997.
Lewenza, S., Conway, B., Greenberg, E. P., & Sokol, P. A. 1999, "Quorum sensing in Burkholderia cepacia: identification of the LuxRI homologs CepRI", J.Bacteriol., vol. 181, no. 3, pp. 748-756.
Lewenza, S. & Sokol, P. A. 2001, "Regulation of omibactin biosynthesis and N-acyl-L- homoserine lactone production by CepR in Burkholderia cepacia", J.Bacteriol., vol. 183, no. 7, pp. 2212-2218.
Lewin, C., Doherty, C., & Govan, J. 1993, "/« vitro activities of meropenem, PD 127391, PD 131628, ceftazidime, chloramphenicol, co-trimoxazole, and ciprofloxacin against Pseudomonas cepacia", Antimicrob.Agents Chemother., vol. 37, no. 1, pp. 123-125.
Li, X. Z. & Nikaido, H. 2004. Efflux mediated drug resistance in bacteria. Drugs 64, pp. 159-204.
224
References
Li, X. Z., Nikaido, H., & Poole, K. 1995, "Role of mexA-mexB-oprM in antibiotic efflux in Pseudomonas aeruginosa", Antimicrob.Agents Chemother., vol. 39, no. 9, pp. 1948- 1953.
Linares, J, de la Campa, A.G. and Palla. 1999. Fluoroquinolone resistance in Streptococcus pneumoniae. N. Engl. J.Med. vol. 11., pp. 1546-7.
Lin, J., Michel, L. O., & Zhang, Q. 2002, "CmeABC functions as a multidrug efflux system in Campylobacter jejuni", Antimicrob. Agents Chemother., vol. 46, no. 7, pp. 2124- 2131.
Lindsay, D. & von Holy, A. 1997, "Evaluation of dislodging methods for laboratory- grown bacterial biofilms", Food Microbiology, vol. 14, no. 4, pp. 383-390.
LiPuma, J. J. 1998, "Burkholderia cepacia. Management issues and new insights", Clin.Chest M ed, vol. 19, no. 3, pp. 473-86, vi.
LiPuma, J. J., Dasen, S. E., Nielson, D. W., Stem, R. C., & Stull, T. L. 1990, "Person-to- person transmission of Pseudomonas cepacia between patients with cystic fibrosis", Lancet, vol. 336, no. 8723, pp. 1094-1096.
LiPuma, J. J., Dulaney, B. J., McMenamin, J. D., Whitby, P. W., Stull, T. L., Coenye, T., & Vandamme, P. 1999, "Development of rRNA-based PCR assays for identification of Burkholderia cepacia complex isolates recovered from cystic fibrosis patients", J.Clin.Microbiol., vol. 37, no. 10, pp. 3167-3170.
LiPuma, J. J., Mortensen, J. E., Dasen, S. E., Edlind, T. D., Schidlow, D. V., Bums, J. L., & Stull, T. L. 1988, "Ribotype analysis of Pseudomonas cepacia from cystic fibrosis treatment centers", J.Pediatr., vol. 113, no. 5, pp. 859-862.
LiPuma, J. J., Spilker, T., Coenye, T., & Gonzalez, C. F. 2002, "An epidemic Burkholderia cepacia complex strain identified in soil", Lancet, vol. 359, no. 9322, pp. 2002-2003.
LiPuma, J. J., Spilker, T., Gill, L. H., Campbell, P. W., Ill, Liu, L., & Mahenthiralingam,E. 2001, "Disproportionate distribution of Burkholderia cepacia complex species and transmissibility markers in cystic fibrosis", Am.J.Respir.Crit Care Med., vol. 164, no. 1, pp. 92-96.
Little, J. W. & Mount, D. W. 1982, "The SOS regulatory system of Escherichia coli", Cell, vol. 29, no. 1, pp. 11-22.
Lomovskaya, O., Kawai, F., & Matin, A. 1996, "Differential regulation of the mcb and emr operons of Escherichia coli: role of mcb in multidrug resistance", Antimicrob. Agents Chemother., vol. 40, no. 4, pp. 1050-1052.
Loo, C. Y., Corliss, D. A., & Ganeshkumar, N. 2000, "Streptococcus gordonii biofilm formation: identification of genes that code for biofilm phenotypes", J.Bacteriol., vol. 182, no. 5, pp. 1374-1382.
Luo, N., Pereira, S., Sahin, O., Lin, J., Huang, S., Michel, L., & Zhang, Q. 2005, "Enhanced in vivo fitness of fluoroquinolone-resistant Campylobacter jejuni in the
225
References
absence of antibiotic selection pressure", Proc.Natl.Acad.Sci.U.S.A, vol. 102, no. 3, pp. 541-546.
Luria, S. & Delbriick, M. 1943, "Mutations of Bacteria from Virus Sensitivity to Virus Resistance", Genetics, vol. 28, pp. 491-511.
Lutter, E., Lewenza, S., Dennis, J. J., Visser, M. B., & Sokol, P. A. 2001, "Distribution of quorum-sensing genes in the Burkholderia cepacia complex", Infect.Immun., vol. 69, no. 7, pp. 4661-4666.
Ma, D., Cook, D. N., Alberti, M., Pon, N. G., Nikaido, H., & Hearst, J. E. 1995, "Genes acrA and acrB encode a stress-induced efflux system of Escherichia coli", Mol. Microbiol, vol. 16, no. 1, pp. 45-55.
Ma, W. T., Sandri, G. V. H. & Sarkar. S. 1992, "Analysis of the Luria Delbriick distribution using discrete convolution powers", J.Appl.Probab., vol. 29, pp. 255-267.
MacDougall, C., Harpe, S. E., Powell, J. P., Johnson, C. K., Edmond, M. B., & Polk, R. E. 2005, "Pseudomonas aeruginosa, Staphylococcus aureus, and fluoroquinolone use", Emerg.Infect.Dis., vol. 11, no. 8, pp. 1197-1204.
Macia, M. D., Borrell, N., Perez, J. L., & Oliver, A. 2004, "Detection and susceptibility testing of hypermutable Pseudomonas aeruginosa strains with the E-test and disk diffusion", Antimicrob.Agents Chemother., vol. 48, no. 7, pp. 2665-2672.
Maeda, Y., Kiba, A., Ohnishi, K., & Hikichi, Y. 2004, "Implications of amino acid substitutions in GyrA at position 83 in terms of oxolinic acid resistance in field isolates of Burkholderia glumae, a causal agent of bacterial seedling rot and grain rot of rice", Appl.Environ.Microbiol., vol. 70, no. 9, pp. 5613-5620.
Mah, T. F. & O'Toole, G. A. 2001, "Mechanisms of biofilm resistance to antimicrobial agents", Trends Microbiol., vol. 9, no. 1, pp. 34-39.
Mah, T. F., Pitts, B., Pellock, B., Walker, G. C., Stewart, P. S., & O'Toole, G. A. 2003, "A genetic basis for Pseudomonas aeruginosa biofilm antibiotic resistance", Nature, vol. 426, no. 6964, pp. 306-310.
Mahenthiralingam, E., Baldwin, A., & Vandamme, P. 2002, "Burkholderia cepacia complex infection in patients with cystic fibrosis", J.Med.Microbiol, vol. 51, no. 7, pp. 533-538.
Mahenthiralingam, E., Bischof, J., Byrne, S. K., Radomski, C., Davies, J. E., Av-Gay, Y., & Vandamme, P. 2000, "DNA-Based diagnostic approaches for identification of Burkholderia cepacia complex, Burkholderia vietnamiensis, Burkholderia multivorans, Burkholderia stabilis, and Burkholderia cepacia genomovars I and III", J.Clin.Microbiol., vol. 38, no. 9, pp. 3165-3173.
Mahenthiralingam, E., Coenye, T., Chung, J. W., Speert, D. P., Govan, J. R., Taylor, P., & Vandamme, P. 2000, "Diagnostically and experimentally useful panel of strains from the Burkholderia cepacia complex", J.Clin.Microbiol., vol. 38, no. 2, pp. 910-913.
226
References
Mahenthiralingam, E., Simpson, D. A., & Speert, D. P. 1997, "Identification and characterization of a novel DNA marker associated with epidemic Burkholderia cepacia strains recovered from patients with cystic fibrosis", J.Clin.Microbiol., vol. 35, no. 4, pp. 808-816.
Mahenthiralingam, E., Urban, T. A., & Goldberg, J. B. 2005, "The multifarious, multireplicon Burkholderia cepacia complex", Nat.Rev.Microbiol, vol. 3, no. 2, pp. 144- 156.
Mahenthiralingam, E., Vandamme, P., Campbell, M. E., Henry, D. A., Gravelle, A. M., Wong, L. T., Davidson, A. G., Wilcox, P. G., Nakielna, B., & Speert, D. P. 2001, "Infection with Burkholderia cepacia complex genomovars in patients with cystic fibrosis: virulent transmissible strains of genomovar III can replace Burkholderia multivorans", Clin.Infect.Dis., vol. 33, no. 9, pp. 1469-1475.
Maiden, M. C. 1998, "Horizontal genetic exchange, evolution, and spread of antibiotic resistance in bacteria", Clin.Infect.Dis., vol. 27 Suppl 1, p. S12-S20.
Maira-Litran, T., Allison, D. G., & Gilbert, P. 2000, "An evaluation of the potential of the multiple antibiotic resistance operon {mar) and the multidrug efflux pump acrAB to moderate resistance towards ciprofloxacin in Escherichia coli biofilms", J.Antimicrob.Chemother., vol. 45, no. 6, pp. 789-795.
Malott, R. J., Baldwin, A., Mahenthiralingam, E., & Sokol, P. A. 2005, "Characterization of the ccilR quorum-sensing system in Burkholderia cenocepacia", Infect. Immun., vol. 73, no. 8, pp. 4982-4992.
Mamber, S. W., Kolek, K. W., Brookshire, D. P., Bonner, D. P., & Fung-Tomc, J. 1993, "Activity of quinolones in the Ames Salmonella TA102 mutagenicity test and other bacterial genotoxicity assays", Antimicrb. Agents Chemother. pp. 213-217.
Marciano, D.C., Karkouti, O.Y. & Palzkill, T. 2007. "A fitness cost associated with the antibiotic resistance enzyme SME-1 p-lactamase". Genetics. vol,176, pp 2381-2392.
Mariam, D. H., Mengistu, Y., Hoffner, S. E., & Andersson, D. I. 2004, "Effect of rpoB mutations conferring rifampin resistance on fitness of Mycobacterium tuberculosis", Antimicrob.Agents Chemother., vol. 48, no. 4, pp. 1289-1294.
Markham, P. N. 1999, "Inhibition of the emergence of ciprofloxacin resistance in Streptococcus pneumoniae by the multidrug efflux inhibitor reserpine", Antimicrob. Agents Chemother., vol. 43, no. 4, pp. 988-989.
Markowitz, V. M., Korzeniewski, F., Palaniappan, K., Szeto, E., Werner, G., Padki, A., Zhao, X., Dubchak, I., Hugenholtz, P., Anderson, I., Lykidis, A., Mavromatis, K., Ivanova, N., & Kyrpides, N. C. 2006, "The integrated microbial genomes (IMG) system", Nucleic Acids Res., vol. 34, no. Database issue, p. D344-D348.
Martinez-Martinez, L., Pascual, A., & Jacoby, G. A. 1998, "Quinolone resistance from a transferable plasmid", Lancet, vol. 351, no. 9105, pp. 797-799.
227
References
Marsh, P. D. 1995. "Dental plaque", in H. M. Lappin-Scott and J. W. Costerton (ed.), Microbial biofilms. Cambridge University Press, Cambridge, United Kingdom, pp. 282- 300.
Mathee, K., Ciofu, O., Sternberg, C., Lindum, P. W., Campbell, J. I., Jensen, P., Johnsen, A. H., Givskov, M., Ohman, D. E., Molin, S., Hoiby, N., & Kharazmi, A. 1999, "Mucoid conversion of Pseudomonas aeruginosa by hydrogen peroxide: a mechanism for virulence activation in the cystic fibrosis lung", Microbiology, vol. 145 ( Pt 6), pp. 1349-1357.
Matic, I., Radman, M., Taddei, F., Picard, B., Doit, C., Bingen, E., Denamur, E., & Elion, J. 1997, "Highly variable mutation rates in commensal and pathogenic Escherichia coli", Science, vol. 277, no. 5333, pp. 1833-1834.
McDonald, L.C., Chen, F., Lo, H.J., Yin, H.C., Lu, P.L., Huang, C.H., Lauderdale, T.L. & Ho, M. "Emergence of reduced susceptibility and resistance to fluoroquinolones in Escherichia coli in Taiwan and contributions of distinct selective pressures", Antimicrob. Agents. Chemother., vol. 45, no.11, pp. 3084-3091.
McGowan, J.E. 2006. " Resistance in non-fermenting Gram-negative bacteria: multidrug resistance to the maximum", Am. J.Med., vol. 119, no.6, pp. S29-S36.
McHugh, T.D. 2001. "Application of SSCP to identification of resistance mutations", in . Antibiotic resistance: Methods and Protocols, ed. S.H. Gillespie, Humana Press, New Jersey, pp. 31-37.
McKenney, D., Brown, K. E., & Allison, D. G. 1995, "Influence of Pseudomonas aeruginosa exoproducts on virulence factor production in Burkholderia cepacia: evidence of interspecies communication", J.Bacteriol., vol. 177, no. 23, pp. 6989-6992.
McKevitt, A. I., Bajaksouzia, S., Klinger, J. D. & Woods, D. E. 1989, "Purification and characterisation of an extracellular protease from Pseudomonas cepacia" Infect. Immun. vol. 57, pp 771-778.
McKevitt, A. I & Woods, D. E. 1984, "Characterisation of Pseudomonas cepacia isolates from patients with CF", J. Clin.Micro., vol. 19, pp. 291-293.
McManus, T.E., Beattie, D., Graham, C., Moore, J.E. & Elbom, J.S. 2005. "Cystic fibrosis genotype and bacterial infection: a possible connection", Br.J.Biomed.Sci., vol.62, no.2, pp.85-88.
McMurray L.M., Oethinger M., and Levy S.B. 1998. "Triclosan targets lipid synthesis", Nature, vol. 394, pp. 531-532.
Meka, V. G., Gold, H. S., Cooke, A., Venkataraman, L., Eliopoulos, G. M., Moellering, R.C., Jr., & Jenkins, S. G. 2004, "Reversion to susceptibility in a linezolid-resistant clinical isolate of Staphylococcus aureus", J. Antimicrob. Chemother., vol. 54, no. 4, pp. 818-820.
Meyer, J. M., Hohnadel, D., & Halle, F. 1989, "Cepabactin from Pseudomonas cepacia, a new type of siderophore", J.Gen.Microbiol., vol. 135, no. 6, pp. 1479-1487.
228
References
Miche, L. & Balandreau, J. 2001, "Effects of rice seed surface sterilization with hypochlorite on inoculated Burkholderia vietnamiensis", Appl.Environ.Microbiol., vol. 67, no. 7, pp. 3046-3052.
Mikuniya, T., Kato, Y., Kariyama, R., Monden, K., Hikida, M., & Kumon, H. 2005, "Synergistic effect of fosfomycin and fluoroquinolones against Pseudomonas aeruginosa growing in a biofilm", Acta Med. Okayama, vol. 59, no. 5, pp. 209-216.
Miles, A. A. & Misra. S. S. 1938, "The estimation of the bactericidal power of the blood.", J. Hyg., vol. 38, pp. 732-749.
Miller, J. H. 1996, "Spontaneous mutators in bacteria: insights into pathways of mutagenesis and repair", Annu.Rev.Microbiol, vol. 50, pp. 625-643.
Mingeot-Leclercq, M. P., Glupczynski, Y., & Tulkens, P. M. 1999, "Aminoglycosides: activity and resistance", Antimicrob.Agents Chemother., vol. 43, no. 4, pp. 727-737.
Modi, R. I., Wilke, C. M., Rosenzweig, R. F., & Adams, J. 1991, "Plasmid macroevolution: selection of deletions during adaptation in a nutrient-limited environment", Genetica, vol. 84, no. 3, pp. 195-202.
Moken, M. C., McMurry, L. M., & Levy, S. B. 1997, "Selection of multiple-antibiotic- resistant (mar) mutants of Escherichia coli by using the disinfectant pine oil: roles of the mar and acrAB loci", Antimicrob.Agents Chemother., vol. 41, no. 12, pp. 2770-2772.
Moore, J.E., Mclhatton, B., Buchanan, J., Gilpin, D. Shaw, A., Hall, V., Murphy, P.G. and Elbom, J.S. 2002. "Occurrence of Burkholderia cepacia in the hospital environment", Ir.J. MedSci., vol. 171, no. 3, pp.131-133.
Moore, J.E, Shaw, A., Howard, J.L., Dooley, J. S. G. & Elbom, J. S. 2004. "Infection control and the significance of sputum and other respiratory secretions from adult patients with cystic fibrosis". Annal. Clin. Microbiol. Antim., vol. 3, pp. 813.
Moorman, D. R. & Mandell, G. L. 1981, "Characteristics of rifampin-resistant variants obtained from clinical isolates of Staphylococcus aureus", Antimicrob. Agents Chemother., vol. 20, no. 6, pp. 709-713.
Morris, N. S., Stickler, D. J., & McLean, R. J. 1999, "The development of bacterial biofilms on indwelling urethral catheters", World J. Urol., vol. 17, no. 6, pp. 345-350.
Mouneimne, H., Robert, J., Jarlier, V., & Cambau, E. 1999, "Type II topoisomerase mutations in ciprofloxacin-resistant strains of Pseudomonas aeruginosa", Antimicrob.Agents Chemother., vol. 43, no. 1, pp. 62-66.
Moyed, H. S. & Bertrand, K. P. 1983,"hipA, a newly recognized gene of Escherichia coli K-12 that affects frequency of persistence after inhibition of murein synthesis", J.Bacteriol, vol. 155, no. 2, pp. 768-775.
Moyed, H. S. & Broderick, S. H. 1986, "Molecular cloning and expression of hipA, a gene of Escherichia coli K-12 that affects frequency of persistence after inhibition of murein synthesis", J.Bacteriol., vol. 166, no. 2, pp. 399-403.
229
References
Moxon, E. R., Rainey, P. B., Nowak, M. A., & Lenski, R. E. 1994, "Adaptive evolution of highly mutable loci in pathogenic bacteria", Curr.Biol., vol. 4, no. 1, pp. 24-33.
Mukamolova, G. V., Turapov, O. A., Young, D. I., Kaprelyants, A. S., Kell, D. B., & Young, M. 2002, "A family of autocrine growth factors in Mycobacterium tuberculosis", Mol Microbiol., vol. 46, no. 3, pp. 623-635.
Mukamolova, G. V., Yanopolskaya, N. D., Kell, D. B., & Kaprelyants, A. S. 1998, "On resuscitation from the dormant state of Micrococcus luteus", Antonie Van Leeuwenhoek, vol. 73, no. 3, pp. 237-243.
Muller, H. J. 1964, "The relation of recombination to mutational advance", Mutat.Res., vol. 1, pp. 2-9.
Murga, R., Miller, J. M., & Donlan, R. M. 2001, "Biofilm formation by Gram-negative bacteria on central venous catheter connectors: effect of conditioning films in a laboratory model", J.Clin.Microbiol., vol. 39, no. 6, pp. 2294-2297.
Mutnick, A. H., Rhomberg, P. R., Sader, H.S. & Jones, R. N. 2004, "Antimicrobial usage and resistance trend relationships from the MYSTIC Programme in North America (1999- 2001), J. Antimicrob. Chemother. vol. 53, pp 290-6.
Nagai, K., Davies, T. A., Pankuch, G. A., Dewasse, B. E., Jacobs, M. R., & Appelbaum, P. C. 2000, "In vitro selection of resistance to clinafloxacin, ciprofloxacin, and trovafloxacin in Streptococcus pneumoniae", Antimicrob.Agents Chemother., vol. 44, no. 10, pp. 2740-2746.
Nagano, Y., Millar, B.C., Goldsmith, C.E., Elbom, J.S., Rendall, J. & Moore, J.E. 2007. "Emergence of Scedosporium apiospermum in patients with cystic fibrosis", Arch. Dis. Child., vol. 92, pp. 607.
Nakamura, S., Nakamura, M., Kojima, T. & Yoshida, H. 1989."gyrA and gyrB mutations in quinolone-resistant strains of Escherichia coli", Antimicrob. Agents Chemother, vol. 33, no.2, pp. 254-255.
Nakazawa, T., Yamada, Y., & Ishibashi, M. 1987, "Characterization of hemolysin in extracellular products of Pseudomonas cepacia", J.Clin. Microbiol., vol. 25, no. 2, pp. 195- 198.
Nawaz, M. S., Khan, S. A., Khan, A. A., Nayak, R., Steele, R., Paine, D., & Jones, R. 2003, "Molecular characterization of fluoroquinolone-resistant Campylobacter spp. isolated from poultry", Poult.Sci., vol. 82, no. 2, pp. 251-258.
Nealson, K. H. & Hastings, J. W. 1979, "Bacterial bioluminescence: its control and ecological significance", Microbial Reviews, vol. 43, pp. 496-518.
Nelson, J. M., Chiller, T. M., Powers, J. H., & Angulo, F. J. 2007, "Fluoroquinolone- resistant Campylobacter species and the withdrawal of fluoroquinolones from use in poultry: a public health success story", Clin.Infect.Dis., vol. 44, no. 7, pp. 977-980.
230
References
Nelson, J. W., Doherty, C. J., Brown, P. H., Greening, A. P., Kaufmann, M. E., & Govan, J. R. 1991, "Pseudomonas cepacia in inpatients with cystic fibrosis", Lancet, vol. 338, no. 8781, pp. 1525.
Neu, H.C., 1989, "Overview of mechanisms of bacterial resistance", Diagn. Microbiol. Infect. Dis., vol. 12, pp.l09S-l 16S.
Neyfakh, A. A., Bidnenko, V. E., & Chen, L. B. 1991, "Efflux-mediated multidrug resistance in Bacillus subtilis: similarities and dissimilarities with the mammalian system", Proc.Natl.Acad.Sci. U.S.A, vol. 88, no. 11, pp. 4781-4785.
Nguyen, T. N., Phan, Q. G., Duong, L. P., Bertrand, K. P., & Lenski, R. E. 1989, "Effects of carriage and expression of the TnlO tetracycline-resistance operon on the fitness of Escherichia coli K12", Molecular Biology and Evolution, vol. 6, no. 3, pp. 213-225.
Nies, D. H. 1999, "Microbial heavy-metal resistance", Appl.Microbiol.Biotechnol., vol. 51, no. 6, pp. 730-750.
Nies, D. H. & Silver, S. 1995, "Ion efflux systems involved in bacterial metal resistances", J.Ind.Microbiol., vol. 14, pp. 186-199.
Nikaido, H. 1996, "Multidrug efflux pumps of gram-negative bacteria", J.Bacteriol., vol. 17, pp. 5853-5898.
Nierman, W. C., DeShazer, D., Kim, H. S., Tettelin, H., Nelson, K. E., Feldblyum, T., Ulrich, R. L., Ronning, C. M., Brinkac, L. M., Daugherty, S. C., Davidsen, T. D., Deboy, R. T., Dimitrov, G., Dodson, R. J., Durkin, A. S., Gwinn, M. L., Haft, D. H., Khouri, H., Kolonay, J. F., Madupu, R., Mohammoud, Y., Nelson, W. C., Radune, D., Romero, C. M., Sarria, S., Selengut, J., Shamblin, C., Sullivan, S. A., White, O., Yu, Y., Zafar, N., Zhou, L., & Fraser, C. M. 2004, "Structural flexibility in the Burkholderia mallei genome", Proc.Natl.Acad.Sci. U.S.A, vol. 101, no. 39, pp. 14246-14251.
Nosanchuk, J. D. & Casadevall, A. 2003, "The contribution of melanin to microbial pathogenesis", Cell Microbiol., vol. 5, no. 4, pp. 203-223.
Nowak, R. 1994, "Hungary sees an improvement in penicillin resistance", Science, vol. 264, no. 5157, pp. 364.
Norrby, S.R., Nord, C.E., Finch, R & The European Society of Clinical Microbiology and Infectious Diseases. 2005, "Lack of development of new antimicrobial drugs: a potential serious threat to public health", Lancet Inf. Dis., vol. 5, no. 2, pp. 115- 119.
Nucifora, G., Chu, L., Misra, T. K., & Silver, S. 1989, "Cadmium resistance from Staphylococcus aureus plasmid pI258 cadA gene results from a cadmium-efflux ATPase", Proc.Natl.Acad.Sci.U.S.A, vol. 86, no. 10, pp. 3544-3548.
Nzula, S., Vandamme, P., & Govan, J. R. 2002, "Influence of taxonomic status on the in vitro antimicrobial susceptibility of the Burkholderia cepacia complex", J.Antimicrob. Chemother., vol. 50, no. 2, pp. 265-269.
231
References
O'Callaghan, E. M., Tanner, M. S., & Boulnois, G. J. 1994, "Development of a PCR probe test for identifying Pseudomonas aeruginosa and Pseudomonas (.Burkholderia) cepacia", J.Clin.Pathol, vol. 47, no. 3, pp. 222-226.
Ochman, H., Lawrence, J. G., & Groisman, E. A. 2000, "Lateral gene transfer and the nature of bacterial innovation", Nature, vol. 405, no. 6784, pp. 299-304.
Oethinger, M., Kern, W. V., Jellen-Ritter, A. S., McMurry, L. M., & Levy, S. B. 2000, "Ineffectiveness of topoisomerase mutations in mediating clinically significant fluoroquinolone resistance in Escherichia coli in the absence of the AcrAB efflux pump", Antimicrob.Agents Chemother., vol. 44, no. 1, pp. 10-13.
Oh, H., Stenhoff, J., Jalal, S., & Wretlind, B. 2003, "Role of efflux pumps and mutations in genes for topoisomerases II and IV in fluoroquinolone-resistant Pseudomonas aeruginosa strains", Microb.Drug Resist., vol. 9, no. 4, pp. 323-328.
Oie, S. & Kamiya, A. 1996, "Microbial contamination of antiseptics and disinfectants", Am.J.Infect. Control, vol. 24, no. 5, pp. 389-395.
Okazaki, T., Iyobe, S., Hashimoto, H., & Hirai, K. 1991, "Cloning and characterization of a DNA fragment that complements the nficB mutation in Pseudomonas aeruginosa PAO", FEMSMicrobiol.Lett., vol. 63, no. 1, pp. 31-35.
Oliver, A., Canton, R., Campo, P., Baquero, F., & Blazquez, J. 2000, "High frequency of hypermutable Pseudomonas aeruginosa in cystic fibrosis lung infection", Science, vol. 288, no. 5469, pp. 1251-1254.
Oliver, A., Levin, B. R., Juan, C., Baquero, F., & Blasquez, J. 2004, "Hypermutation and the preexistence of antibiotic resistant Pseudomonas aeruginosa mutants implications for susceptibility testing and treatment of chronic infections", Antimicrob. Agents Chemother., vol. 48, no. 11, pp. 4226-4233.
O'Neill, A. J., Huovinen, T., Fishwick, C. W., & Chopra, I. 2006, "Molecular genetic and structural modeling studies of Staphylococcus aureus RNA polymerase and the fitness of rifampin resistance genotypes in relation to clinical prevalence", Antimicrob.Agents Chemother., vol. 50, no. 1, pp. 298-309.
Ordway, D. J., Sonnenberg, M. G., Donahue, S. A., Belisle, J. T., & Orme, I. M. 1995, "Drug-resistant strains of Mycobacterium tuberculosis exhibit a range of virulence for mice", Infect.Immun., vol. 63, no. 2, pp. 741-743.
O'Sullivan, D. M., McHugh, T. D., & Gillespie, S. H. 2005, "Analysis of rpoB and pncA mutations in the published literature: an insight into the role of oxidative stress in Mycobacterium tuberculosis evolution?", J.Antimicrob.Chemother., vol. 55, no. 5, pp. 674-679.
O'Toole, G. A. 2003, "To build a biofilm", J.Bacteriol., vol. 185, no. 9, pp. 2687-2689.
O'Toole, G. A. & Kolter, R. 1998, "Initiation of biofilm formation in Pseudomonas fluorescens WCS365 proceeds via multiple, convergent signalling pathways: a genetic analysis", Mol Microbiol, vol. 28, no. 3, pp. 449-461.
232
References
Palffeyman, R. W., Watson, M. L., Eden, C., & Smith, A. W. 1997, "Induction of biologically active interleukin-8 from lung epithelial cells by Burkholderia (Pseudomonas) cepacia products", Infect.Immun., vol. 65, no. 2, pp. 617-622.
Pan, X. S. & Fisher, L. M. 1998, "DNA gyrase and topoisomerase IV are dual targets of clinafloxacin action in Streptococcus pneumoniae", Antimicrob.Agents Chemother., vol. 42, no. 11, pp. 2810-2816.
Pao, S. S., Paulsen, I. T., & Saier, M. H., Jr. 1998, "Major facilitator superfamily", Microbiol Mol Biol.Rev., vol. 62, no. 1, pp. 1-34.
Parke, J. L. & Gurian-Sherman, D. 2001, "Diversity of the Burkholderia cepacia complex and implications for risk assessment of biological control strains", Annu.Rev.Phytopathol., vol. 39, pp. 225-258.
Parsek, M. R. & Greenberg, E. P. 1999, "Quorum sensing signals in development of Pseudomonas aeruginosa biofilms", Methods Enzymol., vol. 310, pp. 43-55.
Parsek, M. R. & Greenberg, E. P. 2000, "Acyl-homoserine lactone quorum sensing in Gram-negative bacteria: a signaling mechanism involved in associations with higher organisms", Proc.Natl.Acad.Sci.U.S.A, vol. 97, no. 16, pp. 8789-8793.
Parsons, Y. N., Glendinning, K. J., Thornton, V., Hales, B. A., Hart, C. A., & Winstanley,C. 2001, "A putative type III secretion gene cluster is widely distributed in the Burkholderia cepacia complex but absent from genomovar I", FEMS Microbiol.Lett., vol. 203, no. l ,pp. 103-108.
Paschoal, I. A., de, O., V, Bertuzzo, C. S., Cerqueira, E. M., & Pereira, M. C. 2007, "Cystic fibrosis in adults", Lung, vol. 185, no. 2, pp. 81-87.
Passador, L., Cook, J. M., Gambello, M. J., Rust, L., & Iglewski, B. H. 1993, "Expression of Pseudomonas aeruginosa virulence genes requires cell to cell communication", Science, vol. 260, pp. 1127-1130.
Passerini, L., Lam, K., Costerton, J. W., & King, E. G. 1992, "Biofllms on indwelling vascular catheters", Crit Care Med., vol. 20, no. 5, pp. 665-673.
Paulsen, I. T., Brown, M. H., & Skurray, R. A. 1996, "Proton-dependent multidrug efflux systems", Microbiol Rev., vol. 60, no. 4, pp. 575-608.
Paulsen, I. T., Skurray, R. A., Tam, R., Saier, M. H., Jr., Turner, R. J., Weiner, J. H., Goldberg, E. B., & Grinius, L. L. 1996, "The SMR family: a novel family of multidrug efflux proteins involved with the efflux of lipophilic drugs", Mol Microbiol, vol. 19, no. 6, pp. 1167-1175.
Pearson, J. P., Pesci, E. C., & Iglewski, B. H. 1997, "Roles of Pseudomonas aeruginosa las and rhl quorum-sensing systems in control of elastase and rhamnolipid biosynthesis genes", J.Bacteriol, vol. 179, no. 18, pp. 5756-5767.
Pegues, D. A., Carson, L. A., Tablan, O. C., FitzSimmons, S. C., Roman, S. B., Miller, J. M., & Jarvis, W. R. 1994, "Acquisition of Pseudomonas cepacia at summer camps for
233
References
patients with cystic fibrosis. Summer Camp Study Group", J.Pediatr., vol. 124, no. 5 Pt 1, pp. 694-702.
Peloquin, C. A., Cumbo, T. J., Nix, D. E., Sands, M. F., & Schentag, J. J. 1989, "Evaluation of intravenous ciprofloxacin in patients with nosocomial lower respiratory tract infections. Impact of plasma concentrations, organism, minimum inhibitory concentration, and clinical condition on bacterial eradication", Arch.Intern.Med., vol. 149, no. 10, pp. 2269-2273.
Peng, H. & Marians, K. J. 1993, "Escherichia coli topoisomerase IV. Purification, characterization, subunit structure, and subunit interactions", J.Biol.Chem., vol. 268, no. 32, pp. 24481-24490.
Peters, A. & Wimpenny, J. 1987, "A constant depth laboratory model film fermenter.", Biotechnology and Bioengineering, vol. 32, pp. 263-270.
Piddock, L. J., Walters, R. N., & Diver, J. M. 1990, "Correlation of quinolone MIC and inhibition of DNA, RNA, and protein synthesis and induction of the SOS response in Escherichia coli", Antimicrob.Agents Chemother., vol. 34, no. 12, pp. 2331-2336.
Pitt, T. L., Kaufmann, M. E., Patel, P. S., Benge, L. C., Gaskin, S., & Livermore, D. M. 1996, "Type characterisation and antibiotic susceptibility of Burkholderia (Pseudomonas) cepacia isolates from patients with cystic fibrosis in the United Kingdom and the Republic of Ireland", J. Med. Microbiol., vol. 44, no. 3, pp. 203-210.
Pope, C. F., Gillespie, S. H., Pratten, J. R. & McHugh, T. D. 2007, "Investigation on Fluoroquinolone- Resistant mutants of Burkholderia cepacia" Antimicrob. Agent Chemother., vol 52, no. 3, pp. 1203-3.
Poole, K. 2000, "Efflux-mediated resistance to fluoroquinolones in gram-negative bacteria", Antimicrob.Agents Chemother., vol. 44, no. 9, pp. 2233-2241.
Potera, C. 1999, "Forging a link between biofilms and disease", Science, vol. 283, no. 5409, pp. 1837, 1839.
Poyart, C. Pierre, C., Quesne, G., Pron, B., Berch, P. & Trien-Cust, P. 1997."Emergence of vancomycin resistance in the genus Streptococcus: characterization of a vanB transferable determinant in Streptococcus bovis" Antimicrob. Agent Chemother., vol. 41, pp. 24-29
Pratt, L. A. & Kolter, R. 1998, "Genetic analysis of Escherichia coli biofilm formation: roles of flagella, motility, chemotaxis and type I pili", Mol.Microbiol., vol. 30, no. 2, pp. 285-293.
Pratten R, Barnett, P & Wilson, M. 1998. "Composition and Susceptibility to Chlorhexidine of Multispecies Biofilms of Oral Bacteria", Appli. Environ. Micro., vol. 64., no.9, pp 3515-3519.
Purevdorj, B., Costerton, J. W., & Stoodley, P. 2002, "Influence of hydrodynamics and cell signaling on the structure and behavior of Pseudomonas aeruginosa biofilms", Appl.Environ.Microbiol., vol. 68, no. 9, pp. 4457-4464.
234
References
Rafii, F., Park, M., & Novak, J. S. 2005, "Alterations in DNA gyrase and topoisomerase IV in resistant mutants of Clostridium perfringens found after in vitro treatment with fluoroquinolones", Antimicrob.Agents Chemother., vol. 49, no. 2, pp. 488-492.
Rahme, L. G., Ausubel, F. M., Cao, H., Drenkard, E., Goumnerov, B. C., Lau, G. W., Mahajan-Miklos, S., Plotnikova, J., Tan, M. W., Tsongalis, J., Walendziewicz, C. L., & Tompkins, R. G. 2000, "Plants and animals share functionally common bacterial virulence factors", Proc.Natl.Acad.Sci.U.S.A, vol. 97, no. 16, pp. 8815-8821.
Rahme, L. G., Stevens, E. J., Wolfort, S. F., Shao, J., Tompkins, R. G., & Ausubel, F. M. 1995, "Common virulence factors for bacterial pathogenicity in plants and animals", Science, vol. 268, no. 5219, pp. 1899-1902.
Rahme, L. G., Tan, M. W., Le, L., Wong, S. M., Tompkins, R. G., Calderwood, S. B., & Ausubel, F. M. 1997, "Use of model plant hosts to identify Pseudomonas aeruginosa virulence factors", Proc.Natl.Acad.Sci.U.S.A, vol. 94, no. 24, pp. 13245-13250.
Rainbow, L., Hart, C. A., & Winstanley, C. 2002, "Distribution of type III secretion gene clusters in Burkholderia pseudomallei, B. thailandensis and B. mallei", J.Med.Microbiol, vol. 51, no. 5, pp. 374-384.
Raj, P. A. & Dentino, A. R. 2002, "Current status of defensins and their role in innate and adaptive immunity", FEMSMicrobiol.Lett., vol. 206, no. 1, pp. 9-18.
Ramadhan, A. A. & Hegedus, E. 2005, "Survivability of vancomycin resistant enterococci and fitness cost of vancomycin resistance acquisition", J.Clin.Pathol., vol. 58, no. 7, pp. 744-746.
Randall, L. P. & Woodward, M. J. 2001, "Multiple antibiotic resistance (mar) locus in Salmonella enterica serovar typhimurium DT104", Appl.Environ.Microbiol., vol. 67, no. 3, pp. 1190-1197.
Rasmussen, B. 2000, "Filamentous microfossils in a 3,235-million-year-old volcanogenic massive sulphide deposit", Nature, vol. 405, no. 6787, pp. 676-679.
Ratjen, F. & Doring, G. 2003, "Cystic fibrosis", Lancet, vol. 361, no. 9358, pp. 681-689.
Ratledge, C. & Dover, L. G. 2000, "Iron metabolism in pathogenic bacteria", Annu.Rev.Microbiol., vol. 54, pp. 881-941.
Rayssiguier, C., Thaler, D. S., & Radman, M. 1989, "The barrier to recombination between Escherichia coli and Salmonella typhimurium is disrupted in mismatch-repair mutants", Nature, vol. 342, no. 6248, pp. 396-401.
Remold, S. K. & Lenski, R. E. 2001, "Contribution of individual random mutations to genotype-by-environment interactions in Escherichia coli", Proc.Natl.Acad.Sci. U.S.A, vol. 98, no. 20, pp. 11388-11393.
Richau, J. A., Leitao, J. H., Correia, M., Lito, L., Salgado, M. J., Barreto, C., Cescutti, P., & Sa-Correia, I. 2000, "Molecular typing and exopolysaccharide biosynthesis of Burkholderia cepacia isolates from a Portuguese cystic fibrosis center", J.Clin.Microbiol, vol. 38, no. 4, pp. 1651-1655.
235
References
Riedel, K., Hentzer, M., Geisenberger, O., Huber, B., Steidle, A., Wu, H., Hoiby, N., Givskov, M., Molin, S., & Eberl, L. 2001, "N-acylhomoserine-lactone-mediated communication between Pseudomonas aeruginosa and Burkholderia cepacia in mixed biofilms", Microbiology, vol. 147, no. Pt 12, pp. 3249-3262.
Roberts, M. C., Chung, W. O., & Roe, D. E. 1996, "Characterization of tetracycline and erythromycin resistance determinants in Treponema denticola", Antimicrob.Agents Chemother., vol. 40, no. 7, pp. 1690-1694.
Robicsek, A., Strahilevitz, J., Jacoby, G. A., Macielag, M., Abbanat, D., Park, C. H., Bush, K., & Hooper, D. C. 2006, "Fluoroquinolone-modifying enzyme: a new adaptation of a common aminoglycoside acetyltransferase", Nat.Med., vol. 12, no. 1, pp. 83-88.
Rogues, A. M., Dumartin, C., Amadeo, B., Venier, A. G., Marty, N., Pameix, M.D., Gachie, J. P. 2007, "Relationship between rates of antimicrobial consumption and the incidence of antimicrobial resistance in Staphylococcus aureus and Pseudomonas aeruginosa", Infect. Con. Hosp. Epidemiol., vol. 28, pp. 1389-1395.
Rosche, W. A. & Foster, P. L. 2000, "Determining mutation rates in bacterial populations", Methods, vol. 20, no. 1, pp. 4-17.
Rossman, T. G., Goncharova, E. I., & Nadas, A. 1995, "Modeling and measurement of the spontaneous mutation rate in mammalian cells", Mutat.Res., vol. 328, no. 1, pp. 21-30.
Rotz, L. D., Khan, A. S., Lillibridge, S. R., Ostroff, S. M., & Hughes, J. M. 2002, "Public health assessment of potential biological terrorism agents", Emerg.Infect.Dis., vol. 8, no.2, pp. 225-230.
Rozen, S. & Skaletsky, H. 2000. Primer3 on the WWW for general use and for biologist programming methods. Methods. Mol. Biol. 132; 365-386.
Ruiz, J. 2003, "Mechanisms of resistance to quinolones: target alterations, decreased accumulation and DNA gyrase protection", J.Antimicrob.Chemother., vol. 51, no. 5, pp. 1109-1117.
Ruiz, J., Goni, P., Marco, F., Gallardo, F., Mirelis, B., Jimenez, d. A., & Vila, J. 1998, "Increased resistance to quinolones in Campylobacter jejuni: a genetic analysis of gyrA gene mutations in quinolone-resistant clinical isolates", Microbiol.Immunol., vol. 42, no.3, pp. 223-226.
Saenz, Y., Zarazaga, M., Brinas, L., Ruiz-Larrea, F., & Torres, C. 2003, "Mutations in gyrA and parC genes in nalidixic acid-resistant Escherichia coli strains from food products, humans and animals", J.Antimicrob.Chemother., vol. 51, no. 4, pp. 1001-1005.
Sahly, H., Schubert, S., Harder, J., Rautenberg, P., Ullmann, U., Schroder, J., & Podschun, R. 2003, "Burkholderia is highly resistant to human Beta-defensin 3", Antimicrob.Agents Chemother., vol. 47, no. 5, pp. 1739-1741.
Saier, M. H., Jr., Tam, R., Reizer, A., & Reizer, J. 1994, "Two novel families of bacterial membrane proteins concerned with nodulation, cell division and transport", Mol Microbiol, vol. 11, no. 5, pp. 841-847.
236
References
Sajjan, U. S. & Forstner, J. F. 1993, "Role of a 22-kilodalton pilin protein in binding of Pseudomonas cepacia to buccal epithelial cells", Infect.Immun., vol. 61, no. 8, pp. 3157- 3163.
Sajjan, U. S., Sun, L., Goldstein, R., & Forstner, J. F. 1995, "Cable (cbl) type II pili of cystic fibrosis-associated Burkholderia {Pseudomonas) cepacia: nucleotide sequence of the cbl A major subunit pilin gene and novel morphology of the assembled appendage fibers", J.Bacteriol., vol. 177, no. 4, pp. 1030-1038.
Salyers, A. A., Shoemaker, N. B., Stevens, A. M., & Li, L. Y. 1995, "Conjugative transposons: an unusual and diverse set of integrated gene transfer elements", Microbiol.Rev., vol. 59, no. 4, pp. 579-590.
Sanchez, P., Linares, J. F., Ruiz-Diez, B., Campanario, E., Navas, A., Baquero, F., & Martinez, J. L. 2002, "Fitness of in vitro selected Pseudomonas aeruginosa nalB and nficB multidrug resistant mutants", J.Antimicrob.Chemother., vol. 50, no. 5, pp. 657-664.
Sarkar, S. 1991, "Haldane's solution of the Luria-Delbriick distribution", Genetics, vol. 127, no. 2, pp. 257-261.
Sarkar, S., Ma, W. T., & Sandri, G. H. 1992, "On fluctuation anlaysis: a new, simple and effiecient method for computing the expected number of mutants", Genetica, vol. 85, no. 2, pp. 173-179.
Schmitz, F. J., Jones, M. E., Hofmann, B., Hansen, B., Scheuring, S., Luckefahr, M., Fluit, A., Verhoef, J., Hadding, U., Heinz, H. P., & Kohrer, K. 1998, "Characterization of grlA, grlB, gyrA, and gyrB mutations in 116 unrelated isolates of Staphylococcus aureus and effects of mutations on ciprofloxacin MIC", Antimicrob. Agents Chemother., vol. 42, no. 5, pp. 1249-1252.
Schrag, S. J., Perrot, V., & Levin, B. R. 1997, "Adaptation to the fitness costs of antibiotic resistance in Escherichia coli", Proc.Biol.Sci., vol. 264, no. 1386, pp. 1287-1291.
Schroder, J. M. 1999, "Epithelial antimicrobial peptides: innate local host response elements", Cell Mol.Life Sci., vol. 56, no. 1-2, pp. 32-46.
Schwartz, D. A., Quinn, T. J., Thome, P. S., Sayeed, S., Yi, A. K., & Krieg, A. M. 1997, "CpG motifs in bacterial DNA cause inflammation in the lower respiratory tract", J.Clin.Invest, vol. 100, no. 1, pp. 68-73.
Segonds, C., Heulin, T., Marty, N., & Chabanon, G. 1999, "Differentiation of Burkholderia species by PCR-restriction fragment length polymorphism analysis of the 16S rRNA gene and application to cystic fibrosis isolates", J.Clin.Microbiol, vol. 37, no. 7, pp. 2201-2208.
Seppala, H., Klaukka, T., Vuopio-Varkila, J., Muotiala, A., Helenius, H., Lager, K., & Huovinen, P. 1997, "The effect of changes in the consumption of macrolide antibiotics on erythromycin resistance in group A Streptococci in Finland. Finnish Study Group for Antimicrobial Resistance", N.Engl.J.Med., vol. 337, no. 7, pp. 441-446.
Shapiro, J. A. 1997, "Genome organisation, natural genetic engineering and adaptive mutation", Trends.Genet., vol. 13, pp. 98-104.
237
References
Shaw, K. J., Miller, N., Liu, X., Lemer, D., Wan, J., Bittner, A., & Morrow, B. J. 2003, "Comparison of the changes in global gene expression of Escherichia coli induced by four bactericidal agents", J.Mol.Microbiol.Biotechnol., vol. 5, no. 2, pp. 105-122.
Shaw, D., Poxton, I.R. & Govan, J.R. 1995, "Biological activity of B. cepacia lipopolysaccharide", FEMs Immunol. Med. Microbiol, vol. 11, pp. 99-106.
Sherman, D. R., Mdluli, K., Hickey, M. J., Arain, T. M., Morris, S. L., Barry, C. E., Ill, & Stover, C. K. 1996, "Compensatory ahpC gene expression in isoniazid-resistant Mycobacterium tuberculosis", Science, vol. 272, no. 5268, pp. 1641-1643.
Shigeta, M., Tanaka, G., Komatsuzawa, H., Sugai, M., Suginaka, H., & Usui, T. 1997, "Permeation of antimicrobial agents through Pseudomonas aeruginosa biofilms: a simple method", Chemotherapy, vol. 43, no. 5, pp. 340-345.
Shlaes, D. M., Gerding, D. N., John, J. F., Jr., Craig, W. A., Bomstein, D. L., Duncan, R. A., Eckman, M. R., Farrer, W. E., Greene, W. H., Lorian, V., Levy, S., McGowan, J. E., Jr., Paul, S. M., Ruskin, J., Tenover, F. C., & Watanakunakom, C. 1997, "Society for Healthcare Epidemiology of America and Infectious Diseases Society of America Joint Committee on the Prevention of Antimicrobial Resistance: guidelines for the prevention of antimicrobial resistance in hospitals", Clin.Infect.Dis., vol. 25, no. 3, pp. 584-599.
Shotton, D. M. 1989, "Confocal scanning optical microscopy and its applications for biological specimens", J. Cell Sci., vol. 94, pp. 175-2.
Sindelar, G., Zhao, X., Liew, A., Dong, Y., Lu, T., Zhou, J., Domagala, J., & Drlica, K. 2000, "Mutant prevention concentration as a measure of fluoroquinolone potency against mycobacteria", Antimicrob.Agents Chemother., vol. 44, no. 12, pp. 3337-3343.
Singh, P. K., Schaefer, A. L., Parsek, M. R., Moninger, T. O., Welsh, M. J., & Greenberg,E. P. 2000, "Quorum-sensing signals indicate that cystic fibrosis lungs are infected with bacterial biofilms", Nature, vol. 407, no. 6805, pp. 762-764.
Sist, P., Cescutti, P., Skerlavaj, S., Urbani, R., Leitao, J. H., Sa-Correia, I., & Rizzo, R. 2003, "Macromolecular and solution properties of Cepacian: the exopolysaccharide produced by a strain of Burkholderia cepacia isolated from a cystic fibrosis patient", Carbohydr.Res., vol. 338, no. 18, pp. 1861-1867.
Sjolund, M., Tano, E., Blaser, M. J., Andersson, D. I., & Engstrand, L. 2005, "Persistence of resistant Staphylococcus epidermidis after single course of clarithromycin", Emerg.Infect.Dis., vol. 11, no. 9, pp. 1389-1393.
Smith, S. M., Eng, R. H., & Padberg, F. T., Jr. 1996, "Survival of nosocomial pathogenic bacteria at ambient temperature", J.Med., vol. 27, no. 5-6, pp. 293-302.
Snell, G. I., de Hoyos, A., Krajden, M., Winton, T., & Maurer, J. R. 1993, "Pseudomonas cepacia in lung transplant recipients with cystic fibrosis", Chest, vol. 103, no. 2, pp. 466- 471.
Sniegowski, P. D., Gerrish, P. J., Johnson, T., & Shaver, A. 2000, "The evolution of mutation rates: separating causes from consequences", Bioessays, vol. 22, no. 12, pp. 1057-1066.
238
References
Sokol, P. A. 1986, "Production and utilization of pyochelin by clinical isolates of Pseudomonas cepacia", J.Clin.Microbiol., vol. 23, no. 3, pp. 560-562.
Sokol, P. A., Darling, P., Woods, D. E., Mahenthiralingam, E., & Kooi, C. 1999, "Role of omibactin biosynthesis in the virulence of Burkholderia cepacia: characterization of pvdA, the gene encoding L-omithine N(5)-oxygenase", Infect.Immun., vol. 67, no. 9, pp. 4443- 4455.
Sokol, P. A., Kooi, C., Hodges, R. S., Cachia, P., & Woods, D. E. 2000, "Immunization with a Pseudomonas aeruginosa elastase peptide reduces severity of experimental lung infections due to P. aeruginosa or Burkholderia cepacia", J.Infect.Dis., vol. 181, no. 5, pp. 1682-1692.
Sokol, P. A., Lewis, C. J., & Dennis, J. J. 1992, "Isolation of a novel siderophore from Pseudomonas cepacia", J.Med.Microbiol., vol. 36, no. 3, pp. 184-189.
Sokol, P. A., Sajjan, U., Visser, M. B., Gingues, S., Forstner, J., & Kooi, C. 2003, "The CepIR quorum-sensing system contributes to the virulence of Burkholderia cenocepacia respiratory infections", Microbiology, vol. 149, no. Pt 12, pp. 3649-3658.
Sokol, P. A. & Woods, D. E. 1988, "Effect of pyochelin on Pseudomonas cepacia respiratory infections", Microb.Pathog., vol. 5, no. 3, pp. 197-205.
Speer, B. S. & Salyers, A. A. 1988, "Characterization of a novel tetracycline resistance that functions only in aerobically grown Escherichia coli", J.Bacteriol., vol. 170, no. 4, pp. 1423-1429.
Speer, B. S. & Salyers, A. 1989, "Novel aerobic tetracycline resistance gene that chemically modifies tetracycline", J.Bacteriol., vol. 171, no. l ,pp. 148-153.
Speert, D. P. 2002, "Advances in Burkholderia cepacia complex", Paediatr.Respir.Rev., vol. 3, no. 3, pp. 230-235.
Speert, D. P., Bond, M., Woodman, R. C., & Cumutte, J. T. 1994, "Infection with Pseudomonas cepacia in chronic granulomatous disease: role of nonoxidative killing by neutrophils in host defense", J.Infect.Dis., vol. 170, no. 6, pp. 1524-1531.
Speert, D. P., Steen, B., Halsey, K., & Kwan, E. 1999, "A murine model for infection with Burkholderia cepacia with sustained persistence in the spleen", Infect.Immun., vol. 67, no. 8, pp. 4027-4032.
Spellberg, B., Powers, J., Brass, E. P., Miller, L.G., Edwards, J. E. 2004, "Trends in antimicrobial drug development: implications for the future", Clin. Inf. Dis., vol. 38, pp. 1279-1286.
Spoering, A. L. & Lewis, K. 2001, "Biofilms and planktonic cells of Pseudomonas aeruginosa have similar resistance to killing by antimicrobials", J.Bacteriol., vol. 183, no. 23, pp. 6746-6751.
Stanier, R. Y. & Doudoroff, M. 1966, "The aerobic pseudomonads: a taxonomic study.", J. Gen. Microbiol., vol. 43, pp. 159-271.
239
References
Steck, T. R., Franco, R. J., Wang, J. Y., & Drlica, K. 1993, "Topoisomerase mutations affect the relative abundance of many Escherichia coli proteins", Mol.Microbiol., vol. 10, no. 3, pp. 473-481.
Steinberg, D. A., Hurst, M. A., Fujii, C. A., Kung, A. H., Ho, J. F., Cheng, F. C., Loury,D. J., & Fiddes, J. C. 1997, "Protegrin-1: a broad-spectrum, rapidly microbicidal peptide with in vivo activity", Antimicrob.Agents Chemother., vol. 41, no. 8, pp. 1738-1742.
Stephan, H., Freund, S., Beck, W., Jung, G., Meyer, J. M., & Winkelmann, G. 1993, "Omibactins-a new family of siderophores from Pseudomonas", Biometals, vol. 6, no. 2, pp. 93-100.
Stepanovic, S., Djukic, N., Djordjevic, V., & Djukic, S. 2003, "Influence of the incubation atmosphere on the production of biofilm by staphylococci", Clin. Microbiol. Infect., vol. 9, no. 9, pp. 955-958.
Stevens, M. P., Wood, M. W., Taylor, L. A., Monaghan, P., Hawes, P., Jones, P. W., Wallis, T. S., & Galyov, E. E. 2002, "An Inv/Mxi-Spa-like type III protein secretion system in Burkholderia pseudomallei modulates intracellular behaviour of the pathogen", Mol Microbiol, vol. 46, no. 3, pp. 649-659.
Stewart, P. S. 1996, "Theoretical aspects of antibiotic diffusion into microbial biofilms", Antimicrob.Agents Chemother., vol. 40, no. 11, pp. 2517-2522.
Stewart, P. S. 1998, "A review of experimental measurements of effective diffusive permeabilities and effective diffusion coefficients in biofilms", Biotechnol.Bioeng, vol. 59, no. 3, pp. 261-272.
Stewart, P. S. & Costerton, J. W. 2001, "Antibiotic resistance of bacteria in biofilms", Lancet, vol. 358, no. 9276, pp. 135-138.
Stokes, H. W., O'Gorman, D. B., Recchia, G. D., Parsekhian, M., & Hall, R. M. 1997, "Structure and function of 59-base element recombination sites associated with mobile gene cassettes", Mol.Microbiol., vol. 26, no. 4, pp. 731-745.
Stoodley, P., Debeer, D., & Lewandowski, Z. 1994, "Liquid Flow in Biofilm Systems", Appl.Environ.Microbiol., vol. 60, no. 8, pp. 2711-2716.
Stoodley, P., Dodds, I., Boyle, J. D., & Lappin-Scott, H. M. 1999, "Influence of hydrodynamics and nutrients on biofilm structure", J.Appl.Microbiol pp. 19S-28S.
Stoodley, P., Sauer, K., Davies, D. G., & Costerton, J. W. 2002, "Biofilms as complex differentiated communities", Annu.Rev.Microbiol, vol. 56, pp. 187-209.
Stover, G. B., Drake, D. R., & Montie, T. C. 1983, "Virulence of different Pseudomonas species in a burned mouse model: tissue colonization by Pseudomonas cepacia", Infect.Immun., vol. 41, no. 3, pp. 1099-1104.
Sun, L., Jiang, R. Z., Steinbach, S., Holmes, A., Campanelli, C., Forstner, J., Sajjan, U., Tan, Y., Riley, M., & Goldstein, R. 1995, "The emergence of a highly transmissible lineage of cbl+ Pseudomonas (.Burkholderia) cepacia causing CF centre epidemics in North America and Britain", Nat.Med., vol. 1, no. 7, pp. 661-666.
240
References
Tablan, O. C., Carson, L. A., Cusick, L. B., Bland, L. A., Martone, W. J., & Jarvis, W. R. 1987, "Laboratory proficiency test results on use of selective media for isolating Pseudomonas cepacia from simulated sputum specimens of patients with cystic fibrosis", J.Clin.Microbiol, vol. 25, no. 3, pp. 485-487.
Tablan, O. C., Martone, W. J., Doershuk, C. F., Stem, R. C., Thomassen, M. J., Klinger, J.D., White, J. W., Carson, L. A., & Jarvis, W. R. 1987, "Colonization of the respiratory tract with Pseudomonas cepacia in cystic fibrosis. Risk factors and outcomes", Chest, vol. 91, no. 4, pp. 527-532.
Takenouchi, T., Sakagawa, E., & Sugawara, M. 1999, "Detection of gyrA mutations among 335 Pseudomonas aeruginosa strains isolated in Japan and their susceptibilities to fluoroquinolones", Antimicrob.Agents Chemother., vol. 43, no. 2, pp. 406-409.
Tan, M. W. & Ausubel, F. M. 2000, "Caenorhabditis elegans: a model genetic host to study Pseudomonas aeruginosa pathogenesis", Curr.Opin.Microbiol, vol. 3, no. 1, pp. 29- 34.
Tan, M. W., Mahajan-Miklos, S., & Ausubel, F. M. 1999, "Killing of Caenorhabditis elegans by Pseudomonas aeruginosa used to model mammalian bacterial pathogenesis", Proc.Natl.Acad.Sci. U.S.A, vol. 96, no. 2, pp. 715-720.
Tanaka, M., Nakayama, H., Haraoka, M., & Saika, T. 2000, "Antimicrobial resistance of Neisseria gonorrhoeae and high prevalence of ciprofloxacin-resistant isolates in Japan, 1993 to 1998", J.Clin.Microbiol., vol. 38, no. 2, pp. 521-525.
Tanlan, D.A. 2001. "Clinical perspectives on new antimicrobials: Focus on FQs", CID vol. 32 (Suppl), pp. 264-71.
Tavio, M. M., Vila, J., Ruiz, J., Ruiz, J., Martin-Sanchez, A. M., & Jimenez de Anta, M. T. 1999, "Mechanisms involved in the development of resistance to fluoroquinolones in Escherichia coli isolates", J.Antimicrob.Chemother., vol. 44, no. 6, pp. 735-742.
Teitzel, G. M. & Parsek, M. R. 2003, "Heavy metal resistance of biofilm and planktonic Pseudomonas aeruginosa", Appl.Environ.Microbiol., vol. 69, no. 4, pp. 2313-2320.
Then, R.L. 1982. "Mechanisms of resistance to trimethoprim, the suplonamides and trimethoprim-sulfamethoxazole", Rev. Infect. Dis., vol. 4, no.2, pp. 261-269.
Tomich, M., Griffith, A., Herfst, C. A., Bums, J. L., & Mohr, C. D. 2003, "Attenuated virulence of a Burkholderia cepacia type III secretion mutant in a murine model of infection", Infect.Immun., vol. 71, no. 3, pp. 1405-1415.
Tomlin, K. L., Clark, S. R., & Ceri, H. 2004, "Green and red fluorescent protein vectors for use in biofilm studies of the intrinsically resistant Burkholderia cepacia complex", J.Microbiol Methods, vol. 57, no. 1, pp. 95-106.
Tomlin, K. L., Coll, O. P., & Ceri, H. 2001, "Interspecies biofilms of Pseudomonas aeruginosa and Burkholderia cepacia", Can. J.Microbiol, vol. 47, no. 10, pp. 949-954.
241
References
Tomlin, K. L., Malott, R. J., Ramage, G., Storey, D. G., Sokol, P. A., & Ceri, H. 2005, "Quorum-sensing mutations affect attachment and stability of Burkholderia cenocepacia biofilms", Appl Environ. Microbiol, vol. 71, no. 9, pp. 5208-5218.
Tran, J. H., Jacoby, G. A., & Hooper, D. C. 2005, "Interaction of the plasmid-encoded quinolone resistance protein Qnr with Escherichia coli DNA gyrase", Anti microb.Agents Chemother., vol. 49, no. 1, pp. 118-125.
Truong, Q. C., Nguyen, V. J., Shlaes, D., Gutmann, L., & Moreau, N. J. 1997, "A novel, double mutation in DNA gyrase A of Escherichia coli conferring resistance to quinolone antibiotics", Antimicrob.Agents Chemother., vol. 41, no. 1, pp. 85-90.
Tsuchiya, K., Homma, Y., Komoto, Y., & Suzui, T. 1995, "Practical detection of Pseudomonas cepacia from rhizosphere antagonistic to plant pathogens with a combination of selective medium and ELISA", Annals o f Phytopathology Society o f Japan, vol. 61, pp. 318-324.
Turner, A. K., Nair, S., & Wain, J. 2006, "The acquisition of full fluoroquinolone resistance in Salmonella typhi by accumulation of point mutations in the topoisomerase targets", J.Antimicrob.Chemother., vol. 58, no. 4, pp. 733-740.
Ulrich, R. L. & DeShazer, D. 2004, "Type III secretion: a virulence factor delivery system essential for the pathogenicity of Burkholderia mallei", Infect.Immun., vol. 72, no. 2, pp. 1150-1154.
Urban, T. A., Griffith, A., Torok, A. M., Smolkin, M. E., Bums, J. L., & Goldberg, J. B. 2004, "Contribution of Burkholderia cenocepacia flagella to infectivity and inflammation", Infect.Immun., vol. 72, no. 9, pp. 5126-5134.
Valdezate, S., Vindel, A., Echeita, A., Baquero, F., & Canto, R. 2002, "Topoisomerase II and IV quinolone resistance-determining regions in Stenotrophomonas maltophilia clinical isolates with different levels of quinolone susceptibility", Antimicrob.Agents Chemother., vol. 46, no. 3, pp. 665-671.
Van Bambeke, F., Balzi, E., & Tulkens, P. M. 2000, "Antibiotic efflux pumps", Biochem.Pharmacol., vol. 60, no. 4, pp. 457-470.
van Laer, F., Raes, D., Vandamme, P., Lammens, C., Sion, J. P., Vrints, C., Snoeck, J., & Goossens, H. 1998, "An outbreak of Burkholderia cepacia with septicemia on a cardiology ward", Infect.Control Hosp.Epidemiol, vol. 19, no. 2, pp. 112-113.
van Pelt, C., Verduin, C. M., Goessens, W. H., Vos, M. C., Tummler, B., Segonds, C., Reubsaet, F., Verbrugh, H., & van Belkum, A. 1999, "Identification of Burkholderia spp. in the clinical microbiology laboratory: comparison of conventional and molecular methods", J.Clin.Microbiol., vol. 37, no. 7, pp. 2158-2164.
van Soolingen, D., Borgdorff, M. W., de Haas, P. E., Sebek, M. M., Veen, J., Dessens, M., Kremer, K., & van Embden, J. D. 1999, "Molecular epidemiology of tuberculosis in the Netherlands: a nationwide study from 1993 through 1997", J.Infect.Dis., vol. 180, no. 3, pp. 726-736.
242
References
van Veen, H. W. & Konings, W. N. 1998, "The ABC family of multidrug transporters in microorganisms", Biochim.Biophys.Acta, vol. 1365, no. 1-2, pp. 31-36.
Vandamme, P., Govan, J. and LiPuma, J. 2007, “Diversity and role of Burkholderia spp” in Burkholderia. Molecular Microbiology and Genomics, Coeyne, T. & Vandamme, P ., Horizon Bioscience, Wymondham, Norfolk. Chapter 1. pp 1-28.
Vandamme, P., Henry, D., Coenye, T., Nzula, S., Vancanneyt, M., LiPuma, J. J., Speert, D. P., Govan, J. R., & Mahenthiralingam, E. 2002, "Burkholderia anthina sp. nov. and Burkholderia pyrrocinia, two additional Burkholderia cepacia complex bacteria, may confound results of new molecular diagnostic tools", FEMS Immunol. Med. Microbiol., vol. 33, no. 2, pp. 143-149.
Vandamme, P., Holmes, B., Coenye, T., Goris, J., Mahenthiralingam, E., LiPuma, J. J., & Govan, J. R. 2003, "Burkholderia cenocepacia sp. nov.—a new twist to an old story", Res.Microbiol, vol. 154, no. 2, pp. 91-96.
Vandamme, P., Holmes, B., Vancanneyt, M., Coenye, T., Hoste, B., Coopman, R., Revets,H., Lauwers, S., Gillis, M., Kersters, K., & Govan, J. R. 1997, "Occurrence of multiple genomovars of Burkholderia cepacia in cystic fibrosis patients and proposal of Burkholderia multivorans sp. nov", Int.J.Syst.Bacteriol., vol. 47, no. 4, pp. 1188-1200.
Vandamme, P., Mahenthiralingam, E., Holmes, B., Coenye, T., Hoste, B., De Vos, P., Henry, D., & Speert, D. P. 2000, "Identification and population structure of Burkholderia stabilis sp. nov. (formerly Burkholderia cepacia genomovar IV)", J.Clin.Microbiol., vol. 38, no. 3, pp. 1042-1047.
Vandamme, P., Pot, B., Gillis, M., De Vos, P., Kersters, K., & Swings, J. 1996, "Polyphasic taxonomy, a consensus approach to bacterial systematics", Microbiol.Rev., vol. 60, no. 2, pp. 407-438.
Venturi, V., Friscina, A., Bertani, I., Devescovi, G., & Aguilar, C. 2004, "Quorum sensing in the Burkholderia cepacia complex", Res.Microbiol, vol. 155, no. 4, pp. 238-244.
Vermis, K., Coenye, T., LiPuma, J. J., Mahenthiralingam, E., Nelis, H. J., & Vandamme, P. 2004, "Proposal to accommodate Burkholderia cepacia genomovar VI as Burkholderia dolosa sp. nov", Int. J.Syst.Evol.Microbiol., vol. 54, no. Pt 3, pp. 689-691.
Vila, J., Ruiz, J., Goni, P., & De Anta, M. T. 1996, "Detection of mutations in parC in quinolone-resistant clinical isolates of Escherichia coli", Antimicrob.Agents Chemother., vol. 40, no. 2, pp. 491-493.
Vila, J., Ruiz, J., Goni, P., Marcos, A., & Jimenez, D. A. 1995, "Mutation in the gyrA gene of quinolone-resistant clinical isolates of Acinetobacter baumanniF, Antimicrob.Agents Chemother., vol. 39, no. 5, pp. 1201-1203.
Vila, J., Ruiz, J., Marco, F., Barcelo, A., Goni, P., Giralt, E., & Jimenez, d. A. 1994, "Association between double mutation in gyrA gene of ciprofloxacin-resistant clinical isolates of Escherichia coli and MICs", Antimicrob.Agents Chemother., vol. 38, no. 10, pp. 2477-2479.
243
References
Visca, P., Ciervo, A., Sanfilippo, V., & Orsi, N. 1993, "Iron-regulated salicylate synthesis by Pseudomonas spp", J. Gen.Microbiol., vol. 139, no. 9, pp. 1995-2001.
Visser, M. B., Majumdar, S., Hani, E., & Sokol, P. A. 2004, "Importance of the omibactin and pyochelin siderophore transport systems in Burkholderia cenocepacia lung infections", Infect.Immun., vol. 72, no. 5, pp. 2850-2857.
Vorachit, M., Lam, K., Jayanetra, P., & Costerton, J. W. 1993, "Resistance of Pseudomonas pseudomallei growing as a biofilm on silastic discs to ceftazidime and co- trimoxazole", Antimicrob.Agents Chemother., vol. 37, no. 9, pp. 2000-2002.
Voss, A., Milatovic, D., Wallrauch-Schwarz, C., Rosdahl, V. T., & Braveny, I. 1994, "Methicillin-resistant Staphylococcus aureus in Europe", Eur.J.Clin.Microbiol Infect.Dis., vol. 13, no. 1, pp. 50-55.
Vrany, J. D., Stewart, P. S., & Suci, P. A. 1997, "Comparison of recalcitrance to ciprofloxacin and levofloxacin exhibited by Pseudomonas aeruginosa bofilms displaying rapid-transport characteristics", Antimicrob.Agents Chemother., vol. 41, no. 6, pp. 1352- 1358.
Waldor, M. K. & Mekalanos, J.J. 1996, "Lysogenic conversion by a filamentous phage encoding cholera toxin", Science, vol. 272, pp. 1910-1914.
Wallmann, J. 2006, "Monitoring of antimicrobial resistance in pathogenic bacteria from livestock animals", Int.J.Med.Microbiol., vol. 296 Suppl 41, pp. 81-86.
Walsh, C. 2000, "Molecular mechanisms that confer antibacterial drug resistance", Nature, vol. 406, no. 6797, pp. 775-781.
Wang, C. X. & Mi, Z. H. 2006, "Imipenem-resistant Pseudomonas aeruginosa producing IMP-1 metallo-beta-lactamases and lacking the outer-membrane protein OprD", J.Med.Microbiol., vol. 55, no. Pt 3, pp. 353-354.
Wang, H., Dzink-Fox, J. L., Chen, M., & Levy, S. B. 2001, "Genetic characterization of highly fluoroquinolone-resistant clinical Escherichia coli strains from China: role of acrR mutations", Antimicrob.Agents Chemother., vol. 45, no. 5, pp. 1515-1521.
Wang, J. C. 1985, "DNA Topoisomerase", Annual Review o f Biochemistry, vol. 54, no. 1, pp. 665-697.
Wang, M., Sahm, D. F., Jacoby, G. A., & Hooper, D. C. 2004, "Emerging plasmid- mediated quinolone resistance associated with the qnr gene in Klebsiella pneumoniae clinical isolates in the United States", Antimicrob.Agents Chemother., vol. 48, no. 4, pp. 1295-1299.
Wang, M., Tran, J. H., Jacoby, G. A., Zhang, Y., Wang, F., & Hooper, D. C. 2003, "Plasmid-mediated quinolone resistance in clinical isolates of Escherichia coli from Shanghai, China", Antimicrob.Agents Chemother., vol. 47, no. 7, pp. 2242-2248.
Wames, A. & Stephenson, J. R. 1986, "The insertion of large pieces of foreign genetic material reduces the stability of bacterial plasmids", Plasmid, vol. 16, no. 2, pp. 116-123.
244
References
Watnick, P. I. & Kolter, R. 1999, "Steps in the development of a Vibrio cholerae El Tor biofilm", Mol.Microbiol., vol. 34, no. 3, pp. 586-595.
Weigel, L. M., Anderson, G. J., & Tenover, F. C. 2002, "DNA gyrase and topoisomerase IV mutations associated with fluoroquinolone resistance in Proteus mirabilis", Antimicrob.Agents Chemother., vol. 46, no. 8, pp. 2582-2587.
Wetzstein, H. G., Schmeer, N., & Karl, W. 1997, "Degradation of the fluoroquinolone enrofloxacin by the brown rot fungus Gloeophyllum striatum: identification of metabolites", Appl.Environ.Microbiol., vol. 63, no. 11, pp. 4272-4281.
Whiteley, M., Bangera, M. G., Bumgarner, R. E., Parsek, M. R., Teitzel, G. M., Lory, S., & Greenberg, E. P. 2001, "Gene expression in Pseudomonas aeruginosa biofilms", Nature, vol. 413, no. 6858, pp. 860-864.
Whiteley, M., Lee, K. M., & Greenberg, E. P. 1999, "Identification of genes controlled by quorum sensing in Pseudomonas aeruginosa", Proc.Natl.Acad.Sci.U.S.A, vol. 96, no. 24, pp. 13904-13909.
Wichelhaus, T. A., Boddinghaus, B., Besier, S., Schafer, V., Brade, V., & Ludwig, A. 2002, "Biological cost of rifampin resistance from the perspective of Staphylococcus aureus", Antimicrob.Agents Chemother., vol. 46, no. 11, pp. 3381-3385.
Wilke, C. O., Wang, J. L., Ofria, C., Lenski, R. E., & Adami, C. 2001, "Evolution of digital organisms at high mutation rates leads to survival of the flattest", Nature, vol. 412, no. 6844, pp. 331-333.
Willmott, C. J. & Maxwell, A. 1993, "A single point mutation in the DNA gyrase A protein greatly reduces binding of fluoroquinolones to the gyrase-DNA complex", Antimicrob.Agents Chemother., vol. 37, no. 1, pp. 126-127.
Wilson, T. M., de Lisle, G. W., & Collins, D. M. 1995, "Effect of inhA and katG on isoniazid resistance and virulence of Mycobacterium bovis", Mol.Microbiol., vol. 15, no. 6, pp. 1009-1015.
Witte, W., Klare, I., & Werner, G. 1999, "Selective pressure by antibiotics as feed additives", Infection, vol. 27 Suppl 2, p. S35-S38.
Wright, S. 1932, "The roles of mutation, inbreeding, crossbreeding, and selection in evolution", Proceedings o f the Sixth International Congress on Genetics pp. 355-366.
Wroblewska, M. M., Rudnicka, J., Marchel, H., & Luczak, M. 2006, "Multidrug-resistant bacteria isolated from patients hospitalised in Intensive Care Units", Int.J.Antimicrob.Agents, vol. 27, no. 4, pp. 285-289.
Xu, K. D., McFeters, G. A., & Stewart, P. S. 2000, "Biofilm resistance to antimicrobial agents", Microbiology, vol. 146 ( Pt 3), pp. 547-549.
Yabuuchi, E., Kosako, Y., Oyaizu, H., Yano, I., Hotta, H., Hashimoto, Y., Ezaki, T., & Arakawa, M. 1992, "Proposal of Burkholderia gen. nov. and transfer of seven species of the genus Pseudomonas homology group II to the new genus, with the type species
245
References
Burkholderia cepacia (Palleroni and Holmes 1981) comb, nov", Microbiol Immunol., vol. 36, no. 12, pp. 1251-1275.
Yabuuchi, E., Kawamura, Y., Ezaki, T., Ikedo, M., Dejsirilert, S., Fujiwara, N., Naka, T., & Kobayashi, K. 2000. Burkholderia uboniae sp. nov., L-arabinose assimilating but different from Burkholderia thailandensis and Burkholderia vietnamiensis. Microbiol. Immunol. 44, 307-317.
Yonezawa, M., Takahata, M., Matsubara, N., Watanabe, Y., & Narita, H. 1995, "DNA gyrase gyrA mutations in quinolone-resistant clinical isolates of Pseudomonas aeruginosa", Antimicrob.Agents Chemother., vol. 39, no. 9, pp. 1970-1972.
Yoshida, H., Bogaki, M., Nakamura, M., & Nakamura, S. 1990a, "Quinolone resistance- determining region in the DNA gyrase gyrA gene of Escherichia coli", Antimicrob.Agents Chemother., vol. 34, no. 6, pp. 1271-1272.
Yoshida, H., Nakamura, M., Bogaki, M., & Nakamura, S. 1990b, "Proportion of DNA gyrase mutants among quinolone-resistant strains of Pseudomonas aeruginosa", Antimicrob.Agents Chemother., vol. 34, no. 6, pp. 1273-1275.
Yoshida, H., Bogaki, M., Nakamura, M., Yamanaka, C. M. & Nakamura, S. 1991, "Quinolone Resistance Determining Region in DNA gyrase gyrB gene of Escherichia coli". Antimicrob.Agents Chemother., vol. 34, no. 6, pp. 1647-1650.
Youmans, G. P. & Youmans. A. S. 1949, "A method for the determination of the rate of growth of tubercle bacilli by the use of small Inocula", J.Bacteriol., vol. 58, pp. 247-255.
Ysem, P., Clerch, B., Castano, M., Gibert, I., Barbe, J., & Llagostera, M. 1990, "Induction of SOS genes in Escherichia coli and mutagenesis in Salmonella typhimurium by fluoroquinolones", Mutagenesis, vol. 5, no. 1, pp. 63-66.
Zelver, N., Hamilton, M., Pitts, B., Goeves, D., Walker, D., & Sturman, P. H. J. 1999, "Measuring antimicrobial effects on biofilm bacteria: from laboratory to field" in Biofilms:Methods in Enzymology, vol. 310 R. Doyle, ed., Academic Press, San Diego, pp. 608-628.
Zhou, J., Chen, Y., Tabibi, S., Alba, L., Garber, E., & Saiman, L. 2007, "Antimicrobial susceptibility and synergy studies of Burkholderia cepacia complex isolated from patients with cystic fibrosis", Antimicrob.Agents Chemother., vol. 51, no. 3, pp. 1085-1088.
Zhou, J., Dong, Y., Zhao, X., Lee, S., Amin, A., Ramaswamy, S., Domagala, J., Musser, J. M., & Drlica, K. 2000, "Selection of antibiotic-resistant bacterial mutants: allelic diversity among fluoroquinolone-resistant mutations", J.Infect.Dis., vol. 182, no. 2, pp. 517-525.
246
Publications arising from thesis
Pope, C. F., Gillespie, S. H., Pratten, J. R. & McHugh, T. D. 2008, "Investigation on Fluoroquinolone- Resistant mutants of Burkholderia cepacia" Antimicrob. Agent Chemother., vol 52, no. 3, pp. 1203-3.
Pope, C. F., O’Sullivan, D.M., McHugh, T. D. & Gillespie, S. H., 2008, "A practical guide to measuring mutation rates in antibiotic resistance." Antimicrob. Agent Chemother., vol 52, no. 4, pp. 1209-14.
Pope, C. F., McHugh, T. D., Pratten, J. R. & Gillespie, S. H. 2007, "Measuring bacterial fitness" In Biofilms: coming o f age, Gilbert P., Allison D, Brading M, Pratten J., Spratt D. and Upton M. (Eds.). University of Manchester, Contributions to 8th Meeting of Biofilm Club, 5th-7th Sept, 2007, Powys (UK), pp22-33. ISBN 0- 9551030-1-0.
Pope, C. F., McHugh, T. D., & Gillespie, S. H. 2008 "Rapid methods to determine fitness in bacteria using automated culture systems". Commisioned and accepted. Antibiotic Resistance: Methods and Protocols, 2nd edition. S. H. Gillespie (Ed). Methods in Molecular Medicine. Humana Press.
247
A n t im ic r o b ia l A gents a n d C h e m o t h e r a p y , M ar. 2008, p. 1201-1203 0066-4804/08/$08.00+0 doi: 10.1128/AAC.00799-07Copyright © 2008, American Society for Microbiology. All Rights Reserved.
Vol. 52. No. 3
Fluoroquinolone-Resistant Mutants of Burkholderia cepaciavC. F. Pope,1 S. H. Gillespie,1 J. R. Pratten,2 and T. D. McHugh1*
Centre for Medical Microbiology, Royal Free and University College Medical School, Rowland Hill Street, London NW3 2QG , 1 and UCL Eastman Dental Institute, Gray’s Inn Road, London W C1X 8L D ,2 United Kingdom
Received 20 June 2007/Returned for modification 6 August 2007/Accepted 16 December 2007
Fluoroquinolone-resistant Burkholderia cepacia mutants were selected on ciprofloxacin. The rate of mutation in gyrA was estimated to be 9.6 x 10“ 11 mutations per division. Mutations in gyrA conferred 12- to 64-fold increases in MIC, and an additional parC mutation conferred a large increase in MIC (>256-fold). Growth rate, biofilm formation, and survival in water and during drying were not impaired in strains containing single gyrA mutations. Double mutants were impaired only in growth rate (0.85, relative to the susceptible parent).
Exposure to fluoroquinolones increases mutation rates (9, 12, 20, 26) to various degrees (23). The main mechanism of resistance in gram-negative bacteria develops via stepwise accumulation of mutations in the quinolone resistance-determining region (Q R D R ) of topoisomerase genes (4, 7, 8, 13).
Opportunistic pathogens of the Burkholderia cepacia complex (BCC) consist o f genomovars that are important in cystic fibrosis patients (14, 17). Genomovars are species which are phylogenetically distinguishable but phenotypically indistinguishable from each other. Here, BCC refers to the complex, while B. cepacia refers to genomovar I. BCC bacteria can survive in respiratory droplets on surfaces (6) and are resistant to many antibacterial agents.
Resistance to drying allows maintenance on environmental surfaces (24) and transmission between hosts. Transmission between colonized patients has been documented (18).
The objective of this work was to investigate the effects of fluoroquinolone resistance mutations on growth rate, biofilm formation, and environmental survival.
B. cepacia 10661 (National Collection o f Type Cultures, HPA, London, United Kingdom) and mutants derived from this strain were used. The MICs of parent and mutant strains were determined by the ciprofloxacin Etest (AB Biodisk, Solna, Sweden).
The ciprofloxacin MIC of B. cepacia 10661 was 1 |xg/ml. Putative resistant mutants were selected at 2 x , 4 x , and 6X MIC in three separate experiments. Estimation of the mutation rate was performed using ciprofloxacin at 6 x MIC. Characterized first-step mutants were used to obtain second-step mutants by selecting first-step mutations on media containing twice the MIC of the first-step mutants. The numbers of viable cells, from three aliquots (approximately 10%), were determined using the method o f Miles and Misra in order to determine total cell numbers (3, 11). The plates were incubated at 37°C for 18 h, and the proportion o f cultures with mutant colonies were recorded. The mutation rate (p.) was determined using the p 0 method (10, 19, 21).
* Corresponding author. Mailing address: Centre for Medical Microbiology, Royal Free and University College Medical School, Rowland Hill Street, London NW3 2PF, United Kingdom. Phone: 44 207472 6402. Fax: 44 20 7794 0500, ext. 3540. E-mail: [email protected].
v Published ahead of print on 26 December 2007.
Approximately 102 exponentially growing cells were independently inoculated into 28 tubes, each containing 3 ml of Mueller-Hinton broth (Oxoid, Basingstoke, United Kingdom), and incubated at 37°C for 22 h on an orbital shaker (250 rpm; Barloworld Scientific, Rochester, NY). The cells were harvested by centrifugation (2,000 X g , 10 min), the supernatant was removed with a pipette, and the pellet was resuspended in 400 p.1 of Mueller-Hinton broth and then plated onto Mueller- Hinton agar (Oxoid, Basingstoke, United Kingdom) containing ciprofloxacin.
The mutants were characterized by sequencing the QRDRs of gyrA, gyrB, parC, and parE by using the primers listed in Table 1. Standard PCR conditions were employed. Sequencing was performed by the dideoxy method as previously described (15).
No mutations (0/45) were found in the QRDRs of the topoisomerase genes of B. cepacia selected at 2 x MIC. The MIC of these nontopoisomerase mutants was 4 to 5 p,g/ml. At 4X MIC, an Asp87Asn mutation, conferring a 16-fold increase in MIC, was found in colonies from one plate (2/55). All other mutants (53/55) selected at this concentration contained no mutations in the Q RDRs (MICs between 4 and 5 p-g/ml). All first-step mutants selected at 6 X MIC (50/50) contained a Thr83IIe mutation in gyrA and had an MIC of 64 p-g/ml. Mutations, MIC, and selection step information are shown in Table 2. Mutation rates for second-step mutations were higher than those for the first-step mutations.
To detect efflux activity, the ciprofloxacin MIC of the fluoroquinolone-resistant mutants was determined in the absence and presence o f reserpine (25 (xg/ml) in Mueller-Hinton agar (2). The MICs of all mutants that did not contain gyrA mutations, selected at either 2 x MIC (45 mutants tested) or 4 x MIC (55 mutants tested), decreased fivefold in the presence of reserpine to the level o f the wild type. The MICs of mutants containing topoisomerase mutations did not decrease.
The quantification of biofilm growth was achieved by the spectrophotometric measurement o f crystal violet binding by following a previously published method (5). Mutation in gyrA and parC did not affect biofilm formation in B. cepacia. All fitness assays were carried out with one mutation of each type (data not shown).
We modified the method of Youmans and Youmans (25) to determine time to positivity as an indicator of the growth rate.
1201
Dow
nloaded from
aac.asm.org
by on
Novem
ber 27, 2008
1202 NOTES A n t im ic r o b . A g e n ts C h e m o t h e r .
TABLE 1. Primers used to amplify the QRDRs of the topoisomerase genes of B. cepacia
G enePrim er
positions" S equence ( 5 '- 3 ') A m plicon size (bp)
gyrA 62-81493-511
5' ATCTCGATTACGCGATGAGC 5' GCCGTTGATCAGCAGGTT
449
gyrB 1127-11461502-1520
5' GAGGAAGTTGTGGCGAAGG 5' AGTCTTCCTTGCCGATGC
400
parC 98-118295-315
5' ATTGGTCAGGGTCGTGAAGA 5' GTAGCGCAGCGAGAAATCCT
229
parE 1178-11981557-1577
5' CAGGGCAAGGTAGTCGAAAA 5' GTGAGCAGCAAGGTCTGGAT
380
" B. cenocepacia num bering.
The Bactec 9240 continuous blood culture system with standard aerobic medium (Plus Aerobic/F) was used. Aliquots of 100 |xl of the diluted exponential culture (1/10 and 1/1,000) were removed using a 0.5-ml syringe and a needle and were aseptically inoculated into duplicate culture vials. The length of time to detection (time to positivity) was measured for all strains. Gram staining and a purity plate assay were performed to confirm the absence of contaminants.
The growth rate constant, k, was determined using equation 1 (where A is the largest inoculum employed, B is the smallest inoculum, and t is the difference in time to positivity in hours). The generation time (G) was determined using equation 2.
k =log A — log B
G =log 2
( 1)
(2 )
This experiment was repeated in triplicate. The growth rates of the double mutants relative to those of the parent were 0.88 and 0.83 for mutant strains F3 and F4, respectively, as shown in Table 2.
Competition assays were used to measure the fitness of the fluoroquinolone mutants compared to that of the susceptible parent by the use of a modified version of our previously published method (3 ,11). The optical densities of the wild-type and mutant isolates were adjusted to the same value (1.0 optical density unit). Then, 250 pi o f each culture was inoculated
1.00E+06-
1.00E+050 1 2 3 4 5 6 7 8 9 10 11 12 13
• Parent F1 F2 F3 F4
Time (days)
FIG. 1. Effect of topoisomerase mutations on the survival of B. cepacia in water. Survival of B. cepacia in water was not affected by mutation in gyrase subunit A or topoisomerase IV. Error bars indicate the standard errors of the means. Differences in survival are not significant.
into 15 ml o f LB broth in the absence of antibiotics. This mixed culture was incubated for 10 h (200 rpm). The relative fitness of each strain was calculated from the ratio of the number of generations grown by the resistant strains to the number grown by the susceptible strains. Five independent pairwise cultures were performed for each mutant. The relative growth rates of mutant strains F3 and F4 were 0.80 and 0.78, respectively. The differences in relative growth rates of the strains with the single gyrA mutations found during paired competition assays were not significant, as determined by Student’s t test. However, these assays cannot measure differences of >1%.
Survival in water and survival during drying were assessed using the method employed by Sanchez et al. (22). No significant differences in environmental survival were found between the mutants and the susceptible parent, as shown in Fig. 1 and Fig. 2.
Selection at lower concentrations of fluoroquinolone resulted in mutants in which resistance was apparently due to an altered expression of an efflux pump. Similarly, Zhou ct al. demonstrated that low concentrations of fluoroquinolone selected nongyrase mutants o f Mycobacterium smegmatis (27).
At higher selection concentrations of ciprofloxacin (4 x and 6 X MIC), mutations in the topoisomerase genes were found. Lower-level resistance (12- to 64-fold) was caused by single mutations in gyrA. Higher-level resistance (MIC of >256 ixg/
TABLE 2. Characteristics of fluoroquinolone-resistant B. cepacia mutants selected in vitro"
Strain
M utationra te
(m u ta tion /division)
M IC(p-g/ffl)
S electionstep
Sequence found in Q R D R s of: G en e ra tio n tim e [m in (95%
confidence in terval)]
Fvalue
Relativefitness
( ± S E M f
Fvalue
gyrA gyrB parC parE
WT 1 WT WT WT WT 38.0 (37.06-38.94)FI mutant 9.6 X 10“ 11 12 1st Asp87Asn WT WT WT 37.0 (36.77-37.23) 0.331 1.01 ± 0.01 0.831F2 mutant 9.6 X 10"11 64 1st Thr83Ile WT WT WT 37.1 (36.9-37.3) 0.377 1.01 ± 0.152 0.868F3 mutant 1.1 X 10"10 >256 2nd Asp87Asn WT Ser80Leu WT 43.0 (41.85-44.15) 0.004 0.80 ± 0.12 0.003F4 mutant 6.8 x 10"10 >256 2nd Thr83Ile WT Ser80Leu WT 45.7 (44.2-47.2) 0.001 0.78 ± 0.18 0.002
" Strain F I was iso la ted on 2 (o-g/mt ciprofloxacin (2 x M IC ); F2 was iso la ted on 6 M-g/ml (6X M IC ), F3 was iso la ted on 24 p.g/ml ciprofloxacin by the use o f FI as the starting point; F4 was iso la ted on 128 p.g/ml ciprofloxacin by the use o f F2 as the starting point. T he statistical significance o f genera tion tim e differences is shown by a P value. W T, wild type.
h C om petition assays w ere used to m easu re the fitness o f th e fluoroquinolone m utants relative to tha t o f the susceptib le parent.
Dow
nloaded from
aac.asm.org
by on
Novem
ber 27, 2008
V o l . 5 2 ,2008 NOTES 1203
1 00E+08 -|
1 00E+07
1 00E+06 -
1 00E+05
1 00E+04
1 00E+03 -
1 00E+02
1 00E+01
1 OOE+OO
P a r e n t
\0 1 2 3 4 5 6 7 8
T im e (h o u r s )
FIG. 2. Effect of topoisomerase mutations on the survival of B. cepacia on dry surfaces. Survival of B. cepacia in water was not affected by mutation in gyrase subunit A or topoisomerase IV. Error bars indicate the standard errors of the means. Error bars are not shown if obscured by the symbol. Differences in survival are not significant.
ml) required mutations in both gyrA and parC. The same second-step mutation occurred irrespective o f the starting point.
Single-step fluoroquinolone resistance in gyrA occurs at low or no cost to B. cepacia, and this has been observed for other bacteria (11, 1, 16). These mutants may, therefore, remain in the bacterial population in the absence of an antibiotic selective pressure.
We thank Tyrone Pitt (HPA, London, United Kingdom) for advice and for kindly providing reference strains.
REFERENCES
1. Bagel, S., V. Hullen, B. W iedem ann, and P. H eisig . 1999. Im pact o f gyrA and parC m utations on qu ino lone resistance , doub ling tim e, and supercoiling degree o f Escherichia coli. A n tim icrob . A gen ts C hem other. 43:868-875.
2. Beyer, R., E. Pestova, J. J. M illichap, V. Stosor, G. A. N oskin, and L. R. Peterson. 2000. A conven ien t assay fo r estim ating the possible involvem ent o f efflux o f fluoroqu ino lones by Streptococcus pneum oniae and Staphylococcus aureus: evidence fo r d im in ished m oxifloxacin, sparfioxacin, and trova- floxacin efflux. A ntim icrob . A gen ts C hem o th er. 44:798-801.
3. Billington, O. J., T . D. M cHugh, and S. H. G illespie. 1999. Physiological cost o f rifam pin resistance induced in v itro in M ycobacterium tuberculosis. A n timicrob. A gents C hem other. 43:1866-1869.
4. Chen, F. J., and H. J. Lo. 2003. M olecu la r m echanism s o f fluoroquinolone resistance. J. M icrobiol. Im m unol. Infect. 36 :1-9.
5. Conway, B.-A. D., V. Venu, and D. P. Speert. 2002. Biofilm fo rm ation and acyl hom oserine lac tone p ro d u c tio n in the Burkholderia cepacia com plex. J. B acteriol. 184:5678-5685.
6. Drabick, J. A., E. J. Gracely, G. J. Heidecker, and J. J. LiPum a. 1996. Survival o f Burkholderia cepacia on env ironm en ta l surfaces. J. H osp . Infect. 32:267-276.
7. Drlica, K., and M. M alik. 2003. F luoroqu ino lones: action and resistance. C urr. T op . M ed. C hem . 3:249-282.
8. Drlica, K., and X. Zhou. 1997. D N A gyrase, topo isom erase IV , and the 4 -qu ino lones. M icrobiol. M ol. Biol. Rev. 61:377-392.
9. G illespie, S. H., S. Basu, A. L. D ickens, D. M. O'Sullivan, and T. D . M cHugh. 2005. E ffect o f sub inh ib ito ry concen tra tions of ciprofloxacin on M ycobacterium fo r tu itum m u ta tion rates. J. A ntim icrob. C hem other. 56:344-348.
10. G illespie, S. H., L. L. Voelker, J. E. Ambler, C. Traini, and A. Dickens. 2003. F luo ro q u in o lo n e res is tance in Streptococcus pneum oniae: evidence tha t gyrA m u ta tions arise a t a low er ra te and tha t m uta tion in gyrA o r parC p redisposes to fu r th e r m u ta tion . M icrob. D rug Resist. 9:17-24.
11. G illespie, S. H., L. L. Voelker, and A. Dickens. 2002. Evolutionary barriers to q u ino lone res is tance in Streptococcus pneum oniae. M icrob. D rug Resist. 8 :79-84.
12. Gocke, E. 1991. M echan ism o f qu ino lone m utagenicity in bacteria . M utat. R es. 248:135-143.
13. Hooper, D. C. 2003. M echan ism s o f quino lone resistance, p. 41-67. In D. C. H o o p e r an d E. R u b en s te in (ed .), Q uino lone antim icrobial agents. ASM P ress, W ash ing ton , D C.
14. Isles, A., I. M aclusky, M . Corey, R. Gold, C. Prober, P. Fleming, and H. Levison. 1984. P seudom onas cepacia infection in cystic fibrosis: an em erging p rob lem . J. P ed ia tr . 104:206-210.
15. Jenkins, C. 2005. R ifam p ic in resistance in tuberculosis ou tbreak , London, E ngland. E m erg . Infect. D is. 11:931-934.
16. Kugelberg, E., S. Lofm ark, B. W retlind, and D. I. Andersson. 2005. R eduction o f th e fitness b u rd en o f qu ino lone resistance in Pseudom onas aentginosa. J. A n tim icrob . C h em o th e r. 55:22-30.
17. LiPuma, J. J. 1998. Burkholderia cepacia. M anagem ent issues and new insights. C lin . C hest M ed. 19:473-486.
18. LiPum a, J. J ., S. E. D asen, D. W. N ielson, R. C. Stern, and T. L. Stull. 1990. P e rson -to -person transm ission o f Pseudom onas cepacia betw een patien ts w ith cystic fibrosis. L ance t 336:1094-1096.
19. Luria, S., and M. D elbruck. 1943. M utations o f bac teria from virus sensitivity to virus resistance . G en e tics 28:491-511.
20. M am ber, S. W., B. K olek, K. W. Brookshire, D. P. Bonner, and J. Fung- Tomc. 1993. A ctiv ity o f qu in o lo n es in th e A m es Salm onella TA 102 m utagenicity te st an d o th e r b ac teria l genotoxicity assays. A ntim icrob. A gents C hem o ther. 37 :213-217.
21. Rosche, W. A., and P. L. Foster. 2000. D eterm ining m utation rates in bacterial populations. M ethods 20:4-17.
22. Sanchez, P., J. F. L inares, B. Ruiz-Diez, E. Campanario, A. Navas, F. Baquero, and J. L. M artinez. 2002. F itness of in vitro selected Pseudom onas aeruginosa na lB an d n fxB m u ltid rug resistan t m utants. J. A ntim icrob. C hem o ther. 50:657-664.
23. Sierra, J. M ., J. G. C abeza, C. M. Ruiz, T. Montero, J. Hernandez, J. M ensa, M. Llagostera, and J. Vila. 2005. T he selection of resistance to and the m utagen icity o f d iffe ren t fluo roqu ino lones in Staphylococcus aureus and Streptococcus p n eu m o n ia e . C lin. M icrobiol. Infect. 11:750-758.
24. Sm ith, S. M ., R. H . Eng, and F. T. Padberg, Jr. 1996. Survival o f nosocom ial pa thogen ic b ac te ria at am b ien t te m p era tu re . J. M ed. 27:293-302.
25. Youmans, G. P., and A. S. Y oum ans. 1949. A m ethod for the determ ination o f the ra te o f grow th o f tub e rc le bacilli by the use o f small inocula. J. B acterio l. 58:247-255.
26. Y sem , P., B. C lerch, M . C astano, I. Gibert, J. Barbe, and M. Llagostera. 1990. Induction o f SOS genes in Escherichia coli and m utagenesis in Salm onella typhim urium by fluoroqu ino lones. M utagenesis 5:63-66.
27. Zhou, J., Y. D ong, X. Zhao, S. Lee, A. Amin, S. Ramaswamv, J. Domagala, J. M. M usser, and K. D rlica. 2000. Selection o f an tib io tic-resistan t bacterial m utan ts: allelic divcrsitv am ong fluoroqu ino lone-resistan t m utations. J. Infect. D is. 182:517-525. ’
Dow
nloaded from
aac.asm.org
by on
Novem
ber 27, 2008
A n t im ic r o b ia l A gents a n d Ch e m o t h e r a p y , Apr. 2008, p. 1209-1214 0066-4804/08/$08.00+0 doi:10.1128/AAC.01152-07Copyright © 2008, American Society for Microbiology. All Rights Reserved.
Vol. 52, No. 4
MINIREVIEW
A Practical Guide to Measuring Mutation Rates in Antibiotic ResistancevCassie F. Pope, Denise M. O’Sullivan, Timothy D. McHugh, and Stephen H. Gillespie*
Centre for Medical Microbiology, Royal Free and University College Medical School,Rowland Hill Street, London NW 3 2PF, United Kingdom
Bacteria become resistant to antibacterial agents by three main mechanisms: acquisition o f complete resistance genes or gene complexes via plasmids and other transposable elements (12,16, 21, 26, 30), recombination of D N A from other bacteria into the genome by transformation (6), and spontaneous mutational events in the chromosome and accessory D N A (14). Horizontal gene transfer in bacteria has been reviewed by Thomas and Nielsen (31). This minireview will concentrate on the study of chromosomal mutations that confer resistance. Mutational events are assumed to be stochastic, so that the rate of beneficial mutation does not occur at a higher frequency than those that are neutral or disadvantageous and that mutations are not directed. For bacterial cells, there is a finite probability that a mutation conferring the resistant phenotype will occur, and unless a revertant mutation occurs, all o f the progeny of such a cell will be resistant also. An important review by Rosche and Foster which critically analyzes mutation rate determination methods lays the foundation o f this minireview (29). The terms and abbreviations used here are defined in Table 1.
MUTATION RATE OR MUTATION FREQUENCY
A mutation rate is an estimation o f the probability of a mutation occurring per cell division and corresponds to the probability of a mutation occurring in the lifetime of a bacterial cell. A mutation frequency is simply the proportion of mutant bacteria present in a culture. These terms are often used interchangeably, causing confusion. The relationship between mutation frequency and the rate at which mutations occur is uncertain. If a mutation arises early in the culture period, then a large number of mutant progeny occur and this would be represented by a high frequency. This phenomenon is known as a “jackpot culture” and was first described in 1943 by Luria and Delbruck during their seminal set o f experiments investigating the mutation of Escherichia coli from bacteriophage T1 sensitivity to resistance (19). Understanding of this phenom enon was the crucial evidence indicating the role o f mutation in phage resistance and underpins all o f the work on mutation that followed.
* Corresponding author. Mailing address: Centre for Medical Microbiology, Royal Free and University College Medical School, Rowland Hill Street, London NW3 2PF, United Kingdom. Phone: 44(0)207 794 0500. Fax: 44 (0)207 794 0433. E-mail: [email protected].
v Published ahead of print on 4 February 2008.
FLUCTUATION TEST OF LURIA AND DELBRUCK
Luria and Delbruck demonstrated that bacteriophage-resistant mutant colonies arise from a sensitive culture of E. coli if bacteriophage T1 is present in excess (19). Resistant colonies appeared from sensitive cultures, i.e., in which there was clearing, within 12 to 16 h. These bacteria were resistant to bacteriophage T1 but sensitive to other viruses capable of causing lysis in that strain o f E. coli. Luria and Delbruck showed that reversion to sensitivity was a rare event and that, in a growing culture, the proportion of resistant bacteria increased with time. They argued that if the presence of the phage was needed to trigger the change to resistance, then the distribution of mutant colonies should demonstrate a Poisson distribution. The high variance in the numbers of mutants in the culture, however, led Luria and Delbruck to conclude that resistant mutants were present in the culture before bacteriophage exposure and that the bacteriophage resistance mutation arose independently. The Luria-Delbriick distribution is different from the Poisson distribution in that its variance is greater than 1.
Luria and Delbruck assumed that for a bacterium there was a small fixed chance that a resistance-conferring mutation could occur per unit o f time if the bacteria are “in an identical state.” The number o f mutated cells in a culture depends on how early the mutation occurred during the growth of the bacterial population. If mutation occurs early in the culture, the number o f mutated cells will be higher than if it occurs later. M easurement o f the mutation rate, rather than frequency, should be the standard in antibiotic research. A lthough the protocols and calculation methods are more complex, they are not as inaccessible as it might appear.
DETERMINATION OF MUTATION RATE
Broadly, there are two methods for determination of the mutation rate: mutation accumulation and fluctuation analysis. Mutant accumulation methods have the advantage that they are very accurate, but they are complicated and time-consuming to perform because the culture is sampled at multiple time points. The methodology depends on growing bacteria exponentially until probability dictates that a mutant will be present. If the assumption is made that the growth rates of wild-type and mutant bacteria are the same, then the proportion of mutants will increase linearly with time. Furthermore, if the number of mutants and the total number of bacterial cells are known at each time point, then the mutation rate (p.) can be calculated from the slope of the line describing the rela-
1209
Dow
nloaded from
aac.asm.org
by on
Novem
ber 27, 2008
1210 M INIREVIEW
TABLE 1. Terms and abbreviations used in this minireviewTerm Definition
m ................................................No. of mutational events/culture|x.................................................Mutation rater ..................................................Observed no. of mutantsx ..................................................Median no. of mutantsC.................................................No. of culturesp 0................................................Proportion of cultures without mutantsN0...............................................Initial no. of cellsNt ...............................................No. of cells at time tf ..................................................Mutant frequencyn .................................................No. of generations
tionship between the number o f mutants against the generation number. The mutation rate can be determined by using the equation p. = [(r2/N2) ~ (rJN J] X In (N 2/N ]) = (/, - f 2) X
In (N2/N i), where r, is the observed number of mutants at time point 1, r2 is the observed number o f mutants at the next time point, and N 1 and N 2 are the numbers o f cells at time points 1 and 2, respectively, while and f 2 are the mutant frequencies at points 1 and 2.
For this method to be accurate, a very large difference in the total cell number is required between (the number o f cells at the first time point) and N 2 (the number o f cells at the second time point) Serial dilutions would make this easier to perform, but this introduces sampling errors. If available, continuous culture would be an alternative but this would allow the selection of waves o f bacteria, each better suited than the generation before to take over the culture (25). Moreover, many studies have shown that the acquisition of a mutation providing resistance is associated with a significant fitness deficit, which invalidates one o f the basic premises of the mutant accumulation method, as less fit mutants will accumulate at a different rate than the parent (3). For this reason and for greater simplicity, fluctuation methods are more commonly used, and this minireview will concentrate on describing various- applications o f this approach.
FLUCTUATION ANALYSIS IN ANTIBIOTIC RESEARCH: GENERAL PRINCIPLES
Fluctuation analysis involves estimating the mutation rate from the distribution of mutants in a number of parallel cultures. This method was pioneered by Luria and Delbruck (19). Briefly, an initial inoculum of cells (with a known cell volume) from a growing culture is added to a broth and incubated in the absence of selective pressure. The bacterial cells are concentrated and screened for antibiotic-resistant mutant cells by plating the whole cell population onto solid medium containing a suitable concentration of the test antibiotic, usually at two to four times the MIC. It is assumed that this will inhibit the growth of susceptible cells, leaving only resistant mutants. A plate count is performed on a portion of the culture to determine the number of viable cells in the cell deposit. The method of Miles and Misra can be used to determine viable cell numbers. This method involves the spotting o f replicate 20-p.l drops of broth onto a plate and counting o f the colonies that grow within that spot. This reduces the bacterial cells that are lost by spreading (23). Luria and Delbruck suggested two methods for
A n t im ic r o b . A g e n t s C h e m o t h e r .
estimating the overall mutation rate of the population: the p Q method, which is based on the proportion of cultures in which there are no mutants observed, and the method of the mean, which relies on the determination of the mean number of mutants. Both methods assume a Poisson distribution with a mean and variance equal to the product of the probability of a mutation and the number of bacteria. All of the methods described in this minireview use an estimate of the number of mutational events (not the number of mutants), m, to determine the mutation rate and have a Luria-Delbriick distribution (19). Parameter m will be influenced by the amount of growth and the mutation rate (p.). The estimated value of m can be divided by the total number of cells to give the mutation rate.
DESIGNING A MUTATION RATE EXPERIMENT
Choice of selective antibiotic. Ideally, mutation rates should be calculated by using an antibiotic to which resistance arises via a mutation at a single base pair for the reasons noted above. This situation rarely arises, and consequently, pragmatic com promises must be made. Manipulating the culture volume growth conditions and durations enables these methods to be adapted to answer a wide range o f questions in antibiotic research.
The choice of the selecting agent depends on the purpose of the experiment. Antibiotics which are most suitable for mutation rate methods are those to which resistance arises as a result of point mutations in chromosomal genes, including the aminoglycosides, quinolones, rifampin, pyrazinamide, and iso- niazid (10). If one wants to measure the rate of resistance to a particular antibiotic, then the nature of the drug-bacterium interaction will dictate how the parameters vary and “ranging” experiments may be required. N ot all of the colonies growing on the selective plate will contain the same mutation. Thus, a mutation rate calculated by including confirmed mutations in a single target gene will be lower than a phenotypic mutation rate due to the presence o f multiple target genes and nonhe- ritable changes. In antibiotic research, it is usual that lethal selection for preexisting mutations, as in the case of the experiment o f Luria and Delbruck, is being tested, and this is different from the nonlethal selection used by Cairns et al. in their “directed-mutation” experiments with Lac, which allowed mutants arising postplating to grow (5).
Parameters. For each mutation rate experiment, there are three main parameters which must be considered, i.e., the expected number o f mutational events, the number of cultures to be examined, and the size o f the initial inoculum.
If the p 0 method is to be used, m should be between 0.3 and 2.3 mutational events per culture. If m is less than 0.3, then none of the mutation rate methods are reliable. When m is greater than 2.3, the Luria and Delbruck method of the mean can be used to estimate the mutation rate (19). Methods of the mean or median described below have constraints on the number of mutants per culture if the results are to be valid, and these ranges are shown in Table 2.
The number o f mutational events present in the culture depends on the mutation rate itself and the amount of growth. Growth conditions will vary between bacterial species. For example, culture aliquots of Streptococcus pneumoniae cannot be incubated for extended periods. This is due to the activity of
Dow
nloaded from
aac.asm.org
by on
Novem
ber 27, 2008
V o l . 52, 2008 M INIREVIEW 1211
TABLE 2. Appropriateness of different methods for different values of m
V alue o f m (no. ofM ethod m uta tional events/
cu ltu re)
p 0 method................................................................................0.3 < m s 2 . 3Method of the mean.............................................................AnyLea and Coulson method of the m edian....................... 1.5 ^ m 15Drake formula....................................................................... m > 30
the cell wall autolysin, which results in a decrease in the viable cell count following extended incubation (15). The value of m can be manipulated by inoculating different volumes of broth onto solid medium, but this can introduce errors (see below). The choice of methods will vary with different values of m, and therefore the method chosen will depend on the expected value of m.
Number of cultures. The second crucial parameter is the number of parallel cultures (C) chosen to represent the bacterial population. Irrespective of the method used, the precision of m is a function o f l / \ / C and increases as C increases; if more cultures are tested, then precision is increased. Between 20 and 30 cultures are routinely included (2). For the p 0 method, a precision level o f 20% is considered necessary to provide a suitable estimate of the number of mutational events per culture (29). Precision is the coefficient o f variation, u„Jm, multiplied by 100% and has been calculated as 0.2 (29) and is a measurement o f the reproducibility o f results, as opposed to accuracy.
Size of initial inoculum. The final parameter is the size of the initial inoculum (N 0). This inoculum should not contain any preexisting mutants, and thus it should be small. For example, in their E. coli experiments, Luria and Delbruck used an initial inoculum of between 50 and 500 bacteria (19). The smaller the initial inoculum, the longer the incubation period. This is especially important when working with slow-growing cultures, e.g., Mycobacterium tuberculosis. We have found that between 3,000 and 5,000 cells/ml is sufficient as the initial inoculum for S. pneumoniae and M. tuberculosis, respectively. There are other complications involved in growing small numbers of organisms. For example, many organisms monitor the density of cells via quorum sensing and only switch on virulence genes after a quorum o f bacteria is present (24, 28). A small inoculum may produce a reduction in viability, resulting in greater variation in the final number of cells (N t). In each parallel culture, the final cell number ( N{) should be the same and the value of N 0 should always be negligible compared to N t (a ratio of at least <1:1,000 is desirable). Variations in N t can be eliminated by using a large initial inoculum. Rosche and Foster (29) found that, in their experiments, a pragmatic com promise between the above factors was to use an initial inoculum of total cells of m N t /104 (3, 9 ,10 ). To reduce variability, the initial inoculum should consist of an even cell suspension. This is especially important when working with organisms such as M. tuberculosis, which tend to form cellular aggregates. To overcome this problem, the initial inoculum should be passed through a fine-needle syringe or a filter to form a single-cell suspension. Additionally, Middlebrook 7H9 broths contain Tween 80 to reduce clumping (3).
Additional relevant considerations, (i) Volume. In order to observe a mutation, it is necessary to have a large enough final cell number. The size of this final cell number is a function of the culture volume and the mutation rate. If the mutation rate is high, then a small broth culture can be used, and if the rate is low, then larger cultures must be used.
(ii) Cell cycle. Mutation rates may be influenced by the growth phase o f the cell. Determinations of mutation rates are usually performed by using cells growing in exponential phase (3, 10). There are reports, however, that mutation rates in E. coli are elevated in stationary phase compared to exponential phase (15, 18). The initial inoculum of cells should contain cells that are in the same phase of the growth cycle in order to compare estimated rates. Therefore, a growth curve should be constructed during method optimization. To reduce the degree o f variability in these experiments, all of the above parameters should be kept constant between experiments.
ASSUM PTIONS OF FLUCTUATION ANALYSIS
Each mutation rate method relies on a set of pragmatic assumptions that are made in order to make estimations possible. (i) The probability of the mutation occurring is constant per cell lifetime, (ii) The probability of this mutation occurring does not vary between growth phases, (iii) There is no cell death, (iv) Revertants occur at a negligible rate, (v) Mutation occurs only during cell division and results in only one mutant.(vi) The growth rates o f mutants and nonmutants are the same.(vii) Initial cell numbers are negligible compared to the final cell numbers, (viii) A ll mutants are detected, and no mutants occur after selection is imposed. However, these assumptions may not be true in all situations. Mutation rates of the same organism that are obtained by using the same selection tool and estimated via different methods can be very different.
DEVIATIONS FROM THE ASSUMPTIONS
Fitness o f mutants. As noted above, mutation rate calculation methods assume that there is no physiological impairment of mutants with respect to their susceptible parents. If mutants do not grow as efficiently as their parents, they may not be detected and this may affect the calculated mutation rate. There are examples in which mutations responsible for resistance occur at no or low cost. For example, the rpsL Lys42Arg mutation, which confers resistance to streptomycin in Salmonella enterica serovar Typhimurium, incurs no measurable cost. In contrast, the Lys42Thr and Lys42Asn mutations associated with resistance incur a heavy fitness burden (4). For example, the parC and gyrA mutations, conferring fluoroquinolone resistance, incur no or low cost in S.pneumoniae (11). The extent of a fitness deficit is dependent on the nature of the mutation, as demonstrated by M. tuberculosis, where there is a relationship between the rates at which various resistant mutants are found in clinical practice and the initial fitness deficit of the mutant strain (3, 8, 22).
Completeness of detection. It is possible that not all mutations are detected. For example, mutations that occur late in the culture may not give rise to colonies and these mutants will not be counted. This phenomenon is known as phenotypic lag. Importantly, it is also possible that mutations may occur after
Dow
nloaded from
aac.asm.org
by on
Novem
ber 27, 2008
1212 MINIREVIEW A n t i m i c r o b . A g e n t s C h e m o t h e r .
selection has been imposed; i.e., mutants may arise on antibiotic-containing solid medium. In order to overcome these issues, some preliminary ranging experiments could be preformed which would ensure that the correct initial inoculum and the correct final plating volum e are used. Colonies should be counted as earlier as possible to minimize the number of postplating mutants that could occur.
Other factors. There are a number o f other factors that complicate the calculation o f mutation rates. For example, mutation rates are not constant in a population of cells. They can vary depending on the antibiotic concentration (13) and the availability o f the carbon source (1).
PLATING A PORTION OF THE CULTURE
It is assumed that all mutants are detected. Plating a portion of the culture can introduce an error in the estimation of m. Some of the methods used to determine the rate of mutation have been derived to take sampling into account. Ma et al. (20) and Jones (14) have altered their fluctuation analysis method to show that it is possible to plate an aliquot of the culture volume when there is a large final inoculum. It is also possible to plate a portion of a large culture rather than using multiple small cultures, and Crane et al. have proposed a modified fluctuation assay for the estimation of mutation rates where small increases in the mutation rate are expected (6).
VARATIONS ON THE LURIA-DELBRUCK METHOD FOR MUTATION RATE ESTIMATION
No satisfactory solution o f the Luria and Delbruck distribution has been found that effectively describes the distribution numerically. Therefore, extensive attempts have been made to improve the accuracy of the estimates (2, 15). The practical effect of this is that mutation rates estimated via different methods cannot be compared.
CALCULATION METHODS
The p 0 method. The p 0 method is the simplest method to calculate and is the one originally described by Luria and Delbruck in their seminal paper (19). It is most suitable when the number o f mutational events in a culture is low. This method has successfully been used to estimate mutation rates in M. tuberculosis (3) and S. pneumoniae (10).
The proportion of cultures without mutants {p0) is the zero term of the Poisson distribution given by the equation p n = e~m. This method should only be used if the proportion of cultures without mutants is between 0.1 and 0.7, i.e., the number of mutational events per culture is between 0.3 and 2.3. The formula can be rearranged to give the number of mutational events as follows: m = — In p Q.
Multiple parallel cultures are performed and scored as positive if they yield a resistant mutant, i.e., show growth. When the proportion o f mutants detected is known, then the actual value of m can be calculated. There is no need to enumerate the colonies, and this simplifies the process. It should be noted that the precision o f m varies depending on the value of p 0. Compared with other methods, the p 0 method requires more cultures for the same level o f precision when m > 1.2. As
cultures are scored as either positive or negative for growth, mutations that affect the growth rate of the progeny cells have less effect in the p 0 method than on other methods. A clone that does not give rise to a colony would add to the proportion of cultures without mutants erroneously. Conditions of growth and culture volume need to be chosen so that the proportion of resistant cultures is in the appropriate range. The p Q estimator method is very sensitive to phenotypic lag, postplating mutations, and decreased plating efficiency, as these will increase the value of p 0. Some o f the progeny o f each mutant will be lost if the plate efficiency is less than 100%. This will be the normal situation in most culture systems; thus, cultures with few mutants may be counted as cultures with no mutants.
Methods using the mean. The mean estimator methods use the observation that when a population is large enough there will be an extra pA t mutants after each generation as each of the cells in the final population may undergo mutation. The probability of this occurring is determined by the mutation rate (p). Therefore, the extra number of mutants will be a product of these two terms. The time period after the point when the bacterial population of all cultures has reached the required size when this may occur is 1/p and is known as the Luria- Delbriick period. The mean methods should not be used if there is no Luria-Delbriick period, i.e., if TV, < 1/p. Methods that use the mean are disproportionally inflated by jackpot cultures and are not recommended. They can be made more accurate by removing data points caused by jackpot cultures, but this makes the approach somewhat arbitrary, with data being removed by the investigator. M ethods using the median are more accurate and will be discussed in more detail below.
Lea and Coulson method o f the median. Lea and Coulson (17) attempted to develop a method with better precision than the method of the mean. The function m is calculated from the equation (x/m ) — In m = 1.24.
The method assumes that if the median number of mutants is large enough, then most mutations occur early enough to be detected. From a practical point o f view, a greater number of selective plates (approximately 5 to 10) are needed for this method to give an adequate precision level. An additional drawback to the increased number of plates required is that median methods should not be used if more than half of the plates are devoid o f mutants. It is used when all or most of the cultures give rise to mutant colonies, and it has been quoted as the method of choice (excluding maximum-likelihood methods) if m is between 1.5 and 15 and if the median number of mutational events in a culture is between 2.5 and 60. The main drawback o f the m ethod is that it is sensitive to any variation in the assumptions, e.g., phenotypic lag and altered growth rate of progeny, described previously, which results in reduced precision.
Drake formula using the median. The Drake formula using the median provides an easy option to make an estimate of the mutation rate from frequency data, given by the equation p = //In (/V, p), where / i s the final mutation frequency (7). By using the median final mutation frequency and not the mean final mutation frequency, the impact of jackpot mutations is reduced. It can be used when the number of mutational events per culture is high, i.e., ^30. This method has been used to estimate rates o f mutation of S. pneumoniae to fluoroquin
Dow
nloaded from
aac.asm.org
by on
Novem
ber 27, 2008
V o l . 52, 2008 MINIREVIEW 1213
olone resistance and o f Mycobacterium fortuitum to fluoroquinolone, macrolide, and aminoglycoside resistance (9).
Jones median estimator. Jones calculated the hypothetical dilutions required so that half o f the selective plates in a putative experiment had mutant colon ies (14). Under these circumstances, other median m ethods cannot be used. The Jones method has the advantage that it relies on the observed number of mutant co lon ies to estim ate m by an explicit equation. Jones (14) verified this method against the Lea and Coulson m ethod o f the m edian, by using computer simulations, for values o f m betw een 1.5 and 10 and showed that it is more efficient than the Lea and Coulson method of the median. Crane et al. m odified the m ethod so that it can be used to give more precise m utation rate measurements. In this method, a portion o f larger-volum es cultures is plated rather than the w hole o f sm aller-volum e cultures (6); this allows more mutants to accum ulate. We have used this method to estimate the rate o f the rpoB mutation, which confers rifampin resistance (3).
CHOOSING A METHOD
There may be a number o f differences between methods, but they all use similar functions. Since the pivotal experiments by Luria and Delbruck in the last century, novel methods for the calculation of the Luria-Delbriick distribution have made the estimation of mutation rates more accurate and easy to perform. The most useful methods are the p 0 method (2) and the Jones median estimator together with the modification of Crane et al. for partial plating (6).
Mutation rate studies have been performed with a number of organisms related to antibiotic research, including E. coli, 5. pneumoniae (10), Pseudomonas aeruginosa (27), and M. tuberculosis (3). Oliver et al. used the modification by Crane et al. of the Jones estimator to show that antibiotic-resistant isolates of P. aeruginosa were present prior to antibiotic therapy due to the existence of hypermutable bacteria (27). As large broths were used, aliquots from these broths were taken to reduce culture-to-culture variation (27). For example, Billington et al. also used this method for experiments with M. tuberculosis for similar reasons (3). Mutation rate experiments with S. pneumoniae have been used to show that mutations in the gyrA gene occur at a lower rate than parC mutations and that mutations in either gene predisposes to further mutation (10). The Drake method was used when ciprofloxacin was the selective antibiotic as the number o f mutational events per culture was >30. However, the p 0 m ethod was used with gemifloxacin as the number of mutational events was sm aller (betw een 0.3 and 2.3).
SUMMARY
Whichever method is chosen, the experimental factors should be optimized to improve the precision and accuracy of the estimation. It is usually necessary to perform preliminary experiments to provide estimates o f the mutation rate, and as has been stated previously, it is usually helpful to determine growth curves to confirm that the bacteria are in the same growth phase when the mutation rate estimation cultures are inoculated. The growth conditions o f the experiment can only
be established with the knowledge of the expected mutation rate, which requires preliminary experiments to enable the researcher to develop the necessary protocol. When mutations are likely to be rare, then m is, by definition, small and thus the p 0 method is likely to be the most useful. When m is greater, then median methods are most appropriate. The choice of calculation method will depend on whether all of the cultures were positive, with a median method being chosen for situations in which all are positive and the p 0 when this is not the case.
REFERENCES
1. Andersson, D. I., J. B jorkm an, and D. Hughes. 1998. A ntibiotic resistance here to stay? C om p en sa to ry m u ta tio n s res to re virulence of resistan t bacteria . L akartidn ingen 95:3940, 3943-3944.
2. Asteris, G., and S. Sarkar. 1996. Bayesian p rocedu re s for the estim ation of m utation ra tes from fluc tuation experim en ts. G enetics 142:313-326.
3. Billington, O. J., T. D. M cH ugh, and S. H . G illespie. 1999. Physiological cost o f rifam pin resistance induced in v itro in M ycobacterium tuberculosis. A n timicrob. A gents C h em o th er. 43:1866-1869.
4. Bjorkm an, J„ D. H u gh es, and D. I. A ndersson . 1998. V iru lence o f a n t ib io tic -re s is tan t Sa lm onella typ h im u riu m . P roc . N atl. A cad. Sci. U SA 95: 3949-3953.
5. Cairns, J., J. Overbaugh, and S. M iller. 1988. T he origin o f m utants. N atu re 335:142-145.
6. Crane, G. J., S. M. Thom as, and M . E. Jones. 1996. A m odified Luria- D elbriick fluc tuation assay fo r estim ating and com paring m utation rates. M utat. Res. 354:171-182.
7. Drake, J. W. 1991. C onstan t ra te o f spo n tan eo u s m uta tions in D N A based m icrobes. Proc. N atl. A cad. Sci. U SA 7160-7164.
8 . Gagneux, S., C. D. Long, P. M . Sm all, T. Van, G. K. Schoolnik, and B. J. Bohannan. 2006. T he com petitive cost o f an tib io tic resistance in M ycobacterium tuberculosis. Science 312:1944—1946.
9. Gillespie, S. H., S. Basu, A. L. D ickens, D. M . O’Sullivan, and T. I). McHugh. 2005. Effect o f sub inh ib ito ry co n c en tra tio n s o f ciprofloxacin on Mycobacterium fortu itum m u ta tio n rates. J. A n tim icrob . C hem other. 56:344-348.
10. Gillespie, S. H., L. L. Voelker, J. E. Ambler, C. Traini, and A. Dickens. 2003. F luoroqu ino lone resistance in Streptococcus pneum oniae: evidence tha t gyrA m uta tions arise a t a low er ra te and tha t m u ta tion in gyrA or parC predisposes to fu rthe r m uta tion . M icrob. D ru g R esist. 9:17-24.
11. G illespie, S. H., L. L. Voelker, and A. D ickens. 2002. E volutionary barriers to qu ino lone resistance in Streptococcus pneum oniae . M icrob. D rug Resist. 8:79-84.
12. Guiney, D. G., Jr. 1984. P rom iscuous tra n sfe r of d rug resistance in gram - negative b ac teria . J. In fect. Dis. 149:320-329.
13. Hughes, D., and D. I. A nderson. 1997. C arbon starvation o f Salmonella tvphim urium does n o t cause a g en e ra l increase o f m utation rates. J. B acteriol. 179:6688-6691.
14. Jones, M. E. 1993. A cco u n tin g fo r p la ting efficiency w hen estim ating spontaneous m u ta tio n ra tes . M u ta t. R es. 292:187-189.
15. Kepler, T. B., and M. O prea. 2001. Im proved in ference o f m utation rates. I. A n in tegral re p re sen ta tio n fo r th e L uria-D elbriick distribution. Theor. Popul. Biol. 59:41-48.
16. Kugelberg, E., S. Lofmark, B. W rctlind, and D. Anderssen. 2005. R eduction o f the fitness b u rd e n in P seudom onas aeruginosa. J. A ntim icrob. C hem other. 55:22-30.
17. Lea, D ., and C. C oulson. 1949. T h e d istribu tion o f the num ber of m utants in b ac teria l popu la tions . G en e tics 49:264-285.
18. Loewe, L., V. Textor, and S. Scherer. 2003. H igh deleterious genom ic m uta tion ra te in sta tio n ary p hase o f Escherichia coli. Science 302:1558-1560.
19. Luria, S., and M. D elbriick. 1943. M utations o f bac teria from virus sensitivity to virus resistance. G en e tics 28:491—511.
20. M a, W. T., G. V. Sandri, and S. Sarkar. 1992. Analysis o f the Luria-D elbriick d istribu tion using d iscre te convolu tion pow ers. J. A ppl. P robability 29:255— 267.
21. M aiden, M. C. 1998. H orizon ta l genetic exchange, evolution, and sp read of an tib io tic resistance in b ac teria . Clin. Infect. Dis. 27(Suppl. 1):S12-S20.
22. M ariam, D. H., Y. M engistu, S. E. Hoffner, and D. I. Andersson. 2004. Effect o f rpoB m u ta tions conferring rifam pin resistance on fitness of Mycobacterium tuberculosis. A n tim icrob . A gen ts C hem other. 48:1289-1294.
23. M iles, A. A., and S. S. M isra. 1938. T he estim ation o f the bactericidal pow er of the blood. J. Hyg. 38:732-749.
24. N ealson, K. H., and J. W. H astings. 1979. B acterial biolum inescence: its contro l and ecological significance. M icrob. Rev. 43:496-518.
25. Novick, A,, and L. Szilard. 1950. E xperim ents with the chem ostat on spontaneous m uta tions o f bac teria . Proc. Natl. A cad. Sci. U SA 36:708—719.
26. Ochman, H., J. G. Lawrence, and E. A. Groism an. 2000. L ateral gene transfer and th e na tu re o f b ac teria l innovation. N atu re 405:299-304.
Dow
nloaded from
aac.asm.org
by on
Novem
ber 27, 2008
1214 MINIREVIEW A n t i m i c r o b . A g e n t s C h e m o t h e r .
27. Oliver, A., B. R. Levin. C. Juan. F. Baquero, and J. Blasquez. 2004. H vper- m utation and the p reex istence o f an tib io tic res is tan t Pseudom onas aeruginosa m utants: im plications fo r susceptib ility testing and trea tm en t of chronic infections. A ntim icrob . A gen ts C h em o th er. 48:4226-4233.
28. Parsek, M. JL, and E. P. Greenberg. 2000. A cyl-hom oserine lactone quorum sensing in gram -negative bac teria : a signaling m echan ism involved in associations with higher organism s. P roc. N atl. A cad. Sci. U SA 97:8789-8793.
29. R osche, W. A , and P. L. Foster. 2000. D ete rm in ing m utation rates in bacte rial popu la tions. M ethods 20:4-17.
30. Shapiro, J. A 1997. G en o m e organ isa tion , na tu ra l genetic engineering and adaptive m u ta tion . T re n d s G en e t. 13:98-104.
31. T hom as, C . M ., and K . M . N ielsen . 2005. M echan ism s of, and b a rr ie rs to , h o riz o n ta l g en e tr a n s fe r b e tw e en b ac te ria . N at. R ev. M icrobio l. 3: 711-721 .
Measuring Bacterial Fitness
C.F. Pope'.T.D. McHugh1, J.R Pratten2 and S.H. Gillespie1
'C en tre fo r Medical Microbiology, Royal Free and University College Medical School, Rowland Hill Street, NW 3 2QG and 2UCL Eastman Dental Institute, Gray’s Inn Road, London,W CIX 8LD
Acquisition o f antibiotic resistance may or may not be associated with a physiological cost for the bacterium. Measurement o f planktonic growth rate, by competitive
growth assays between the resistant mutant and the susceptible parent is a commonly used measure o f fitness. However, fitness is a complex characteristic and
multiple models are required to measure fitness costs, which may be small and
difficult to quantify. Available in vitro models that can be used to quantify this fitness
cost when compared to the susceptible parent include quantification o f biofilm
growth, survival in water, resistance to drying and alternative methods to determine
planktonic growth rate. It is an accepted belief that decreased antibiotic use will reduce rates o f resistance. However, some mutations conferring resistance result in a
small or non existent fitness cost These isolates may out compete the susceptible
isolate and may remain in the bacterial population to form a pool o f resistant organisms, which can rapidly proliferate i f the selective antibiotic pressure is reapplied.
IntroductionAntibiotic resistance in a bacterial population occurs due to selection of resistant mutants in the presence of antibiotics.The existence of a continuing antibiotic selective pressure is responsible for high levels of antibiotic resistance. W hen bacteria are exposed to antibiotics a m utation conferring resistance to that antibiotic gives the bacterium an obvious advantage. However it is an accepted dogma that a resistant organism pays a physiological price for resistance, particularly resistance mediated by chrom osom al m utations (Andersson & Levin 1999; Levin et al. 2000). It is an accepted belief tha t with rational use of antibiotics, resistant m utants will be ou t-com peted by their susceptible coun terparts and will be lost from the population. Although studies have shown th a t acquisition of antibiotic resistance can incur a biological cost (Andersson & Levin 1999; Gillespie & McHugh 1997) there is evidence that som e mutations conferring resistance may result in a small o r none existent fitness deficit (Gillespie 2001; Gillespie et al. 2002; Kugelberg et al. 2005). Furtherm ore, quantification of fitness costs is im portant when determining the stability of antibiotic resistance in a population.
Biofilm Club © 2 0 0 7 23
MEASURING BACTERIAL FITNESSFitness and Antibiotic ResistanceFitness is a com plex characteristic tha t encompasses the ability of a genotype to reproduce within a host, be transm itted and be cleared. It is also a m easure of how well bacteria survive in defined environments.The m ajor factors that influence the frequency of antibiotic resistance in a population of bacteria are the ex ten t of antibiotic use, the cost of resistance and the ex ten t th a t the bacteria can com pensate for this cost.W ithin a population of bacteria different genotypes m ust com pete with each o ther to reproduce.Therefore, incidence of resistance can be reduced by the rational use of antibiotics as resistant bacteria can be selected against in the absence of antibiotics due to a fitness cost. However, resistance will not disappear from the population. If m utations conferring resistance have a low fitness cost, o r no cost, then these m utants may remain a t high levels in the bacterial population if antibiotic use is w ithdrawn o r may return to high frequencies if antibiotic pressure is reintroduced.
Models o f FitnessIn vitro models of fitness have been used in o rder to investigate the evolution of antibiotic resistance and to assess the physiological price associated with acquisition of resistance.The growth rate of a bacteria in culture medium is a commonly used model for evaluating fitness (Bennett et al. 1990; Lenski et al.1998; Lenski, Simpson, & Nguyen 1994; Nguyen et al. 1989). Relative fitness is often determ ined by com petition assay between isogenic antibiotic susceptible and antibiotic resistant bacteria in culture o r in animal models.These models can be adapted for use in many bacterial species. Models should be chosen that reflect growth and environmental survival conditions of the bacterial species of interest. For example, a suitable biofilm model should be included fo r bacteria which are known to form biofilms within the human body e.g. Pseudonomas
aeruginosa within the cystic fibrosis lung (Govan & Deretic 1996; Singh et al. 2000). Environmental survival e.g. resistance to drying o r survival in w ate r is relevant for nosocomial pathogens which can be transm itted via contam inated surfaces.
Fitness Costs Incurred by Antibiotic ResistanceThe carriage of plasmids has been shown to reduce the fitness of bacteria (Lee & Edlin 1985; Nguyen et al. l989;W arnes & Stephenson 1986). Insertion of a plasmid reduced fitness of the strain com pared to the plasmid free strain. However, this fitness deficit was reduced following passage. Restoration of fitness may be due to loss of plasmid containing bacteria from th e population as plasmid free bacteria outgrow them (Lenski & Bouma 1987).This would suggest tha t following rational antibiotic use the frequency of resistant bacteria may decline, reducing the spread of antibiotic resistance. Subsequently, it has been dem onstrated th a t with time chrom osom al changes occur tha t increase the fitness of the bacteria plasmid carrying bacteria (Lenski et al. 1994). O ver many generations of association the effects of fitness can be decreased exten
24 Btofilm C lub © 20 0 7
Pope et al.
sively (Bouma & Lenski 1988; Modi et al. 1991).
C hrom osom al mutations that confer resistance by altering antibiotic targets include D N A gyrase, RNA polymerase, the cell wall o r the ribosom e and these alterations may cause a reduction in fitness (Andersson & Levin 1999; Gillespie & McHugh 1997). Mutations in rpsL confer streptomycin resistance in Salmonella Typhimurium due to changes in the ribosomal protein SI2.These mutants have been shown to be less fit than the wild type due to a decrease in peptide elongation rate and resulting decrease in slower protein synthesis and growth rate (Bjorkman e£ al. 1998). Chromosomal mutations in RNA polymerase (rpoB) th a t confer resistance to rifampicin are associated with a fitness cost in Staphylococcus aureus and Mycobacterium tuberculosis (Moorman & Mandell 19 8 1; W ichelhaus et al. 2002).The extent of this fitness cost depends on the resistance m utation.
In 1953 B arnett and colleagues showed that resistance to isoniazid in M . tuberculosis am eliorated disease a guinea pig model (Barnett, et al. 1953). Molecular tools have since shown that point mutations in katG confer this isoniazid resistance. Functional katG, integrated to the genom e, restored virulence to wild type levels (Wilson et al. 1995). In the mouse model, resistant strains of At tuberculosis vary in virulence (Ordway et al. 1995), however, increased levels of drug resistance were not associated with a reduction in virulence.
Compensation o f Fitness CostsA deleterious mutation may be lost from the population, revert to susceptibility o r be com pensated for by another mutation. Bacteria which are less fit may acquire com pensatory mutations that restore reproductive potential.These are mutations tha t occur in another site which am eliorate the cost incurred by the initial resistance mutation w ithout the loss of the resistance.These mutations can accumulate to resto re fitness and stabilise the population of resistant bacteria.
M ost com pensatory mutations that resto re fitness are no t revertants to susceptibility.This may be because the mutation rate fo r o th e r m utations is higher due to multiple targets. For example, com pensation of fluoroquinolone resistance in S. aureus occurs by decreased expression of topoisom erase IV (Inee & H ooper 2003). It has also been dem onstrated tha t the fitness cost of mutations in rpsL, conferring streptomycin resistance in £. coli can be com pensated to a resto red rate of protein synthesis following adaptation (Schrag et al. 1997). Similarly, adaptation experim ents in M . tuberculosis have dem onstrated tha t rifampicin resistant rpoB m utants lose the fitness deficit following serial passage (Billington et al. 1999).
Isoniazid resistant M . tuberculosis with mutation in katG, resulting in loss of aB iofilm Club © 2 0 0 7 25
MEASURING BACTERIAL FITNESSfunctional catalase, accumulate com pensatory mutations tha t result in increased expression of the ahpC prom oter.The ahpC gene encodes an alkyl hydroperoxidase reductase and it has been proposed that these m utations increase the expression of this enzyme which protects M. tuberculosis from oxidative stress and com pensates for the loss of catalase (Sherman et al. 1996).
Measuring FitnessDefining fitness cost can be difficult due to variations in m easurem ents in experim ental procedures. N o one m ethod is likely to be sufficient in isolation and therefo re multiple models are required.The models selected will depend on the organism, its natural lifestyle and its mode of growth. Fitness deficits will vary depending on the resistance mutation, the organism and the model used to quantify the cost. For example, Sanchez et al. assessed the fitness costs associated with overproduction of multidrug efflux pumps in P. aeruginosa using survival in water, maintenance on dry surfaces, biofilm formation, nem atode killing, production of pyocyanin and pyoverdin and quantification of proteases (Sanchez et al. 2002).These mutants have been shown to have fitness costs in term s of resistance to desiccation, survival in water, loss of quorum sensing response and loss of virulence in the nem atode killing model. However, the nalB m utant exhibited g rea ter biofilm formation than the wild type (Sanchez et al. 2002). Hence, fitness costs may not be evident in all assays and the models chosen should reflect the how the organism causes disease in the host.
Fitness costs are measured in a num ber of ways and a variety of in vitro and animal models are available.These include comparison of growth rate in m onocultures (Kugelberg et al. 2005). For example, we have used paired com petition assays to assess fitness costs of fluoroquinolone resistance in Streptococcus pneumoniae (Gillespie et al. 2002) and Burkholderia cepacia and rifampicin resistance in M . tuberculosis (Billington et al. 1999; Davies et al. 2000). Relative fitness is defined by the difference in num ber of generations th a t have occurred between the susceptible parent and the resistant mutant. W e have adapted the m ethod of Youmans and Youmans (1949) to determ ine generation times in a semi autom ated liquid culture system for B. cepacia and M. tuberculosis, using the difference in time to positivity of diluted inoculums.These m ethods may minimise observed variation and allow fitness costs to be calculated in term s of generations.
Most studies investigating fitness costs use in vitro models while few have used in vivo models.These in vivo studies commonly use competitive colonisation to measure fitness (Johnson et al. 2005). For example, fitness of fluoroquinolone resistant Campylobacter jejuni, was assessed via colonisation and persistence in chickens in the absence of antibiotic selective pressure (Luo et al. 2005). Few studies have used human colonization o r infection to measure fitness cost. Andersson et al. have assessed the fitness costs conferred by parC and fusR
26 Biofilm Club © 200 7
Pope et al.
mutations, conferring resistance to fluoroquinolones and fusidic acid respectively, in Staphylococcus epidermidis using a human com petition mode (Gustafsson et al. 2003). Susceptible and resistant bacteria w ere inoculated on to human skin and relative numbers monitored. N o loss of fitness associated with parC m utation was found. However fusA mutations resulted in a considerable loss of fitness as compared to the susceptible isogenic strain during com petition. It is unrealistic to assume that in vitro assays, using biological rich media, will accurately reflect the fitness costs experienced by the pathogen during infection. Fitness deficits may be affected by growth conditions (D urso
et al. 2004; Remold & Lenski 2001) and so use of a minimal medium may be m ore appropriate if in vivo models are not possible.
Biofilm Fitness ModelsBiofilms have a role in many infectious diseases. For bacteria tha t grow as biofilms during infection a biofilm quantification assay should be included as a fitness assay.This is because the propensity to form biofilms is likely to affect fitness.There are numerous systems that have been developed and used to model the growth of bacterial biofilms. However, no single model is ideal for all experim ental scenarios as each as been designed for a specific purpose. For use as a fitness assay the model of biofilm growth should be simple and reproducible with sufficient replicate biofilms to allow statistical analysis.
G row th within a biofilm can be measured by sacrificing cells from the biofilm by sonication and/or vortexing the biofilm before determ ining viable cell num bers estim ated by plate counting, although using this m ethod biofilm specific characteristics may be lost. Biofilm growth can also be visualised in situ
with fluorescent probes and rep o rte r genes (Geesey 2001) as well as using imaging software to estimate biofilm coverage of the surface. Bioluminescence is particurarly useful in vitro and in vivo as it allows biofilms to be m onitored in real time (Kadurugamuwa et al. 2003a,b). Models of quantifying biofilm form ation, in selected m odels,are shown in Table I.
The crystal violet m icrotitre plate assay is a simple and rapid m ethod that quantifies adherence of bacteria to the wells of a m icrotitre plate. It is especially useful as a fitness assay as replicate biofilms can be grown in large numbers.The use of a ro b o t can increase reproducibility and partly autom ate the procedure. Bacteria are grown in wells of a m icrotitre plate containing a suitable medium.Wells are washed to remove planktonic cells and incubated with crystal violet. Unbound crystal violet is rem oved by repeated washing with water. Ethanol is added to release bound crystal violet and biofilm formation is quantified by determ ination of the absorbance of the solution a t 590 nm.This assay has been used to study biofilm formation in a num ber of bacteria including Escherichia coli (Pratt & Kolter 1998), 8. cepacia complex (BCC) bacteria (Conway et al. 2002), Pseudomonas fluorescens (O ’Toole & Kolter 1998b), P. aeruginosa (O ’Toole & Kolter 1998a), Vibrio cholerae (W atnick & Kolter 1999)
Biofilm Club © 2 0 0 7 27
MEASURING BACTERIAL FITNESSand Streptococcus gordonii (Loo et al. 2000) and has been used as a fitness assay to quantify the physiological cost of antibiotic resistance in P. aeruginosa
(Kugelberg et al. 2005) and B. cepacia.
T able I M odels th a t have been used to quantify bacterial biofilm grow th
Model O rganism s Flow Substratum M ethod o fquantifyingbiofilm
Reference
Constant Depth B. cepacia. Continuous Variable Vortex plug, (Hengtrakool, Pearson, &Film fermenter P.aeruginosa, oral viable count. W ilson 2006; Hope &(CDFF) bacteria Can be
observed directly by SEM and CLSM
W ilson 2006; Peters & W impenny 1987)
CDC Biofilm Gram negative Continuous Plastic Sonicate, (Murga el al. 2001)Reactor bacteria connectors vortex,
homogenise, viable count
M odified Robbins B. pseudomallei. Batch Variable Viable count (Honraet & Nelis 2006;device P. aeruginosa M ikuniya et al.
2005;Vorachit et at. 1993)Calgary biofilm P. aeruginosa, Batch Plastic pegs Sonicate peg, (Ceri et al. 1999)device S. aureus,
E. coliviable count
Sorborads Filter S. aureus,P. aeruginosa
Continuous Filter paper Vortex, viable count
(Hodgson el al. 1995)
Use o f Fitness Models to assess Fitness Costs Associated with Fluoroquinolone
Resistance MutationsFluoroquinolones (FQs) inhibit two homologous enzymes, DNA gyrase and topoisom erase IV which consist of two subunits, gyrase is encoded by gyrA and gyrB and topoisom erase IV by parC and pare, respectively. Target alteration, together with efflux and reduced permeability are the primary mechanisms that confer resistance to FQs in Gram-negative bacteria (Ince & H ooper 2003).. Resistance develops via the stepwise accumulation of m utations in the Q uinolone Resistance Determining Regions (QRDR) of topoisom erase genes, increasing the level of resistance with each successive mutation (Everett et al. l996).The cost of mutations conferring fluoroquinolone m utations has been investigated in a num ber of organisms including E. coli (Bagel et al. 1999), S. pneumoniae (Gillespie et al. 2002), S. typhimurium (Giraud et al. 2003) and P. aeruginosa (Kugelberg et al. 2005).The fitness cost varies in these organisms and depends on the resistance mutations. Multiple mutations associated with high levels of resistance exhibit reduced fitness.
ConclusionIn a culture, a non fatal deleterious mutation is m ore frequent than the occurrence of favourable m utations leading to an increase in fitness.Therefore an accumulation of deleterious mutations will occur, a decline in fitness will be observed and the fittest individuals can eventually be lost from the population. This has been referred to a s ‘Muller’s ratchet’(Muller 1964). Andersson and Hughes showed tha t Muller’s ratchet also operates in Salmonella typhimurium
28 B iofilm Club © 20 0 7
Pope et al.
(Andersson & Hughes 1996).
A num ber of fitness models are available that can be used as tools to assess the cost of acquiring antibiotic resistance. The context of a fitness model is importan t and models should be chosen to rep resen t how the organism survives in the environm ent and causes disease and therefore multiple models may be required.
Few studies have investigated the effect of reduction in antibiotic use and subsequent levels of resistance in bacterial populations.Austin et al. (1999) attem pted to quantify the relationship between antibiotic use and frequency of resistance.Their findings suggested that significant reduction in antibiotic use is required to cause a significant decline in resistance.This decline in resistance is likely to occur a t a lower rate than the initial emergence of the resistance (Austin e ta l. 1999). Reduction in macrolide use within outpatients in Finland during the 1990s resulted in a decline in erythromycin resistance in G roup A streptococci isolated from th roat swabs and pus samples (Seppala et al. 1997). Isolates containing no cost mutations may not be outcom peted by their susceptible counterparts and may remain in the population to form a pool of resistant organism s.Therefore rational use of antibiotics, in isolation, may no t be adequate to reverse the continuing rise in antibiotic resistance.
ReferencesA ndersson , D. I. and Hughes, D. ( 1996) M ullers ra tche t decreases fitness of a D N A -based m icrobe.
Proceedings o f the National Academy o f Sciences 93,906-907.A ndersson , D. Land Levin, B. R .( l9 9 9 )T h e biological co s t of antibiotic resistance . Current Opinions in
Microbiology 2,489-493 .Austin, D.J., Kristinsson, K .G . and A nderson, R. M .(l9 9 9 )T h e re lationship b e tw een th e volum e of
antimicrobial consum ption in human com m unities and th e frequency of resistance. Proceedings o f the National Academy o f Sciences 9 6 , 115 2 -1156.
Bagel, S., Hullen.V.,W iedemann, B. and Heisig, P. ( 1999) Impact of gyrA and parC m utations onquino lone resistance, doubling time, and supercoiling deg ree of Escherichia coli. Antimicrobial Agents and Chemotherapy 4 3 ,868-875.
B arn ettM .,B usby ,S .R .and M itchison,D .A .(19 5 3 )Tubercle bacilli re s to isoniazid:virulence and re sp o n se to tre a tm e n t w ith isoniazid in guinea pigs. British Journal o f Experimental Pathology 34, 568-581.
B e n n e tt A. F., Dao, K .M .and Lenski, R. E. (1990) Rapid evolution in re sp o n se to h igh-tem peratu re selection. Nature 3 4 6 ,7 9 -8 1.
Billington, O.J., McHugh,T.D. and Gillespie, S. H .( 1999) Physiological c o s t of rifampin resistance induced in vitro in Mycobacterium tuberculosis. Antimicrobial Agents and Chemotherapy 4 3 , 1866- 1869.
Bjorkman, J., Hughes, D. and A ndersson, D. I. (1998) V irulence of an tib io tic-resis tan t Salmonella typhimurium. Proceedings o f the National Academy o f Sciences 95, 3949-3953.
Bouma, J. E. and Lenski, R. E. (1988) Evolution of a bacteria/plasm id association. Nature 335, 351- 3 52 .
C eri, H., O lson, M. E., Strem ick, C ., Read, R. R., M orck, D. and B u re t A. ( 1999) T he Calgary Biofilm Device: new technology fo r rapid de term ination of antibiotic susceptibilities of bacterial biofilms. Journal o f Qinical Microbiology 37, 1771-1776.
Conway, B. A.,Venu,V. and S p e e r t D. P. (2002) Biofilm form ation and acyl hom oserine lactone
Biofilm Club © 2 0 0 7 29
MEASURING BACTERIAL FITNESSproduction in th e Burkholderia cepacia com plex. Journal o f Bacteriology 184, 5678-5685.
Davies, A. P., Billington, O . J., Bannister, B. A., W eir.W . R., M cHugh,T. D. and Gillespie, S. H. (2000) C om parison o f fitness of tw o isolates of Mycobacterium tuberculosis, o n e o f w hich had developed m ulti-drug resistance during th e c o u rse of trea tm en t. The Journal o f Infection 4 1, 184 -187 .
D urso, L. M., Smith, D. and H utkins, R.W . (2004) M easurem ents of fitness and com petition in com m ensal Escherichia coli and E. coli O I5 7 :H 7 strains. Applied and Environmental Microbiology 70, 6 4 6 6 -6 4 7 2 .
Everett, M.J., Jin,Y. F., Ricci, V. and Piddock, L.J. (1996) C ontribu tions of individual m echanism s to fluoroquinolone resistance in 36 Escherichia coli strains isolated from hum ans and animals. Antimicrobial Agents and Chemotherapy 40 , 2380-2386.
Geesey, G. G. (2001) Bacterial behavior a t surfaces. Current Opinions in Microbiology 4, 296-300.Gillespie, S. H . (2001) A ntibiotic resistance in th e absence of selective p ressu re . International
Journal o f Antimicrobial Agents 17, 17 1 - 176.Gillespie, S. H. and M cHugh, T. D. (1997) The biological cost of antimicrobial resistance. Trends in
Microbiology 5, 337-339.Gillespie, S. H., Voelker, L. L. and Dickens, A. (2002) Evolutionary barriers to quinolone resistance
in Streptococcus pneumoniae. Microbial Drug Resistance 8, 79-84.Giraud, E., C loeckaert, A., Baucheron, S., Mouline, C . and Chaslus-Dancla, E. (2003) Fitness cost
of fluoroqu ino lone resistance in Salmonella en terica serovar Typhimurium. Journal o f Medical Microbiology 52, 697-703.
G o van, J. R. and D eretic , V. (1996) Microbial pathogenesis in cystic fibrosis: mucoid Pseudomonas aeruginosa and Burkholderia cepacia. Microbiology Reviews 60, 539-574.
G ustafsson, I., C ars, O. and A ndersson, D. I. (2003) Fitness of antibiotic res istan t Staphylococcus epidermidis assessed by com petition on th e skin of human volunteers.Journa/ o f Antimicrobial Chemotherapy 5 2 ,258-263.
H engtrakool, C., Pearson, G .J .and W ilson, M. (2006) Interaction be tw een GIC and S. sanguis biofilms: antibacterial p ro p e rties and changes of surface hardness .Journal o f Dentistry 3 4 ,588-597.
H odgson,A . E., N elson, S. M., Brown, M .R .and G ilb e rt P.(1995) A simple in vitro m odel fo r g row th con tro l of bacterial biofilms.Journd o f Applied Bacteriology 7 9 ,87-93.
H o n ra e t K .and Nelis, H.J. (2006) U se of th e modified robbins device and flu o rescen t staining to screen plant ex trac ts fo r th e inhibition of S.mutans biofilm form ation. Journal o f Microbiology Methods 6 4 ,2 17 -224 .
H ope, C . K. and W ilson, M. (2006) Biofilm s tru c tu re and cell vitality in a lab o ra to ry m odel of subgingival plaqu e.Journal o f Microbiology Methods 6 6 ,390-398.
Ince, D. and H ooper, D. C . (2003) Q uinolone resistance due to reduced ta rg e t enzym e expression . Journal o f Bacteriology 18 5 ,6883-6892.
Johnson, C . N„ Briles, D. E., Benjamin, W. H.,Jr., Hollingshead, S. K .and W aites, K .B .(2005) Relative fitness o f fluoroqu ino lone-resistan t Streptococcus pneumoniae. Emerging Infectious Disease I 1,814- 820.
Kadurugamuwa,J.L., Sin, L.,Albert, E.,Yu,J., Francis, K., DeBoer, M„ Rubin, M., Bellinger-Kawahara, C., Parr,J.T .Jr. and C ontag, P. R. (2003a) D irect con tinuous m ethod for m onitoring biofilm infection in a m ouse m odel. Infection and Immunity 7 1,882-890.
Kadurugam uwa, J. L„ Sin, L.V.,Yu, J., Francis, K. P., Kimura, R., Purchio.T. and C ontag, P. R. (2003b) Rapid d irec t m e th o d fo r m onitoring antibiotics in a m ouse m odel of bacterial biofilm infection. Antimicrobial Agents and Chemotherapy 4 7 ,3 13 0 -3 137.
Kugelberg, E., Lofmark, S .,W redind, B .and A ndersson, D. I. (2005) R eduction of th e fitness burden of quinolone resistance in Pseudomonas aeruginosa. Journal o f Antimicrobial Chemotherapy 5 5 ,22-30.
Lee, S .W .and E d lin ,G .(l9 8 5 ) Expression of tetracycline resistance in pBR322 derivatives reduces th e reproductive fitness of plasm id-containing Escherichia co/i. Gene 39, 173-180.
Lenski, R. E .and B oum aJ.E . (1987) Effects of segregation and selection on instability of plasmid pACYC 184 in Escherichia coli. Journal o f Bacteriology 1 6 9 ,5 3 1 4 -5 3 16.
Lenski, R.E., M ongold,J.A .,Sniegowski, P. D .Travisano, M.,Vasi, F., G errish, P.J.and Schmidt,T. M .(I998) Evolution of com petitive fitness in experim ental populations of £ coli: w hat makes o n e geno type a b e t te r co m p e tito r than ano ther? Antonie Van Leeuwenhoek 73, 35-47.
30 Biofilm Club © 2 0 0 7
Pope et al.
Lenski, R. E., Simpson, S. C. and Nguyen, T.T. (1994) G enetic analysis of a plasm id-encoded, host genotype-specific enhancem ent of bacterial fitness. Journal o f Bacteriology 17 6 ,3140-3147.
Levin, B.R., Perrot,V. and Walker, N .(2000) C om pensa to ry m utations, antibiotic resistance and the population genetics of adaptive evolution in bacteria. Genetics 154, 985-997.
Loo, C.Y., Corliss, D. A. and G aneshkum ar, N . (2000) Streptococcus gordonii biofilm form ation: identification of genes th a t code fo r biofilm phenotypes .Journo/ o f Bacteriology 182, 13 7 4 -1382.
Luo, N., Pereira, S., Sahin, O., Lin, J., Huang, S., Michel, L. and Zhang, Q . (2005) Enhanced in vivo fitness o f fluoroquinolone-resistan t Campylobacter jejuni in th e absence of antibiotic selection pressure . Proceedings o f the National Academy o f Sciences 10 2 ,5 4 1 -546.
Mikuniya,T.,Kato,Y.,Kariyama, R., M onden, K., Hikida, M .and Kumon, H .(2 0 0 5 ) Synergistic effect of fosfomycin and fluoroquinolones against Pseudomonas aeruginosa grow ing in a biofilm. Acta Medica Okayama 5 9 ,209-216.
Modi, R.I.,W ilke, C .M .,Rosenzweig, R.F.and A d am s,J.(l9 9 1 ) Plasmid m acro-evo lu tion :selection of dele tions during adaptation in a nutrient-lim ited environm ent. Genetica 84 , 195-202.
M oorm an, D. R. and Mandell, G. L. ( 19 8 1) C haracteristics of rifam pin-resistant variants obtained from clinical isolates of Staphylococcus aureus. Antimicrobial Agents Chemotherapy 2 0 ,7 0 9 -7 13.
Muller, H .J .( 1964) The relation of recom bination to m utational advance. Mutation Research 1,2-9.Murga, R., Miller, J. M .and Donlan, R.M. (2001) Biofilm form ation by gram -negative bacteria on central
venous c a th e te r connecto rs: effect of conditioning films in a labo ra to ry m odel .Journal o f Clinical Microbiology 39,2294-2297.
Nguyen,T. N., Phan, Q . G., Duong, L. P., B ertrand, K. P. and Lenski, R. E. ( 1989) Effects of carriage and exp ression of th e T n 10 tetracycline-resistance operon on the fitness of Escherichia coli K 12. Molecular Biology and Evolution 6 ,2 13-225.
O ’Toole, G.A. and Kolter, R. ( 1998a) Flagellar and twitching motility are necessary for Pseudomonas aeruginosa biofilm developm ent.Molecular Microbiology 30 ,295-304.
O ’Toole, G .A .and Kolter, R. ( 1998b) Initiation of biofilm form ation in Pseudomonas fluorescens W C S 365 p roceeds via multiple, convergent signalling pathw ays:a genetic analysis. Molecular Microbiology 2 8 ,4 4 9 -4 6 1.
O rdway, D.J., Sonnenberg, M .G., D onahue, S.A., Belisle,J.T.and O rm e, I. M. (1995) D rug-resistan t stra ins of Mycobacterium tuberculosis exhibit a range of virulence for m ice. Infection and Immunity 6 3 ,7 41 -743 .
P eters, A. and W im penny,J.( 1987) A constan t dep th labora to ry m odel film ferm en ter. Biotechnology and Bioengineering 32,263-270.
P ratt, L.A.and Kolter, R. ( 1998) G enetic analysis of Escherichia coli biofilm fo rm ation : ro les of flagella, motility, chem otaxis and type I pili. Molecular Microbiology 3 0 ,285 -293 .
Remold, S. K. and Lenski, R. E. (2 0 0 1) C ontribu tion of individual random m utations to genotype-by- env ironm en t interactions in Escherichia coli. Proceedings o f the National Academy o f Sciences 98,I 1388-11393.
Sanchez, P., Linares, J. F.,Ruiz-Diez, B .,Cam panario, E„ Navas,A., Baquero, F.and M artinez,J.L .(2002) Fitness of in vitro selected Pseudomonas aeruginosa nalB and nfxB m ultidrug re s istan t m utants.
Journal o f Antimicrobial Chemotherapy 5 0 ,657-664.Schrag, S.J., Perrot,V. and Levin, B.R. (1997) A daptation to th e fitness costs o f antibiotic resistance in
Escherichia coli. Proceedings Biological Sciences 2 6 4 ,12 8 7 -12 9 1.Seppala, H„ Klaukka,T.,Vuopio-Varkila,J., Muotiala.A., H elenius,H ., Lager, K .and H uovinen, P. ( 1997)
T he effect of changes in th e consum ption of m acrolide antibiotics on ery throm ycin resistance in g ro u p A streptococci in Finland. Finnish Study G ro u p for A ntim icrobial R esistance. New England Journal o f Medicine 3 3 7 ,4 4 1 -446.
Sherm an, D. R., Mdluli, K., Hickey, M.J.,Arain.T. M„ M orris, S. L., Barry, C . E. and Stover, C . K. ( 1996) C o m p en sa to ry ahpC gene expression in isoniazid-resistant Mycobacterium tuberculosis. Science 272 , 1641-1643.
Singh, P. K., Schaefer,A.L., Parsek, M. R., Moninger.T. O .,W elsh, M.J. and G reenberg , E. P. (2000) Q uorum -sensing signals indicate th a t cystic fibrosis lungs are infected w ith bacterial biofilms. Nature 4 0 7 ,762-764.
Vorachit, M., Lam, K., Jayanetra, P. and C o ste rto n , J.W . (1993) R esistance of Pseudomonas pseudomallei grow ing as a biofilm on silastic discs to ceftazidim e and co-trim oxazole.
Biofilm C lub © 2 0 0 7 31
MEASURING BACTERIAL FITNESSAntimicrobial Agents Chemotherapy 37, 2000-2002.
W arn es .A .an d S tephenson , J .R .( 1986) T he insertion of large pieces of foreign genetic m aterial reduces th e stability of bacterial plasm ids.Plasmid 16, 116 - 123.
W atnick, P. L and Kolter, R. (1999) Steps in the developm ent of a Vibrio cholerae El Tor biofilm. Molecular Microbiology 34, 586-595.
W ichelhaus.T .A ., Boddinghaus, B., Besier, S., Schafer,V., Brade.V.and Ludwig, A. (2002) Biological co st of rifampin resistance from th e perspective of Staphylococcus aureus. Antimicrobial Agents and Chemotherapy 4 6 ,3 3 8 1 -3385.
W ilson.T. M .,de Lisle, G.W . and Collins, D. M. 1995,“Effect of inhA and katG on isoniazid resistance and virulence of Mycobacterium bovis Molecular Microbiology 15, 1009-1015.
Youmans, G. P. and Youmans. A. S. (1949) A M ethod for the determ ination of th e ra te of g row th of tu b e rc le bacilli by th e use of small inocula.Journal o f Bacteriology 58,247-255.
32 B iofilm Club © 20 0 7
Rapid methods to determine fitness in bacteria using automated culture systems
Cassie Pope, Timothy McHugh and Stephen Gillespie
Abstract
Determination of growth rate and generation time is often used to measure fitness costs
associated with antibiotic resistance. However the use of growth curve techniques to
determine generation time is laborious, time consuming and can introduce sampling
error. We have described the use of a semi automated liquid culture system to estimate
generation time in Burkholderia cepacia complex bacteria. We have also used the
BacT/ALERT system to determine generation time and enumerate bacterial numbers in
Mycobacterium tuberculosis. These methods, therefore, can be adapted for use with
other organisms. This chapter outlines a method to use the Bactec 9000 series of
instruments to measure generation time.
Introduction
It is an accepted dogma that a resistant organism pays a physiological price for resistance,
particularly resistance mediated by chromosomal mutations (1,2). Although studies have
shown that acquisition of antibiotic resistance can incur a biological cost (1,3) there is
evidence that some mutations conferring resistance may result in a low or no existent
fitness deficit (4-6). In vitro models of fitness have been used in order to investigate the
evolution of antibiotic resistance and to assess the physiological price associated with
acquisition of resistance. The growth rate of bacteria in culture medium is a commonly
used model for evaluating fitness as a measure of reproductive potential (7-10). However
fitness is a complex characteristic that encompasses the ability of a genotype to reproduce
267
within a host, be transmitted and be cleared. Multiple models should therefore be chosen
carefully that represent the mode of life of the organism in question. We have used
competitive pair wise cultures, growth rate, biofilm formation and environmental survival
models to assess the fitness cost of acquisition of fluoroquinolone resistance in
Burkholderia cepacia (11). Relative fitness is often determined by competition assay
between isogenic antibiotic susceptible and antibiotic resistant bacteria in culture or in
animal models. These models can be adapted for use in many bacterial species.
Viable cell count estimation is subjective and dependent on enumeration of colonies that
grow under growth conditions provided, introducing sampling error. By using an
automated system which is less time consuming and not user dependent, it is possible to
determine growth rate for large numbers of strains. Youmans and Youmans used the
difference in time to positivity, measured as time to a certain turbidity, of small inoculums
of M. tuberculosis to determine generation time (12). We have adapted this method to
determine generation times in a semi automated liquid culture system for B. cepacia and M.
tuberculosis, using the difference in time to positivity of diluted inoculums. These methods
may minimise observed variation and allow fitness costs to be calculated in terms of
generations. Laurent et al have also used an automated liquid culture system (MS2
Research System, Abbott Laboratories, Dallas, Tx, USA) and paired competitive cultures
to determine growth rate, as a measure of fitness in MRSA (13). This chapter describes use
of a semi automated liquid culture system for measurement of generation time in
Burkholderia cepacia.
We have used the Bactec 9240 continuous, blood culture system with standard aerobic
medium was used to determine growth rate in B. cepacia. The Bactec 9000
268
(9240/9120/9050) series of automated blood culture systems are used to rapidly detect
viable microorganisms in clinical specimens and is used in most clinical laboratories with
in the UK. Bactec Plus Aerobic vials, contain 25 mL of enriched soybean-caesin digest
broth, 0.05% sodium polyanetholesulfonate (SPS), resins, CO2, O2 and a sensor. This
sensor, within each vial, responds to changes in oxygen and carbon dioxide levels as a
result of bacterial metabolism. These changes are measured by an increase in the
fluorescence of the sensor which is monitored every ten minutes. A positive fluorescence
reading indicates an increase in CO2 or decrease in oxygen and the presence of
microorganisms in that vial.
Materials1. Test organisms2. Incubator3. Muller Hinton Broth4. Orbital incubator5. Phosphate buffer saline (PBS)6. Spectrophotometer7. 0.5 mL syringe8. 0.5 mm guage needle9. Bactec automated blood culture system (Bactec 9000 series)10. Steret alcohol wipes11. Aerobic Bactec bottles12. Blood agar plates13. Microscope14. Gram stain reagents15. Glass slides
Methods
1. Grow B. cepacia on Columbia blood agar plates at 37°C for 18 hours2. Using a sterile loop inoculate one colony of B. cepacia in Muller Hinton broth
(5mL) and incubate using an orbital incubator (200rpm) for 4 hours to obtain an exponentially growing culture. Dilute culture to standard optical density using PBS.
3. Dilute culture via serial dilution (10"1 -1 O'6) in PB S.4. Aseptically inoculate triplicate Bactec bottles with 0.5 mL of the 10'2 and 10'4
dilutions using steret alcohol wipe, needle and syringe.5. Invert bottles to mix.6. Load into system.7. Incubate until bottles flag as positive.
269
8. Print growth curve and time to positivity.9. Remove bottles and discard.10. Confirm absence of contaminants by Gram stain and spreading of one drop of
bottle content onto Columbia blood agar.
The growth rate constant and generation time can be determined by the following equations
K = log a - log b t
G = log 2 K
Where K is the growth rate constant, a is the largest inoculum (1:10), b is the smallest inoculum (1:1000), t is the difference in time (h) taken for each of the sets of bottles to signal positive and G is the generation time.
Notes
1. The Bactec 9000 series of instruments are used by most clinical microbiology laboratories and are therefore available for translational research following discussion with the service manager and chief Biomedical Scientists.
2. Bactec bottles should be allowed to equilibrate at room temperature before inoculation.
3. Bottles should be left in the system until time to positivity data can be printed, as the system only stores data temporarily. If with discussion, the Biomedical Scientist wishes to remove bottles immediately after flagging as positive then they should print the growth plot at the same time.
4. Bottles may flag as positive overnight therefore ensure that the on call Biomedical Scientist is aware of the experiment and understands the importance of printing the growth plot or leaving bottles in the system.
5. Print out of growth curve can be integrated into clinical service if required.6. Bottles must to be booked into the laboratory computer system because
otherwise sample data will not be recorded.7. Bottle bar code stickers must be retained in order to identify bottles.8. Any bottles that do not become positive must be removed from the system.9. Cells must be added to bottles while in exponential phase to limit the effect of
lag time differences on time to positivity. An initial growth curve experiment should be performed to determine incubation conditions required for bacterial cells to be in exponential phase
10. This method can be adapted for other fast growing bacteria. We have also used the BacT/ALERT system to determine generation time in M. tuberculosis.
References
1. Andersson, D. I, and Levin, B. R. (1999) The biological cost of antibiotic resistance. Curr Opin Microbiol, 2, 489-493.
270
2. Levin, B.R., Perrot, V., and Walker, N. (1999) Compensatory mutations, antibiotic resistance and the population genetics of adaptive evolution in bacteria. Genetics, 154, 985-997.
3. Gillespie, S. H., McHugh, T. D. (1997) The biological cost of antimicrobial resistance. Trends Microbiol, 5, 337-339.
4. Kugelberg, E., Lofmark, S., Wretlind, B., Andersson, D. I. (2005) Reduction of the fitness burden of quinolone resistance in Pseudomonas aeruginosa J Antimicrob Chemother, 55, 22-30.
5. Gillespie, S. H, Voelker, L. L, Dickens, A.(2002) Evolutionary barriers to quinolone resistance in Streptococcus pneumoniae. Microb Drug Resist, 8, 79- 84.
6. Gillespie, S. H. (2001) Antibiotic resistance in the absence of selective pressure. Int J Antimicrob Agents, 17, 171-176.
7. Bennett, A. F, Dao, K. M, Lenski, R. E. (1990) Rapid evolution in response to high-temperature selection Nature, 346, 79-81.
8. Lenski, R.E., Simpson, S.C. and Nguyen, T. T. (1994) Genetic analysis of a plasmid-encoded, host genotype-specific enhancement of bacterial fitness. J Bacteriol ,176, 3140-3147.
9. Lenski, R. E, Mongold, J. A, Sniegowski, P. D, Travisano, M., Vasi, F., Gerrish, P. J. and Schmidt, T. (1998) Evolution of competitive fitness in experimental populations of E. coli: what makes one genotype a better competitor than another? Antonie Van Leeuwenhoek, 73, 35-47.
10. Nguyen, T. N., Phan Q. G., Duong L. P., Bertrand K. P. and Lenski R. E. (1989) Effects of carriage and expression of the Tn 10 tetracycline-resistance operon on the fitness of Escherichia coli K12. Mol Biol Evol 6, 213-225.
11. Pope, C. F., Gillespie, S. H., Pratten, J. R. & McHugh, T. D. 2007, Investigation on Fluoroquinolone- Resistant mutants of Burkholderia cepacia Antimicrob. Agent Chemother 52, 1203-3.
12. Youmans, G. P. and Youmans, A. S. (1949) A method for the determination of the rate of growth of tubercle bacilli by the use of small inocula. J Bacteriol 58, 247-255.
13. Laurent, F., Lelievre, H., Comu, M., Vandenesch, F., Carret, G., Etienne, J., and Flandrois, J. P. (2001) Fitness and competitive growth advantage of new gentamicin-susceptible MRSA clones spreading in French hospitals. J.Antimicrob Chemother 47, 277-283.
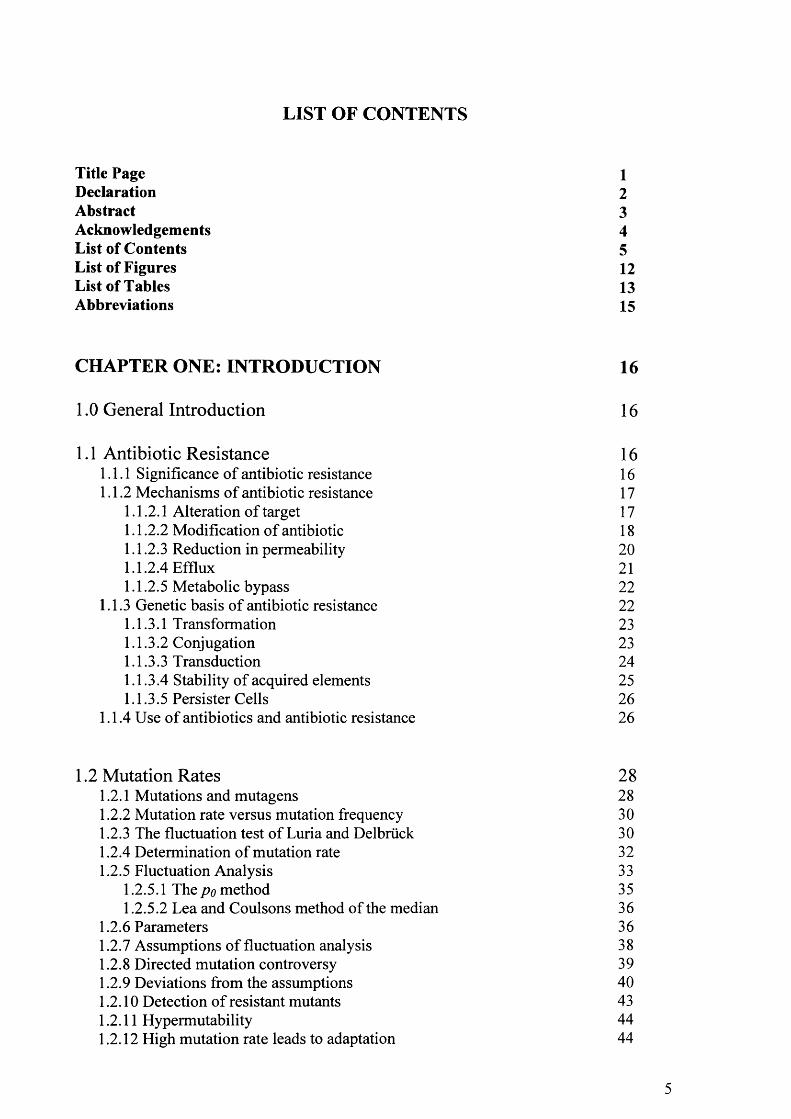
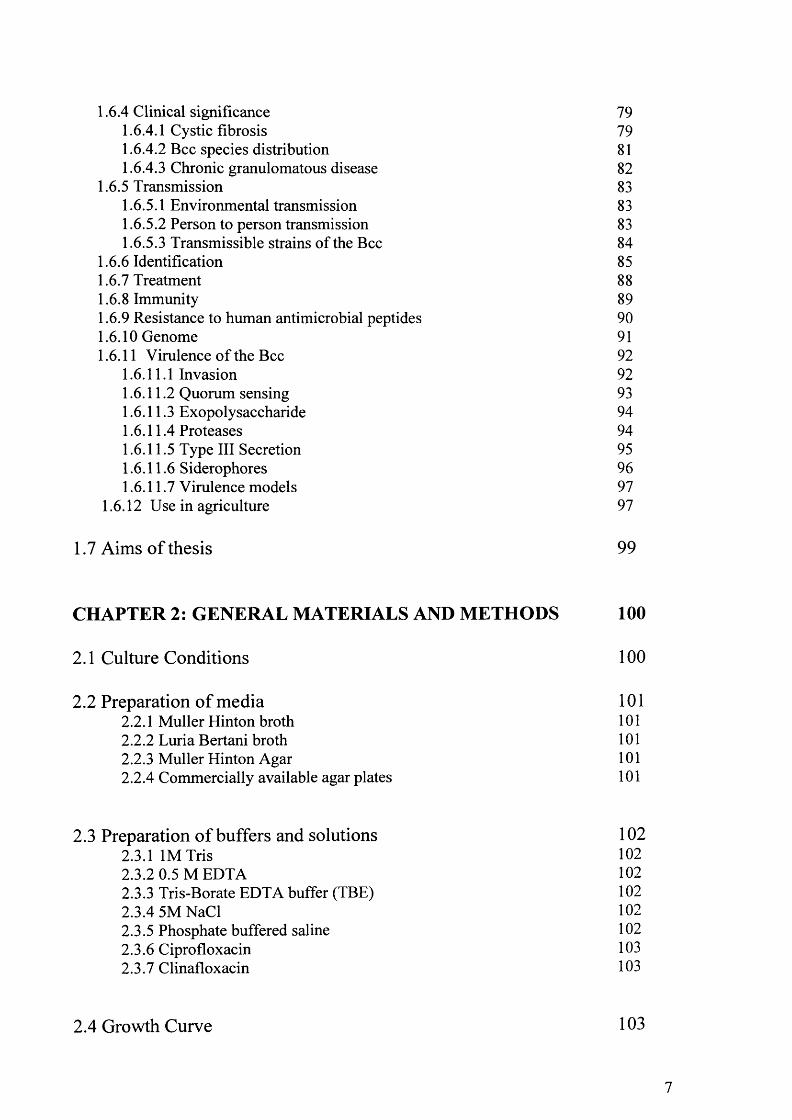
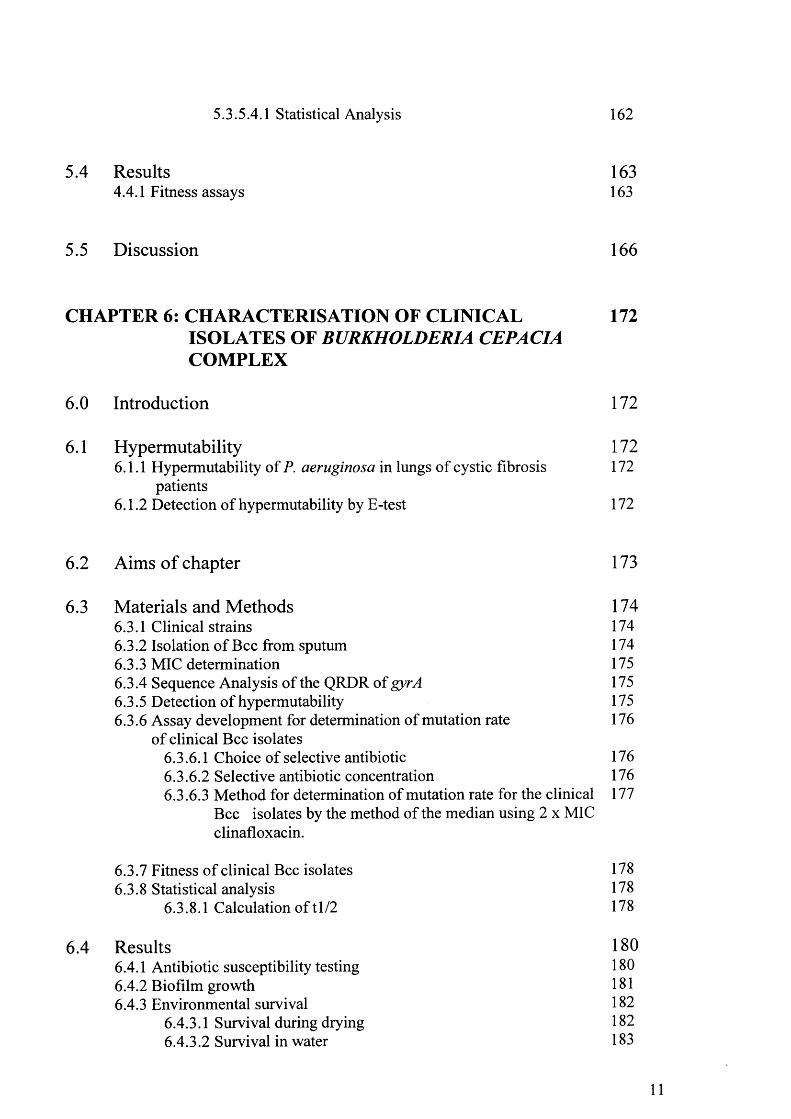
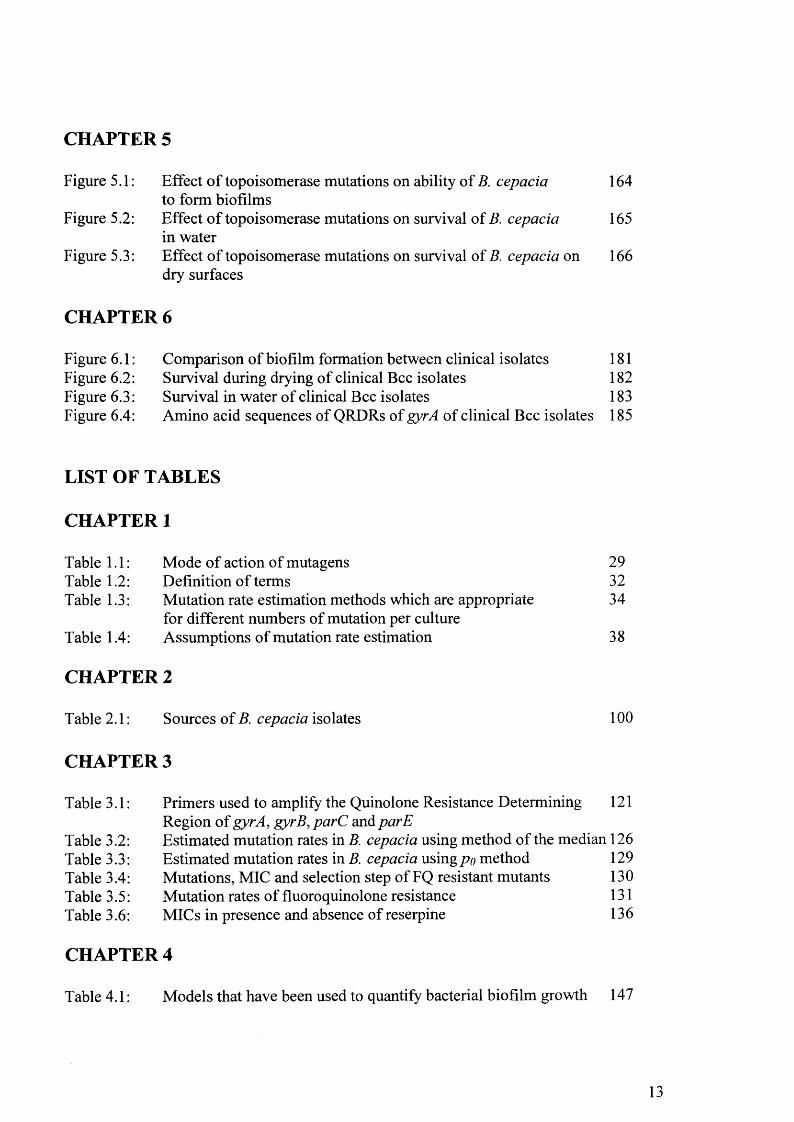
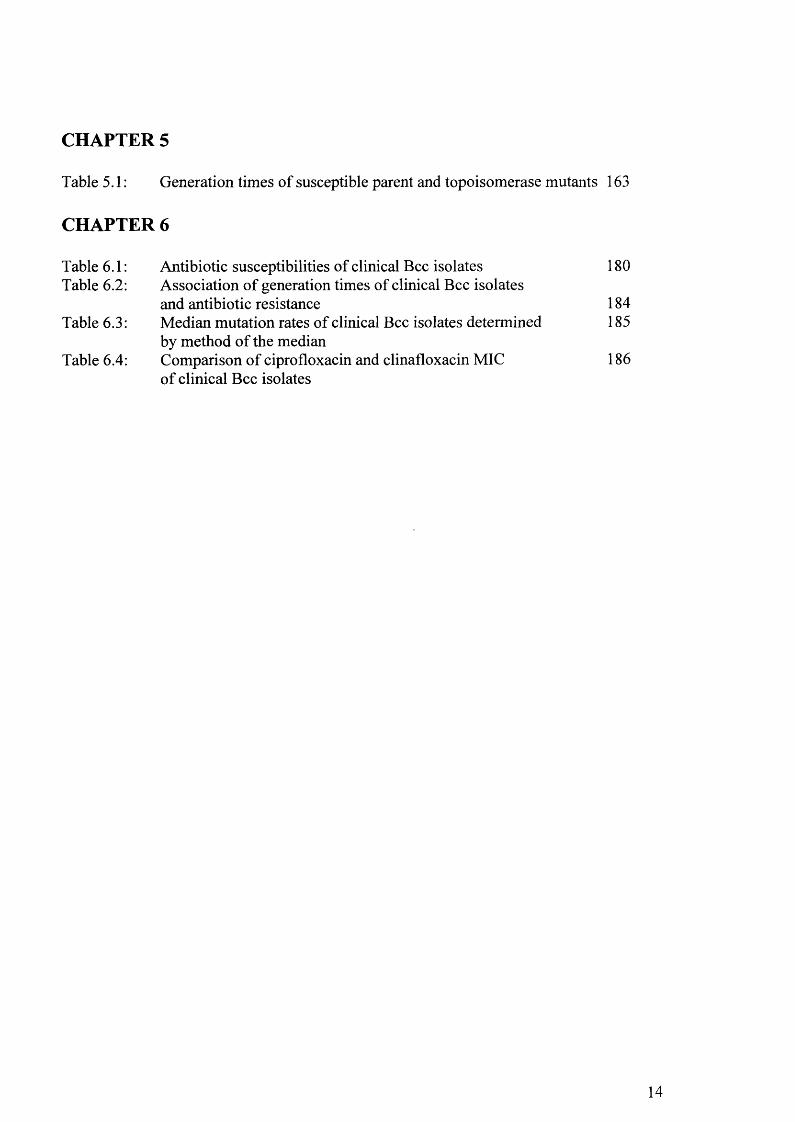
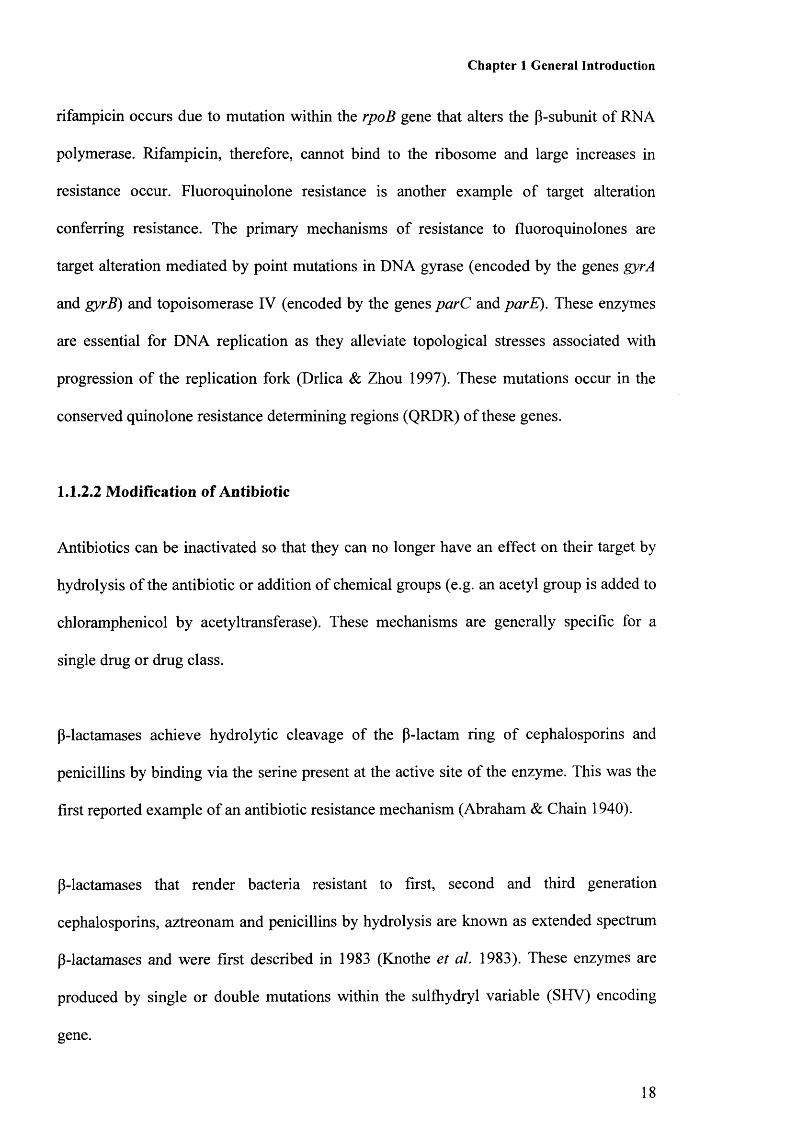
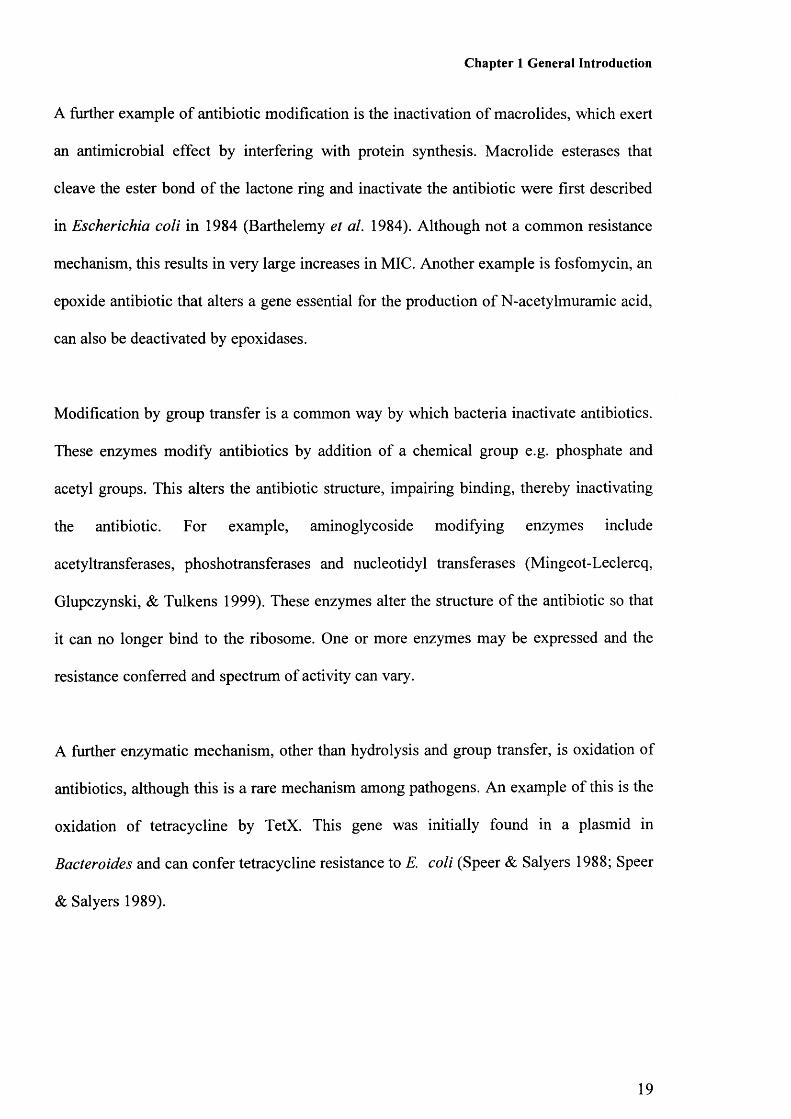
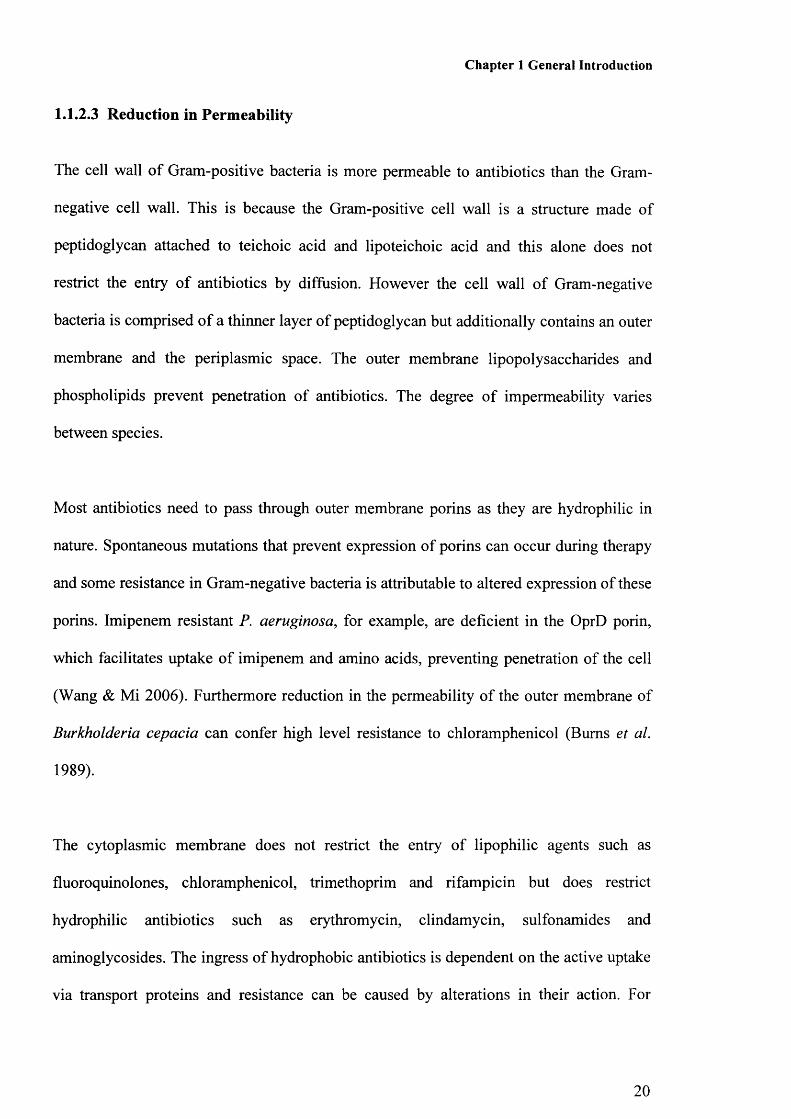
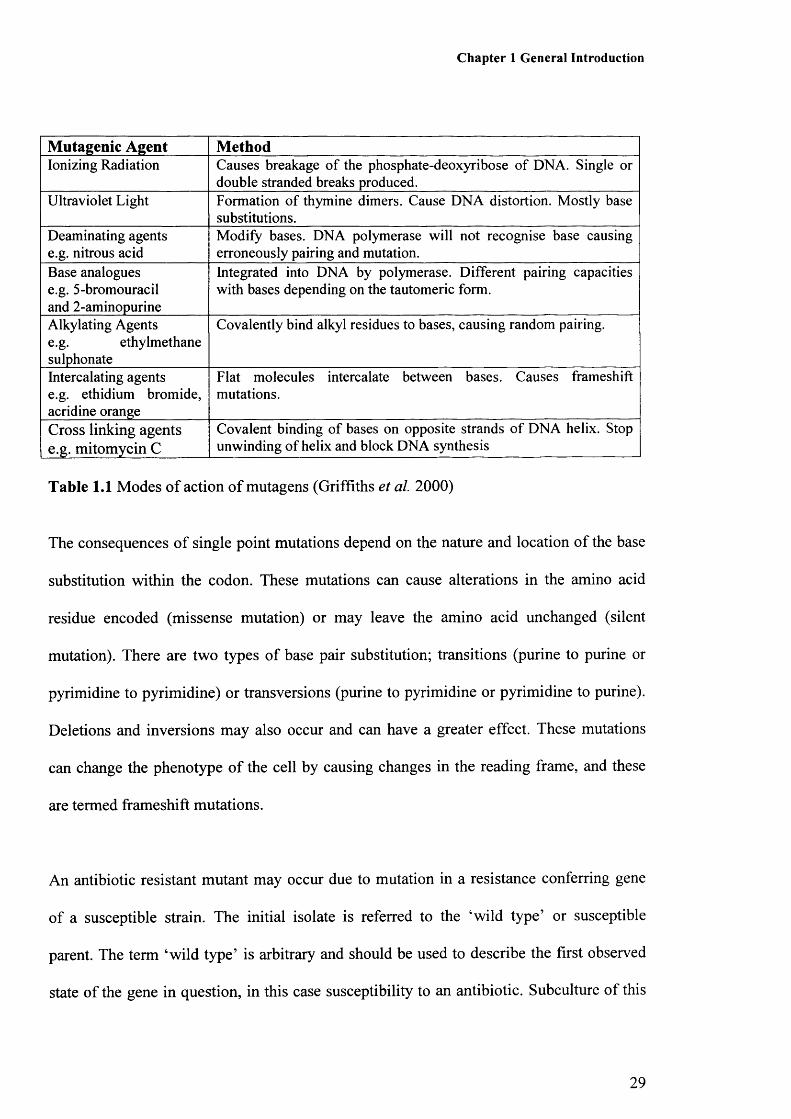
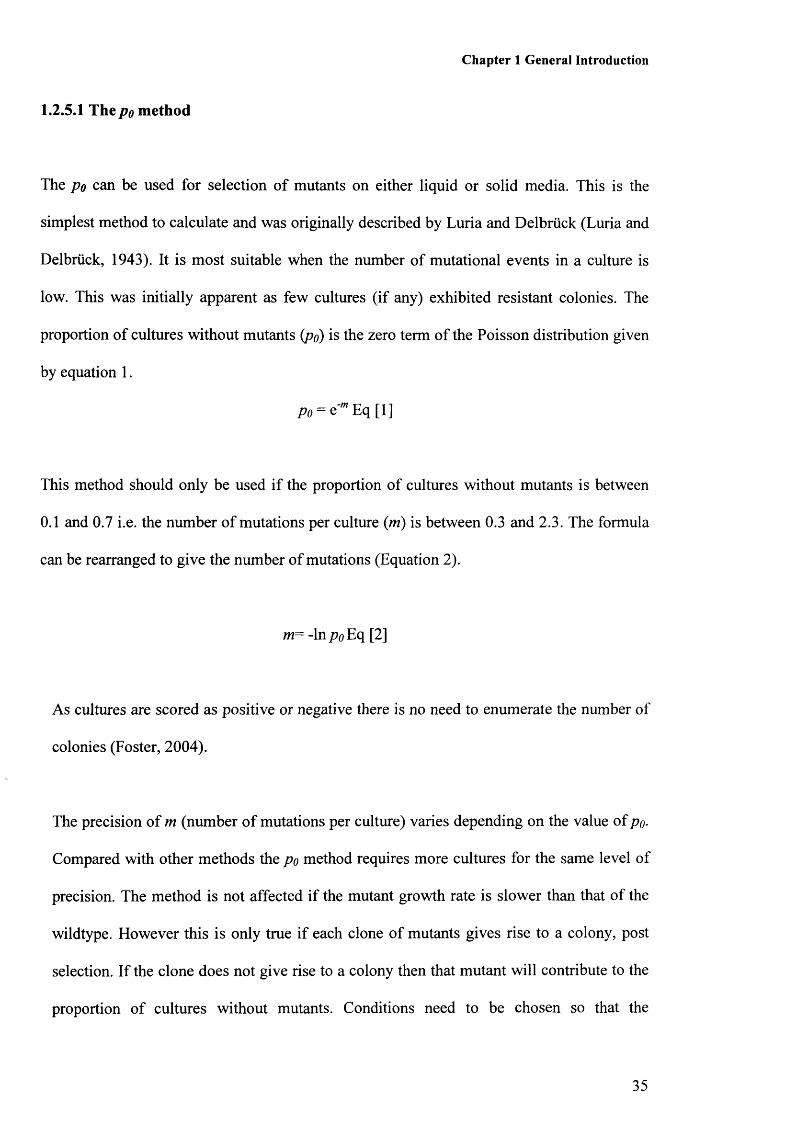
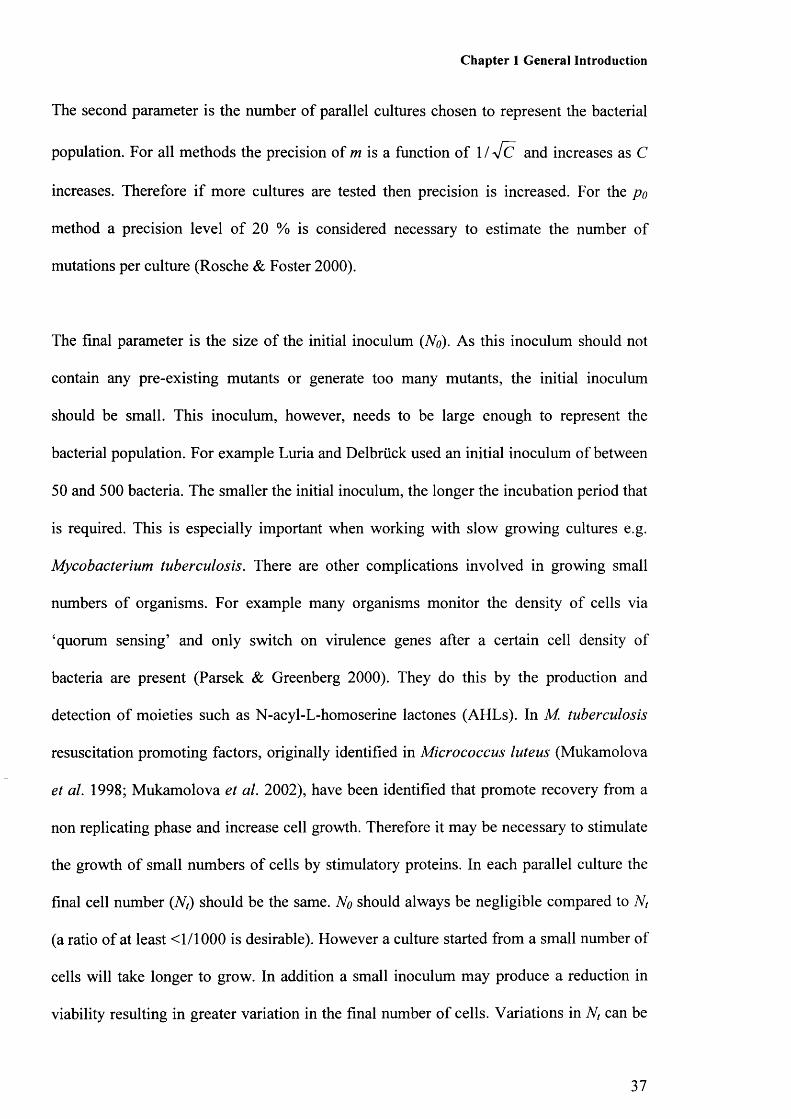
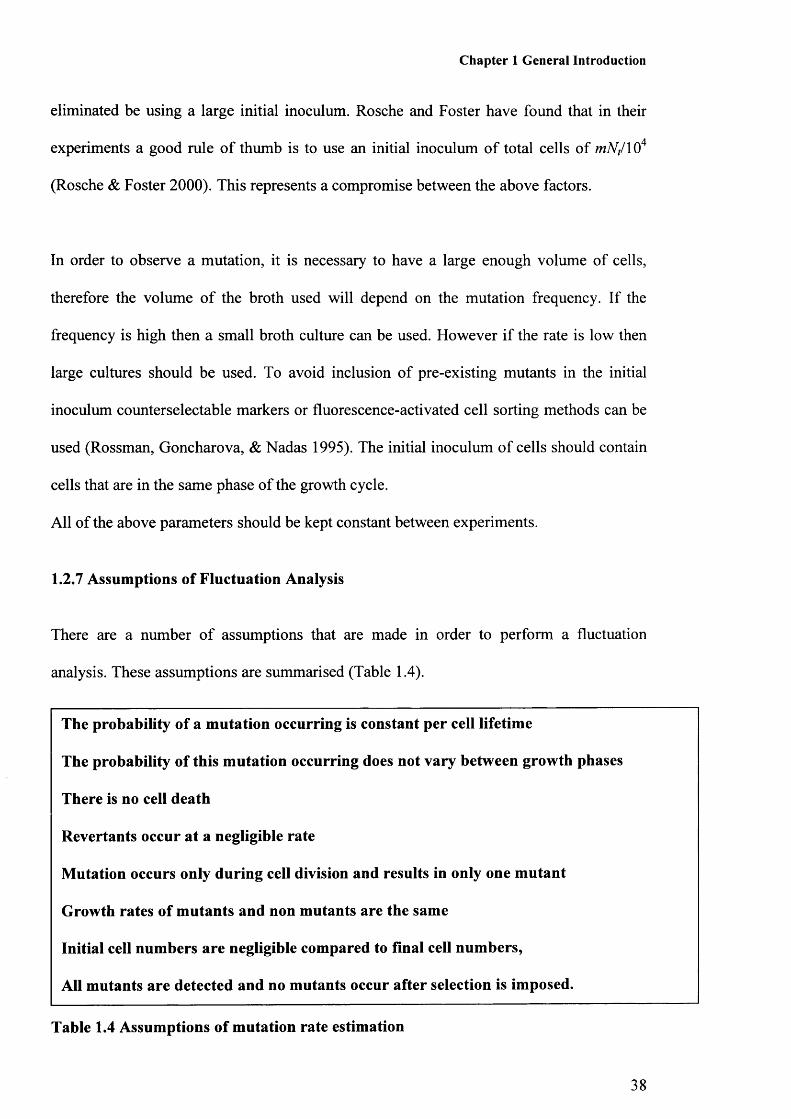
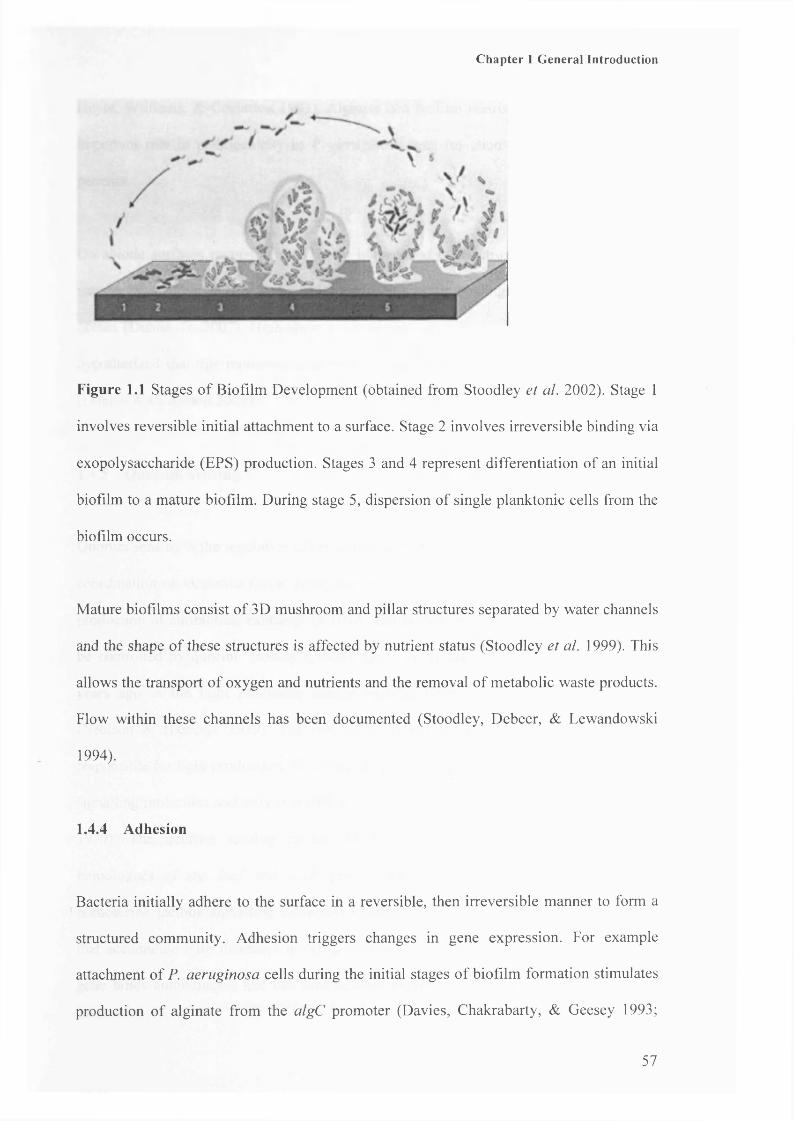
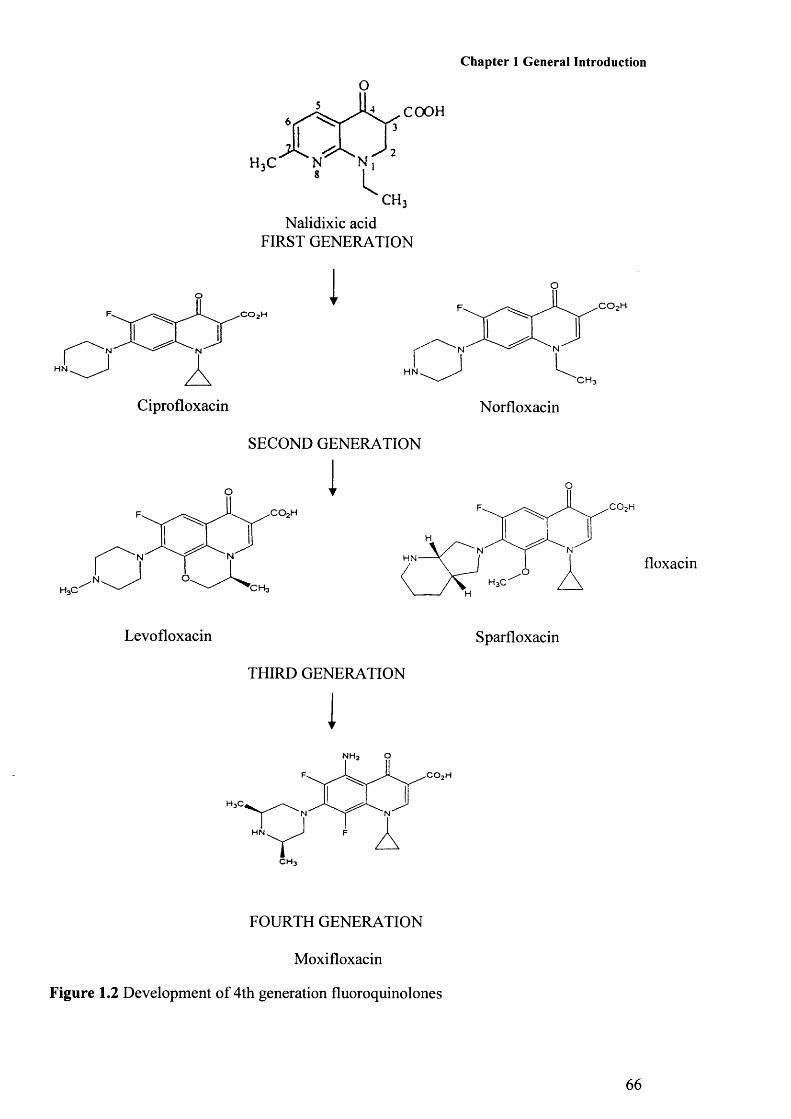
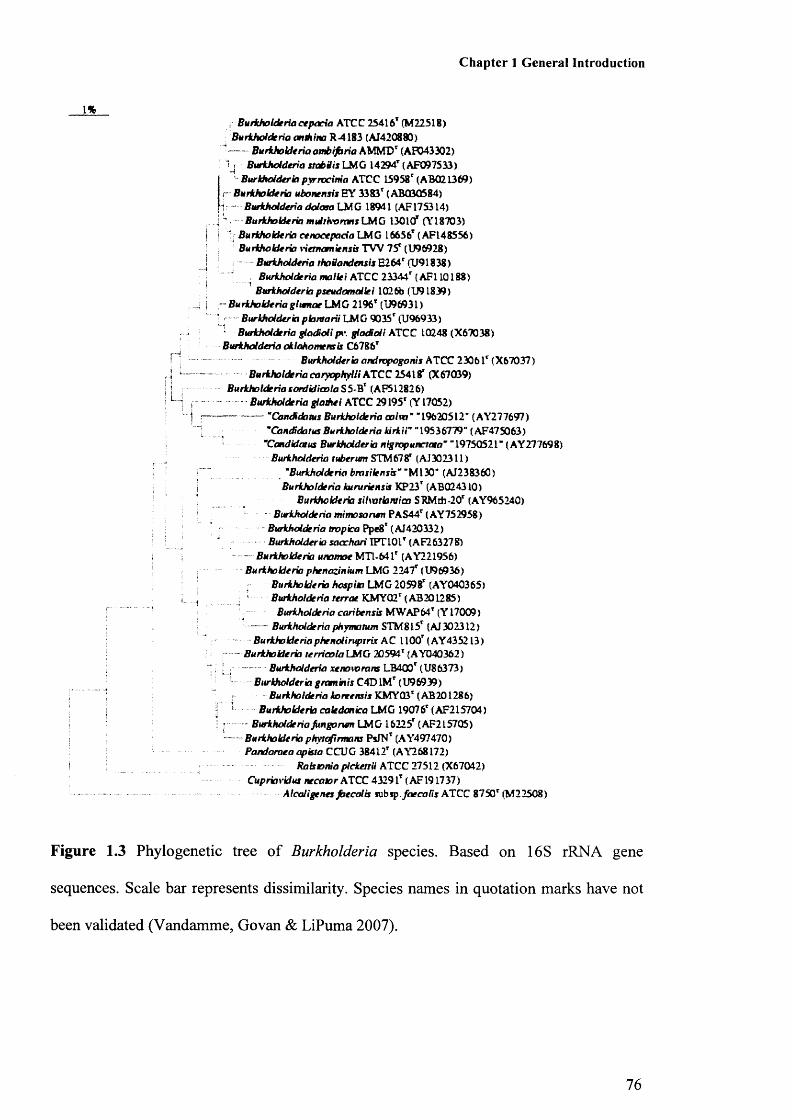
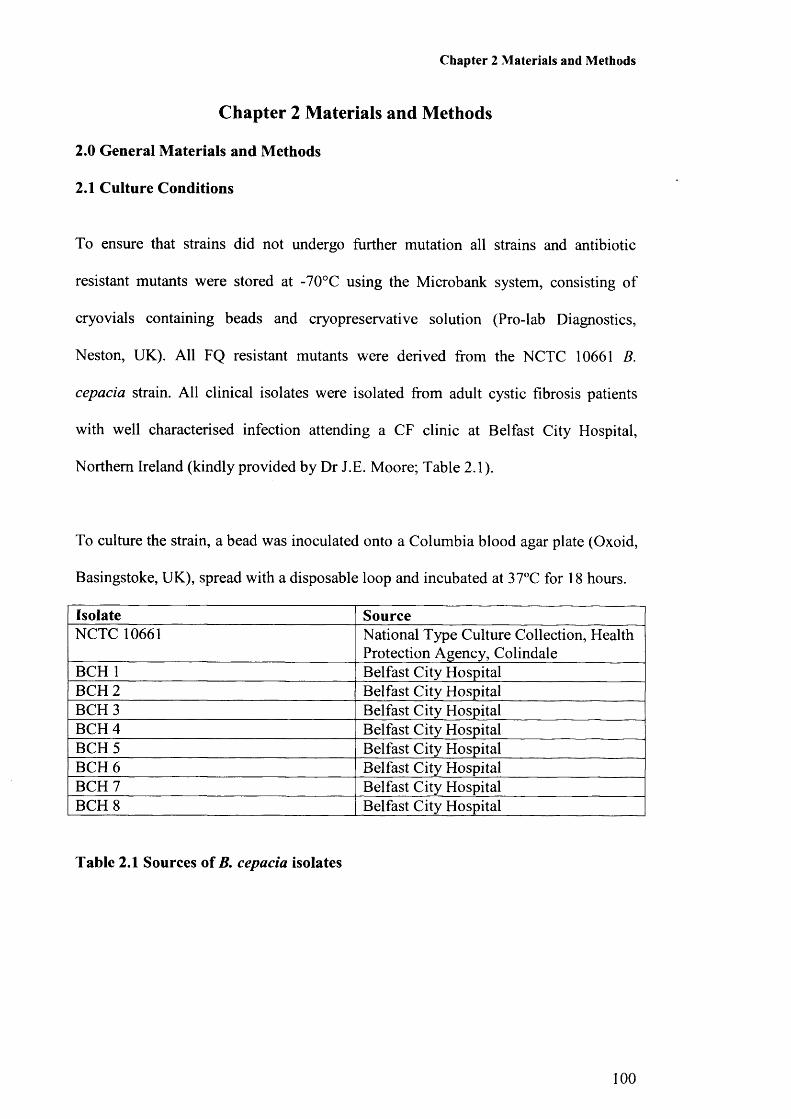
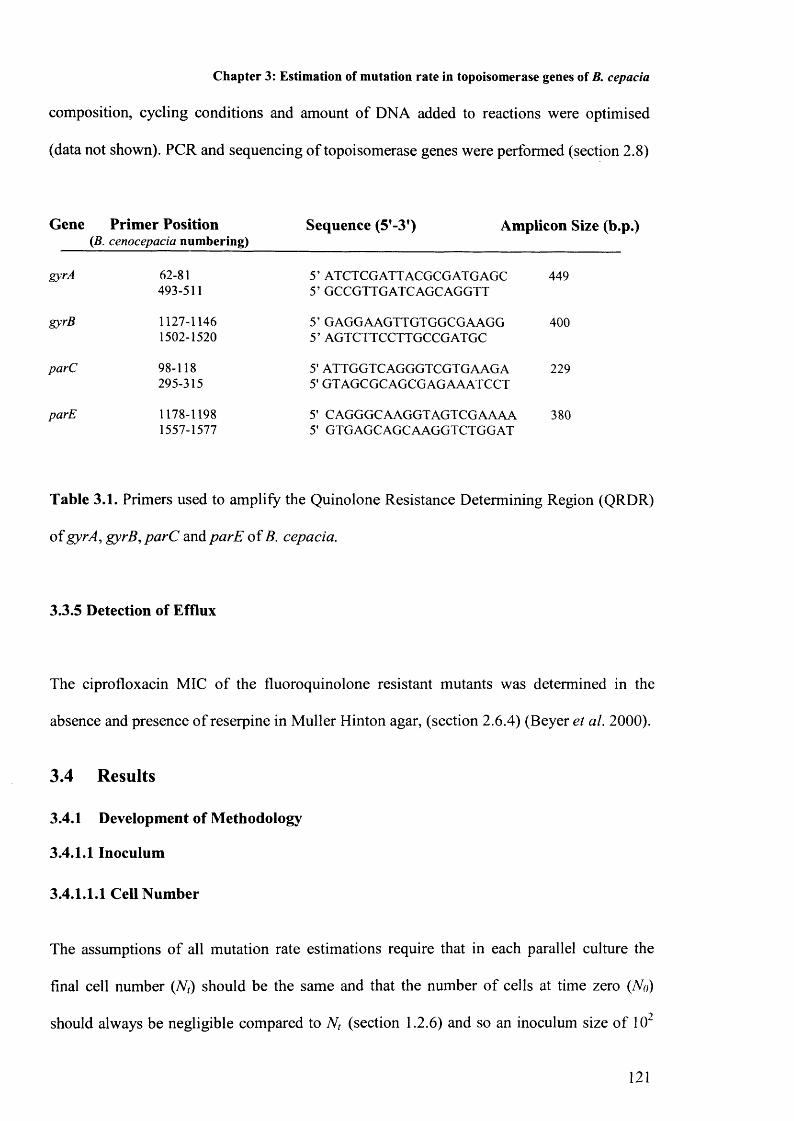
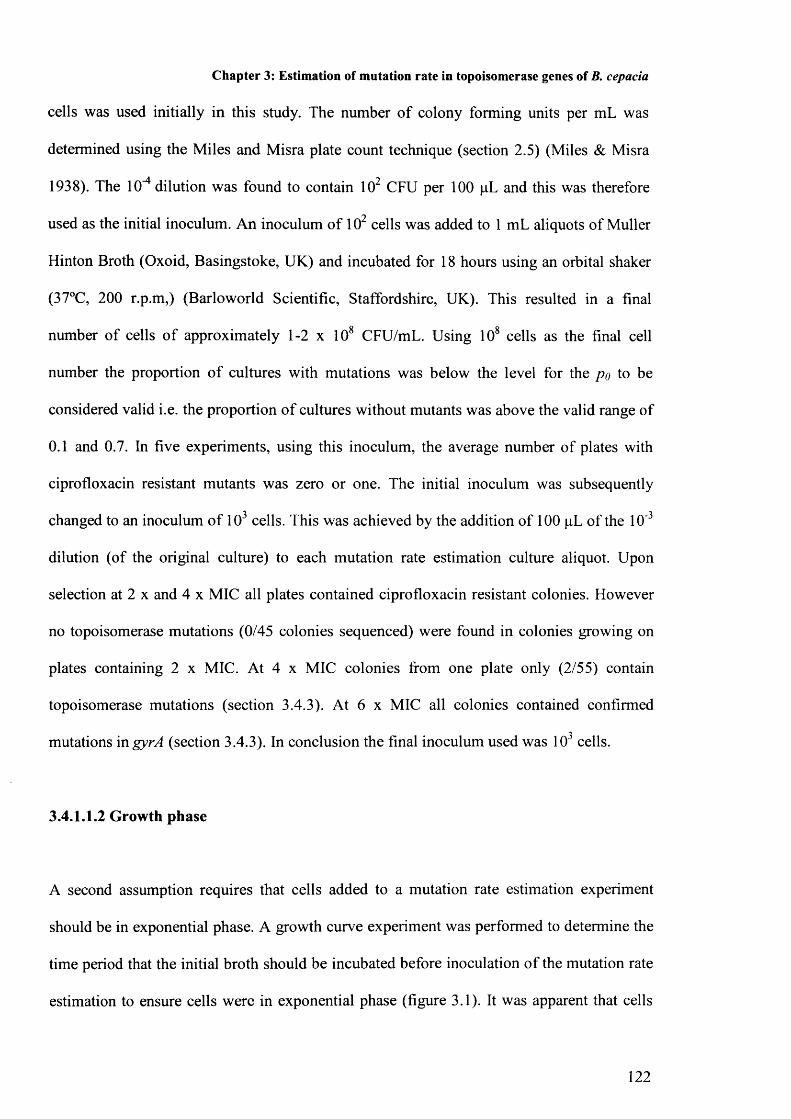
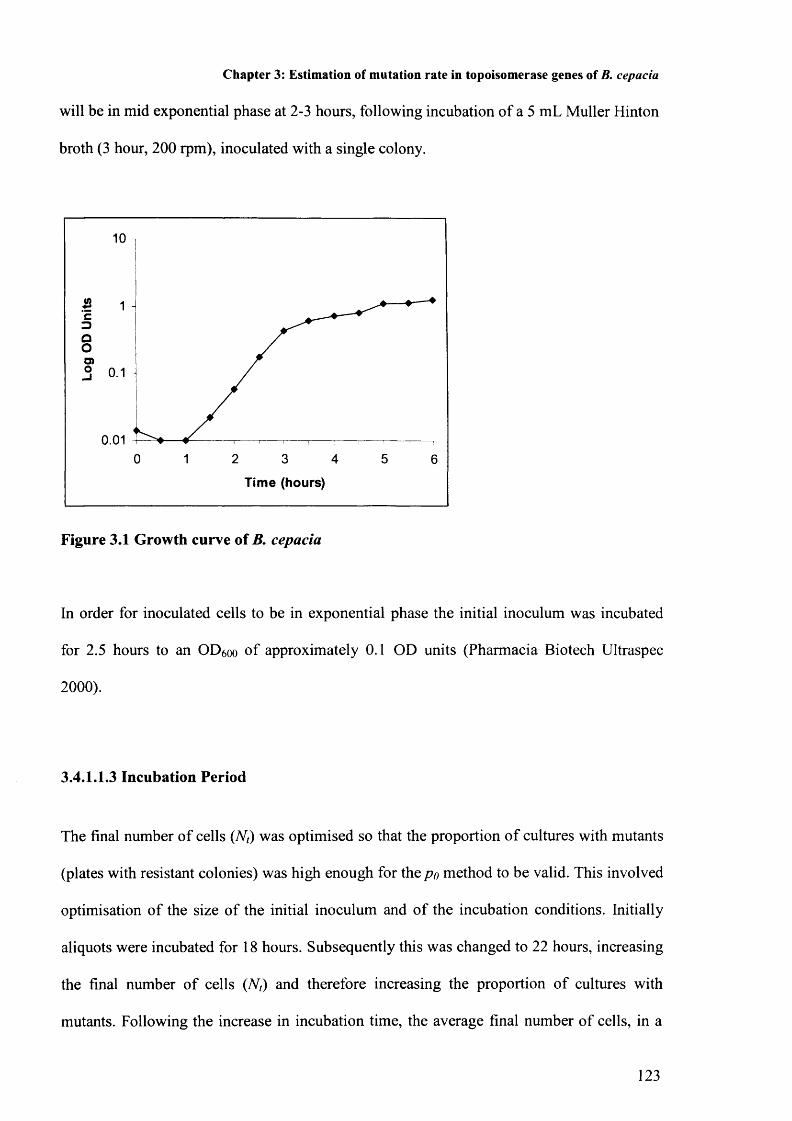
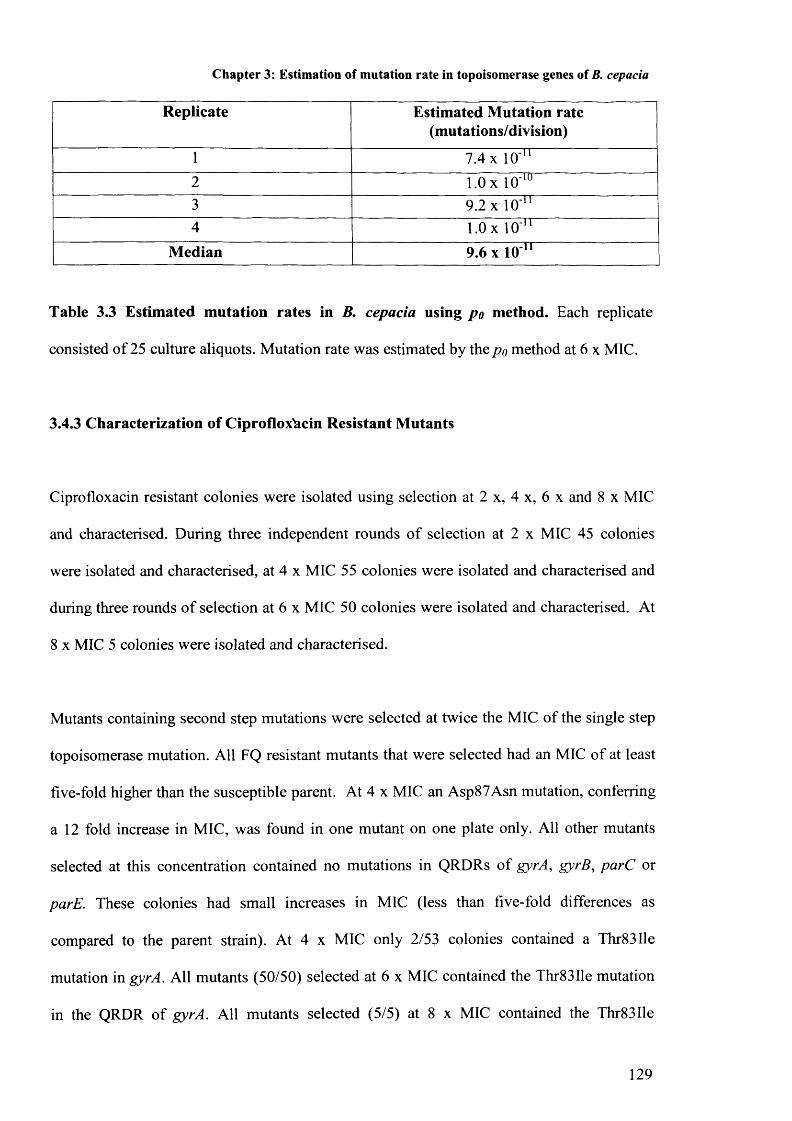
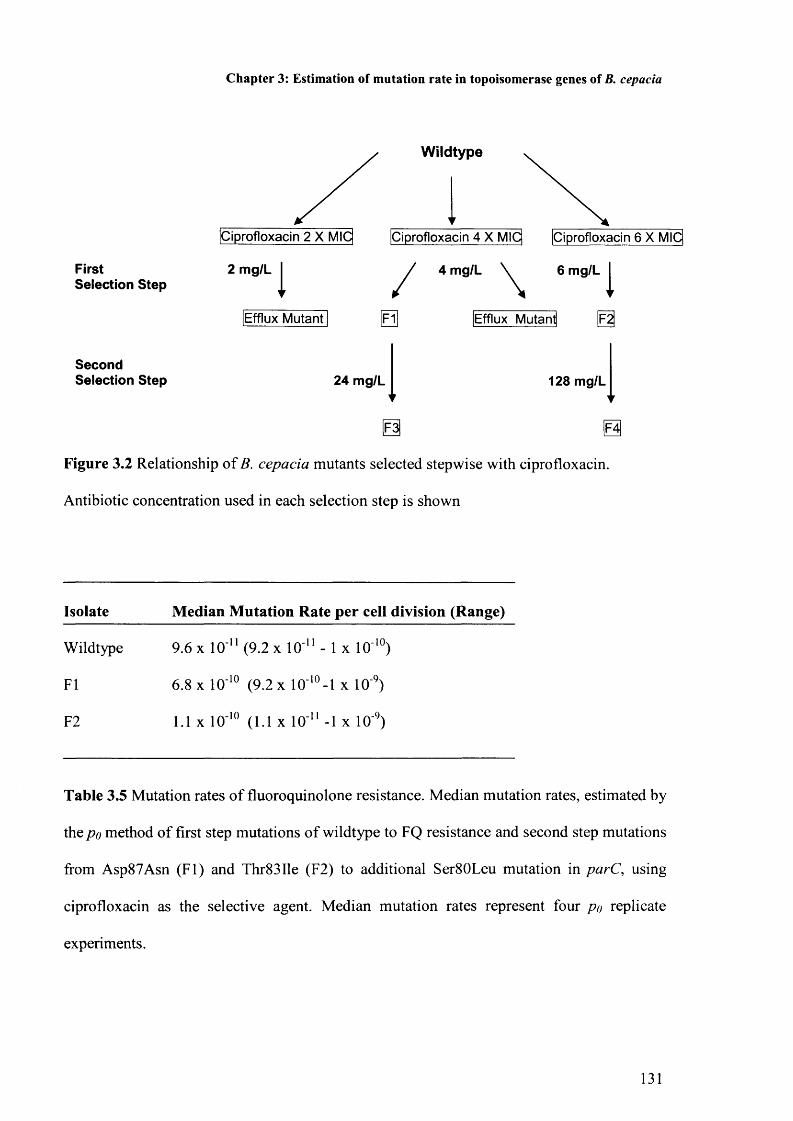
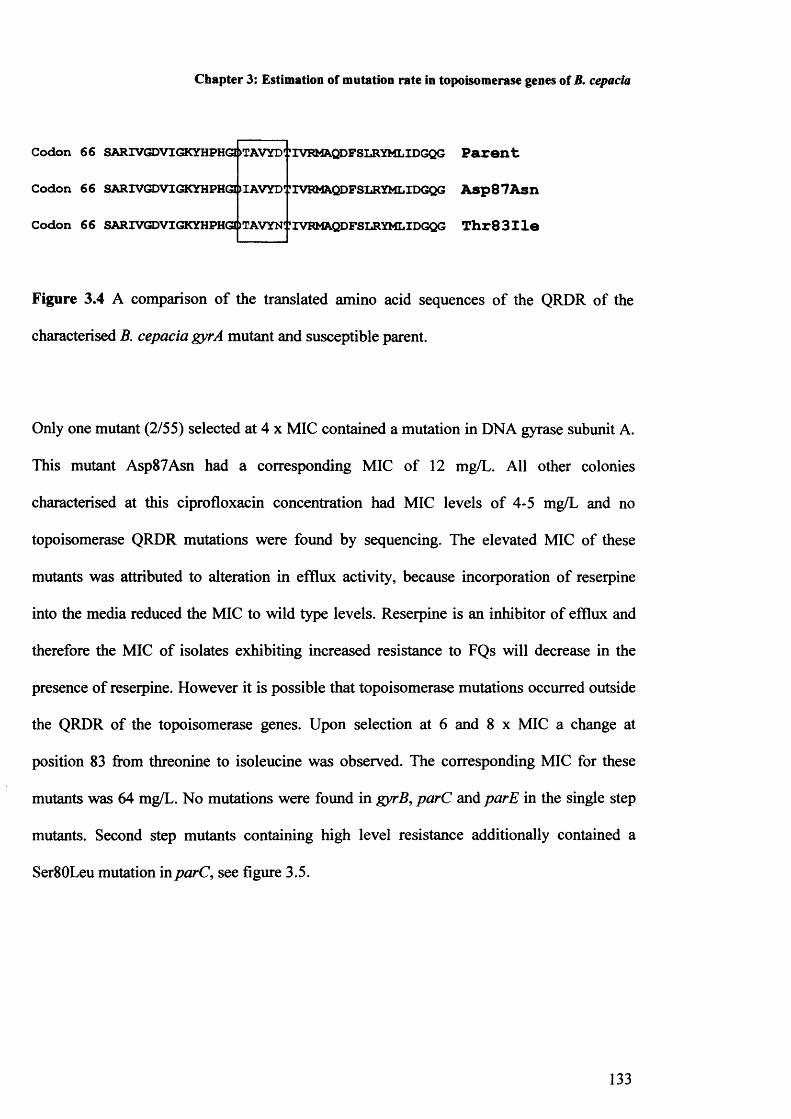
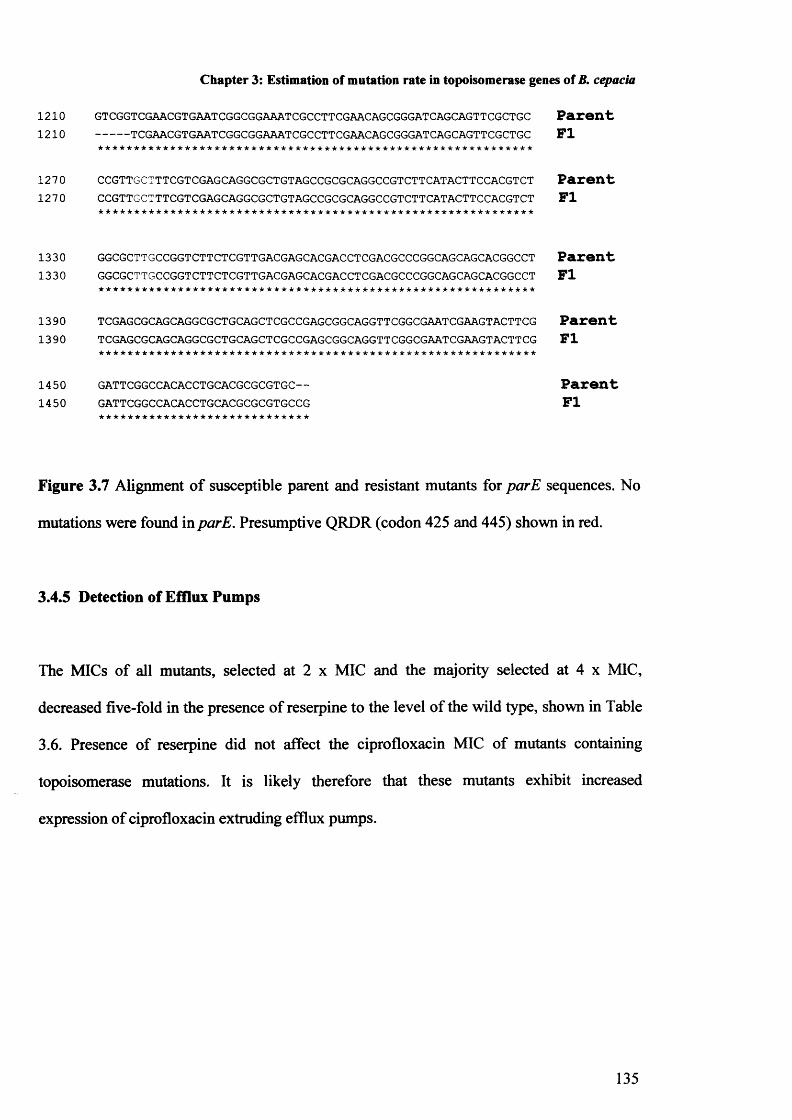
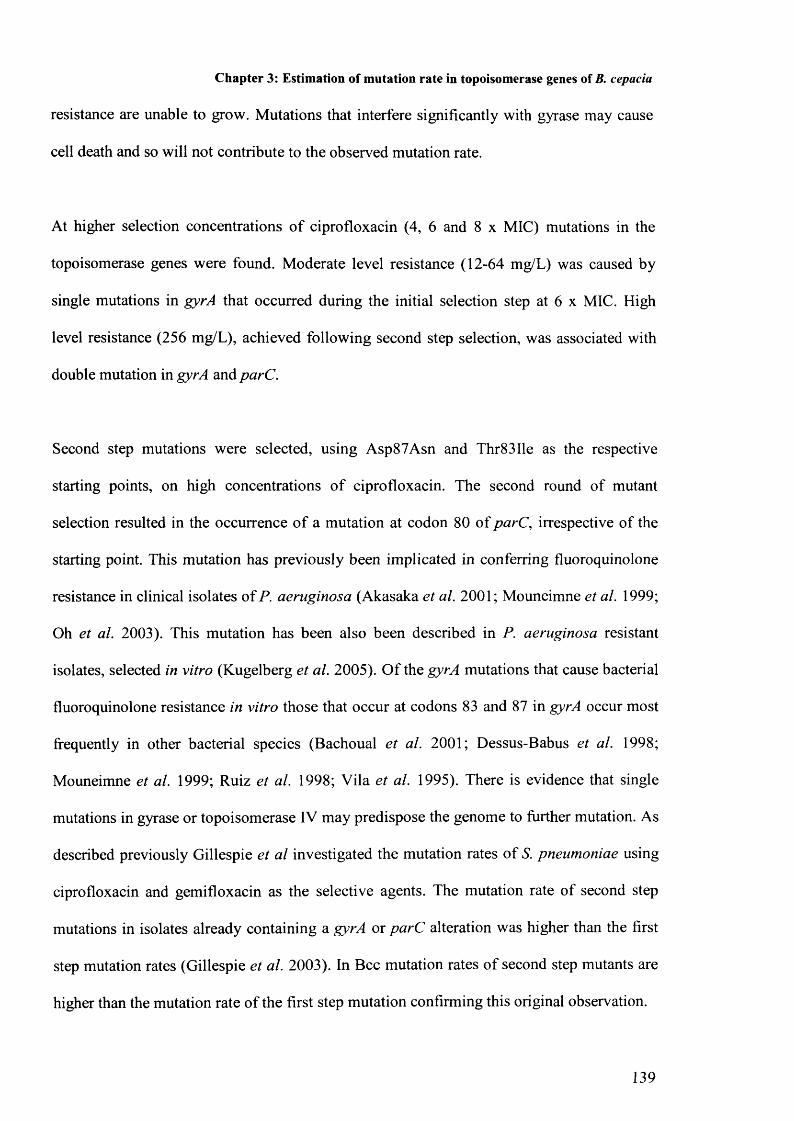
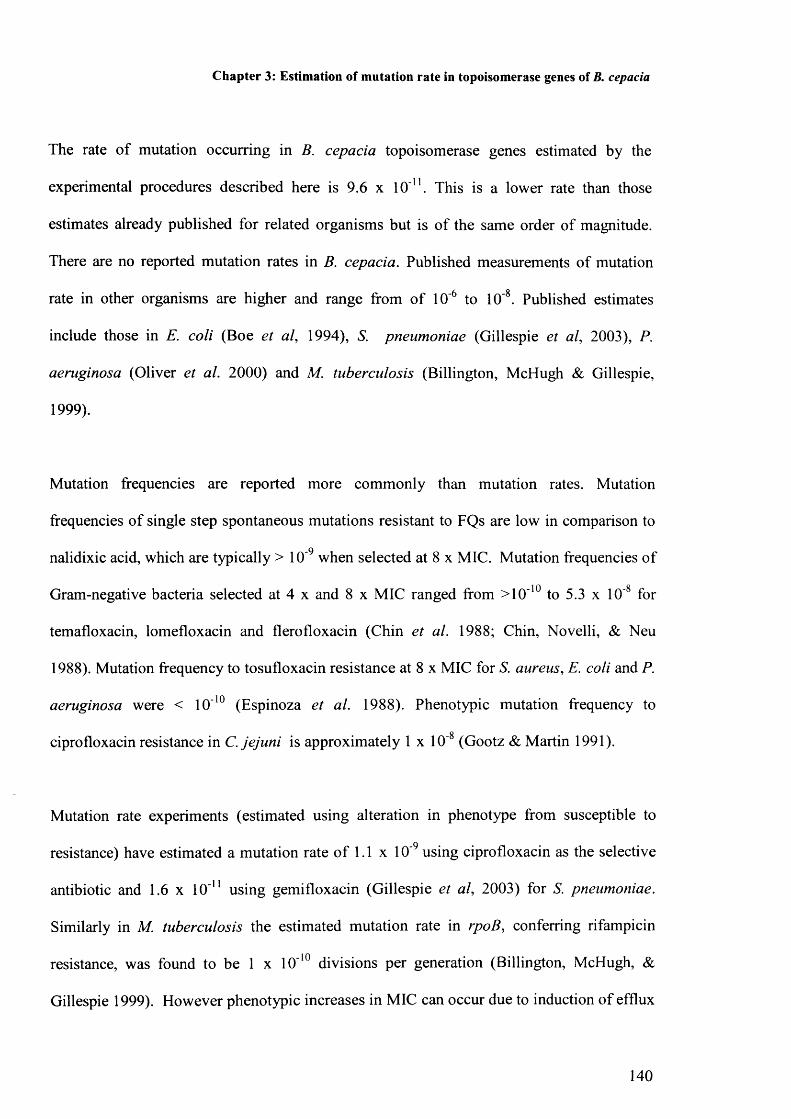
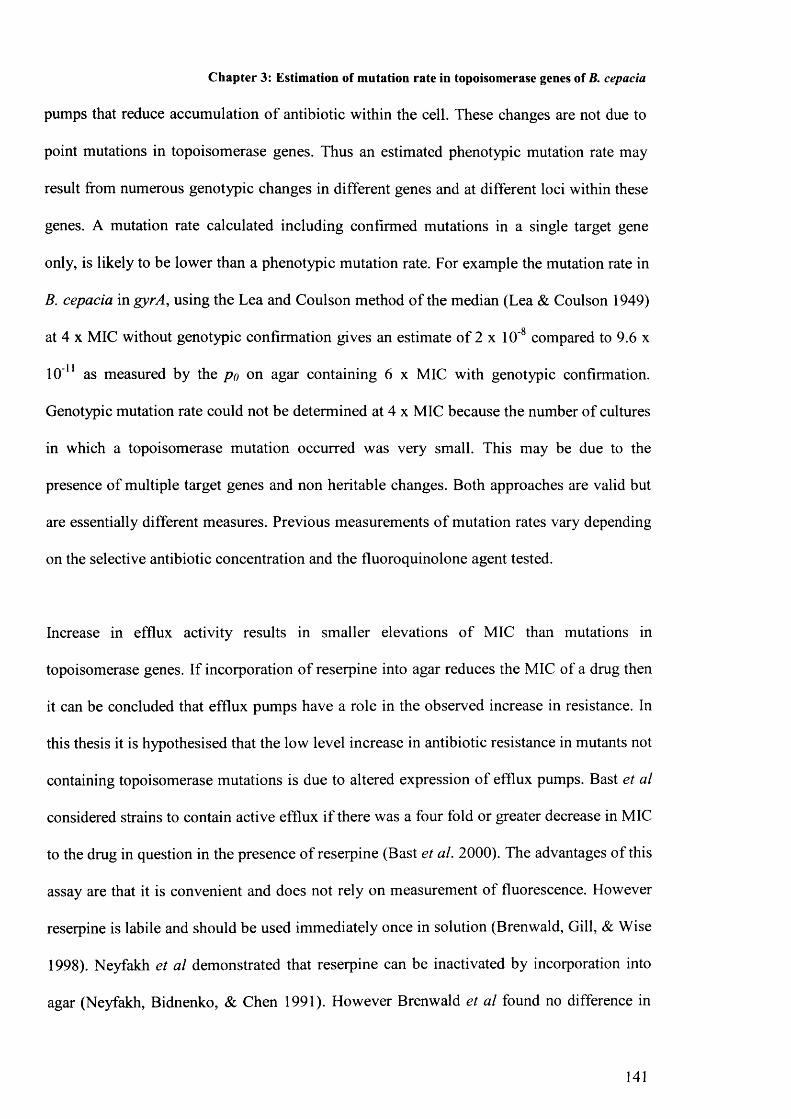
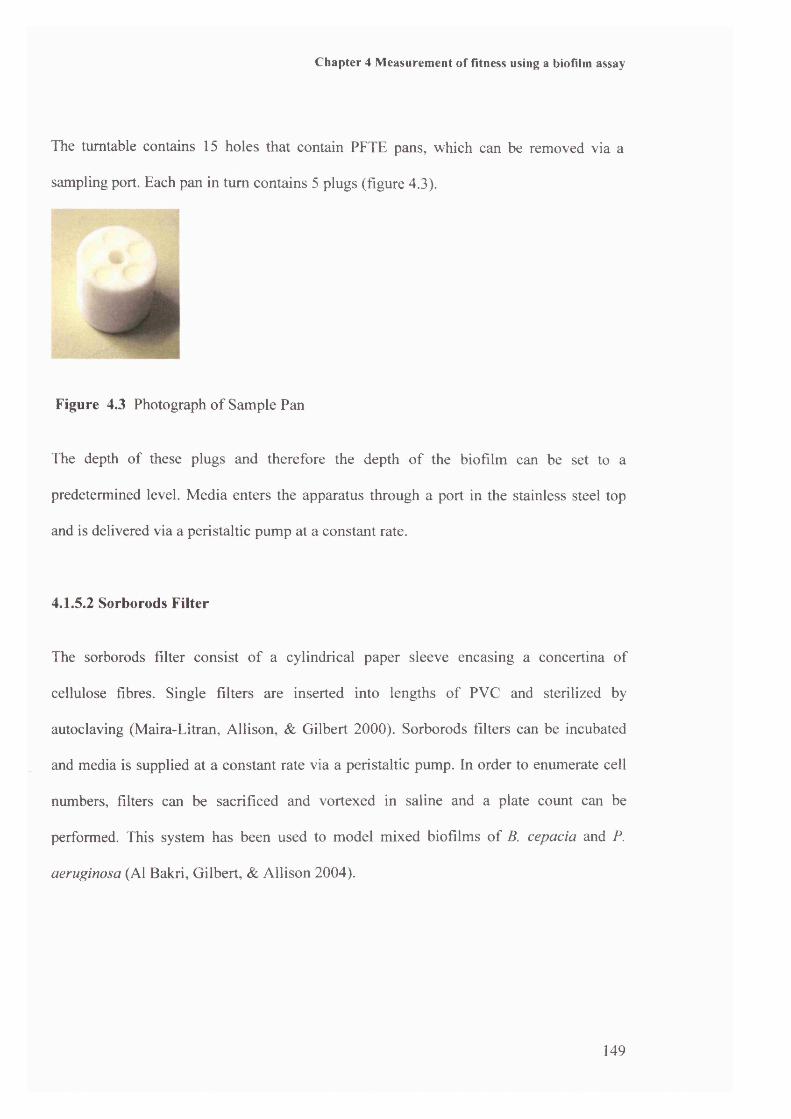
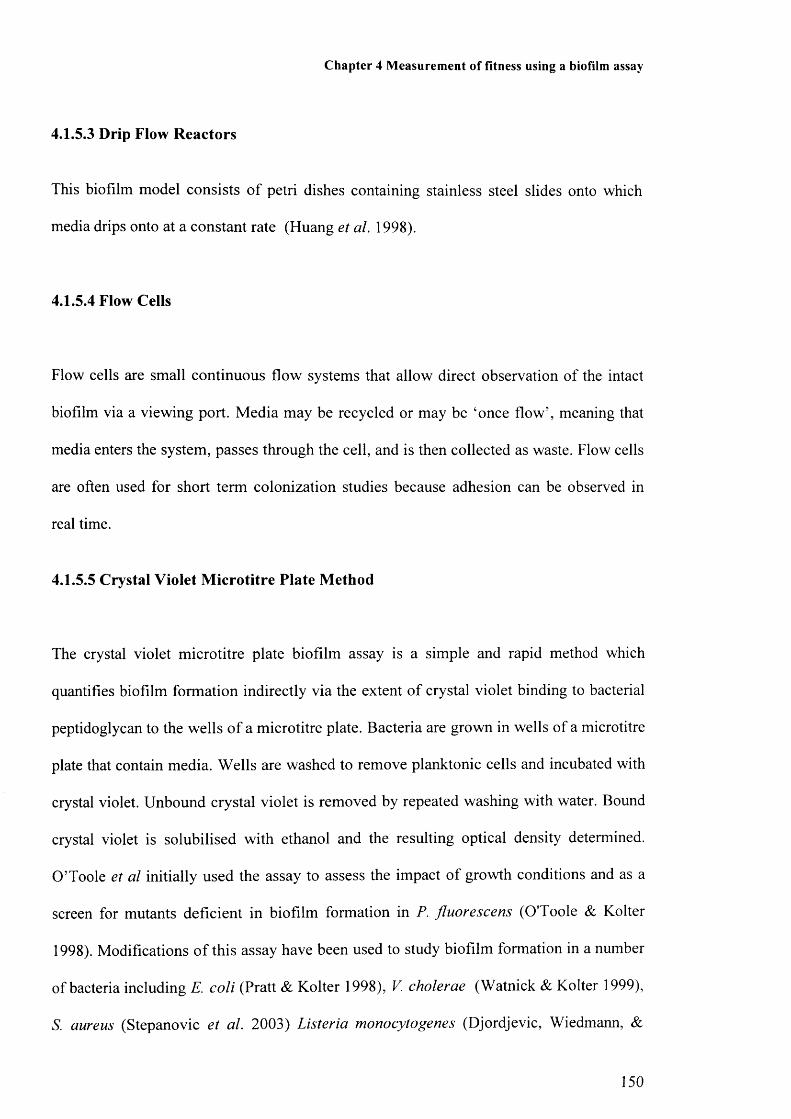
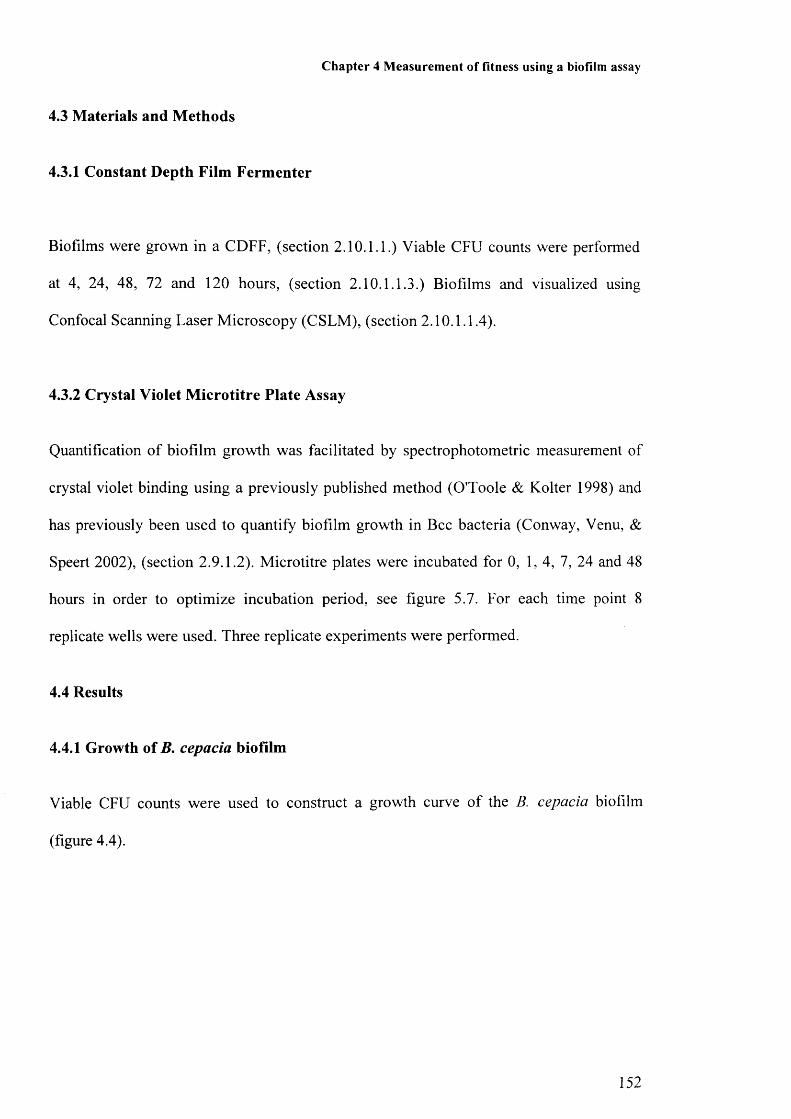
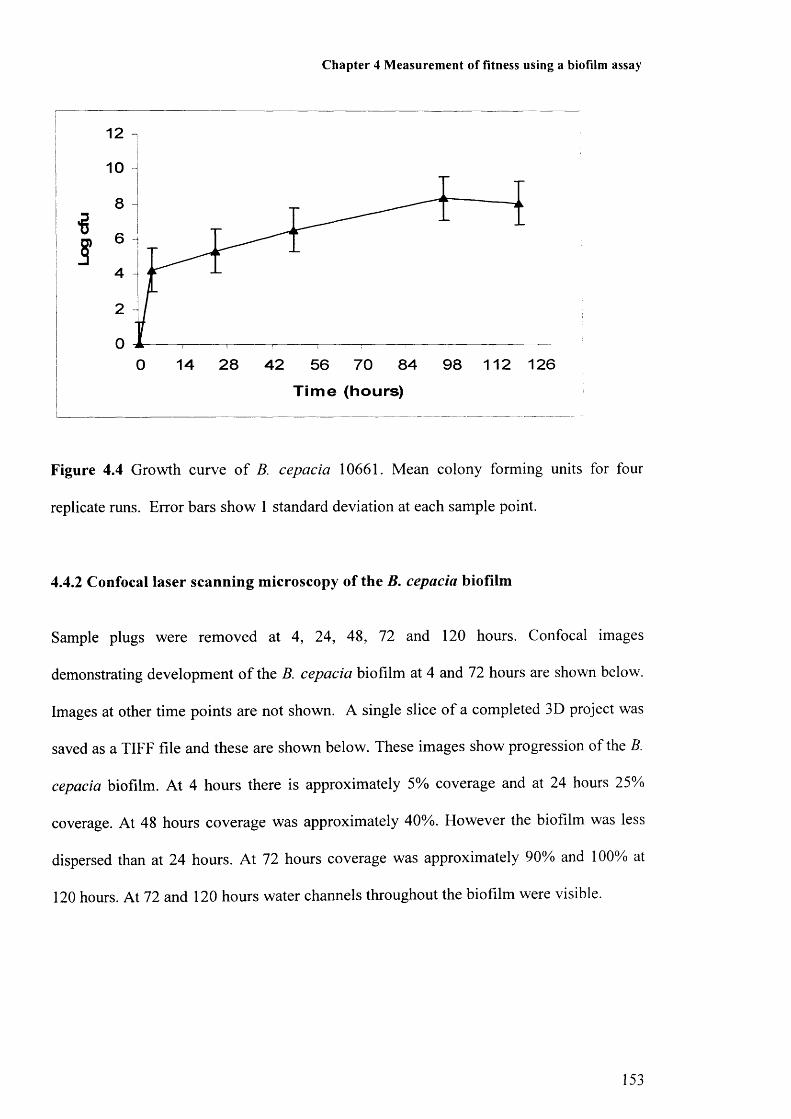
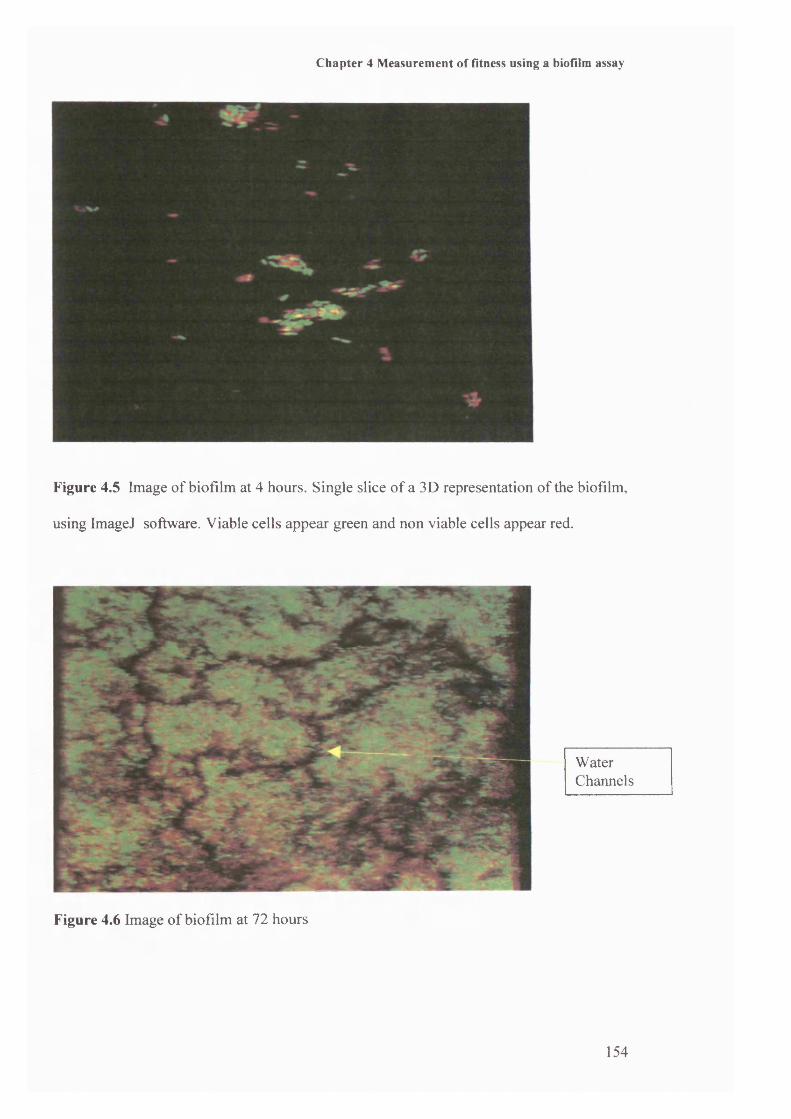
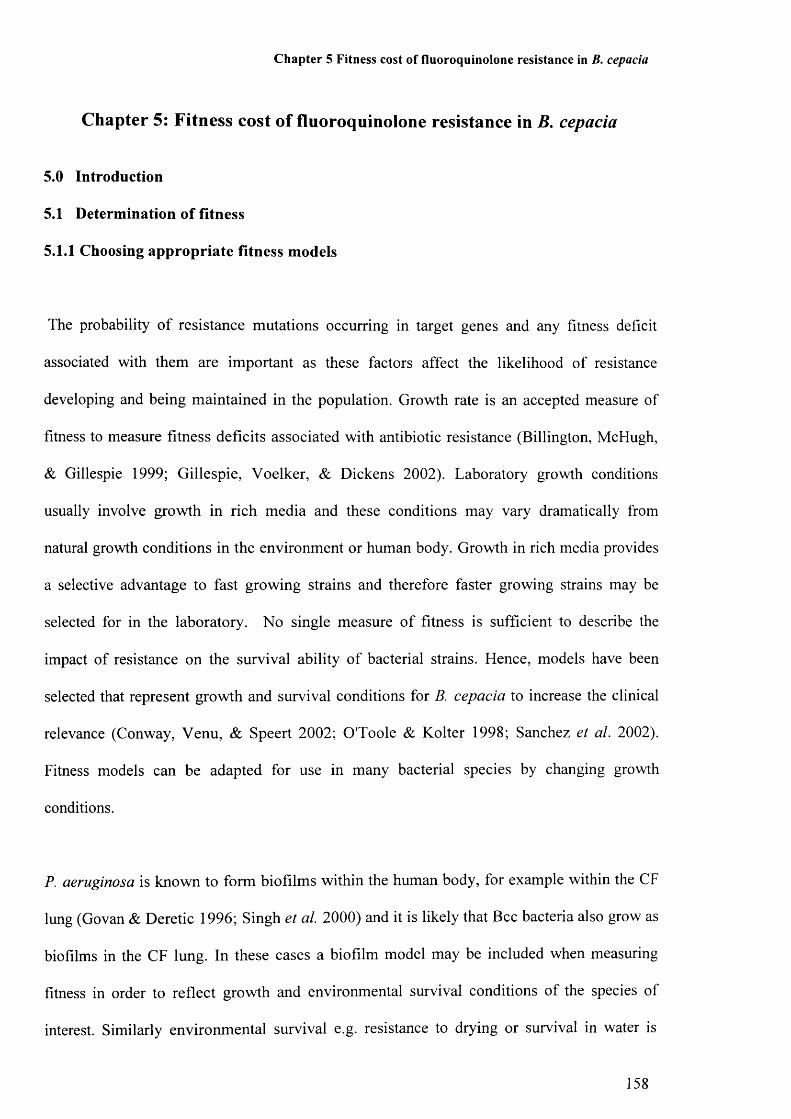
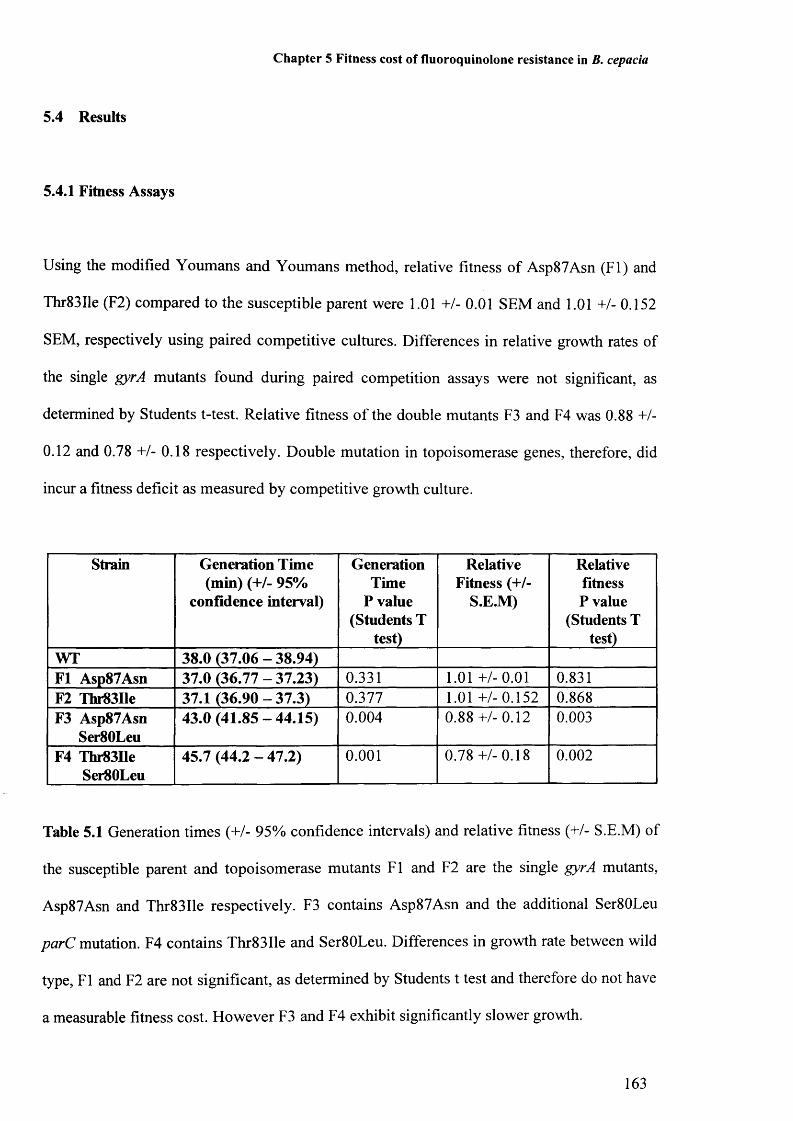
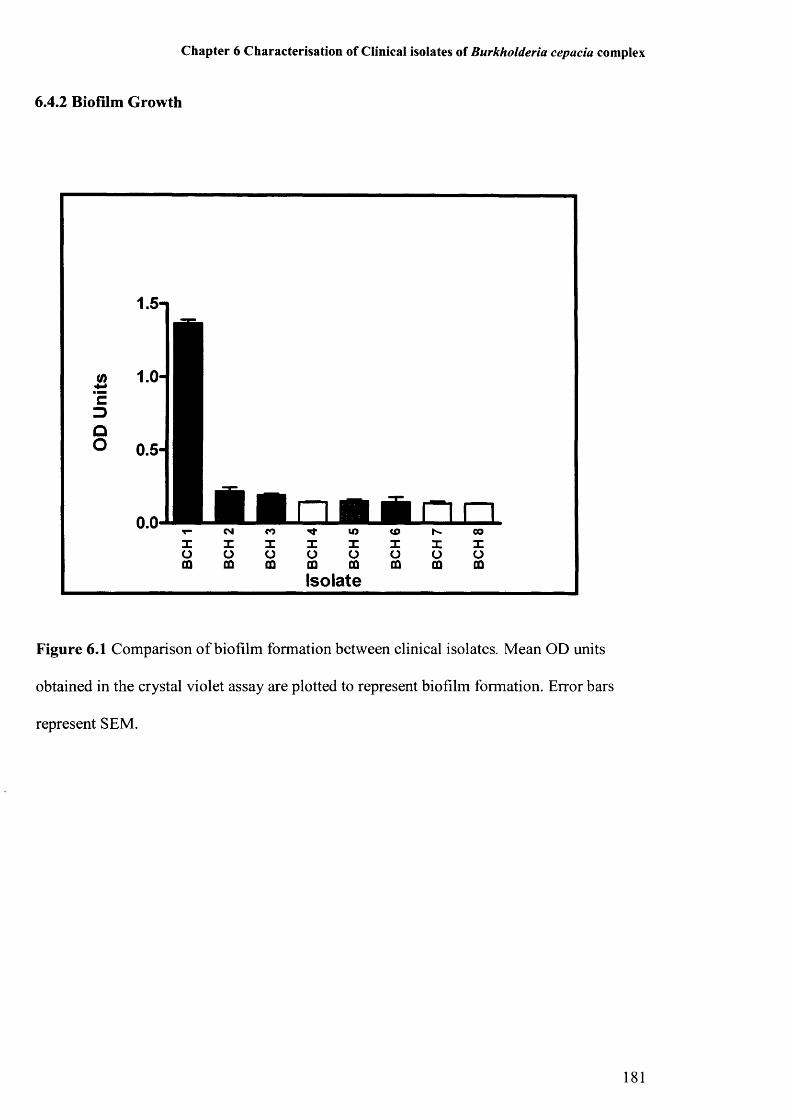
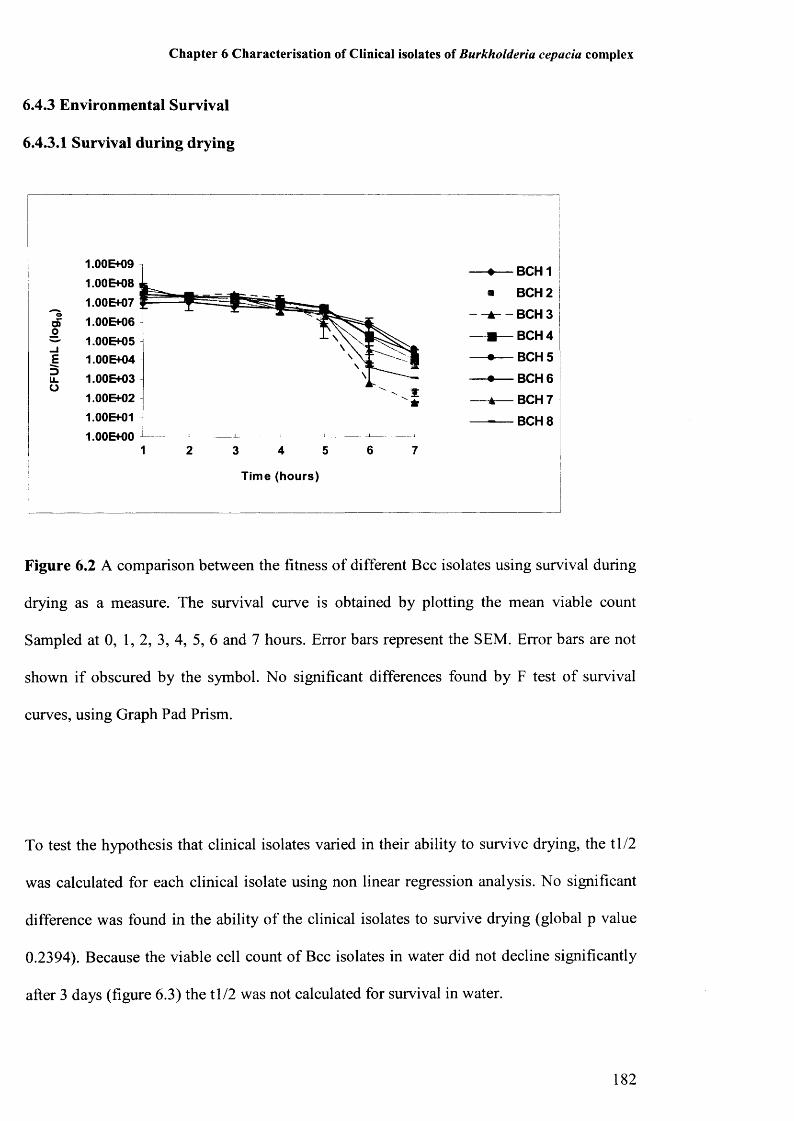
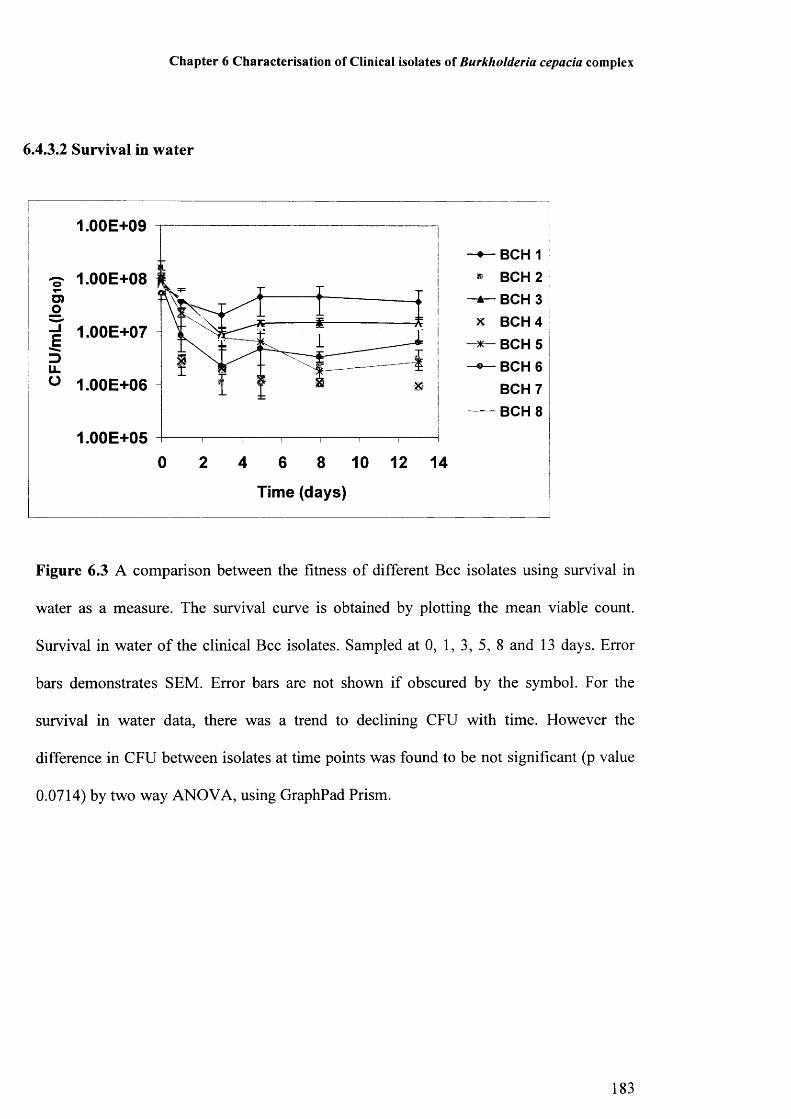
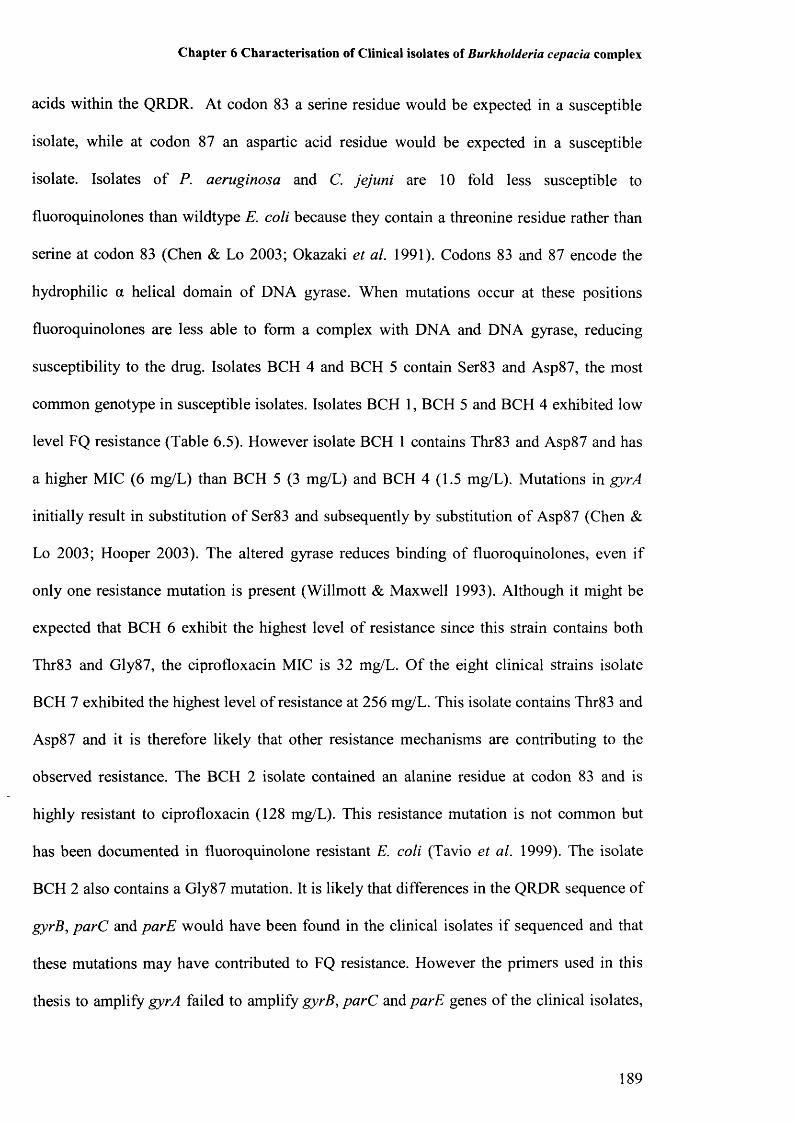
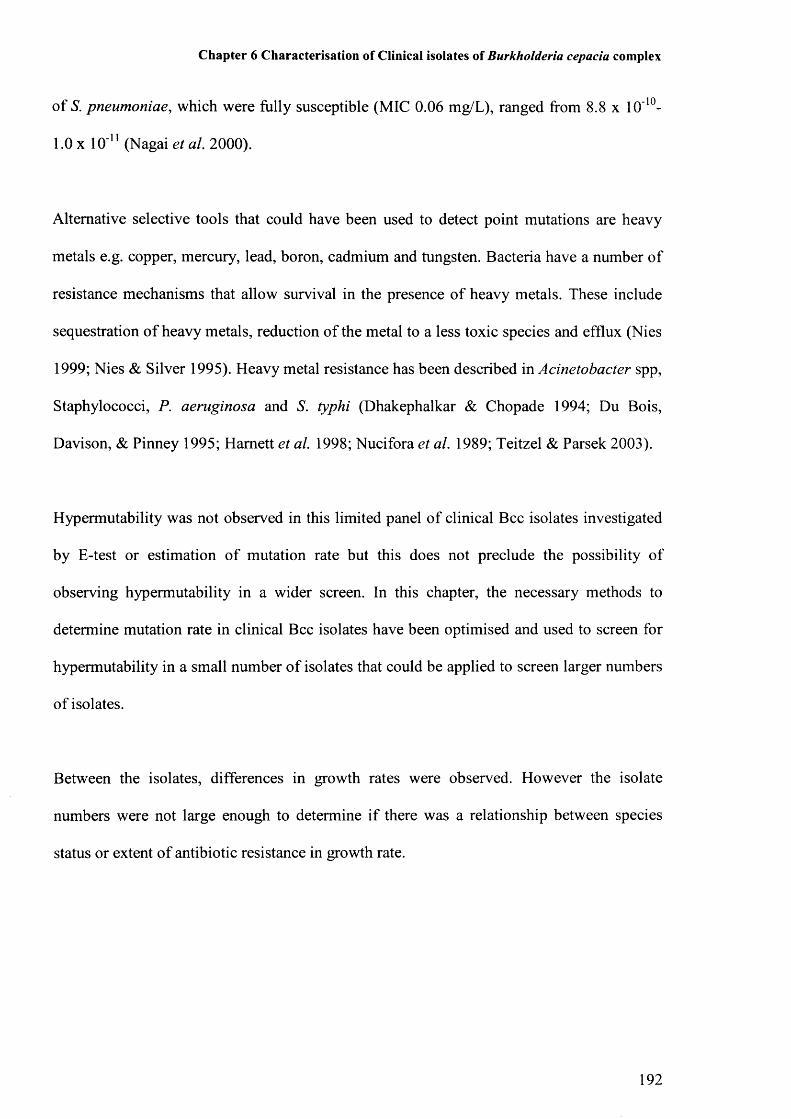
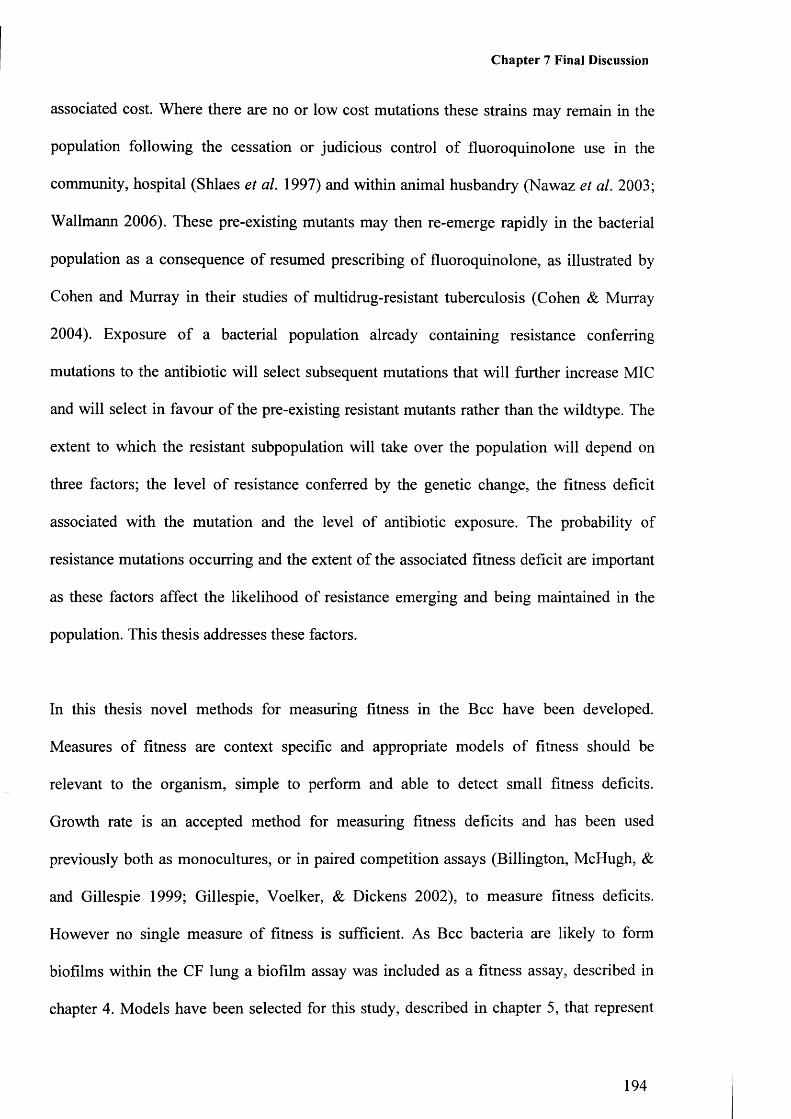
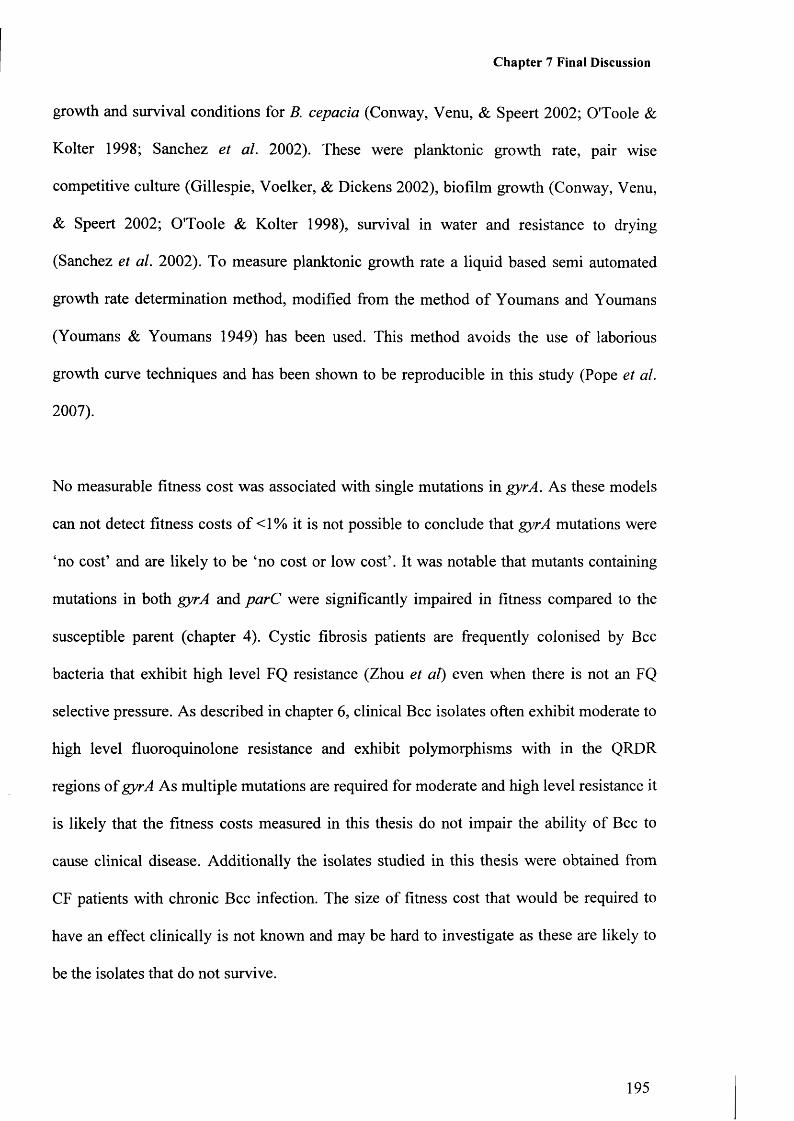
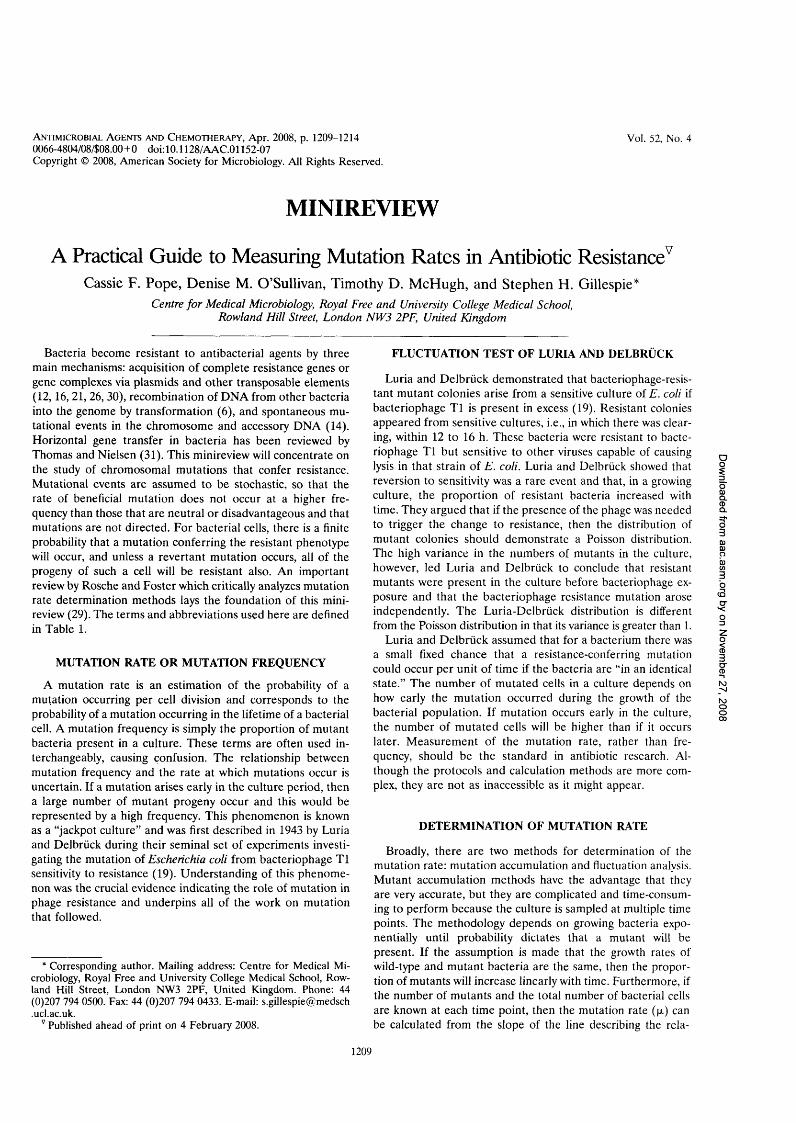
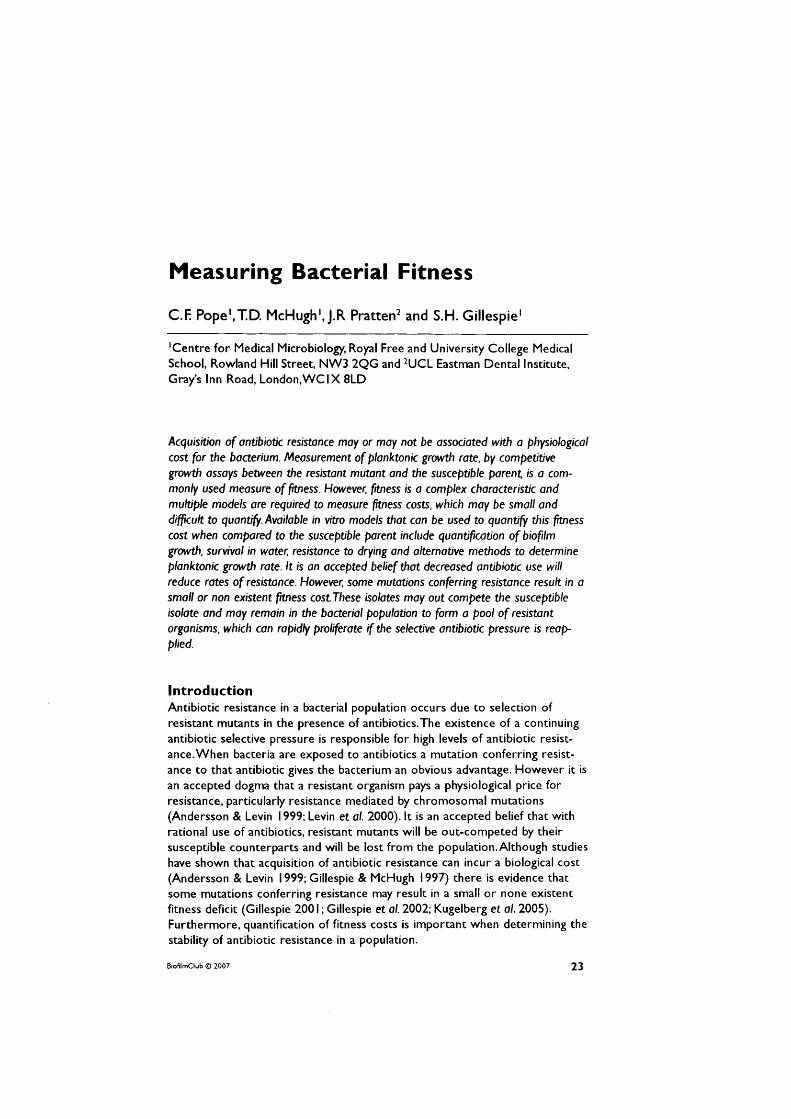
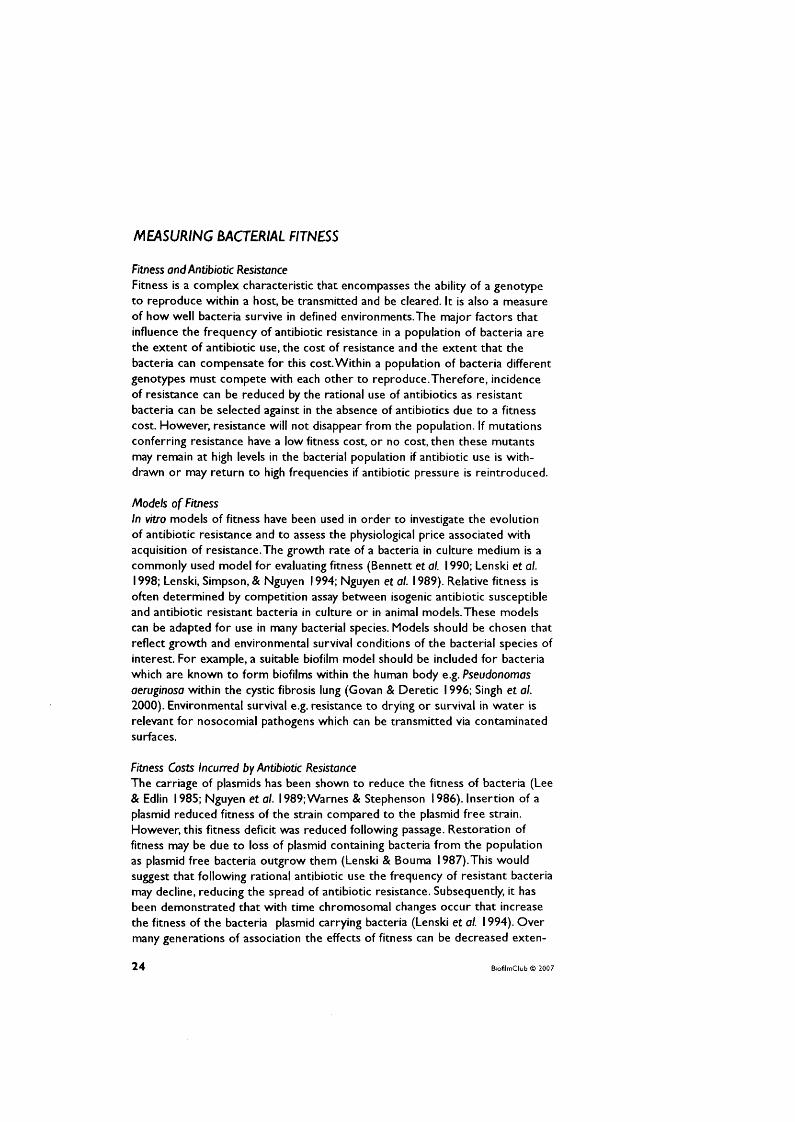
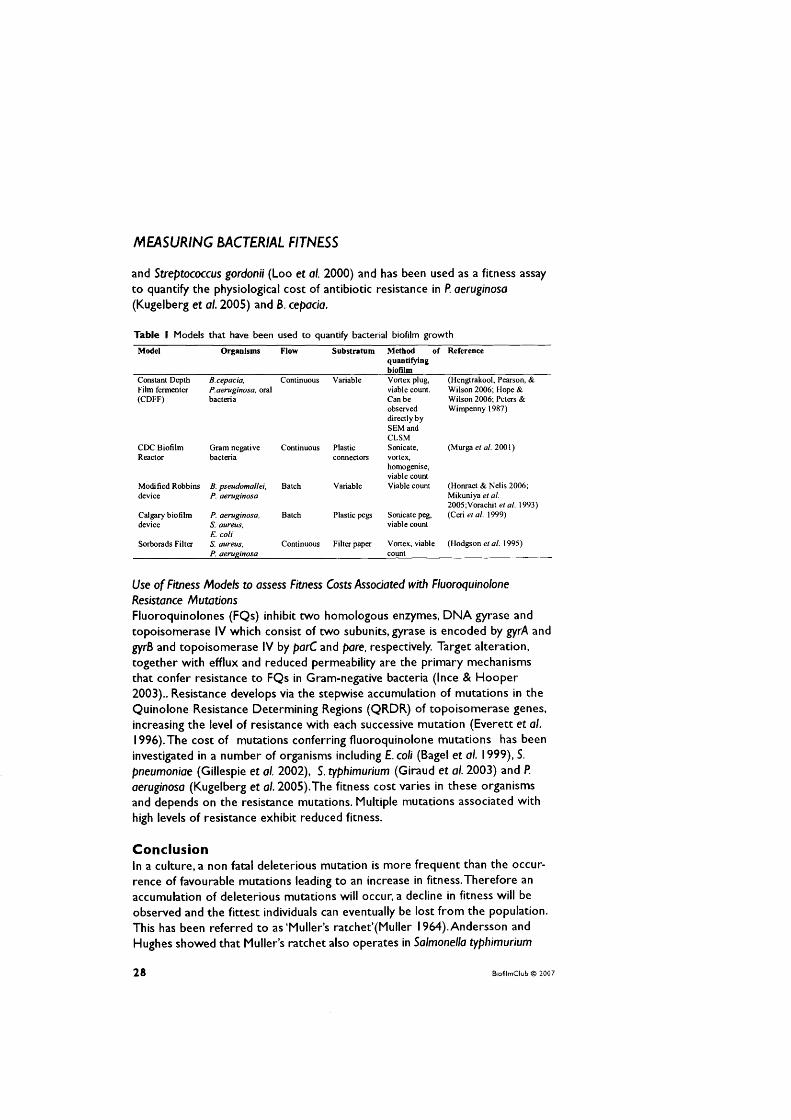
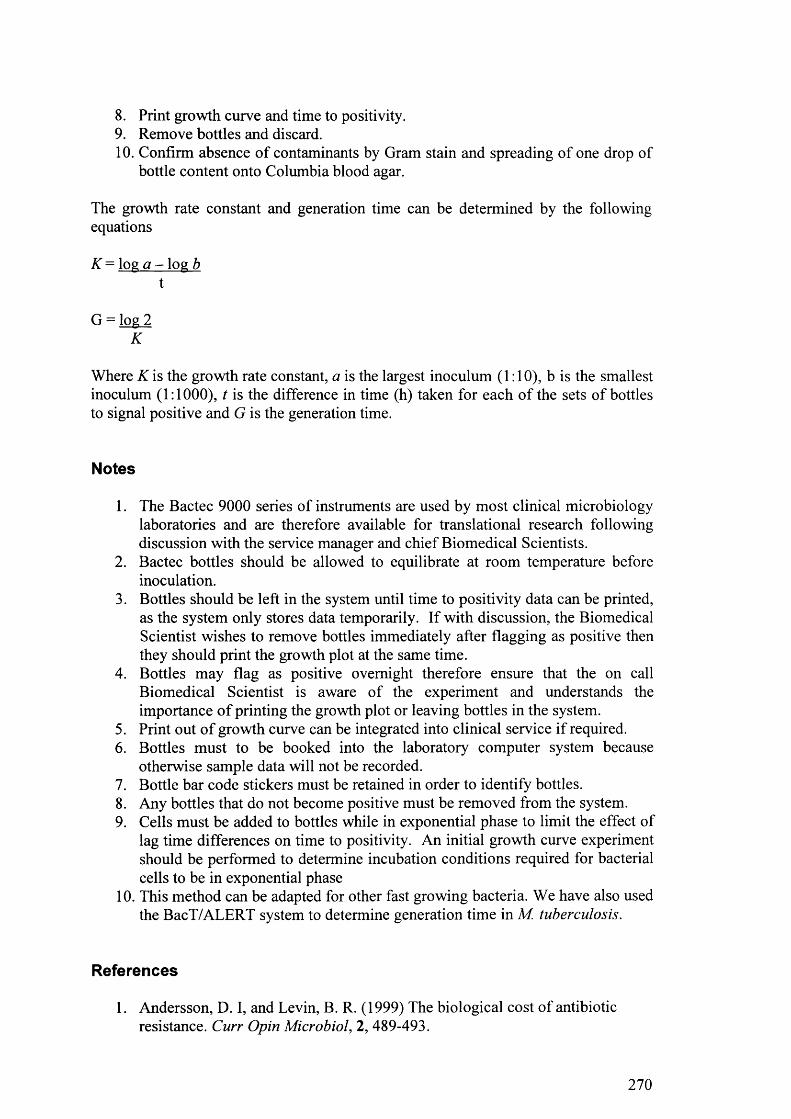
271