25
Evolution of Evolution of Genomes Genomes Evolution of the Evolution of the eukaryotic cell eukaryotic cell Human evolution Human evolution
| Date post: | 02-Jan-2016 |
| Category: |
Documents |
| Upload: | cecil-copeland |
| View: | 225 times |
| Download: | 0 times |
Evolution of GenomesEvolution of Genomes
Evolution of the eukaryotic cellEvolution of the eukaryotic cell
Human evolutionHuman evolution
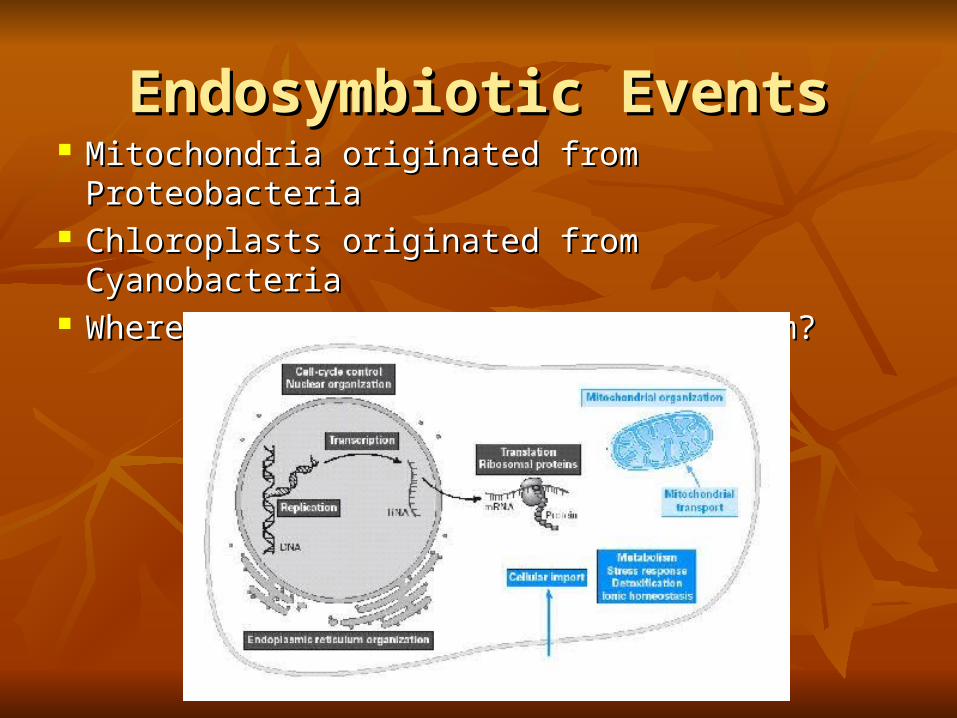
Endosymbiotic EventsEndosymbiotic Events Mitochondria originated from ProteobacteriaMitochondria originated from Proteobacteria Chloroplasts originated from CyanobacteriaChloroplasts originated from Cyanobacteria Where did the nucleus originate from?Where did the nucleus originate from?
Genomic Study of EndosymbiosisGenomic Study of Endosymbiosis Takao Shinozawa’s group in Japan compared Takao Shinozawa’s group in Japan compared
orthologs between yeast an either eubacteria or orthologs between yeast an either eubacteria or archaea.archaea.
E-values are represented as -log E (the larger the # E-values are represented as -log E (the larger the # the better E-value).the better E-value).
The bit scores get larger as the E-values decrease, The bit scores get larger as the E-values decrease, resulting in a lower # of hits (lines have - slope)resulting in a lower # of hits (lines have - slope)
A t-statistic test was performed comparing data from A t-statistic test was performed comparing data from the two domains.the two domains.
A t-stat of > 1.771 indicates Archaeal origin, while a A t-stat of > 1.771 indicates Archaeal origin, while a value of < -1.771 indicates Eubacteria.value of < -1.771 indicates Eubacteria.
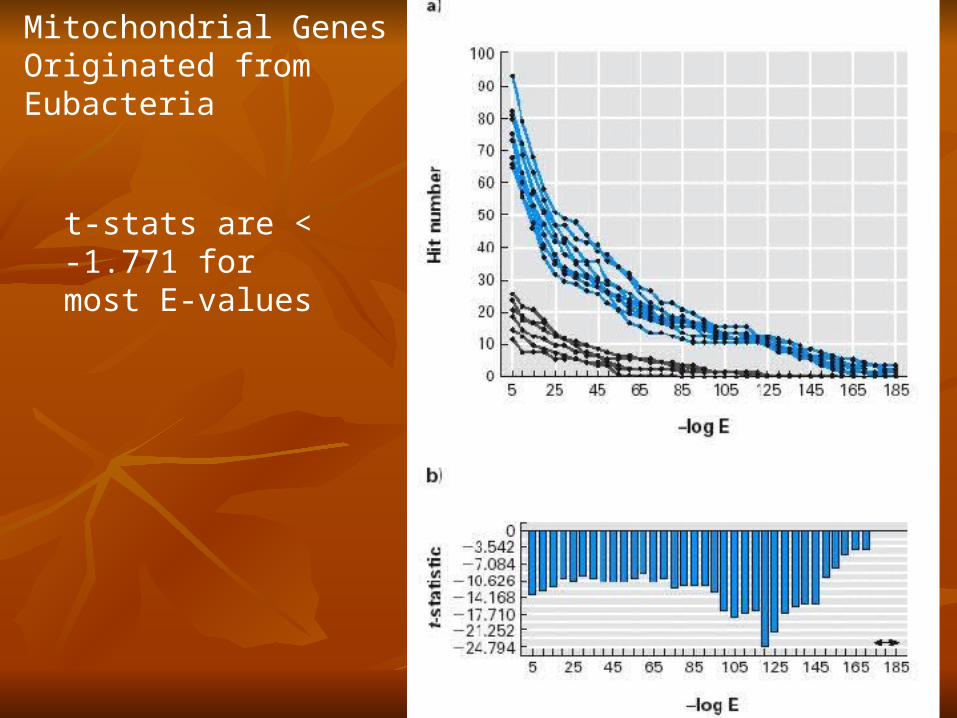
Mitochondrial Genes Originated from Eubacteria
t-stats are < -1.771 for most E-values
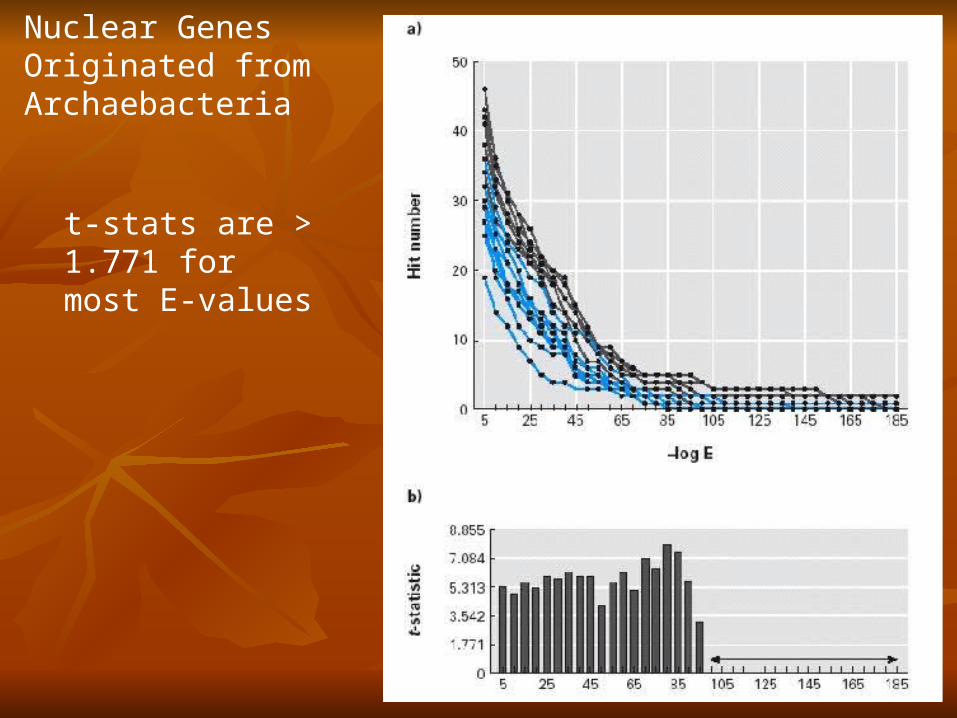
Nuclear Genes Originated from Archaebacteria
t-stats are > 1.771 for most E-values
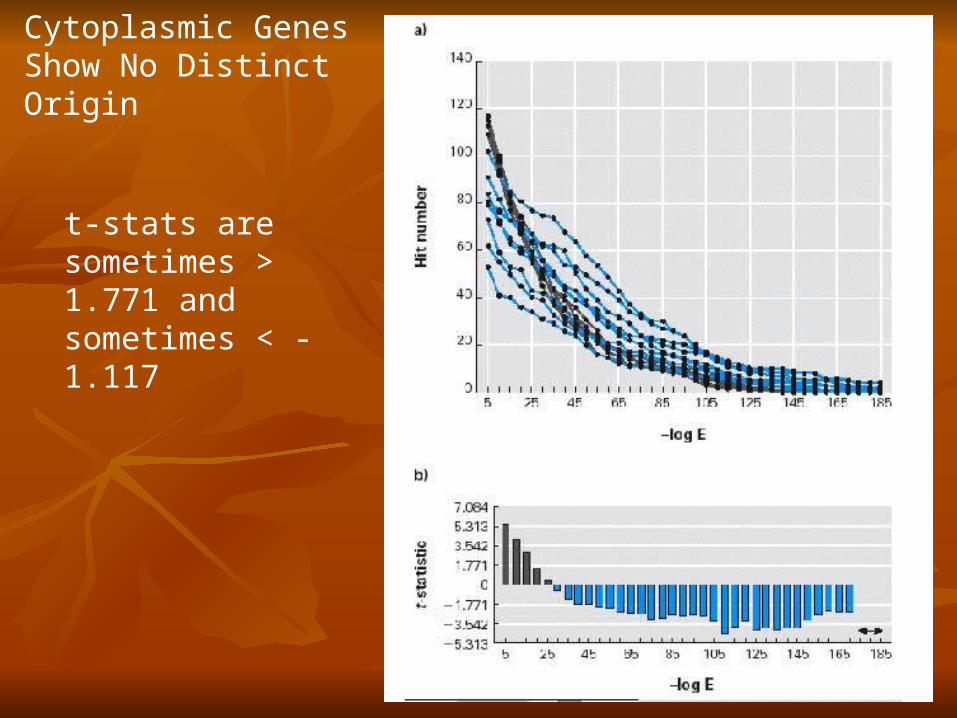
Cytoplasmic Genes Show No Distinct Origin
t-stats are sometimes > 1.771 and sometimes < -1.117
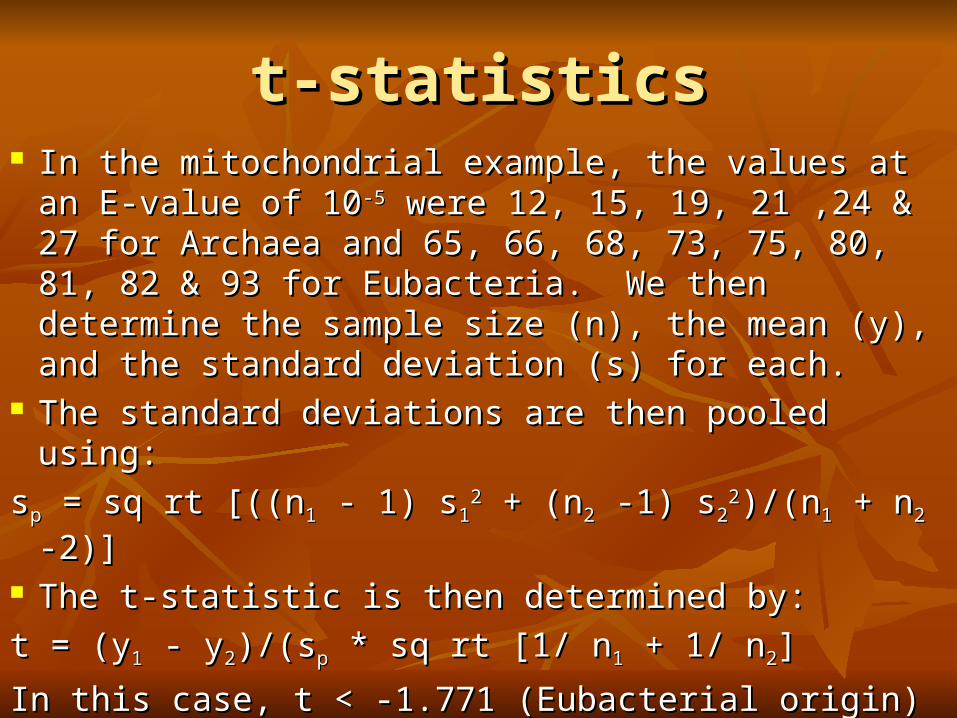
t-statisticst-statistics In the mitochondrial example, the values at an E-In the mitochondrial example, the values at an E-
value of 10value of 10-5-5 were 12, 15, 19, 21 ,24 & 27 for were 12, 15, 19, 21 ,24 & 27 for Archaea and 65, 66, 68, 73, 75, 80, 81, 82 & 93 for Archaea and 65, 66, 68, 73, 75, 80, 81, 82 & 93 for Eubacteria. We then determine the sample size (n), Eubacteria. We then determine the sample size (n), the mean (y), and the standard deviation (s) for the mean (y), and the standard deviation (s) for each.each.
The standard deviations are then pooled using:The standard deviations are then pooled using:
sspp = sq rt [((n = sq rt [((n11 - 1) s - 1) s1122 + (n + (n22 -1) s -1) s22
22)/(n)/(n11 + n + n22 -2)] -2)] The t-statistic is then determined by:The t-statistic is then determined by:
t = (yt = (y11 - y - y22)/(s)/(spp * sq rt [1/ n * sq rt [1/ n11 + 1/ n + 1/ n22]]
In this case, t < -1.771 (Eubacterial origin)In this case, t < -1.771 (Eubacterial origin)
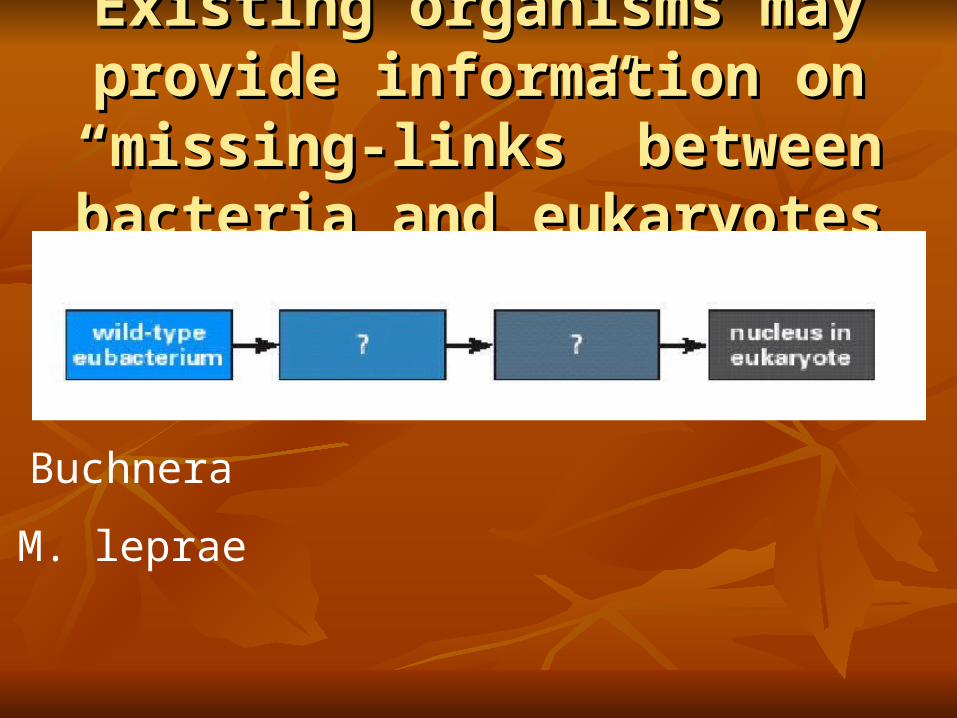
Existing organisms may provide Existing organisms may provide information on “missing-links” information on “missing-links”
between bacteria and eukaryotesbetween bacteria and eukaryotes
Buchnera
M. leprae
BuchneraBuchnera
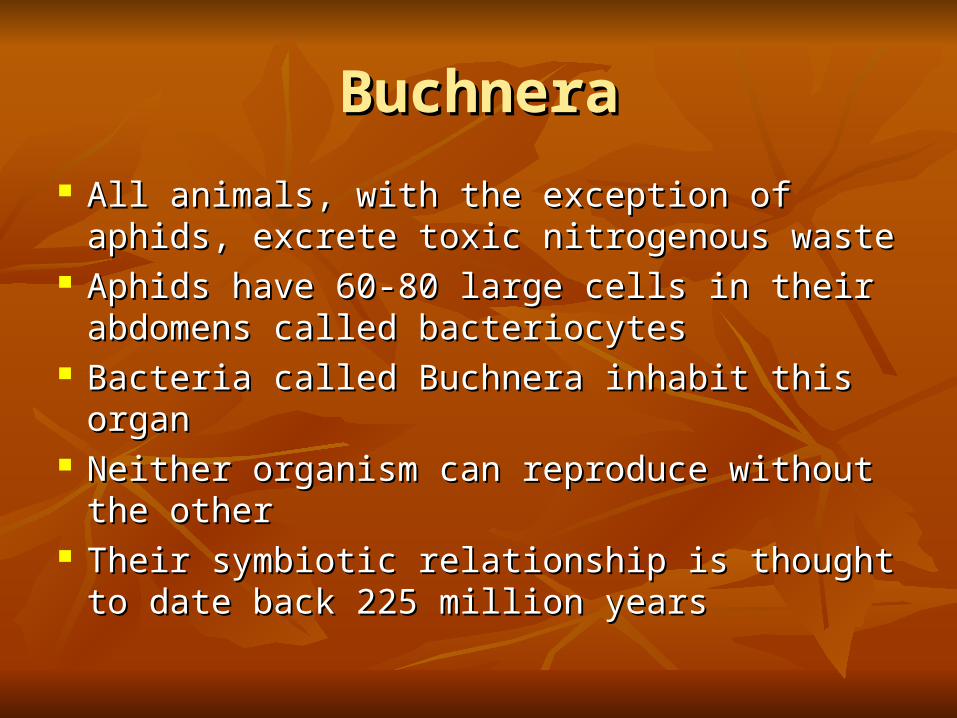
All animals, with the exception of aphids, All animals, with the exception of aphids, excrete toxic nitrogenous wasteexcrete toxic nitrogenous waste
Aphids have 60-80 large cells in their Aphids have 60-80 large cells in their abdomens called bacteriocytesabdomens called bacteriocytes
Bacteria called Buchnera inhabit this organBacteria called Buchnera inhabit this organ Neither organism can reproduce without the Neither organism can reproduce without the
otherother Their symbiotic relationship is thought to date Their symbiotic relationship is thought to date
back 225 million yearsback 225 million years

The Buchnera GenomeThe Buchnera Genome
At 640,681 bp, it is the 2nd smallest sequencedAt 640,681 bp, it is the 2nd smallest sequenced Contains 583 genesContains 583 genes 500 are very similar to E. coli, 79 are related to 500 are very similar to E. coli, 79 are related to
other bacterial, only 4 are unique to Buchneraother bacterial, only 4 are unique to Buchnera Many genes which are non-essential to the Many genes which are non-essential to the
symbiotic relationship have been lost over timesymbiotic relationship have been lost over time Buchnera can only synthesize amino acids Buchnera can only synthesize amino acids
which aphids are unable to producewhich aphids are unable to produce
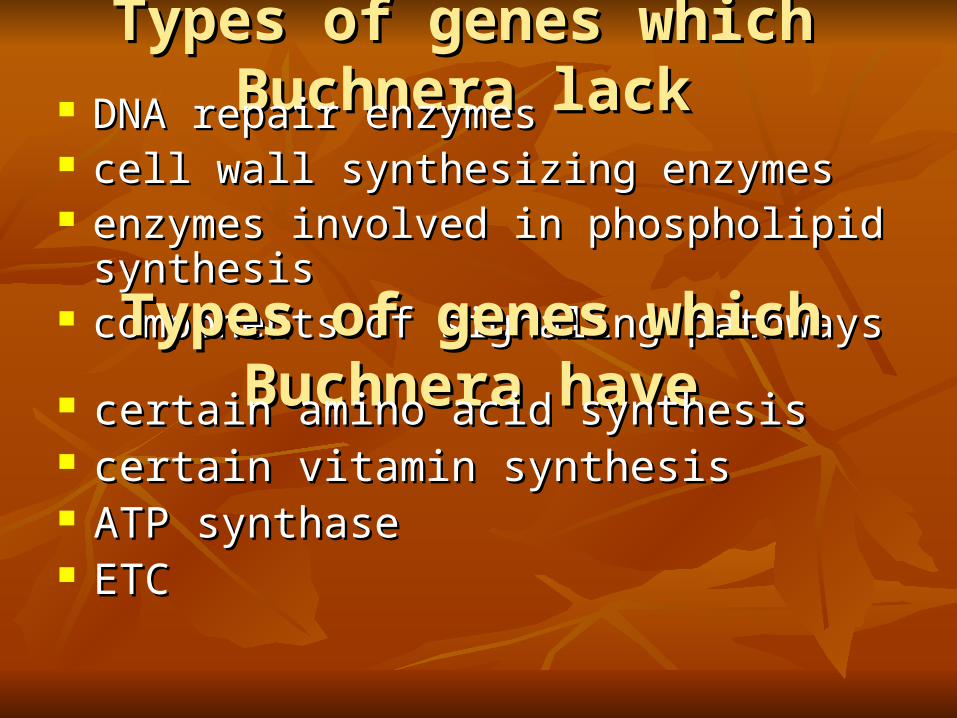
Types of genes which Buchnera lackTypes of genes which Buchnera lack DNA repair enzymesDNA repair enzymes cell wall synthesizing enzymescell wall synthesizing enzymes enzymes involved in phospholipid synthesisenzymes involved in phospholipid synthesis components of signaling pathwayscomponents of signaling pathways
Types of genes which Buchnera haveTypes of genes which Buchnera have certain amino acid synthesiscertain amino acid synthesis certain vitamin synthesiscertain vitamin synthesis ATP synthaseATP synthase ETCETC
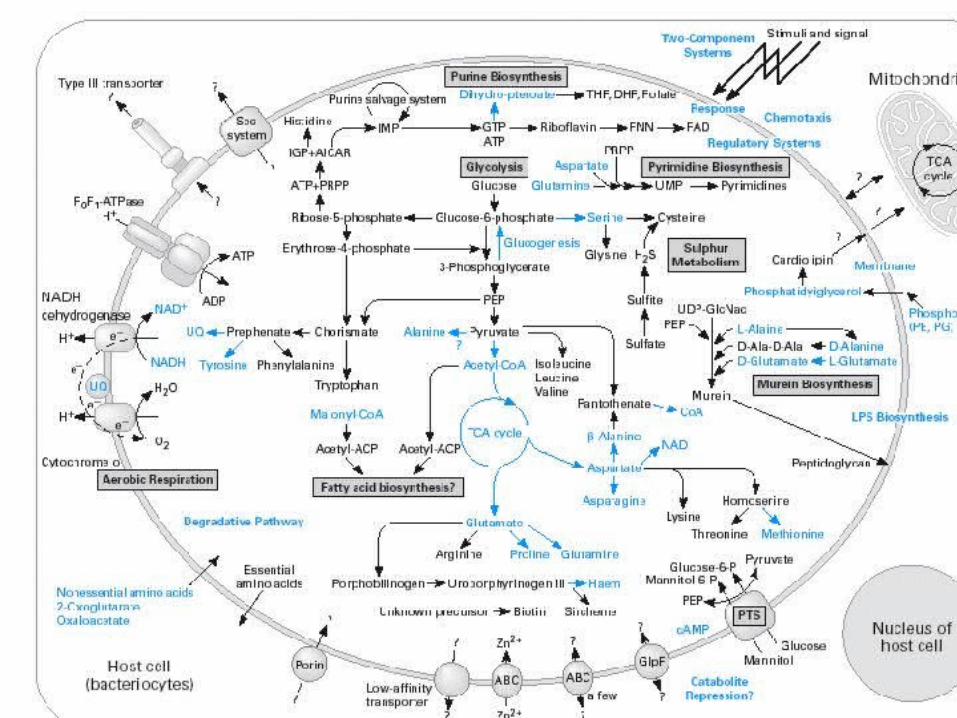
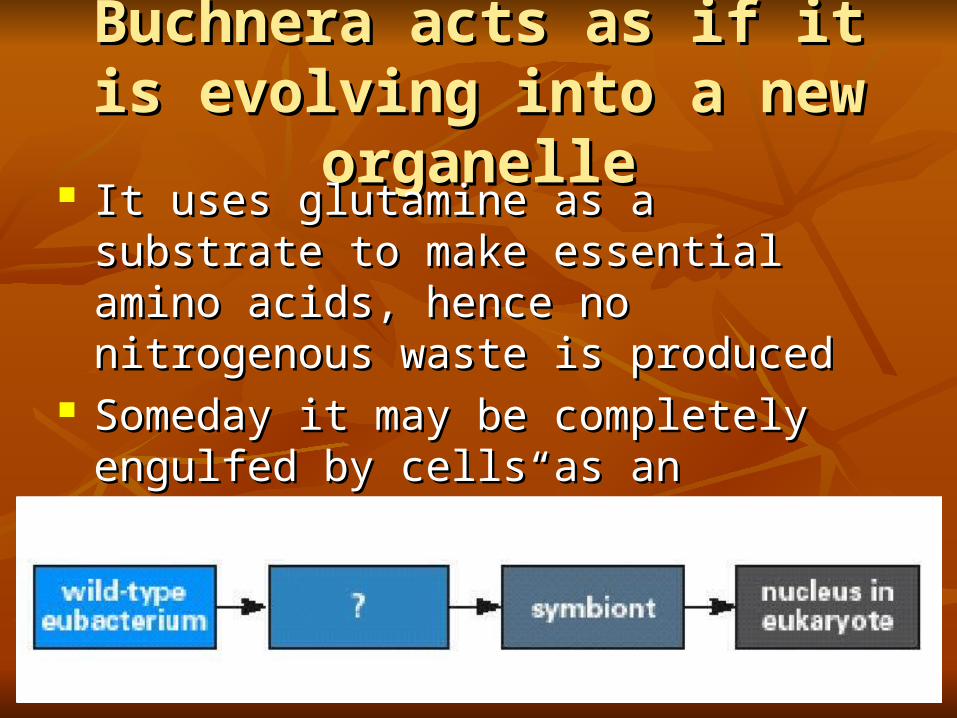
Buchnera acts as if it is evolving Buchnera acts as if it is evolving into a new organelleinto a new organelle
It uses glutamine as a substrate to make It uses glutamine as a substrate to make essential amino acids, hence no nitrogenous essential amino acids, hence no nitrogenous waste is producedwaste is produced
Someday it may be completely engulfed by Someday it may be completely engulfed by cells as an “aminoacid-plast”cells as an “aminoacid-plast”
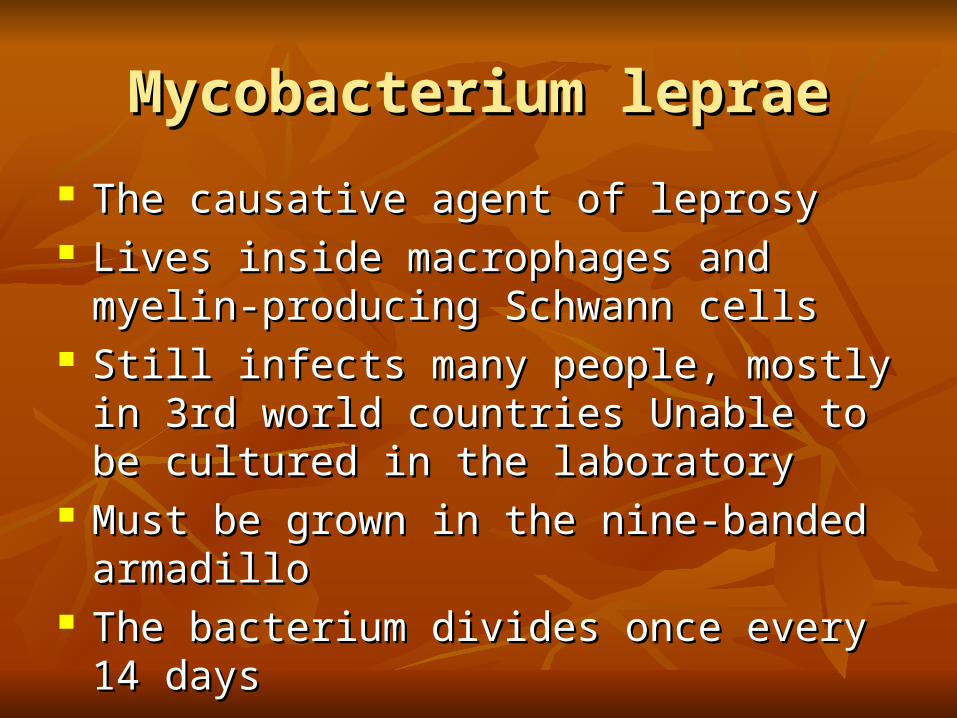
Mycobacterium lepraeMycobacterium leprae
The causative agent of leprosyThe causative agent of leprosy Lives inside macrophages and myelin-Lives inside macrophages and myelin-
producing Schwann cellsproducing Schwann cells Still infects many people, mostly in 3rd world Still infects many people, mostly in 3rd world
countries Unable to be cultured in the countries Unable to be cultured in the laboratorylaboratory
Must be grown in the nine-banded armadilloMust be grown in the nine-banded armadillo The bacterium divides once every 14 daysThe bacterium divides once every 14 days
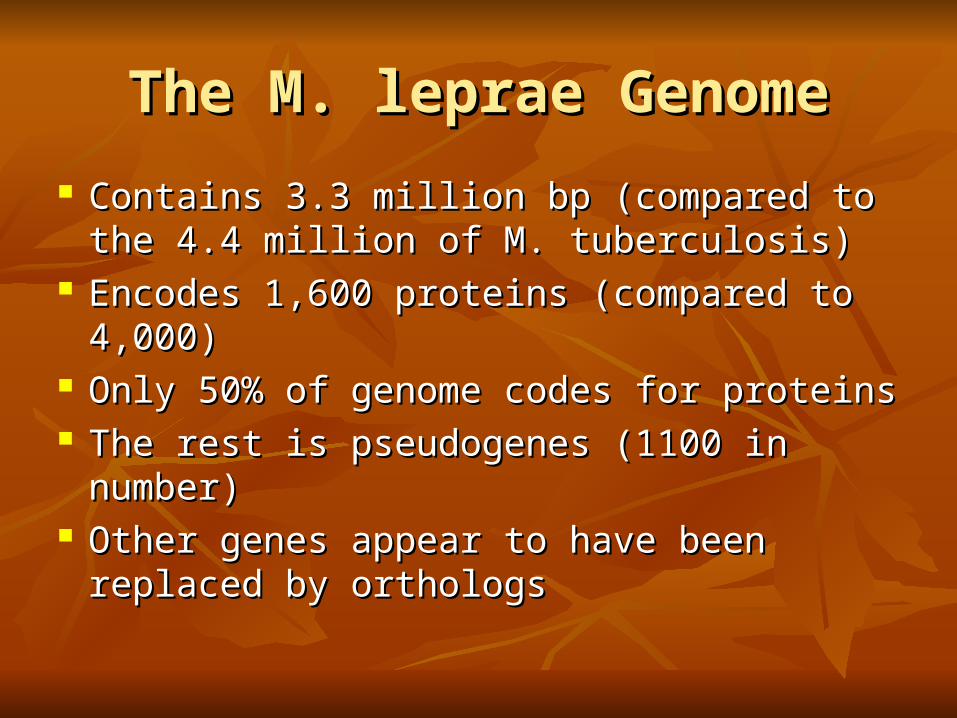
The M. leprae GenomeThe M. leprae Genome
Contains 3.3 million bp (compared to the 4.4 Contains 3.3 million bp (compared to the 4.4 million of M. tuberculosis)million of M. tuberculosis)
Encodes 1,600 proteins (compared to 4,000)Encodes 1,600 proteins (compared to 4,000) Only 50% of genome codes for proteinsOnly 50% of genome codes for proteins The rest is pseudogenes (1100 in number)The rest is pseudogenes (1100 in number) Other genes appear to have been replaced by Other genes appear to have been replaced by
orthologsorthologs
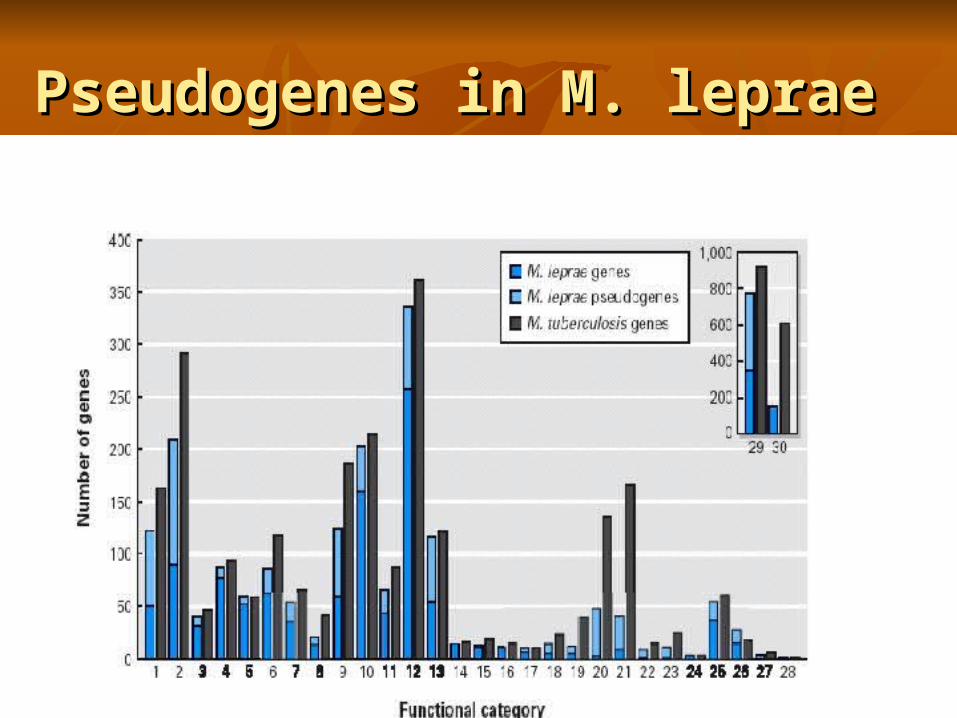
Pseudogenes in M. lepraePseudogenes in M. leprae
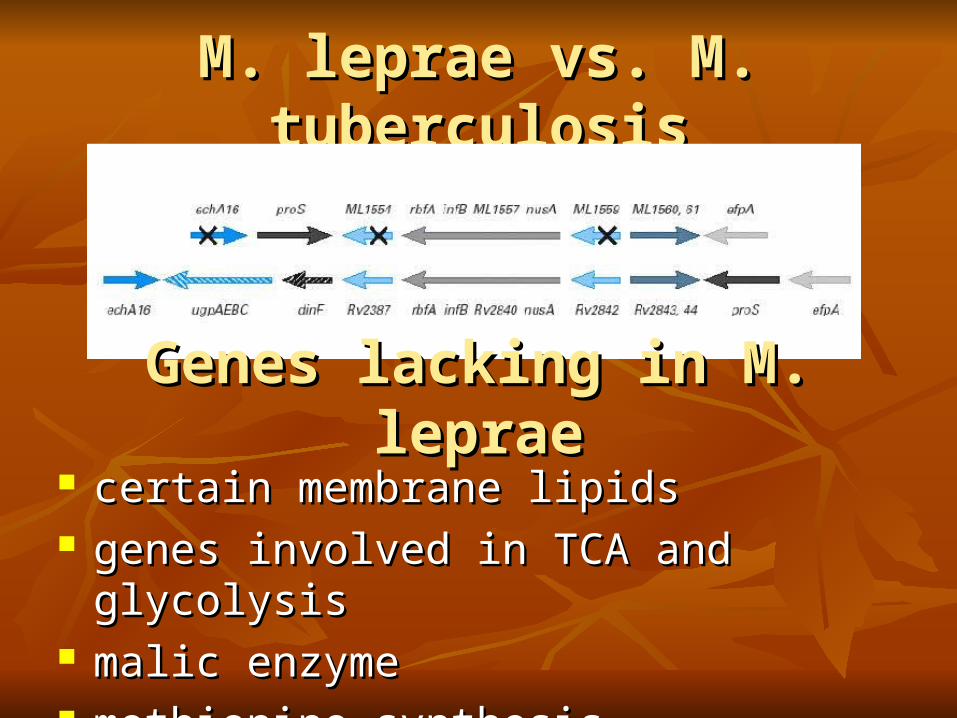
M. leprae vs. M. tuberculosisM. leprae vs. M. tuberculosis
certain membrane lipidscertain membrane lipids genes involved in TCA and glycolysisgenes involved in TCA and glycolysis malic enzymemalic enzyme methionine synthesismethionine synthesis
Genes lacking in M. lepraeGenes lacking in M. leprae
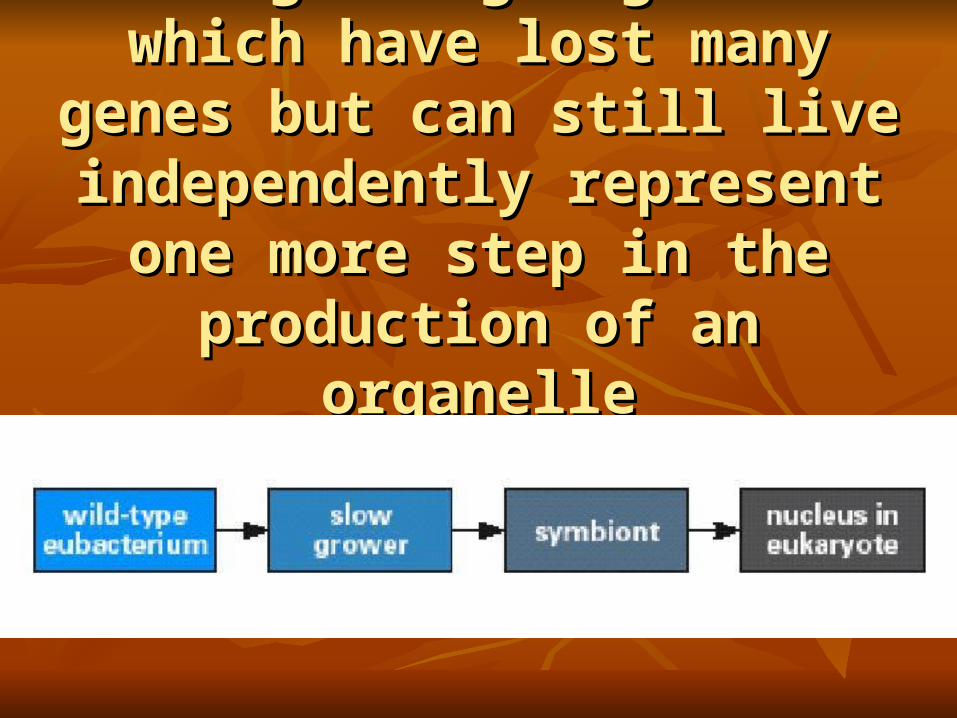
Slow-growing organisms which Slow-growing organisms which have lost many genes but can still have lost many genes but can still live independently represent one live independently represent one more step in the production of an more step in the production of an
organelleorganelle
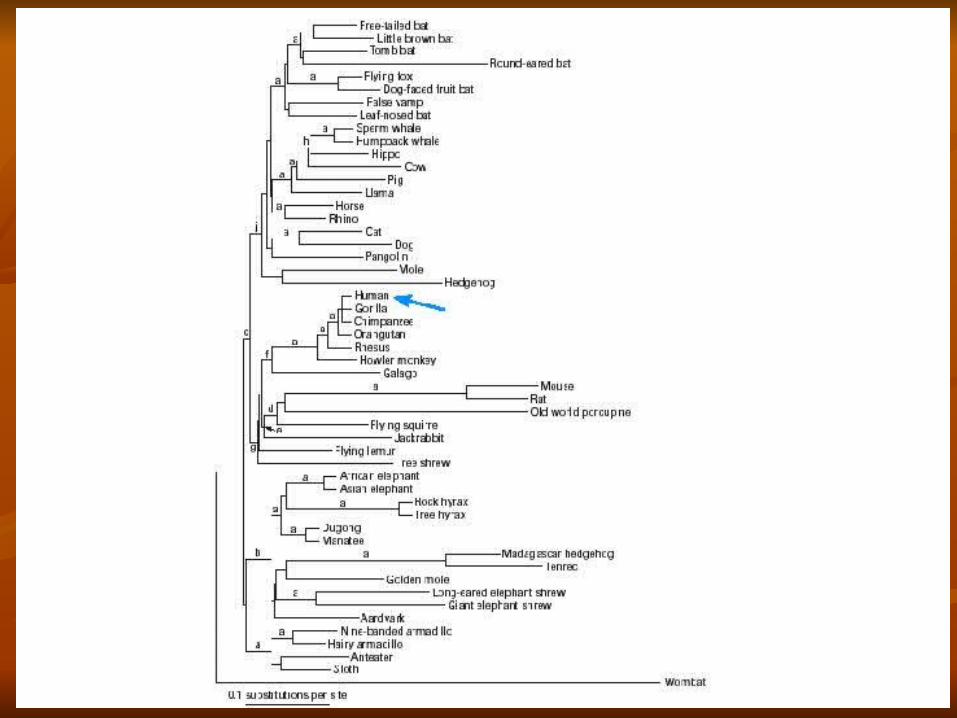
Human EvolutionHuman Evolution3000 bp of nuclear sequence was used to create 3000 bp of nuclear sequence was used to create
phylogenetic trees.phylogenetic trees.
Humans are closely related to the great apes.Humans are closely related to the great apes.
The base of the mammalian tree is a Tree shrew.The base of the mammalian tree is a Tree shrew.
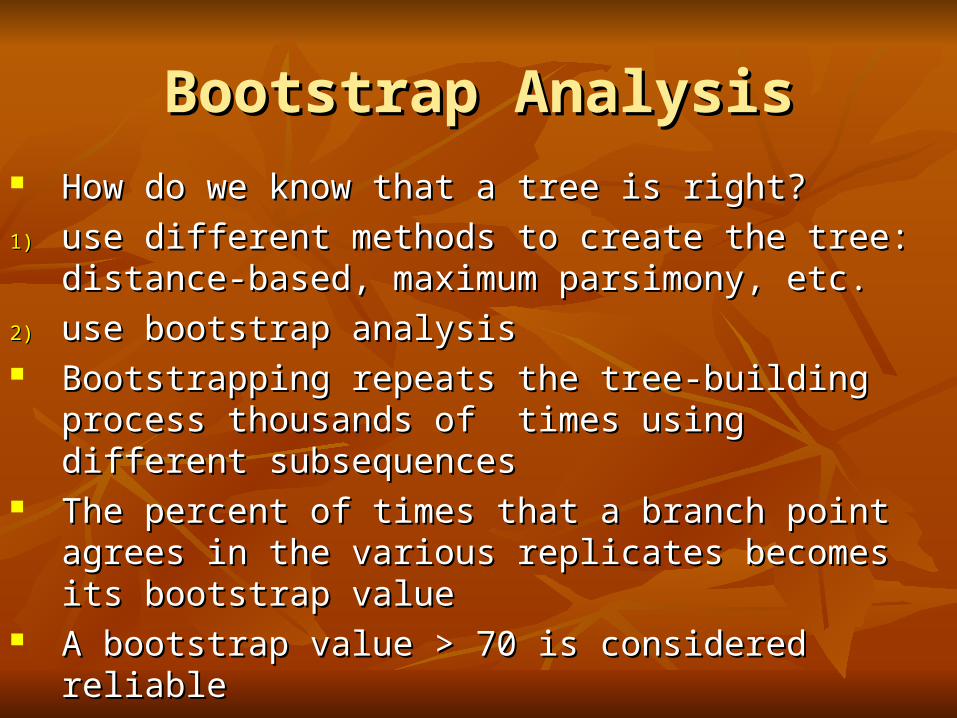
Bootstrap AnalysisBootstrap Analysis
How do we know that a tree is right?How do we know that a tree is right?
1)1) use different methods to create the tree: distance-use different methods to create the tree: distance-based, maximum parsimony, etc.based, maximum parsimony, etc.
2)2) use bootstrap analysisuse bootstrap analysis Bootstrapping repeats the tree-building process Bootstrapping repeats the tree-building process
thousands of times using different subsequencesthousands of times using different subsequences The percent of times that a branch point agrees in The percent of times that a branch point agrees in
the various replicates becomes its bootstrap valuethe various replicates becomes its bootstrap value A bootstrap value > 70 is considered reliableA bootstrap value > 70 is considered reliable
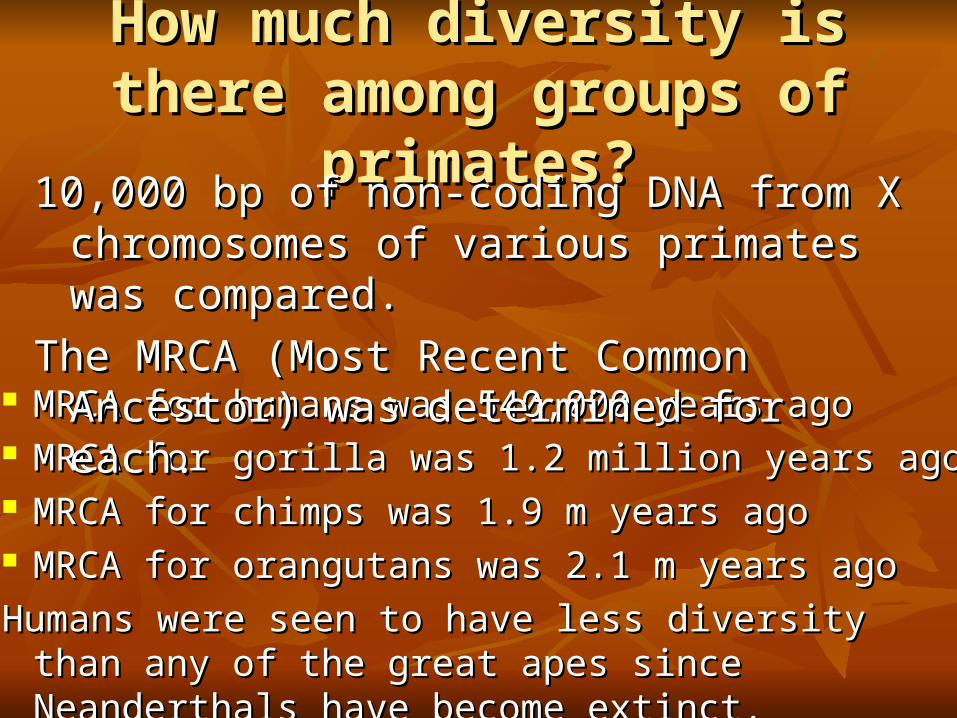
How much diversity is there How much diversity is there among groups of primates?among groups of primates?
MRCA for humans was 540,000 years agoMRCA for humans was 540,000 years ago MRCA for gorilla was 1.2 million years agoMRCA for gorilla was 1.2 million years ago MRCA for chimps was 1.9 m years agoMRCA for chimps was 1.9 m years ago MRCA for orangutans was 2.1 m years agoMRCA for orangutans was 2.1 m years ago
Humans were seen to have less diversity than any of the Humans were seen to have less diversity than any of the great apes since Neanderthals have become extinct.great apes since Neanderthals have become extinct.
10,000 bp of non-coding DNA from X 10,000 bp of non-coding DNA from X chromosomes of various primates was compared.chromosomes of various primates was compared.
The MRCA (Most Recent Common Ancestor) was The MRCA (Most Recent Common Ancestor) was determined for each.determined for each.
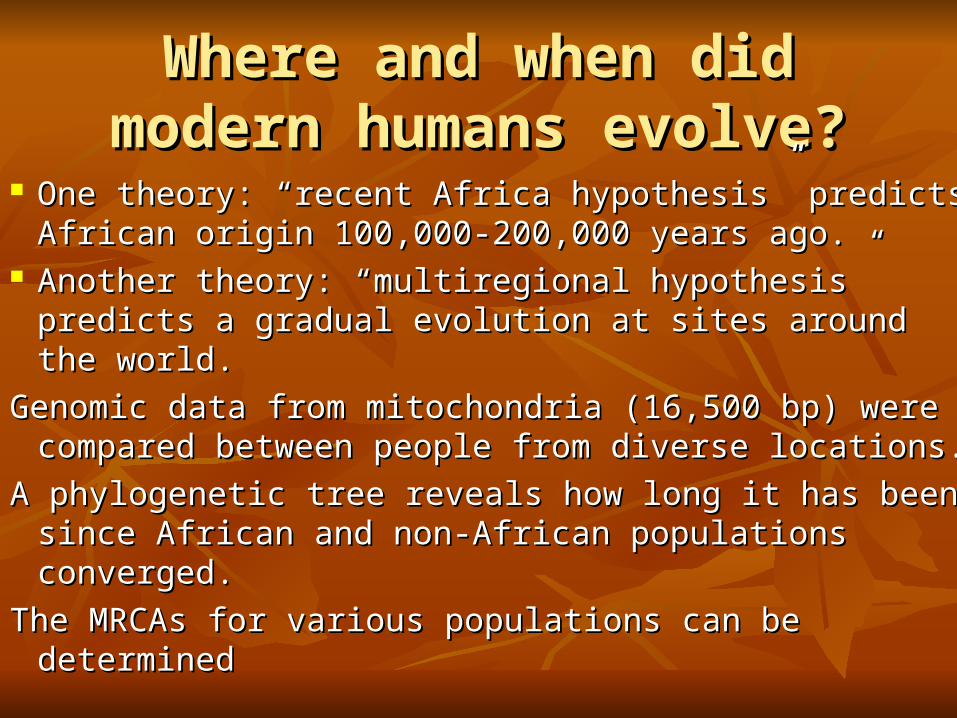
Where and when did modern Where and when did modern humans evolve?humans evolve?
One theory: “recent Africa hypothesis” predicts One theory: “recent Africa hypothesis” predicts African origin 100,000-200,000 years ago.African origin 100,000-200,000 years ago.
Another theory: “multiregional hypothesis” predicts a Another theory: “multiregional hypothesis” predicts a gradual evolution at sites around the world.gradual evolution at sites around the world.
Genomic data from mitochondria (16,500 bp) were Genomic data from mitochondria (16,500 bp) were compared between people from diverse locations.compared between people from diverse locations.
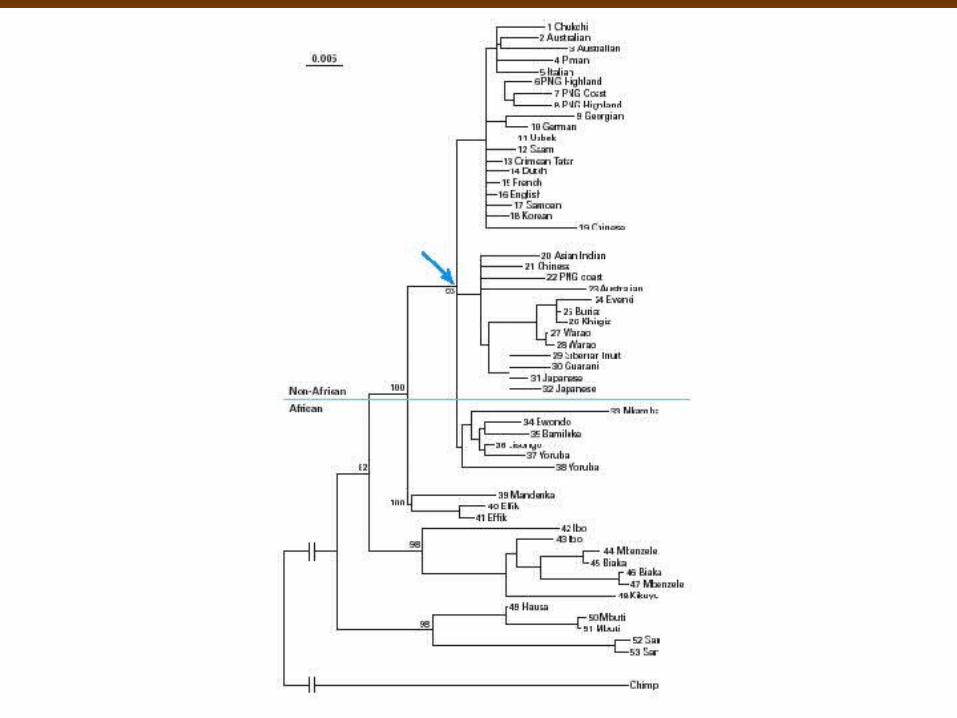
A phylogenetic tree reveals how long it has been since A phylogenetic tree reveals how long it has been since African and non-African populations converged.African and non-African populations converged.
The MRCAs for various populations can be determinedThe MRCAs for various populations can be determined
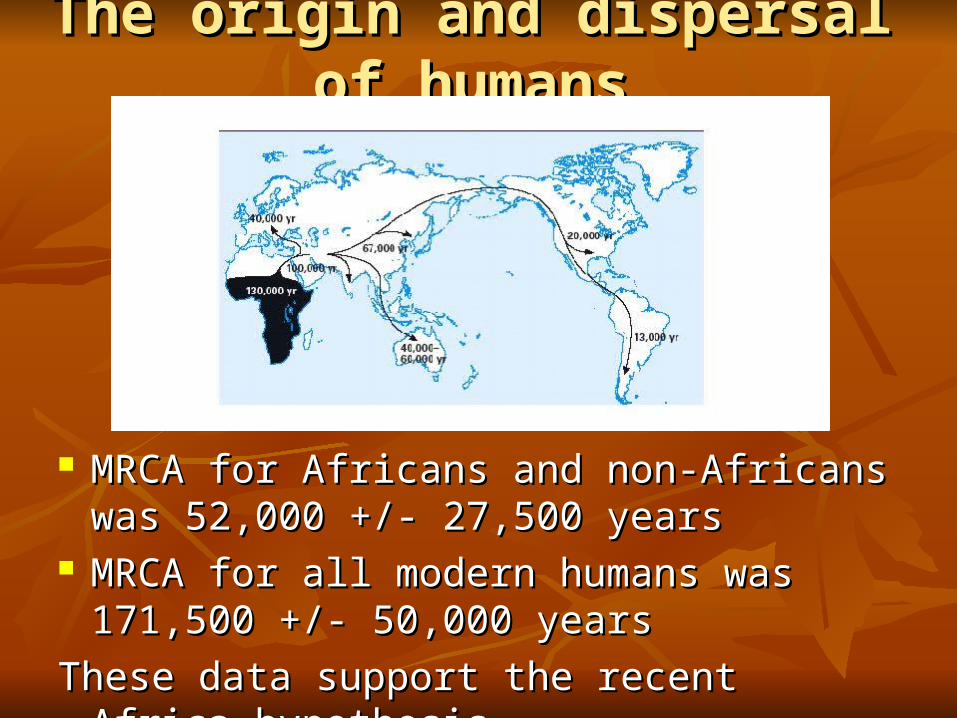
The origin and dispersal of humansThe origin and dispersal of humans
MRCA for Africans and non-Africans was MRCA for Africans and non-Africans was 52,000 +/- 27,500 years52,000 +/- 27,500 years
MRCA for all modern humans was 171,500 MRCA for all modern humans was 171,500 +/- 50,000 years+/- 50,000 years
These data support the recent Africa hypothesisThese data support the recent Africa hypothesis


