1 1 Evolution of Sea Temperature Anomalies in Nino 3.4 region into Indonesia Rainfall Anomalies during El Nino Event 2015/2016 Adi Ripaldi, Dodi Apandi, Robi Muharsyah, Supari ( Center For Climate Change Information - BMKG) Edvin Aldrian (Agency for the Assessment and Application of Technology (BPPT) Harsono Soepardjo (University Of Indonesia) JCOMM-5, JOINT TECHNICAL COMMISSION FOR OCEANOGRAPHY AND MARINE METEOROLOGY 5TH SESSION AND TECHNICAL CONFERENCE (TECO) GENEVA - October 23rd to the 24th, 2017 BMKG
Transcript
1 1
Evolution of Sea Temperature Anomalies in Nino 3.4 region into Indonesia Rainfall
Anomalies during El Nino Event 2015/2016
Adi Ripaldi, Dodi Apandi, Robi Muharsyah, Supari ( Center For Climate Change Information - BMKG)
Edvin Aldrian (Agency for the Assessment and Application of Technology (BPPT) Harsono Soepardjo (University Of Indonesia)
JCOMM-5, JOINT TECHNICAL COMMISSION FOR OCEANOGRAPHY AND MARINE METEOROLOGY 5TH SESSION AND TECHNICAL CONFERENCE (TECO) GENEVA - October 23rd to the 24th, 2017
BMKG
2
BMKG
BACK GROUND
El Niño can be classified as “very strong” if surface waters are running at
least 2 °C warmer than average for at least three months. This has only
happened three times on record: 1982/1983, 1997/1998 and 2015/2016.
Bye-bye, El Niño. (earth.nullschool.net) 2015 ‘Godzilla’ El Niño Bill Patzert (NASA Climatologist) www.washingtonpost.com
NOAA’s Climate Prediction Center
3
BMKG
EL NINO 2015 IMPACT FOR INDONESIA
4
BMKG
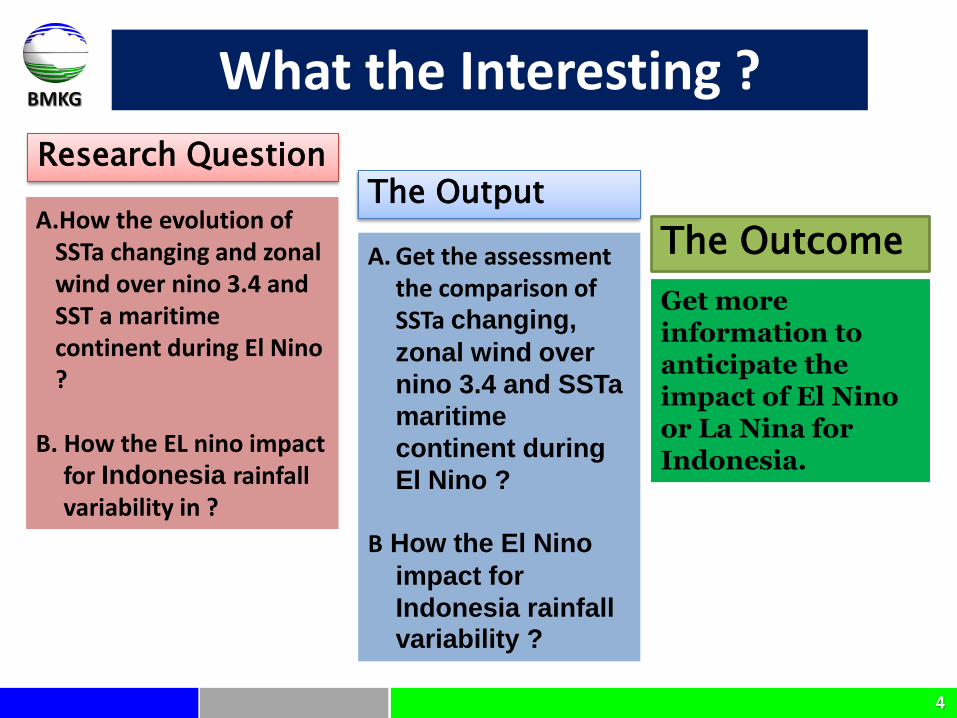
Research Question
A.How the evolution of SSTa changing and zonal wind over nino 3.4 and SST a maritime continent during El Nino ?
B. How the EL nino impact
for Indonesia rainfall variability in ?
The Output
A. Get the assessment the comparison of SSTa changing,
zonal wind over
nino 3.4 and SSTa
maritime
continent during
El Nino ?
B How the El Nino
impact for
Indonesia rainfall variability ?
The Outcome
Get more information to anticipate the impact of El Nino or La Nina for Indonesia.
What the Interesting ?
5
BMKG METHOD
RESEARCH AREA Data
a. Sea Surface Temperature, Sub Surface Temperature and Reanalysis wind 850 mb, over njno 3.4 region and Sea Surface Temperature (NCEP –NOAA)
Rainfall data observations (BMKG)
Three Assessment Regional divided Rain Gauge Station
6
BMKG
a. Calculate SST, Sub ST and
Zonal Wind at Nino 3.4 region,
SSTa Indonesia Region,
Rainfall anomalies in
Indonesia.
b. Calculate the large area of
subsurface anomalies based
on grid which is < -1 ºC (cool)
and > 1 º C (Warmer)
1 º = 111 km
Data Analysis 1. Assess patern and trend
2. Compare anomalies values
3. Compare the period of El Nino
1997 : 2015
4. Correlation analysis between
SSTa nino 3.4 and Indonesia
rainfall anomalies.
7
BMKG DATA ANALYSIS : SUB SURFACE EL NINO YEAR (1997)
8
BMKG SUB SURFACE EL NINO YEAR (1997)
9
BMKG SUB SURFACE LA NINA YEAR (1998)
10
BMKG SUB SURFACE EL NINO YEAR (2015)
11
BMKG SUB SURFACE EL NINO YEAR (2015)
12
BMKG SUB SURFACE (2016)
13
BMKG SUB SURFACE LA NINA YEAR (2016)
14
BMKG
Nino 3.4 SST Anomalies Month Period of Warm : Cool: Neutral SST
warm neutral cool
Analysis and Result
awal Puncak Akhir awal Puncak Akhir
1982-1983 Mei 82 (0,6) Des 82 (2,21) Jun 83(0,75) Okt 16 (-0,75) Nop 83 (-0,89) Des 83 (-0,76)
1987-1988 Jan 87 (1,14) Sep 87 (1,66) Jan 88 (0,91) Mei 88 (-0,86) Nop 88 (-1,78) Des 88 (-1,72)
1997-1998 Mei 97 (0,56) Nop 97 (2,32) Mei 98 (0,67) Jul 98 (-0,74) Des 98 (-1,52) Des 98 (-1,52)
1999-2000 Jan 1999 (-1,58) Jan 1999 (-1,58) Des 20 (-0,84)
2015-2016 Apr 15 (0,73) Jan 16 (2,33) Mei 16 (0,6) Ags 16 (0,63) Nop 16 (-0,93) Des 16 (-0,72)
El Nino LaninaTahun
Onset peak retreat Onset peak retreat
Year
15
BMKG
Perbandingan Luasan suhu bawah laut wilayah laut pasifik 120 E - 180 E Pada kondisi El Nino dan La Nina.
Comparison Large Area of Sub SST at Indonesia Region Warmer Sub SST (red) Coller Sub SST (Blue)
16
BMKG
SST anomalies Indonesia Region
Domain 2
Domain 3
period of warm, Cool, Neutral SST
Domain 2
Domain 3
Domain 1
warm normal dingin warm neutral cool
warm neutral cool
warm neutral cool
Domain 1
17
BMKG
Zonal Wind Anomalies Nino 3.4 Region
Zonal Wind Climatology (1981-2010)
Grafik anomalies Long period Wind Zonal Anomalies (month)
Zonal Wind During El Nino
Wind
Wind
Wind
Wind
wind
westerly easterly
18
BMKG
Comparison : SST nino 3.4 : Sub SST : Zonal Wind (Maximum and Minimum Anomalies)
zonal wind
19
BMKG
Rainfall Distribution Anomalies in Indonesia
Annual Rainfall Distribution Anomalies 2015 Annual Rainfall Distribution Anomalies 1997
20
BMKG
RAINFALL DISTRIBUTION ANOMALIES IN INDONESIA
21
BMKG
1999-2000 1997-1998
Grafik Anomali Curah Hujan, SST Nino 3.4, SST Indonesia dan Angin Zonal
2015 -2016
SSTa nino 3.4, SSTa of Indonesia, Zonal Wind and Rainfall Anomalies,
22
BMKG
1982-1983 1987-1988 1997-1998 1999-2000 2015-2016
1 Korelasi Positif 20% 24% 8% 40% 6%
2 Korelasi Negatif 80% 76% 93% 60% 94%
3 Significant 28% 23% 54% 8% 44%
4 Tidak Significant 73% 78% 46% 93% 56%
No Hasil KorelasiPeriode Tahun
1982-1983 1987-1988 1997-1998 1999-2000 2015-2016
1 Korelasi Positif 69% 73% 96% 76% 89%
2 Korelasi Negatif 31% 27% 4% 24% 11%
3 Significant 20% 18% 68% 9% 30%
4 Tidak Significant 80% 83% 33% 91% 70%
Hasil KorelasiNoPeriode Tahun
% of Correaltion between SSTa Niino 3.4 with Indonesia Rainfall
Grafik Korelasi Curah Hujan dengan SST Nino 3.4 dan SST Indonesia The Correlation of SSTa nino 3.4, SSTa of Indonesia and Rainfall Anomalies,
% of Correaltion between SST a Indonesia with Indonesia Rainfall
23
BMKG Conclusion
1. EL nino 2015/2016 have the highest anomaly 2,33° C with the 14 month period, its means that 2015/2016 is the strongest El Nino event.
2. We found the shifting of peak SSTa nino 3.4 during El Nino 2015/2016 wtih the starting early than 1982/21983 and 1997/1998.
3. The area Impact of El Nino 1997/1998 for Indonesia is larger than 2015/2016.
4. The SST of Indonesia region during El Nino 2015/2016 show warmer than 1997/1998 indicating more supporting condition for developing convective over maritim continent, this conditions suggested reduced the impact El Nino 2015/2016.
Suggestion :
The impact of global warming reduced the impact of El nino at Maritime Continent will be interesting for the future study


![A Dimensions: [mm] B Recommended land pattern: [mm] D ... · 2005-12-16 DATE SSt SSt SSt SSt SSt SSt SSt BY SSt SSt SMu SMu SSt ... RDC Value 600 800 1000 0.20 High Cur rent ... 350](https://static.documents.pub/doc/80x56/5c61318009d3f21c6d8cb002/a-dimensions-mm-b-recommended-land-pattern-mm-d-2005-12-16-date-sst.jpg)


