1 Evolution through time of Pyrrolizidine Alkaloids detection and quantification Filipe Monteiro-Silva, a Gerardo González-Aguilar b a Departamento de Química e Bioquímica, Faculdade de Ciências, Universidade do Porto, Rua do Campo Alegre, 4169-007 Porto, Portugal b UOSE- INESC TEC, Departamento de Física, Faculdade de Ciências, Universidade do Porto, Rua do Campo Alegre, 4169-007 Porto, Portugal _____________________________________________________________________________ Abstract Pyrrolizidine Alkaloids (PAs) are a group of naturally occurring alkaloids that are produced by plants as a defense mechanism against insect herbivores. The analytical methodologies employed for their detection have come a long way since the first analytical experiment and in the last 30 years had an enormous development, both technological and experimental. It is notorious that before the generalization of certain technologies, especially in a post-war atmosphere, most scientific researches relied on what it is today thin-layer chromatography. Nevertheless this technique was not sufficient for accurately measure quantities and unambiguously identify compounds, therefore spectroscopic techniques arose as well as chromatographic techniques. While the first never really coped with PAs analysis requirements the latter, either as gas or liquid chromatography allowed the analysis of complex sample matrixes. Simultaneously, nuclear magnetic resonance also suffered significant developments while mass spectrometry has become an attractive technique due to increasingly higher maximum resolutions. The observed tendency in recent years, in pyrrolizidine detection and quantification – as well as in many other areas – is that hyphenated techniques are the chosen methods. A large number of papers report multi-hyphenated methodologies, and the overwhelming majority relies on gas or liquid chromatography. Keywords: pyrrolidine alkaloid; pyrrolidizine alkaloid N-oxides; metabolization; high performance liquid chromatography; gas chromatography; mass spectrometry; molecularly imprinted polymers
Transcript
1
Evolution through time of Pyrrolizidine Alkaloids detection and
quantification
Filipe Monteiro-Silva,a Gerardo González-Aguilarb
aDepartamento de Química e Bioquímica, Faculdade de Ciências, Universidade do Porto,
Rua do Campo Alegre, 4169-007 Porto, Portugal bUOSE- INESC TEC, Departamento de Física, Faculdade de Ciências, Universidade do Porto,
Pyrrolizidine Alkaloids (PAs) are a group of naturally occurring alkaloids that are produced
by plants as a defense mechanism against insect herbivores. The analytical methodologies
employed for their detection have come a long way since the first analytical experiment and in
the last 30 years had an enormous development, both technological and experimental. It is
notorious that before the generalization of certain technologies, especially in a post-war
atmosphere, most scientific researches relied on what it is today thin-layer chromatography.
Nevertheless this technique was not sufficient for accurately measure quantities and
unambiguously identify compounds, therefore spectroscopic techniques arose as well as
chromatographic techniques. While the first never really coped with PAs analysis requirements
the latter, either as gas or liquid chromatography allowed the analysis of complex sample
matrixes. Simultaneously, nuclear magnetic resonance also suffered significant developments
while mass spectrometry has become an attractive technique due to increasingly higher
maximum resolutions.
The observed tendency in recent years, in pyrrolizidine detection and quantification – as
well as in many other areas – is that hyphenated techniques are the chosen methods. A large
number of papers report multi-hyphenated methodologies, and the overwhelming majority
relies on gas or liquid chromatography.
Keywords:
pyrrolidine alkaloid; pyrrolidizine alkaloid N-oxides; metabolization; high performance liquid
chromatography; gas chromatography; mass spectrometry; molecularly imprinted polymers
2
Contents
1. Introduction 1.1. Biological importance of PAs
2. Analytical methods for pyrrolizidine identification and quantification 2.1. Sample preparation 2.2. Qualitative analytical methods
3. Quantitative methods 3.1. From 1980 to 1999
3.1.1. High Performance Liquid Chromatography and Liquid Chromatography-Mass Spectrometry
3.1.2. Gas Chromatography and Gas Chromatography-Mass Spectrometry 3.1.3. Enzyme-Linked ImmunoSorbent Assay (ELISA) 3.1.4. Other techniques
3.2. From 2000-2009 3.2.1. High Performance Liquid Chromatography and Liquid Chromatography-Mass
Spectrometry 3.2.2. Gas Chromatography and Gas Chromatography-Mass Spectrometry 3.2.3. Enzyme-Linked ImmunoSorbent Assay (ELISA) 3.2.4. Other techniques
3.3. From 2010-2013 3.3.1. High Performance Liquid Chromatography and Liquid Chromatography-Mass
Spectrometry 3.3.2. Gas Chromatography and Gas Chromatography-Mass Spectrometry 3.3.3. Other techniques
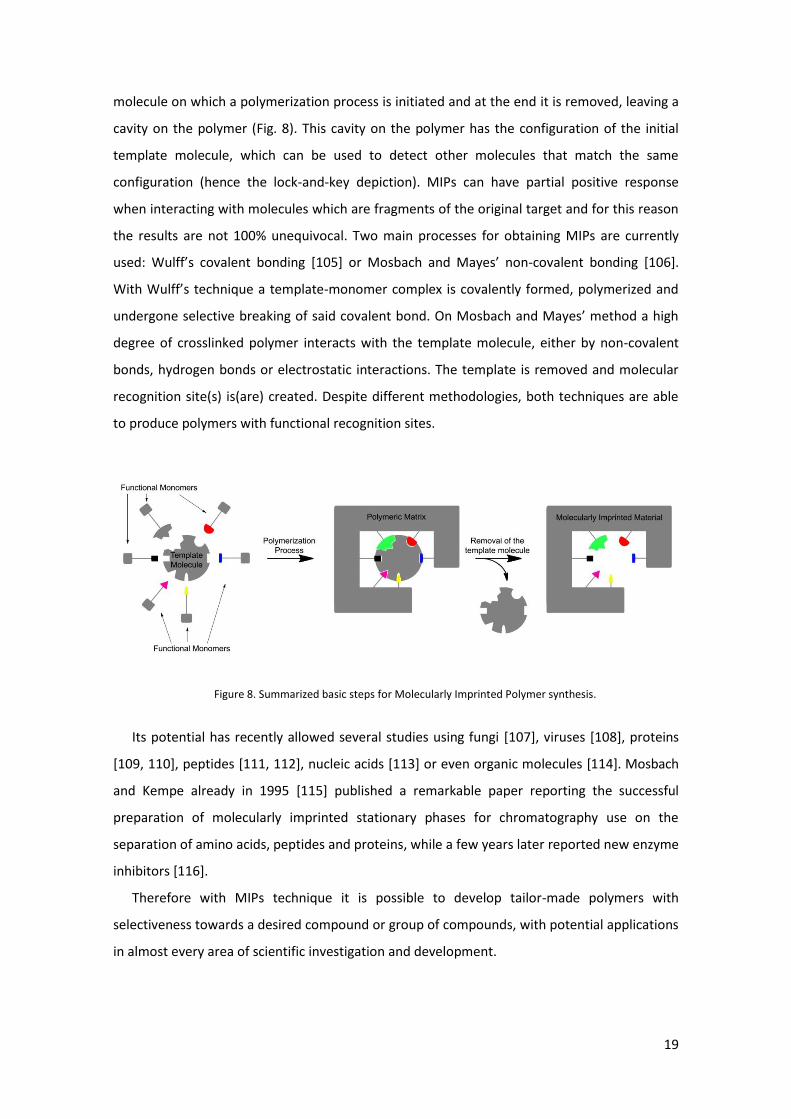
4. Potentialities Molecularly Imprinted Polymers (MIPs): The future analytical method?
5. Conclusions
1. Introduction
Pyrrolizidines alkaloids (PAs) are a class of naturally occurring chemicals that are toxins
biosynthesized by some plant species. More than 660 PAs have been identified from over 6000
plant species [1] that correspond approximately to 3% of the world’s flowering plants and
represent a convergent trait in the plant kingdom [2]. Species like the Fabaceae (Crotalaria),
Boraginaceae, Apocynaceae (Echiteae) and Asteraceae (Senecioneae, Eupatorieae) occur in
almost every habitat. They can be shrubs or vines, annual or perennials, and some species are
invasive and considered as noxious weeds [3].
In terms of structure pyrrolizidines are two-fused 5-membered rings with a nitrogen atom
at the bridgehead. An amino alcohol - necine - is the base system and variations on this core
with typically highly branched and substituted acids originate mono, di or macrocylic diesters
of the unsaturated necine or otonecine bases [4]. Single esters at C9, diesters at both C7 and C9
positions of the necine base can occur, sometimes with long cyclic diesters linking C7 to C9. The
respective N-oxides (PANOs) can also be formed (Fig. 1) [5]. Many PAs frequently co-occur as
3
the N-oxide and as the tertiary base. In plants an enzymatic catalyzed reaction originates N-
oxidation of PAs, while a spontaneous reduction of PANOs occurs in the presence of biological
or chemical reducing agents. There are records of the presence of tertiary PAs and PANOs even
after decades of storage (under controlled light and humidity exposure), in lyophilized plant
material [6].
Figure 1. Pyrrolizidines structures. A - Necine base, B - Otonecine base and C - Senecionine N-oxide.
In general, PAs are optically active as they are chiral molecules and unsaturated PAs UV
(ultra-violet) spectra usually show an absorption maximum ca. 214 nm [7]. At pH-values above
9 their esters can be hydrolyzed in aqueous solutions and the quaternisation of tertiary PAs
can be promoted by halogenated solvents to the corresponding salts [8].
Property-wise, tertiary PAs are soluble in polar organic solvents, as well as in more lipophilic
solvents like dichloromethane being slightly soluble in water while their protonation at the
nitrogen atom can occur at low pH-values. On the other hand, PANOs are charged molecules
that are partially soluble in water and in polar organic solvents.
Despite their specific stability, PAs and PANOs are prone to suffer influence from outside
factors, resulting in changes on their structure, concentration or stability that could lead to
changes to the PAs/PANOs ratio and/or total PA content of a determined sample. This is one of
the reasons why caution should be taken when performing PAs and PANOs analysis. The main
factor that may influence the results obtained is the temperature, as Hösch et al. reported in
1996. The time to which the samples were exposed to temperature severely influenced the
PAs/PANOs ratio [9]. However, the temperature per se does not seem to influence these
values but instead promotes the reductive activity of certain compounds over the N-oxides
[10].
4
1.1. Biological importance of PAs
The commonly accepted definition of PAs also includes saturated pyrrolizidines even
though their biological roles have not been thoroughly studied and are likely to be different
[3]. Until date, PAs are classified as toxics and some are even classified as possibly carcinogenic
to humans (Fig. 2) [11, 12]. This toxicity is associated to their metabolization. PAs can be
converted to PANOs and their toxic form during digestion [8] and are themselves susceptible
to be considered toxic [4].
Figure 2. Examples of carcinogenic PAs: A - Riddelliine, B - Lasiocarpine and C - Monocrotaline.
The problematic of the PAs relies on the premise that exposure to this contaminant is not
controlled and there is not a deep knowledge of their hepatotoxicity. Many of the PAs feature
the necessary chemical properties to be hepatotoxic: a C1-C2 double bond on the pyrrolizidine
moiety and a hydroxyl group able to undergo sterification [13].
As these xenobiotics enter the system, they are absorbed by the blood stream and enter
the hepatic portal system and undergo metabolization. This metabolization has the purpose of
converting a certain molecule, capable of crossing membranes, in one that can be excreted
(through urine, sweat, etc.). Throughout the metabolic steps, the molecules’ lipophilicity
usually decreases, increasing their polarity. This step determines if the molecule proceeds to
renal excretion or if it undergoes further metabolization [14].
If metabolization continues, they are due to be activated in the liver and in the case of PAs,
to reveal their toxic effects. In the liver, esters and amides are susceptible to esterases action
while nitro, azo and carbonyl moieties undergo action of reductases. By oxidase action, PAs
transform into pyrrolic dehydro-alkaloids (dehydroPAs) which are reactive alkylating agents.
These are believed to be responsible for liver cell necrosis and for hepatic sinusoidal
obstruction syndrome [15]. Besides, there have been reports of additional damages such as
lung vascular lesions characteristic of primary pulmonary hypertension [16]. DNA-binding
5
capabilities have also been pointed as responsible for the genotoxic effects that pyrrolic
metabolites possess (Fig. 3) [17, 18, 19].
Some PAs may present some degree of resistance to esterase due to the steric hindrance in
the acid moiety. High levels of pyrrolic metabolites may be formed from the chain branch near
the carbonyl groups, in the necine base. This transformation slows down possible hydrolytic
steps. In the same manner, a spatial conformation of the basic moiety, which brings the ester
groups closer, leads to mutual steric hindrance and subsequent hydrolysis inhibition of the
resulting molecule [20].
Figure 3. Summary of the metabolic pathway of dehydroPA (1a, b) by bioactivation and detoxification in vivo.
Compounds (1a and b) are converted in hepatocytes, by Cytochrome P450 (CYP) enzymes, to 6,7-dihydropyrrolizine
esters (2). A fast nucleophilic (Nu) reaction occurs and adducts are formed (3), some of these adducts release
dehydroretronecine/heliotridine (4) and the formation of adducts proceeds and may lead to chronic diseases.
Compounds (4) can also be produced by a water reaction with initial metabolites (2). The hydrolysis of (1a, b) ester
groups can occur by detoxification through esterases and non-toxic necid acids are produced. In the liver N-oxides
(5) are obtained by N-oxidation of (1a) and are reduced in the gut to the free base form. R1-R2 are a subgroup of
dehydroPA diesters [21].
6
The rate to which pyrrolic metabolites are formed is influenced by the induction or
inhibition of the mixed-function oxidases in the liver, but evidences of a relationship between
the rate of metabolism and expression of toxicity are still not known [21].
Despite the limited information on the dose-response relationships, according to the World
Health Organization, intake of PAs may present a health risk and exposure should be
minimized whenever possible [16].
2. Analytical methods for pyrrolizidine identification and quantification
2.1. Sample preparation
Prior to determine any sample content, one must consider the variety of PAs that exist and
the possibility of co-occurrence of PANOs also. Besides simultaneous presence, both matrix
and matrix interferences have always to be taken into account.
In order to obtain an efficient extraction of both types certain characteristics should be
acknowledged:
- PAs and PANOs are polar compounds;
- PAs bearing basic nitrogen are suitable to be extracted via classic alkaloid methodology
with acidified aqueous conditions or polar to semi-polar organic solvents;
- PANOs are oxidized forms of parent PAs and, if considered adequate, can be reduced
to them. The most common method is a reaction with elemental zinc in acidic aqueous
solution with subsequent extraction [22]. Otherwise they can be extracted by polar solvents
or diluted aqueous acids;
- A cleanup step, either before or after the extraction can be performed using, for
example, non-polar solvents to suppress the interferences of any non-polar compounds.
The type of extraction procedure needs to be assessed depending on the matrix available.
Solid samples must have a different treatment regarding a liquid sample. If it is sought to
extract PAs/PANOs from tissues or heterogeneous samples, homogenization should be assured
prior to extraction in order to obtain a representative sample. Isolating PAs from animal tissues
might be difficult as they might be metabolized very rapidly once ingested. Yet, several types
of samples were successfully analyzed up-to-date: honey [23], milk [24], eggs [25], urine [26]
and blood [15] are just a few examples.
The extraction process is also dependent of the type of analytical technique(s) chosen,
adopting a more iterative stance. It is known that PANOs are thermophobic and become
unstable at high temperatures – e.g. those needed on GC analysis – therefore direct analysis of
samples containing PANOs must not be done without previous derivatization [27]. Soxhlet
7
extraction is one of other commonly used techniques [9, 28, 29], requiring high temperatures
and boiling solvent(s), which allows to obtain high recover rates, but if extraction of PANOs is
required then this technique should be avoided because of the motives aforementioned.
Another commonly adopted technique on sample preparation and extraction is the use of
solid-phase extraction (SPE). Several types of materials are available for usage in PAs/PANOs
extraction from different sample types: from typical C18 [30], Ergosil [31], LiChrolut [32],
Serdoxit [33], Extrelut [34] or SCX (strong cation-exchange) [35].
2.2. Qualitative analytical methods
Several techniques have been used and developed over the years in this field and will be
discussed below, through a chronological timeline of the last 30+ years.
Nevertheless, a brief reference goes to the first technique that sought to identify PAs and
PANOs already in the 1960’s by distinguishing their different polarities and oxidation
properties: paper chromatography. By using a rudimentary version of modern thin-layer
chromatography, Arthur Thurlby Dann used acetic anhydride in order to obtain selective and
colorful spots [36]. A few years later Robin Mattocks enhanced the previous method, using
hydrogen peroxide or peroxide anhydride reagents, making it sensitive for alkaloids with an
unsaturated pyrrolizidine ring [37].
3. Quantitative methods
It was only after 1980 that pyrrolizidine alkaloids began to be quantified and for that
purpose, several techniques were used. In the following pages a review of the most important
reports and progresses of the quantitative methods is presented and the study will be divided
in three main periods. These periods are 1980-99, 2000-09 and finally 2010-13, as these time
intervals represent - for us - different development stages in both analytical techniques and
pyrrolizidine alkaloids analysis.
3.1. From 1980 to 1999
3.1.1. High Performance Liquid Chromatography and Liquid Chromatography-Mass
Spectrometry
High Performance Liquid Chromatography (HPLC) is a resourceful and widely used analytical
technique that being non-destructive is useful when limited amounts of sample are available
8
and their recovery is required. In the case of PAs/PANOs, simultaneous determination is
possible without any prior derivatization steps but limited and unspecific information is
obtained [7].
In the referred time span, HPLC was not the preferred method of choice when PAs analysis
was needed, at least not in the first few years. Few papers with HPLC determination were
published probably because, among other reasons, to the lack of a chromophore that enabled
their detection with conventional ultra-violet systems. Adding such a group through
derivatization, either before or after the chromatographic column, would allow HPLC detection
but would also add complex steps to the process of analysis which desirably, should be fast
and simple. Also the generally low solubility in organic solvents that do not portray hydroxyl
groups disabled the development of adequate solvent system–column combinations [27].
In 1981, Ramsdell and Buhler reported HPLC analysis of Senecio vulgaris and S. jacobaea
flower tops for PAs [38] using a standard C8 reverse-phase (RP) column. A few years later, in
1986 Kersierski and Buhler improved a HPLC method using a styrene-divinylbenzene column
and ultraviolet detection allowing the simultaneous determination of the senecionine,
seneciphylline, and retrorsine as well as their major metabolites produced during in vitro
transformation of PAs [39]. With the evolution of column packing in the decade of 1990 some
very interesting works were done like the one of Brown et al. [40] using cyano and phenyl-
bonded columns allowing shorter running times. In 1997, Crews and his co-workers developed
a method that combined SPE with HPLC-MS detection for PA determination in honey samples
of Ragwort (Senecio jacobaea). The advantages of the method included the determination of
individual alkaloids and a considerable improvement in specificity, sensitivity as well as speed-
wise. The lowest detection limit achieved in honey samples was 0.002 ppm [34].
3.1.2. Gas Chromatography and Gas Chromatography-Mass Spectrometry
Gas Chromatography (GC) allows the use of samples, either in the form of extracts or
separate components, however in the first case it is necessary a preliminary step of ion-
exchange and for some samples a previous modification or derivatization is also required.
Analysis of PAs samples is possible without any prior modification however for the analysis of
PANOs, due to their properties (high polarity, low volatilization ability and instability at the
temperatures required to GC analysis), they should be converted to the corresponding tertiary
PAs or derivatized. The derivatization process allows PANOs to become less polar, which can
be achieved by introduction of:
- bulky, non-polar silyl groups to form trimethylsilyl ethers [41] or
9
- boronate reagents, like methyl, butyl or phenyl boronic acids, to form bonds across
vicinal diol groups [42], [43].
The apparent disadvantage of derivatization is that it may cause some degree of destruction or
modification to senecionine and seneciphylline [44] however it allows the determination of
retronecine base [45].
It was not until 1982 that GC-MS was used in the determination of PANOs. In the work
developed by Brauchli et al. 7-pyrrolizidine alkaloid-N-oxides were determined by this
methodology [28]. A few years later, in 1988 Hendriks et al. used positive and negative ion-
chemical ionization to detect PAs in Anchusa officinalis after trimethylsilylation [46]. Pieters
and his co-workers opted to quantify PAs from Senecio vernalis using GC and NMR (1H and 13C)
after reducing PANOs to the parent tertiary bases [47]. The first report of PAs determination
from Senecio serra, S. dimophophyllus and S. hydrophyllus was published by Stelljes et al. in
1991, and it allowed through GC-MS analysis to profile and compare the Senecio species in
terms of PA content [48]. The method employed a medium-low polarity DB-17 column that
afforded a less time-consuming identification of PAs in comparison with NMR analysis. A very
interesting work was performed by Dueker et al. where PAs where incubated in guinea pig
carboxylesterase (GPH1), with the purpose of measuring the release of retronecine (RET). The
GC analysis provided information on the release of RET by enzymatic hydrolysis or base-
catalysis processes that occurred on the parent molecules [49]. Hovermale and Craig
established a routine method for RET determination using GC after derivatization with bis-
(heptafluorobutyrate). With this work it became clear that GC started to provide very
remarkable results in terms of limit detection [45].
3.1.3. Enzyme-Linked ImmunoSorbent Assay (ELISA)
Enzyme-Linked ImmunoSorbent Assay had its first steps ca 1960 as radioimmunoassays
performed by Yalow and Berson [50] but the radioactivity was a downside of the technique.
Since enzymes react specifically under certain conditions, this property was explored - under
the advent of solid-phase organic synthesis by Robert Bruce Merrifield [51] - binding enzymes
to antigens or antibodies that were fixed to a solid surface. One of the first reports appeared in
1966 [52]. In general terms ELISA involves the production of visible color shifts associated to
certain chromogenic reporters and substrates that stress the presence of analytes or antigens.
Few reports during this time period arised comprising ELISA assays on PAs. The first one, in
1989, by Bober and her team demonstrated how using the common structural necine base, it
was possible to raise antibodies, through retronecine-protein (bovine serum albumin - BSA), to
10
detect retronecine as well as retrorsine, senecionine, and seneciphylliine in a competitive
inhibition enzyme-linked immunosorbent assay [53, 54]. Later, the same group reported the
production of retrocine-moiety class-specific antibodies, this time through retronamine-BSA
conjugate [55]. In 1992, David Roseman and his group achieved very interesting results
developing a class-specific method claiming detection limits of 1.0-100 ppb, comparable at the
time to GC/GC-MS detection limits [56]. In 1996, the same group achieved detection limits of
0.5-10 ppb for retrorsine [57]. All these papers reported the existence, to some degree, of
mixed crossed-reactivity as they tend to suffer influence from other PAs and/or PANOs (see
section 3.2.3).
3.1.4. Other techniques
Other techniques that allowed scientist to research PAs in this time span were mainly
focused on other types of chromatography.
In 1980, curiously published in the same issue of the same journal, both Huizing and
Molyneux claimed findings on a method to determine the presence of PA on TLC plates (thin-
layer chromatography) using chloranil [58, 59]. Other methods included oxidation either by
Dragendorff’s or Erlich’s reagent sprayed on TLC plates [60] or ion-pair adsorption
chromatographic separation developed by Huizing and Malingré [61].
On the same year, Birecka et al. published a very simple and fast method that through the
stoichiometric reaction of protonated alkaloids with methyl orange permitted the
spectrophotometric assessment of alkaloids up to a concentration of 0.5 ppm [62]. A novel
method for extraction of PA was achieved by Schaeffer and his collaborators employing
supercritical fluid in 1989 [63] and two years later Bicchi et al. tested the applicability of offline
supercritical fluid extraction of PAs for identification with GC, with higher recoveries in
comparison to typical Soxhlet extractions [64]. By 1992, Roeder and colleagues improved an
existing method to, by spectrophotometric means, reach detection limits up to 10 ppm in 1
gram of substrate [65].
As a final example, counter-current chromatography (CCC) – not a very common
separation technique - was employed by Huxtable and co-workers in 1996 to separate and
purify PAs from Amsinckia tessellata, Symphytum spp., Trichodesma incanum and Senecio
douglasii longilobus [66]. CCC consisted in one liquid to act like a stationary phase - sustained
against the outer walls of a helical column due to its rotation – and a mobile phase to be
pumped through the system. This method though it presented low resolution and separation
11
ability to today’s standards (350 to 1000 theorical plates), had the advantage of minimal
contamination and adsorptive loss due to the absence of a solid support.
3.2. From 2000 to 2009
3.2.1. High Performance Liquid Chromatography and Liquid Chromatography-Mass
Spectrometry
After the year 2000, liquid chromatography and related techniques applied to the
determination of PAs or PANOs grew rapidly, mostly associated to the developments and
breakthroughs on column packing and processing. The use of mass spectrometry (MS) coupled
to HPLC became more common and an unequivocal method for identification.
In the study of 2001 by Chou et al., the development of a sensitive and reliable 32P-
postlabeling and HPLC method for detection of (i) two DHR-3’-dGMP and four DHR-3’-dAMP
adducts and (ii) a set of eight DHR-derived DNA adducts in vitro and in vivo was achieved [67].
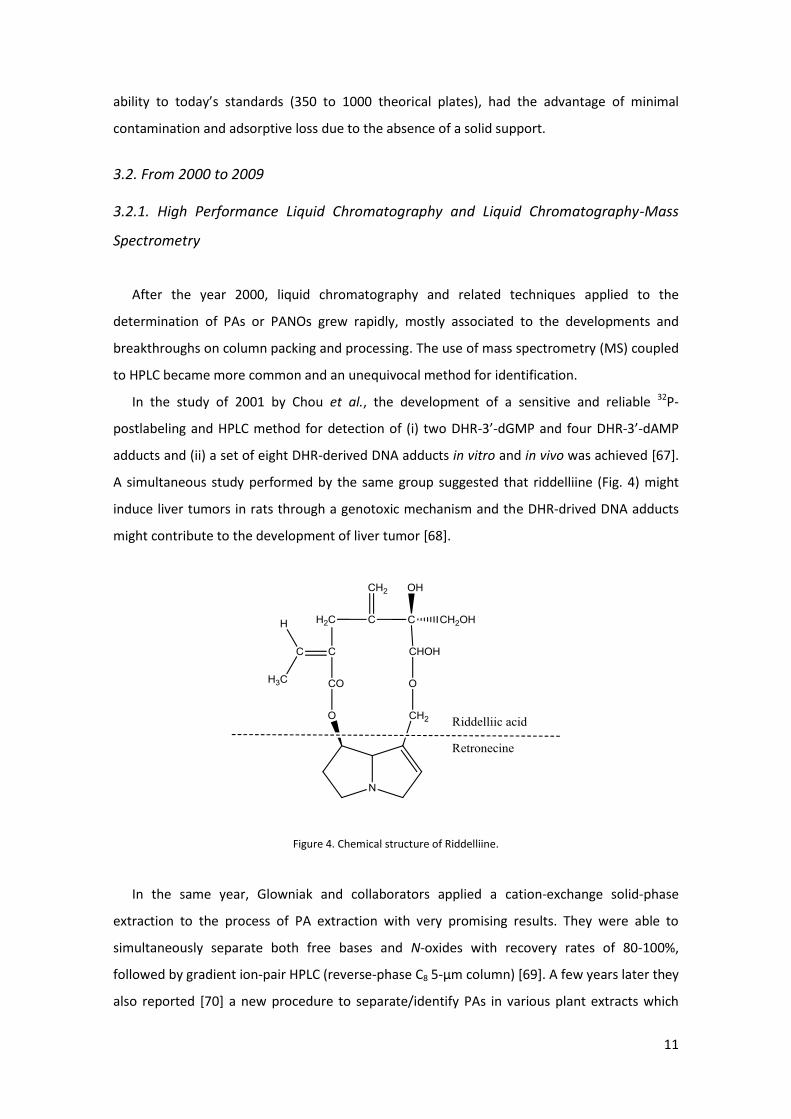
A simultaneous study performed by the same group suggested that riddelliine (Fig. 4) might
induce liver tumors in rats through a genotoxic mechanism and the DHR-drived DNA adducts
might contribute to the development of liver tumor [68].
Figure 4. Chemical structure of Riddelliine.
In the same year, Glowniak and collaborators applied a cation-exchange solid-phase
extraction to the process of PA extraction with very promising results. They were able to
simultaneously separate both free bases and N-oxides with recovery rates of 80-100%,
followed by gradient ion-pair HPLC (reverse-phase C8 5-µm column) [69]. A few years later they
also reported [70] a new procedure to separate/identify PAs in various plant extracts which
12
involved a rapid resolution C18 column and MS fragmentation and again, in 2004, the structure
characterization of Onosma stellulatum and Emilia coccinea with a RP HPLC with ion-trap MS
[71], and in 2006 Symphytum cordatum alkaloids [72]. Colegate et al. reported honey samples
analysis by SPE followed HPLC identification [73] and quantification through internal standard
normalization while Bligh and colleagues preferred to derivatize existing PAs, evaluating a
common retrocine marker (7-ethoxy-1-ethoxylmethyl retronecine derivative), produced by the
different retronecine esters-type pyrrolizidine alkaloids (RET-PAs) [74]. Two years later, a
slightly improved method was reported by Wang et al. in which derivatization and elution
conditions were optimized [75]. A different extraction process was presented by Ong et al.,
combining microwaves and hot water after which identification was performed using mild
elution conditions. Further identification resorted to LC-MS, using a 3-µm C18 column and good
relative standard deviation (RSD) values of precision were obtained [76]. Later in the same
year an improvement of the same method was attempted using sonication instead of
microwave-assisted synthesis. Pressurized hot water extraction (PHWE) was also investigated
but lycopsamine extraction efficiency was considerably reduced with the increase of
temperature (Fig. 5). According to the authors, the lower efficiency might have been due the
presence of dissolved nitrogen with effects on lycopsamine solubility or leading to its
oxidation, resulting in high RSD values [77].
Figure 5. Chemical structure of Lycopsamine.
The analysis of PAs in Jacobaea vulgaris was also investigated by Joosten et al. in 2009. In a
very insightful work, their objective was to determine the applicability of different extraction
and detection techniques, namely GC with nitrogen phosphorus detection (GC-NPD) and LC-
MS-MS. The detection of PAs by both techniques was comparable - despite the apparent 15
fold difference in detection limit (LOD) - but LC-MS outperformed GC due to the unnecessary
reductive step for GC and allowed the detection of 11 additional different PANOs. This fact
might indicate that regardless the reductive strategy, some information might be lost during
that process [78].
13
3.2.2. Gas Chromatography and Gas Chromatography-Mass Spectrometry
Gas chromatography also benefited from technological evolutions in this time period, not
only on column efficiency and sensitivity but also on tandem analysis techniques, namely mass
spectrometry. Their sensitivity and LOD as well as their dynamic range were gradually
enhanced as ionization techniques became finer and detectors gained better resolution.
A very exciting work, in 2000 by Schoch, Gardner and Stegelmeier employed GC-MS-MS for
PA metabolite detection, using a protein-metabolite conjugate as a pseudo-standard for the
calibration curve [79]. They studied riddelliine supplementation effects on pigs - generally
accepted as the most suitable human mimetic model – by analyzing both liver and blood
pyrrolic metabolites. Differences in metabolite levels could be discerned, but amounts of
riddelliine fed and detected did not show correlation. In 2003, Karlberg and Wretensjö
assessed PA content in borage oil and the effect of the refinement process, with a combination
of two different columns for GC-MS analysis: a non-polar DB-1 and a mid-polarity DB17; and a
100% dimethylpolysiloxane column for GC-FID [80]. The authors did not find presence of any
PAs except the crotaline they added as a reference and concluded that no PAs were present at
a level above 100 ppb. In 2008, two interesting papers were published. The first, by Schreier et
al. regarding honey sampling analysis through GC-MS with previous SPE and derivatization in
which the authors claim a limit of quantification (LOQ) of 0.01 ppm [81] and the second by
Hartmann et al. where assignment of stereoisomeric 1,2-saturated necine bases was achieved.
In the latter, two different equipment configurations were used, one with a low polarity
column and the second with a slightly more polar one: 100% dimethylpolysiloxane versus 95%
dimethylpolysiloxane/5% phenyl. The authors announced unambiguous identification achieved
by detailed GC–MS analysis and confirmation of the structures by NMR [82].
3.2.3. Enzyme-Linked ImmunoSorbent Assay (ELISA)
Recently, ELISA technologies evolved to use fluorescent probes, in addition to the
previously used chromogenic markers as well as electrochemiluminescent ones which brought
higher sensitivities and higher sample throughput [83, 84].
Lee and his collaborators investigated [85] crossed reactivity among 16 pyrrolizidine
alkaloids and found that this interaction between the N-oxide and the free base forms allowed
an estimation of the total PA content in the sample and inferred that the methylene group at
the C19 carbon was the primary antigenic site and promoter of the immunologic response for
the antibodies raised against the used immunogen.
14
3.2.4. Other techniques
Despite the main identification and quantification techniques used were gas and liquid
chromatography, mostly with mass-spectrometry support, some other techniques continued
to be evaluated to assess pyrrolizidine alkaloids and their N-oxidized bases.
In 2004, a group of Brazilian researchers led an investigation to determine the cause of
livestock deaths in several outbreaks [86]. Upon PA poisoning suspicions, samples were
collected and after liquid extraction and oxidation by Erlich’s reagent, identification was
performed by TLC and quantification by UV spectrophotometry. Coincidentally at the same
time, Khan, Molyneux and Schaneberg developed a reverse-phase HLPC with evaporative light
scattering detection (ELSD) which, according to the authors, should be able to detect
simultaneously PAs with and without a chromophore. A rather simple elution gradient was set
by the authors, at room temperature that enabled a LOD of 40 ppm [87]. Dickinson et al. in
2005, hydrolyzed PAs to its parent base retronecine and proceeded to fluorination obtaining
four derivatives after which they were injected on MS [88]. As a result of the insertion of
electron withdrawing fluorinated groups, the preferred fragmentation changed from the
nitrogen α-cleavage to a charge site migration, resulting in an alkyl–oxygen bond cleavage and
the formation of a stabilized allylic cation. In a slightly different investigative area, Pothier and
Galand applied automated multiple development in thin-layer chromatography to opiate
alkaloids which, not sharing the same properties, might have a similar potential of applicability
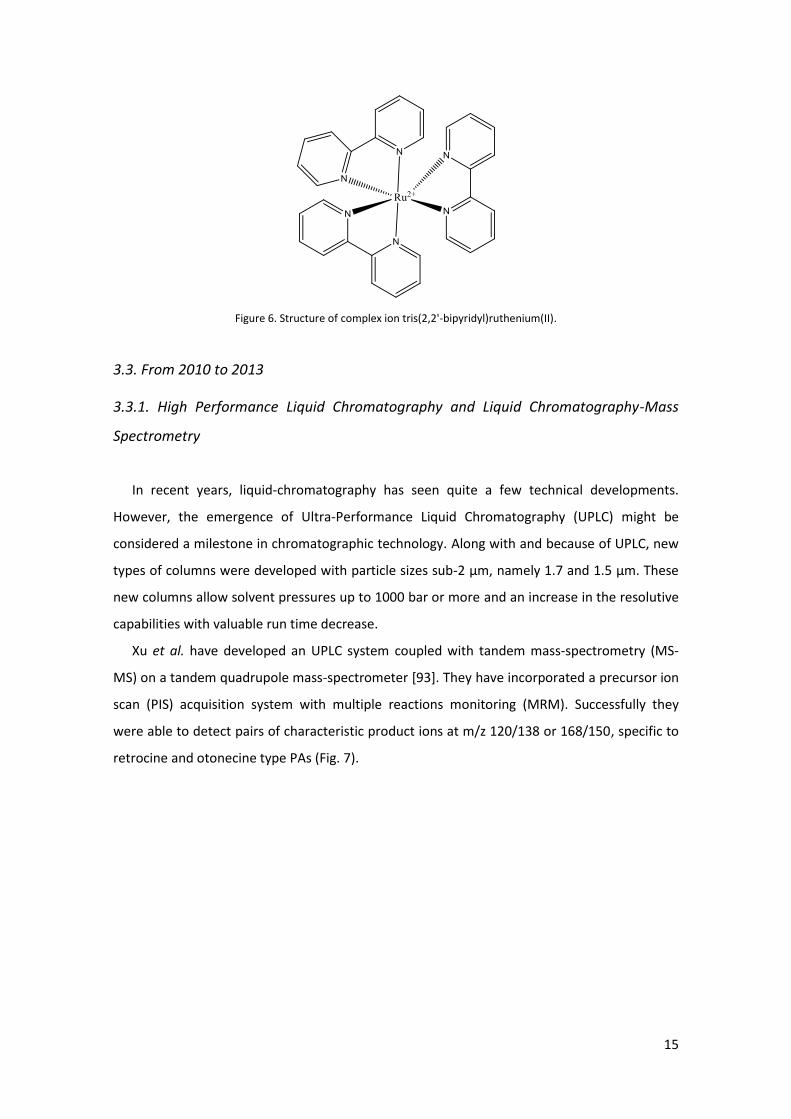
[89]. Barnett, Gorman and Bos in 2005 published an outstanding work combining
chemiluminescent reactions with PAs, using ruthenium’s remarkable properties (Fig. 6) [90].
Performing flow-injection and sequential-injection analysis (FIA and SIA respectively), the
authors were able to determine PAs presence with good LOD. Another potentially useful
technique for PAs analysis was investigated by Li et al. in 2005 based on micellar electrokinetic
chromatography (MEKC) [91]. The authors claimed that, in a single 17 minute run they were
able to separate a senkirkine, senecionine, retrorsine, and seneciphylline containing matrix.
The presented LOD values of 1.19 to 2.70 ppm were not as good as in others techniques (e.g.
chromatographic techniques) but nevertheless it was a simple and rapid method that provided
good results. Simultaneously Li and Yu published another study on PA detection that consisted
on dynamic pH junction-sweeping capillary electrophoresis (CE) [92]. The hyphenization of CE
with dynamic pH junction-sweeping allowed the authors to enhance the CE detection
sensitivity to values as low as 30 ppb, which enabled them to reach good results.
15
Figure 6. Structure of complex ion tris(2,2'-bipyridyl)ruthenium(II).
3.3. From 2010 to 2013
3.3.1. High Performance Liquid Chromatography and Liquid Chromatography-Mass
Spectrometry
In recent years, liquid-chromatography has seen quite a few technical developments.
However, the emergence of Ultra-Performance Liquid Chromatography (UPLC) might be
considered a milestone in chromatographic technology. Along with and because of UPLC, new
types of columns were developed with particle sizes sub-2 µm, namely 1.7 and 1.5 µm. These
new columns allow solvent pressures up to 1000 bar or more and an increase in the resolutive
capabilities with valuable run time decrease.
Xu et al. have developed an UPLC system coupled with tandem mass-spectrometry (MS-
MS) on a tandem quadrupole mass-spectrometer [93]. They have incorporated a precursor ion
scan (PIS) acquisition system with multiple reactions monitoring (MRM). Successfully they
were able to detect pairs of characteristic product ions at m/z 120/138 or 168/150, specific to
retrocine and otonecine type PAs (Fig. 7).
16
Figure 7. Retronecine-type and otonecine-type PA toxins representative chemical structures used in the study [93].