University of Southern Denmark Evolutionary Trends of Players’ Technical Characteristics in the UEFA Champions League Yi, Qing; Liu, Hongyou; Nassis, George P.; Gómez, Miguel Ángel Published in: Frontiers in Psychology DOI: 10.3389/fpsyg.2020.01032 Publication date: 2020 Document version: Final published version Document license: CC BY Citation for pulished version (APA): Yi, Q., Liu, H., Nassis, G. P., & Gómez, M. Á. (2020). Evolutionary Trends of Players’ Technical Characteristics in the UEFA Champions League. Frontiers in Psychology, 11, [1032]. https://doi.org/10.3389/fpsyg.2020.01032 Go to publication entry in University of Southern Denmark's Research Portal Terms of use This work is brought to you by the University of Southern Denmark. Unless otherwise specified it has been shared according to the terms for self-archiving. If no other license is stated, these terms apply: • You may download this work for personal use only. • You may not further distribute the material or use it for any profit-making activity or commercial gain • You may freely distribute the URL identifying this open access version If you believe that this document breaches copyright please contact us providing details and we will investigate your claim. Please direct all enquiries to [email protected]Download date: 03. Feb. 2022
Transcript
University of Southern Denmark
Evolutionary Trends of Players’ Technical Characteristics in the UEFA Champions League
Yi, Qing; Liu, Hongyou; Nassis, George P.; Gómez, Miguel Ángel
Published in:Frontiers in Psychology
DOI:10.3389/fpsyg.2020.01032
Publication date:2020
Document version:Final published version
Document license:CC BY
Citation for pulished version (APA):Yi, Q., Liu, H., Nassis, G. P., & Gómez, M. Á. (2020). Evolutionary Trends of Players’ Technical Characteristicsin the UEFA Champions League. Frontiers in Psychology, 11, [1032]. https://doi.org/10.3389/fpsyg.2020.01032
Go to publication entry in University of Southern Denmark's Research Portal
Terms of useThis work is brought to you by the University of Southern Denmark.Unless otherwise specified it has been shared according to the terms for self-archiving.If no other license is stated, these terms apply:
• You may download this work for personal use only. • You may not further distribute the material or use it for any profit-making activity or commercial gain • You may freely distribute the URL identifying this open access versionIf you believe that this document breaches copyright please contact us providing details and we will investigate your claim.Please direct all enquiries to [email protected]
Gómez M-Á (2020) EvolutionaryTrends of Players’ TechnicalCharacteristics in the UEFA
Champions League.Front. Psychol. 11:1032.
doi: 10.3389/fpsyg.2020.01032
Evolutionary Trends of Players’Technical Characteristics in theUEFA Champions LeagueQing Yi1,2,3* , Hongyou Liu4, George P. Nassis1,5 and Miguel-Ángel Gómez6
1 School of Physical Education and Sport Training, Shanghai University of Sport, Shanghai, China, 2 Shanghai Key Labof Human Performance, Shanghai University of Sport, Shanghai, China, 3 Key Laboratory of Diagnosis & Analysis of Skills &Tactics in Sports, Shanghai University of Sport, Shanghai, China, 4 School of Physical Education & Sports Science, SouthChina Normal University, Guangzhou, China, 5 Department of Sports Science and Clinical Biomechanics, Faculty of HealthSciences, SDU Sport and Health Sciences Cluster, University of Southern Denmark, Odense, Denmark, 6 Facultadde Ciencias de la Actividad Física y del Deporte (INEF), Universidad Politécnica de Madrid, Madrid, Spain
The current study aimed to investigate the evolutionary trends of players’ technicalperformances in the UEFA Champions League. Match statistics of 18 technicalperformance indicators from 1,125 matches (2,489 players, 16,247 full matchobservations) from the group and knockout stages of the UEFA Champions League(season 2009/2010 to 2017/2018) were analysed. Separate Poisson regression modelswere run in the generalised mixed linear modelling to compare the differences intechnical performances among seasons, and the autocorrelation function was used toidentify the correlations within technical variables. Results demonstrated that players’match performances in variables of shots and shots on target showed trivial changesover the nine seasons. The defending related variables showed either downward trendsor negligible changes, and the passing- and attacking-related variables showed differentevolving paths throughout the course of the nine seasons. These findings may indicatethat European teams are now more focussed on the control of match play, creatingoffensive space by increasing passing frequency and accuracy rather than crossingthe ball from the wings into the penalty box. The significant autocorrelations were onlydetected in the attacking- and passing-related variables of crossing, though ball andaerial wins, they displayed persistence patterns among the nine seasons.
Keywords: football, soccer, performance analysis, technical evolution, UEFA Champions League
INTRODUCTION
Football matches are characterised by high dynamicity (Garganta, 2009) where the players’ adapttheir behaviours in the continuous performer–environment interactions (Barreira et al., 2015;Aquino et al., 2017b). Thus, the variability of players’ match performances can be observed andassessed between matches (Bush et al., 2015a; Liu et al., 2016a). The within-season variation wasobserved at a low level (Morgans et al., 2014), but when putting it in a larger timeframe, theplaying patterns of football matches have undergone substantial changes over the past seasonsand will continue to evolve due to the interaction of external factors (Bush et al., 2015b)and intrinsic variation within the human movement (Gonçalves et al., 2014). The modificationof playing rules, the innovation of tactics, and the advancement of technical and physicalpreparation have been reported as the main external contributors of the longitudinal performance
Frontiers in Psychology | www.frontiersin.org 1 June 2020 | Volume 11 | Article 1032
Yi et al. Evolution of Play in UEFA Champions League
changes (Barnes et al., 2014; Wallace and Norton, 2014).Nevertheless, in addition to the causes of performance evolution,it is also important to figure out how the playing patternsevolve during a given period. The patterns of match play can bedescribed by a selection of match actions and events that couldbe valid measurements of various aspects of match performance(O’Donoghue, 2009; McGarry et al., 2013). Naturally, trackingthe longitudinal changes of performance parameters may providea valid way to interpret and quantify the evolution of playingpatterns. Furthermore, technical parameters have been identifiedto be related to the match outcome (Castellano et al., 2012; Liuet al., 2016b). Therefore, the investigation of the evolutionarytrends of technical parameters allows the understanding of howcoaches find the secret to succeed in a match.
To date, literature about the evolution of technical parametersis well documented. Williams et al. (1999) reported that playersfrom the top tier of English football performed more passes,dribbles, and crosses during the period of season 1991/1992 and1997/1998. Subsequent research from Barnes et al. (2014) in theEnglish Premier League found that the total number of passesmade by players per match increased by 40% and the number ofshort and medium passes increased, but long passes varied littleacross the timeframe of the study (season 2006/2007–2012/2013).Furthermore, more detailed research has also been conductedthat attempts to identify the long-term trends of the technicalcharacteristics in European domestic leagues considering theeffects of playing positions (Bush et al., 2015b), team quality(Bradley et al., 2016), player identity (Bush et al., 2017), andmatch outcome (Konefał et al., 2019). However, each nationalleague was characterised by different specificities and behavioursof match play (Dellal et al., 2011; Oberstone, 2011). Thus, theidentified evolutionary dynamics of the match performance ina specific domestic league cannot represent all evolving trendsof match play in modern football. A previous study Wallaceand Norton (2014) analysed the evolution of match play in aninternational competition (FIFA World Cup) over a 44 yearperiod. The research focussed on the longitudinal changes of thegame structure, speed, and play patterns rather than the evolutionof technical parameters.
However, limited technical performance parameters wereanalysed in the abovementioned literature, and the studies weremainly focussed on passing related parameters. These findingsmay provide limited information of the overall evolutionaryprocess of players and teams’ performance. Furthermore, inaddition to the comparison of technical performance amongseasons, the evolving trends of match play could also be identifiedby the measure of the correlations of technical match actionsand events among seasons (Yi et al., 2019a). The autocorrelationfunction (ACF) has been reported as a valid measure (temporalseries) to assess the dynamic correlations among a time series(Prieto et al., 2016). This dynamic time-dependent approach mayprovide a novel insight to assess the temporal relationships withintechnical variables in a specific period of time.
The UEFA Champions League is considered to be one ofthe top international competitions and the participating teamsare top squads from all over Europe, leading the latest trendsin modern football (Liu et al., 2015). Coaches and performance
analysts from these teams have been devoted to the innovationof tactics and strategies in order to improve the players’ matchperformance (Memmert and Rein, 2018). The results from theprevious studies revealed the temporal changes over a specificperiod, but the playing patterns of football matches evolveover time; more recent changes need to be identified based onthe latest database to describe the contemporary trends of thefootball match. Therefore, the current study aims to explore theevolutionary trends of players’ technical parameters in the UEFAChampions League from season 2009/2010 to 2017/2018 andprovide a comprehensive understanding of how the technicalcharacteristics evolve in modern football incorporating the matchperformance of players from different European countries in goalscoring, attacking, passing, and defending aspects.
MATERIALS AND METHODS
Data Source and ReliabilityTechnical match performance data of players in the UEFAChampions League across nine consecutive seasons (2009/2010–2017/2018) were acquired from a public-accessed footballstatistic website called “whoscored.com,1” whose data have beenconsidered highly reliable and were used in previous studies(Liu et al., 2015; Yi et al., 2019b), as the data provider is theOPTA Sports. The inter-operator reliability of the tracking system(OPTA Client System) has been previously verified (Kappavalues > 0.90) with high consistency when repeatedly coding thematch actions and events (Liu et al., 2013). The study design andprocedures were in accordance with the Declaration of Helsinkiand approved by the ethics committee of the local university.
Sample and Technical ParametersThe sample of this study comprises the technical match statisticsof 125 matches per season (total matches analysed = 1,125matches; 2,489 players; and 16,247 players’ observations) in thegroup stage and knockout stage of the UEFA Champions Leaguefrom season 2009/2010 to 2017/2018 (n = 1,808; n = 1,832;n = 1,796; n = 1,800; n = 1,793; n = 1,796; n = 1,809;n = 1,803; and n = 1,810 players’ observations, respectively).Only the outfield players that played at least one full matchwere included for further analysis to make sure that matchobservations could be analysed upon the same time dimension.Eighteen technical performance-related actions and events wereanalysed and classified into three groups of variables (goalscoring, attacking and passing, and defending) in the analysisreferring to the previous studies (Lago-Peñas et al., 2010; Liuet al., 2015; Yi et al., 2019b). The grouping information andoperational definitions of these technical variables are in Table 1.
Statistical AnalysisSeparate Poisson regressions were run in the generalised mixedlinear modelling performing with Proc Glimmix in the UniversityEdition of Statistical Analysis System (version SAS Studio 3.6)used to examine both the differences in technical variables
1https://www.whoscored.com
Frontiers in Psychology | www.frontiersin.org 2 June 2020 | Volume 11 | Article 1032
Yi et al. Evolution of Play in UEFA Champions League
TABLE 1 | Selected technical performance-related match events and actions.
Groups Event or action: operational definition
Variables related to goalscoring
Shot: an attempt to score a goal, made with any(legal) part of the body, either on or off targetShot on target: an attempt to goal which requiredintervention to stop it going in or resulted in agoal/shot which would go in without being diverted
Variables related topassing and organising
Touch: a sum of count values of all actions andevents where a player touches the ballPass: an intentional played ball from one player toanotherPass accuracy (%): successful passes as aproportion of total passesKey pass: the final pass or cross leading to therecipient of the ball having an attempt at goal withoutscoringCross: any ball sent into the opposition team’s areafrom a wide positionLong ball: an attempted pass of 25 yards or moreThrough ball: a pass that split the last line of defenseand plays the teammate through on goalDribble: a dribble is an attempt by a player to beat anopponent in possession of the ball. OPTA also logattempted dribbles where the player overruns the ballAerial won: two players competing for a ball in the air,for it to be an aerial duel both players must jump andchallenge each other in the air and have both feet offthe ground. The player who wins the duel gets theAerial won, and the player who does not gets anAerial lostFouled: where a player is fouled by an opponentOffside: awarded to the player deemed to be in anoffside position where a free kick is awarded. If two ormore players are in an offside position when the passis played, the player considered to be most activeand trying to play the ball is given offside.
Variables related todefending
Tackle: the action of gaining possession from anopposition player who is in possession of the ballInterception: a player intercepts a pass with somemovement or reading of the playClearance: attempt made by a player to get the ballout of the danger zone, when there is pressure (fromopponents) on him to clear the ballFoul: any infringement that is penalised as foul play bya refereeYellow card: where a player was shown a yellow cardby the referee for reasons of foul, persistentinfringement, hand ball, dangerous play, etc.
between seasons and the localised differences verified. The valueof each of the 18 technical performance-related variables wasselected as the dependent variable (Yi et al., 2019c). The fixedeffects estimated the effects of match location (home, away,and neutral), competition stage (group stage and knock-outstage), match outcome (win, draw, and loss) and playing position(central defender, full back, central midfielder, wide midfielder,and forward), as well as the team and opponent strengthestimated by including the difference in the log of the end-of-season UEFA club coefficient as a predictor (Yi et al., 2018). Theplayer identity was employed as the random effect to accountfor the repeated-measure data acquired from players in multiplematches across seasons.
Autocorrelation function was employed to quantify thecorrelations of a technical variable among a time series of nineseasons with its own values (Yi et al., 2019a). The statisticalsoftware IBM SPSS version 25 for Windows (IBM Corp.,Armonk, NY, United States) was used for the analysis. The ACFwas calculated with a lag length of one season, and seven lags werechosen according to the length of the time series. There was notime-offset if lag = 0. The magnitude of the absolute value of ACFwas assessed qualitatively with the following scales: <0.1 trivial,0.1–0.3 small, 0.3–0.5 moderate, 0.5–0.7 large, 0.7–0.9 very large,>0.9 nearly perfect (Hopkins, 2002). Statistical significance wasset at P ≤ 0.5.
Uncertainty in the true effects of the predictors wasevaluated by a combination of null hypothesis significancetesting (P-value) and non-clinical magnitude-based inference. Animplemented spreadsheet accompanying the package of materialsfor generalised mixed modelling with SAS Studio was used forthe evaluation (Hopkins, 2016). The magnitude of meaningfuldifference and the 90% confidence limit were expressed instandardised units, and a standardised effect of 0.2 and −0.2were assumed to be the smallest worthwhile differences. Effectwere considered clear if the 90% confidence limit of the effectsize did not affect the smallest worthwhile differences of 0.2and −0.2 simultaneously. Estimated magnitudes of effect sizeswere quantified by the following scales: <0.2 trivial, 0.2–0.6small, 0.6–1.2 moderate, and 1.2–2.0 large (Hopkins et al., 2009),along with a qualitative likelihood of the clear effects: <0.5%,most unlikely; 0.5–5%, very unlikely; 5–25%, unlikely; 25–75%,possibly; 75–95%, likely; 95–99.5%, very likely; and >99.5%, mostlikely (Hopkins et al., 2009).
RESULTS
Goal Scoring Related VariablesThe number of shots and shots on target showed trivialdifferences across nine seasons (p < 0.9685; effect size(ES) = −0.16, 0.1; likelihood: likely-most likely); shots on targetobserved a relatively greater fluctuation (see Figure 1). Therewere no clear correlations for these variables over the same periodof time (ACF = −0.072 ± 0.215, −0.068 ± 0.191; P = 0.52, 0.575)(see Table 2).
Attacking and Passing Related VariablesSimilar changing trends were observed among touches, passes,and pass accuracy (%) during the timeframe of this study.There were simultaneous increases between season 2009/2010and 2010/2011 (52.76 ± 18.01vs. 56.03 ± 18.76, 36.02 ± 16.32vs. 39.54 ± 17.36, 77.96 ± 9.87 vs. 79.37 ± 9.99; P < 0.0001;ES = 0.18, 0.21, 0.14; likelihood: possibly, possibly, and verylikely), which then remained relatively steady until season2016/2017, where the significant increases were appealed againpeaking at season 2017/2018 (64.06 ± 20.56, 45.20 ± 19.01,81.59 ± 10.16), although trivial increases for pass and passaccuracy were observed between season 2015–2016 and 2016–2017 (40.99 ± 17.79 vs. 42.45 ± 18.21, 79.74 ± 10.03 vs.80.41 ± 10.07; P = 0.0033 and 0.147; ES = 0.08, 0.05; likelihood:
Frontiers in Psychology | www.frontiersin.org 3 June 2020 | Volume 11 | Article 1032
Yi et al. Evolution of Play in UEFA Champions League
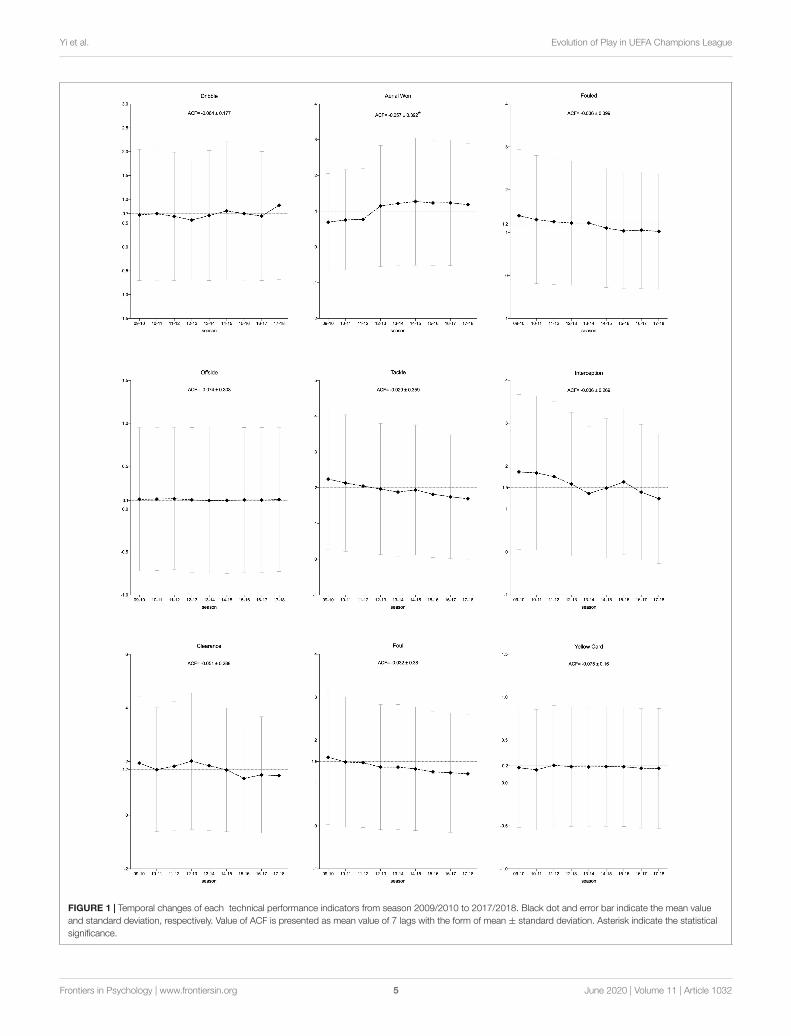
FIGURE 1 | Temporal changes of each technical performance indicators from season 2009/2010 to 2017/2018. Black dot and error bar indicate the mean valueand standard deviation, respectively. Value of ACF is presented as mean value of 7 lags with the form of mean ± standard deviation. Asterisk indicate the statisticalsignificance.
Frontiers in Psychology | www.frontiersin.org 5 June 2020 | Volume 11 | Article 1032
n denotes the number of players’ observations. Results are presented as the form of mean ± standard deviation, representing the average value that players achieved in a full match. Units are counts, except for passaccuracy. The average value was calculated dividing the total number of actions by the number of players’ observations.
Yi et al. Evolution of Play in UEFA Champions League
most likely and most likely). The players’ match performancesin crosses and fouls presented downward trends over the nineseasons. Even though the differences among most of the seasonswere trivial, the number of crosses and fouls of players obtainedper match decreased from 1.26 ± 2.75 and 1.39 ± 1.54 in2009/2010 to 0.91 ± 2.27 and 1.03 ± 1.34 in 2017/2018(P < 0.0001; ES = −0.21, −0.32; likelihood: possibly, most likely).The longitudinal changes in through ball and aerial wins showedopposite trends; there was a pronounced decrease for throughball and an increase for aerial wins in season 2012/2013 comparedto season 2011/2012 (0.17 ± 0.84 vs. 0.11 ± 0.88, 0.77 ± 1.42 vs.1.15 ± 1.69; P < 0.0001; ES = −0.20, 0.29; likelihood: possibly,most likely). Afterwards, both showed negligible changes overfollowing seasons. The number of dribbles varied little withinseason 2009/2010 and 2016/2017, while it significantly increasedby 35% between season 2016/2017 and 2017/2018 (0.65 ± 1.35vs. 0.88 ± 1.56; P < 0.0001; ES = 0.20; likelihood: possibly).Players’ match performances in key passes, long balls, and offsidesvaried by trivial magnitudes across the nine seasons (P < 0.9916;ES = −0.16, 0.16; likelihood: likely-most likely).
Concerning the inter-variable correlations among the nineseasons, the statistical significance was only observed in cross,through ball, and aerial wins (ACF = −0.042 ± 0.415,−0.061 ± 0.419, −0.057 ± 0.392; P = 0.036, 0.021, 0.033) showingtrivial negative correlations among seasons.
Defending Related VariablesContinued momentum of decline can be found in the numberof tackles and fouls of players performed per match, decliningfrom 2.24 ± 1.96, 1.60 ± 1.57 in season 2009/2010 to 1.69 ± 1.71,1.21 ± 1.38 in season 2017/2018 (P < 0.0001; ES = −0.36,−0.32; likelihood: most likely, most likely). Although there werealso general declining trends in interception and clearance,they experienced fluctuations during the nine seasons. Playersachieved more interceptions and clearances (P < 0.0001; ES:−0.47, −0.26; likelihood: most likely, likely) in season 2009/2010(1.86 ± 1.81; 1.94 ± 2.49) compared to season 2017/2018(1.24 ± 1.51; 1.47 ± 2.14), peaking at season 2009/2010(1.86 ± 1.81) and 2012/2013 (2.02 ± 2.55), respectively. Playersshowed a relatively stable match performance in yellow cardsamong these nine seasons (P < 0.9875; ES = −0.10, −0.13;likelihood: very likely-most likely). All defending related variablesshowed non-clear correlations during the studied period of time(ACF = −0.075 ± 0.16 to −0.029 ± 0.359; P = 0.079–0.784).
DISCUSSION
The current study quantified the long-term trends of technicalperformance indicators among seasons aiming to identify thecontemporary evolution of players’ technical characteristicsbased on the latest nine seasons of the UEFA ChampionsLeague. The evolutional process of 18 technical performancerelated indicators regarding goal scoring, attacking and passing,and defending aspects have been demonstrated. The effects ofsituational factors and positional roles were controlled by themodelling to deal with the intrinsic variation within matches.
Coaches and performance analysts have been trying to findways to increase the scoring opportunities and improve theefficiency over years, so the increase in relevant match statistics,therefore, might be expected. However, our research on theplayers from the UEFA Champions League demonstrated thattheir match performances in variables of shots and shots on targetshowed trivial changes over the last nine seasons. This findingis in line with a study on the English Premier League fromBarnes et al. (2014) in which the evolutionary trends of players’technical performance were identified based on a period ofseven consecutive seasons. Nevertheless, opposite changes wereobserved in Germany’s Bundesliga, the number of total shotsdecreased among playing positions during season 2014/2015 to2016/2017 (Konefał et al., 2019). This disparity may be due tothe relatively smaller database used (three seasons); the identifiedlongitudinal performance characteristics cannot be comparedwith the seven-season and nine-season period studies. Theresults among studies may be more consistent by expanding thetimeframe of the study on the German Bundesliga.
Although the number of shots and shots on target variedlittle, the number of touches and passes players performed permatch increased over the last nine seasons. This trend partlycontrasts with the research by Tenga et al. (2010) who arguedthat longer passing sequences could produce more shots perpossession. This may indicate that the increase in the frequencyof passes cannot directly bring more scoring opportunities,the ability of creating offensive space and sending the ballinto the scoring area may play an important role (Collet,2013). This statement could be supported by the changes ofkey pass and through balls as these two match performanceindicators can describe the key situations during match play.The evolving technical characteristics of the increase of passingfrequency may possibly be driven by the prevalence of possessionplay (Aquino et al., 2017a; Yi et al., 2019b), whereas howto decrease unwanted passes and improve offensive efficiencyare key issues for teams that employ this tactical approachto consider during the coaching process (Alves et al., 2019).These evolving trends are further supported by the changes inthe number of crosses and long balls. These variables showeda relentless decline and a limited fluctuation, respectively,among nine seasons, which means that players performedmore short passes and medium passes, so the pass accuracywas increased accordingly. Similar findings were reported in aprevious study on the English Premier League (Barnes et al.,2014). This indicates that the passing tempo increased duringthe period of nine seasons and teams tended to play a moreelaborate match.
The changes of passing actions may also influence players’performance in attacking behaviours. The players’ stableperformance in offside could be considered as a result of theminimal changes of the key pass and through balls over thesame period, as these two technical performance indicators areusually associated with the offside situations. The number ofkey passes fluctuated within a narrow range, and the meannumber of through balls players achieved per match remainedat a relatively low level, although there was a clear decreasein season 2012/2013. Combining this result with the feature of
Frontiers in Psychology | www.frontiersin.org 7 June 2020 | Volume 11 | Article 1032
Yi et al. Evolution of Play in UEFA Champions League
the occurrence rate of offsides during a match may explain thelow variation of offsides over the nine seasons. Another concernis that the number of crosses continuously decreased and thenumber of long balls slightly changed among the period ofnine seasons, while the percentage of the aerial wins observed asignificant increase, especially from the season 2012/2013. Thisresult is in line with the study of Konefał et al. (2019) on theGerman Bundesliga. As the aerial duels usually occurred fromcrosses and long balls (Liu et al., 2016a), our findings may indicatethat the decrease of the crosses has a negative impact on theappearance of the aerial duels. However, this finding should beinterpreted with caution, because the underlying causes need tobe verified and more insight is needed to interpret the substantialincrease in the last six seasons.
The occurrence frequency of dribbling was relatively stable inthe first eight seasons and then suddenly increased in the lastseason. This finding is not in accordance with the research madeby Williams et al. (1999), who reported that the incidence ofdribbling in the English league increased from season 1991/1992to 1997/1998. Future research is needed given that dribbling isan important performance indicator explaining players’ technicalcharacteristics and tactical roles during match play. Anotherinteresting finding of our analysis is that the number of playerswho were fouled during a match showed a steady declineduring the timeframe of the current study. Together with thefindings in defensive performance indicators, the number oftackles and fouls also showed a similar downward trend andthe number of yellow cards remained stable among the nineseasons. These findings support the notion of Oberstone (2011)that players played football more cleanly. The modificationof rules could be one of the potential reasons for this data.The rules of the game are being tweaked over time as thelawmakers continue to figure out the best way to regulate thebehaviour of players on the pitch, especially in controversialand confrontational situations involving opponents or matchofficials. The downward trends could also be found in thenumber of interceptions and clearances, even though fluctuationswere seen. These findings may reflect the way teams’ defencehas changed over time, rather than the retrogress of players’defensive abilities. The defensive manners of teams are evolvingin the direction of joint actions, which can improve theeffectiveness of the defence.
Autocorrelation functions of technical variables provideimportant understanding from another perspective to depict howplaying patterns evolve. A prior study investigated the long-term trends of the variation of technical variables in the UEFAChampions League and reported that the variation of throughballs displayed trivial negative autocorrelation throughout atime period of eight seasons (2009/2010–2016/2017) (Yi et al.,2019a). This finding was also identified in the current study,where crosses, through balls, and aerial wins showed substantialnegative correlations among nine seasons, while the temporalrelationships within other variables have not been detected.The lower ACF value indicates less persistence among a timeseries (Prieto et al., 2017). However, the magnitudes of theautocorrelations were trivial, which may still provide usefulinsights about the patterns of these three variables to describe the
dynamic trends of technical performances. These findings maymean that the more unstable the performance of the players in theform of crosses, through balls, and aerial duels won in a season,the more stable the performance could be of these variables inthe following season. Thus, these susceptible variables should betreated by coaches with care.
CONCLUSION
The current study investigated the evolving patterns of players’technical performance indicators based on a dataset of nineseasons from the UEFA Champions League. Disparities existin the evolutionary patterns between technical performanceindicators of goal scoring, passing, organising, and defending.Players performed an increasing number of passes per match,especially short passes, with no change in the number of shotsand shots on target. Teams are now more focussed on controllingthe match and creating offensive space by increasing the passingfrequency and accuracy, rather than crossing the ball from thewings into the penalty box. However, the progression of theability of creating scoring opportunities was not observed andthe success rate of aerial duel increased. We also found thatall defending related indicators did not show upward trendsduring the nine seasons. The number of players who were fouleddecreased during the match and teams organised their defencecollectively in a group-tactical way to enhance the effectiveness ofdefensive actions. Besides, only the attacking and passing relatedvariables of crosses, through balls, and aerial wins demonstrateda certain degree of persistence over the nine seasons.
Practical ApplicationsWe tracked the temporal trends of the technical matchperformances of contemporary elite football and the longitudinalchanges were quantified across a period of nine seasons. Weprovided important evidence to explain how and why thetechnical aspect of match-play evolve. The identified evolvingcharacteristics could provide a holistic understanding forcoaches and performance analysts to fine-tune their performanceknowledge about the matches in the UEFA Champions League.The key performance indicators such as shots on target, keypasses, and through balls should be treated with care; specialinterventions are needed to improve players’ match performancetowards these indicators. Teams could also diagnose and optimisetheir tactics and strategies according to the identified trends.For example, the current study reported that the number ofpasses increased while the number of crosses decreased, whichmay provide references for teams in the disposition of defensivetactics. However, this study failed to consider the effects ofplaying positions and situational variables, thus some importantinformation was masked as the differences exist in players’tactical roles and duties and in the technical behaviours whenplaying in different situations. Future research regarding theinvestigation of evolving trends of technical indicators shouldtake players’ positions on the pitch and the competing situationsinto account, which may contribute to more practical insights.Moreover, further research is needed to explore the causative
Frontiers in Psychology | www.frontiersin.org 8 June 2020 | Volume 11 | Article 1032
Yi et al. Evolution of Play in UEFA Champions League
factors underlying the temporal changes in players’ technicalperformance. The modification of rules, the improvement of skillexecution, and the innovation of tactics may help to explain thedynamic changes.
DATA AVAILABILITY STATEMENT
All datasets generated for this study are included in thearticle/supplementary material.
ETHICS STATEMENT
The studies involving human participants were reviewed andapproved by Shanghai University of Sport. Written informedconsent for participation was not required for this study inaccordance with the national legislation and the institutional
requirements. Written informed consent was not obtained fromthe individual(s) for the publication of any potentially identifiableimages or data included in this article.
AUTHOR CONTRIBUTIONS
QY, M-ÁG, and HL: conceptualisation and methodology. HL:software. QY: data collection, writing – original draft preparation,visualisation, and funding acquisition. HL, GN, and M-ÁG:writing – review and editing and supervision.
FUNDING
QY was supported by the Shanghai Key Lab of HumanPerformance (Shanghai University of Sport) under GrantNo. 11DZ2261100.
REFERENCESAlves, D. L., Osiecki, R., Palumbo, D. P., Moiano-Junior, J. V., Oneda, G., and
Cruz, R. (2019). What variables can differentiate winning and losing teams inthe group and final stages of the 2018 FIFA World Cup? Int. J. Perform. Anal.Sport 19, 248–257. doi: 10.1080/24748668.2019.1593096
Aquino, R., Manechini, J. P., Bedo, B. L., Puggina, E. F., and Garganta, J. (2017a).Effects of match situaional variables on possession: the case of England PremierLeague season 2015/16. Motriz 23:3.
Aquino, R., Puggina, E. F., Alves, I. S., and Garganta, J. (2017b). Skill-relatedperformance in soccer: a systematic review. Hum. Mov. 18, 3–24.
Barnes, C., Archer, D. T., Hogg, B., Bush, M., and Bradley, P. S. (2014). The evolu-tion of physical and technical performance parameters in the English PremierLeague. Int. J. Sports Med. 35, 1095–1100. doi: 10.1055/s-0034-1375695
Barreira, D., Garganta, J., Castellano, J., Machado, J., and Anguera, M. T. (2015).How elite-level soccer dynamics has evolved over the last three decades?: inputfrom generalizability theory. Cuadernos Psicol. Deporte 15, 51–62. doi: 10.4321/s1578-84232015000100005
Bradley, P. S., Archer, D. T., Hogg, B., Schuth, G., Bush, M., Carling, C., et al.(2016). Tier-specific evolution of match performance characteristics in theEnglish Premier League: it’s getting tougher at the top. J. Sports Sci. 34, 980–987.doi: 10.1080/02640414.2015.1082614
Bush, M., Archer, D. T., Barnes, C., Hogg, B., and Bradley, P. S. (2017). Longitudinalmatch performance characteristics of UK and non-UK players in the EnglishPremier League. Sci. Med. Football 1, 2–9. doi: 10.1080/02640414.2016.1233347
Bush, M., Archer, D. T., Hogg, R., and Bradley, P. S. (2015a). Factors influencingphysical and technical variability in the English Premier League. Int. J. SportsPhysiol. Perform. 10, 865–872. doi: 10.1123/ijspp.2014-0484
Bush, M., Barnes, C., Archer, D. T., Hogg, B., and Bradley, P. S. (2015b). Evolutionof match performance parameters for various playing positions in the EnglishPremier League. Hum. Mov. Sci. 39, 1–11. doi: 10.1016/j.humov.2014.10.003
Castellano, J., Casamichana, D., and Lago, C. (2012). The use of match statisticsthat discriminate between successful and unsuccessful soccer teams. J. Hum.Kinet. 31, 137–147. doi: 10.2478/v10078-012-0015-7
Collet, C. (2013). The possession game? A comparative analysis of ball retentionand team success in European and international football, 2007–2010. J. SportsSci. 31, 123–136. doi: 10.1080/02640414.2012.727455
Dellal, A., Chamari, K., Wong, D. P., Ahmaidi, S., Keller, D., Barros, R., et al.(2011). Comparison of physical and technical performance in European soccermatch-play: FA Premier League and La Liga. Eur. J. Sport Sci. 11, 51–59. doi:10.1080/17461391.2010.481334
Garganta, J. (2009). Trends of tactical performance analysis in team sports:bridging the gap between research, training and competition. Rev. PortuguesaCiências Desporto 9, 81–89. doi: 10.5628/rpcd.09.01.81
Gonçalves, B. V., Figueira, B. E., Maçãs, V., and Sampaio, J. (2014). Effect of playerposition on movement behaviour, physical and physiological performancesduring an 11-a-side football game. J. Sports Sci. 32, 191–199. doi: 10.1080/02640414.2013.816761
Hopkins, W., Marshall, S., Batterham, A., and Hanin, J. (2009). Progressivestatistics for studies in sports medicine and exercise science. Med. Sci. SportsExerc. 41:3. doi: 10.1249/mss.0b013e31818cb278
Hopkins, W. G. (2002). A scale of magnitudes for effect statistics. A new view ofstatistics Am. J. Sports Sci. Med. 5, 21–26.
Hopkins, W. G. (2016). SAS (and R) for mixed models. Sportscience 20.Konefał, M., Chmura, P., Zajac, T., Chmura, J., Kowalczuk, E., and Andrzejewski,
M. (2019). Evolution of technical activity in various playing positions, inrelation to match outcomes in professional soccer. Biol. Sport 36:181. doi:10.5114/biolsport.2019.83958
Lago-Peñas, C., Lago-Ballesteros, J., Dellal, A., and Gómez, M. (2010). Game-related statistics that discriminated winning, drawing and losing teams fromthe Spanish soccer league. J. Sports Sci. Med. 9:288.
Liu, H., Gómez, M.-A., Gonçalves, B., and Sampaio, J. (2016a). Technicalperformance and match-to-match variation in elite football teams. J. Sports Sci.34, 509–518. doi: 10.1080/02640414.2015.1117121
Liu, H., Hopkins, W. G., and Gómez, M.-A. (2016b). Modelling relationshipsbetween match events and match outcome in elite football. Eur. J. Sport Sci.16, 516–525. doi: 10.1080/17461391.2015.1042527
Liu, H., Hopkins, W., Gómez, A. M., and Molinuevo, S. J. (2013). Inter-operator reliability of live football match statistics from OPTA Sportsdata.Int. J. Perform. Anal. Sport 13, 803–821. doi: 10.1080/24748668.2013.11868690
Liu, H., Yi, Q., Giménez, J.-V., Gómez, M.-A., and Lago-Peñas, C. (2015).Performance profiles of football teams in the UEFA Champions Leagueconsidering situational efficiency. Int. J. Perform. Anal. Sport 15, 371–390.doi: 10.1080/24748668.2015.11868799
McGarry, T., O’Donoghue, P., and Sampaio, J. (2013). Routledge Handbook ofSports Performance Analysis. Abingdon: Routledge.
Memmert, D., and Rein, R. (2018). Match analysis, big data and tactics: currenttrends in elite soccer. German J. Sports Med. 69, 65–72. doi: 10.5960/dzsm.2018.322
Morgans, R., Adams, D., Mullen, R., McLellan, C., and Williams, M. D. (2014).Technical and physical performance over an English championship leagueseason. Int. J. Sports Sci. Coach. 9, 1033–1042. doi: 10.1260/1747-9541.9.5.1033
Oberstone, J. (2011). Comparing team performance of the English premier league,Serie A, and La Liga for the 2008-2009 season. J. Quant. Anal. Sports 7,1–18.
O’Donoghue, P. (2009). Research Methods for Sports Performance Analysis.Abingdon: Routledge.
Frontiers in Psychology | www.frontiersin.org 9 June 2020 | Volume 11 | Article 1032
Yi et al. Evolution of Play in UEFA Champions League
Prieto, J., García, J., and Ibáñez, S. J. (2017). Scoring coordination patterns inbasketball international championships of national teams. Rev. Psicol. Deporte26, 27–32.
Prieto, J., Gómez, M. -Á, and Sampaio, J. (2016). Game-scoring coordination inhandball according to situational variables using time series analysis methods.Int. J. Perform. Anal. Sport 16, 40–52. doi: 10.1080/24748668.2016.11868869
Tenga, A., Ronglan, L. T., and Bahr, R. (2010). Measuring the effectiveness ofoffensive match-play in professional soccer. Eur. J. Sport Sci. 10, 269–277.doi: 10.1080/17461390903515170
Wallace, J. L., and Norton, K. I. (2014). Evolution of World Cup soccer finalgames 1966–2010: game structure, speed and play patterns. J. Sci. Med. Sport17, 223–228. doi: 10.1016/j.jsams.2013.03.016
Williams, A., Lee, D., and Reilly, T. (1999). A Quantitative Analysis of MatchesPlayed in the 1991–92 and 1997–98 Seasons. London: The Football Association.
Yi, Q., Gómez, M. -Á, Liu, H., and Sampaio, J. (2019a). variation of matchstatistics and football teams’match performance in the group stage of the UEFAchampions league from 2010 to 2017. Kinesiology 51, 170–181. doi: 10.26582/k.51.2.4
Yi, Q., Gómez, M. A., Wang, L., Huang, G., Zhang, H., and Liu, H. (2019b).Technical and physical match performance of teams in the 2018 FIFA World
Cup: effects of two different playing styles. J. Sports Sci. 37, 2569–2577. doi:10.1080/02640414.2019.1648120
Yi, Q., Groom, R., Dai, C., Liu, H., and Gomez Ruano, M. A. (2019c). Differences intechnical performance of players from’the big five’European football leagues inthe UEFA Champions League. Front. Psychol. 10:2738. doi: 10.3389/fpsyg.2019.02738
Yi, Q., Jia, H., Liu, H., and Gómez, M. Á (2018). Technical demands of differentplaying positions in the UEFA Champions League. Int. J. Perform. Anal. Sport18, 926–937. doi: 10.1080/24748668.2018.1528524
Conflict of Interest: The authors declare that the research was conducted in theabsence of any commercial or financial relationships that could be construed as apotential conflict of interest.