260
eVSM - The easiest way to visualize the value stream Value Stream Maps Spaghetti Diagrams Communication Circles A3 Reports Mold Handles Sharpen Drill Assemble Cardboard Boxes

eVSM - The easiest way to visualize the value stream
Value Stream Maps
Spaghetti Diagrams
Communication Circles
A3 Reports
Mold Handles
Sharpen
Drill
Assemble
Cardboard Boxes

13 November 2011
Table Of Contents
1. The eVSM Environment 4
2. Quick Manufacturing 16
3. Quick Services 46
4. Quick Healthcare 70
5. Quick MCTLite 98
6. Quick MCT 114
7. Drawing Value Stream Maps 130
8. eVSM Data Link 144
9. Drawing Spaghetti Diagrams 148
10. Drawing Communication Circles 152
11. Creating A3 Reports 156
12. Using Gadgets to Visualize Data 160
13. Standardizing Value Stream Maps 170
14. Analyzing with eVSM 184
15. Working with Tables 210
2 2

Table Of Contents
16. Plotting VSM Charts 214
17. Stencil Maker 228
18. Managing Improvements 238
19. Sharing with eVSM 242
Toolbar Button Index 246
Icons Index 248
General Index 256
3 3

1. The eVSM Environment
Start eVSM
The best way to start a blank value stream map is to double-click the eVSM icon on your desktop.
Starting eVSM
If your Visio security setting is set to anything but low, messages will come up asking for permission to “Enable Macros”. You must answer “Yes” to these messages for eVSM to operate.
eVSM Pre-requisites and Updates
eVSM requires Windows 2000/XP/Vista/Win7, Visio 2003-2010 (32-bit), and Excel 2000-2010 (32-bit). You can check on the latest eVSM version available at:
www.evsm.com/updates
Help Movies
These and other short movies about using eVSM are available at www.evsm.com/help
Start Drawing
1. The eVSM Environment4 4
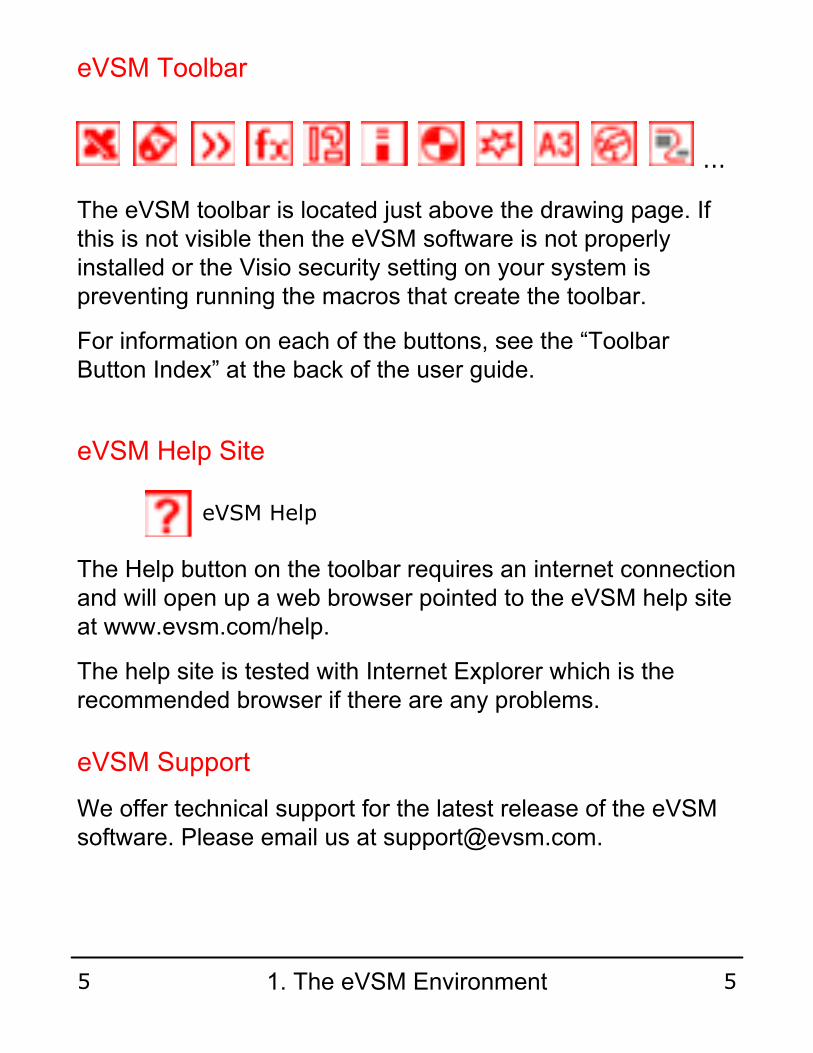
eVSM Toolbar
The eVSM toolbar is located just above the drawing page. If this is not visible then the eVSM software is not properly installed or the Visio security setting on your system is preventing running the macros that create the toolbar.
For information on each of the buttons, see the “Toolbar Button Index” at the back of the user guide.
eVSM Help
The Help button on the toolbar requires an internet connection and will open up a web browser pointed to the eVSM help site at www.evsm.com/help.
The help site is tested with Internet Explorer which is the recommended browser if there are any problems.
eVSM Help Site
eVSM Support
We offer technical support for the latest release of the eVSM software. Please email us at [email protected].
...
1. The eVSM Environment5 5

eVSM has a collection of value stream mapping shapes that appear in eVSM stencilsto the left of the drawing page.
These shapes, behaviors, and corresponding functions have been designed from the outset to support the series of lean workbooks from the Lean Enterprise Institute (www.lean.org) , the Lean Enterprise Academy (www.leanuk.org) and their worldwide network partners. The primary workbook impacting the design has been “Learning To See”.
As software usage has become widespread across multiple industries, the icon language has been extended to keep pace with practitioner requests. For Lean Healthcare implementations, the software now supports all publications developed by Lean Healthcare West (www.leanhealthcarewest.com).
To make it easier to navigate the comprehensive set of shapes, they have been organized into family stacks (blue icons in the stencil) and into the subset stencils.
eVSM Shapes & Stencils
eVSM v5
Quick Mfg
Quick Services
Quick Healthcare
1. The eVSM Environment6 6
Re-opening eVSM Stencils
eVSM Stencils must always be kept open when working with maps. If you have “lost” the eVSM stencils from your drawing file, here are the steps to re-open them.
In Visio 2003/2007:
Click “File > Shapes > Open Stencil…”
Navigate to the following folder:
“C:\Program Files\GumshoeKI\Visio2002\Setup\Solutions”
Select all the eVSMIcons.vss stencil file in this folder and then click the Open button.
Save your Visio file so it “remembers” this stencil for next time.
In Visio 2010:
In the Shapes pane (on left) click "More Shapes > Open Stencil..."
Follow the same steps as above.
Note that on 64-bit Windows, the file location is:
"C:\Program Files(x86)\GumshoeKI\Visio2002\Setup\Solutions"
1. The eVSM Environment7 7
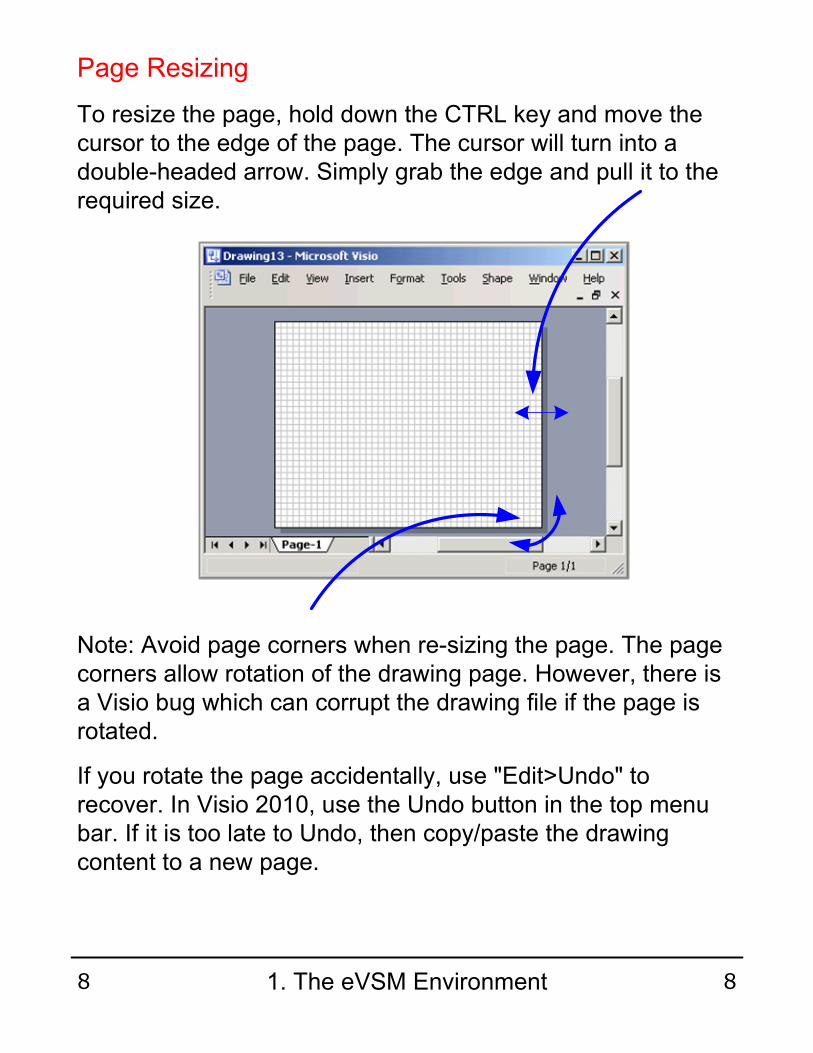
To resize the page, hold down the CTRL key and move the cursor to the edge of the page. The cursor will turn into a double-headed arrow. Simply grab the edge and pull it to the required size.
Page Resizing
Note: Avoid page corners when re-sizing the page. The page corners allow rotation of the drawing page. However, there is a Visio bug which can corrupt the drawing file if the page is rotated.
If you rotate the page accidentally, use "Edit>Undo" to recover. In Visio 2010, use the Undo button in the top menu bar. If it is too late to Undo, then copy/paste the drawing content to a new page.
1. The eVSM Environment8 8

Drag & Drop
OutsideSource
Drag and drop eVSM icons from the stencil onto the drawing page.
Blue icons represent stacks of shapes. Access the stack by dragging out the shape and then clicking the right mouse button.
Resizing Shapes
Shapes are designed to be grid-sized. The drawing page has a grid on it. Use “View > Grid” to turn grid visibility on. Snap shapes to grid locations for easy alignment.
Cross DockIn_Store StorageMoment_Of_TruthPicture ProcessProcessProcess CellProduction ControlRework ProcessShared ProcessWarehouse
Process
Snap To Grid
Avoid resizing shapes whenever possible. Shapes are designed to fit together and resizing a shape will make “fitting” shapes together difficult and create extra work.
1. The eVSM Environment9 9

ValueName Unit
ValueName Unit
Connecting Shapes - Glue
eVSM shapes have built-in connection points on their boundaries that allow them to be glued together. Gluing shapes together has two uses:
It makes modifying the map simpler because moving a parent shape causes the child shape to move with it.
eVSM infers association between shapes by looking at the parent-child glue connections between shapes.
Process
Process
Visio shows a glue connection at the point of gluing with a red box. When the arrow head is moved to a point where Visio is about to glue it to the lower process block, a red box is temporarily displayed.
Process
Similar to connecting arrows, the red box appears when you move a data shape to the bottom of an activity shape.
Process
When a child shape is glued to a parent and you select the child shape you will see some red dots on its periphery to indicate that it is glued.
eVSM Glue Check On/Off
Toggle the Glue Check button in the toolbar for a visual display of the glue connections.
1. The eVSM Environment10 10

Manipulating Text
All shapes in Visio can have their own text. This includes eVSM Connector Arrows.
Text Block Tool
Caution: Be sure to de-select the Text Block Tool when finished.
Text on
Conne
ctor
Twice per week
Double-click a shape to edit its text.
The Visio Text Block Tool (located behind the Text Tool in the Visio Standard toolbar) can be used to move the text relative to the shape location.
The Text Block Tool displays control handles around the text belonging to a shape. These control handles can be used to position and size the text block.
Twice per week
Twice per week
Double-click a shape to edit its text.
Text Editing
1. The eVSM Environment11 11
Copying Shapes
“Edit>Copy” followed by “Edit>Paste” (or Ctrl+C and Ctrl+V) work in Visio just like any other Windows program.
Another method is to hold the Ctrl key down, and then move one or more shapes to create duplicates. You must keep the Ctrl key pressed for this to work. Otherwise you will just end up moving the original shapes.
Undoing Mistakes
The Visio toolbar has an “Undo” button to reverse any mistakes (also, “Edit>Undo”)
Visio Pages
Rules for Visio drawing page naming:
Page names must start with an alpha character
Page names must be limited to 0-9 and A-Z characters. Characters such as [!@#$%^&*()|+-?] are not allowed
Page names should be kept as short as possible
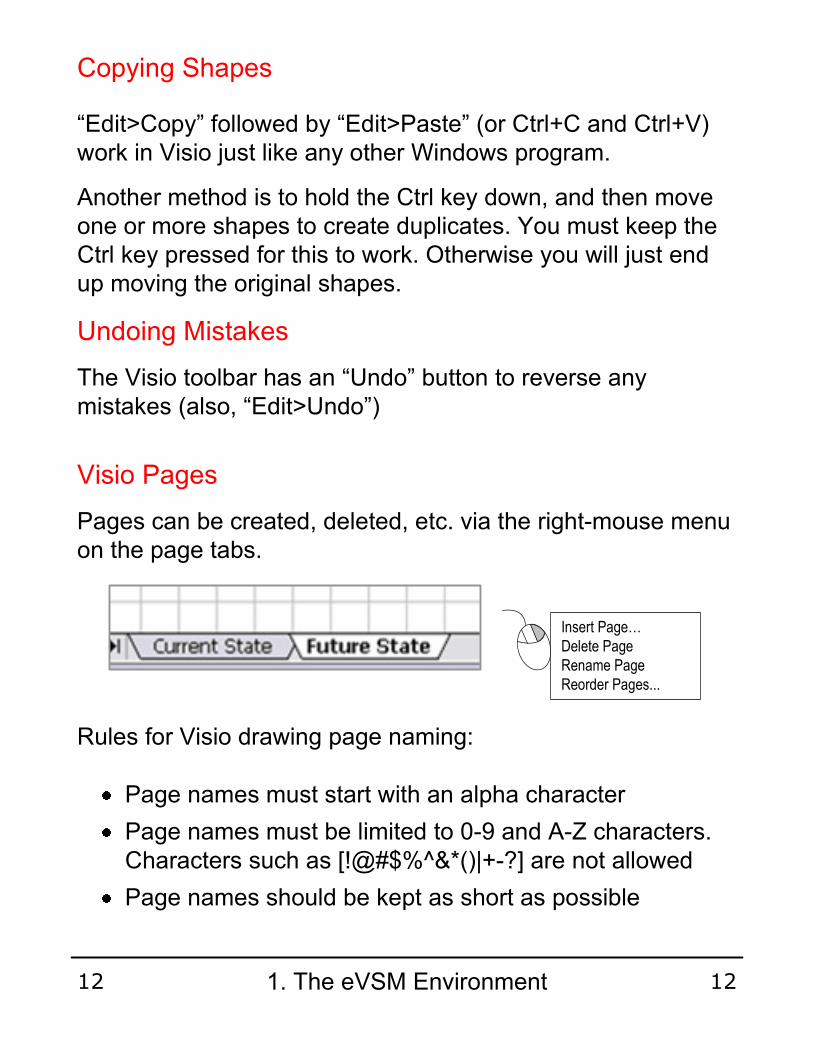
Insert Page…Delete PageRename PageReorder Pages...
Pages can be created, deleted, etc. via the right-mouse menu on the page tabs.
1. The eVSM Environment12 12
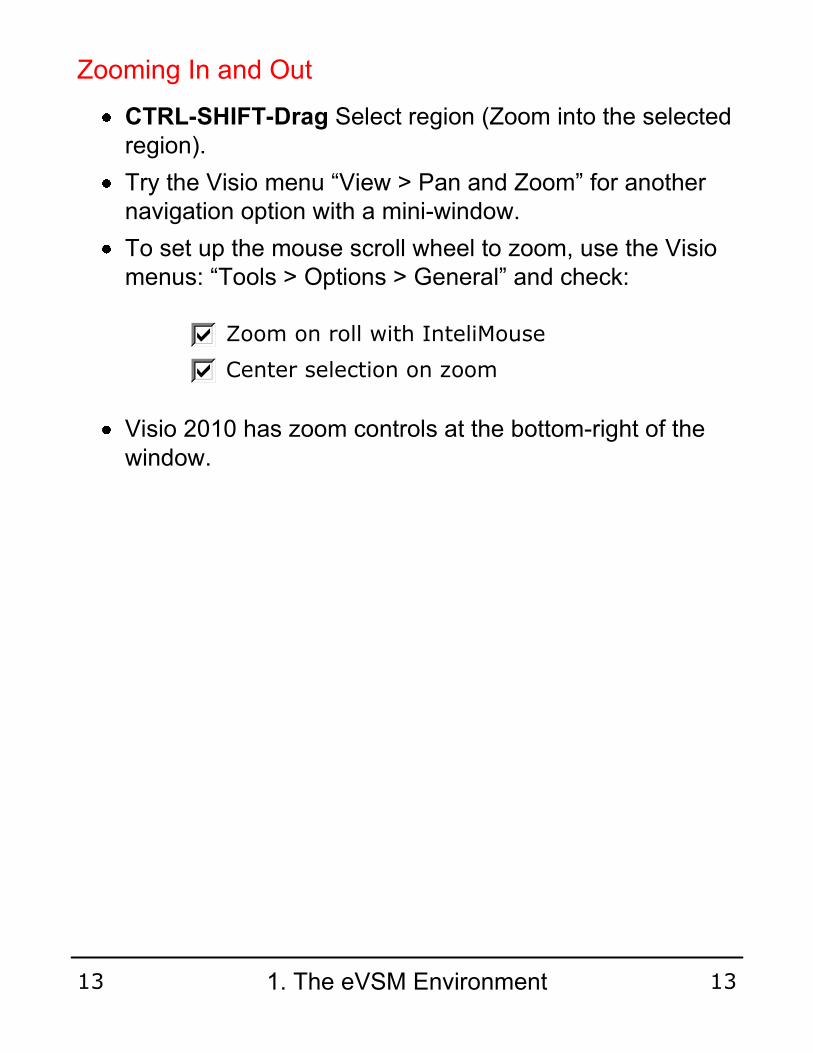
CTRL-SHIFT-Drag Select region (Zoom into the selected region).
Try the Visio menu “View > Pan and Zoom” for another navigation option with a mini-window.
To set up the mouse scroll wheel to zoom, use the Visio menus: “Tools > Options > General” and check:
Visio 2010 has zoom controls at the bottom-right of the window.
Zooming In and Out
Zoom on roll with InteliMouse
Center selection on zoom
1. The eVSM Environment13 13

DO glue everything and use Glue Check button.
DON’T resize eVSM Shapes whenever possible.
DO Snap shapes to grid locations.
DON’T close eVSM Stencils.
DO zoom in fast with CTRL-SHIFT-Drag.
DO zoom out quickly with CTRL-W. NOTE: In Visio 2010, use CTRL-SHIFT-W. CTRL-W will close the page.
DO use a mouse to be productive with eVSM.
1. The eVSM Environment14 14

This area intentionally left blank
1. The eVSM Environment15 15

2. Quick Manufacturing
Quick eVSM denotes stencils that are built on eVSM to simplify, standardize, and speed up creation of value stream maps in an application area. The ‘Quick Mfg’ stencil in eVSM v5 has been built for VSMs at a plant level.
What is Quick eVSM ?
Macro Shape
Watch a movie about using the Quick Mfg stencil.
Auto Day
xxQueue Day
Type
A020 1
Download Visio file containing example maps created with the Quick Mfg stencil.
Quick Mfg Stencil
2. Quick Manufacturing16 16
Can Quick eVSM stencils be used on existing maps ?
You can only use the Quick eVSM stencils for completely NEW maps. The stencils rely on a standard set of names, units, and eqn’s that old maps will not be compliant to.
Quick eVSM Stencils : Icon Colors
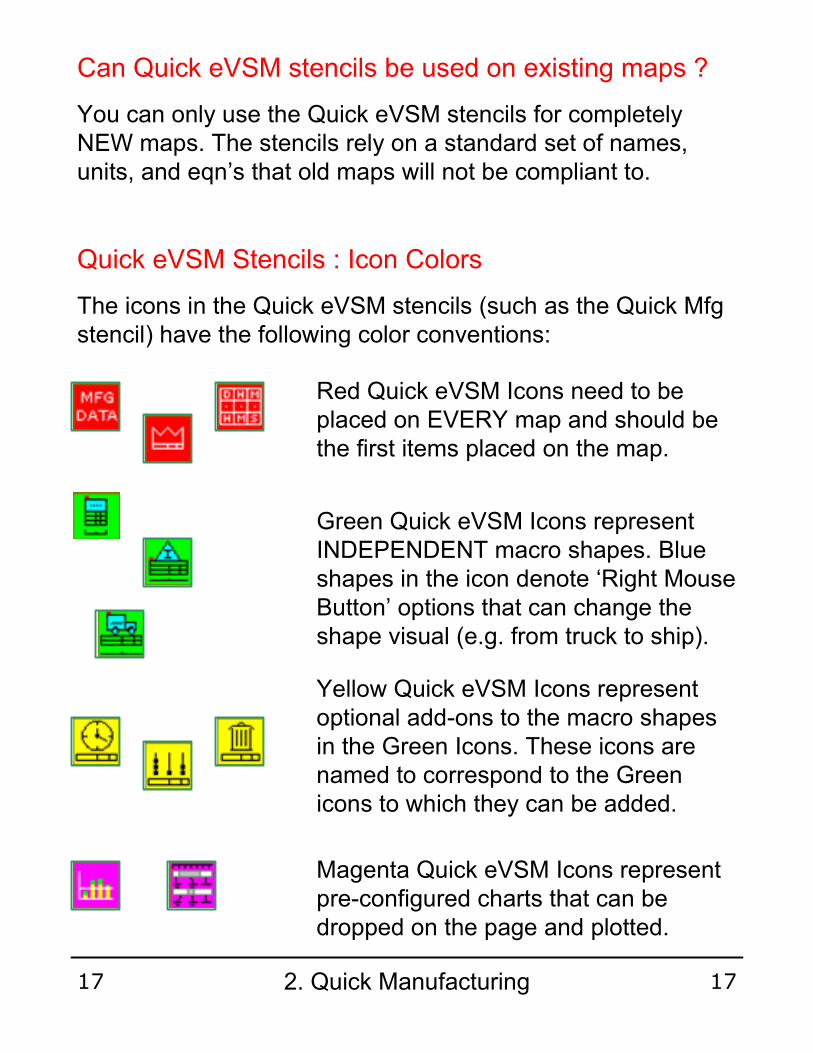
The icons in the Quick eVSM stencils (such as the Quick Mfg stencil) have the following color conventions:
Red Quick eVSM Icons need to be placed on EVERY map and should be the first items placed on the map.
Green Quick eVSM Icons represent INDEPENDENT macro shapes. Blue shapes in the icon denote ‘Right Mouse Button’ options that can change the shape visual (e.g. from truck to ship).
Yellow Quick eVSM Icons represent optional add-ons to the macro shapes in the Green Icons. These icons are named to correspond to the Green icons to which they can be added.
Magenta Quick eVSM Icons represent pre-configured charts that can be dropped on the page and plotted.
2. Quick Manufacturing17 17

Recommended Layout for Quick eVSM
Note that the main eVSM stencil (typically named eVSM vX.XX) is on the left of the screen. We will refer to this as the “Main Stencil”. Its important that this stencil is never closed because closing it disables eVSM toolbar functions.
2. Quick Manufacturing18 18
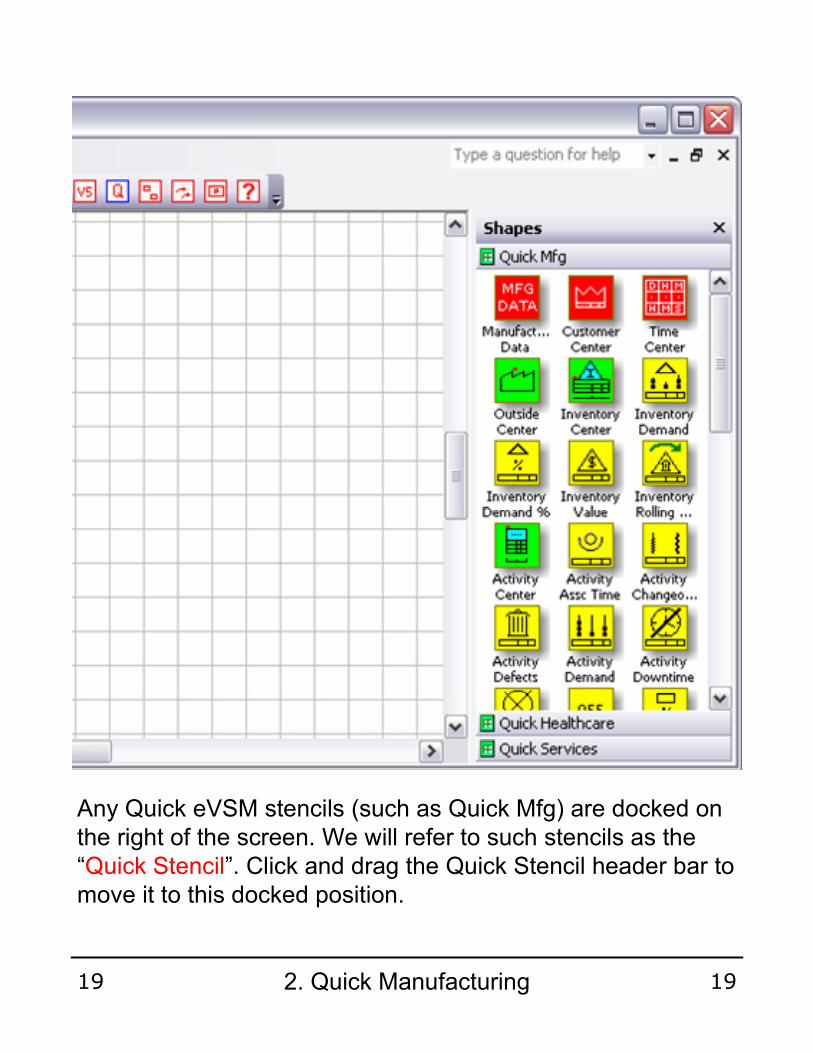
Any Quick eVSM stencils (such as Quick Mfg) are docked on the right of the screen. We will refer to such stencils as the “Quick Stencil”. Click and drag the Quick Stencil header bar to move it to this docked position.
2. Quick Manufacturing19 19
Icon Help
Quick eVSM Icons all have associated help text that is visible if you hold your mouse over the appropriate icon in the stencil.
Drag and Drop Behavior
When you drag and drop an icon on the page it creates either a single shape or a macro shape (a set of connected Shapes).
Red, green, and magenta icons are independent and do not need to be attached to other items when they are being dropped on the page.
Yellow icons represent add-on shapes. They need to be positioned and attached to their parent shape as part of the drag & drop process.
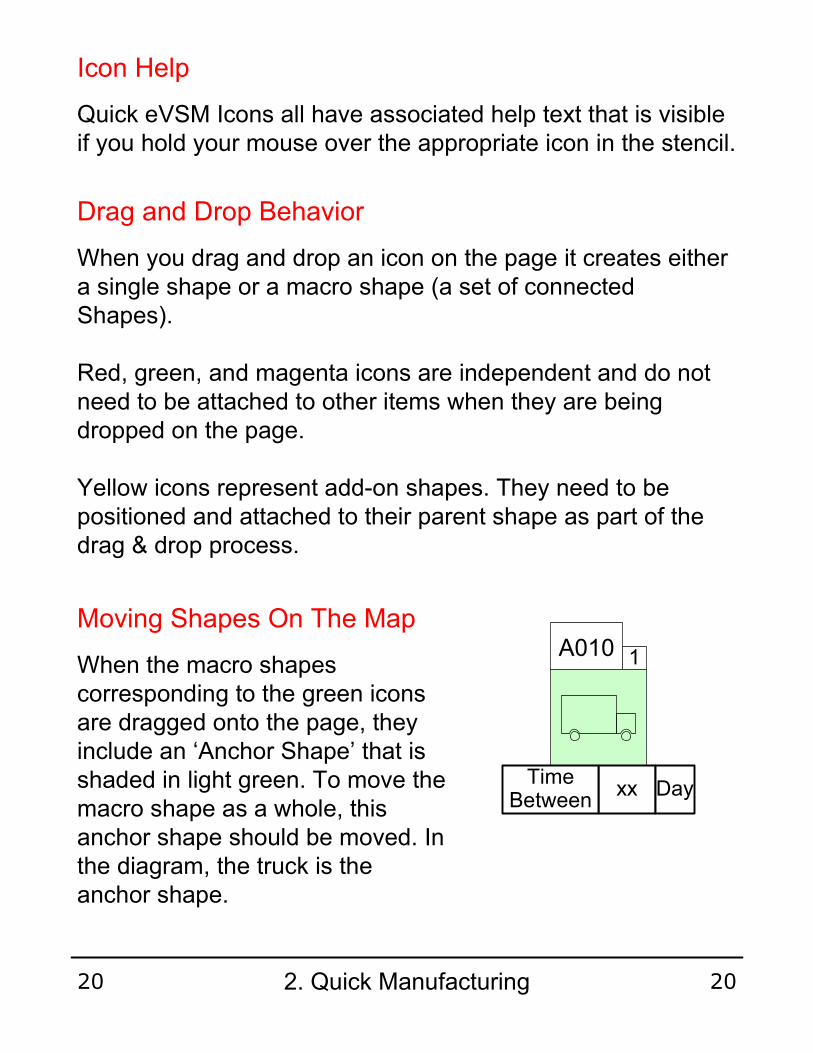
When the macro shapes corresponding to the green icons are dragged onto the page, they include an ‘Anchor Shape’ that is shaded in light green. To move the macro shape as a whole, this anchor shape should be moved. In the diagram, the truck is the anchor shape.
Moving Shapes On The Map
xxTime
BetweenDay
A010 1
2. Quick Manufacturing20 20
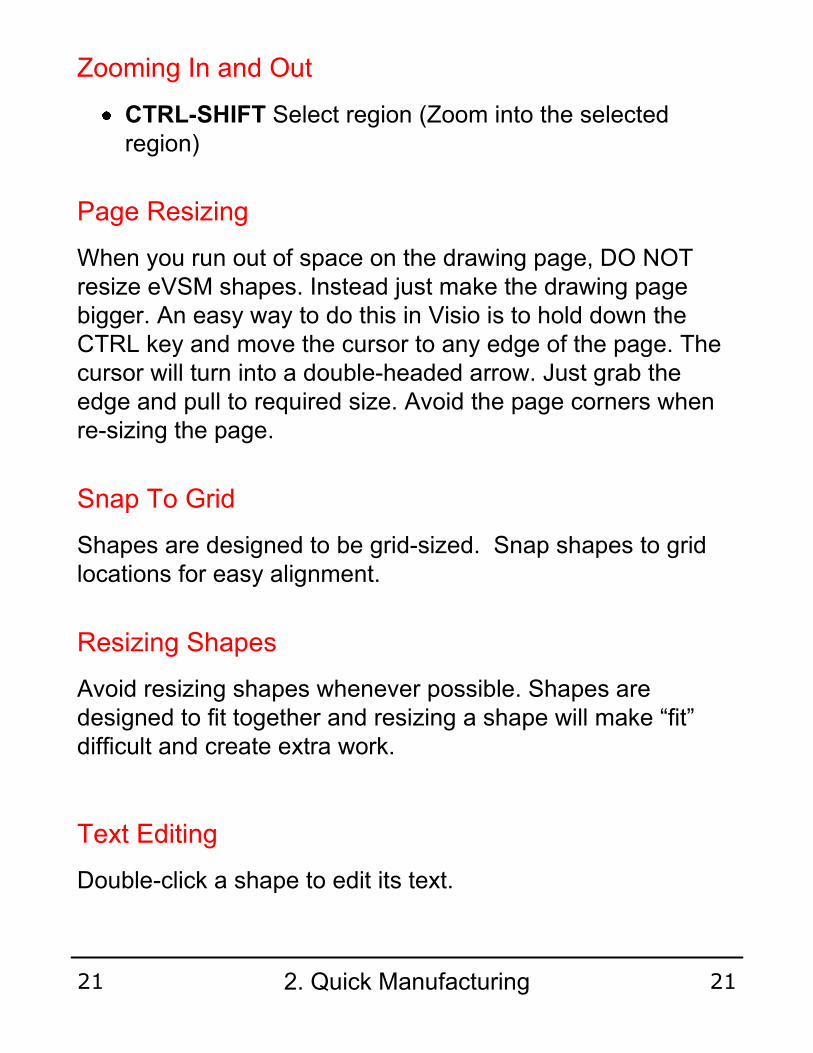
CTRL-SHIFT Select region (Zoom into the selected region)
Zooming In and Out
When you run out of space on the drawing page, DO NOT resize eVSM shapes. Instead just make the drawing page bigger. An easy way to do this in Visio is to hold down the CTRL key and move the cursor to any edge of the page. The cursor will turn into a double-headed arrow. Just grab the edge and pull to required size. Avoid the page corners when re-sizing the page.
Page Resizing
Resizing Shapes
Double-click a shape to edit its text.
Text Editing
Snap To Grid
Avoid resizing shapes whenever possible. Shapes are designed to fit together and resizing a shape will make “fit” difficult and create extra work.
Shapes are designed to be grid-sized. Snap shapes to grid locations for easy alignment.
2. Quick Manufacturing21 21

Tagged and Path Located Shapes
The green icons in the stencil have shapes that are pre-tagged via an “Operation Tag” and pre-assigned to Path 1 via the “Path Locater”.
Auto Day
xxTime
BetweenDay
A010
Transport Center
Red dot shows approximate tag location
When the shape is dragged onto the map its operation tag will “auto-number” to create a unique tag ID. You can double-click and change the ID but it MUST be unique on the map and it MUST be an alphabetic character followed by 3 numerals.
The charts in Quick Mfg are plotted in tag alphabetic sequence order.
Operation Tag
1
Path Locater
2. Quick Manufacturing22 22

Data Shapes
Quick eVSM data shapes have 3 types of entries:
1Batch Size Item
x.xxCycle Time Min
AutoCycle Time Per Item Min
AutoActivity Takt Time Min
Shapes with xx in the center field indicate values that MUST be entered.
Some shapes have default values already entered. Override these when necessary.
Any shapes with ‘Auto’ fields should be left alone. They will be automatically calculated.
Most data shapes have a Name, Value, Unit composition. The exception are the ‘Value Added’ and ‘Non Value Added’ shapes where the name is implied.
Auto DayAuto Min
Value Added Non Value Added
2. Quick Manufacturing23 23
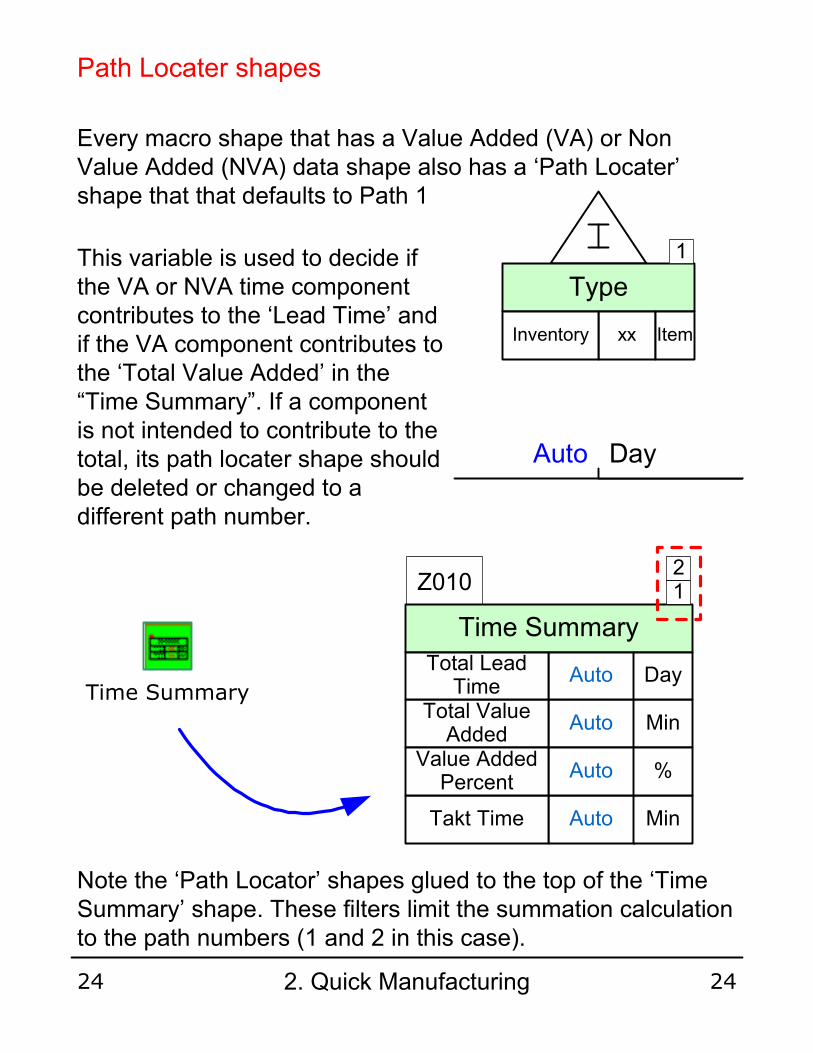
Path Locater shapes
Every macro shape that has a Value Added (VA) or Non Value Added (NVA) data shape also has a ‘Path Locater’ shape that that defaults to Path 1
Auto Day
Type
xxInventory Item
This variable is used to decide if the VA or NVA time component contributes to the ‘Lead Time’ and if the VA component contributes to the ‘Total Value Added’ in the “Time Summary”. If a component is not intended to contribute to the total, its path locater shape should be deleted or changed to a different path number.
Time Summary
1
Z010
Time Summary
AutoTakt Time Min
AutoTotal Value
AddedMin
AutoTotal Lead
TimeDay
AutoValue Added
Percent%
12
Note the ‘Path Locator’ shapes glued to the top of the ‘Time Summary’ shape. These filters limit the summation calculation to the path numbers (1 and 2 in this case).
2. Quick Manufacturing24 24
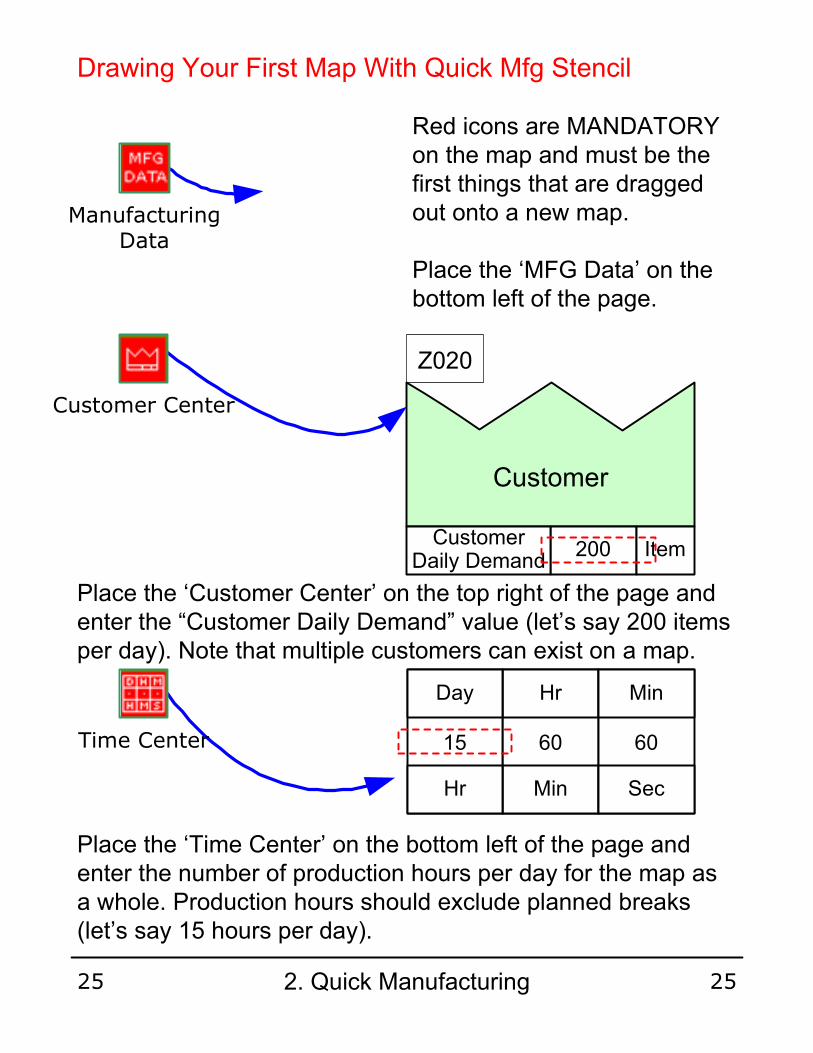
Drawing Your First Map With Quick Mfg Stencil
Red icons are MANDATORY on the map and must be the first things that are dragged out onto a new map.
Place the ‘MFG Data’ on the bottom left of the page.
Place the ‘Customer Center’ on the top right of the page and enter the “Customer Daily Demand” value (let’s say 200 items per day). Note that multiple customers can exist on a map.
Place the ‘Time Center’ on the bottom left of the page and enter the number of production hours per day for the map as a whole. Production hours should exclude planned breaks (let’s say 15 hours per day).
60
Hr
Min
60
Min
Sec
15
Day
Hr
Time Center
Customer Center
Z020
Customer
200Customer
Daily DemandItem
ManufacturingData
2. Quick Manufacturing25 25
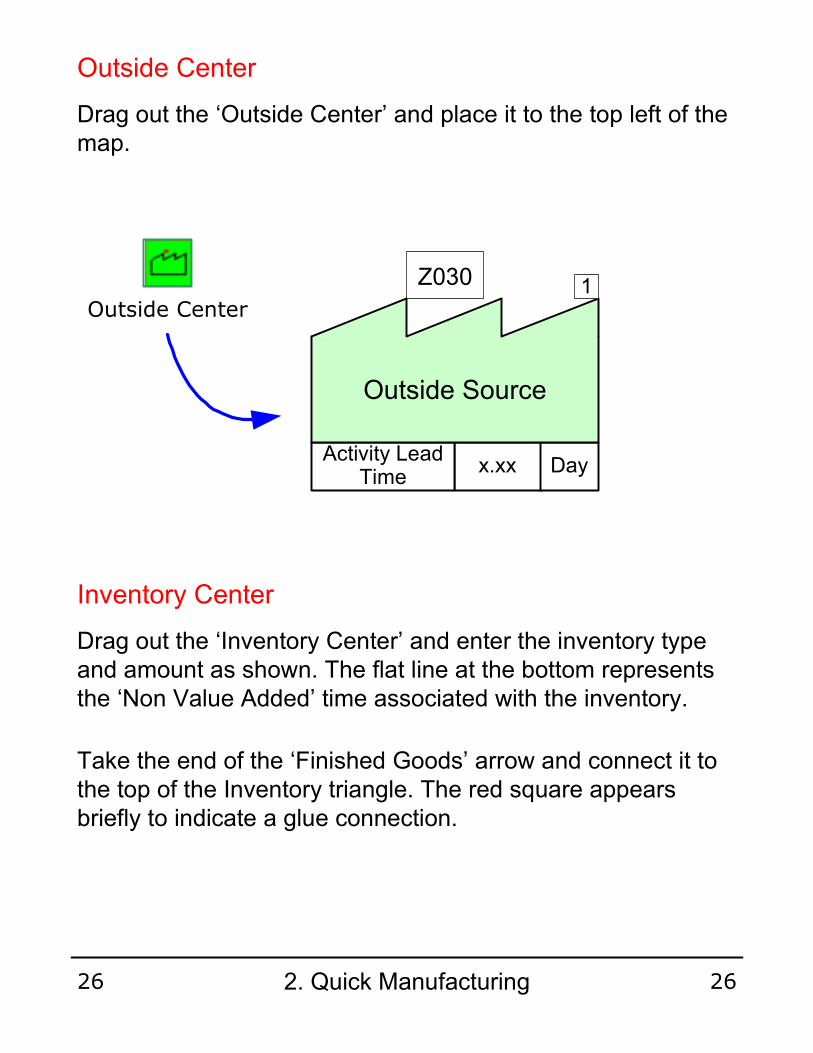
Drag out the ‘Inventory Center’ and enter the inventory type and amount as shown. The flat line at the bottom represents the ‘Non Value Added’ time associated with the inventory.
Take the end of the ‘Finished Goods’ arrow and connect it to the top of the Inventory triangle. The red square appears briefly to indicate a glue connection.
Inventory Center
Outside Center
Drag out the ‘Outside Center’ and place it to the top left of the map.
Outside Center
x.xxActivity Lead
TimeDay
Z030
Outside Source
1
2. Quick Manufacturing26 26

Auto Day
Raw Material
300Inventory Item
Inventory Center
Optional Inventory Value Shape
The inventory value is an optional data shape that can be connected to the bottom of the Inventory Center and can be useful in calculating the value of the inventory.
Inventory Value2.1
Single Item Value
$
AutoInventory Value
$
A010 1
Inventory Center (Cont’d.)
2. Quick Manufacturing27 27
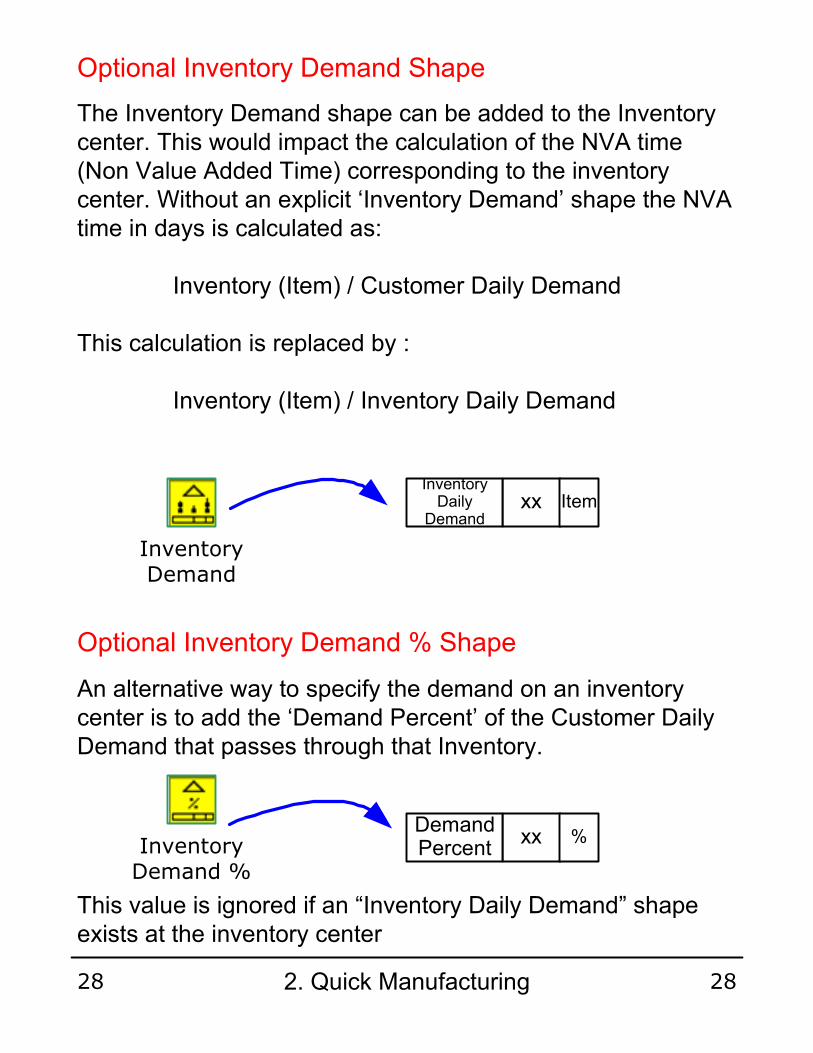
Optional Inventory Demand Shape
The Inventory Demand shape can be added to the Inventory center. This would impact the calculation of the NVA time (Non Value Added Time) corresponding to the inventory center. Without an explicit ‘Inventory Demand’ shape the NVA time in days is calculated as:
Inventory (Item) / Customer Daily Demand
This calculation is replaced by :
Inventory (Item) / Inventory Daily Demand
xxInventory Daily
DemandItem
Inventory Demand
Optional Inventory Demand % Shape
An alternative way to specify the demand on an inventory center is to add the ‘Demand Percent’ of the Customer Daily Demand that passes through that Inventory.
Inventory Demand %
This value is ignored if an “Inventory Daily Demand” shape exists at the inventory center
xxDemand Percent
%
2. Quick Manufacturing28 28

Inventory Quantity Specification
The word ‘Item’ refers to a unit of finished goods. Sometimes the inventory can be made up of a component that is used multiple times within one unit of finished goods.
Let’s say that 4 gears are used in each Item of finished goods and we want to represent an inventory of gears. This is done in 3 steps:
eVSM Name and Unit Manager
First, click on the ‘Name Unit Manager’ (listed as “Variables”) in the toolbar and use the dialog to create a new unit called ‘Gear’.
Second, go to the main eVSM Stencil and drag out a ‘Unit Converter’ shape. Use it to show that there are 4 gears for every finished goods item.
Units Converter 4
Item
Gear
Finally, specify the inventory as the appropriate number of gears.
1200Inventory Gear
2. Quick Manufacturing29 29

Adding Activity Data
Drag out the ‘Activity Center’ and position it as shown. Type in the data indicated.
Auto Day
Final Widgets
300Inventory Item
Activity Center
Note that some of the data shapes have been reduced to half height. This is because they contain variables that will be used for charting later and are automatically calculated. They are not considered critical for viewing directly and so some map space is being preserved.
A020 1
Auto Min
2Associates Staff
2Qty Per Cycle Item
6Cycle Time Min
AutoCycle Time Per Item Min
AutoActivity Takt Time Min
Activity
A050
AutoActivity VA Per Item Min
1
2. Quick Manufacturing30 30

Connecting Activities With Arrows
1Associates Staff
x.xxCycle Time Min
1Batch Size Item 1Batch Size Item
Activity
1Associates Staff
x.xxCycle Time Min
AutoActivity Takt Time MinAutoCycle Time Per Item Min
Activity
AutoActivity Takt Time MinAutoCycle Time Per Item Min
Auto Min Auto Min
Stepped Arrows
FIFO Arrow
ExpeditedInformationKanbanMaterialPushService
Curvable Arrows
One of the arrows above should be used to connect activities together to show the sequence. A Right-Click provides additional formats to show the type of flow (PUSH in the above example).
Electronic Info Flow
The red jagged arrow is used to represent electronic information flow (for example, an email of a forecast from a customer).
Finished Goods
AutoActivity VA Per Item Min AutoActivity VA Per Item Min
1 1
2. Quick Manufacturing31 31
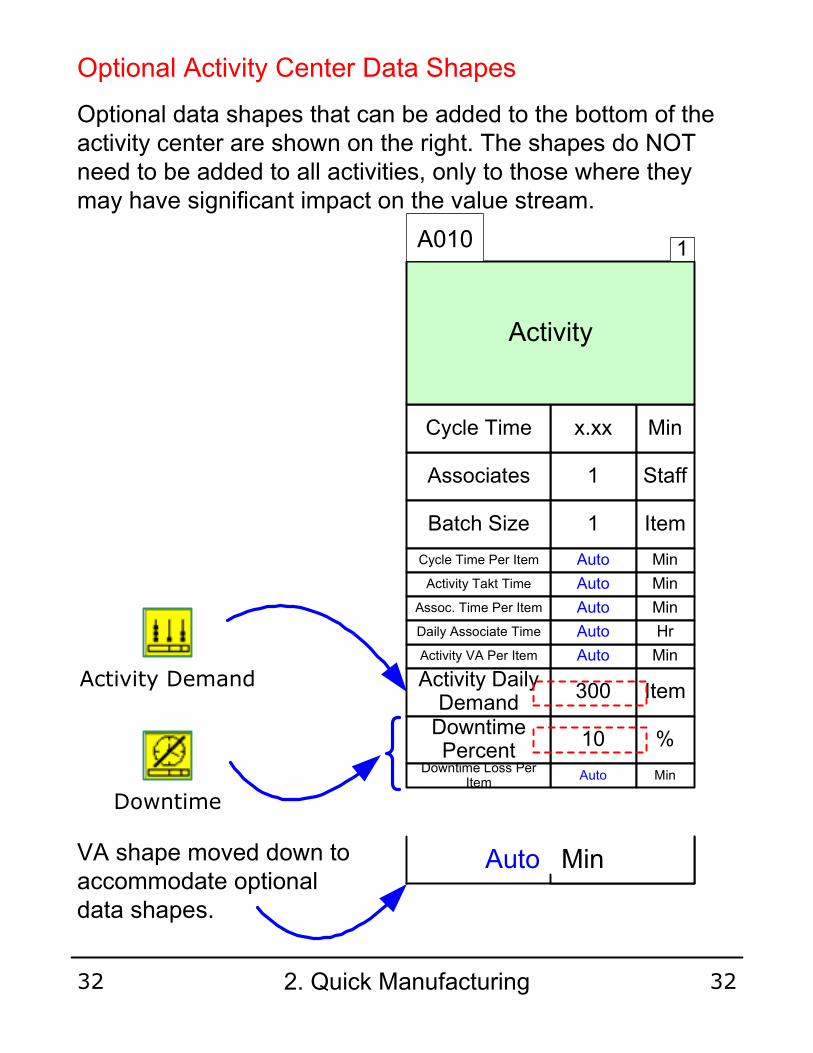
Optional Activity Center Data Shapes
Optional data shapes that can be added to the bottom of the activity center are shown on the right. The shapes do NOT need to be added to all activities, only to those where they may have significant impact on the value stream.
Activity Demand
Downtime
VA shape moved down to accommodate optional data shapes.
Auto Min
1Associates Staff
1Batch Size Item
x.xxCycle Time Min
AutoCycle Time Per Item Min
AutoActivity Takt Time Min
Activity
A010
AutoAssoc. Time Per Item Min
AutoActivity VA Per Item Min
AutoDaily Associate Time Hr
1
300Activity Daily Demand
Item
10Downtime Percent
%
AutoDowntime Loss Per
ItemMin
2. Quick Manufacturing32 32

Activity Demand
Activity Scrap
Optional Activity Center Data Shapes (Cont’d.)
Add this shape to denote a unique activity demand (due to servicing multiple value streams, perhaps).
Add this shape to denote percent of Items that are defective from this activity.
Activity Changeover
Add this shape to denote the time taken for changeovers each day.
Add this shape to denote the work time per associate for one cycle of this activity. The default value is the cycle time.
Activity Assc Time
Add this shape to denote the percent of demand going through this activity.
Activity Demand %
Activity Downtime
Add this shape to record unplanned downtime. Effect will be to reduce the ‘Cycle Time Per Item’.
2. Quick Manufacturing33 33

Optional Activity Center Data Shapes (Cont’d.)
Activity Stations
Activity Shortage
Activity Time
Add this shape to denote a unique activity available time (due to overtime, perhaps).
Add this shape to denote multiple stations. Effect will be to reduce the ‘Cycle Time Per Item’. Note that the “Associates” value on the ‘Activity Center’ denotes the total number of associates at all ‘Activity Stations’
Add this shape to denote percent of times a shortage in components stops production at this activity.
Activity OEE
OEE can be a general way to denote all the reasons that a loss in production occurs.
Activity NVA
Add this shape to denote the NVA component within the ‘Cycle Time’ for an activity.
Inventory Rolling Defects
Add this shape to support rolling defect calculations (See the Rolling Defects Section).
2. Quick Manufacturing34 34
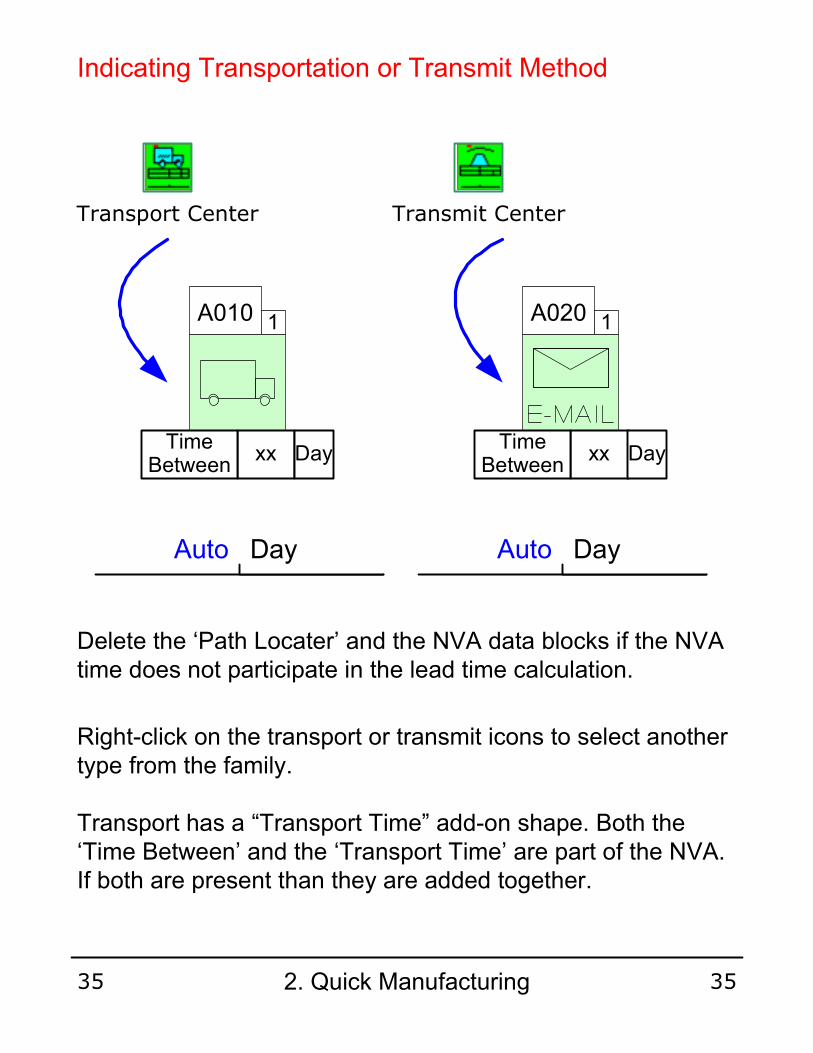
Transmit Center
Auto Day
xxTime
BetweenDay
Indicating Transportation or Transmit Method
Transport Center
Auto Day
xxTime
BetweenDay
A010 A0201 1
Delete the ‘Path Locater’ and the NVA data blocks if the NVA time does not participate in the lead time calculation.
Right-click on the transport or transmit icons to select another type from the family.
Transport has a “Transport Time” add-on shape. Both the ‘Time Between’ and the ‘Transport Time’ are part of the NVA. If both are present than they are added together.
2. Quick Manufacturing35 35

Rolling Defects
The rolling defects calculation is an optional add-on shape that shows the cumulative effect of defects downstream of the activity and how it impacts capacity at the activity. It must be used in conjunction with the ‘Activity Defect %’.
Every Green macro shape has its own ‘Rolling Defect’ add-on shape. In order for the map to calculate the rolling defect, every shape downstream of the activity must have the ‘Rolling Defect’ add-on. Also, all centers must be sequenced in order using the ‘Tag Seq Arrow’ (See the ‘Tag Sequence Arrow’ section in the “Analyzing with eVSM” chapter).
AutoRolling Defect
Percent%
Inventory Rolling Defects
AutoDownStr Loss Per Item Min
AutoRolling Defect Percent %
AutoDaily Associate Defect
TimeHr
Activity Rolling Defects
AutoRolling Defect
Percent%
Wait Rolling Defects
Note that with the ‘Rolling Defects’ add-on, all the data boxes will be automatically calculated.
2. Quick Manufacturing36 36

Coils
2Inventory Item
A020 1
3.50 Min
1Associates Staff
1Batch Size Item
3.5Cycle Time Min
3.50Cycle Time Per Item Min
4.08Activity Takt Time Min
Stamping
A030
3.50Assoc. Time Per Item Min
3.50Activity VA Per Item Min
14.58Daily Associate Time Hr
1
8Defects Percent
%
0.30Defects Loss Per Item Min
0.81DownStr Loss Per Item Min
24.20Rolling Defect Percent %
3.53Daily Associate Defect
TimeHr
24.20Rolling Defect
Percent%
Tag Seq Arrow
Activity Defects
Activity Rolling Defects
After defining the percentage of defects for each activity, the ‘Rolling Defects Percent’ is calculated based on the ‘Defect Percent’ for activities downstream. Adding a CT / TT chart to the map will visually show the losses due to defects (see following example).
2. Quick Manufacturing37 37
Rolling Defects Cont’d
The CT / TT chart is an effective way to visually communicate how downstream losses due to defects can adversely effect capacity at upstream activities.
2. Quick Manufacturing38 38

Activity Associate Time
x.xxAssoc. Time Per Cycle
Min
AutoDaily Time Per Associate Hr
AutoDaily Available Time Per
AssociateHr
Activity Assc Time
The ‘Activity Associate Time’ add-on can be used when an associate does not spend all their available working time on the activity.
Enter the amount of time EACH associate spends on the activity for ONE cycle in the ‘Assoc. Time Per Cycle’ field. Note that this must be less than the cycle time. The ‘Daily Time Per Associate’ field is the total amount of time each associate spends working on the activity in one working day (and is automatically calculated).
The Staff Summary (following section) summarizes the data from this and the ‘Rolling Defects’ add on.
The ‘Assoc. Load Chart’ presents the data in a bar graph. Note that the current capability does not provide a chart that properly represents available time of associates working on multiple activities.
Daily Associate Load Chart
Hr
Daily Time Per Associate
Daily Available Time Per Associate
Assoc. Load Chart
2. Quick Manufacturing39 39

Z050
Staff Summary
AutoTotal Assoc. Time Per Item
Min
AutoTotal Daily Assoc Time
Hr
AutoTotal Daily Assoc Defect Time Hr
1
The Staff Summary gives totals from the ‘Activity Assc Time’ and the ‘Activity Rolling Defects’ add on shapes.
‘Total Assoc. Time Per Item’ gives the total time spent by all associates in making an item (not necessarily the total cycle times, if an associate spent less than ‘Cycle Time’ on an activity).
‘Total Daily Assoc Time’ is the above multiplied by ‘Customer Daily Demand’.
And ‘Total Daily Assoc Defect Time’ is tied to the “Rolling Defects’ add-on and sums up all the time lost by associates due to defects in a day.
Staff Summary
Staff Summary
2. Quick Manufacturing40 40
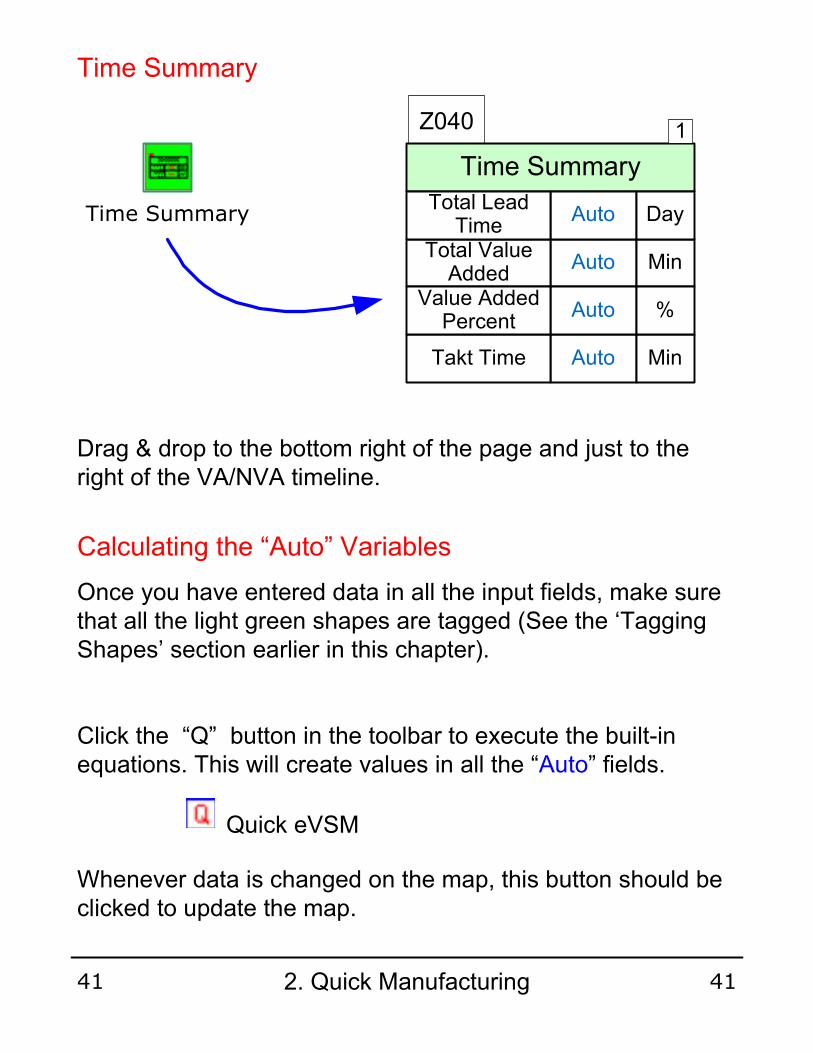
Time Summary
Time Summary
Z040
Time Summary
AutoTakt Time Min
AutoTotal Value
AddedMin
AutoTotal Lead
TimeDay
AutoValue Added
Percent%
1
Drag & drop to the bottom right of the page and just to the right of the VA/NVA timeline.
Calculating the “Auto” Variables
Once you have entered data in all the input fields, make sure that all the light green shapes are tagged (See the ‘Tagging Shapes’ section earlier in this chapter).
Click the “Q” button in the toolbar to execute the built-in equations. This will create values in all the “Auto” fields.
Whenever data is changed on the map, this button should be clicked to update the map.
Quick eVSM
2. Quick Manufacturing41 41
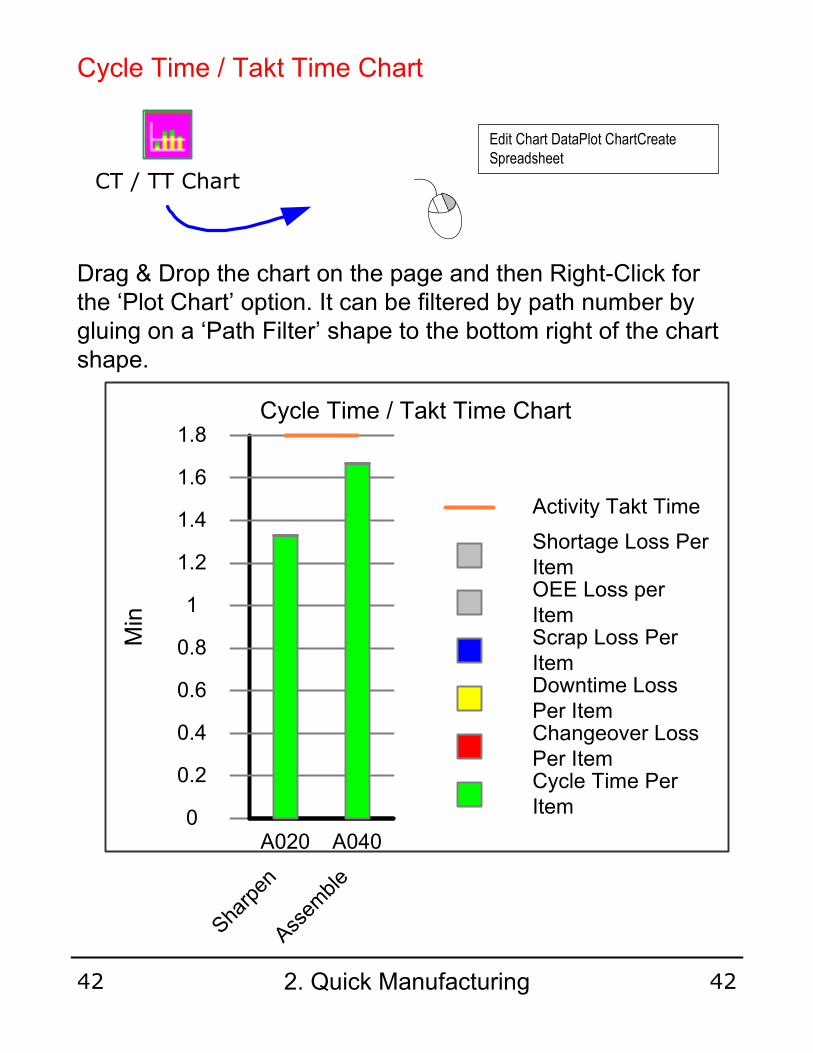
Cycle Time / Takt Time Chart
CT / TT Chart
Edit Chart DataPlot ChartCreate Spreadsheet
Drag & Drop the chart on the page and then Right-Click for the ‘Plot Chart’ option. It can be filtered by path number by gluing on a ‘Path Filter’ shape to the bottom right of the chart shape.
Cycle Time / Takt Time Chart
Min
0
0.2
0.4
0.6
0.8
1
1.2
1.4
1.6
1.8
A020
Sharpen
A040
Assemble
Cycle Time Per Item
Changeover Loss Per Item
Downtime Loss Per Item
Scrap Loss Per Item
OEE Loss per Item
Shortage Loss Per Item
Activity Takt Time
2. Quick Manufacturing42 42

VA Time / Takt Time Chart
This is very similar to the Cycle Time / Takt Time Chart. Use it if you have applied the “Activity NVA” add-on to any of your ‘Activity Centers’. It splits the cycle time into its VA and NVA components.
VA / TT Chart
NVA Timeline Chart
NVA Timeline Chart
This chart plots the NVA times in a horizontal bar chart and “to scale”. It can be filtered by Path Number.
2. Quick Manufacturing43 43

Quick eVSM Summary
Quick eVSM stencils provide a standard, easy, and rapid means of creating, analyzing, and visualizing the map.
The Quick Mfg stencil in eVSM V5 provides a highly productive way of working with plant-level value stream maps. The eVSM group plans to create further “Quick” stencils in respond to customer demand. If you have such a request please email us at [email protected].
Quick Mfg Info
Quick Mfg Info
This shape contains an image that lays out the content of the Quick Mfg stencil on a single page and provides annotation on the equations that are involved in calculating all the “Auto” fields.
Drag out the shape for Preview or Printing.
2. Quick Manufacturing44 44
This area intentionally left blank
2. Quick Manufacturing45 45

3. Quick Services
Quick eVSM denotes stencils that are built on eVSM to simplify, standardize, and speed up the creation of value stream maps in an application area. The ‘Quick Services’ stencil in eVSM has been built for VSMs at a product level.
What is Quick eVSM ?
Quick Services Stencil
Icon
Macro Shape
Help Movie
Short movies about using eVSM are available at www.evsm.com/help.
Quick Services
Decision
x.xxNO %
x.xxYES %
A040
1
3. Quick Services46 46
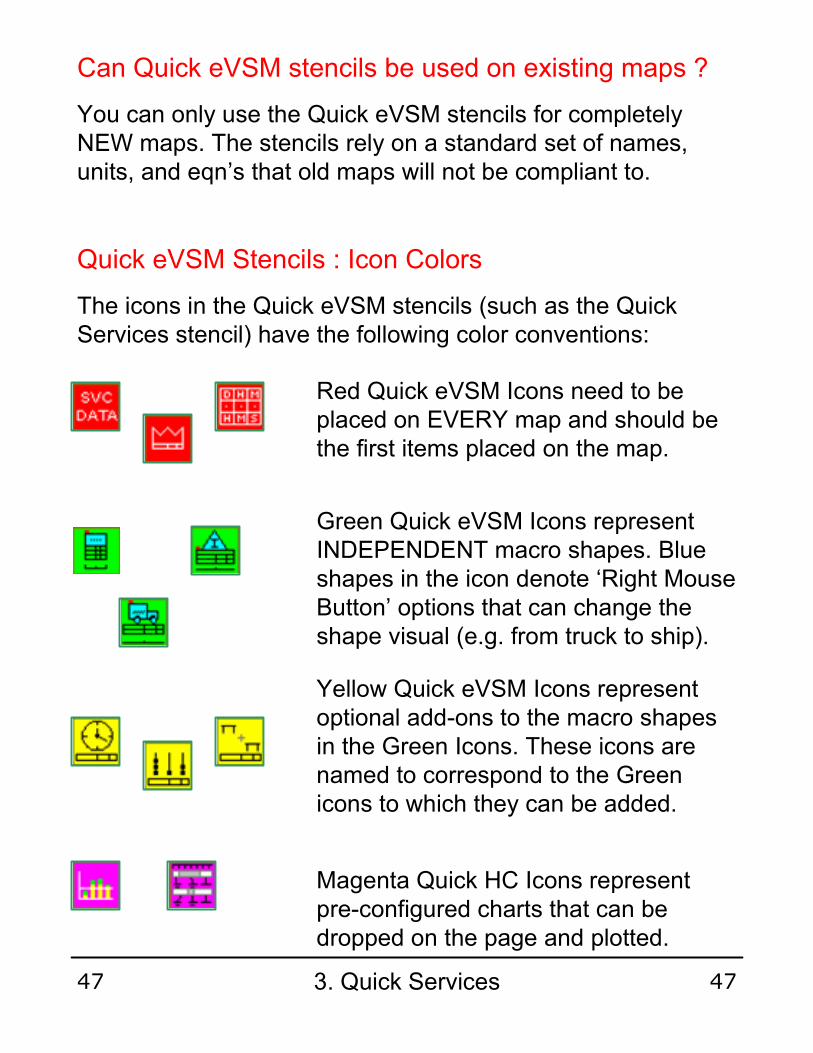
Can Quick eVSM stencils be used on existing maps ?
You can only use the Quick eVSM stencils for completely NEW maps. The stencils rely on a standard set of names, units, and eqn’s that old maps will not be compliant to.
Quick eVSM Stencils : Icon Colors
The icons in the Quick eVSM stencils (such as the Quick Services stencil) have the following color conventions:
Red Quick eVSM Icons need to be placed on EVERY map and should be the first items placed on the map.
Green Quick eVSM Icons represent INDEPENDENT macro shapes. Blue shapes in the icon denote ‘Right Mouse Button’ options that can change the shape visual (e.g. from truck to ship).
Yellow Quick eVSM Icons represent optional add-ons to the macro shapes in the Green Icons. These icons are named to correspond to the Green icons to which they can be added.
Magenta Quick HC Icons represent pre-configured charts that can be dropped on the page and plotted.
3. Quick Services47 47
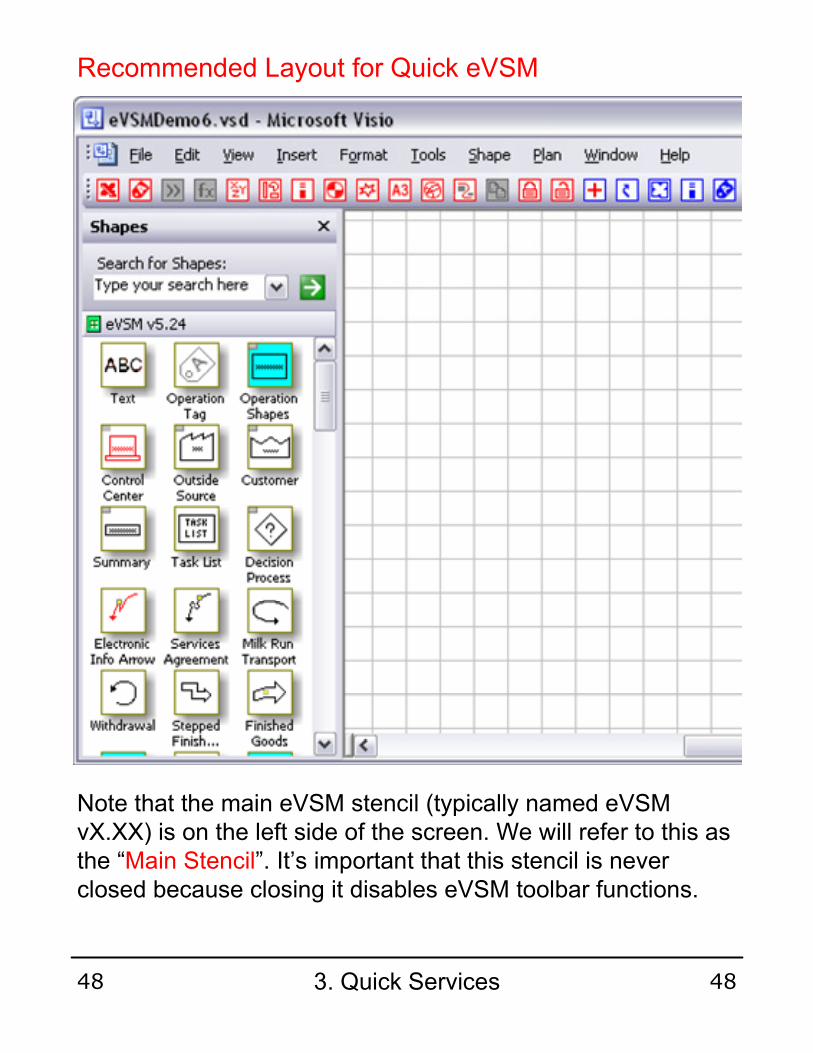
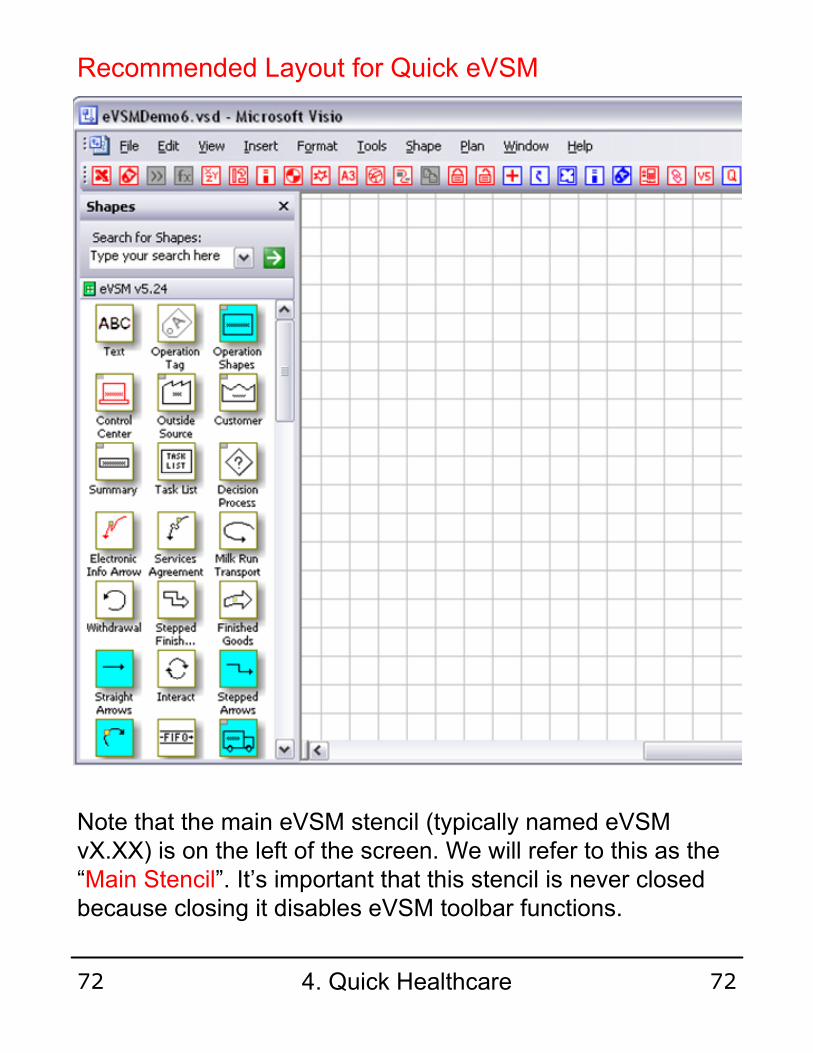
Recommended Layout for Quick eVSM
Note that the main eVSM stencil (typically named eVSM vX.XX) is on the left side of the screen. We will refer to this as the “Main Stencil”. It’s important that this stencil is never closed because closing it disables eVSM toolbar functions.
3. Quick Services48 48

Any Quick eVSM stencils (such as Quick Services) are docked on the right of the screen. We will refer to such stencils as the “Quick Stencil”. Click and drag the Quick Stencil header bar to move it to this docked position.
3. Quick Services49 49
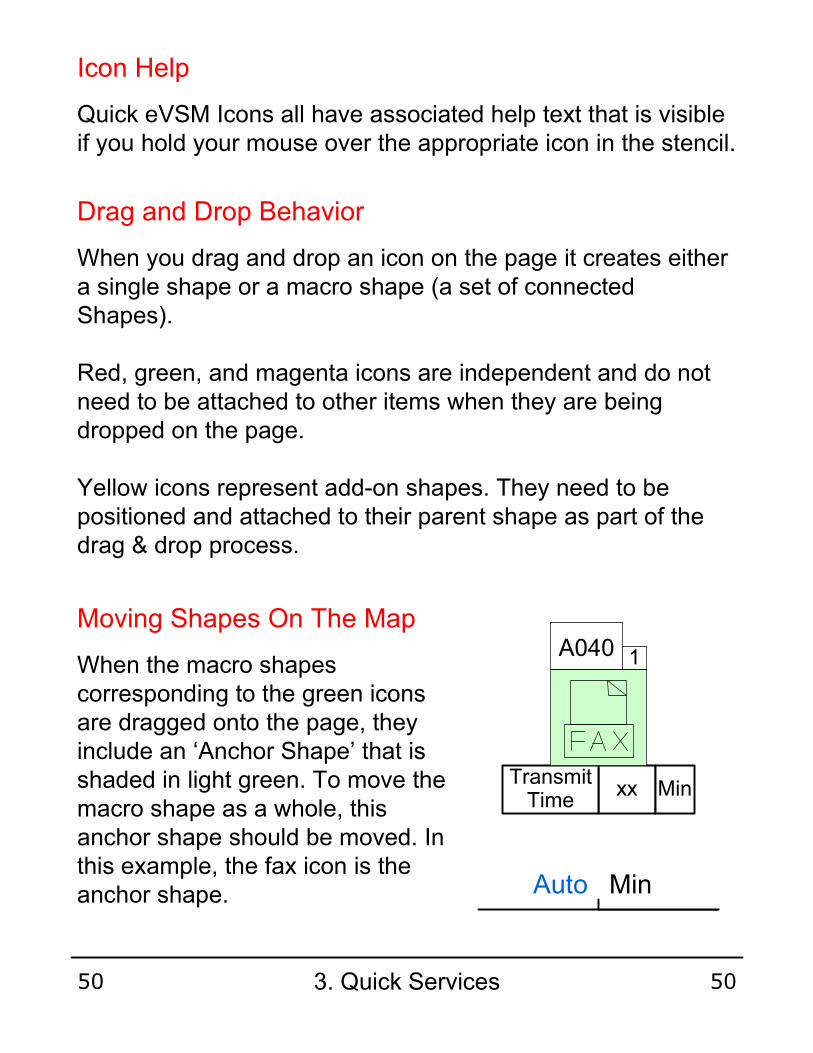
Icon Help
Quick eVSM Icons all have associated help text that is visible if you hold your mouse over the appropriate icon in the stencil.
Drag and Drop Behavior
When you drag and drop an icon on the page it creates either a single shape or a macro shape (a set of connected Shapes).
Red, green, and magenta icons are independent and do not need to be attached to other items when they are being dropped on the page.
Yellow icons represent add-on shapes. They need to be positioned and attached to their parent shape as part of the drag & drop process.
When the macro shapes corresponding to the green icons are dragged onto the page, they include an ‘Anchor Shape’ that is shaded in light green. To move the macro shape as a whole, this anchor shape should be moved. In this example, the fax icon is the anchor shape.
Moving Shapes On The Map
Auto Min
xxTransmit Time
Min
A040 1
3. Quick Services50 50

CTRL-SHIFT-Drag Select region (Zoom into the selected region).
Zooming In and Out
When you run out of space on the drawing page, DO NOT resize eVSM shapes. Instead just make the drawing page bigger. An easy way to do this in Visio is to hold down the CTRL key and move the cursor to any edge of the page. The cursor will turn into a double-headed arrow. Just grab the edge and pull to the required size. Avoid the page corners when re-sizing the page.
Page Resizing
Resizing Shapes
Double-click a shape to edit its text.
Text Editing
Snap To Grid
Avoid resizing shapes whenever possible. Shapes are designed to fit together and resizing a shape will make “fit” difficult and create extra work.
Shapes are sized to fit the grid. Snap shapes to grid locations for easy alignment.
3. Quick Services51 51

Tagged and Path Located Shapes
The green icons in the stencil have shapes that are pre-tagged with an “Operation Tag” and pre-assigned to Path 1 via the “Path Locater”.
Red dot shows approximate tag location
When the shape is dragged onto the map its operation tag will “auto-number” to create a unique tag ID. You can double-click and change the ID but it MUST be unique on the map and it MUST be an alphabetic character followed by 3 numerals.
The charts in eVSM are plotted in tag alphabetic sequence order.
Operation Tag Path Locater
Transmit Center
Auto Min
xxTransmit Time
Min
A040 1
3. Quick Services52 52
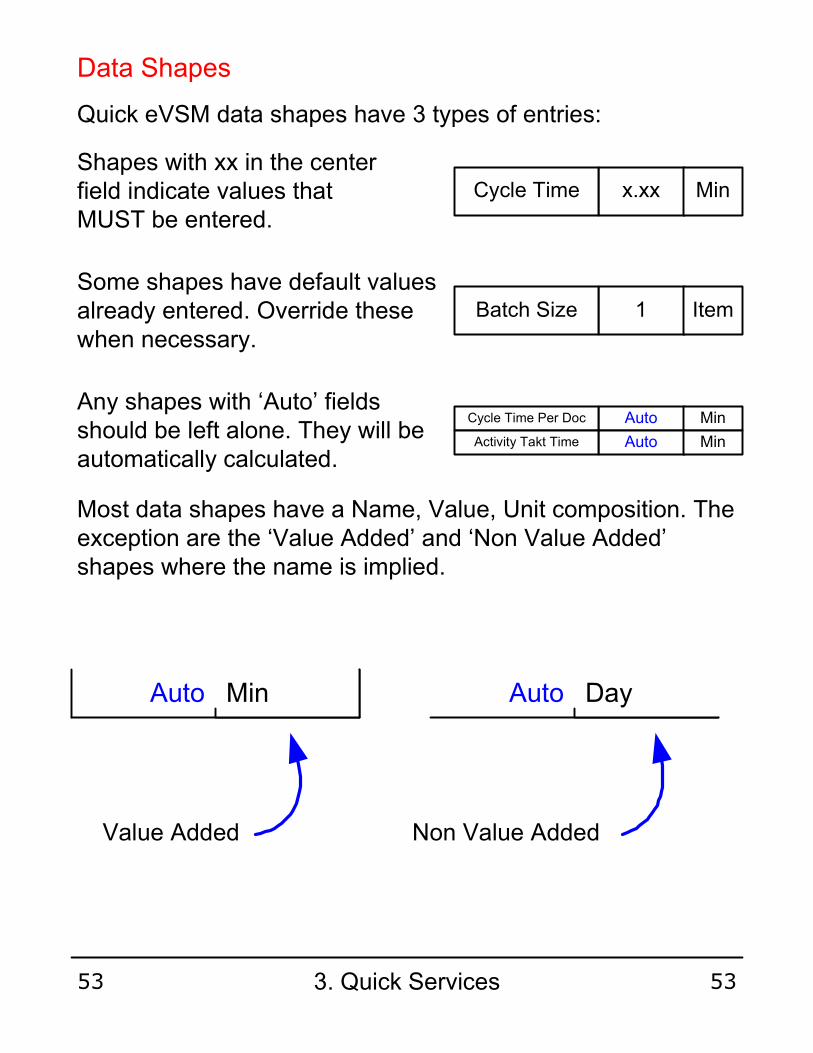
Data Shapes
Quick eVSM data shapes have 3 types of entries:
1Batch Size Item
x.xxCycle Time Min
AutoCycle Time Per Doc Min
AutoActivity Takt Time Min
Shapes with xx in the center field indicate values that MUST be entered.
Some shapes have default values already entered. Override these when necessary.
Any shapes with ‘Auto’ fields should be left alone. They will be automatically calculated.
Most data shapes have a Name, Value, Unit composition. The exception are the ‘Value Added’ and ‘Non Value Added’ shapes where the name is implied.
Auto DayAuto Min
Value Added Non Value Added
3. Quick Services53 53
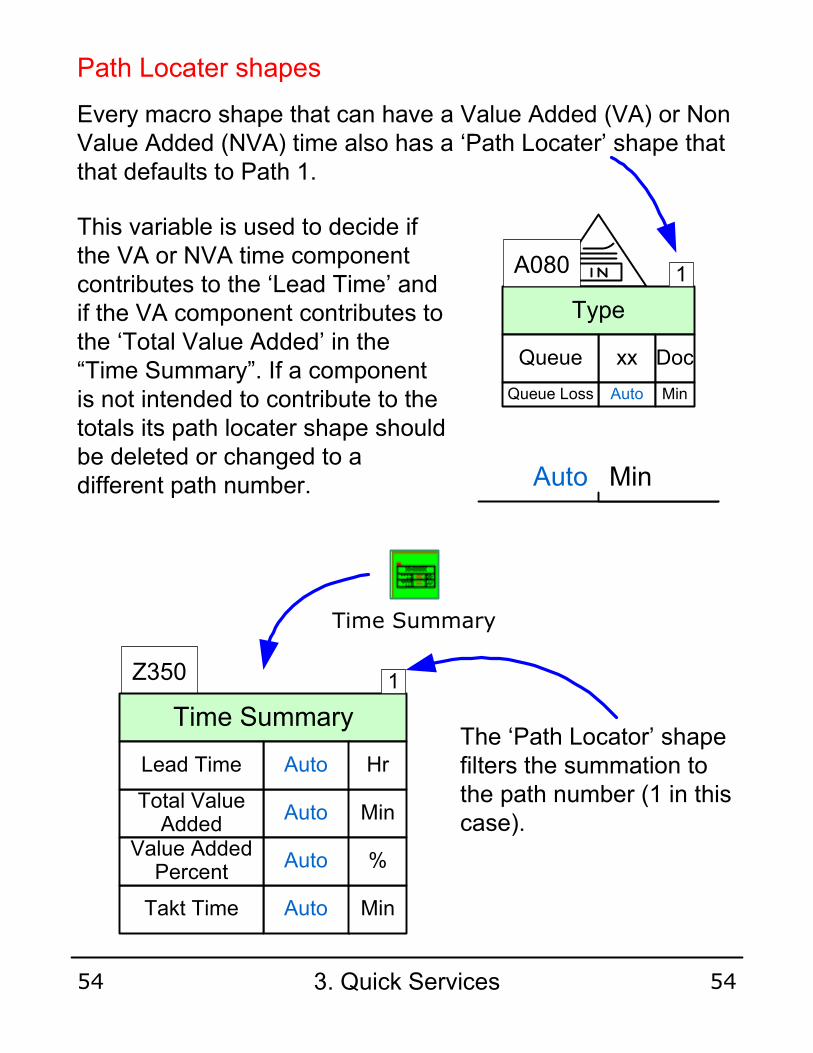
Path Locater shapes
Every macro shape that can have a Value Added (VA) or Non Value Added (NVA) time also has a ‘Path Locater’ shape that that defaults to Path 1.
This variable is used to decide if the VA or NVA time component contributes to the ‘Lead Time’ and if the VA component contributes to the ‘Total Value Added’ in the “Time Summary”. If a component is not intended to contribute to the totals its path locater shape should be deleted or changed to a different path number.
Time Summary
The ‘Path Locator’ shape filters the summation to the path number (1 in this case).
Auto Min
Type
xxQueue Doc
A080 1
AutoQueue Loss Min
Z350
Time Summary
AutoTakt Time Min
AutoTotal Value
AddedMin
AutoLead Time Hr
AutoValue Added
Percent%
1
3. Quick Services54 54
Your First Map With Quick Services Stencil
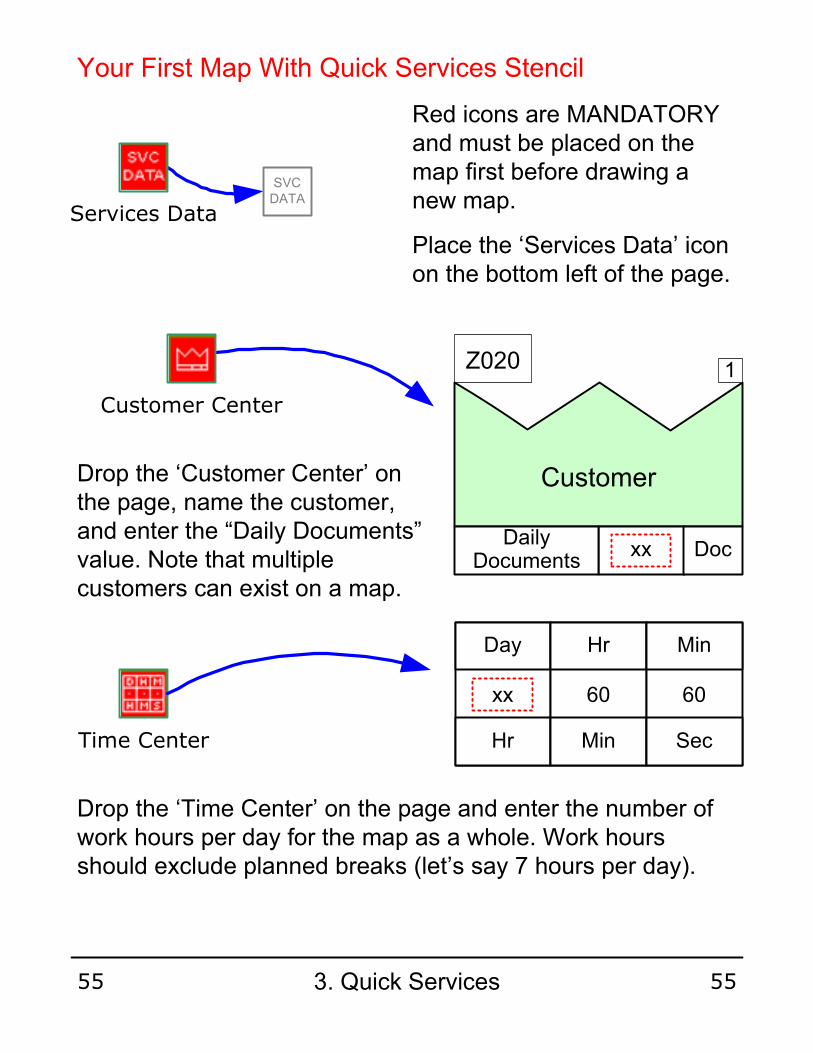
Red icons are MANDATORY and must be placed on the map first before drawing a new map.
Place the ‘Services Data’ icon on the bottom left of the page.
Drop the ‘Customer Center’ on the page, name the customer, and enter the “Daily Documents” value. Note that multiple customers can exist on a map.
Drop the ‘Time Center’ on the page and enter the number of work hours per day for the map as a whole. Work hours should exclude planned breaks (let’s say 7 hours per day).
Time Center
Customer Center
Services Data
SVC DATA
xx
Day
Hr
60
Hr
Min
60
Min
Sec
Z020
Customer
xxDaily
DocumentsDoc
1
3. Quick Services55 55

Outside Center
Drag out the ‘Outside Center’ and name it. It is used to represent suppliers, contractors, vendors, distributers, etc.
Outside Center
Queue Center
Queue Center
If an outside source needs to be included in the calculations, then use the Activity Center macro shape instead.
Used to represent the number of docs in the in-tray or waiting ahead of the next activity.
Z010
Outside Source
1
Auto Min
Type
xxQueue Doc
A090 1
AutoQueue Loss Min
3. Quick Services56 56
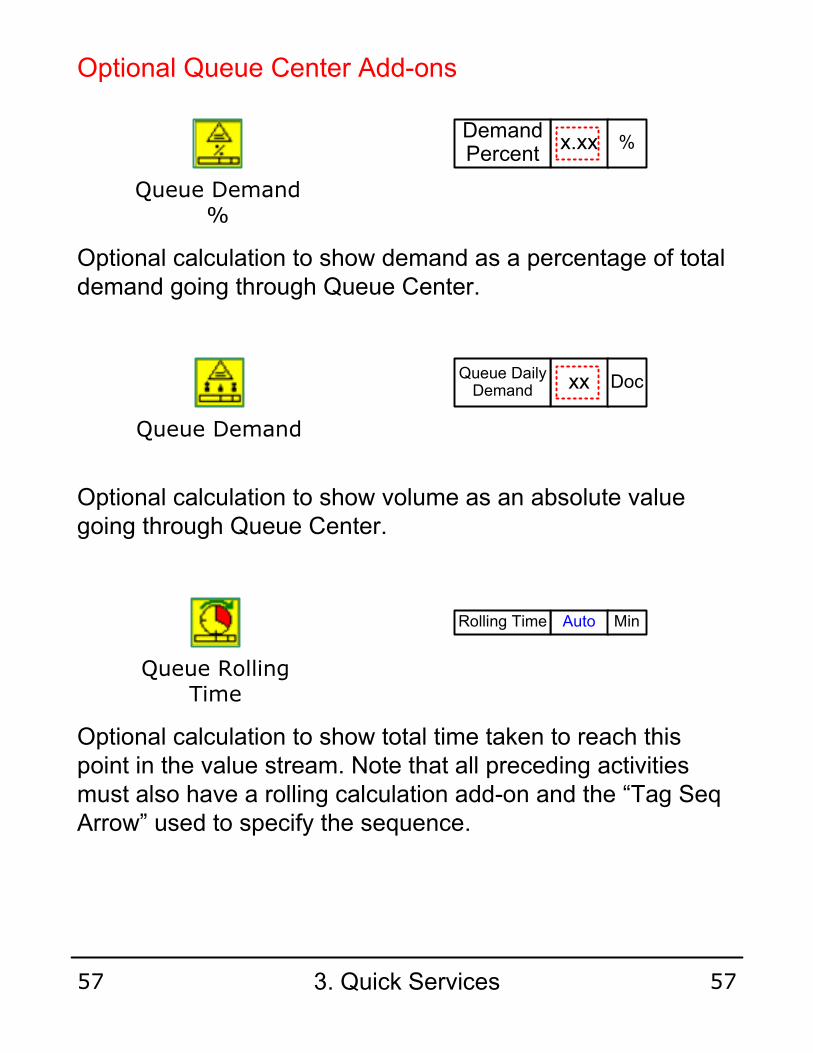
Queue Demand %
Queue Demand
Queue Rolling Time
Optional calculation to show demand as a percentage of total demand going through Queue Center.
Optional calculation to show volume as an absolute value going through Queue Center.
Optional calculation to show total time taken to reach this point in the value stream. Note that all preceding activities must also have a rolling calculation add-on and the “Tag Seq Arrow” used to specify the sequence.
x.xxDemand Percent
%
xxQueue Daily Demand
Doc
AutoRolling Time Min
Optional Queue Center Add-ons
3. Quick Services57 57
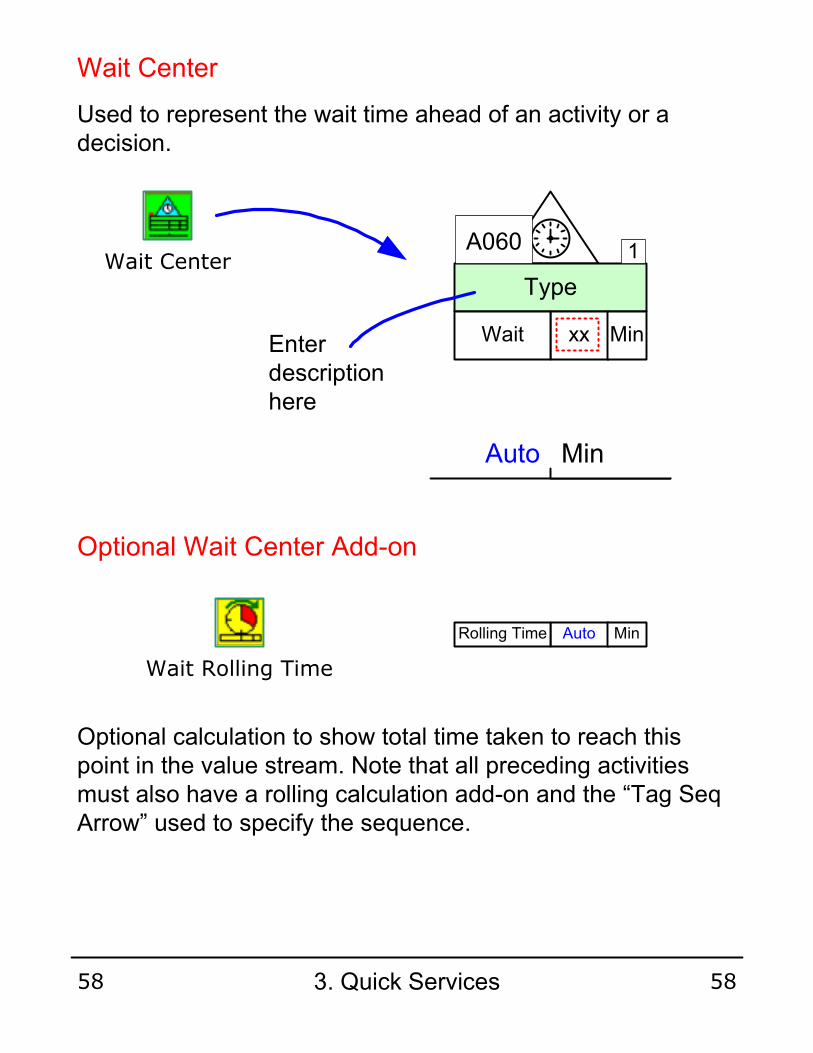
Wait Center
Wait Rolling Time
Wait Center
Optional calculation to show total time taken to reach this point in the value stream. Note that all preceding activities must also have a rolling calculation add-on and the “Tag Seq Arrow” used to specify the sequence.
Auto Min
Type
xxWait Min
A060 1
AutoRolling Time Min
Used to represent the wait time ahead of an activity or a decision.
Enter description here
Optional Wait Center Add-on
3. Quick Services58 58

Decision Center
Decision Rolling Time
Optional calculation to show total time taken to reach this point in the value stream. Note that all preceding activities must also have a rolling calculation add-on and the “Tag Seq Arrow” used to specify the sequence.
Decision Center
Decision
x.xxYES %
x.xxNO %
1
A070
AutoRolling Time Min
The Decision Center is used to represent a decision point. You need to phrase the decision description so the answer is always “Yes” or “No”. If the decision takes a significant amount of time, then the time value should be included in the preceding activity.
Optional Decision Center Add-on
3. Quick Services59 59

Activity Center
Activity Assc Time
Activity Center
Auto Min
1Associates Staff
1Batch Size Doc
x.xxCycle Time Min
AutoCycle Time Per Doc Min
AutoActivity Takt Time Min
Activity
A010 1
AutoAssoc. Time Per Doc Min
AutoActivity VA Per Doc Min
AutoDaily Associate Time Hr
x.xxAssoc. Time Per Cycle
Min
AutoDaily Time Per Associate Hr
AutoDaily Available Time Per
AssociateHr
Used to represent actual activities (eg. Enter order, Schedule, Review, etc.) in the value stream.
Align the Activity Center to the grid and with any preceding macro shapes so that the VA/NVA shapes at the bottom form a contiguous time line.
Enter the description and the mandatory Cycle Time.
Add this macro to denote the work time per associate for one cycle of this activity.
Optional Activity Center Add-ons
3. Quick Services60 60

Activity Demand
Activity Demand %
x.xxDemand Percent
%
xxActivity Daily Demand
Doc
Optional Activity Center Add-ons (Cont’d)
Add this macro to denote a unique activity demand (due to servicing multiple value streams, perhaps).
Add this macro to denote the percent of demand going through this activity.
Activity Downtime
x.xxDowntime Percent
%
AutoDowntime Loss Per Doc Min
Add this macro to record unplanned downtime. Effect will be to reduce the ‘Cycle Time Per Item’.
Activity Defects
Activity Center Add-On : Add this shape to denote percent of units that are defective from this activity, if significant
x.xxDefects Percent
%
AutoDefects Loss Per Doc Min
3. Quick Services61 61
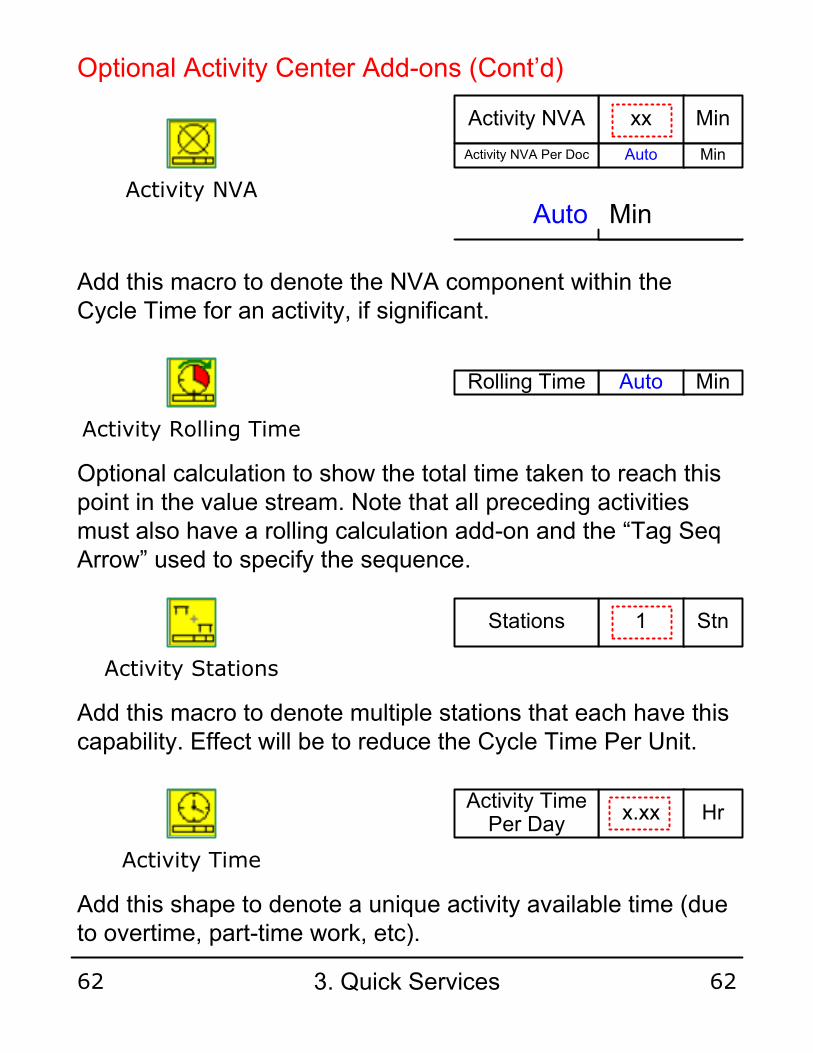
Activity NVA
xxActivity NVA Min
Auto Min
AutoActivity NVA Per Doc Min
Add this macro to denote the NVA component within the Cycle Time for an activity, if significant.
Optional Activity Center Add-ons (Cont’d)
Activity Rolling Time
Activity Stations
Activity Time
Optional calculation to show the total time taken to reach this point in the value stream. Note that all preceding activities must also have a rolling calculation add-on and the “Tag Seq Arrow” used to specify the sequence.
AutoRolling Time Min
x.xxActivity Time
Per DayHr
1Stations Stn
Add this macro to denote multiple stations that each have this capability. Effect will be to reduce the Cycle Time Per Unit.
Add this shape to denote a unique activity available time (due to overtime, part-time work, etc).
3. Quick Services62 62

Query Center
Query Rolling Time
The Query Center allows you to model any significant loss of lead time or associate time due to incorrect, incomplete, or defective documents.
Optional calculation to show total time taken to reach this point in the value stream. Note that all preceding activities must also have a rolling calculation add-on and the “Tag Seq Arrow” used to specify the sequence.
Query Center
xxAssoc. Time Per Query Min
AutoDaily Associate Query Time
Hr
AutoQuery Loss Min
Auto Min
Query Type
xxQuery Percent
%
1A030
xxTime Per Query
Min
AutoAssoc. Time Loss Min
AutoRolling Time Min
Optional Query Center Add-on
3. Quick Services63 63

Transmit Center
Transmit Rolling Time
Optional calculation to show total time taken to reach this point in the value stream. Note that all preceding activities must also have a rolling calculation add-on and the “Tag Seq Arrow” used to specify the sequence.
Transmit Center
Auto Min
xxTransmit Time
Min
A050 1
AutoRolling Time Min
Used when information transmit time is significant and needs to be included in the Lead Time calculation. If time is not important, then use the Transmit Shapes from the main stencil instead.
Optional Transmit Center Add-on
3. Quick Services64 64
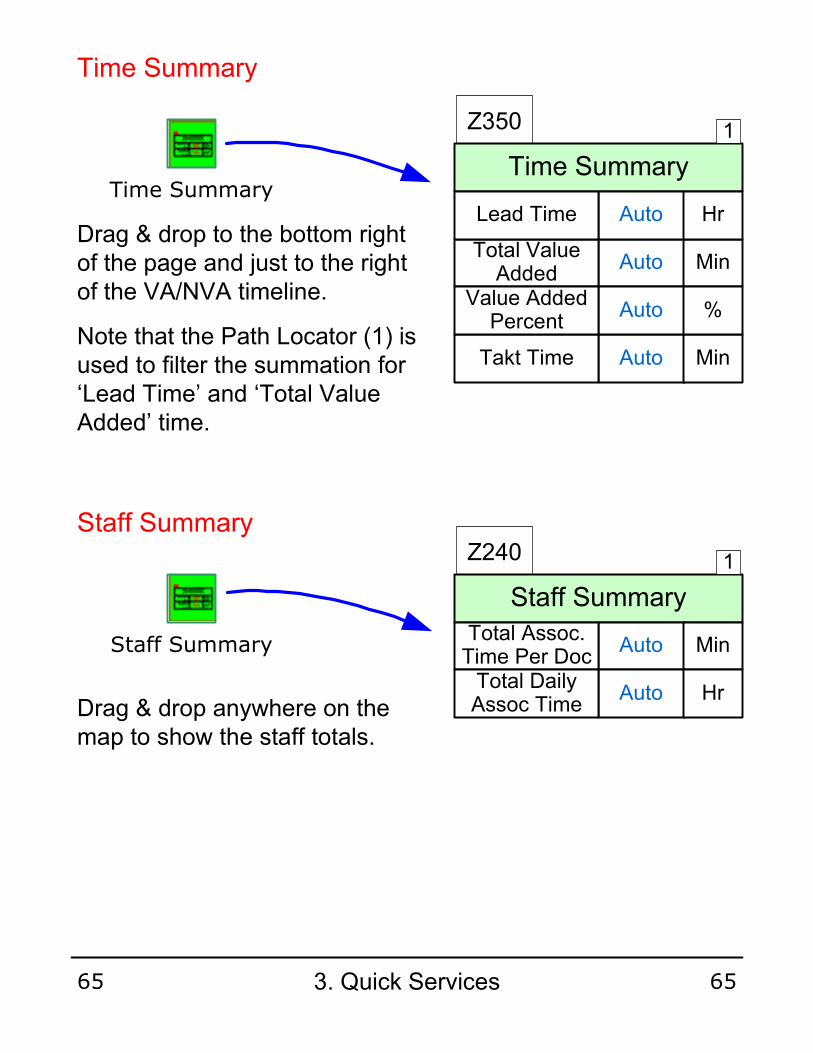
Time Summary
Staff Summary
Time Summary
Staff Summary
Z350
Time Summary
AutoTakt Time Min
AutoTotal Value
AddedMin
AutoLead Time Hr
AutoValue Added
Percent%
1
Z240
Staff Summary
AutoTotal Assoc. Time Per Doc
Min
1
AutoTotal Daily Assoc Time
Hr
Drag & drop to the bottom right of the page and just to the right of the VA/NVA timeline.
Note that the Path Locator (1) is used to filter the summation for ‘Lead Time’ and ‘Total Value Added’ time.
Drag & drop anywhere on the map to show the staff totals.
3. Quick Services65 65

Lane A
Lane C
Lane BSwimlane Frame
Swimlane Frame
Cycle Time / Takt Time Chart
CT / TT Chart
Edit Chart DataPlot ChartCreate Spreadsheet
Drag & Drop the chart on the page and then Right-Click for the ‘Plot Chart’ option. It can be filtered by path number by gluing on a ‘Path Filter’ shape to the bottom right of the chart shape
CT / TTChart
Drag & Drop on the page, and name the swimlanes. Use right-mouse menus to add/delete rows and to re-size. For details on drawing value stream maps in swimlanes, see the eVSM Table function help.
Cycle Time / Takt Time Chart
Min
0
5
10
15
20
25
A280
Accept Order
A310
Approve
A330
Manufacture
A350
Bill Customer
3. Quick Services66 66
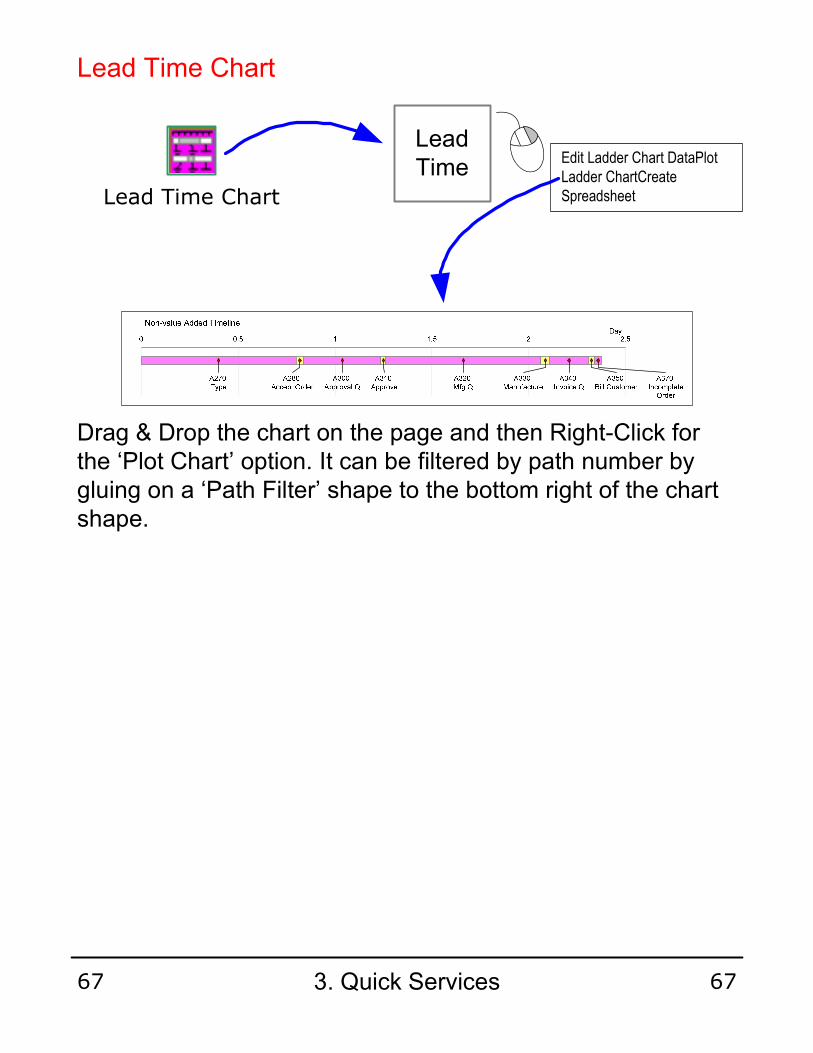
Lead Time Chart
Lead Time Chart
Edit Ladder Chart DataPlot Ladder ChartCreate Spreadsheet
Drag & Drop the chart on the page and then Right-Click for the ‘Plot Chart’ option. It can be filtered by path number by gluing on a ‘Path Filter’ shape to the bottom right of the chart shape.
LeadTime
3. Quick Services67 67
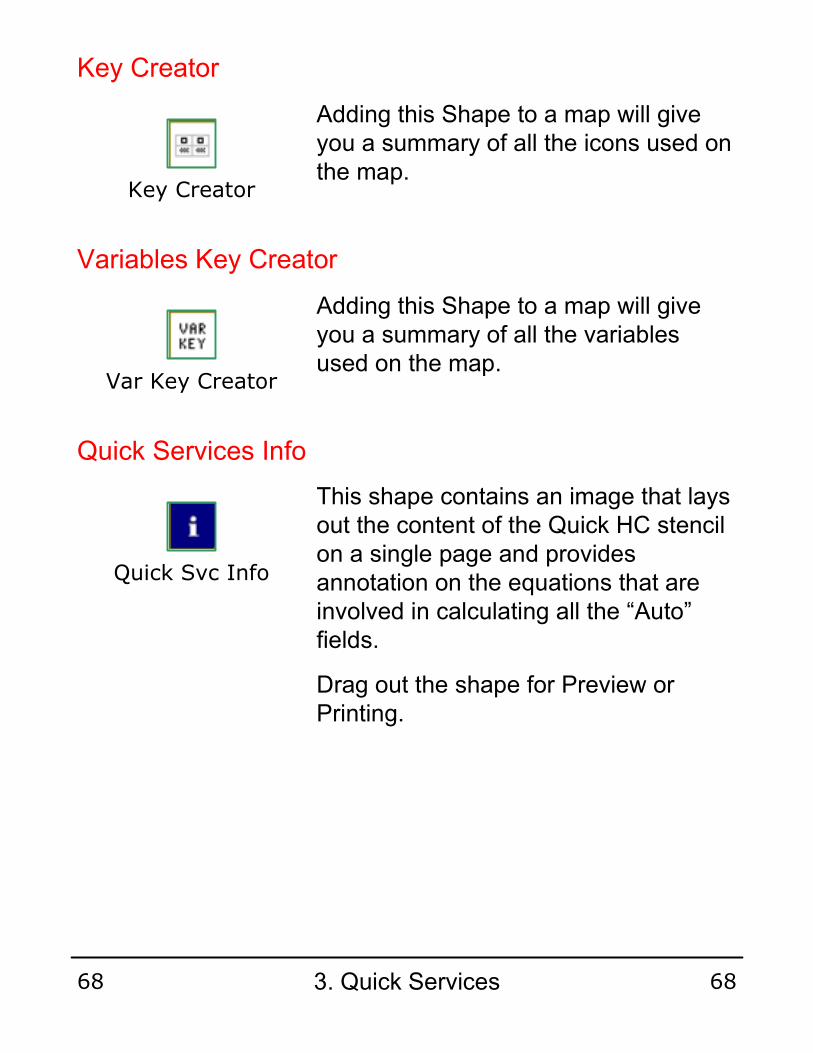
Key Creator
Var Key Creator
Key Creator
Variables Key Creator
Adding this Shape to a map will give you a summary of all the icons used on the map.
Adding this Shape to a map will give you a summary of all the variables used on the map.
This shape contains an image that lays out the content of the Quick HC stencil on a single page and provides annotation on the equations that are involved in calculating all the “Auto” fields.
Drag out the shape for Preview or Printing.
Quick Svc Info
Quick Services Info
3. Quick Services68 68

This area intentionally left blank
3. Quick Services69 69

4. Quick Healthcare
Quick xx denotes Quick eVSM stencils that are built on eVSM to simplify, standardize, and speed up creation of value stream maps in an application area. This chapter talks about the Quick Healthcare (Quick HC) stencil.
What is Quick eVSM ?
Quick Healthcare Stencil
Icon
Macro Shape
Help Movie
Short movies about using eVSM are available at www.evsm.com/help.
Decision
x.xxYES %
x.xxNO %
1
A020
Quick HC
4. Quick Healthcare70 70

Can Quick eVSM stencils be used on existing maps ?
You can only use the Quick eVSM stencils for completely NEW maps. The stencils rely on a standard set of names, units, and eqn’s that old maps will not be compliant to.
Quick eVSM Stencils : Icon Colors
The icons in the Quick HC stencil have the following color conventions:
Both Red Quick HC Icons need to be placed on EVERY map and should be the first items placed on the map.
Green Quick HC Icons represent INDEPENDENT macro shapes.
Yellow Quick HC Icons represent optional add-ons to the macro shapes in the Green Icons.
One of the Red Bar Icons must be placed on EVERY map. It represents demand and is assigned the unit PID (for Patient, Item, or Document) which must not be changed.
Magenta Quick HC Icons represent pre-configured charts that can be dropped on the page and plotted.
4. Quick Healthcare71 71
Note that the main eVSM stencil (typically named eVSM vX.XX) is on the left of the screen. We will refer to this as the “Main Stencil”. It’s important that this stencil is never closed because closing it disables eVSM toolbar functions.
Recommended Layout for Quick eVSM
4. Quick Healthcare72 72
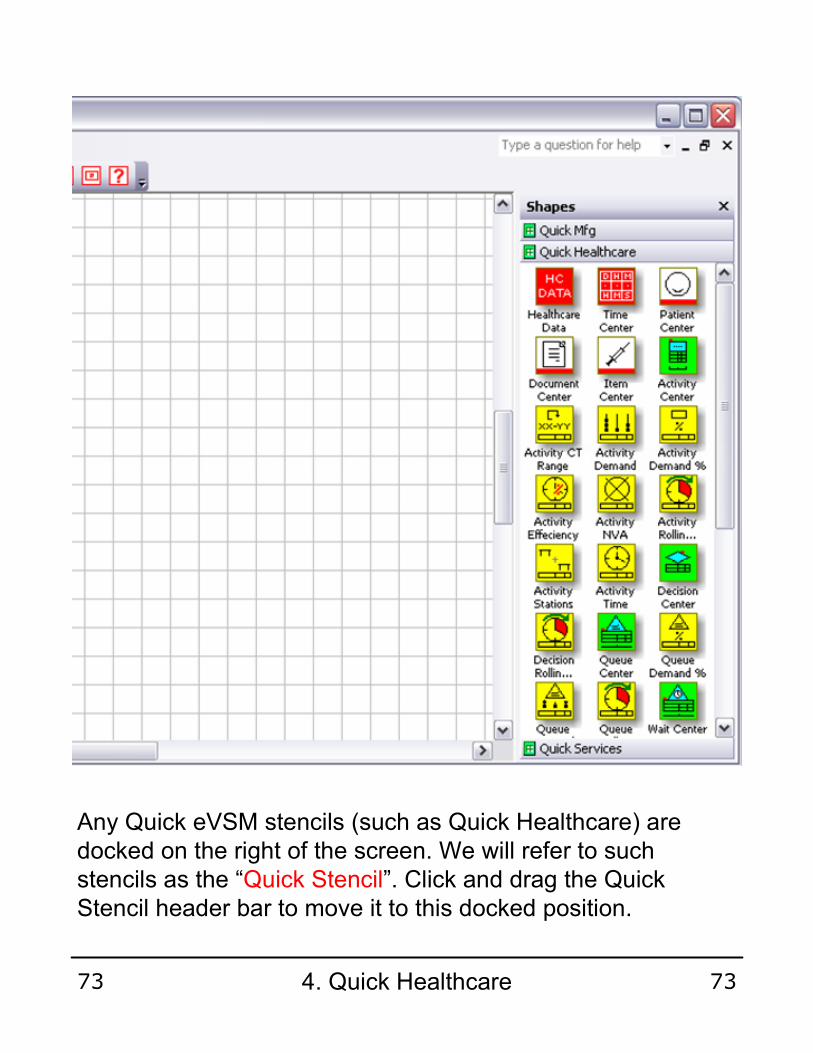
Any Quick eVSM stencils (such as Quick Healthcare) are docked on the right of the screen. We will refer to such stencils as the “Quick Stencil”. Click and drag the Quick Stencil header bar to move it to this docked position.
4. Quick Healthcare73 73

Icon Help
Quick eVSM Icons all have associated help text that is visible if you hold your mouse over the appropriate icon in the stencil.
Drag and Drop Behavior
When you drag and drop an icon on the page it creates either a single shape or a macro shape (a set of connected Shapes).
Red, green, and magenta icons are independent and do not need to be attached to other items when they are being dropped on the page.
Yellow icons represent add-on shapes. They need to be positioned, attached, and glued to their parent shape as part of the drag & drop process.
When the macro shapes corresponding to the green icons are dragged onto the page, they include an ‘Anchor Shape’ that is shaded in light green. To move the macro shape as a whole, this anchor shape should be moved. In the diagram, the truck is the anchor shape.
Moving Shapes On The Map
xxTime
BetweenDay
A010 1
4. Quick Healthcare74 74
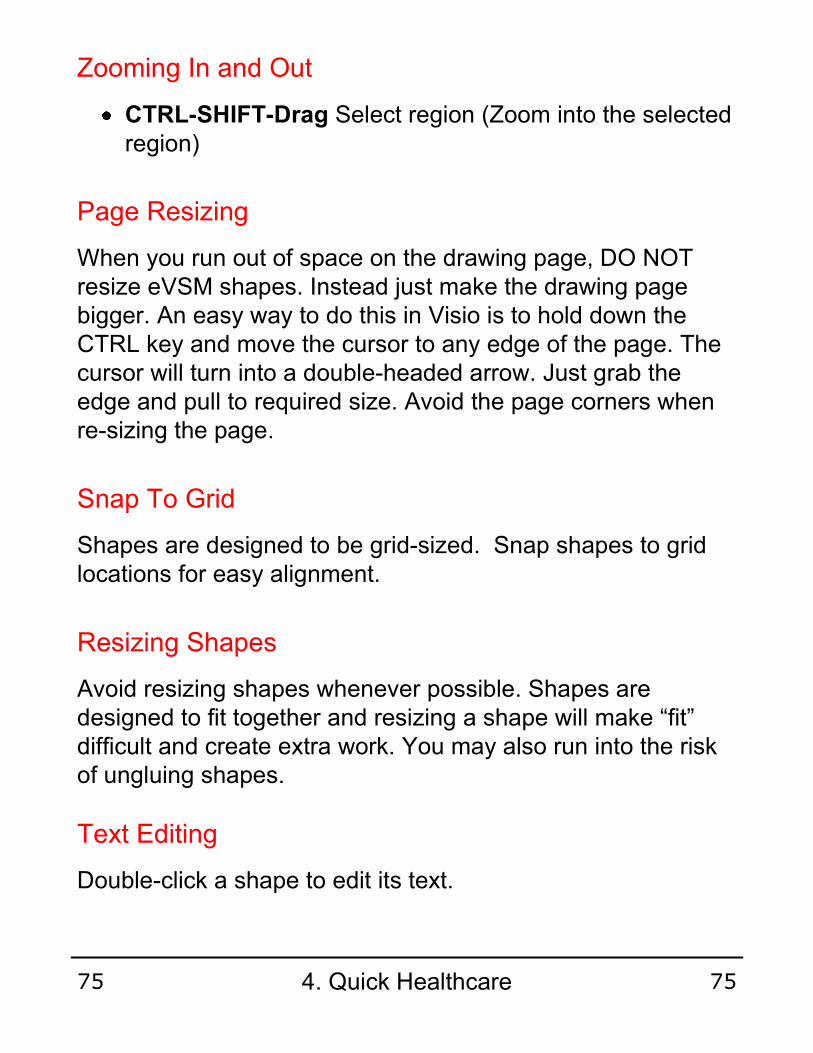
CTRL-SHIFT-Drag Select region (Zoom into the selected region)
Zooming In and Out
When you run out of space on the drawing page, DO NOT resize eVSM shapes. Instead just make the drawing page bigger. An easy way to do this in Visio is to hold down the CTRL key and move the cursor to any edge of the page. The cursor will turn into a double-headed arrow. Just grab the edge and pull to required size. Avoid the page corners when re-sizing the page.
Page Resizing
Resizing Shapes
Double-click a shape to edit its text.
Text Editing
Snap To Grid
Avoid resizing shapes whenever possible. Shapes are designed to fit together and resizing a shape will make “fit” difficult and create extra work. You may also run into the risk of ungluing shapes.
Shapes are designed to be grid-sized. Snap shapes to grid locations for easy alignment.
4. Quick Healthcare75 75
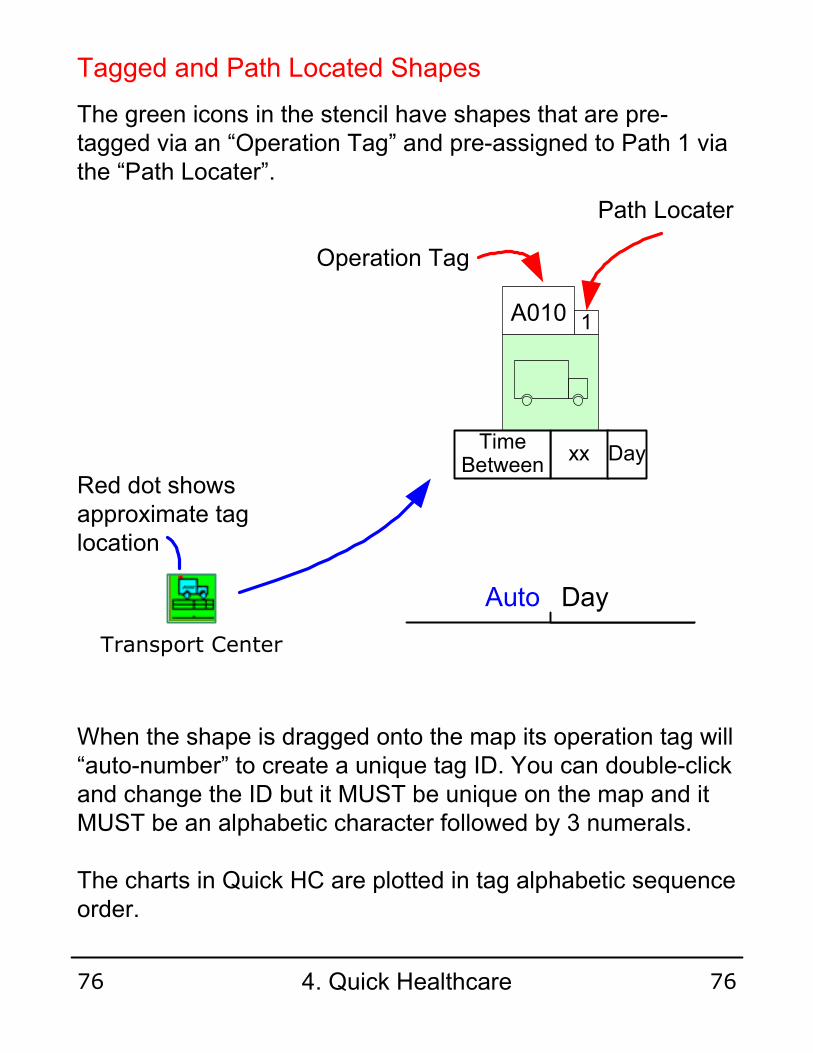
Tagged and Path Located Shapes
The green icons in the stencil have shapes that are pre-tagged via an “Operation Tag” and pre-assigned to Path 1 via the “Path Locater”.
Auto Day
xxTime
BetweenDay
A010
Transport Center
Red dot shows approximate tag location
When the shape is dragged onto the map its operation tag will “auto-number” to create a unique tag ID. You can double-click and change the ID but it MUST be unique on the map and it MUST be an alphabetic character followed by 3 numerals.
The charts in Quick HC are plotted in tag alphabetic sequence order.
Operation Tag
1
Path Locater
4. Quick Healthcare76 76

Data Shapes
Quick HC data shapes have 3 types of entries:
1Group Size PID
x.xxCycle Time Min
AutoCycle Time Per PID Min
AutoActivity Takt Time Min
Shapes with xx in the center field indicate values that MUST be entered.
Some shapes have default values already entered. Override these when necessary.
Any shapes with ‘Auto’ fields should be left alone. They will be automatically calculated.
Most data shapes have a Name, Value, Unit composition. The exception are the ‘Value Added’ and ‘Non Value Added’ shapes where the name is implied.
Auto DayAuto Min
Value Added Non Value Added
4. Quick Healthcare77 77

Drawing Your First Map With Quick Healthcare Stencil
Red icons are MANDATORY on the map and must be the first things that are dragged out onto a new map.
Place the ‘Name Unit Eqns’ on the bottom left of the page.
Place the ‘Time Center’ anywhere on the page and enter the number of work hours per day for the map as a whole. Work hours should exclude planned breaks.
60
Hr
Min
60
Min
Sec
15
Day
Hr
Time Center
Healthcare Data
Place the ‘Patient (or Document or Item) Center’ anywhere on the page and enter the “Daily XX” value (let’s say 200 PID per day). This represents demand for Takt Time calculations.
Z120
150Daily Patients PID
1
ED Patient
Patient Center
4. Quick Healthcare78 78

Wait Center
5Min Wait Time
Min
30Max Wait Time
Min
Optional Wait Shapes
Wait Center
Wait Range
Auto Min
Waiting Room
30Wait Min
A030 1
Typically most maps start with a wait for the Patient, Item, or Document (PID) being processed. So drag out the ‘Wait Center’ and enter the wait type and time as shown. The flat line at the bottom represents the ‘Non Value Added’ time associated with the wait. You can also change the time units when appropriate: just double click on the units, a dialog pops up, select the unit you want and double click it. Use the ‘Wait Center’ anytime there is a wait between activities.
The Wait Range is an optional data shape that can be connected to the bottom of the Wait center and that can be used to indicate the range of wait times. However, only the ‘Wait’ variable is used for calculating lead time.
4. Quick Healthcare79 79

Queue Center
Auto Min
Waiting Room
10Queue PID
A010 1
AutoQueue Loss MinQueue Center
An alternative way to calculate waiting time is through the Queue Center shape. You can directly observe the number of PID’s in a Queue (eg., the number of people in a waiting room or the number of documents in the IN tray), and enter the value (you must NOT change the PID units though). The ‘Non Value Added’ time will automatically be calculated as ‘Queue Loss’ (queue/demand).
Queue Demand
Queue Demand %
Optional Queue Shapes
Add this shape to denote a unique queue demand (due to servicing multiple value streams, perhaps).
Add this shape to denote the demand percent going through this queue.
4. Quick Healthcare80 80
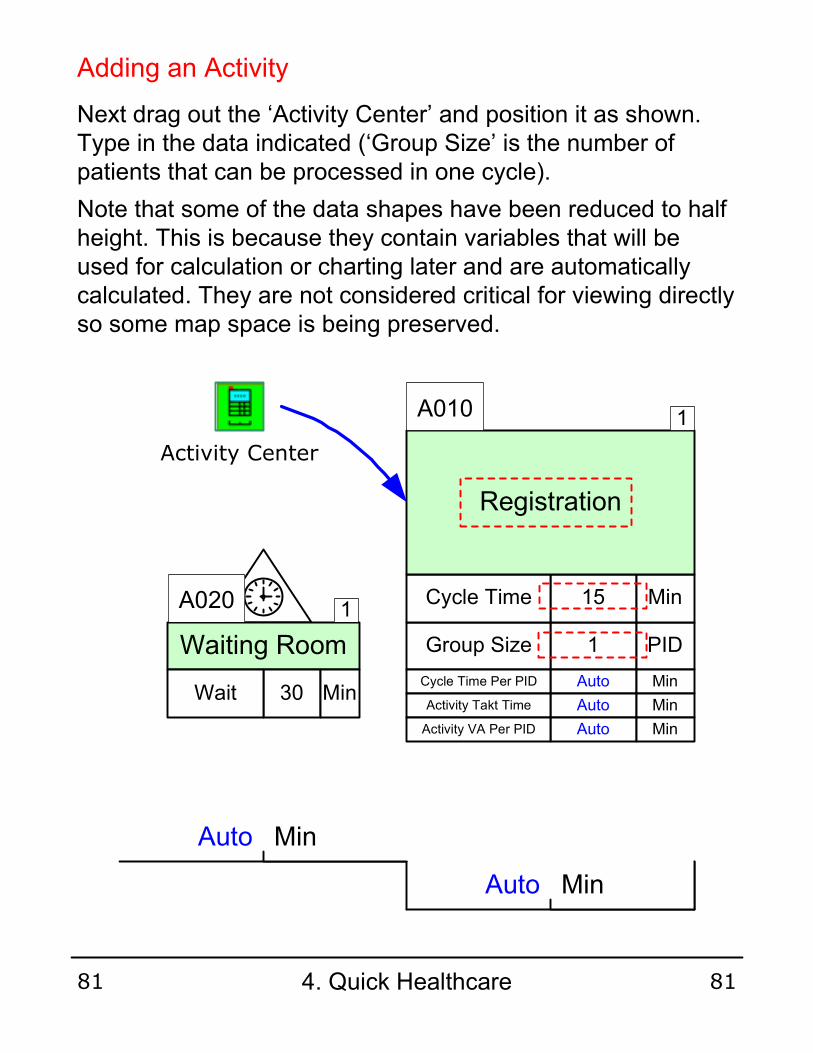
Adding an Activity
Auto Min
1Group Size PID
15Cycle Time Min
AutoCycle Time Per PID Min
AutoActivity Takt Time Min
Registration
A010
AutoActivity VA Per PID Min
Activity Center
Next drag out the ‘Activity Center’ and position it as shown. Type in the data indicated (‘Group Size’ is the number of patients that can be processed in one cycle).
Note that some of the data shapes have been reduced to half height. This is because they contain variables that will be used for calculation or charting later and are automatically calculated. They are not considered critical for viewing directly so some map space is being preserved.
Auto Min
Waiting Room
30Wait Min
A020 1
1
4. Quick Healthcare81 81

Optional Activity Center Shapes
Optional data shapes that can be added to the bottom of the activity center are shown below. The shapes do NOT need to be added to all activities, only to those where they may have significant impact on the value stream.
Activity Demand
Auto Min
1Group Size PID
15Cycle Time Min
AutoCycle Time Per PID Min
AutoActivity Takt Time Min
Registration
AutoActivity VA Per PID Min
200Activity Daily Demand
PID
5Stations StnActivity Stations
VA shape moved down to accommodate optional data shapes.
(Denotes multiple stations performing this activity. Will reduce CT.)
1A070
4. Quick Healthcare82 82
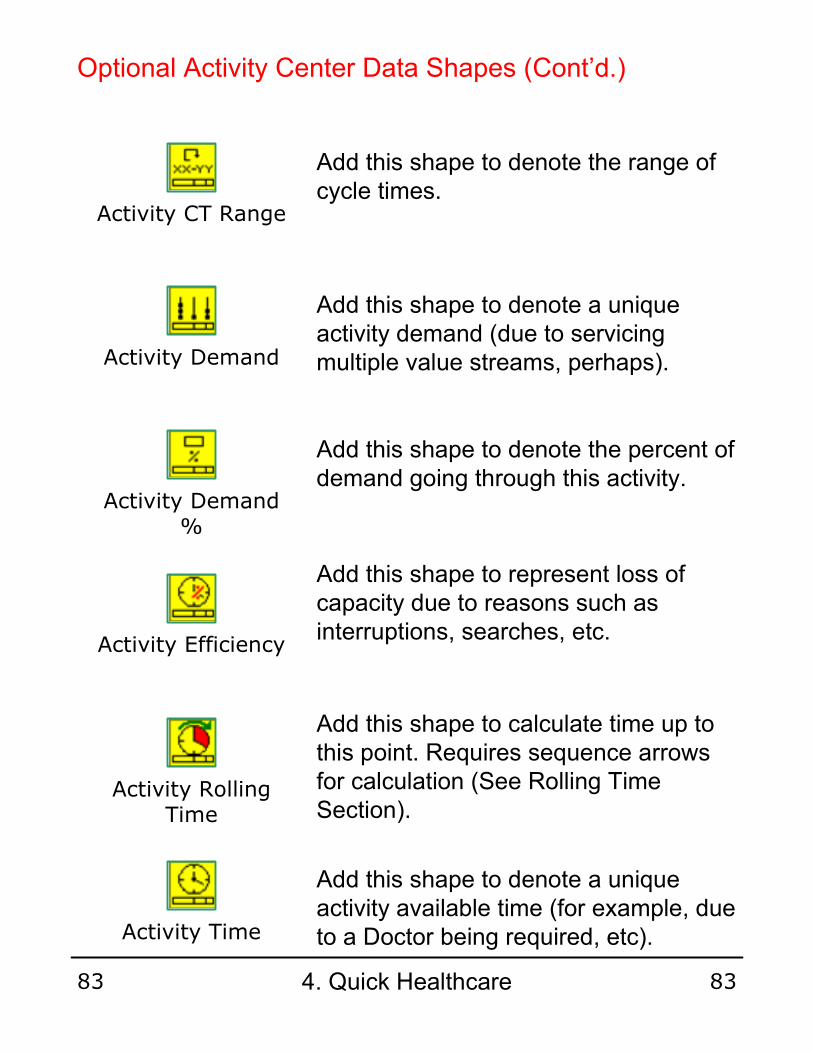
Activity CT Range
Activity Demand %
Activity Demand
Optional Activity Center Data Shapes (Cont’d.)
Add this shape to denote a unique activity demand (due to servicing multiple value streams, perhaps).
Add this shape to represent loss of capacity due to reasons such as interruptions, searches, etc.
Add this shape to denote the range of cycle times.
Add this shape to denote the percent of demand going through this activity.
Activity Efficiency
Add this shape to calculate time up to this point. Requires sequence arrows for calculation (See Rolling Time Section).
Activity Rolling Time
Activity Time
Add this shape to denote a unique activity available time (for example, due to a Doctor being required, etc).
4. Quick Healthcare83 83

Connecting Activities With Arrows
1Group Size PID
x.xxCycle Time Min
AutoActivity Takt Time MinAutoCycle Time Per PID Min
Activity
Auto Min Auto Min
The ‘Tag Seq Arrow’ from the Main eVSM stencil should be used to connect activities together to show the sequence (see Tag Sequence Arrow Section in “Analyzing with eVSM” Chapter).
The red jagged arrow is used to represent electronic information flow (for example, an electronic request for an X-Ray).
AutoActivity VA Per PID Min
1
1Group Size PID
x.xxCycle Time Min
AutoActivity Takt Time MinAutoCycle Time Per PID Min
Activity
AutoActivity VA Per PID Min
1
Electronic Info Flow
Tag Seq Arrow
A050 A065
Transmit Shapes
The Blue Transmit Icon allows you to select the method of information flow. Right click the icon to select.
4. Quick Healthcare84 84

Query Center
When you do NOT have First Time Correct and Complete Information, use the Query Center to capture waste due to resolving incomplete or incorrect information.
Drag out the Query Center Shape and place it between the 2 activities where the query occurs. Use a double-headed dashed arrow to indicate a query transaction.
1
Auto Min
Query Center
Admit ?
25YES %
A030
12
75NO %
Auto Min
1Group Size PID
30Cycle Time Min
AutoCycle Time Per PID Min
AutoActivity Takt Time Min
AutoActivity VA Per PID Min
Admit Patient
A080 2
25Demand Percent
%
Insurance
30Time Per Query
Min
20Query Percent
%
AutoQuery Loss
Min
A020
4. Quick Healthcare85 85

Time to make a Decision
Admit ?
25YES %
75NO %
1
A010
Decision Center
Drag out the Decision block and place it after an activity. This block does not add to process time, but allows for a PID to move to different activities (for example, whether a patient needs admitting or not). Estimate how often this decision is true or not, as a percentage, and fill in the data as shown.
You will need to add a second Path Number to track the alternate path the PID takes (see the following section for a discussion). Drag the Path Locater icon (from the Main eVSM Stencil) onto the Decision shape and connect it. The red square appears briefly to indicate a glue connection. Double click and select a path number for this alternate path.
Admit ?
1
Path Locater
2
4. Quick Healthcare86 86

Yes
The example above shows the 2 possible paths a patient can take after the decision. Path 1 leads to discharge and Path 2 to admission. You will need to drag the optional ‘Activity Demand %’ shape and glue it to the Activity Center shapes to indicate the percent of demand flowing through each path.
1
Admit ?
25YES %
A030
12
75NO %
Auto Min
1Group Size PID
5Cycle Time Min
AutoCycle Time Per PID Min
AutoActivity Takt Time Min
AutoActivity VA Per PID Min
Discharge
A060 1
Auto Min
1Group Size PID
30Cycle Time Min
AutoCycle Time Per PID Min
AutoActivity Takt Time Min
AutoActivity VA Per PID Min
Admit
A080 2
No
75Demand Percent
%
25Demand Percent
%
Activity Demand %
You can then place two Time Summary (see Time Summary section) shapes to summarize the alternate paths.
AutoTakt Time Min
AutoTotal Value
AddedMin
AutoTotal Time Hr
AutoValue Added
Percent%
Z110
Time Summary
1
1AutoTakt Time Min
AutoTotal Value
AddedMin
AutoTotal Time Hr
AutoValue Added
Percent%
Z115
Time Summary
2
Path 1 Summary
Path 2 Summary
4. Quick Healthcare87 87
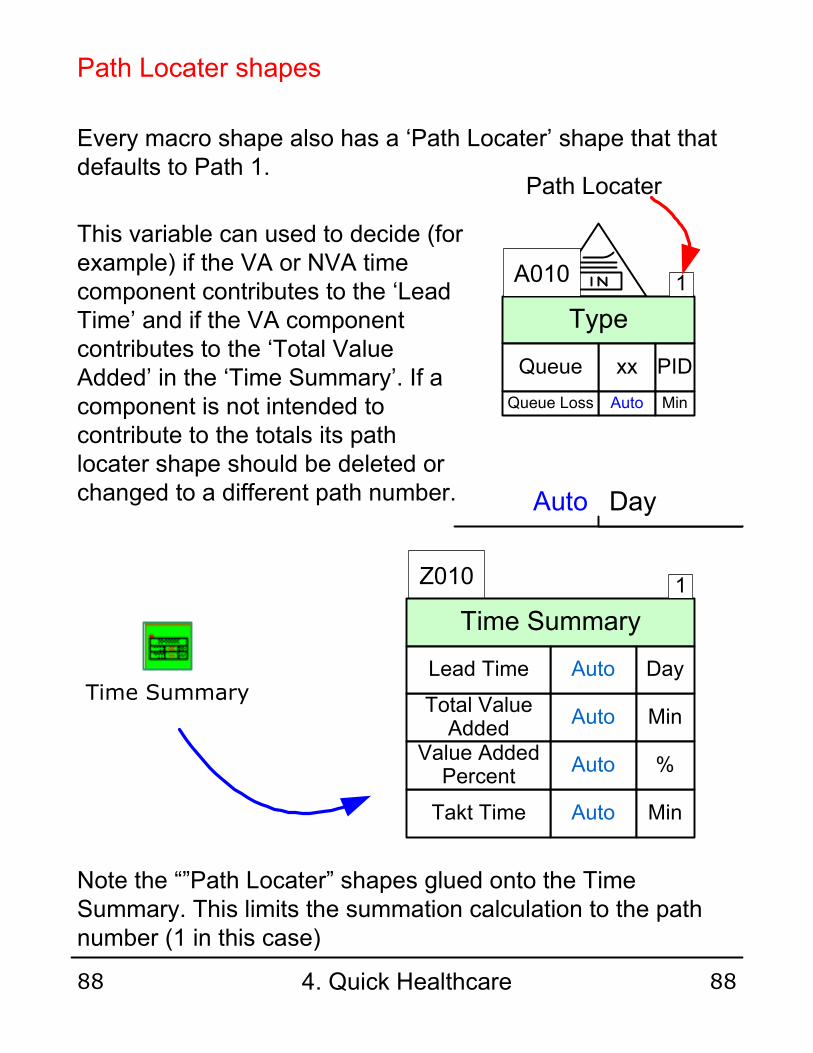
Path Locater shapes
Every macro shape also has a ‘Path Locater’ shape that that defaults to Path 1.
Auto Day
Time Summary
Note the “”Path Locater” shapes glued onto the Time Summary. This limits the summation calculation to the path number (1 in this case)
Z010
Time Summary
AutoTakt Time Min
AutoTotal Value
AddedMin
AutoLead Time Day
AutoValue Added
Percent%
Type
xxQueue PID
A010 1
AutoQueue Loss Min
1
Path Locater
This variable can used to decide (for example) if the VA or NVA time component contributes to the ‘Lead Time’ and if the VA component contributes to the ‘Total Value Added’ in the ‘Time Summary’. If a component is not intended to contribute to the totals its path locater shape should be deleted or changed to a different path number.
4. Quick Healthcare88 88

AutoRolling Time MinRolling Time
Rolling Time Calculation
Optional Rolling Time shapes are available for all Shape Centers. They are recognizable by a curved green arrow over a clock in the icon.
Rolling Time is be used to show how long the PID has been on the VSM up to that point.
Rolling Time is automatically calculated, but requires that Shape Tags be connected by sequence arrows (see Tag Sequence Arrow Section in “Analyzing with eVSM” Chapter) and EVERY green shape upstream MUST also have ‘Rolling Time’ attached.
Waiting Room
30Wait Min
A010 1
1Group Size PID
12Cycle Time Min
AutoCycle Time Per PID Min
AutoActivity Takt Time Min
Registration
AutoActivity VA Per PID Min
AutoRolling Time Min
Activity Rolling Time
Tag Seq Arrow
A060
4. Quick Healthcare89 89

Transmit Center
Auto Day
xxTime
BetweenDay
Indicating Transportation or Transmit Method
Transport Center
Auto Day
xxTime
BetweenDay
A010 A0201 1
Delete the ‘Path Locater’ and the NVA data blocks if the NVA time does not participate in the lead time calculation.
Right-click on the transport or transmit icons to select another type from the family.
4. Quick Healthcare90 90

Time Summary
Time Summary
Drag & drop to the bottom right of the page and just to the right of the VA/NVA timeline.
Note that the “Path 1” filter shapes applied to the summation calculations for ‘Total Time’ and ‘Total Value Added’ time.
Z010
Time Summary
AutoTakt Time Min
AutoTotal Value
AddedMin
AutoTotal Time Hr
AutoValue Added
Percent%
1
Calculating the “Auto” Variables
Once you have entered data in all the input fields, make sure that all the light green shapes are tagged (See the ‘Tagging Shapes’ section earlier in this chapter).
Click the “Q” button in the toolbar to execute the built-in equations. This will create values in all the “Auto” fields.
Whenever data is changed on the map, this button should be clicked to update the map.
Quick eVSM
4. Quick Healthcare91 91

Cycle Time / Takt Time Chart
CT / TT Chart
Edit Chart DataPlot ChartCreate Spreadsheet
Drag & Drop the chart on the page and then Right-Click for the ‘Plot Chart’ option. It can be filtered by path number by gluing on a ‘Path Filter’ shape to the bottom right of the chart shape.
Cycle Time / Takt Time Chart
Min
0
5
10
15
20
25
A080
Admission
A100
Prep
A120
Procedure
A130
DX/RX Info &
Discharge
Cycle Time Per PID
Activity Takt Time
4. Quick Healthcare92 92

Lead Time Chart
Edit Ladder Chart DataPlot Ladder ChartCreate Spreadsheet
Lead Time Chart
Lead Time Components
Hr
0 0.2 0.4 0.6 0.8 1 1.2 1.4
A080Admission
A090Wait Rm1
A100Prep
A110Wait Rm 2
A120Procedure
A130DX/RX Info &
Discharge
A150Wait Rm 3
Activity VA Per PID
Wait
Drag & Drop the chart on the page and then Right-Click for the ‘Plot Chart’ option. It can be filtered by path number by gluing on a ‘Path Filter’ shape to the bottom right of the chart shape.
4. Quick Healthcare93 93

HC DATA
11.00 Min
1Group Size PID
11Cycle Time Min
11.00Cycle Time Per PID Min
15.00Activity Takt Time Min
Admission
A080 1
11.00Activity VA Per PID Min
5Min Cycle
TimeMin
14Max Cycle
TimeMin
3.00 Min
Wait Rm1
3Wait Min
A090 1
1Min Wait Time
Min
15Max Wait Time
Min
21.00 Min
1Group Size PID
21Cycle Time Min
21.00Cycle Time Per PID Min
15.00Activity Takt Time Min
Prep
A100 1
21.00Activity VA Per PID Min
16Min Cycle
TimeMin
27Max Cycle
TimeMin
Scheduler
64.00 Min
64Wait Min
Wait
A180 1
8Min Wait Time
Min
81Max Wait Time
Min
ApptInfo. Clinic
Info.
Quick Healthcare VSM Example
Use the Value Stream Map (from Review by Cindy Jimmerson) above as an exercise to create your own first VSM using Quick Healthcare.
If you have any questions or problems contact us at [email protected].
4. Quick Healthcare94 94

60
Hr
Min
60
Min
Sec
10
Day
Hr
40Daily Patients PID
Z020 1
Cardio
16.00 Min
Wait Rm 2
16Wait Min
A110
1Min Wait Time
Min
80Max Wait Time
Min
19.00 Min
1Group Size PID
19Cycle Time Min
19.00Cycle Time Per PID Min
15.00Activity Takt Time Min
Procedure
A120 1
19.00Activity VA Per PID Min
18Min Cycle
TimeMin
22Max Cycle
TimeMin
DX/RX Info & Discharge
10Cycle Time Min
A130 1
10.00Cycle Time Per PID Min
1Group Size PID0Min Wait Time
Min
14Max Wait Time
Min
2Wait Min
1
10.00Activity VA Per PID Min
15.00Activity Takt Time Min
12Max Cycle
TimeMin
7Min Cycle
TimeMin
2.00 Min
Wait Rm 3
A150
10.00 Min
Cardiology Office
1
15.00Takt Time Min
61.00Total Value Added Min
2.43Total Time Hr
41.78Value Added Percent
%
Z200
Time Summary1Patient Flow For Treadmills
John Abrahams
Rev 4, July 23rd
4. Quick Healthcare95 95

Quick Healthcare Info
Quick HC Info
This shape contains an image that lays out the content of the Quick HC stencil on a single page and provides annotation on the equations that are involved in calculating all the “Auto” fields.
Drag out the shape for Preview or Printing.
Key Creator
Var Key Creator
Key Creator
Var Key Creator
Adding this Shape to a map will give you a summary of all the icons used on the map.
Adding this Shape to a map will give you a summary of all the variables used on the map.
4. Quick Healthcare96 96

Quick HC Summary
Quick HC stencils provide a standard, easy, and rapid means of creating, analyzing, and visualizing the map.
The Quick Healthcare stencil in eVSM V5 provides a highly productive way of working with value stream maps. The eVSM group plans to create further “Quick” stencils in response to customer demand. If you have such a request please email us at [email protected].
4. Quick Healthcare97 97

5. Quick MCTLite
Manufacturing Critical-path Time (MCT) is Quick Response Manufacturing’s (QRM) metric for Lead Time. The Quick MCTLite allows for quick drawing of maps with Flow Times and the MCT chart.
What is Quick MCTLite ?
Quick MCT Stencil
Icon
Macro Shape
Opening the Quick MCTLite Stencil.
From the eVSM Toolbar, click on the Quick MCT button to open up the MCT stencils.
Quick MCT Button
Mfg Wait
A040
AutoMfg NVA Day
xxWait Day
5. Quick MCTLite98 98
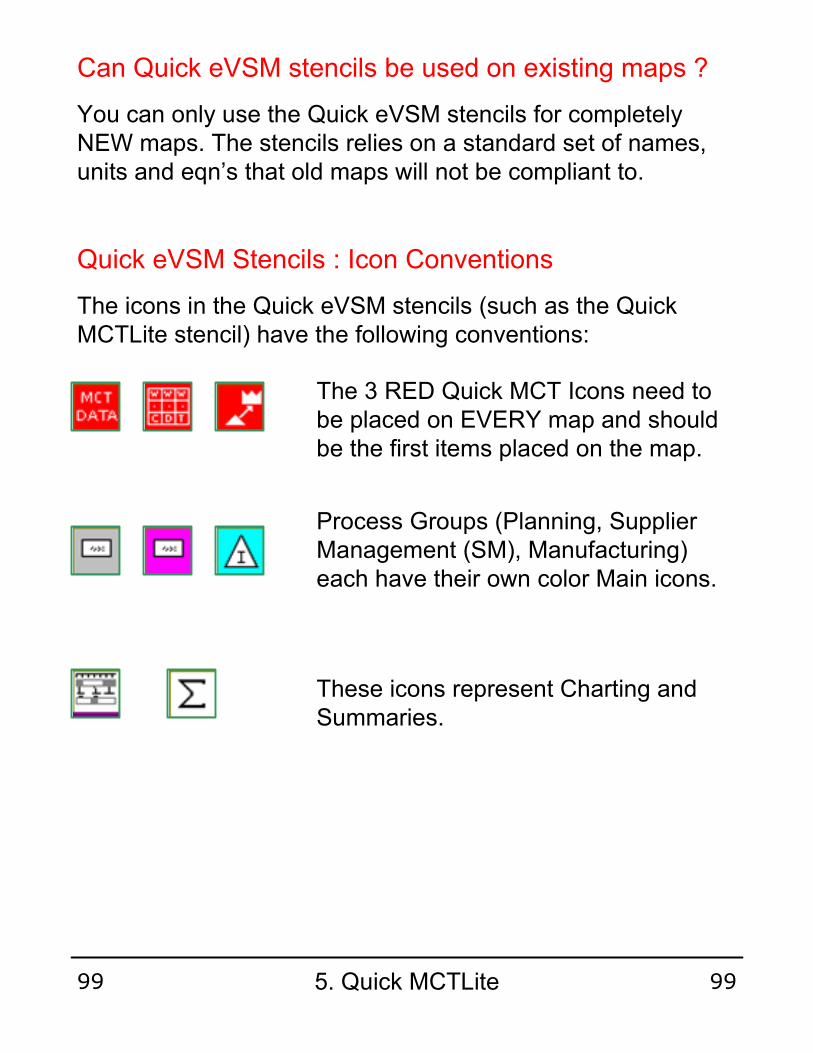
Can Quick eVSM stencils be used on existing maps ?
You can only use the Quick eVSM stencils for completely NEW maps. The stencils relies on a standard set of names, units and eqn’s that old maps will not be compliant to.
Quick eVSM Stencils : Icon Conventions
The icons in the Quick eVSM stencils (such as the Quick MCTLite stencil) have the following conventions:
The 3 RED Quick MCT Icons need to be placed on EVERY map and should be the first items placed on the map.
Process Groups (Planning, Supplier Management (SM), Manufacturing) each have their own color Main icons.
These icons represent Charting and Summaries.
5. Quick MCTLite99 99
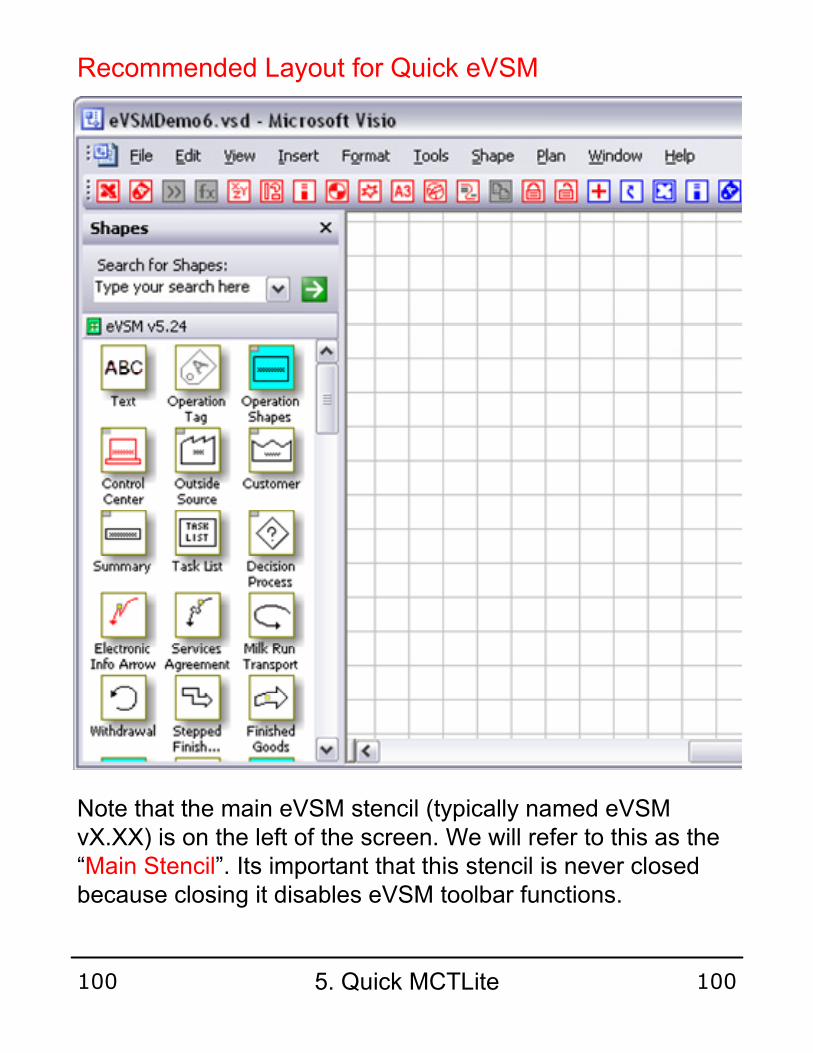
Recommended Layout for Quick eVSM
Note that the main eVSM stencil (typically named eVSM vX.XX) is on the left of the screen. We will refer to this as the “Main Stencil”. Its important that this stencil is never closed because closing it disables eVSM toolbar functions.
5. Quick MCTLite100 100

Any Quick eVSM stencils (such as Quick MCTLite) are docked on the right of the screen. We will refer to such stencils as the “Quick Stencil”. Click and drag the Quick Stencil header bar to move it to this docked position.
5. Quick MCTLite101 101
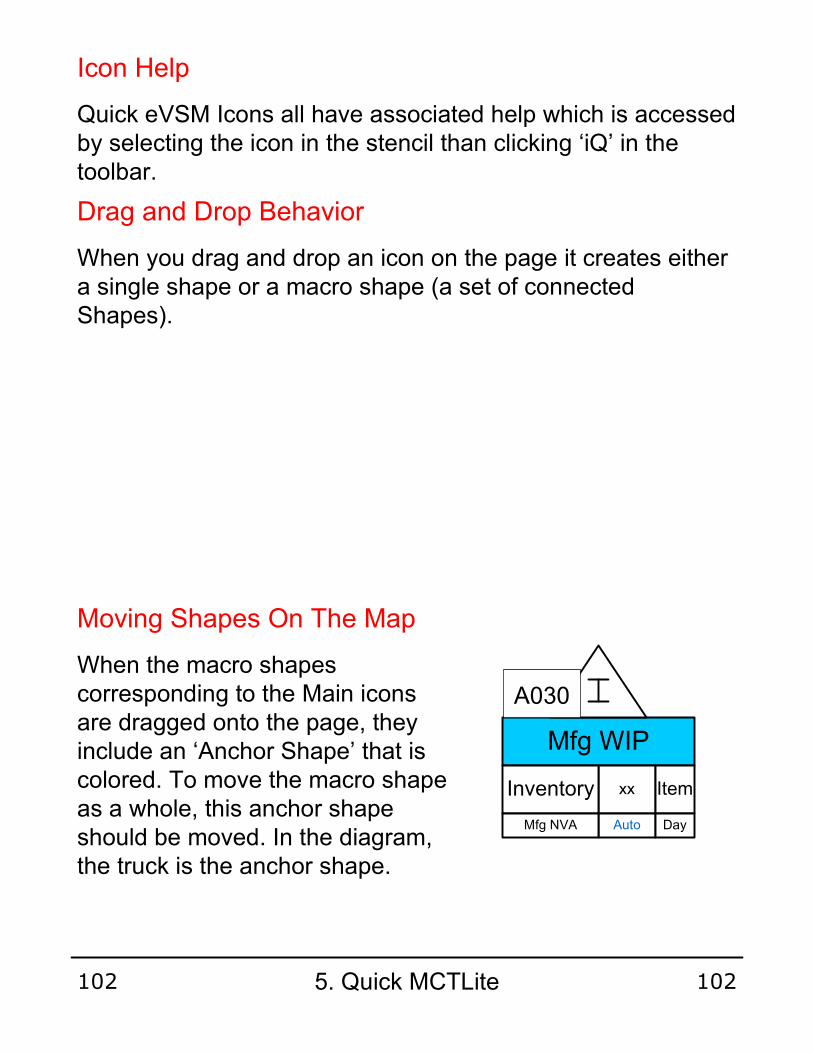
Icon Help
Quick eVSM Icons all have associated help which is accessed by selecting the icon in the stencil than clicking ‘iQ’ in the toolbar.
Drag and Drop Behavior
When you drag and drop an icon on the page it creates either a single shape or a macro shape (a set of connected Shapes).
When the macro shapes corresponding to the Main icons are dragged onto the page, they include an ‘Anchor Shape’ that is colored. To move the macro shape as a whole, this anchor shape should be moved. In the diagram, the truck is the anchor shape.
Moving Shapes On The Map
Mfg WIP
xxInventory Item
A030
AutoMfg NVA Day
5. Quick MCTLite102 102

CTRL-SHIFT-Drag Select region (Zoom into the selected region)
Zooming In and Out
When you run out of space on the drawing page, DO NOT resize eVSM shapes. Instead just make the drawing page bigger. An easy way to do this in Visio is to hold down the CTRL key and move the cursor to any edge of the page. The cursor will turn into a double-headed arrow. Just grab the edge and pull to required size. Avoid the page corners when re-sizing the page.
Page Resizing
Resizing Shapes
Double-click a shape to edit its text.
Text Editing
Snap To Grid
Avoid resizing shapes whenever possible. Shapes are designed to fit together and resizing a shape will make “fit” difficult and create extra work.
Shapes are designed to be grid-sized. Snap shapes to grid locations for easy alignment.
5. Quick MCTLite103 103

Tagged and Path Located Shapes
Some icons in the stencil have shapes that are pre-tagged via an “Operation Tag”.
When the shape is dragged onto the map its operation tag will “auto-number” to create a unique tag ID. You can double-click and change the ID but it MUST be unique on the map and it MUST be an alphabetic character followed by 3 numerals.
The charts in Quick MCT are plotted in tag alphabetic sequence order.
Operation Tag
Mfg WIP
xxInventory Item
A020
AutoMfg NVA Day
Mfg WIP
5. Quick MCTLite104 104

Data Shapes
Quick eVSM data shapes have 3 types of entries:
x.xxCycle Time Min
Shapes with xx in the center field indicate values that MUST be entered.
Some shapes have default values already entered. Override these when necessary.
Any shapes with ‘Auto’ fields should be left alone. They will be automatically calculated.
AutoMfg VA Min
AutoMfg NVA Day
0Flow Time OHr
5. Quick MCTLite105 105

Path Locater shapes
Every macro shape that has a Value Added (VA) or Non Value Added (NVA) data shape contribute to MCT Total and Response.
Mfg WIP
xxInventory Item
A130
AutoMfg NVA Day
MCT Summary
Mfg WIP
MCT Summary
Z010
AutoMCT Response CDay
AutoMCT Total CDay
1
Path Filter
Note the “”Path Filter” shapes glued onto the top of the ‘MCT Summary’ shape. These filters limit the summation calculation to the path numbers ( 1 and 2 in this case). They are also used to map separate paths in the MCT Chart.
2
5. Quick MCTLite106 106

Drawing Your First Map With Quick MCT Stencil
Place the ‘MCT Data’ on the bottom left of the page.
Fill out all the “XX” values in the units converters. In these converters time units prefixed with an “O” refer to office times, those with a “C” refer to calendar times and those without a prefix relate to production times
Time Center
7
Wk
CDay
xx
Wk
Day
24
CDay
CHr
xx
Wk
ODay
xx
ODay
OHr
60
OHr
OMin
60
CHr
CMin
xx
Day
Hr
60
Hr
Min
60
Min
Sec
60
CMin
CSec
60
OMin
OSec
MCT Data
5. Quick MCTLite107 107
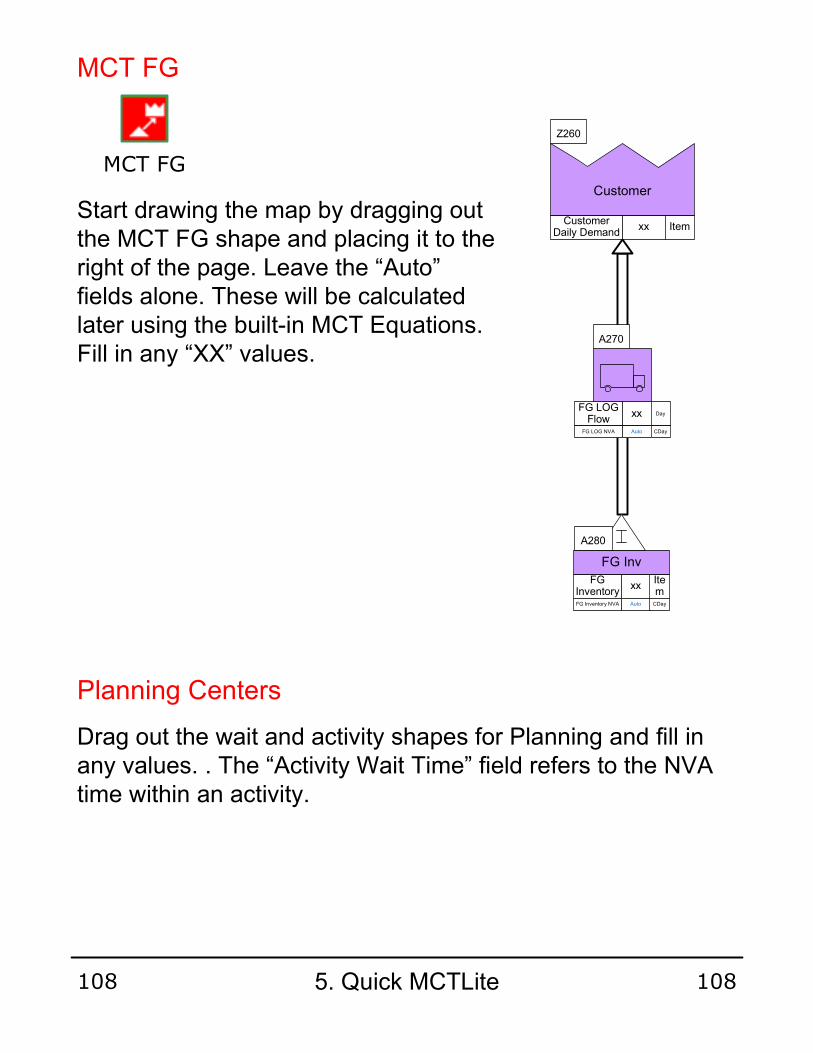
Drag out the wait and activity shapes for Planning and fill in any values. . The “Activity Wait Time” field refers to the NVA time within an activity.
Planning Centers
MCT FG
Start drawing the map by dragging out the MCT FG shape and placing it to the right of the page. Leave the “Auto” fields alone. These will be calculated later using the built-in MCT Equations. Fill in any “XX” values.
MCT FG
xxCustomer
Daily DemandItem
xxFG LOG Flow
Day
xxFG
InventoryItem
AutoFG LOG NVA CDay
AutoFG Inventory NVA CDay
Customer
Z260
A270
FG Inv
A280
5. Quick MCTLite108 108

Planning Cont’d
Planning Activity
A210
Plan Activity
xxCycle Time OMin
0Flow Time OHr
AutoPln VA CMin
AutoPln NVA CHr
Flow Time is the total time taken by an item entering this process to exiting it (including any non-processing (NVA) time). Cycle Time is the actual hands on time.
Planning Queue
xxWait OHr
A010
AutoPln NVA CHr
Plan Wait
‘Wait’ time captures waste due to queues.
5. Quick MCTLite109 109
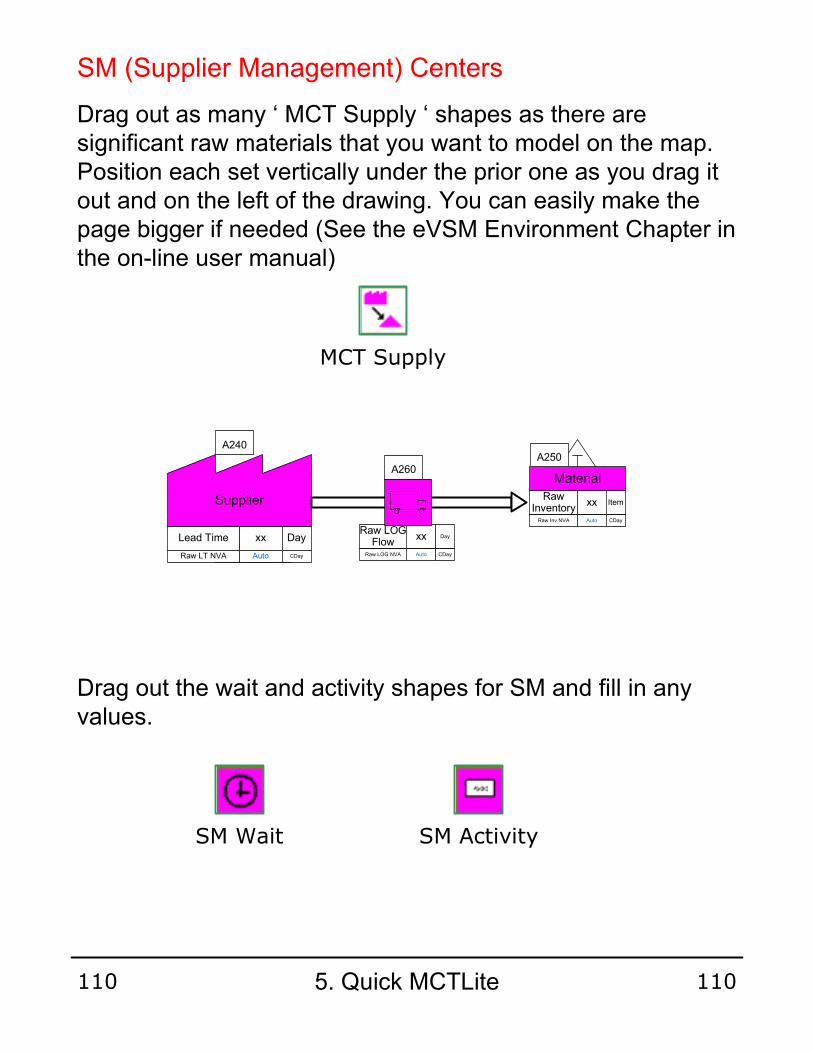
SM (Supplier Management) Centers
Drag out the wait and activity shapes for SM and fill in any values.
Drag out as many ‘ MCT Supply ‘ shapes as there are significant raw materials that you want to model on the map. Position each set vertically under the prior one as you drag it out and on the left of the drawing. You can easily make the page bigger if needed (See the eVSM Environment Chapter in the on-line user manual)
MCT Supply
A210xxLead Time Day
Supplier xxRaw
InventoryItem
AutoRaw Inv NVA CDay
AutoRaw LT NVA CDay
xxRaw LOG
FlowDay
AutoRaw LOG NVA CDay
A240
Material
A250A260
SM Wait SM Activity
5. Quick MCTLite110 110

Mfg (Manufacturing) Centers
Drag out manufacturing WIP, Wait and Activity shapes to complete the VSM
Mfg ActivityMfg WIP Mfg Wait
5. Quick MCTLite111 111

Click the “Quick eVSM” button in the eVSM toolbar. Give it time to calculate all the fields (can take a few minutes). You must click this button to rerun calculations when you change map data.
Drawing the MCT Chart
Drag out the ‘White/Gray Map’ shape and attach “Path Filter” shapes to it from the stencil on the left of the page. These are glued to the bottom right corner. One path filter shape for each path number. Now right-click the chart shape and select the “plot” option
MCT Summary
Drag out the ‘MCT summary’ shape and attach a “path locater” shape to the top right of the activity. Double click the path locater shape to select the path you want a summary for. Only ONE path locater should be attached to the summary. Once this is done click the “eVSM Calculator” button in the toolbar to calculate the summary values
Putting path numbers on shapes
Use the red “eVSM Tag Path Locater Defaults” toolbar button to set up path number defaults and then use the red “eVSM AutoPath” toolbar button to pick each set of activity shapes in sequence and apply path numbers to them and staring at the customer shape. The MCT chart will have one bar for each path number
Calculating the “Auto” Fields
eVSM AutoPatheVSM Tag Path Locater Defaults
Quick eVSM
White/Gray Map
5. Quick MCTLite112 112

Mfg Activity
xxCycle Time Sec
0Flow Time Hr
AutoMfg VA Min
AutoMfg NVA Day
A060
Mfg Activity
Connecting Activities With Arrows
Stepped Arrows
FIFO Arrow
ExpeditedInformationKanbanMaterialPushService
Curvable Arrows
One of the arrows above should be used to connect activities together to show the sequence. A Right-Click provides additional formats to show the type of flow (PUSH in the above example).
Electronic Info Flow
The red jagged arrow is used to represent electronic information flow (for example, an email of a forecast from a customer).
Finished Goods
xxCycle Time Sec
0Flow Time Hr
AutoMfg VA Min
AutoMfg NVA Day
A060
5. Quick MCTLite113 113

6. Quick MCT
Manufacturing Critical-path Time (MCT) is Quick Response Manufacturing’s (QRM) metric for Lead Time. The Quick MCT is the more advanced template that features detailed variables for full VSM and MCT calculations
What is Quick MCT ?
Quick MCT Stencil
Icon
Macro Shape
Opening the Quick MCT Stencil.
From the eVSM Toolbar, click on the Quick MCT button to open up the MCT stencils.
Quick MCT Button
Mfg Wait
A040
AutoMfg NVA Day
xxWait Day
6. Quick MCT114 114

Can Quick eVSM stencils be used on existing maps ?
You can only use the Quick eVSM stencils for completely NEW maps. The stencils relies on a standard set of names, units and eqn’s that old maps will not be compliant to.
Quick eVSM Stencils : Icon Conventions
The icons in the Quick eVSM stencils (such as the Quick MCT stencil) have the following conventions:
The 3 RED Quick MCT Icons need to be placed on EVERY map and should be the first items placed on the map.
Process Groups (Planning, Supplier Management (SM), Manufacturing) each have their own color Main icons.
Yellow Quick eVSM Icons represent optional add-ons to the main macro shapes. These icons are named to correspond to the Main icons to which they can be added.
These icons represent Charting and Summaries.
6. Quick MCT115 115

Recommended Layout for Quick eVSM
Note that the main eVSM stencil (typically named eVSM vX.XX) is on the left of the screen. We will refer to this as the “Main Stencil”. Its important that this stencil is never closed because closing it disables eVSM toolbar functions.
6. Quick MCT116 116

Any Quick eVSM stencils (such as Quick MCT) are docked on the right of the screen. We will refer to such stencils as the “Quick Stencil”. Click and drag the Quick Stencil header bar to move it to this docked position.
6. Quick MCT117 117

Icon Help
Quick eVSM Icons all have associated help which is accessed by selecting the icon in the stencil than clicking ‘iQ’ in the toolbar.
Drag and Drop Behavior
When you drag and drop an icon on the page it creates either a single shape or a macro shape (a set of connected Shapes).
Except yellow icons all the others are independent and do not need to be attached to other items when they are being dropped on the page.
Yellow icons represent add-on shapes. They need to be positioned and attached to their parent shape as part of the drag & drop process.
When the macro shapes corresponding to the Main icons are dragged onto the page, they include an ‘Anchor Shape’ that is colored. To move the macro shape as a whole, this anchor shape should be moved. In the diagram, the ‘Mfg WIP’ is the anchor shape.
Moving Shapes On The Map
Mfg WIP
xxInventory Item
A030
AutoMfg NVA Day
6. Quick MCT118 118
CTRL-SHIFT-Drag Select region (Zoom into the selected region)
Zooming In and Out
When you run out of space on the drawing page, DO NOT resize eVSM shapes. Instead just make the drawing page bigger. An easy way to do this in Visio is to hold down the CTRL key and move the cursor to any edge of the page. The cursor will turn into a double-headed arrow. Just grab the edge and pull to required size. Avoid the page corners when re-sizing the page.
Page Resizing
Resizing Shapes
Double-click a shape to edit its text.
Text Editing
Snap To Grid
Avoid resizing shapes whenever possible. Shapes are designed to fit together and resizing a shape will make “fit” difficult and create extra work.
Shapes are designed to be grid-sized. Snap shapes to grid locations for easy alignment.
6. Quick MCT119 119

Tagged and Path Located Shapes
Some icons in the stencil have shapes that are pre-tagged via an “Operation Tag”.
When the shape is dragged onto the map its operation tag will “auto-number” to create a unique tag ID. You can double-click and change the ID but it MUST be unique on the map and it MUST be an alphabetic character followed by 3 numerals.
The charts in Quick MCT are plotted in tag alphabetic sequence order.
Operation Tag
Mfg WIP
xxInventory Item
A020
AutoMfg NVA Day
Mfg WIP
6. Quick MCT120 120

Data Shapes
Quick eVSM data shapes have 3 types of entries:
x.xxCycle Time Min
AutoCycle Time Per Item Min
AutoActivity Takt Time Min
Shapes with xx in the center field indicate values that MUST be entered.
Some shapes have default values already entered. Override these when necessary.
Any shapes with ‘Auto’ fields should be left alone. They will be automatically calculated.
Most data shapes have a Name, Value, Unit composition. The exception are the ‘Value Added’ and ‘Non Value Added’ shapes where the name is implied.
Auto Day
Auto Min
Value Added
Non Value Added
1Qty Per Cycle Ord
6. Quick MCT121 121

Path Locater shapes
Every macro shape that has a Value Added (VA) or Non Value Added (NVA) data shape contribute to MCT Total and Response.
Auto Day
12
Note the “”Path Filter” shapes glued onto the top of the ‘MCT Summary’ shape. These filters limit the summation calculation to the path numbers ( 1 and 2 in this case). They are also used to map separate paths in the MCT Chart.
Mfg WIP
xxInventory Item
A130
AutoMfg NVA Day
AutoMfg WIP NVA CDay
MCT Summary
Z050
AutoMCT Response CDay
AutoMCT Total CDay
AutoTakt Time Min
AutoCMP VA Day
AutoCMP VA to MCT Total Percent
%
MCT Summary
Mfg WIP
6. Quick MCT122 122

Drawing Your First Map With Quick MCT Stencil
Place the ‘MCT Data’ on the bottom left of the page.
Fill out all the “XX” values in the units converters. In these converters time units prefixed with an “O” refer to office times, those with a “C” refer to calendar times and those without a prefix relate to production times
Time Center
7
Wk
CDay
xx
Wk
Day
24
CDay
CHr
xx
Wk
ODay
xx
ODay
OHr
60
OHr
OMin
60
CHr
CMin
xx
Day
Hr
60
Hr
Min
60
Min
Sec
60
CMin
CSec
60
OMin
OSec
MCT Data
6. Quick MCT123 123
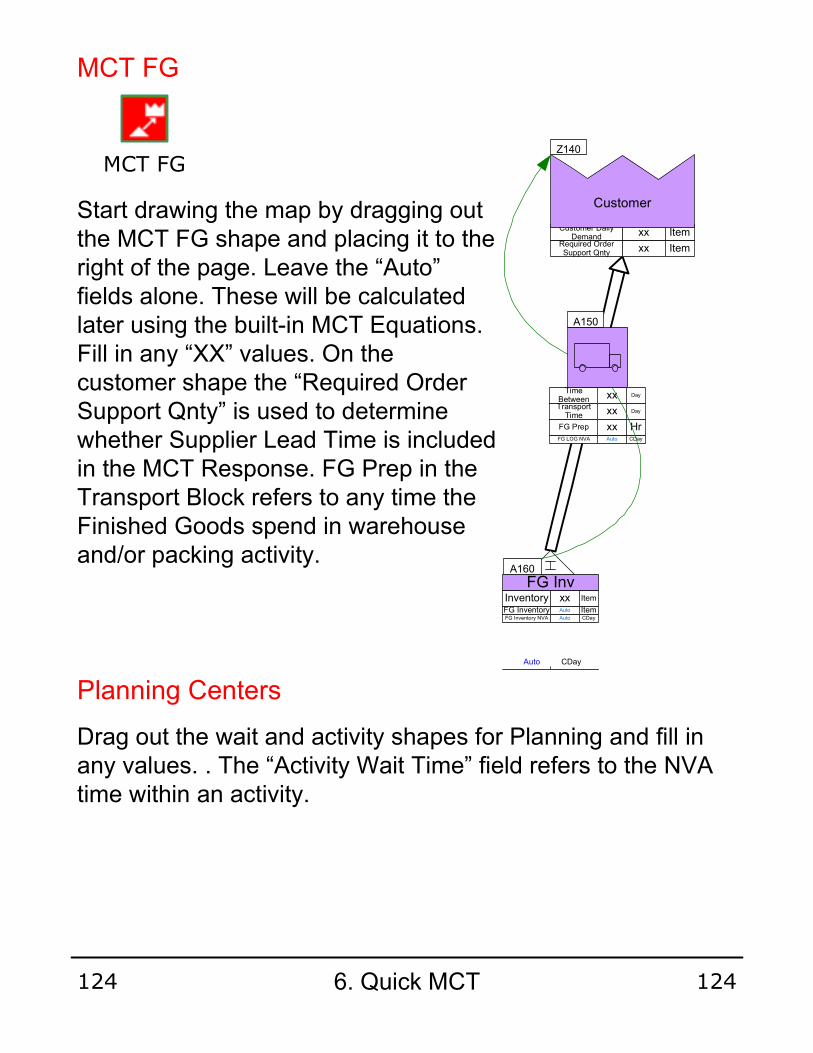
Drag out the wait and activity shapes for Planning and fill in any values. . The “Activity Wait Time” field refers to the NVA time within an activity.
Planning Centers
MCT FG
Start drawing the map by dragging out the MCT FG shape and placing it to the right of the page. Leave the “Auto” fields alone. These will be calculated later using the built-in MCT Equations. Fill in any “XX” values. On the customer shape the “Required Order Support Qnty” is used to determine whether Supplier Lead Time is included in the MCT Response. FG Prep in the Transport Block refers to any time the Finished Goods spend in warehouse and/or packing activity.
MCT FG
xxCustomer Daily Demand Item
xxTime Between
Day
AutoFG Inventory Item
AutoFG LOG NVA CDay
AutoFG Inventory NVA CDay
xxTransport Time
Day
xxRequired Order Support Qnty Item
xxFG Prep Hr
xxInventory Item
Auto CDay
Customer
Z140
A150
FG InvA160
6. Quick MCT124 124

Planning Cont’d
Planning Activity
xxCycle Time OHr
0Activity Wait
TimeODay
AutoPln VA CMin
AutoPln NVA CHr
A210
Plan Activity
Planning Queue
xxWait OHr
A290
AutoPln NVA CHr
Plan Wait
‘Activity Wait Time’ is any time within a process that an item is not being worked on (NVA time). ‘Cycle Time’ is the actual hands on time.
‘Wait’ time captures waste due to queues.
6. Quick MCT125 125
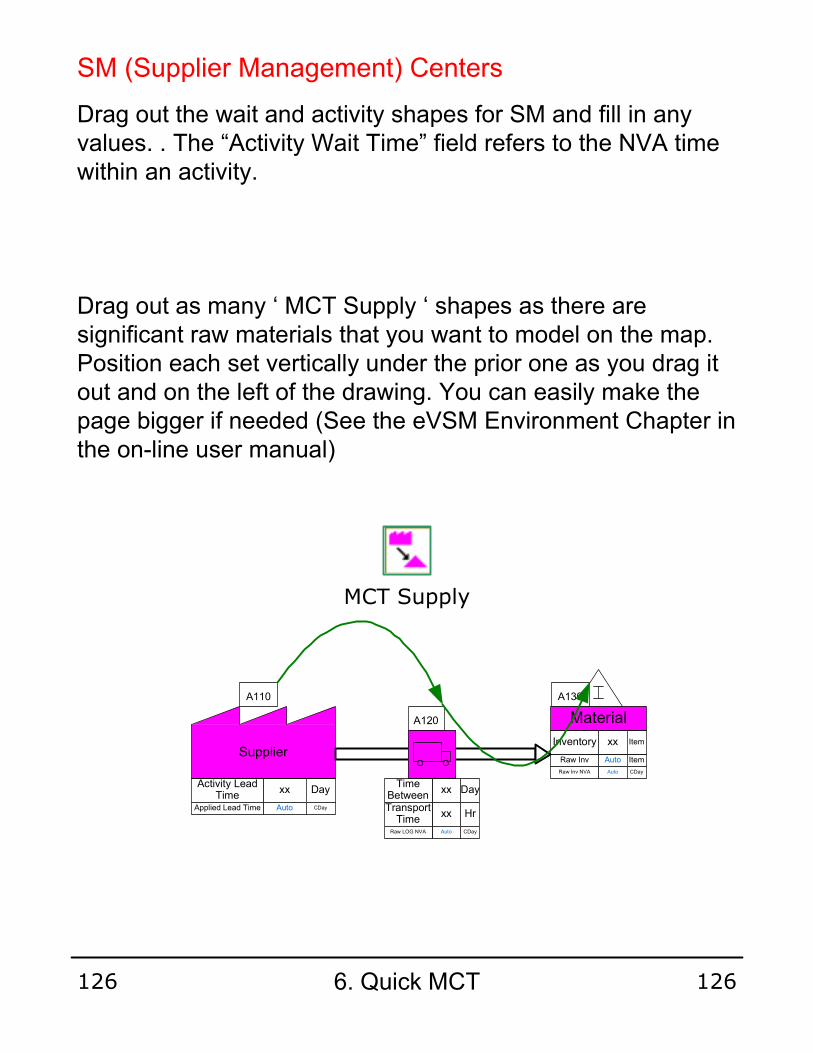
SM (Supplier Management) Centers
Drag out the wait and activity shapes for SM and fill in any values. . The “Activity Wait Time” field refers to the NVA time within an activity.
Drag out as many ‘ MCT Supply ‘ shapes as there are significant raw materials that you want to model on the map. Position each set vertically under the prior one as you drag it out and on the left of the drawing. You can easily make the page bigger if needed (See the eVSM Environment Chapter in the on-line user manual)
xxActivity Lead
TimeDay
SupplierAutoRaw Inv Item
AutoRaw Inv NVA CDay
AutoApplied Lead Time CDay
xxInventory Item
xxTime
BetweenDay
xxTransport
TimeHr
AutoRaw LOG NVA CDay
A110
A120 Material
A130
MCT Supply
6. Quick MCT126 126

Mfg (Manufacturing) Centers
Drag out manufacturing WIP, Wait and Activity shapes to complete the VSM
Use the red “eVSM Tag Path Locater” toolbar button to set up tag defaults and then use the red “eVSM AutoTag” toolbar button to pick each set of activity shapes in sequence and apply tags to them. The MCT chart will be plotted in tag sequence. For help on either of these button search the online user manual.
Tagging the shapes in Sequence Order
Mfg ActivityMfg WIP Mfg Wait
6. Quick MCT127 127

Click the “Quick eVSM” button in the eVSM toolbar. Give it time to calculate all the fields (can take a few minutes). You must click this button to rerun calculations when you change map data.
Drawing the MCT Chart
Drag out the ‘MCT Chart’ shape and attach “Path Filter” shapes to it from the stencil on the left of the page. These are glued to the bottom right corner. One path filter shape for each path number. Now right-click the chart shape and select the “plot” option
MCT Summary
Drag out the ‘MCT summary’ shape and attach a “path locater” shape to the top right of the activity. Double click the path locater shape to select the path you want a summary for. Only ONE path locater should be attached to the summary. Once this is done click the “eVSM Calculator” button in the toolbar to calculate the summary values
Putting path numbers on shapes
Use the red “eVSM Tag Path Locater Defaults” toolbar button to set up path number defaults and then use the red “eVSM AutoPath” toolbar button to pick each set of activity shapes in sequence and apply path numbers to them and staring at the customer shape. The MCT chart will have one bar for each path number
Calculating the “Auto” Fields
eVSM AutoPatheVSM Tag Path Locater Defaults
MCT Map
Quick eVSM
6. Quick MCT128 128
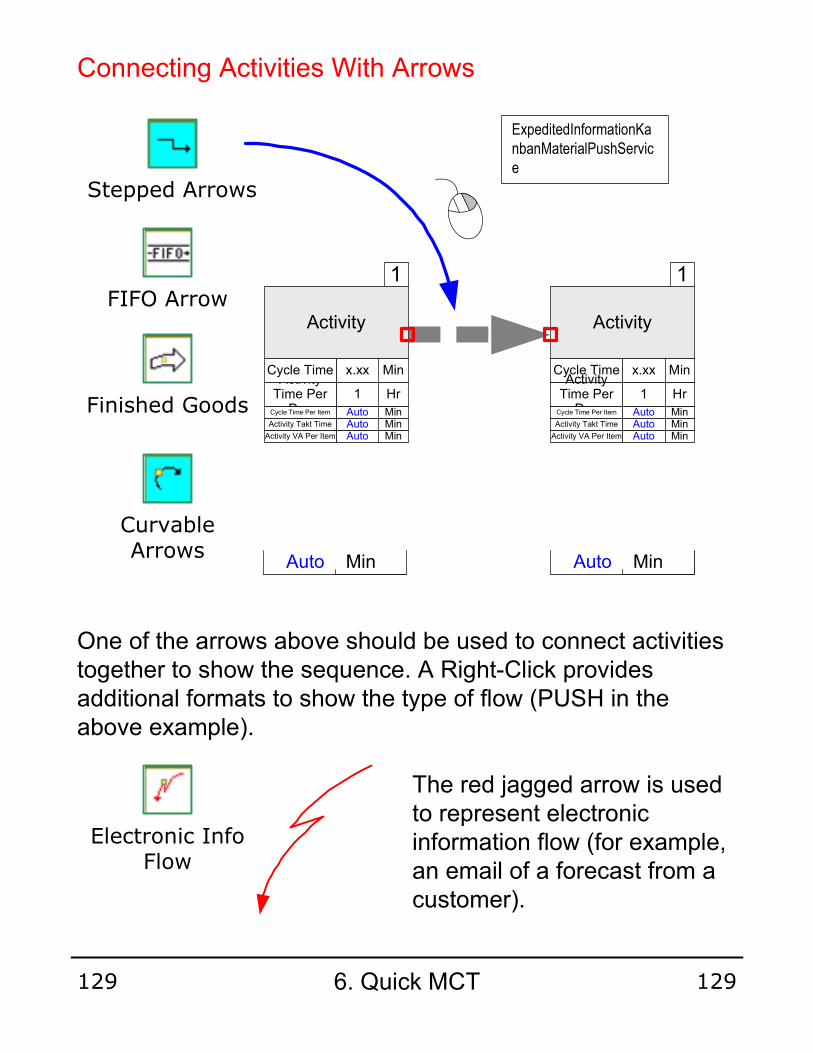
Connecting Activities With Arrows
x.xxCycle Time Min
1Activity Time Per
DayHr 1
Activity Time Per
DayHr
Activity
x.xxCycle Time Min
AutoActivity Takt Time MinAutoCycle Time Per Item Min
Activity
AutoActivity Takt Time MinAutoCycle Time Per Item Min
Auto Min Auto Min
Stepped Arrows
FIFO Arrow
ExpeditedInformationKanbanMaterialPushService
Curvable Arrows
One of the arrows above should be used to connect activities together to show the sequence. A Right-Click provides additional formats to show the type of flow (PUSH in the above example).
Electronic Info Flow
The red jagged arrow is used to represent electronic information flow (for example, an email of a forecast from a customer).
Finished Goods
AutoActivity VA Per Item Min AutoActivity VA Per Item Min
1 1
6. Quick MCT129 129

7. Drawing Value Stream Maps
Customer
Identifying Customers
Outside Source
Start the map at the customer end.
Help Movies
These and other short movies about using eVSM are available at www.evsm.com/help
Draw the Flow
Add Map Data Hyperlink Maps
Fix common mapping problems Insert Activities
Work with Variables
Create Map KeyWorking with Variables
7. Drawing Value Stream Maps 130 130
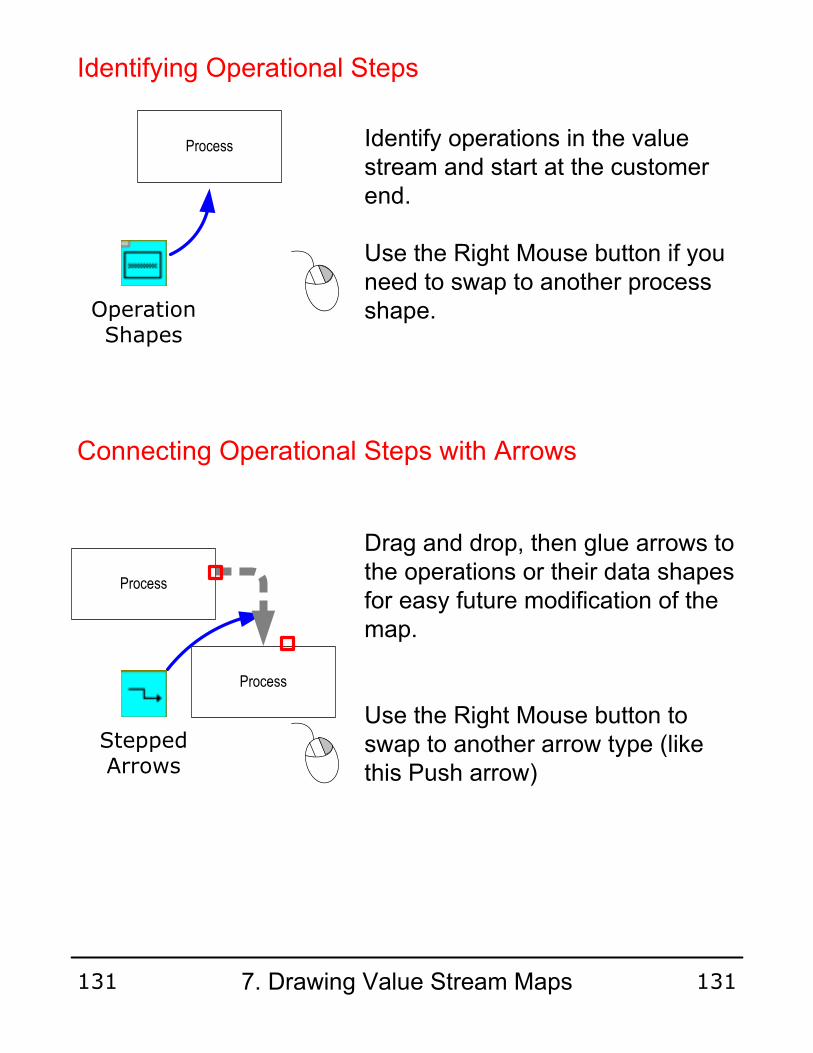
Identify operations in the value stream and start at the customer end.
Use the Right Mouse button if you need to swap to another process shape.
Identifying Operational Steps
Process
Operation Shapes
Process
Process
Drag and drop, then glue arrows to the operations or their data shapes for easy future modification of the map.
Use the Right Mouse button to swap to another arrow type (like this Push arrow)
Connecting Operational Steps with Arrows
Stepped Arrows
7. Drawing Value Stream Maps 131 131
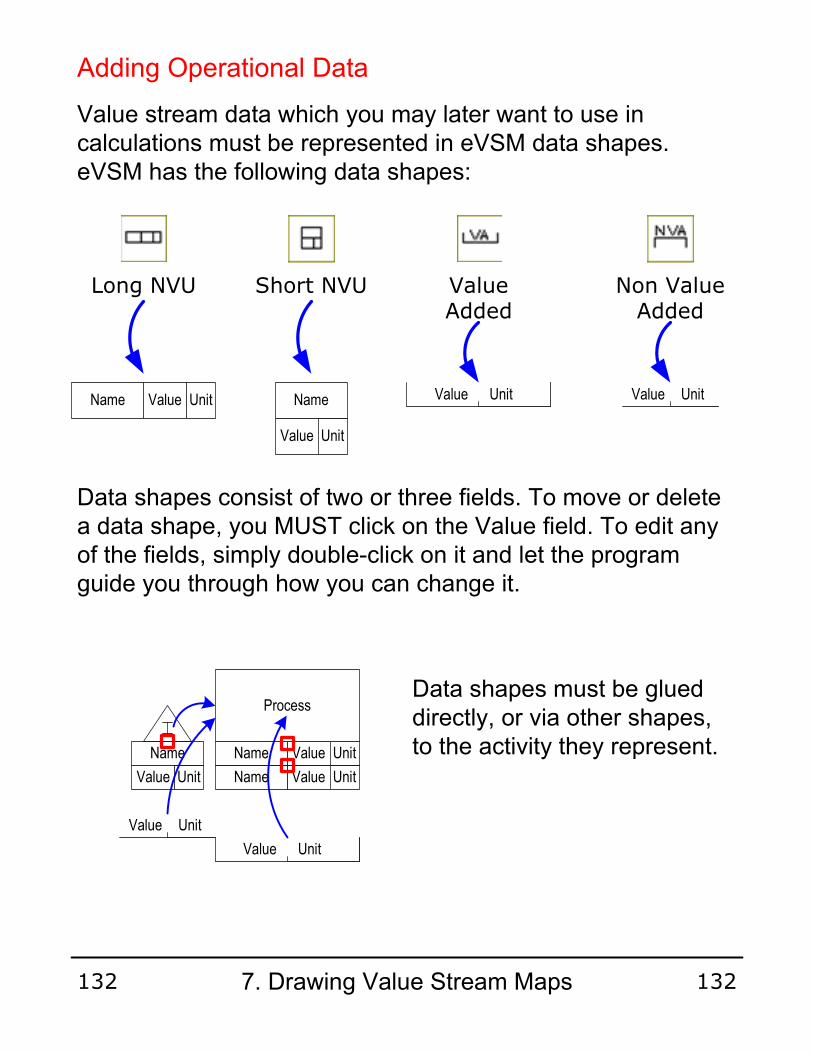
ValueName Unit
Adding Operational Data
Data shapes must be glued directly, or via other shapes, to the activity they represent.
Process
Value stream data which you may later want to use in calculations must be represented in eVSM data shapes. eVSM has the following data shapes:
ValueName Unit
Value
Name
Unit
Value Unit Value Unit
Long NVU Short NVU Value Added
Non Value Added
Data shapes consist of two or three fields. To move or delete a data shape, you MUST click on the Value field. To edit any of the fields, simply double-click on it and let the program guide you through how you can change it.
ValueName UnitValue
Name
Unit
Value Unit
Value Unit
7. Drawing Value Stream Maps 132 132

Variable Names and Units
eVSM Name and Unit Manager
To add variable names/units to the right mouse button (RMB) menu, follow these steps:
1.Click the following button in the eVSM Toolbar to open the Name & Unit Manager (NUM) dialog.
3. To add a new unit, click the “New Unit…” button.
4. All variable names must have a default unit. When adding new variable names, first make sure that the unit you wish to make the default for the new variable exists in the units list. Then, click the “New Name…” button and follow the prompts.
7. Drawing Value Stream Maps 133 133

3CO min
20CT sec
3CO min
20CT sec
ProcessAdditional data can be added to a process. Drag & glue new NVU to the bottom of existing NVU.
Data shapes that do not touch the operation or its data shapes directly should be associated with the operation by dragging the flying yellow connector and gluing it to the operation.
Note: Flying connectors should NOT be used where shapes are touching.
Process
Adding Additional Data Shapes
Long NVU
xxDays
xx Unit
Process
VA and NVA shapes are available to construct a timeline on the map.
Glue these shapes to operational shapes with a flying connector.
Process
Representing VA & NVA data
When there are several VA/NVA metrics to be tracked, the Long NVU shape should be used instead of the specific VA, NVA shapes.
Value Added
Non Value Added
x.xx Unit
7. Drawing Value Stream Maps 134 134
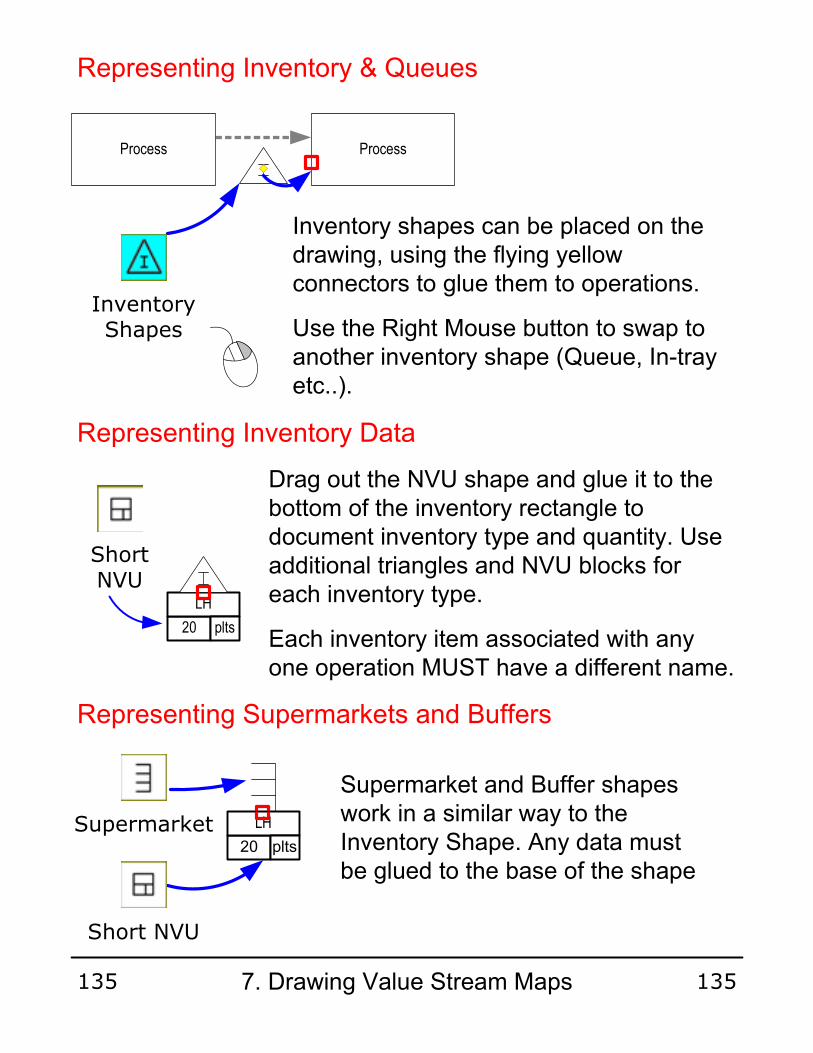
20
LH
plts
20
LH
plts
Supermarket and Buffer shapes work in a similar way to the Inventory Shape. Any data must be glued to the base of the shape
Representing Supermarkets and Buffers
Short NVU
Supermarket
Drag out the NVU shape and glue it to the bottom of the inventory rectangle to document inventory type and quantity. Use additional triangles and NVU blocks for each inventory type.
Each inventory item associated with any one operation MUST have a different name.
Representing Inventory Data
Short NVU
Inventory shapes can be placed on the drawing, using the flying yellow connectors to glue them to operations.
Use the Right Mouse button to swap to another inventory shape (Queue, In-tray etc..).
Representing Inventory & Queues
Inventory Shapes
Process Process
7. Drawing Value Stream Maps 135 135
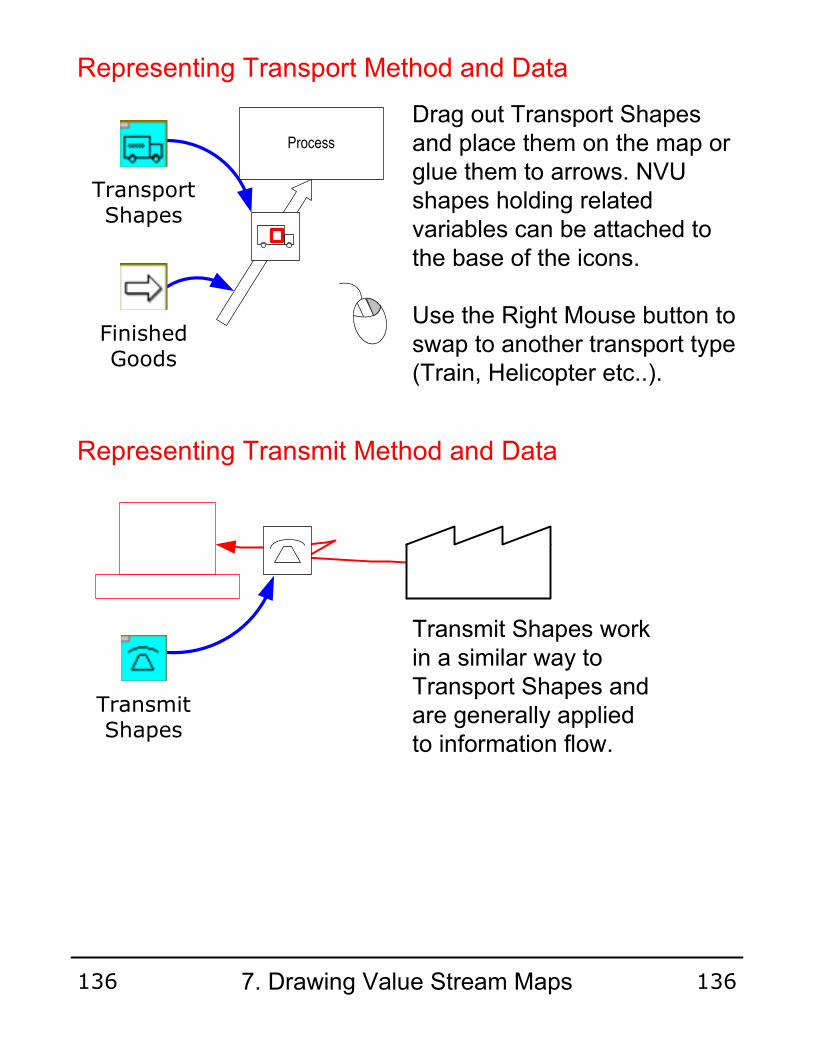
Drag out Transport Shapes and place them on the map or glue them to arrows. NVU shapes holding related variables can be attached to the base of the icons.
Use the Right Mouse button to swap to another transport type (Train, Helicopter etc..).
Representing Transport Method and Data
Process
Transport Shapes
Finished Goods
Representing Transmit Method and Data
Transmit Shapes work in a similar way to Transport Shapes and are generally applied to information flow.
Transmit Shapes
7. Drawing Value Stream Maps 136 136
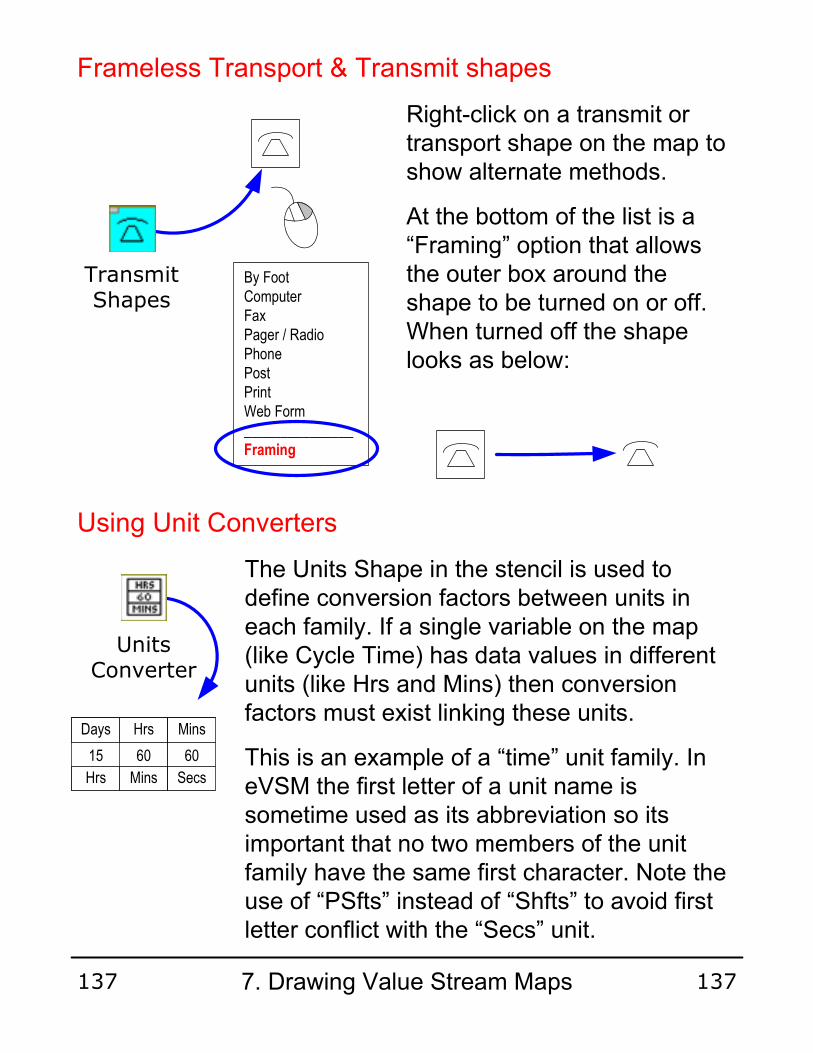
The Units Shape in the stencil is used to define conversion factors between units in each family. If a single variable on the map (like Cycle Time) has data values in different units (like Hrs and Mins) then conversion factors must exist linking these units.
This is an example of a “time” unit family. In eVSM the first letter of a unit name is sometime used as its abbreviation so its important that no two members of the unit family have the same first character. Note the use of “PSfts” instead of “Shfts” to avoid first letter conflict with the “Secs” unit.
Using Unit Converters
Units Converter
Frameless Transport & Transmit shapes
Transmit Shapes
By FootComputerFaxPager / RadioPhonePostPrintWeb Form_______________Framing
Right-click on a transmit or transport shape on the map to show alternate methods.
At the bottom of the list is a “Framing” option that allows the outer box around the shape to be turned on or off. When turned off the shape looks as below:
15
Days
Hrs
60
Hrs
Mins
60
Mins
Secs
7. Drawing Value Stream Maps 137 137

This function allows you to enter and edit data values in a combination of related units. Available in Long and Short NVU’s shapes only. Steps:
x.xxCycle Time Hrs
Enable Flying ConnectorMulti Unit Edit
2.753Cycle Time Hrs
60
Hrs
Mins
60
Mins
Secs
16
Days
Hrs
Multi-Unit Edit
1. Setup Units Convertors for the related units.
2. Right-mouse click on the Value field of the NVU and select the “Multi-Unit Edit” command.
3. Enter values in the Data Entry form.
4. See the result in the NVU.
7. Drawing Value Stream Maps 138 138

Automove
Automove makes it easier to insert/remove activities from large map. This function consists of two buttons:
eVSM Link Activities
eVSM Unlink Activities
When the Link Activities button is clicked, all activity shapes in each flow line are linked (rigidly locked) to each other. In this mode, if any activity block is selected and moved, it gets unlinked from the upstream activity. All the downstream activities stay linked and move with it.
The Unlink Activities button is used to exit this mode. It is active when the shapes are in the linked mode.
Steps:
1.Click the eVSM Link Activities button.
2. Select and move activity downstream of where space needs to be created or removed.
3.Click the eVSM Unlink Activities button to exit Automove mode.
Move
7. Drawing Value Stream Maps 139 139
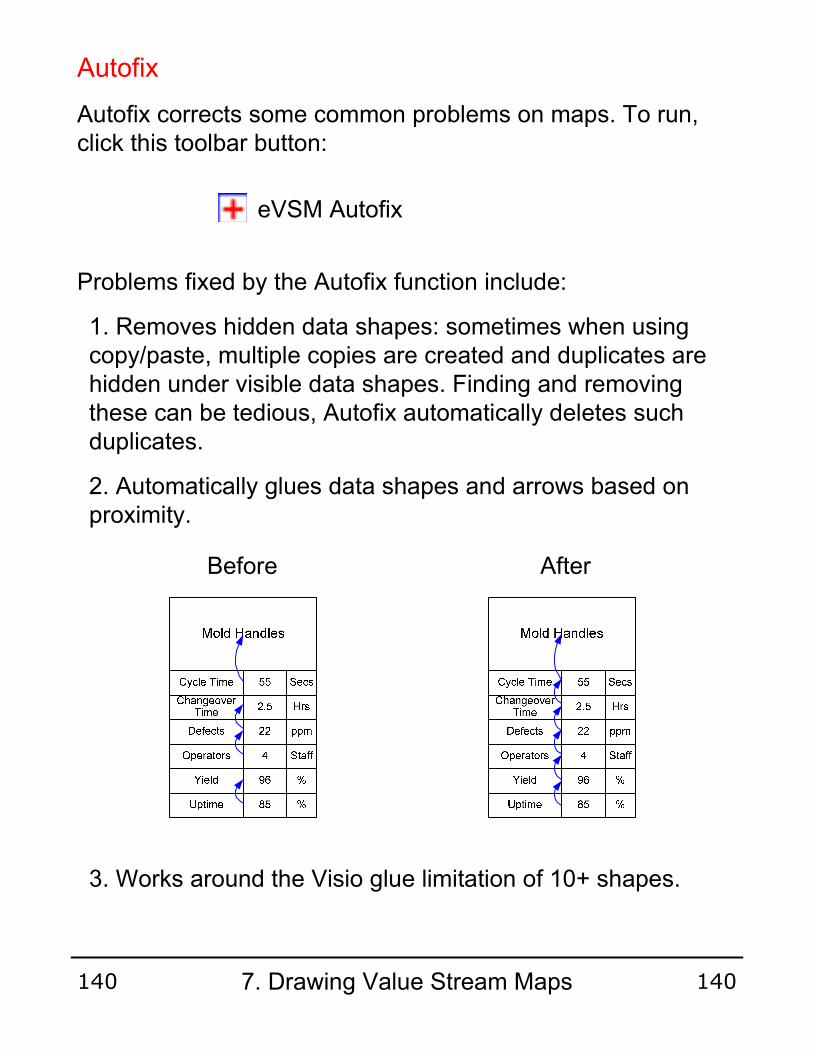
Autofix
Autofix corrects some common problems on maps. To run, click this toolbar button:
Problems fixed by the Autofix function include:
1. Removes hidden data shapes: sometimes when using copy/paste, multiple copies are created and duplicates are hidden under visible data shapes. Finding and removing these can be tedious, Autofix automatically deletes such duplicates.
2. Automatically glues data shapes and arrows based on proximity.
3. Works around the Visio glue limitation of 10+ shapes.
eVSM Autofix
Before After
7. Drawing Value Stream Maps 140 140

Text on Connector
Text on Connector
Manipulating Text on Connectors
Text can be added to any connector by double-clicking and typing.
The Visio Text Block Tool can be used to move the text position along the arrow. Note: The Text Box Tool is part of Visio, not eVSM tools, and can be found in the Visio menu.
Text on Connector
Text Block Tool
Caution: Be sure to de-select the Text Block Tool when finished.
7. Drawing Value Stream Maps 141 141

Creating Drill-Down Maps
The eVSM Drill Down button in the toolbar can be used to create a sub-page corresponding to an Operation Shape on the map. Pick the Operation Shape and then click the Drill Down button. A hyperlink is automatically created from the Operational Shape to the sub-page
eVSM Drill Down
Migrate Maps to eVSM v5
The following button in the toolbar will migrate eVSM v2, v3, and v4 maps to eVSM v5 format.
Once a map is migrated to v5, it cannot be opened in older releases of eVSM.
If you need to open an eVSM v5 file in, say v3 (or any earlier version of eVSM) for viewing/printing purposes only, here is a workaround.
1. Start eVSM and switch VB Macros Off. Click “Tools > Options > Security”.
2. Switch “Off” thischeckbox.
3. Exit Visio and open the eVSM v5 file.
Note: Remember to reverse Step 2 above when you wish to use eVSM v5 again.
eVSM v5 Migration
7. Drawing Value Stream Maps 142 142

Drawing a Key of Icons
The eVSM Key Creator generates a key of the icons used on the current drawing.
Drag out the Key Creator icon and drop it in the space on your map where you want to display the key.
Note: This automatic function is restricted to eVSM shapes on the current drawing page. Some eVSM shapes, eg. data shapes such as long and short NVU’s are intentionally omitted.
The Key display uses the eVSM Table shape. This allows you to delete/add columns (see how in the “Working with Tables” chapter) and also change the annotation of the key.
Cross Dock
Finished Goods
InventoryOutside Source
Process Summary TruckUnits
ConverterWarehouse
Key Creator
7. Drawing Value Stream Maps 143 143
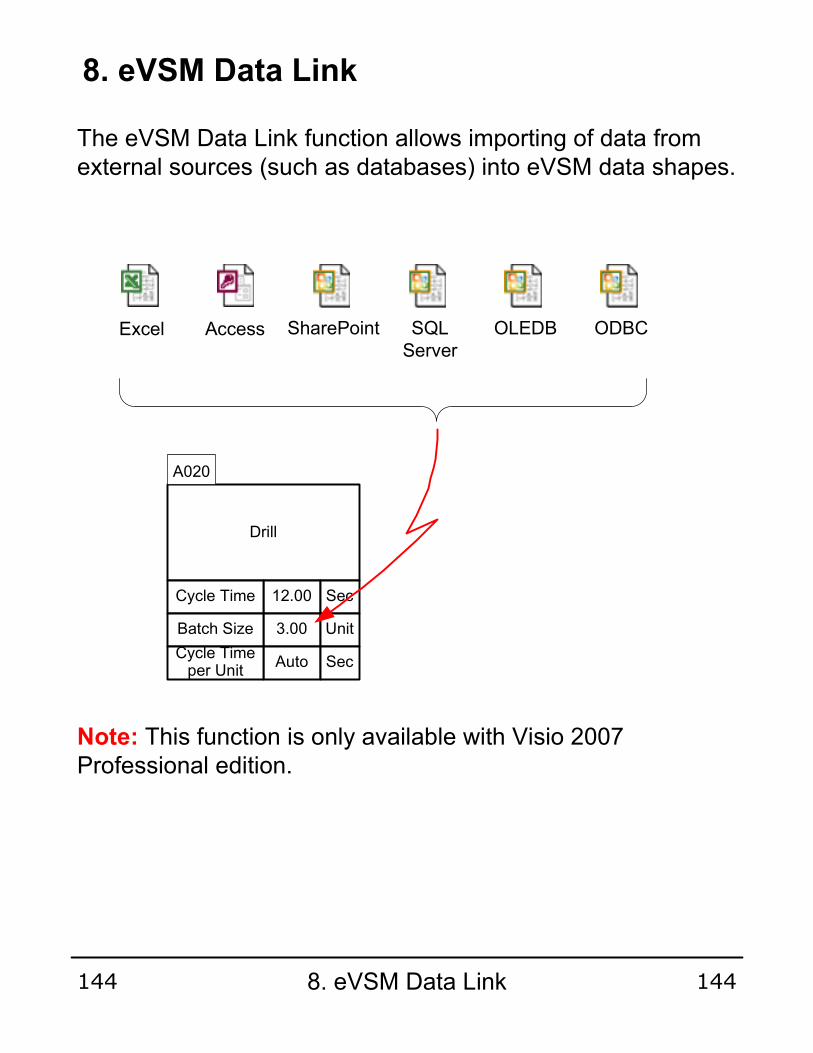
The eVSM Data Link function allows importing of data from external sources (such as databases) into eVSM data shapes.
Drill
12.00Cycle Time Sec
3.00Batch Size Unit
A020
AutoCycle Time per Unit
Sec
AccessExcel SharePoint SQL Server
OLEDB ODBC
Note: This function is only available with Visio 2007 Professional edition.
8. eVSM Data Link
8. eVSM Data Link144 144
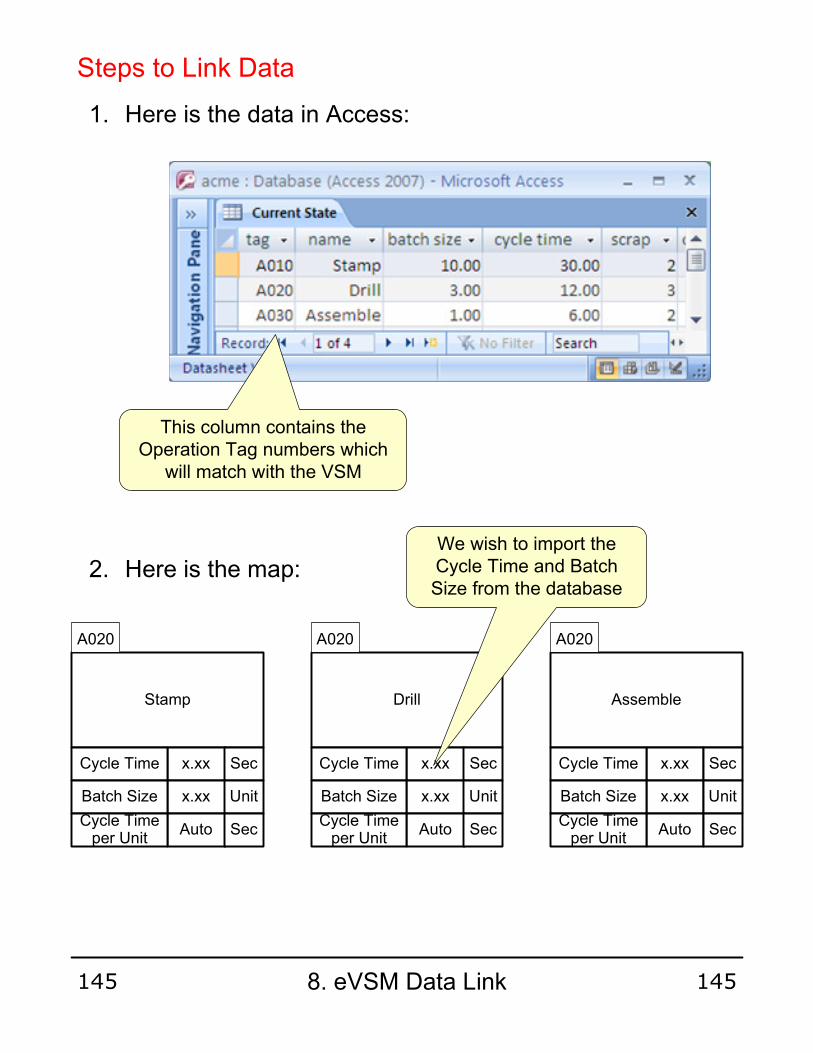
1. Here is the data in Access:
Steps to Link Data
This column contains the Operation Tag numbers which
will match with the VSM
2. Here is the map:
Stamp
x.xxCycle Time Sec
x.xxBatch Size Unit
A020
AutoCycle Time per Unit
Sec
Drill
x.xxCycle Time Sec
x.xxBatch Size Unit
A020
AutoCycle Time per Unit
Sec
Assemble
x.xxCycle Time Sec
x.xxBatch Size Unit
A020
AutoCycle Time per Unit
Sec
We wish to import the Cycle Time and Batch Size from the database
8. eVSM Data Link145 145

3. In the Visio menus, click “Data > Link Data to Shapes…”
Steps to Link Data (Cont’d)
Select the Access file
Here is the data in Visio
Follow the instructions
8. eVSM Data Link146 146

4. Click “Data > Automatically Link…”, follow the wizard, and link the “tag” data column to the shape text for all shapes on page. The wizard allows you to filter out any unwanted columns and rows. This action will add shape data to the Operation Tags on the map.
Here is an example:
5. Click the Data Link button in the eVSM Toolbar
Stamp
30.00Cycle Time Sec
10.00Batch Size Unit
A020
AutoCycle Time per Unit
Sec
Drill
12.00Cycle Time Sec
3.00Batch Size Unit
A020
AutoCycle Time per Unit
Sec
Assemble
6.00Cycle Time Sec
1.00Batch Size Unit
A020
AutoCycle Time per Unit
Sec
eVSM Data Link
Steps to Link Data (Cont’d)
Here is the data in eVSM data shapes
8. eVSM Data Link147 147

Spaghetti Diagrams highlight wasted journeys and effort by visualizing motion between activity centers. The eVSM Spaghetti Diagram function allows you to draw paths on a floor plan (or any geographic map) and then export a Path Report to Excel.
9. Drawing Spaghetti Diagrams
TO COLOR DESCRIPTION DATE TIME DISTANCE
ER Bay 9 Patient assisted in wheelchair 3/3/2007 5:36pm 102
X-ray waiting area patient escorted to X-ray waiting area 3/3/2007 6:20pm 58
X-ray Room 1 Patient to X-ray 3/3/2007 6:32pm 27
ER Bay 9 Patient returned to Bay 9 3/3/2007 6:45pm 62
Help Movies
Draw Spaghetti Diagrams
Floor Map
Spaghetti Place
Spaghetti Path
Spaghetti Report in Excel
9. Drawing Spaghetti Diagrams148 148
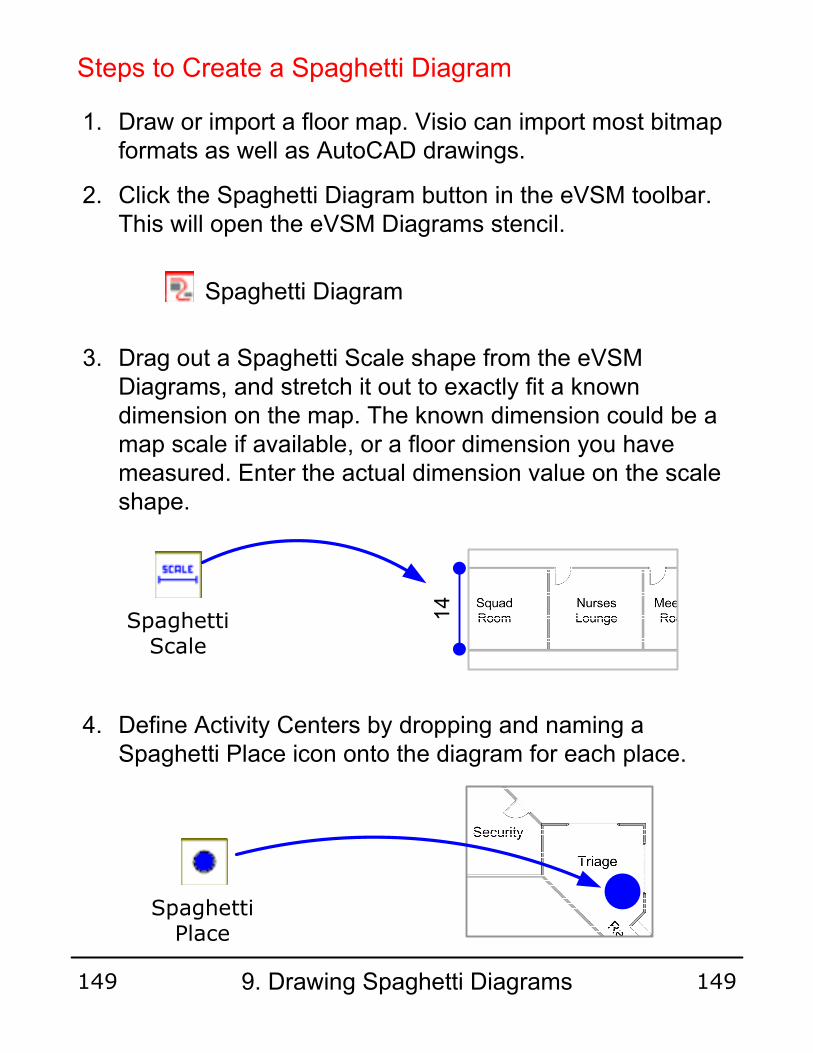
1. Draw or import a floor map. Visio can import most bitmap formats as well as AutoCAD drawings.
2. Click the Spaghetti Diagram button in the eVSM toolbar. This will open the eVSM Diagrams stencil.
3. Drag out a Spaghetti Scale shape from the eVSM Diagrams, and stretch it out to exactly fit a known dimension on the map. The known dimension could be a map scale if available, or a floor dimension you have measured. Enter the actual dimension value on the scale shape.
4. Define Activity Centers by dropping and naming a Spaghetti Place icon onto the diagram for each place.
Steps to Create a Spaghetti Diagram
Spaghetti Diagram
Spaghetti Place
Spaghetti Scale
14
9. Drawing Spaghetti Diagrams149 149
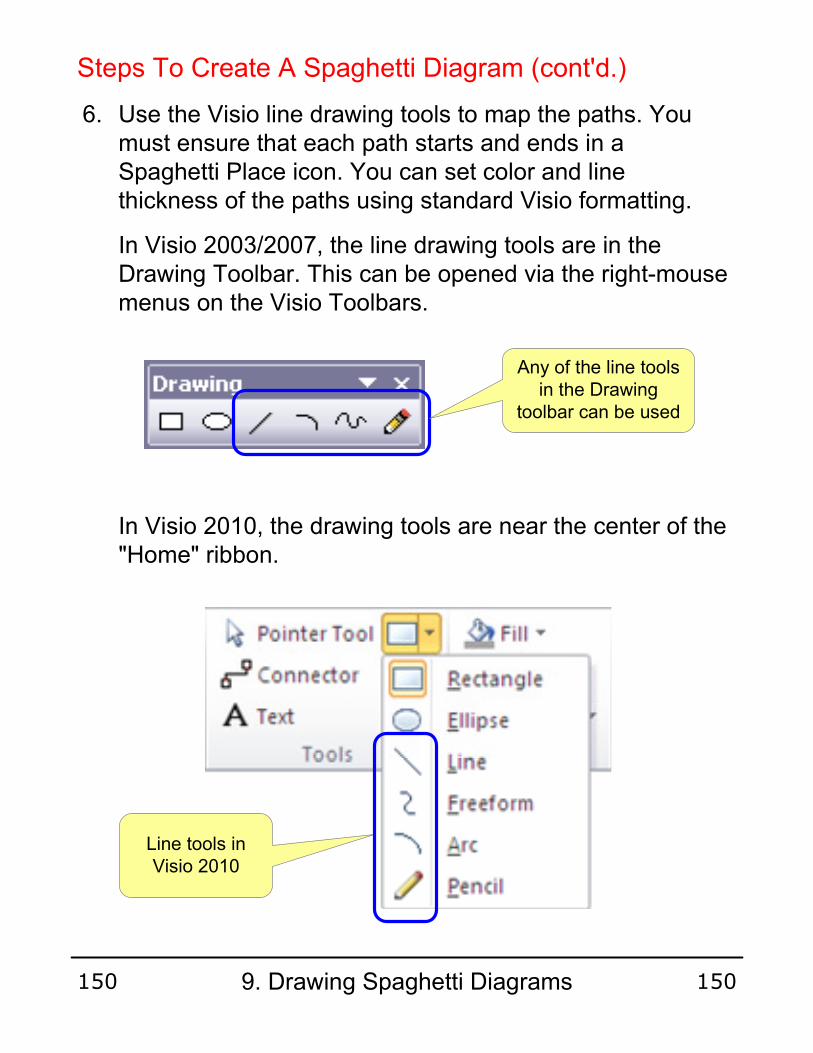
Steps To Create A Spaghetti Diagram (cont'd.)
6. Use the Visio line drawing tools to map the paths. You must ensure that each path starts and ends in a Spaghetti Place icon. You can set color and line thickness of the paths using standard Visio formatting.
In Visio 2003/2007, the line drawing tools are in the Drawing Toolbar. This can be opened via the right-mouse menus on the Visio Toolbars.
In Visio 2010, the drawing tools are near the center of the "Home" ribbon.
Any of the line tools in the Drawing
toolbar can be used
Line tools in Visio 2010
9. Drawing Spaghetti Diagrams150 150
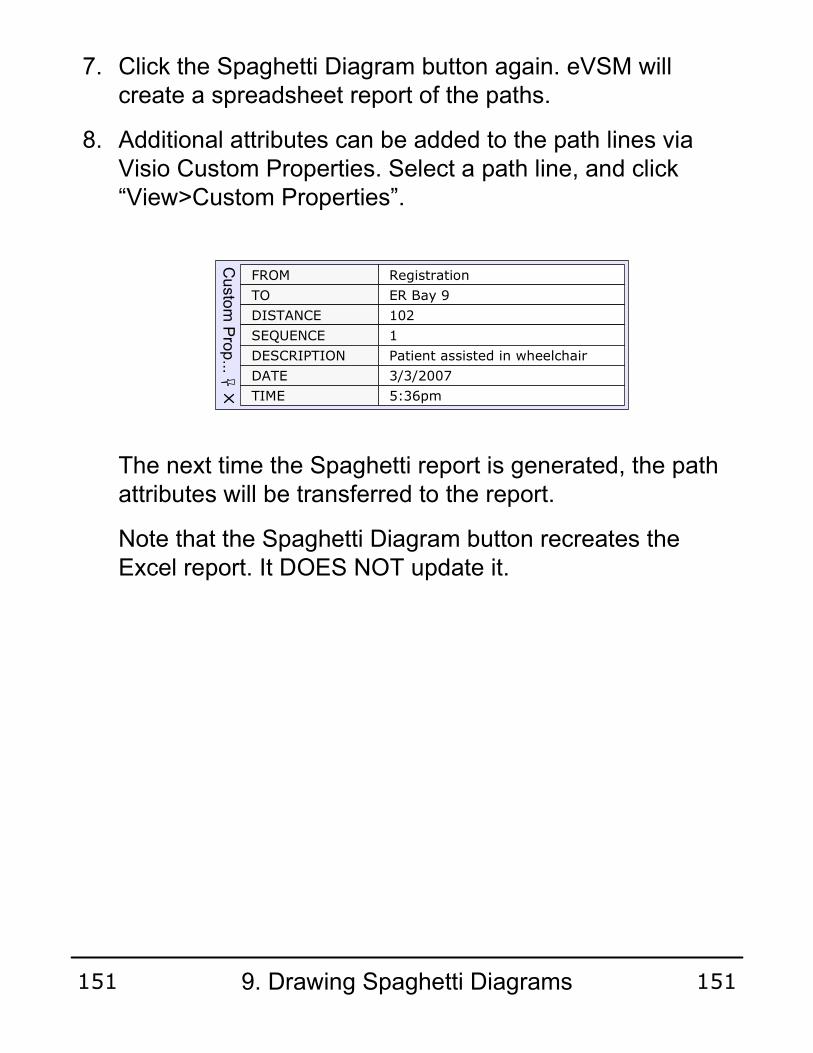
FROM Registration
ER Bay 9TO
DISTANCE 102
SEQUENCE 1
DESCRIPTION Patient assisted in wheelchair
DATE 3/3/2007
TIME 5:36pm
Custom Prop...
7. Click the Spaghetti Diagram button again. eVSM will create a spreadsheet report of the paths.
8. Additional attributes can be added to the path lines via Visio Custom Properties. Select a path line, and click “View>Custom Properties”.
The next time the Spaghetti report is generated, the path attributes will be transferred to the report.
Note that the Spaghetti Diagram button recreates the Excel report. It DOES NOT update it.
9. Drawing Spaghetti Diagrams151 151
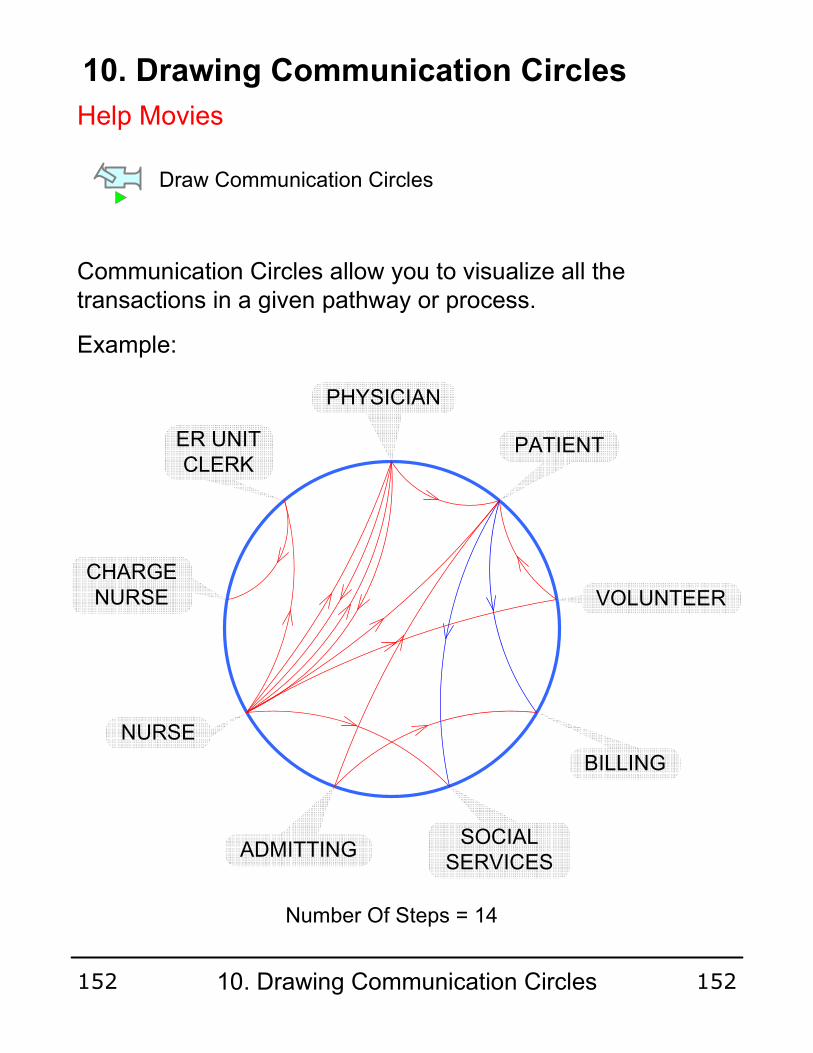
Communication Circles allow you to visualize all the transactions in a given pathway or process.
Example:
Number Of Steps = 14
PHYSICIAN
PATIENT
VOLUNTEER
BILLING
SOCIAL SERVICES
ADMITTING
NURSE
CHARGE NURSE
ER UNIT CLERK
10. Drawing Communication Circles
Help Movies
Draw Communication Circles
10. Drawing Communication Circles 152 152
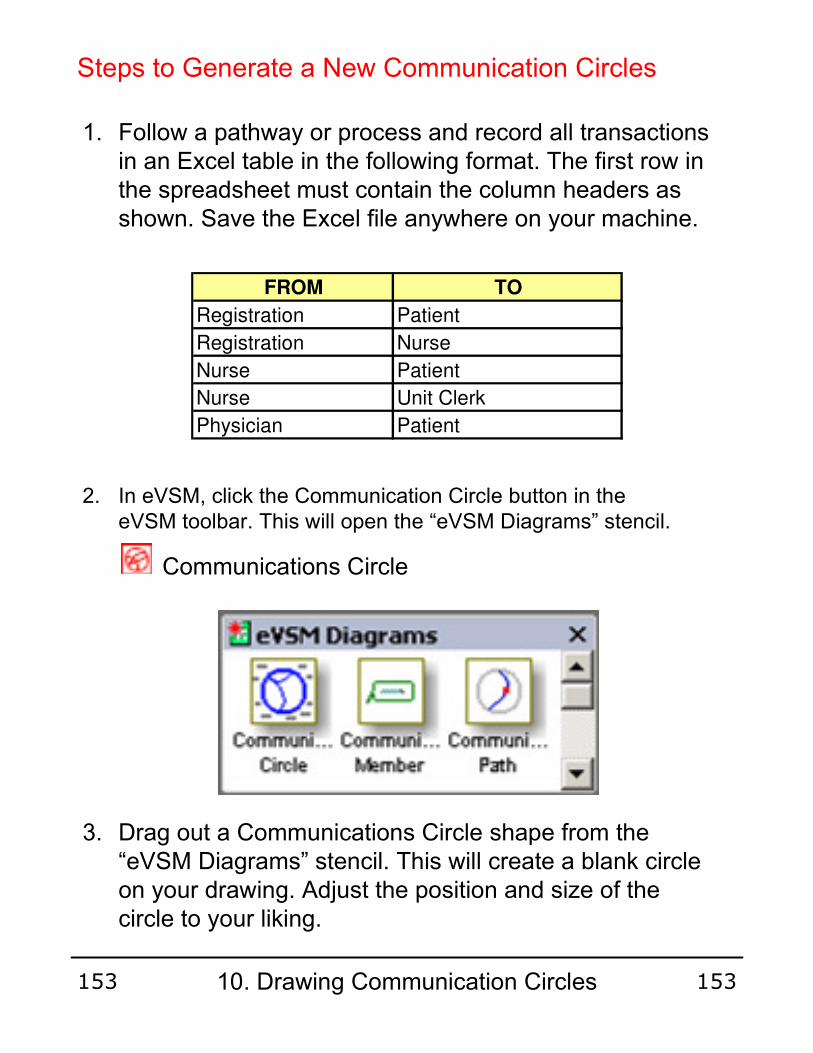
1. Follow a pathway or process and record all transactions in an Excel table in the following format. The first row in the spreadsheet must contain the column headers as shown. Save the Excel file anywhere on your machine.
Steps to Generate a New Communication Circles
FROM TO
Registration Patient
Registration Nurse
Nurse Patient
Nurse Unit Clerk
Physician Patient
2. In eVSM, click the Communication Circle button in the eVSM toolbar. This will open the “eVSM Diagrams” stencil.
3. Drag out a Communications Circle shape from the “eVSM Diagrams” stencil. This will create a blank circle on your drawing. Adjust the position and size of the circle to your liking.
Communications Circle
10. Drawing Communication Circles 153 153
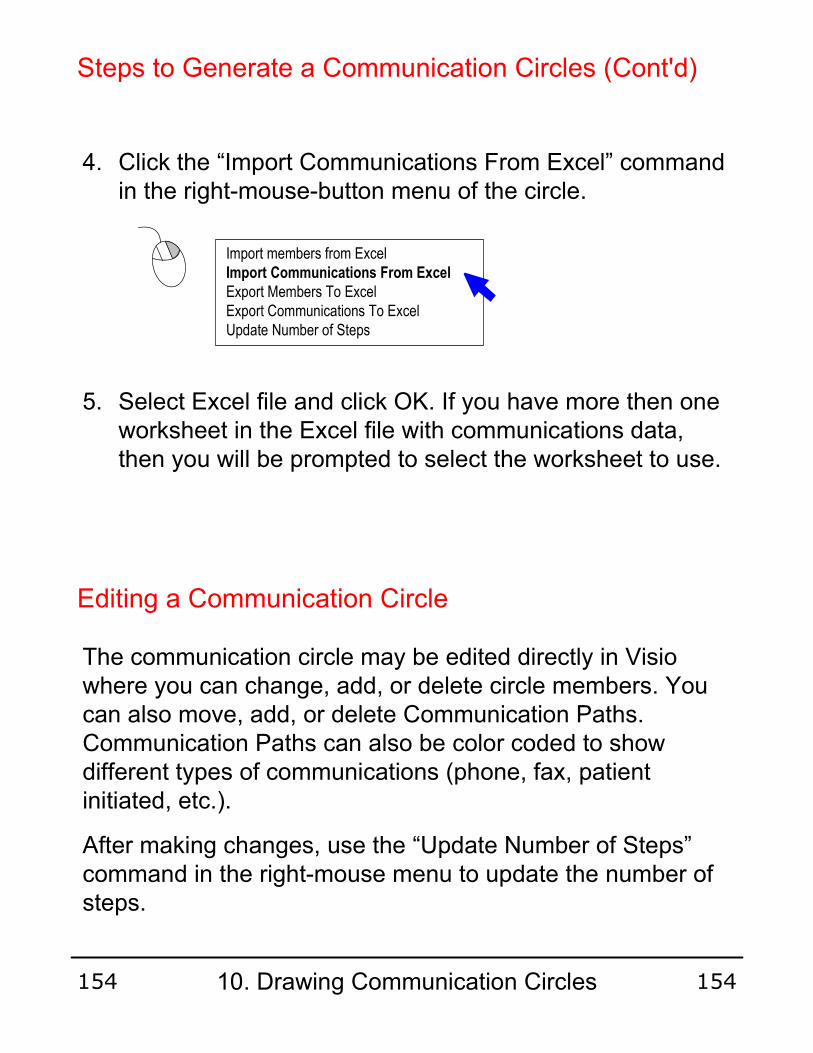
4. Click the “Import Communications From Excel” command in the right-mouse-button menu of the circle.
5. Select Excel file and click OK. If you have more then one worksheet in the Excel file with communications data, then you will be prompted to select the worksheet to use.
The communication circle may be edited directly in Visio where you can change, add, or delete circle members. You can also move, add, or delete Communication Paths. Communication Paths can also be color coded to show different types of communications (phone, fax, patient initiated, etc.).
After making changes, use the “Update Number of Steps” command in the right-mouse menu to update the number of steps.
Editing a Communication Circle
Steps to Generate a Communication Circles (Cont'd)
Import members from ExcelImport Communications From Excel
Export Members To ExcelExport Communications To ExcelUpdate Number of Steps
10. Drawing Communication Circles 154 154

Importing a Circle Members List
This is useful when the members are known but the transactions are not. Use the “Import Members from Excel” command in the right-mouse menu. The Excel data must be in the following format:
MEMBER Y/N
Registration Y
Patient Y
Nurse Y
Unit Clerk N
Physician Y
The “Y/N” column is needed to specify members to import.
Communication Path Properties
Custom properties are available on the Circle Path shape which may be used to capture additional details. To access these, right-mouse click on a path, then select “Shape>Custom Properties…".
The “Export Communications to Excel” command in the right mouse menu of the circle will export all of the above properties to Excel. The Communication Path line color is also transferred to Excel.
Custom Propert...
SEQUENCE 4
Send patient registration details to RNDESCRIPTION
DATE 3/27/07
TIME 5:06 PM
DISTANCE Unknown
DURATION Unknown
TYPE Value Added
PATHWAY Admission
10. Drawing Communication Circles 155 155

Zoom into the appropriate area and fill out the sheet.
eA3 comes with a template (below) of an A3 report and a set of icons to make it easy to visualize the “Current Condition” and “Desired State” aspects of the sheet. Click the A3 toolbar button to create a new report.
eA3 Report
11. Creating A3 Reports
Help Movies
Create A3 Reports
11. Creating A3 Reports 156 156

Practice
Hospital
Hospital
When to Operate ?
Erratic OR Priority Overrides
No centralized booking
Insurance Impacts
A typical “Current Condition” diagram is shown above and can be drawn very quickly in eA3 using the available icons.
You can drag and drop a people shape from the stencil. You can change a person’s “role” by clicking the right mouse button and selecting the role (nurse, doctor, etc..). You can also set a person’s expression in the same way. People stacks are available for mfg, services and healthcare
Diagramming the Current Condition
Representing People
Healthcare People
11. Creating A3 Reports 157 157

Pharmacy
Pharmacy
Pharmacy
Pharmacy
Icon Of Place
You can create an iconic representation of a department by gluing an icon to its center. You can also type in the name.
The square frame of the dept icon can be hidden with the right mouse “framing” option for a simpler look.
High Roof Place
Low Roof Place
Representing Departments
Healthcare Depts
Healthcare Depts
Healthcare Depts
Glue point is here
Glue point is here
11. Creating A3 Reports 158 158
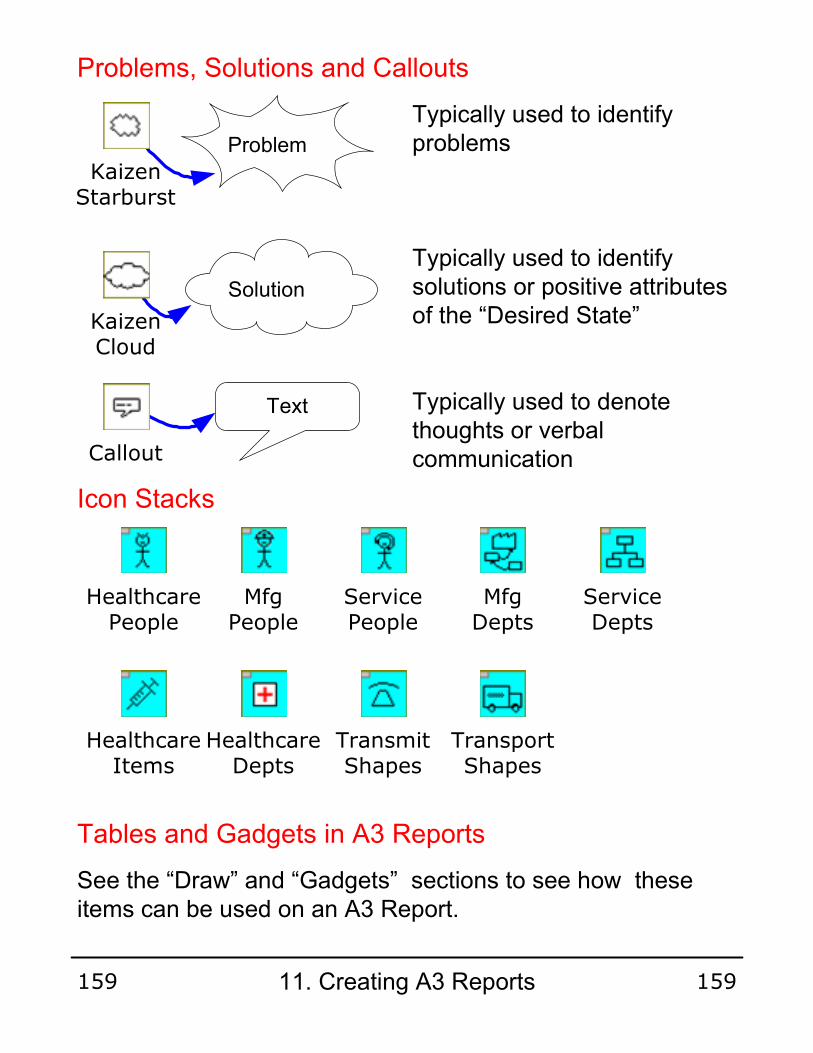
Typically used to identify problemsProblem
Solution
Text
Typically used to identify solutions or positive attributes of the “Desired State”
Typically used to denote thoughts or verbal communication
See the “Draw” and “Gadgets” sections to see how these items can be used on an A3 Report.
Problems, Solutions and Callouts
Icon Stacks
Tables and Gadgets in A3 Reports
Healthcare Depts
Healthcare People
Mfg People
Service People
Mfg Depts
Service Depts
Healthcare Items
Transmit Shapes
Transport Shapes
Kaizen Cloud
Kaizen Starburst
Callout
11. Creating A3 Reports 159 159
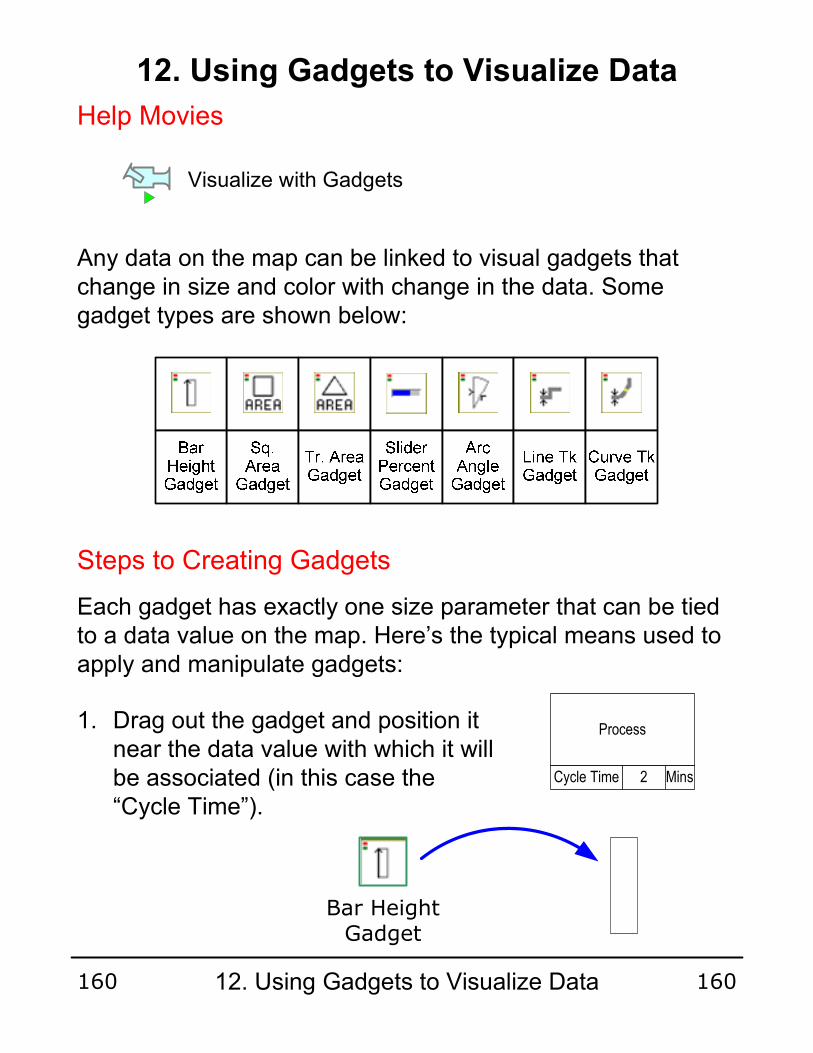
Any data on the map can be linked to visual gadgets that change in size and color with change in the data. Some gadget types are shown below:
Each gadget has exactly one size parameter that can be tied to a data value on the map. Here’s the typical means used to apply and manipulate gadgets:
1. Drag out the gadget and position it near the data value with which it will be associated (in this case the “Cycle Time”).
Steps to Creating Gadgets
12. Using Gadgets to Visualize Data
Bar Height Gadget
Help Movies
Visualize with Gadgets
Process
2Cycle Time Mins
12. Using Gadgets to Visualize Data160 160

Gadget Data
Drag and glue the gadgets yellow flying connector to the side of the NVU data shape (avoid gluing to the top or bottom of the data shape).
Right click on the gadget and use the “Activate Gadget” option to create a new gadget collection. The collection name will be “Bar_Cycle Time”. The name is created from the gadget type and the data variable name.
2. This system shape will be automatically dropped on the page the first time a gadget is used. If you copy a map to a new page make sure you also copy this shape because it is used to hold gadget data for the map.
3. A gadget can only belong to one collection. Each collection can only have a single type (eg. “Bar”) of gadget.
You can change gadget scale factors and color code them by modifying the properties of the associated Gadget Collection.
Steps to Creating Gadgets (Cont'd)
Process
2Cycle Time Mins
Process
2Cycle Time Mins
12. Using Gadgets to Visualize Data161 161

4. You can easily create additional gadgets tied to other instances of the same data on the map. Just click on the gadget and use the right mouse button to select “Create Gadgets By Example” to create the gadget for Process B below.
5. Note that the new gadget is automatically positioned, scaled and put into the same “Bar_Cycle Time” collection. If you do not wish to have new gadgets created for the whole map than select the original gadget, then sub-select an area of the map before using the “Create Gadgets By Example” menu.
Steps to Creating Gadgets (Cont'd)
Process A Process B
2Cycle Time Mins 2Cycle Time Mins
Process A
2Cycle Time Mins
Process B
3Cycle Time Mins
12. Using Gadgets to Visualize Data162 162
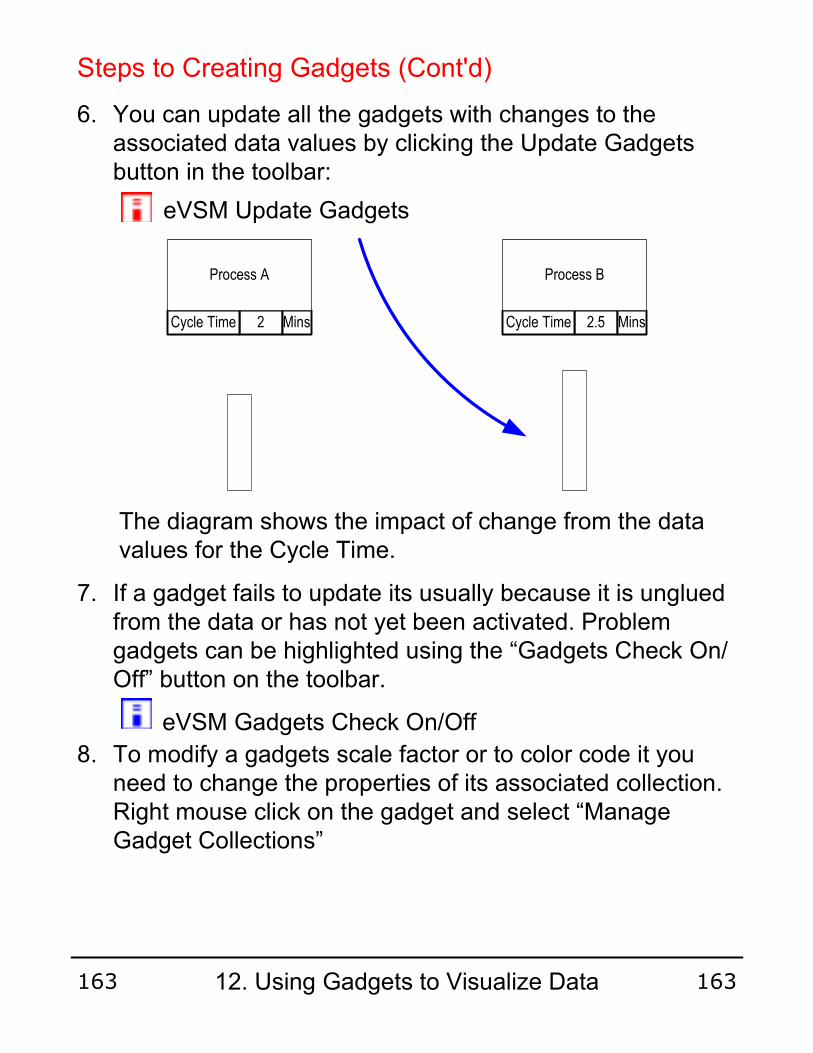
2.5Cycle Time Mins2Cycle Time Mins
6. You can update all the gadgets with changes to the associated data values by clicking the Update Gadgets button in the toolbar:
The diagram shows the impact of change from the data values for the Cycle Time.
7. If a gadget fails to update its usually because it is unglued from the data or has not yet been activated. Problem gadgets can be highlighted using the “Gadgets Check On/Off” button on the toolbar.
8. To modify a gadgets scale factor or to color code it you need to change the properties of its associated collection. Right mouse click on the gadget and select “Manage Gadget Collections”
Steps to Creating Gadgets (Cont'd)
eVSM Update Gadgets
eVSM Gadgets Check On/Off
Process A Process B
12. Using Gadgets to Visualize Data163 163

To transfer gadgets into a collection, first pre-select them, then select the target collection from the list and click this button.
A gadget can only belong to one collection so it is removed from its existing collection upon transfer
Also, a gadget can only be transferred to a collection that has the right gadget type (eg. “Bar”)
Select a collection from the list and click this button to select/highlight any gadgets on the map that belong to it
Managing Gadget Collections
9. Gadget collections can also be accessed via the toolbar button:
eVSM Manage Gadget Collections
12. Using Gadgets to Visualize Data164 164

You can color code the gadget fill and font colors based on the value of the data to which the gadget is glued. You can also simply “inherit” the color from the data shape or assign a color to a gadget manually.
You can modify the scale factor for a collection that controls gadget size in relation to data value. Use the Apply button to see the new gadget sizes on the map before exiting the form.
To hide or show gadgets in a collection, first select the collection from a list, then click this button.
Note: the collection list has a column indicating visibility status.
Modifying and Color-Coding Gadgets
12. Using Gadgets to Visualize Data165 165
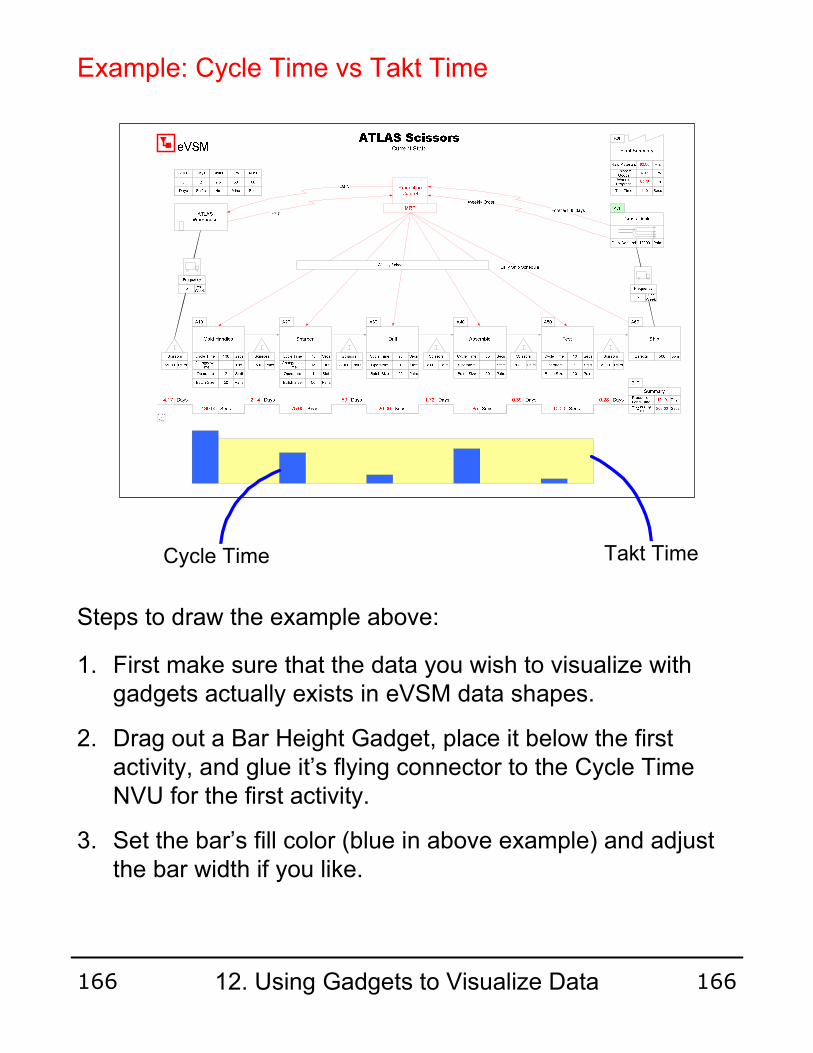
Example: Cycle Time vs Takt Time
1. First make sure that the data you wish to visualize with gadgets actually exists in eVSM data shapes.
2. Drag out a Bar Height Gadget, place it below the first activity, and glue it’s flying connector to the Cycle Time NVU for the first activity.
3. Set the bar’s fill color (blue in above example) and adjust the bar width if you like.
Steps to draw the example above:
Takt TimeCycle Time
12. Using Gadgets to Visualize Data166 166

4. Click the Create Gadgets By Example in the bar’s right mouse button menu
5. Drop a new Bar Height Gadget and attach it’s flying connector to the NVU containing the Takt Time.
6. Align the new gadget with the first gadget collection, and adjust it’s width to overlap the whole first collection. In above example, color is set to yellow.
7. Activate the new gadget with the Activate Gadget command in the right mouse menus.
8. Open the Manage Gadget Collections form, and make the gadget scales for both collections the same via the Modify… button
Example: Cycle Time vs Takt Time (Cont’d)
Activate GadgetCreate Gadgets By ExampleShow Gadget CollectionManage Gadget Collections
12. Using Gadgets to Visualize Data167 167
1. Gadgets have a single size parameter that will scale to the data value in which a gadget is glued via the flying yellow connector.
2. Gadgets are typically glued to NVU, VA or NVA shapes. When gadgets in a collection are glued to data shapes with different units, Units Converters are needed on the map to compute the correct scale factors.
3. Gadgets have to belong to a collection. They can be put in a collection using the Activate Gadget command or by transferring them into a collection via the Manage Gadgets form.
4. Gadget scale factors and color coding can be controlled via the Manage Gadgets form.
5. An easy way to create a gadget “set” after creating a first gadget is to use the Create Gadgets By Example in the right mouse button menu.
6. The Visible switch on the Manage Gadgets form is very useful in showing different metrics on the map in a presentation environment.
7. See the “Examples” section on the eVSM help site (www.evsm.com/help) for usage examples of the different gadget types.
8. A starter set of gadgets is provided with eVSM. Additional gadgets can be requested by contacting [email protected].
Gadgets – Key Points
12. Using Gadgets to Visualize Data168 168

This area intentionally left blank
12. Using Gadgets to Visualize Data169 169

13. Standardizing Value Stream Maps
eVSM has built-in functions to allow your organization to easily draw value stream maps using a standard that you define. With standardization, maps can be drawn and analyzed faster and can be understood by a wider group. The standard comprises of the following:
Standard names for variables and units.
A Standard set of Macro Shapes (combinations of shapes) that can make drawing maps faster.
Blank Starter Maps to ensure consistency and minimize effort in starting new maps.
Company specific set of icons (eg. logo, name block, etc.) to use when drawing maps.
Standardization Components
Help Movies
These and other short movies on eVSM are available at www.evsm.com/help
Create Macro ShapesWork with Variables
13. Standardizing Value Stream Maps170 170
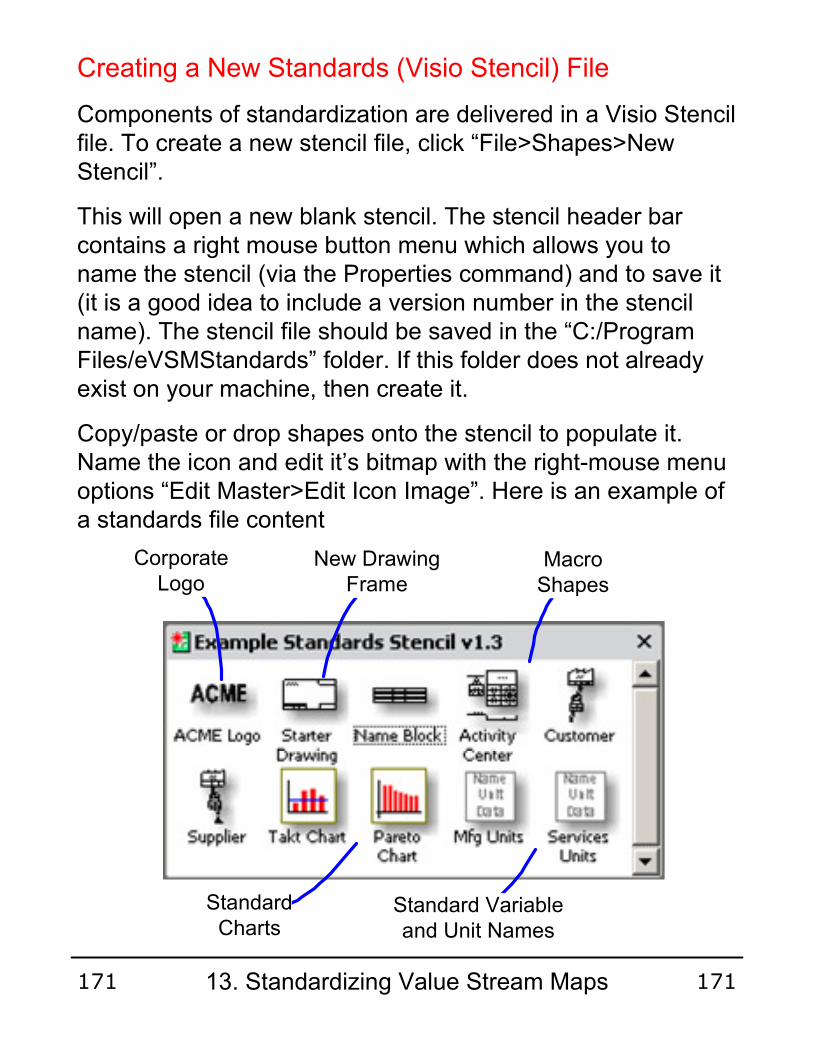
Creating a New Standards (Visio Stencil) File
Components of standardization are delivered in a Visio Stencil file. To create a new stencil file, click “File>Shapes>New Stencil”.
This will open a new blank stencil. The stencil header bar contains a right mouse button menu which allows you to name the stencil (via the Properties command) and to save it (it is a good idea to include a version number in the stencil name). The stencil file should be saved in the “C:/Program Files/eVSMStandards” folder. If this folder does not already exist on your machine, then create it.
Copy/paste or drop shapes onto the stencil to populate it. Name the icon and edit it’s bitmap with the right-mouse menu options “Edit Master>Edit Icon Image”. Here is an example of a standards file content
New Drawing Frame
Macro Shapes
Standard Variable and Unit Names
Standard Charts
Corporate Logo
13. Standardizing Value Stream Maps171 171

Opening a Standards Stencil File
To open a Standards Stencil file from a drawing, click
“File > Shapes > Open Stencil…”
Then navigate to the folder below and select the *.vss file:
C:/Program Files/eVSMStandards
Note: A Visio drawing file “remembers” which stencil files were open when you last saved it.
If you want new drawings to open with the Standards Stencil already open, then follow these steps:
1. Start a new eVSM drawing by clicking the Start eVSM icon on the Desktop
2. Open the Standards Stencil via “Files >Shapes >Open Stencil…”
3. Click “File > Save As…”, change “Save as type” to “Template (*.vst)”, and save the file in the “C:/Program Files/eVSMStandards” folder.
4. Optionally, you can copy the saved *.vst file and paste a shortcut for it on the Desktop and/or the Windows Start menus. When the *.vst file or the shortcut is clicked, it will start a new eVSM map with the standards file
13. Standardizing Value Stream Maps172 172

Managing Names & Units
The Name & Unit Manager (NUM) provides a simple way of managing the names and units on a map via this toolbar button.
eVSM Name and Unit Manager
The purpose of this management environment is to:
1. Provide a means to type in a name only once and then use it consistently through out the map.
2. Provide a means to associate a default unit with a name so that when a name is selected, the unit is automatically set.
3. Provide a means of creating a starter set of names and units for different application areas such as manufacturing, healthcare, etc. This will allow a company to create standard variable sets and deploy them easily.
The NUM function does not allow editing of names and units directly in the data shapes. New names must first be added to the NUM form. Then they can be accessed via right mouse button menus on the following data shapes.
ValueName Unit
x.xx
Name
Unit
x.xx Unit x.xx Unit
60.00
Hrs
MinsLong NVU
Short NVU
Value Added Non Value Added
Units Converter
13. Standardizing Value Stream Maps173 173

Managing Names & Units (Cont’d)
The NUM form is divided into three parts: Sets, Units, and Names. Names and units visible in this dialog box represent the Current Set. Only the Current Set names and units are available on the right mouse button menu of datasets.
Saved Sets
Current Set Units
Add New Units
Current Set Names
Current Set Names
13. Standardizing Value Stream Maps174 174
Each name has a default unit. If a new name requires a new unit, then the new unit must be created first.
The names and units seen in the NUM form are available on the current page only and are stored in the NUM shape.
The NUM shape can be copied to other pages or shared with team members via a stencil.
Managing Names & Units (Cont’d)
Name UnitData
13. Standardizing Value Stream Maps175 175
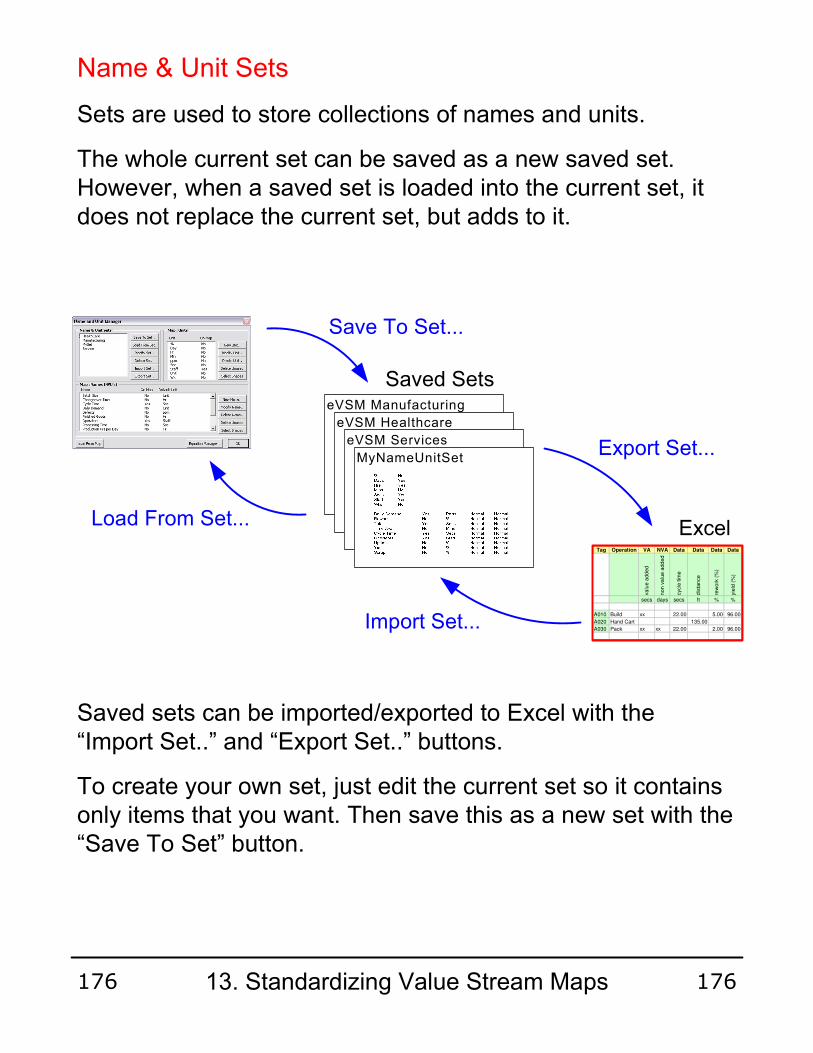
Name & Unit Sets
Sets are used to store collections of names and units.
The whole current set can be saved as a new saved set. However, when a saved set is loaded into the current set, it does not replace the current set, but adds to it.
Saved sets can be imported/exported to Excel with the “Import Set..” and “Export Set..” buttons.
To create your own set, just edit the current set so it contains only items that you want. Then save this as a new set with the “Save To Set” button.
Tag Operation VA NVA Data Data Data Data
va
lue
add
ed
no
n v
alu
e a
dd
ed
cycle
tim
e
dis
tan
ce
rew
ork
(%
)
yie
ld (
%)
secs days secs ft % %
A010 Build xx 22.00 5.00 96.00
A020 Hand Cart 135.00
A030 Pack xx xx 22.00 2.00 96.00
Excel
eVSM Manufacturing
eVSM Healthcare
eVSM Services
MyNameUnitSet
Saved Sets
Load From Set...
Export Set...
Save To Set...
Import Set...
13. Standardizing Value Stream Maps176 176

Name & Unit Sets (Cont’d)
The saved set can be used on other drawings and files by exporting it to Excel and them importing the Excel file into your target drawing.
You can edit the standardized list of names and units either by export/import to Excel or via the “Modify Sets..” button.
You can also create a new set in Excel and then import it with the “Import Set..” button.
Saved Sets
13. Standardizing Value Stream Maps177 177

Delivery of Standardized Components
The team leader creating the company standard essentially creates a collection of files that need to be copied to the following folder on each team member’s machine:
“C:/Program Files/eVSMStandards”
Example files:
“acme.vss” - standards file (Visio stencil format)“acme.vst” - new drawing startup file“readme.txt” - can include version number, history,
any special instructions, etc.
A shortcut on the Desktop (or the Start menu) pointing to the “acme.vst” file is useful for quick access to the standard.
The files can be delivered by manual means such as email, CD, etc. For wider distribution, a setup.exe may be created to automatically install the files in the correct location and create a shortcut. One way of creating a setup.exe is shown at www.evsm.com/v4/selfext.
13. Standardizing Value Stream Maps178 178

Standard Update Process
1. Update Standard Files – team leader updates one or more files.
2. Increment Version Number - in the stencil header bar. Also update history in the readme.txt file.
3. Send to Team – rebuild installation kit, update installation instructions, email or upload to server.
4. Install on Team Machines – verify update is not already installed. Exit Visio and install new version.
The new standard is ready for use on new maps.
Steps to update and deploy the new standard:
The “Load From Map” button will scan the current map for any names/units which do not exist in the current set and add them to the current set.
13. Standardizing Value Stream Maps179 179

eVSM Macro Maker allows you to create Macro Shapes. Macro Shapes are made up of collections of commonly used shapes. Macro Shapes can really speed up drawing of maps.
The eVSM Macro Maker button is in the eVSM toolbar and replaces the “Macro Maker” shape which was in earlier versions of eVSM.
eVSM Macro Maker
eVSM Macro Maker
Create a new Stencil by clicking on File (on the main Visio Menu Bar) – Shapes – New Stencil
Any Stencil to which changes are being made must be in Edit Mode
13. Standardizing Value Stream Maps180 180
1. From the main Visio Menu Bar click on “File>Shapes>New Stencil” to create a new stencil, or Right Click on an existing stencil and select Edit Stencil.
2. Select the shapes on the drawing page which you wish to include in the new macro.
3. Make a copy of the shapes and drag the copied shapes into the stencil.
4. Select the new Macro in the Stencil, then select the shapes from step 2 and click the eVSM Macro Maker. Select Yes when the message “OK to replace Shape contents in Stencil: XXXXX”.
5. Name the Macro in the stencil by right clicking.
6. Edit the icon image if necessary via the icon’s right-mouse-button menu (“Edit Master > Edit Icon Image”).
7. Test the macro by dragging and dropping it onto a map.
8. If needed, make any changes that are required and repeat steps 2 to 7.
9. Once your macro shape is ready, save the stencil.
Steps to Create a New Macro Shape
13. Standardizing Value Stream Maps181 181
Steps to Edit an Existing Macro Shape
1. Open the stencil in which the macro resides and put the stencil in edit mode (“Edit Stencil” command in right mouse menus).
2. Drag and drop your macro shape from the stencil onto the drawing page.
3. Make desired changes on the drawing page.
4. Select the updated shapes on the drawing page. Then select the original macro shape in the stencil.
5. Click the eVSM Macro Maker button on the toolbar. This will update the macro in the stencil.
6. Test the updated macro by dragging and dropping it onto a map.
7. If needed, repeat steps 3-6.
8. Once your macro shape is ready, save the stencil.
13. Standardizing Value Stream Maps182 182

This area intentionally left blank
13. Standardizing Value Stream Maps183 183
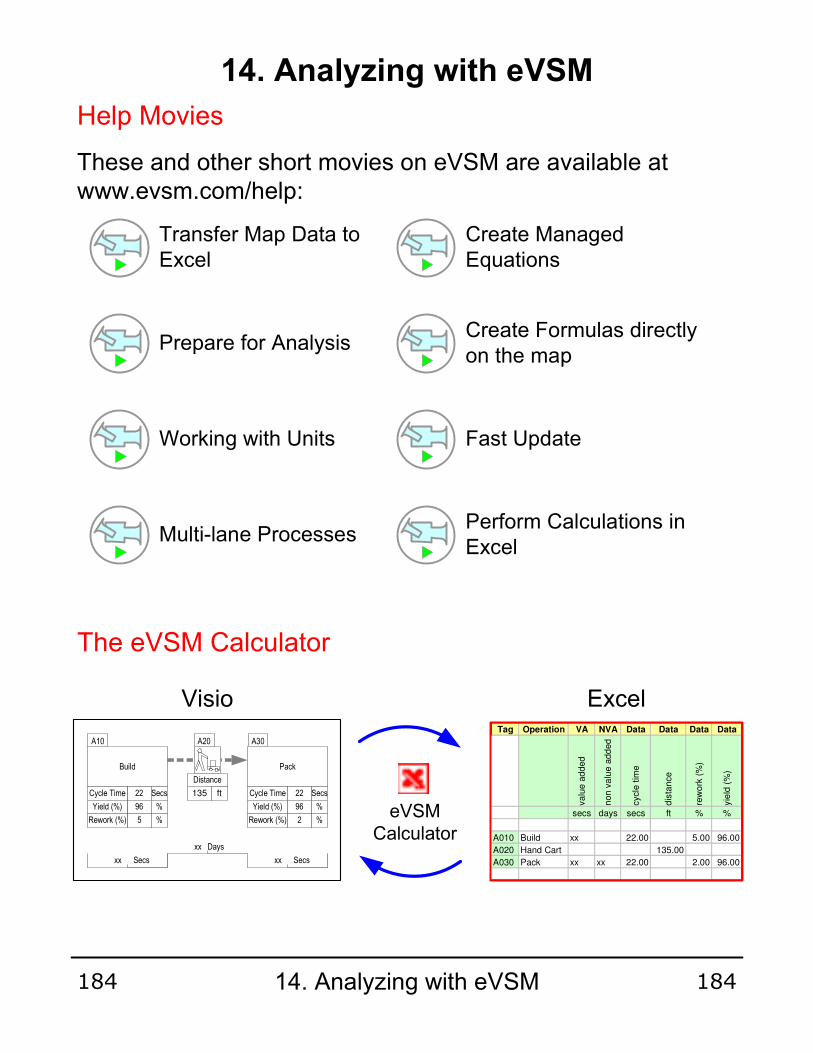
14. Analyzing with eVSM
Transfer Map Data to Excel
Help Movies
These and other short movies on eVSM are available at www.evsm.com/help:
Perform Calculations in Excel
Working with Units
Create Managed Equations
Prepare for Analysis
Fast Update
Multi-lane Processes
The eVSM Calculator
eVSM Calculator
Create Formulas directly on the map
Tag Operation VA NVA Data Data Data Data
valu
e a
dded
non v
alu
e a
dd
ed
cycle
tim
e
dis
tance
rew
ork
(%
)
yie
ld (
%)
secs days secs ft % %
A010 Build xx 22.00 5.00 96.00
A020 Hand Cart 135.00
A030 Pack xx xx 22.00 2.00 96.00
Excel
Build
A10
22Cycle Time Secs
96Yield (%) %
Pack
22Cycle Time Secs
96Yield (%) %
A30A20
135
Distance
ft
5Rework (%) % 2Rework (%) %
xx Days
xx Secs xx Secs
Visio
14. Analyzing with eVSM184 184

Followed by three numeric values
One alphabetic character
The eVSM Calculator button in the toolbar provides bi-directional transfer of information between the map and a spreadsheet. When the button is clicked for the first time in a map, eVSM automatically creates a new Excel file and puts it in the same folder the Visio file is saved in. The function only operates on the current map page
The eVSM Calculator (Cont'd)
Operation Tag
Operation Tags
The Operation Tag shape is used to specify which activities get synchronized with Excel. The tag is glued to any glue-point on the activity shape.
As new tags are dropped on the map, their numbers will increment automatically. The numbering sequence can be controlled via the eVSM Tag Number button.
Process
A10
eVSM Tag Path Locator Defaults
Tag numbers can also be named manually. However, the name must be unique and must be in the following format.
Each tagged shape will generate a row in the spreadsheet. Any data associated to that shape (via gluing) will appear in that row. Excel rows are alphabetically sorted by tag number.
A123
14. Analyzing with eVSM185 185

eVSM AutoTag
A quick way to tag activities is to select them on the page and in the sequence that you want them to be tagged. Then simply click the eVSM AutoTag button.
The activities will be tagged starting with the tag number and increment value as specified in the form under the eVSM Tag Number Button.
If you pick just a single existing tag and click the eVSM AutoTag button then it will use the current tag value to reset the form under the eVSM Tag Number Button. This is useful because in addition to adding and numbering tags for the first time, the eVSM Autotag button can also be used to renumber a selected set of tags or activities.
eVSM Tag Path Locater Defaults
Operation Tags (Cont'd)
14. Analyzing with eVSM186 186
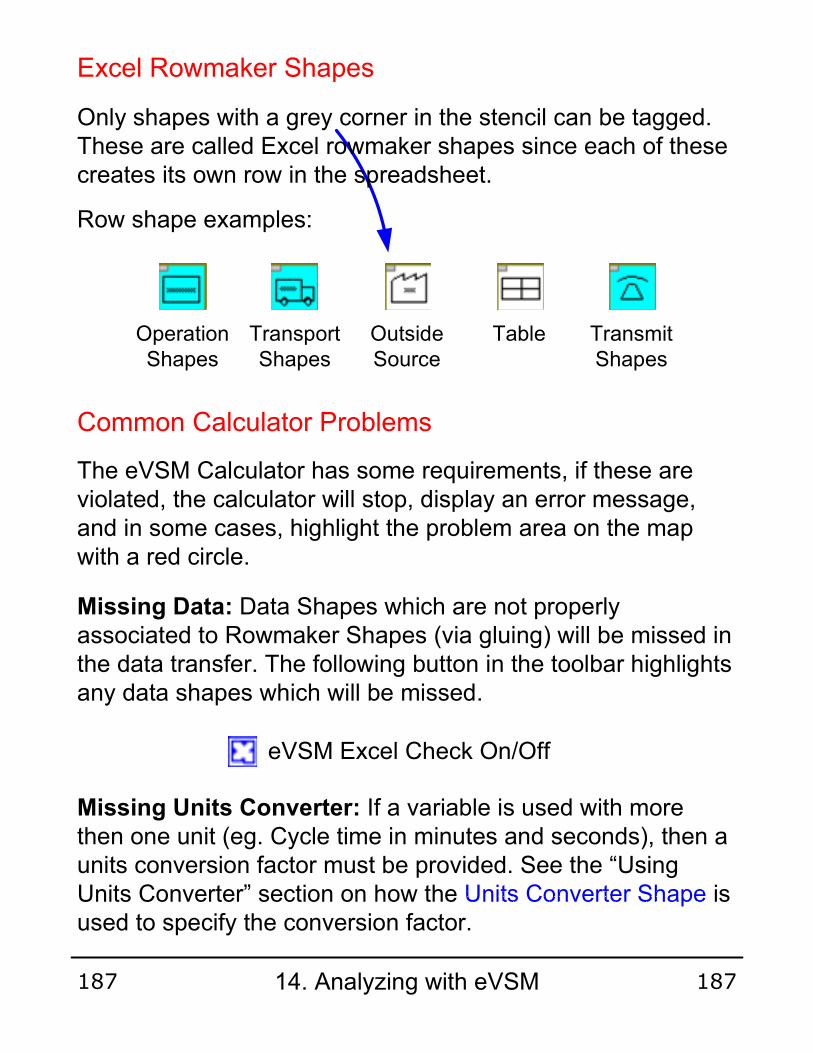
Only shapes with a grey corner in the stencil can be tagged. These are called Excel rowmaker shapes since each of these creates its own row in the spreadsheet.
Row shape examples:
Excel Rowmaker Shapes
Operation Shapes
Transport Shapes
Outside Source
Table Transmit Shapes
Common Calculator Problems
Missing Data: Data Shapes which are not properly associated to Rowmaker Shapes (via gluing) will be missed in the data transfer. The following button in the toolbar highlights any data shapes which will be missed.
Missing Units Converter: If a variable is used with more then one unit (eg. Cycle time in minutes and seconds), then a units conversion factor must be provided. See the “Using Units Converter” section on how the Units Converter Shape is used to specify the conversion factor.
eVSM Excel Check On/Off
The eVSM Calculator has some requirements, if these are violated, the calculator will stop, display an error message, and in some cases, highlight the problem area on the map with a red circle.
14. Analyzing with eVSM187 187

Tag Operation VA NVA Data Data Data Data
va
lue
ad
de
d
no
n v
alu
e a
dd
ed
cycle
tim
e
dis
tan
ce
rew
ork
(%
)
yie
ld (
%)
secs days secs ft % %
A010 Build xx 22.00 5.00 96.00
A020 Hand Cart 135.00
A030 Pack xx xx 22.00 2.00 96.00
All items in a column have same units
Rows sorted by Operation Tag number
One row per Rowmaker Shape
Data columns sorted by variable name
Data in Excel
Duplicate or Unglued Tags: Each Operation Tag on the map must have a unique value and must be glued to a valid Row Shape.
Overlapping Data Shapes: Overlapping Data Shapes when some are hidden behind others is not allowed.
Duplicate Data Shapes: Each Data Shape within a Row Shape collection must have a unique variable name.
Grouped Shapes: eVSM Shapes should not be grouped. The Calculator will abort if grouped shapes are found.
Common Calculator Problems (Cont'd)
14. Analyzing with eVSM188 188

Calculations in Excel
Equations may be entered in the spreadsheet cells in which Data Shapes are represented.
Steps:
The next time the Calculator is run, the result of the equation will be displayed in the appropriate data shape on the map. The calculated value will be color coded red to show it is controlled by Excel.
Note: After the “=” sign, instead of an equation (eg. =C3*D12), static values (eg. =216) can also be entered. This allows entry of measured metrics directly in the spreadsheet.
Select Cell1
Type “=” followed by an equation
Click the Enter button
2
3
14. Analyzing with eVSM189 189

Map.xlsMap.vsd
When the eVSM Calculator is run for the first time, the Excel file is created automatically and saved in the same folder as the Visio file. The Excel file is given the same name as the Visio file. A worksheet is created in Excel with the same name as the Visio page.
Unit conversion variables in Excel are also scoped by the page name.
eVSM relies greatly on the correspondence in names. Map names should only be changed using the “Model Copy” function
Excel and Visio File Naming
eVSM Calculator
Fast Update
The Fast Update button in the toolbar allows spreadsheet update 10x faster than running the eVSM Calculator. It is active if changes after a calculator run are limited to formulas and data values only.
The button is inactive (grayed out) when the spreadsheet is out of sync with the map. It gets activated when the Calculator is run.
eVSM Fast Update
14. Analyzing with eVSM190 190
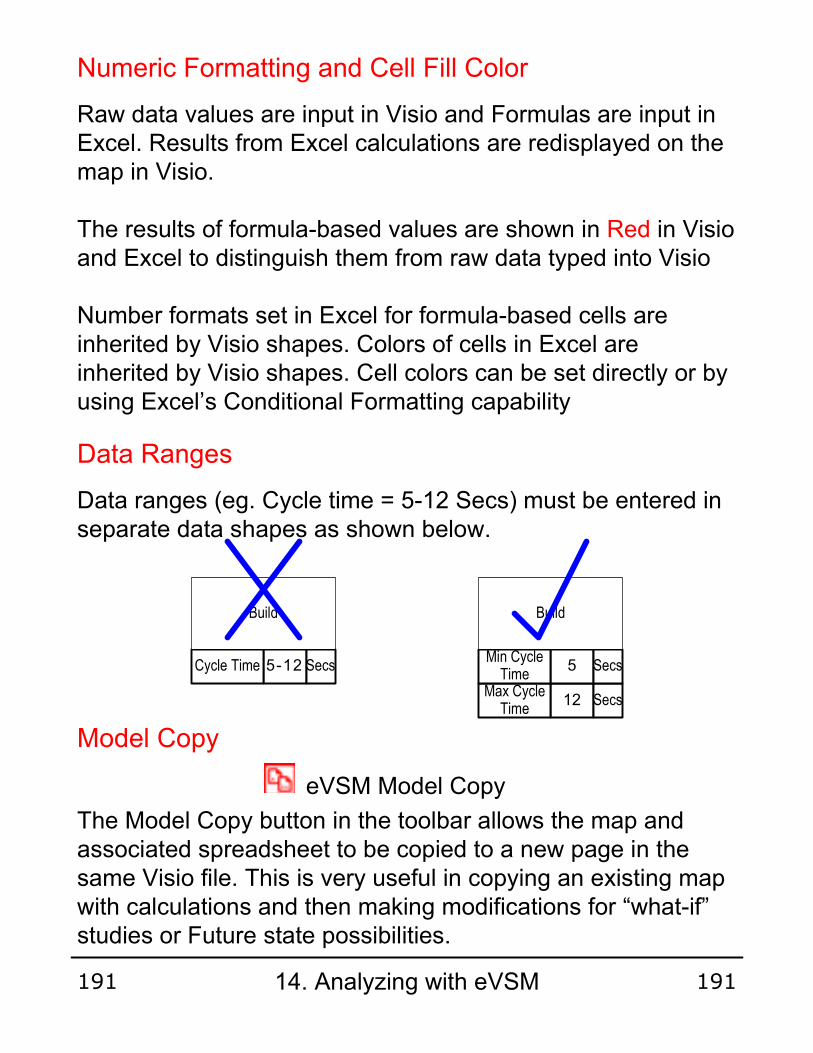
12Max Cycle Time
Secs
5Min Cycle Time
Secs5-12Cycle Time Secs
The Model Copy button in the toolbar allows the map and associated spreadsheet to be copied to a new page in the same Visio file. This is very useful in copying an existing map with calculations and then making modifications for “what-if” studies or Future state possibilities.
Model Copy
eVSM Model Copy
Data Ranges
Data ranges (eg. Cycle time = 5-12 Secs) must be entered in separate data shapes as shown below.
Build Build
Numeric Formatting and Cell Fill Color
Raw data values are input in Visio and Formulas are input in Excel. Results from Excel calculations are redisplayed on the map in Visio.
The results of formula-based values are shown in Red in Visio and Excel to distinguish them from raw data typed into Visio
Number formats set in Excel for formula-based cells are inherited by Visio shapes. Colors of cells in Excel are inherited by Visio shapes. Cell colors can be set directly or by using Excel’s Conditional Formatting capability
14. Analyzing with eVSM191 191

Visio
Build
A10
22Cycle Time Secs
96Yield (%) %
Pack
22Cycle Time Secs
96Yield (%) %
A30A20
135
Distance
ft
5Rework (%) % 2Rework (%) %
xx Days
xx Secs xx Secs
All eVSM calculations are done via an integrated Excel spreadsheet. The spreadsheet is created automatically when the “eVSM Calculator” function is invoked. Results from calculations in the spreadsheet are automatically displayed on the map. eVSM supports two types of equations to perform the calculations:
1.Direct Equations – formulas entered directly into cells in Excel.
2.Managed Equations – equations managed by eVSM and automatically inserted as formulas in Excel.
This section shows the Managed Equations capability in eVSM.
Managed Equations are created in Visio and storedin the NUM shape. When the eVSM Calculator is run, they generate Direct Equations in Excel.
eVSM Equation Manager
Tag Operation VA NVA Data Data Data Data
va
lue
ad
ded
no
n v
alu
e a
dd
ed
cycle
tim
e
dis
tan
ce
rew
ork
(%
)
yie
ld (
%)
secs days secs ft % %
A010 Build xx 22.00 5.00 96.00
A020 Hand Cart 135.00
A030 Pack xx xx 22.00 2.00 96.00
Excel
=($AE$18)*100/(($AF$18)*1440)
Name Unit Data
Managed Equations created and stored in Visio
Direct Equations in Excel
eVSM Calculator
14. Analyzing with eVSM192 192
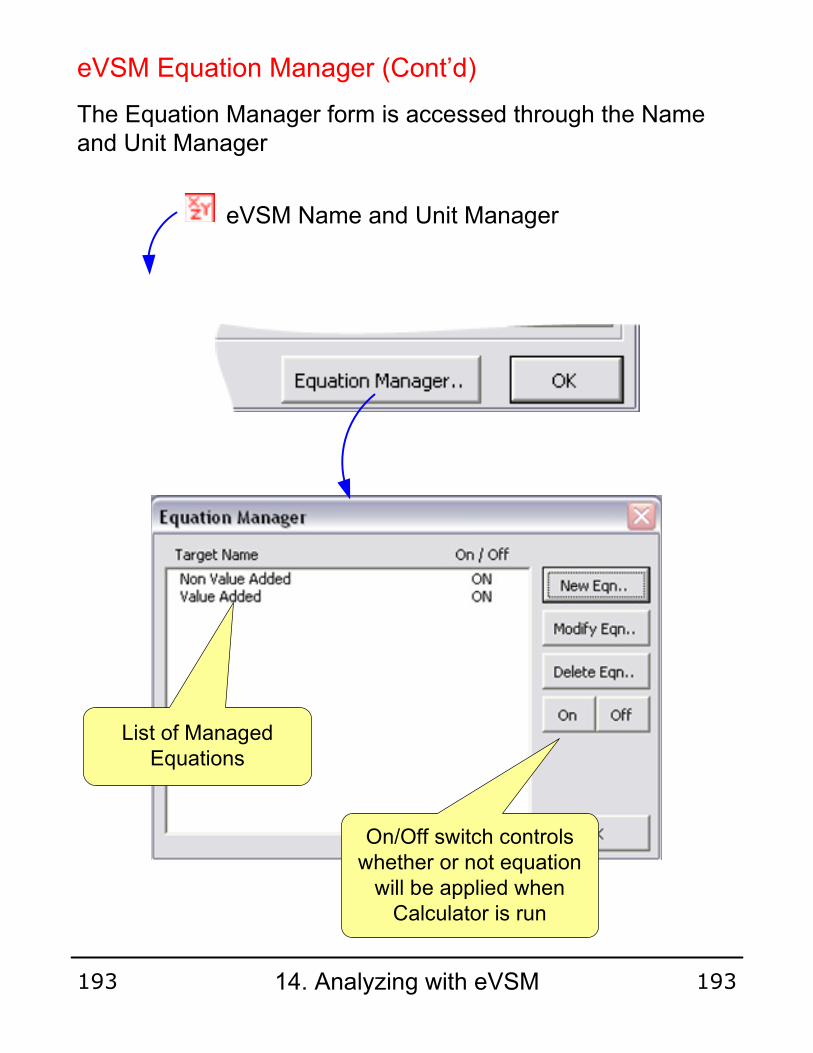
The Equation Manager form is accessed through the Name and Unit Manager
eVSM Name and Unit Manager
eVSM Equation Manager (Cont’d)
List of Managed Equations
On/Off switch controls whether or not equation will be applied when Calculator is run
14. Analyzing with eVSM193 193

Creating Managed Equations
In this example, we will set up a Managed Equation to calculate the Non-Value added (NVA) times associated with inventory and daily demand. The equation is:
Our goal is to use a single equation for the variable “Non Value Added” that is applied everywhere on the map where this variable exists. We will assume two key rules of the Equation Manager:
There is only one equation for each target variable name (left hand side of the equation).
An equation is either applied to the whole map (when it is ON), or not applied at all (when it is OFF).
Non Value Added (Days) =Inventory (Units)
Daily Demand (Units/Day)
Steps
1.Click the New Eqn.. Button.
14. Analyzing with eVSM194 194
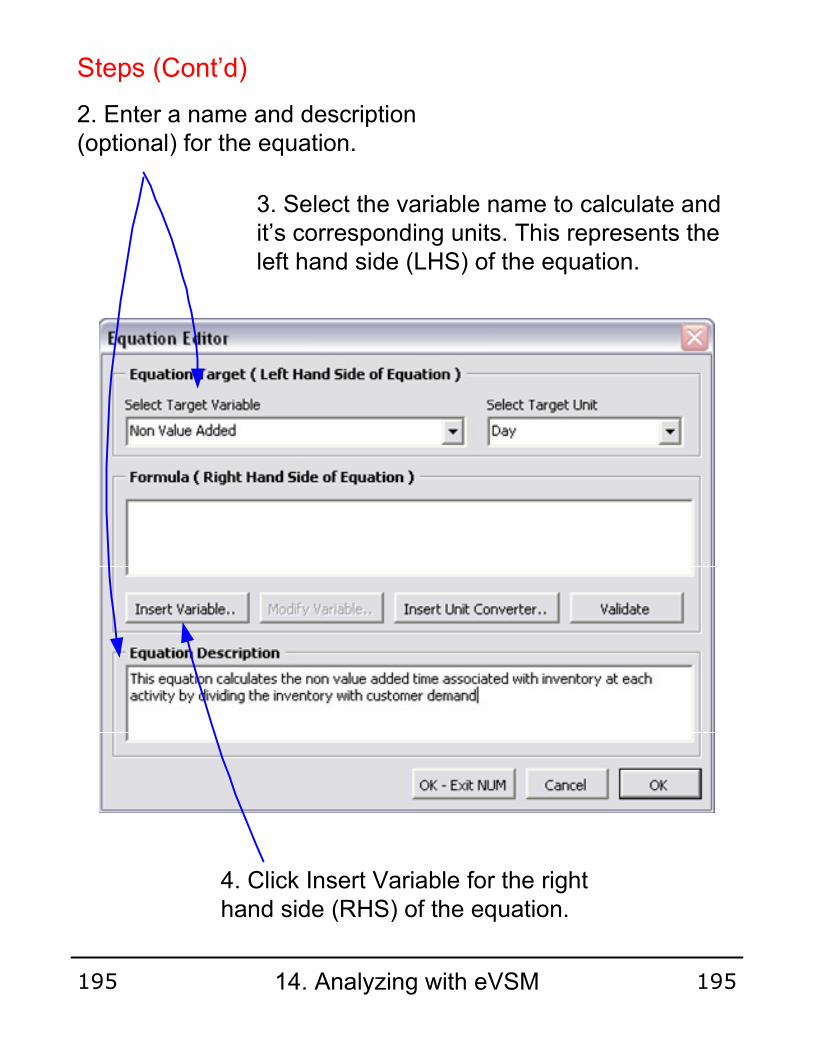
Steps (Cont’d)
2. Enter a name and description (optional) for the equation.
3. Select the variable name to calculate and it’s corresponding units. This represents the left hand side (LHS) of the equation.
4. Click Insert Variable for the right hand side (RHS) of the equation.
14. Analyzing with eVSM195 195

Steps (Cont’d)
5. Select “Parts” for variable name and units
6. Specify action to take if variable is not found on map
7. Select the “ST” option. This specifies how data will get selected from map. The selections are based on Operation Tag and are explained further in the following pages.
8. Click “OK” to return to the previous form.
14. Analyzing with eVSM196 196
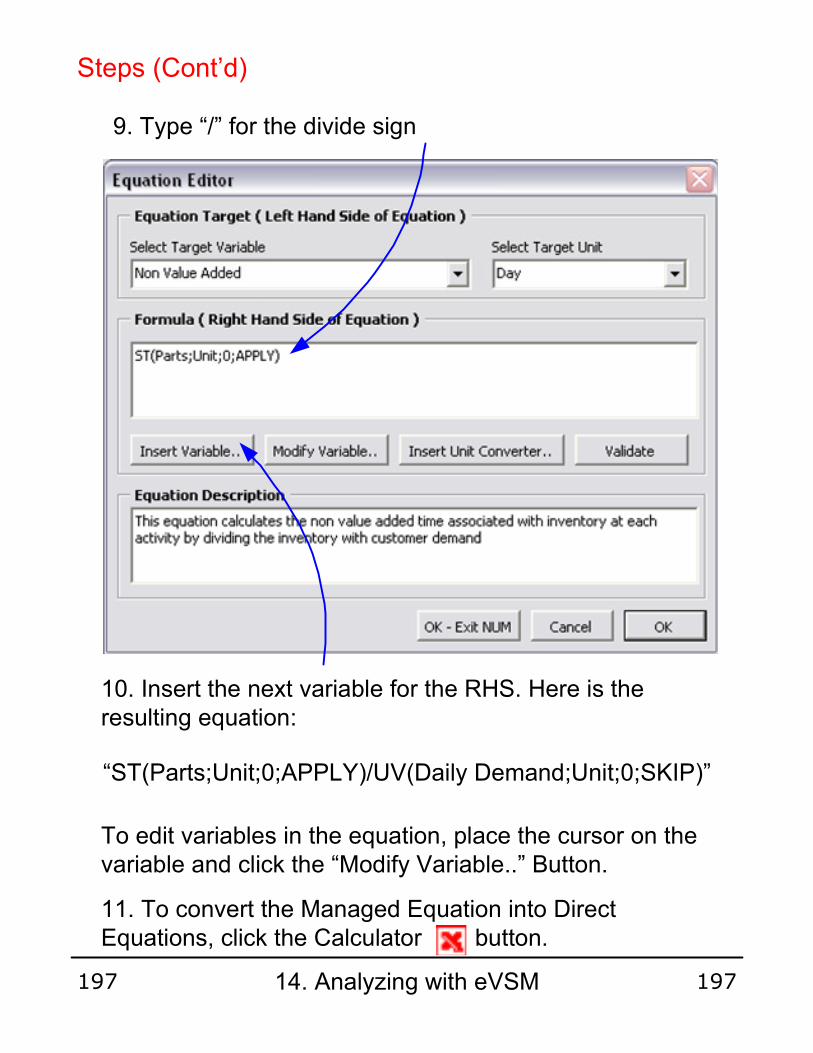
Steps (Cont’d)
9. Type “/” for the divide sign
10. Insert the next variable for the RHS. Here is the resulting equation:
To edit variables in the equation, place the cursor on the variable and click the “Modify Variable..” Button.
11. To convert the Managed Equation into Direct Equations, click the Calculator button.
“ST(Parts;Unit;0;APPLY)/UV(Daily Demand;Unit;0;SKIP)”
14. Analyzing with eVSM197 197

Equation Manager Variables Options
Same as Target Tag (ST) – Used to select the RHS variable from the same operation tag as the LHS variable.
Unique Variable On Map (UV) – Can be used when a variable occurs only once on the map, so there is no need to specify the operation tag id for it.
Named Tag (NT) – Allows you to provide a specific tag id. Should be used sparingly because of dependency on fixed tag id.
All Tags (ATS) - Selects the RHS variable from every tag on map where it exists and makes a list to put in the Excel function. Typical usage: sum all VA times.
Downstream Tags (DTS) – Selects the RHS variable from the downstream tag as specified by the Tag Seq arrows connecting the tags. Typical usage might be for cumulative calculations starting downstream and moving upstream like effective yield calculations.
Upstream Tags (UTS) - Selects the RHS variable from the downstream tag as specified by the Tag Seq arrows connecting the tags. Typical usage: cumulative time or cost calculations.
Range of Tags (RTS) - Selects RHS variable from all tags within the range provided. Typical usage: sum all times for the A series tags in a swimlane chart.
List of Tags (LTS) - Selects RHS variable from all tags supplied in a list
14. Analyzing with eVSM198 198
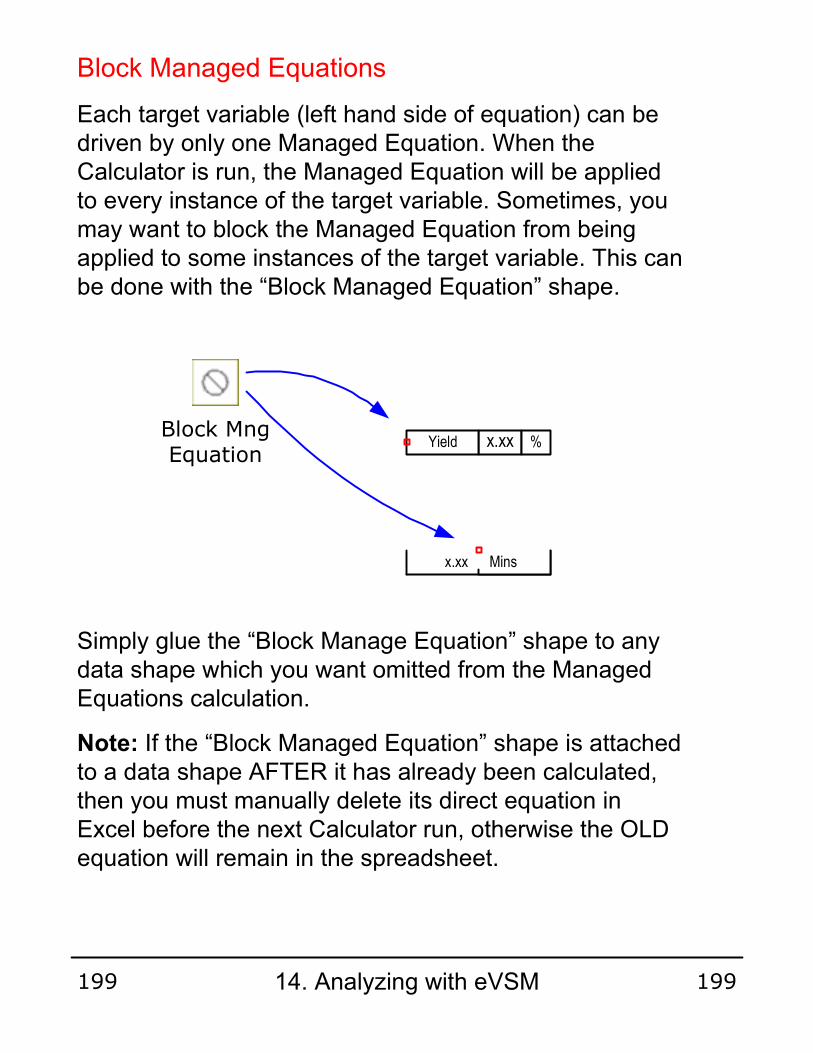
Block Managed Equations
Each target variable (left hand side of equation) can be driven by only one Managed Equation. When the Calculator is run, the Managed Equation will be applied to every instance of the target variable. Sometimes, you may want to block the Managed Equation from being applied to some instances of the target variable. This can be done with the “Block Managed Equation” shape.
Block Mng Equation
x.xxYield %
x.xx Mins
Simply glue the “Block Manage Equation” shape to any data shape which you want omitted from the Managed Equations calculation.
Note: If the “Block Managed Equation” shape is attached to a data shape AFTER it has already been calculated, then you must manually delete its direct equation in Excel before the next Calculator run, otherwise the OLD equation will remain in the spreadsheet.
14. Analyzing with eVSM199 199
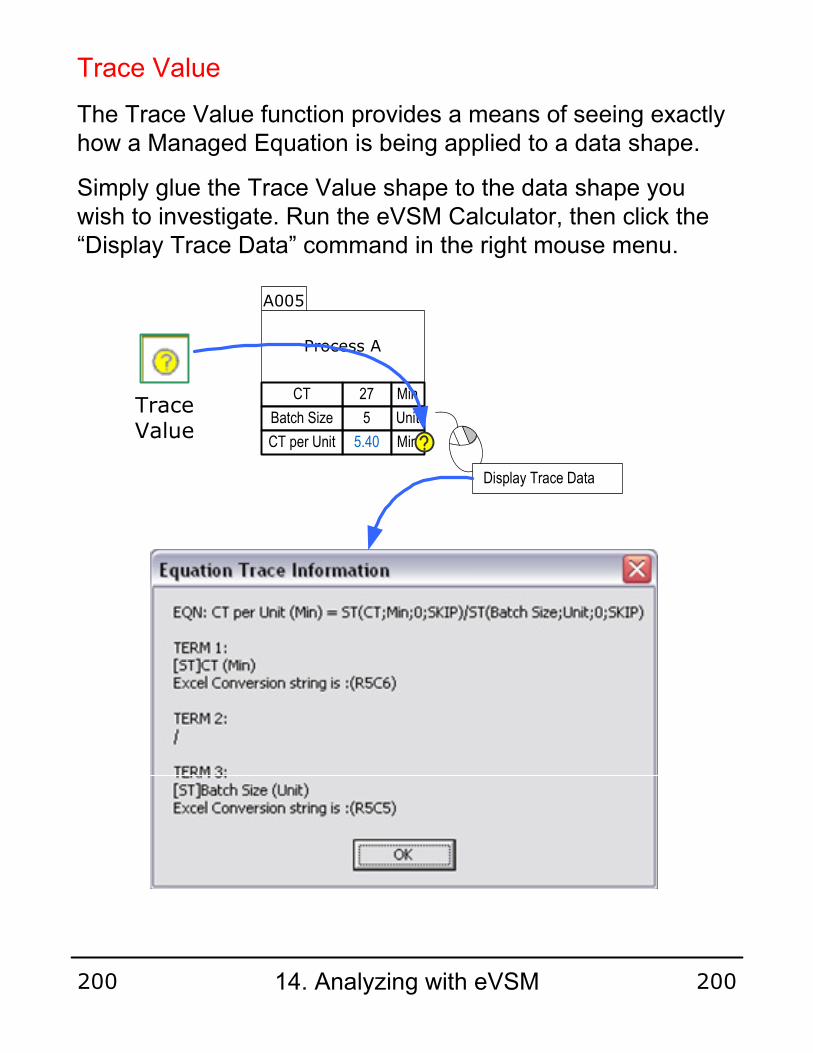
Trace Value
Trace Value
The Trace Value function provides a means of seeing exactly how a Managed Equation is being applied to a data shape.
Simply glue the Trace Value shape to the data shape you wish to investigate. Run the eVSM Calculator, then click the “Display Trace Data” command in the right mouse menu.
Process A
A005
27CT Min
5Batch Size Unit
5.40CT per Unit Min
Display Trace Data
14. Analyzing with eVSM200 200

Tag Sequence Arrow
Tag Seq Arrow
The Tag Seq Arrow is used with Managed Equations and allows you to perform upstream downstream calculations.
The Tag Seq Arrow is glued to Operation Tags.
The example below shows how Accumulative Time can be calculated along the value stream with the use of Tag Seq Arrows.
Process A Process B
15CT Min 10Transport Time
Min 20CT Min
15Accumulative
TimeMin 25
Accumulative Time
Min 45Accumulative
TimeMin
A010A020
A030
The Tag Seq Arrow visibility can be set with the switch in the eVSM Toolbar:
eVSM Tag Sequence Check On/Off
Managed Equation
Accumulated Time =
ST(CT;Min;0;APPLY)
+ ST(Transport Time;Min;0;APPLY)
+ UTS(ACCUMULATIVE TIME;MIN;0;APPLY;SUM)
14. Analyzing with eVSM201 201
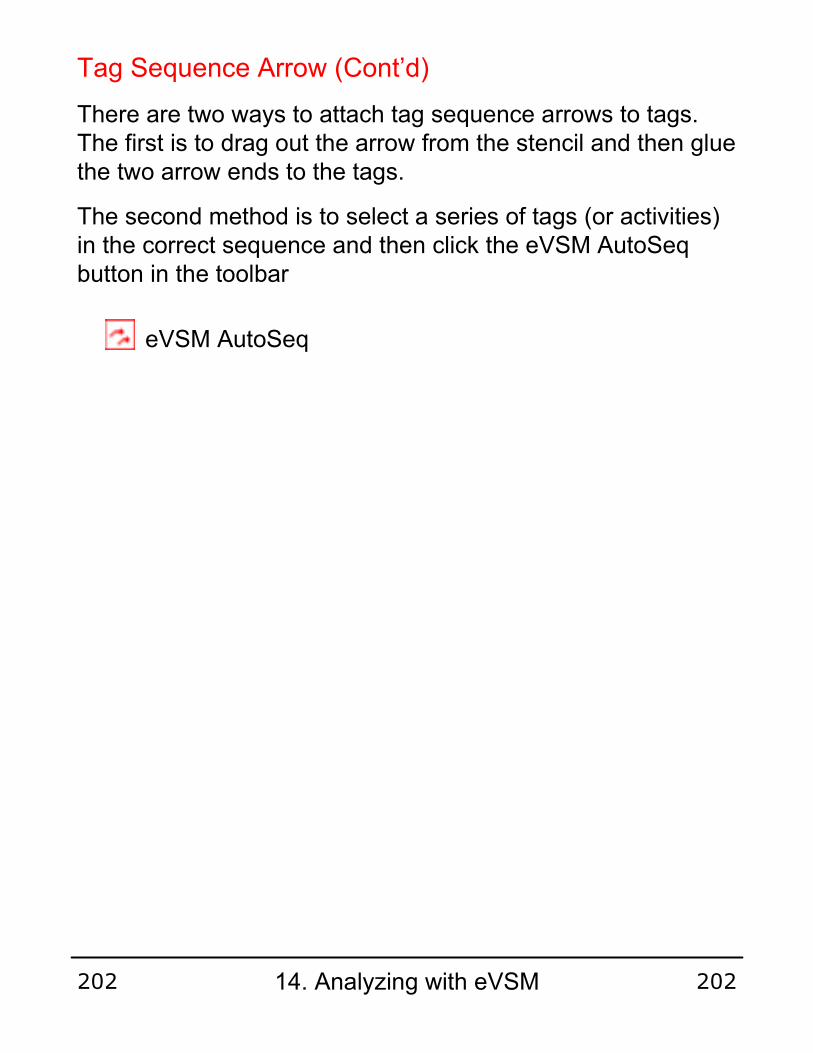
eVSM AutoSeq
There are two ways to attach tag sequence arrows to tags. The first is to drag out the arrow from the stencil and then glue the two arrow ends to the tags.
The second method is to select a series of tags (or activities) in the correct sequence and then click the eVSM AutoSeq button in the toolbar
Tag Sequence Arrow (Cont’d)
14. Analyzing with eVSM202 202
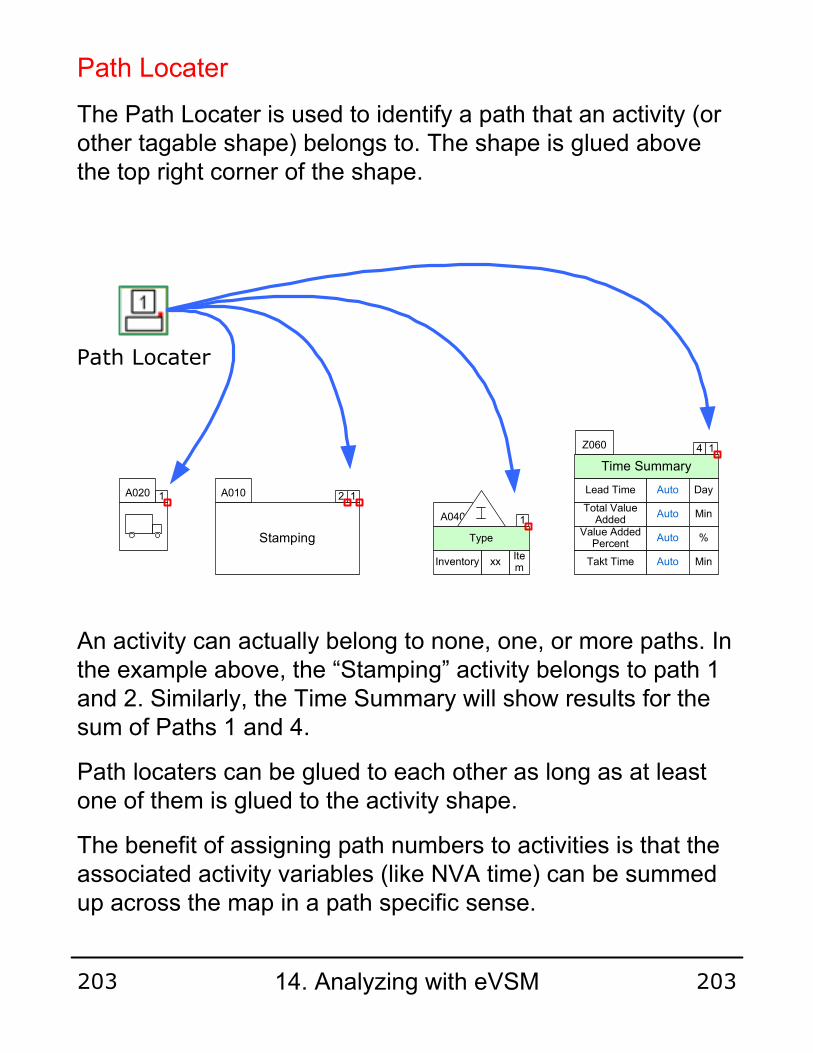
Path Locater
The Path Locater is used to identify a path that an activity (or other tagable shape) belongs to. The shape is glued above the top right corner of the shape.
Path Locater
Stamping
A010 2 1A020 1
A040 1
Type
xxInventoryItem
AutoTakt Time Min
AutoTotal Value
AddedMin
AutoLead Time Day
AutoValue Added
Percent%
Z060
Time Summary
1
An activity can actually belong to none, one, or more paths. In the example above, the “Stamping” activity belongs to path 1 and 2. Similarly, the Time Summary will show results for the sum of Paths 1 and 4.
Path locaters can be glued to each other as long as at least one of them is glued to the activity shape.
The benefit of assigning path numbers to activities is that the associated activity variables (like NVA time) can be summed up across the map in a path specific sense.
4
14. Analyzing with eVSM203 203
14. Analyzing with eVSM204 204

14. Analyzing with eVSM205 205

xx Unit
22Cycle Time Secs
This function provides an alternative method of creating Excel formulas. The formulas are created in Visio by directly picking items from the map. The Formula Wizard also has a presentation function which highlights the participating data shapes on the map and displays the formulas in readable language.
The Formula Wizard is only active immediately after an “eVSM Calculator” run. It is grayed out when inactive.
Formula Wizard
eVSM Formula Wizard
1. First, pick the target shape representing the VA time.
In the example below, we are going to set VA Time=Cycle Time for the A10 activity.
Using the Formula Wizard to create Excel equations
Process
A010
14. Analyzing with eVSM206 206

Using the Formula Wizard (Cont'd.)
2. Now click the Formula Wizard button in the toolbar.
3. The Formula Wizard text window shows the Excel cell corresponding to the target shape (VA) that was selected.
4. Click the Insert Map Variable button to pick data on the drawing for the the formula.
xx Unit
22Cycle Time Secs
5. Pick the “Cycle Time” NVU to create the right hand side of the formula
A BLUE border on a shape represents the right hand side of the equation.
A GREEN border on a shape represents the left hand side of the equation.
Process
14. Analyzing with eVSM207 207

Using the Formula Wizard (Cont'd.)
6. Here is the resulting formula. Click “OK” to send it to the spreadsheet.
7. If the formula needs units converters than they are available by clicking the “Show Units” button on the form.
Remember : The formula behaves exactly as if you typed it into the Excel spreadsheet directly. So the units corresponding to each data shape are those that the data column has in Excel.
9. The “Formula Details” window shows the same formula in a more readable language, useful for presentations. Note: formulas cannot be edited in this window.
14. Analyzing with eVSM208 208

Using the Formula Wizard (Cont'd.)
10.Use the Summation button to pick a value to be summed across the map. For example, if you need the sum of the VA times, just click the summation button, then select any one VA time shape on the map. eVSM will automatically find all the VA time shapes.
11. If the Formula Wizard Icon is grayed out, it is because the spreadsheet needs to be updated first. Do this by running the eVSM calculator.
14. Analyzing with eVSM209 209
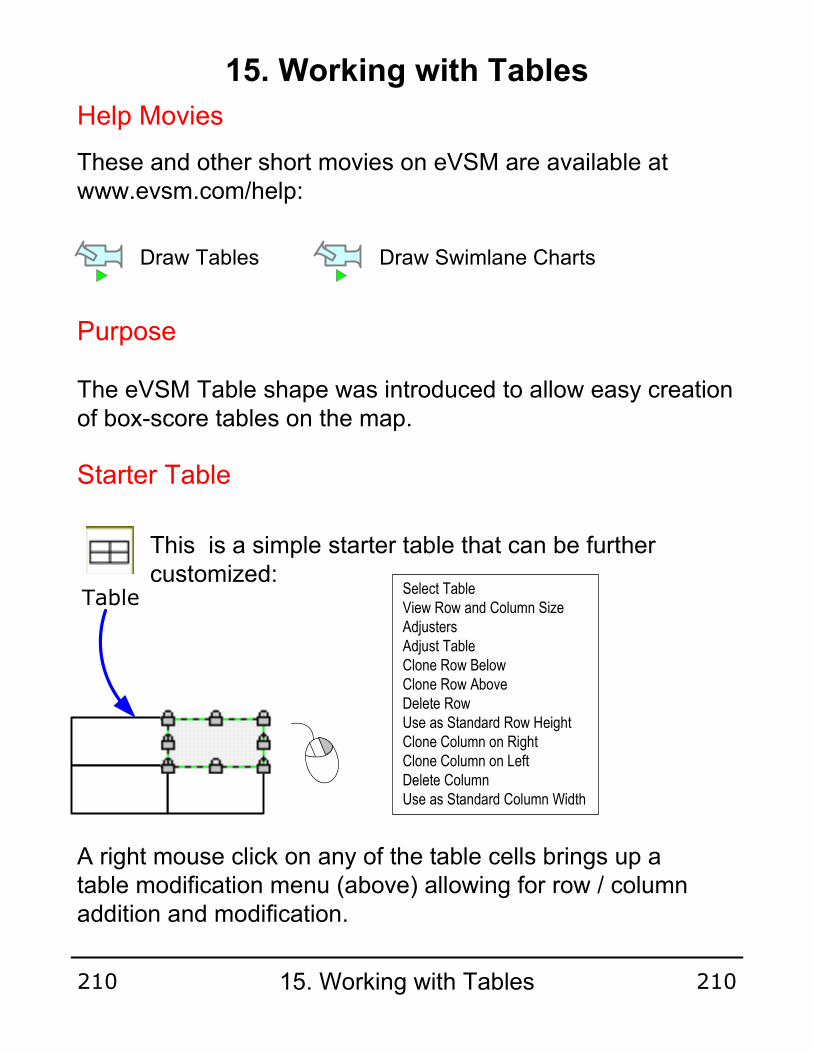
Table
This is a simple starter table that can be further customized:
A right mouse click on any of the table cells brings up a table modification menu (above) allowing for row / column addition and modification.
Select TableView Row and Column Size AdjustersAdjust TableClone Row BelowClone Row AboveDelete RowUse as Standard Row HeightClone Column on RightClone Column on LeftDelete ColumnUse as Standard Column Width
15. Working with Tables
The eVSM Table shape was introduced to allow easy creation of box-score tables on the map.
Purpose
Starter Table
Help Movies
These and other short movies on eVSM are available at www.evsm.com/help:
Draw Tables Draw Swimlane Charts
15. Working with Tables210 210
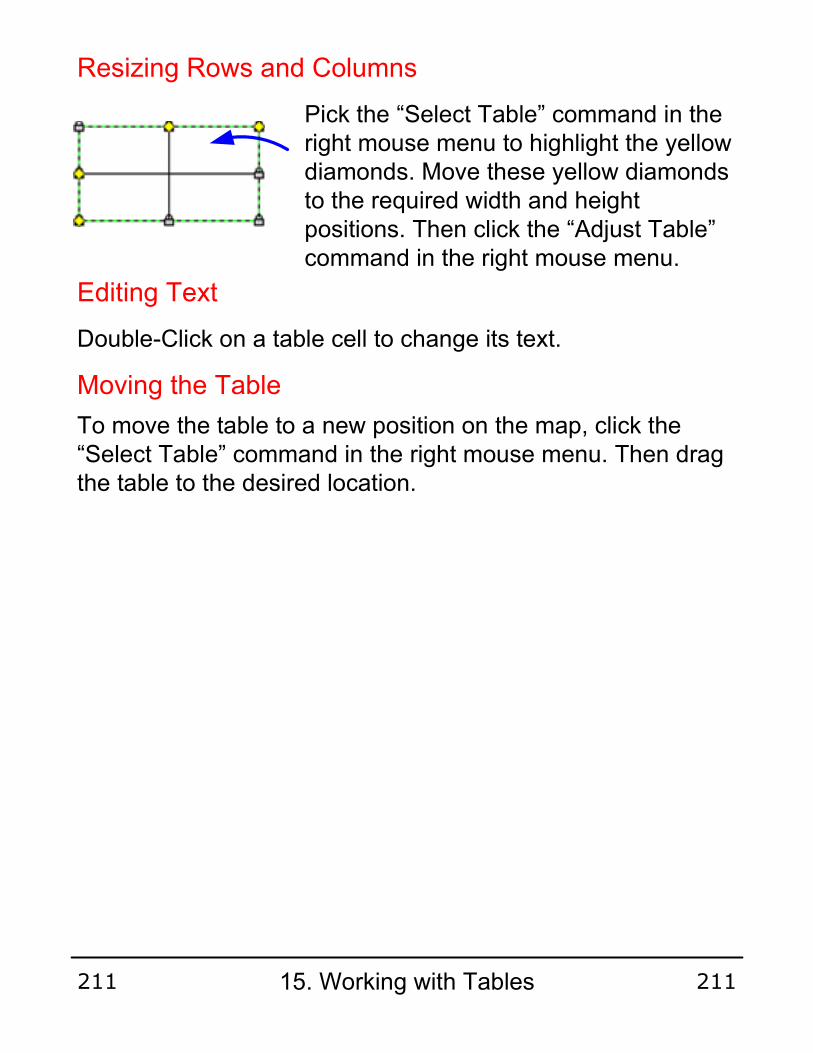
Pick the “Select Table” command in the right mouse menu to highlight the yellow diamonds. Move these yellow diamonds to the required width and height positions. Then click the “Adjust Table” command in the right mouse menu.
Resizing Rows and Columns
Moving the Table
To move the table to a new position on the map, click the “Select Table” command in the right mouse menu. Then drag the table to the desired location.
Editing Text
Double-Click on a table cell to change its text.
15. Working with Tables211 211

Lane A
Lane B
Swim Lane Table
Swimlane
The eVSM Swimlane function allows drawing of VSMs and flowcharts in swimlane layout. The eVSM Swimlane shape is an implementation of the eVSM Table function. Therefore, row manipulation and resizing works exactly as shown above for the Table function.
To calculate totals or plot charts for each lane, see the Path Locator function.
Note: The swim lane function in native Visio is NOT supported with eVSM. The eVSM Calculator will not work if the Visio swim lane shape is on your drawing page.
15. Working with Tables212 212

Current State
1057Capacity
Lead Time 23 days
Future State
2 days
2000
A10
Each table creates its own worksheet page in the Excel Workbook. If the page name is “CS” and the tag is “A10” then the worksheet in Excel will be called “CS_A10”. If formulas are created within cells in the spreadsheet, the results of those formulas will appear in the table when the eVSM Calculator button is clicked.
Tables and Spreadsheets
You can transfer table cell data to the spreadsheet with the “eVSM Calculator” button
eVSM Calculator
To transfer the data the table has to be tagged first.
Operation Tag
15. Working with Tables213 213
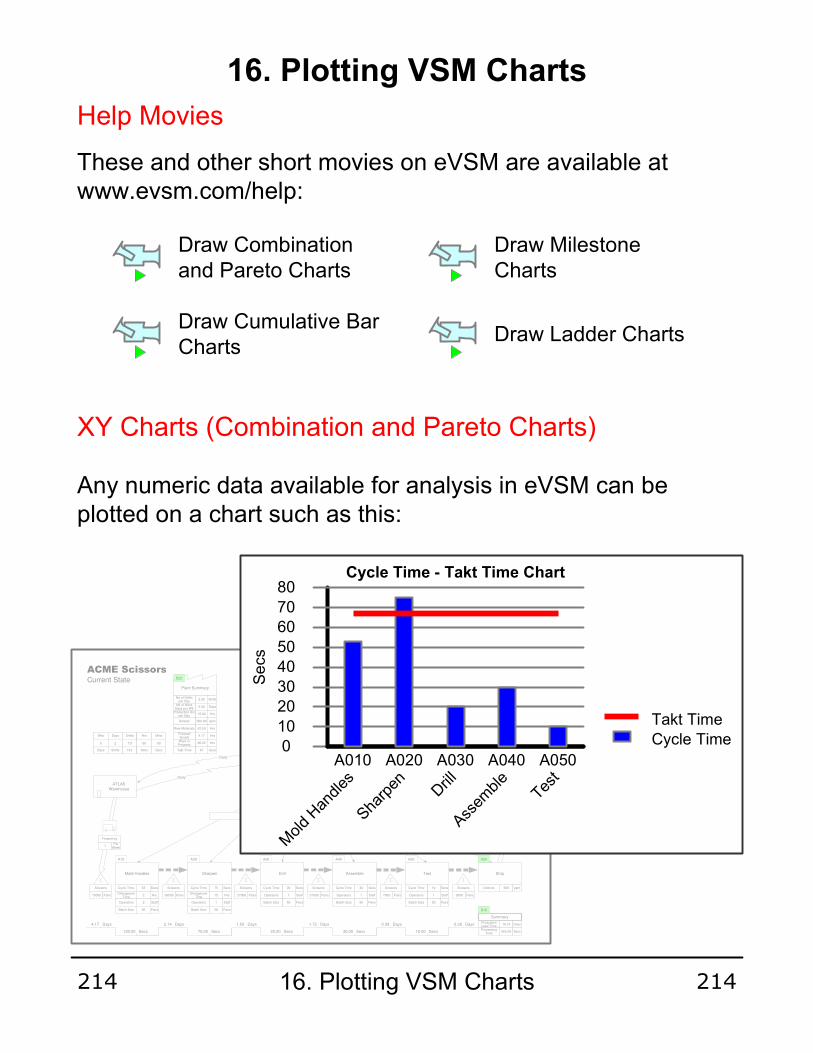
16. Plotting VSM Charts
Help Movies
These and other short movies on eVSM are available at www.evsm.com/help:
Draw Combination and Pareto Charts
XY Charts (Combination and Pareto Charts)
Any numeric data available for analysis in eVSM can be plotted on a chart such as this:
Draw Cumulative Bar Charts
Draw Milestone Charts
Cross Dock
Assemble
30Cycle Time Secs
1Operators Staff
50Batch Size Pairs
Test
10Cycle Time Secs
1Operators Staff
50Batch Size Pairs
Ship
500Defects ppm
Drill
20Cycle Time Secs
1Operators Staff
50Batch Size Pairs
Sharpen
75Cycle Time Secs
15Changeover
TimeHrs
1Operators Staff
50Batch Size Pairs
Mold Handles
53Cycle Time Secs
2Changeover
TimeHrs
2Operators Staff
50Batch Size Pairs
38500
Scissors
Pairs 27000
Scissors
Pairs 31000
Scissors
Pairs 7000
Scissors
Pairs 5000
Scissors
Pairs75000
Scissors
Pairs
ATLAS
Warehouse
1
Frequency
Per Week
1
Frequency
Per Week
MRP
Production
Control
Forecast 30 DaysWeekly Order
Daily
Daily
130.00 Secs
4.17 Days
75.00 Secs
2.14 Days
20.00 Secs
1.50 Days
30.00 Secs
1.72 Days
10.00 Secs
0.39 Days 0.28 Days
Weekly Schedule
Summary
18000Daily Demand Pairs
10.19Production Lead Time
Days
265.00Processing
TimeSecs
Daily Ship Schedule
5
Wks
Days
2
Days
Shifts
7.5
Shifts
Hrs
60
Hrs
Mins
60
Mins
Secs
Plant Summary
2.00No of Shifts
per DayShifts
5.00No of Work
Days per WkDays
15.00Production Hrs
per DayHrs
500.00Defects ppm
62.50Raw Materials Hrs
4.17Finished Goods
Hrs
86.25Work in
ProgressHrs
67Takt Time Secs
A10 A20 A30 A40 A50 A60
A70
B10
B20
ACME Scissors
Current State ChartMaker
Cycle Time - Takt Time Chart
Secs
0
10
20
30
40
50
60
70
80
A010
Mold Handles
A020
Sharpen
A030
Drill
A040
Assemble
A050
Test
Cycle Time
Takt Time
Draw Ladder Charts
16. Plotting VSM Charts214 214

XY Charts (Cont’d)
Before creating a chart, you must ensure that the data to be plotted is:
- Contained in eVSM data shapes- The data shapes are glued to the parent rowmaker shapes- Rowmaker shapes are tagged with Operation Tags
Hint: Use the Glue Check and Excel Check buttons in the eVSM toolbar to verify.
Steps to Plot XY Charts
1. Drag out the XY Chart icon from the stencil, and place it anywhere on the map.
XY Chart
XY Chart
Edit Chart DataPlot ChartCreate Spreadsheet
Right mouse click on the shape and select the “Edit Chart Data” command.
16. Plotting VSM Charts215 215
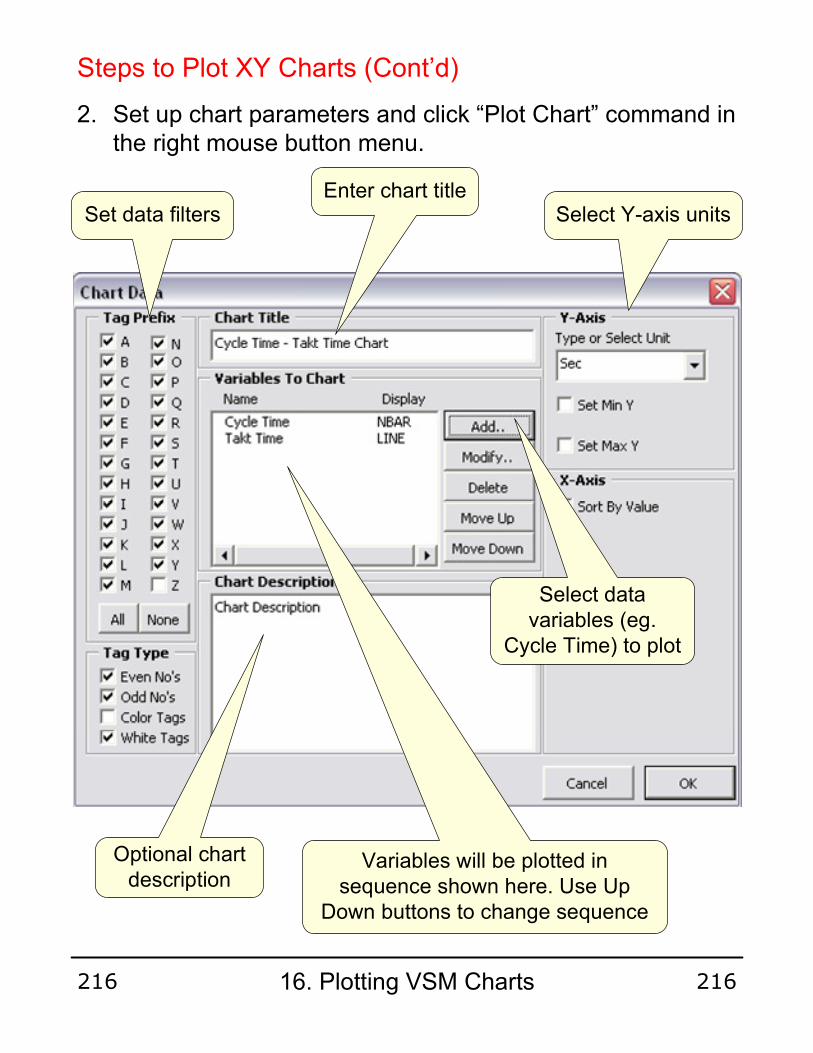
2. Set up chart parameters and click “Plot Chart” command in the right mouse button menu.
Steps to Plot XY Charts (Cont’d)
Enter chart titleSelect Y-axis unitsSet data filters
Select data variables (eg.
Cycle Time) to plot
Variables will be plotted in sequence shown here. Use Up
Down buttons to change sequence
Optional chart description
16. Plotting VSM Charts216 216
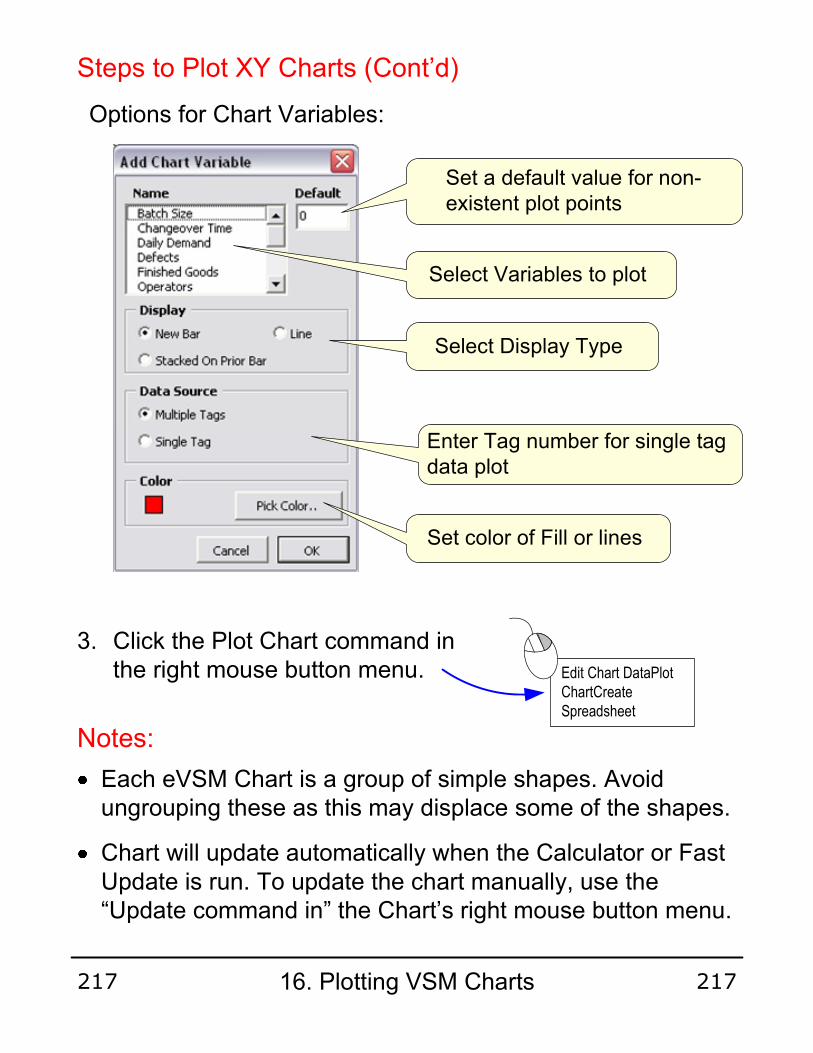
Options for Chart Variables:
Select Variables to plot
Set a default value for non-existent plot points
Select Display Type
Each eVSM Chart is a group of simple shapes. Avoid ungrouping these as this may displace some of the shapes.
Chart will update automatically when the Calculator or Fast Update is run. To update the chart manually, use the “Update command in” the Chart’s right mouse button menu.
Set color of Fill or lines
Enter Tag number for single tag data plot
Notes:
3. Click the Plot Chart command in the right mouse button menu. Edit Chart DataPlot
ChartCreate Spreadsheet
Steps to Plot XY Charts (Cont’d)
16. Plotting VSM Charts217 217
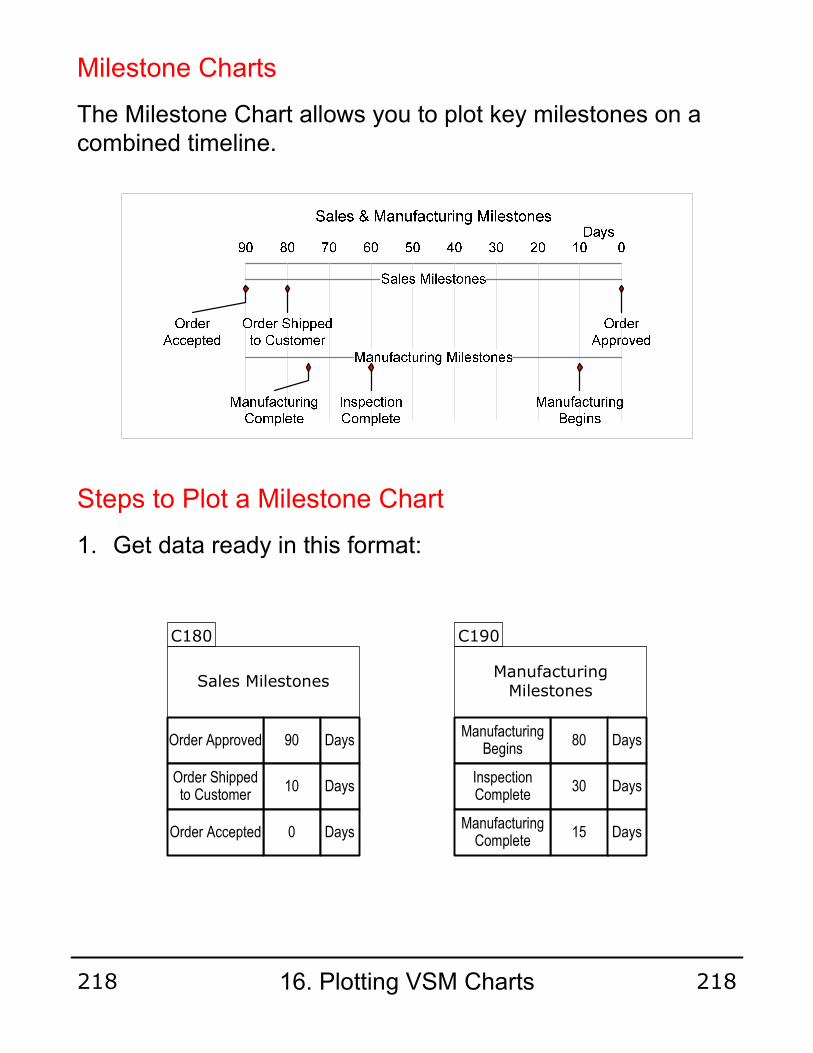
Milestone Charts
The Milestone Chart allows you to plot key milestones on a combined timeline.
Steps to Plot a Milestone Chart
1. Get data ready in this format:
Sales Milestones
90Order Approved Days
10Order Shipped to Customer
Days
0Order Accepted Days
C180
Manufacturing Milestones
80Manufacturing
BeginsDays
30Inspection Complete
Days
15Manufacturing Complete
Days
C190
16. Plotting VSM Charts218 218

Edit Milestone Chart DataPlot Milestone ChartCreate Spreadsheet
Milestone Chart
Milestone Chart
Steps to Plot a Milestone Chart (Cont’d)
2. Drag out the Milestone Chart icon and click the “Edit” command in it’s right mouse button menu.
3. Complete the form:
4. Plot chart
5. Use the “Update..” command in the chart’s right mouse button menu to update the chart when the data changes.
Update Milestone Tag Chart
Milestone Chart
Edit Milestone Chart DataPlot Milestone ChartCreate Spreadsheet
16. Plotting VSM Charts219 219

Cumulative Bar Chart
Cumulative Bar Chart
Cumulative Bar Charts
The Cumulative Bar Chart allows you to visualize the phases of a value stream on a timeline.
Steps to Plot a Cumulative Bar Chart
1. Get data ready in this format:
Edit Milestone Chart DataPlot Milestone ChartCreate Spreadsheet
2. Drag out the Cumulative Bar Chart icon and click the “Edit” command in its right mouse button menu.
Order Fulfillment Timeline
1Process Order Days
8Order Approval Days
3Scheduling Days
15Wait for Mfg Days
10Manufacturing Days
1Wait for Delivery
Days
2Delivery Days
B070
16. Plotting VSM Charts220 220
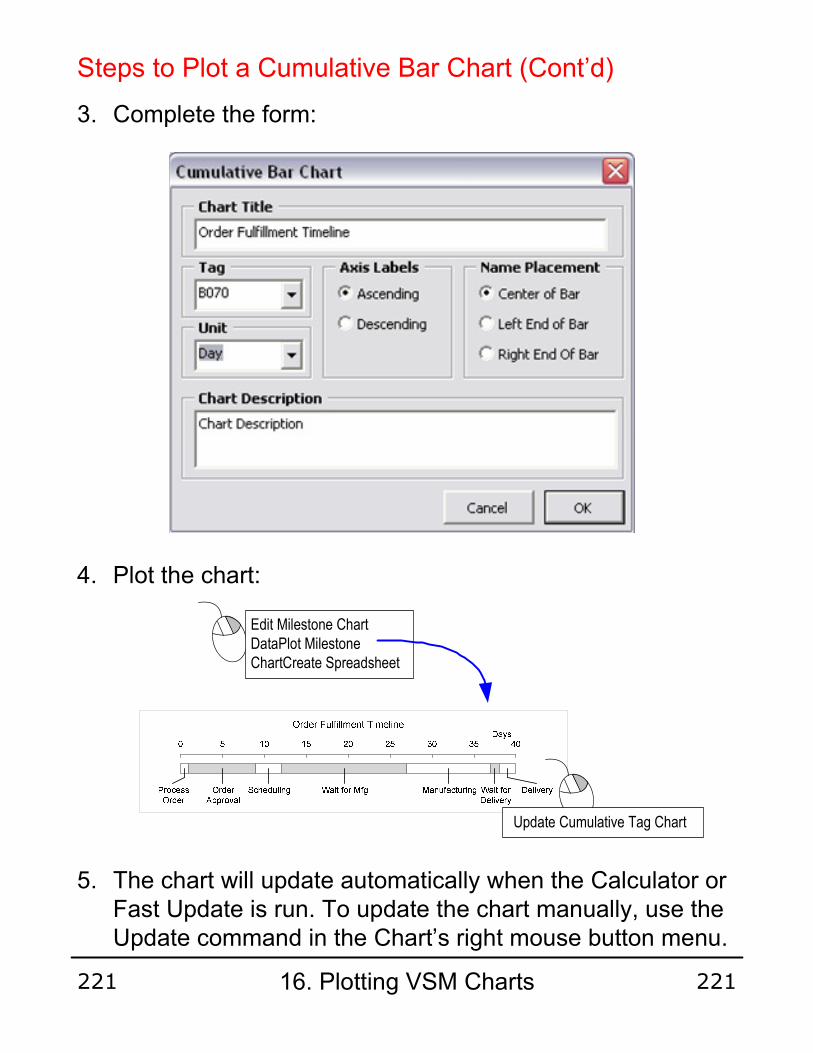
Steps to Plot a Cumulative Bar Chart (Cont’d)
3. Complete the form:
4. Plot the chart:
5. The chart will update automatically when the Calculator or Fast Update is run. To update the chart manually, use the Update command in the Chart’s right mouse button menu.
Update Cumulative Tag Chart
Edit Milestone Chart DataPlot Milestone ChartCreate Spreadsheet
16. Plotting VSM Charts221 221

Ladder Charts
The Ladder Chart shape allows you to create timeline and operator balance charts such as the following:
Operator Balance ChartMin
0 2 4 6 8 10 12 14 16
A010De-burr Casting
Operator1
A020Assemble Lining
A030Install switch
Operator2
A040Solder Wiring
Operator3
Value Added and Non-value added Time LadderMin
0 5 10 15 20 25 30 35
A010De-burr
Casting
A020Assemble Lining
A030Install switch
A040Solder Wiring
Non Value Added Value Added
16. Plotting VSM Charts222 222

Steps to Plot a Timeline Ladder Chart
We will plot a Timeline Ladder for the VA/NVA times from this VSM.
Solder Wiring
13Operator3 Min
A040
9 Min
4 Min
De-burr Casting Assemble Lining Install switch
3Operator1 Min 12Operator1 Min 7Operator2 Min
A010 A020 A030
2 Min
1 Min
9 Min
3 Min
4 Min
3 Min
1. Drag out the Ladder Chart icon and click the “Edit” command in it’s right mouse button menu.
Ladder Chart
Edit Ladder Chart DataPlot Ladder ChartCreate Spreadsheet
Ladder Chart
2. Complete the form:
16. Plotting VSM Charts223 223

3. Plot chart
Steps to Plot a Timeline Ladder Chart (Cont’d)
Ladder Chart Edit Ladder Chart
DataPlot Ladder ChartCreate Spreadsheet
Value Added and Non-value added Time LadderMin
0 5 10 15 20 25 30 35
A010
De-burr Casting
A020
Assemble Lining
A030
Install switch
A040
Solder Wiring
Non Value Added Value Added
Update Chart
4. The chart will update automatically when the Calculator or Fast Update is run. To update the chart, manually, use the “Update Chart” command in the chart’s right mouse button menu.
16. Plotting VSM Charts224 224

Solder Wiring
13Operator3 Min
A040
9 Min
4 Min
De-burr Casting Assemble Lining Install switch
3Operator1 Min 12Operator1 Min 7Operator2 Min
A010 A020 A030
2 Min
1 Min
9 Min
3 Min
4 Min
3 Min
Here is our data:
1. Drag out the Ladder Chart icon and click the Edit command in it’s right mouse button menus
Ladder Chart
Edit Ladder Chart DataPlot Ladder ChartCreate Spreadsheet
Ladder Chart
2. Complete form
Steps to Plot an Operator Balance Chart
16. Plotting VSM Charts225 225
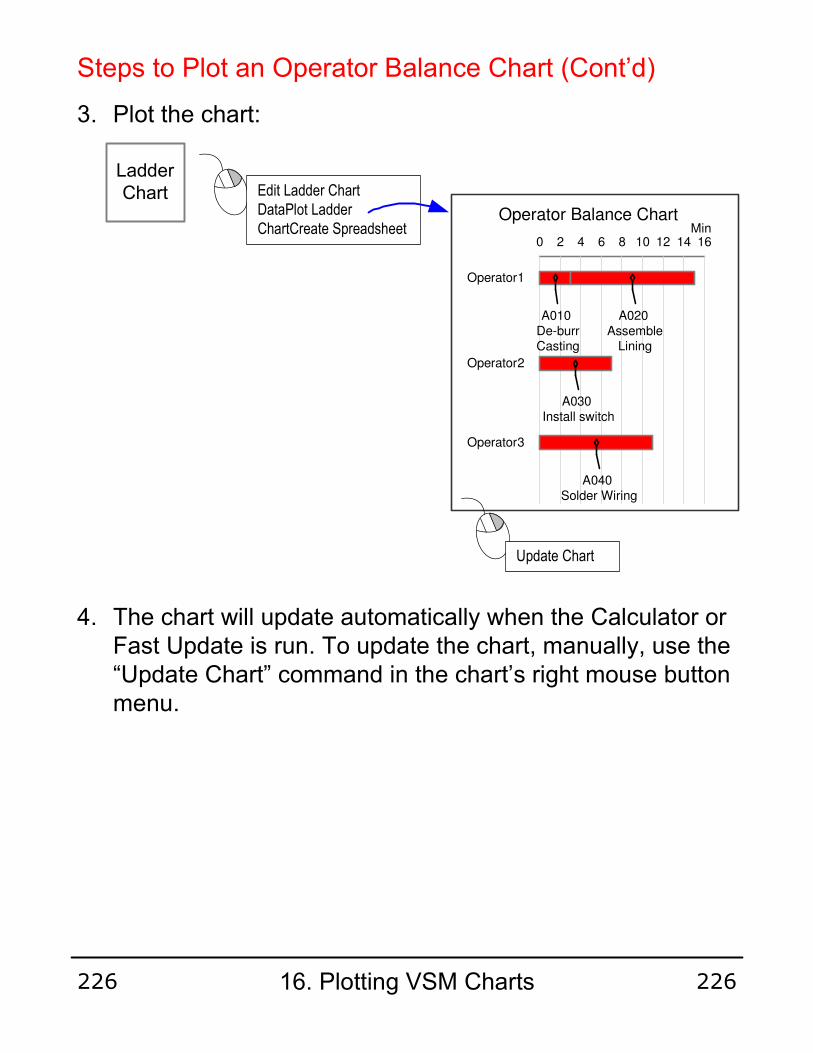
Steps to Plot an Operator Balance Chart (Cont’d)
Ladder Chart Edit Ladder Chart
DataPlot Ladder ChartCreate Spreadsheet
3. Plot the chart:
4. The chart will update automatically when the Calculator or Fast Update is run. To update the chart, manually, use the “Update Chart” command in the chart’s right mouse button menu.
Operator Balance ChartMin
0 2 4 6 8 10 12 14 16
A010
De-burr Casting
Operator1
A020
Assemble Lining
A030
Install switch
Operator2
A040
Solder Wiring
Operator3
Update Chart
16. Plotting VSM Charts226 226

XYChart
Ladder Chart
Filtering data that is plotted on a Chart
1XY Chart Path Filter
Ladder Chart 1 2
In the case of the ladder chart above, data is taken from any activity that is on EITHER path 1 or path 2. If no path filters are glued onto the chart boxes then data is taken from all activities.
The forms associated with each chart provide some filtering of the activities that contribute data to these charts primarily via the tag prefix, its number, and its color.
In addition, the XY Chart and the Ladder chart allow activity data to be used only from activities on given paths (as specified by gluing path locaters on those activities).
To filter in this way simply glue the path filter shape(s) onto the bottom right corner of the chart box as shown below
16. Plotting VSM Charts227 227
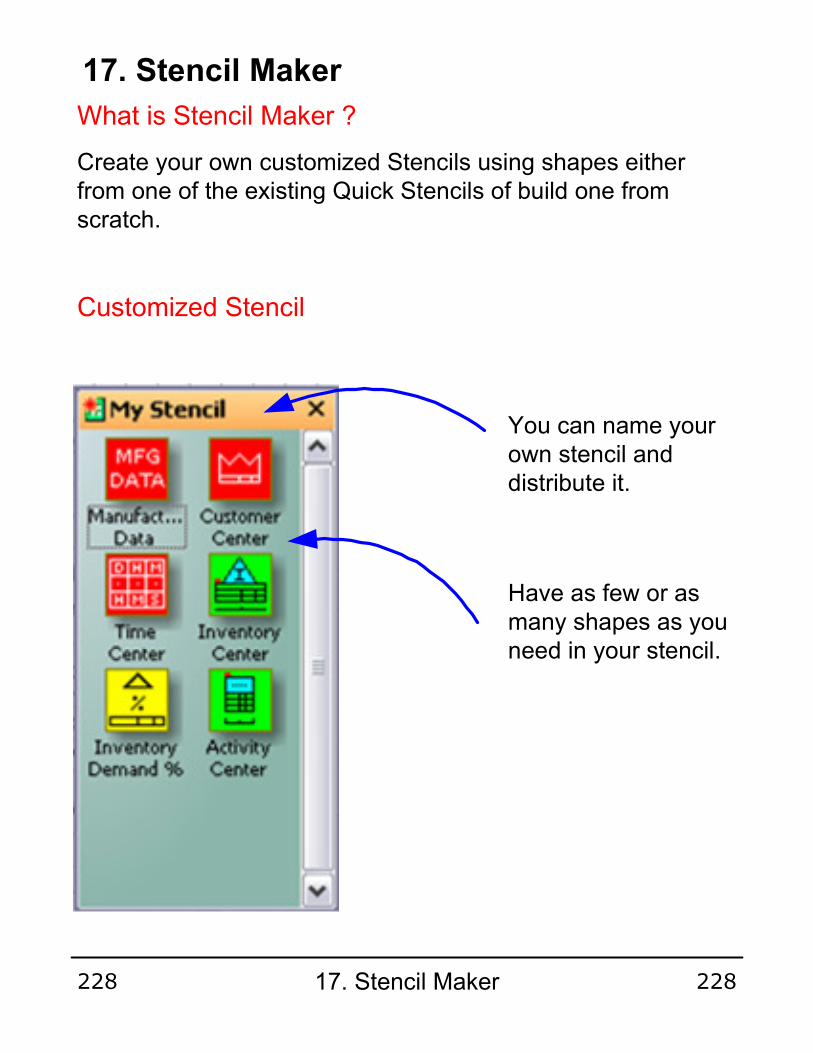
17. Stencil Maker
Create your own customized Stencils using shapes either from one of the existing Quick Stencils of build one from scratch.
What is Stencil Maker ?
Customized Stencil
You can name your own stencil and distribute it.
Have as few or as many shapes as you need in your stencil.
17. Stencil Maker228 228

Can My Stencil be used on existing maps ?
You can only use your stencil for completely NEW maps. The stencil relies on a standard set of names, units and eqn’s that old maps will not be compliant to.
Quick Maker Stencil
Open the Quick Maker Stencil from the File Menu:File – Shapes – Open Stencil (and navigating to: C:\Program Files\GumshoeKI\Visio2002\Setup\Solutions) and selecting QuickMaker.vss
Used to enclose and identify an entire macro shape
Comment for macro shape Help
Warnings and Tips on using the macro shape
17. Stencil Maker229 229
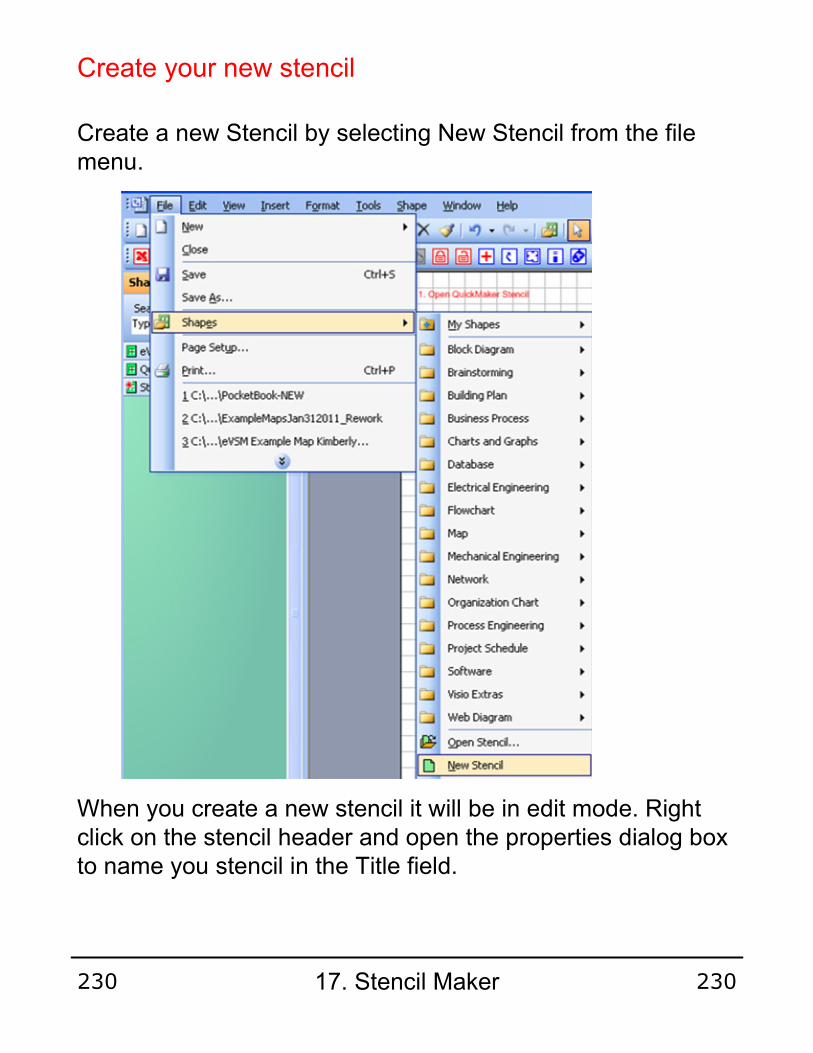
When you create a new stencil it will be in edit mode. Right click on the stencil header and open the properties dialog box to name you stencil in the Title field.
Create your new stencil
Create a new Stencil by selecting New Stencil from the file menu.
17. Stencil Maker230 230
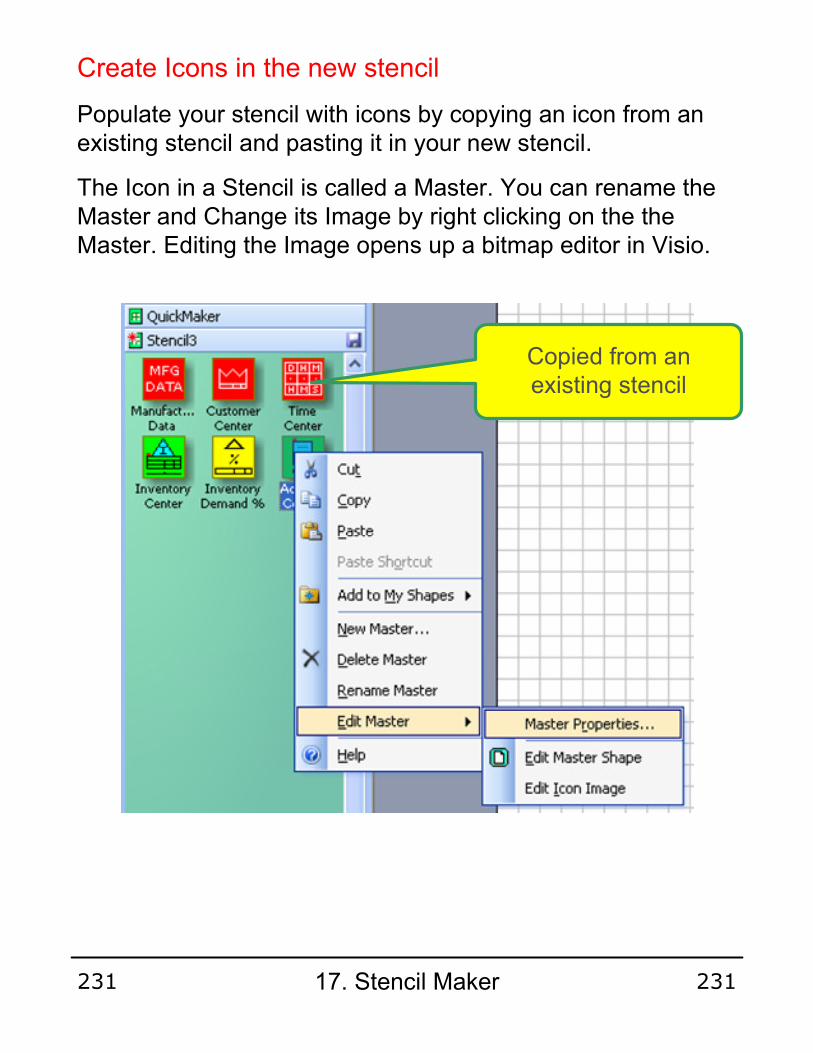
Create Icons in the new stencil
Populate your stencil with icons by copying an icon from an existing stencil and pasting it in your new stencil.
The Icon in a Stencil is called a Master. You can rename the Master and Change its Image by right clicking on the the Master. Editing the Image opens up a bitmap editor in Visio.
Copied from an existing stencil
17. Stencil Maker231 231

Design Page
The most important piece in Stencil creation will be the Design page. This is where you will create the shapes that go into your stencil. It is also where you will create help for your shapes. Any changes that need to made to a stencil should be done here and then regenerating the Stencil from the Design Page.
Design Page for My Stencil
There are two ways to create the shapes for your stencil: 1) By using shapes from one of the Quick Stencils (but you cannot mix shapes from different stencils), or 2) Using base eVSM to build all your shapes from scratch.
17. Stencil Maker232 232
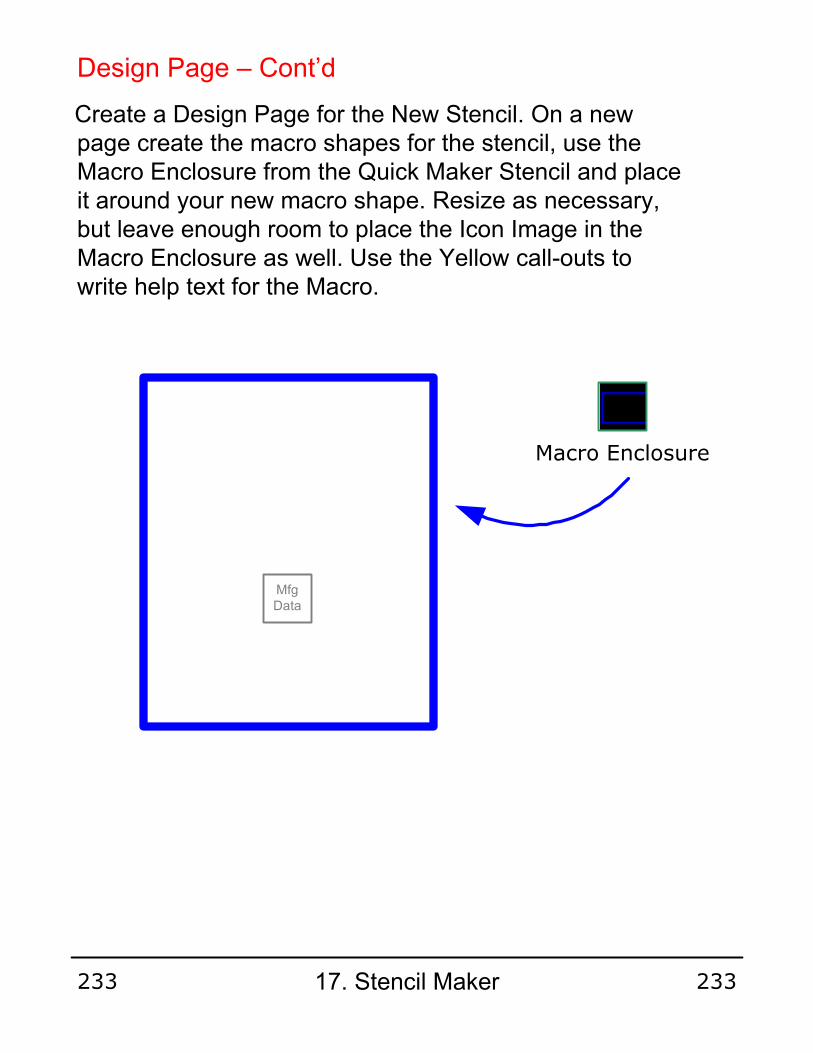
Design Page – Cont’d
Create a Design Page for the New Stencil. On a new page create the macro shapes for the stencil, use the Macro Enclosure from the Quick Maker Stencil and place it around your new macro shape. Resize as necessary, but leave enough room to place the Icon Image in the Macro Enclosure as well. Use the Yellow call-outs to write help text for the Macro.
Macro Enclosure
Mfg Data
17. Stencil Maker233 233
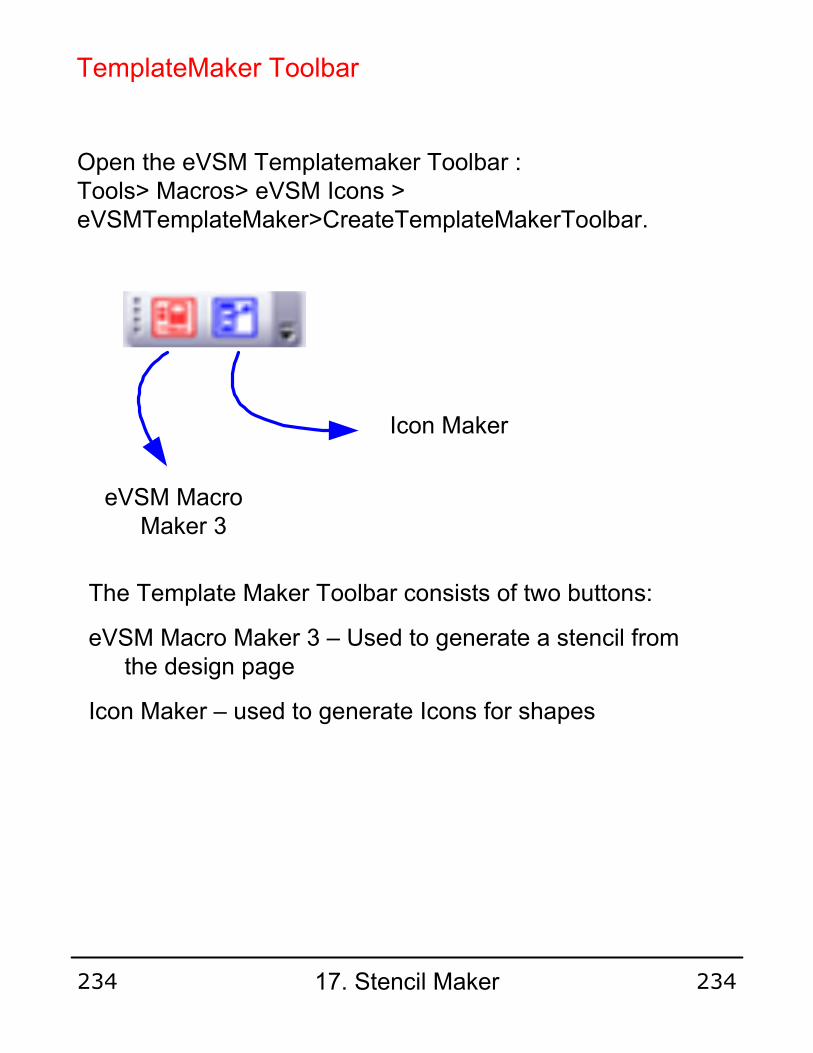
TemplateMaker Toolbar
Open the eVSM Templatemaker Toolbar : Tools> Macros> eVSM Icons > eVSMTemplateMaker>CreateTemplateMakerToolbar.
eVSM Macro Maker 3
Icon Maker
The Template Maker Toolbar consists of two buttons:
eVSM Macro Maker 3 – Used to generate a stencil from the design page
Icon Maker – used to generate Icons for shapes
17. Stencil Maker234 234
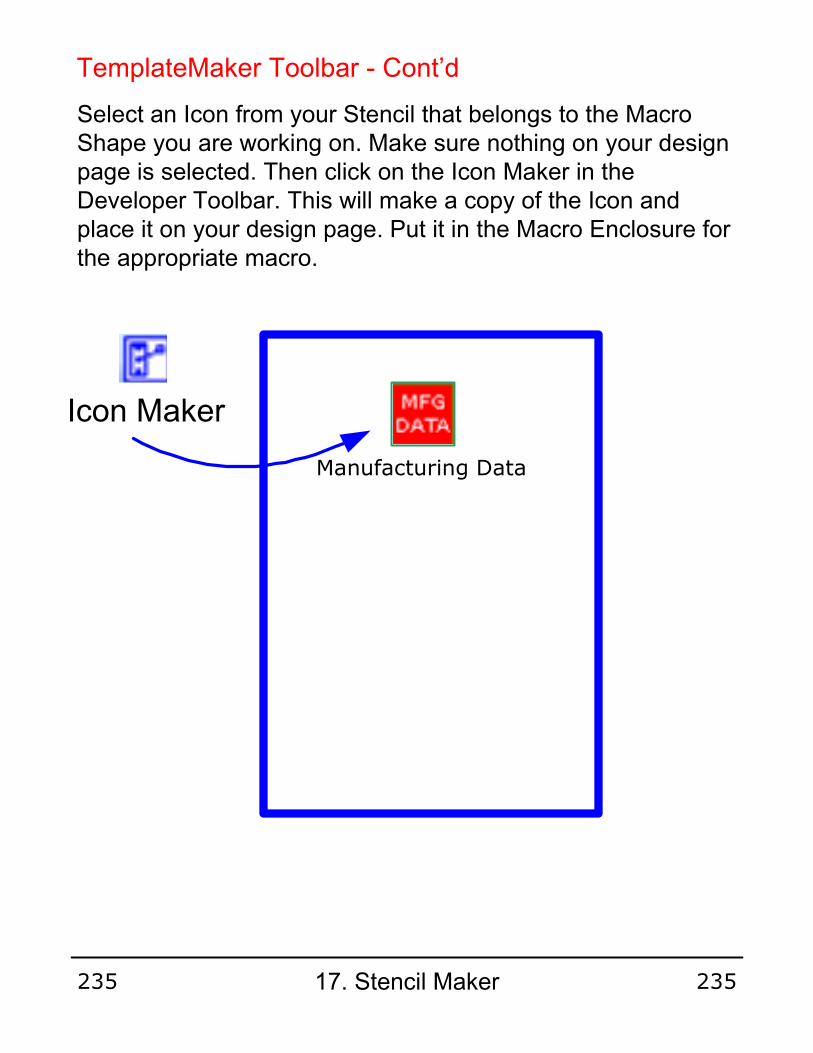
TemplateMaker Toolbar - Cont’d
Select an Icon from your Stencil that belongs to the Macro Shape you are working on. Make sure nothing on your design page is selected. Then click on the Icon Maker in the Developer Toolbar. This will make a copy of the Icon and place it on your design page. Put it in the Macro Enclosure for the appropriate macro.
Icon Maker
Manufacturing Data
17. Stencil Maker235 235

Generating your Stencil
eVSM Macro Maker 3
Once your design page is complete, simply select any one Icon in your new Stencil then click on the eVSM Macro Maker 3 Icon in the Developer Toolbar. You will be prompted that your are replacing (no. of masters) in the Stencil. Click ok and your masters in the Stencil will be replaced with the ones on your design page.
All changes to the Stencil MUST be made through the design page. This will ensure stability. You can now save the Stencil and deploy it by simply sending them the Stencil file (.vss).
17. Stencil Maker236 236

Creating Help for your shapes
Create contextual help for your shapes by using the Macro Comment call out from the Quick Maker stencil.
Macro Comment
When a user selects an Icon in the Stencil then Clicks the iQ button in the toolbar, an exact image of the Macro from the Design page is placed on the map with the help text that you included in it’s enclosure.
17. Stencil Maker237 237

Map Annotation with Kaizen Bursts & Clouds
Adding Attributes to Kaizen Shapes
Problems can be documented using Kaizen bursts
Additional attributes can be added to Kaizen Bursts and Clouds by selecting the shape with a right mouse click and picking the “View Custom Properties” menu.
Kaizen
Kaizen Cloud
Kaizen Starburst
Solutions can be suggested using Kaizen clouds
18. Managing Improvements
Export to ExcelView Custom Properties
Help Movies
Annotate Problems/Ideas for Kaizens
Create Model Copy for Editing
Problem
123
Solution
123
18. Managing Improvements238 238

The eVSM Kaizen Report toolbar button scans the map for all Kaizen shapes (Starbursts and Clouds) and exports custom properties associated with the shapes to two Excel spreadsheets (Pagename_Starbursts and Pagename_Clouds).
The standard custom property user interface in Visio allows Lean Practitioners or organizations to define their own custom properties for export.
This functionality allows export to Excel and via Excel to other products like Microsoft Project Manager. The function replaces the Visio-based Kaizen Table in earlier releases.
Note that the Kaizen Report export is unidirectional and a new report is generated every time overwriting any existing report.
Version 5.29 and later of eVSM include “Impact” and “Difficulty” custom properties that can be used to plot a Kaizen Impact Matrix
Cu...
Sequence 3
Problem DescriptionProblem
Owner Joe Bloggs
Generating Kaizen Reports
eVSM Kaizen Report
18. Managing Improvements239 239

Plotting a Kaizen Impact Matrix
Kaizen Impact Matrix
Kaizen Impact Matrix
Plot Kaizen Impact Matrix
The Kaizen impact matrix was introduced in eVSM V5.29 and uses the “Impact” (Impact On Value) and “Difficulty” (Difficulty of Implementation”) custom properties of kaizen burst and clouds to plot an impact matrix as shown on the next page. The goal of the matrix is to help select kaizens for implementation.
The mini-kaizens in the matrix copy the custom properties of the originals (map kaizens) so its useful to have the custom properties window (View > Custom Properties Window) open while selecting these shapes. They are numbered based on the ID’s of the Kaizens on the map (ID’s are circles glued to the top left of the kaizen shapes). A Right mouse click on any of the mini-kaizens allows for selection and highlighting of the parent map kaizen.
6
Highlight Kaizen
If map kaizens are modified than the Impact matrix can be updated by selecting it with a right mouse click and the command “Update Chart”.
18. Managing Improvements240 240
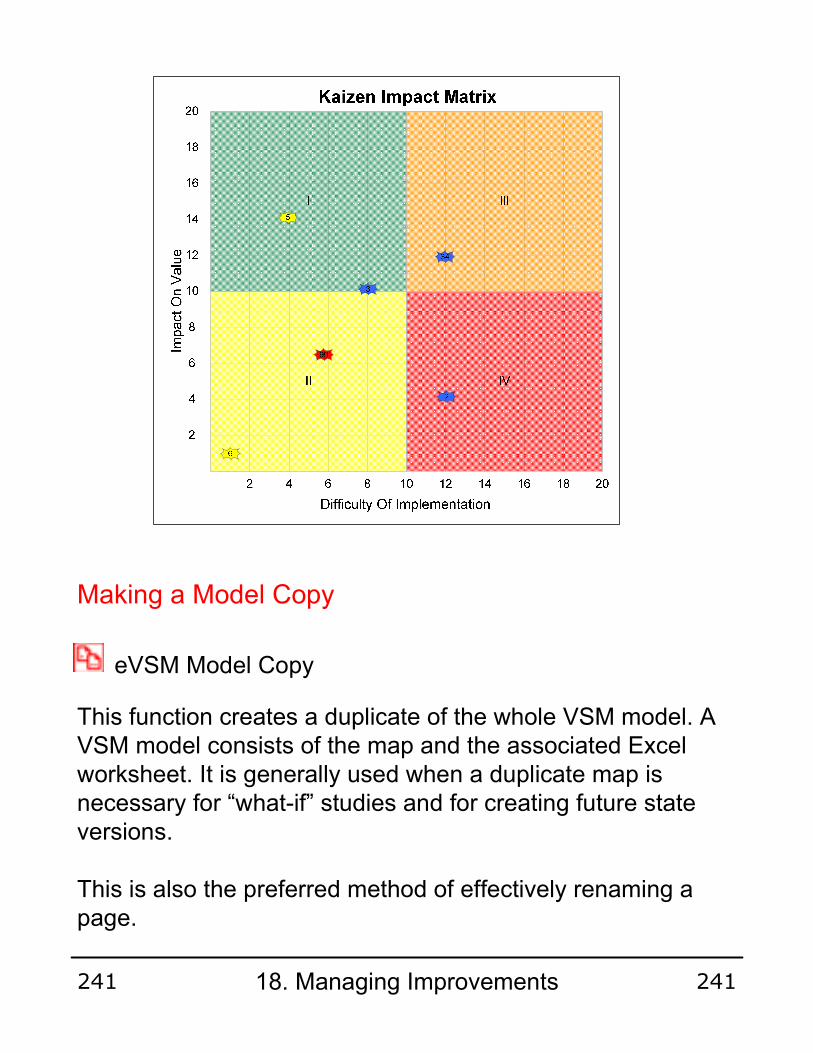
Making a Model Copy
This function creates a duplicate of the whole VSM model. A VSM model consists of the map and the associated Excel worksheet. It is generally used when a duplicate map is necessary for “what-if” studies and for creating future state versions.
This is also the preferred method of effectively renaming a page.
eVSM Model Copy
18. Managing Improvements241 241

Visio shapes can simply be selected, copied and then pasted into other Microsoft office applications like PowerPoint and Excel. Be sure to paste a picture using the Paste As… command. This will allow re-sizing of the pasted picture without requiring editing and font adjustments.
Copy and Paste into PowerPoint or Excel
Visio Viewer
Acrobat PDF
19. Sharing with eVSM
A free Visio Viewer is available for download at:
http://www.microsoft.com/downloads
Acrobat PDF allows capture of any size drawing in a single file, which can be viewed with the free Acrobat Reader, and is easily printable. On-screen viewing is good, it is searchable, and supports password security. The author must have the Acrobat Distiller software, the audience only need the free Acrobat Reader. Steps to convert an eVSM map to PDF:
1. Click the “File>Print…” menu.
2. Select Acrobat Distiller as your Printer, and click “OK”.
3. You will then be prompted for the PDF file name and the location to save the PDF file in.
19. Sharing with eVSM242 242
eVSM maps can be converted to web format which can be viewed in any web browser. The web format files can be uploaded to a web server or emailed.
Steps to convert to web format:
1. Click “File>Save as Web Page…”.
2. In the “Save As” dialog. Click, the “Publish…” button.
3. In the “Publish” dialog, click the “Format Options…” button, set format to “GIF”, and click “OK”.
4. To later view this in a web browser, just open the html file with the same name as your eVSM filename in a web browser.
5. The conversion to web format creates a collection of web files. All of these need to be included in any email transfers or upload to a web server.
6. To open the drawing in a browser, click the drawing_name.htm file.
Publish to Web
Convert to Bitmap
Common bitmap formats such as JPEG, GIF, and TIFF can be viewed in most browsers without any additional software. eVSM maps can be converted to these and other graphic formats from the “File>Save As…” menu. In the “Save As” dialog, click the “Save as type” pull-down and select the format.
19. Sharing with eVSM243 243

Visio allows drawings of any size. The drawings can then be printed on any size paper supported and available on the printer.
When the drawing size does not match the paper size, you can either print across several sheets, or shrink (or expand) the drawing to fit the paper by clicking “File>Page Setup…” and then checking the “Fit to 1 sheet” radio button.
Printing
19. Sharing with eVSM244 244
The “File>Print Preview” function can and should be used to assess the print output before committing the drawing to paper.
Print (Cont’d)
Printing Problems
The eVSM Software essentially generates a Visio file. The printing of the file is handled by standard Visio functionality. Problems printing from Visio could be due to Visio, the print driver, or the printer.
Here are some suggestions if you have problems printing from Visio:
Make sure you have the latest Visio Service Patch installed
Try copy/pasting your VSM to PowerPoint or Excel and then print from there
Convert your VSM to Acrobat PDF and then print the PDF file
19. Sharing with eVSM245 245

Toolbar Button Index
Communications Circle 153
eA3 Report 156
eVSM Autofix 140
eVSM AutoPath 128,112
eVSM AutoSeq 202
eVSM AutoTag 186
eVSM Calculator 213,190
eVSM Drill Down 142
eVSM Excel Check On/Off 187
eVSM Fast Update 190
eVSM Formula Wizard 206
eVSM Gadgets Check On/Off 163
eVSM Glue Check On/Off 10
eVSM Kaizen Report 239
eVSM Link Activities 139
eVSM Macro Maker 180
eVSM Manage Gadget Collections 164
eVSM Model Copy 241,191
Toolbar Button Index246 246
Toolbar Button Index (cont'd.)
eVSM Name and Unit Manager 193,173,133,29
eVSM Tag Path Locater Defaults 186,128,112
eVSM Tag Path Locator Defaults 185
eVSM Tag Sequence Check On/Off 201
eVSM Unlink Activities 139
eVSM Update Gadgets 163
eVSM v5 Migration 142
Quick eVSM 91,41
Spaghetti Diagram 149
Toolbar Button Index247 247

Icons Index
115,99,71,47,17
60,39,33Activity Assc Time
81,60,30Activity Center
33Activity Changeover
83Activity CT Range
61,37Activity Defects
83,82,61,33,32Activity Demand
87,83,61,33Activity Demand %
61,33Activity Downtime
83Activity Efficiency
62,34Activity NVA
34Activity OEE
37,36Activity Rolling Defects
89,83,62Activity Rolling Time
33Activity Scrap
34Activity Shortage
82,62,34Activity Stations
Icons Index248 248
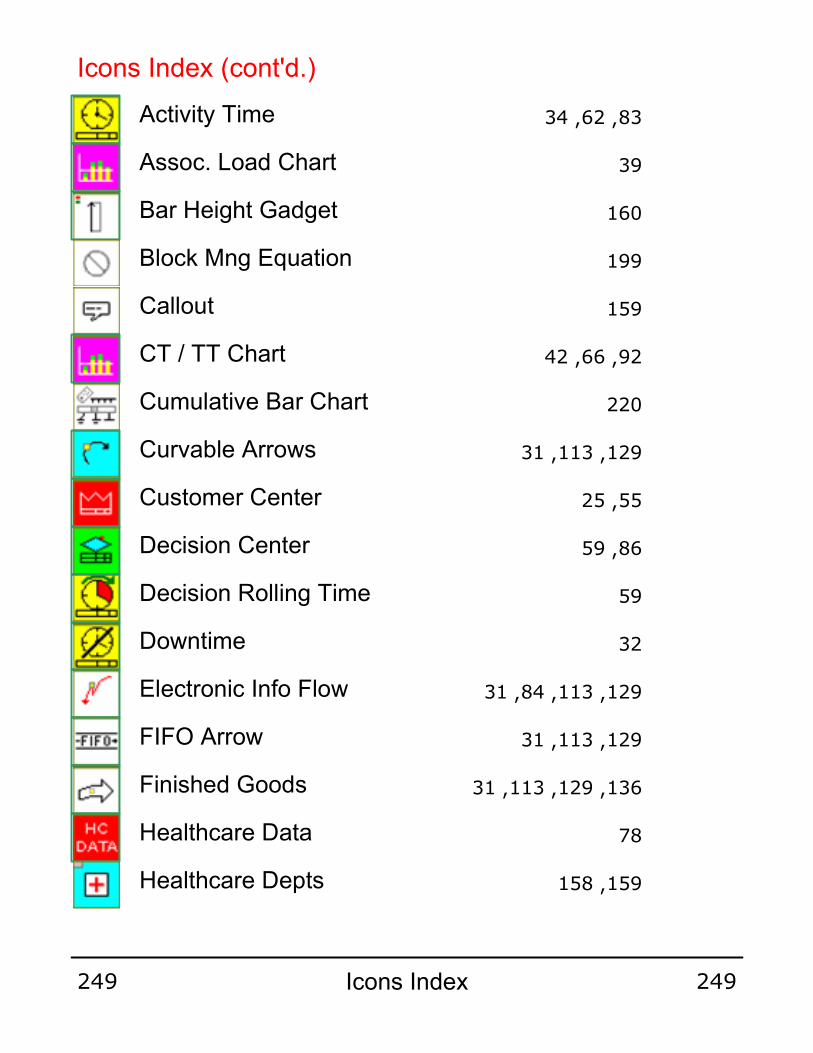
Icons Index (cont'd.)
83,62,34Activity Time
39Assoc. Load Chart
160Bar Height Gadget
199Block Mng Equation
159Callout
92,66,42CT / TT Chart
220Cumulative Bar Chart
129,113,31Curvable Arrows
55,25Customer Center
86,59Decision Center
59Decision Rolling Time
32Downtime
129,113,84,31Electronic Info Flow
129,113,31FIFO Arrow
136,129,113,31Finished Goods
78Healthcare Data
159,158Healthcare Depts
Icons Index249 249

Icon Index (Contd.)
159Healthcare Items
159,157Healthcare People
158High Roof Place
158Icon Of Place
27Inventory Center
28Inventory Demand
28Inventory Demand %
36,34Inventory Rolling Defects
135Inventory Shapes
27Inventory Value
238,159Kaizen Cloud
240Kaizen Impact Matrix
238,159Kaizen Starburst
143,96,68Key Creator
227,225,223Ladder Chart
93,67Lead Time Chart
134Long NVU
Icons Index250 250
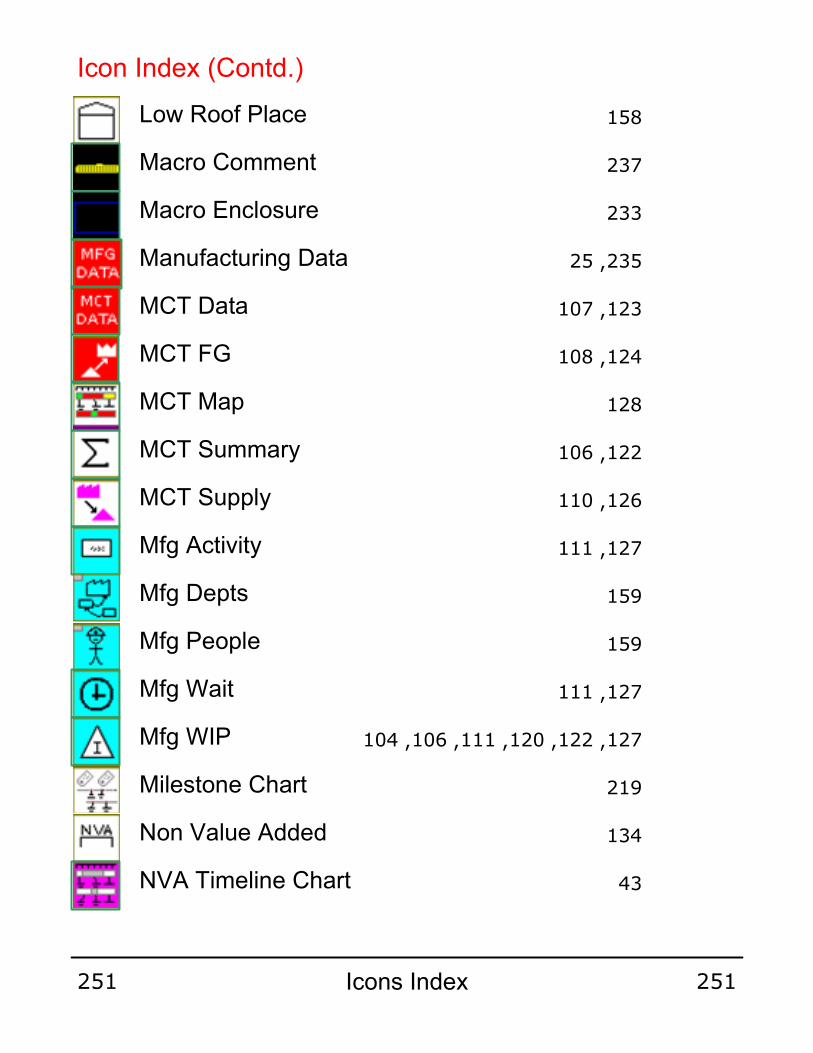
Icon Index (Contd.)
158Low Roof Place
237Macro Comment
233Macro Enclosure
235,25Manufacturing Data
123,107MCT Data
124,108MCT FG
128MCT Map
122,106MCT Summary
126,110MCT Supply
127,111Mfg Activity
159Mfg Depts
159Mfg People
127,111Mfg Wait
127,122,120,111,106,104Mfg WIP
219Milestone Chart
134Non Value Added
43NVA Timeline Chart
Icons Index251 251
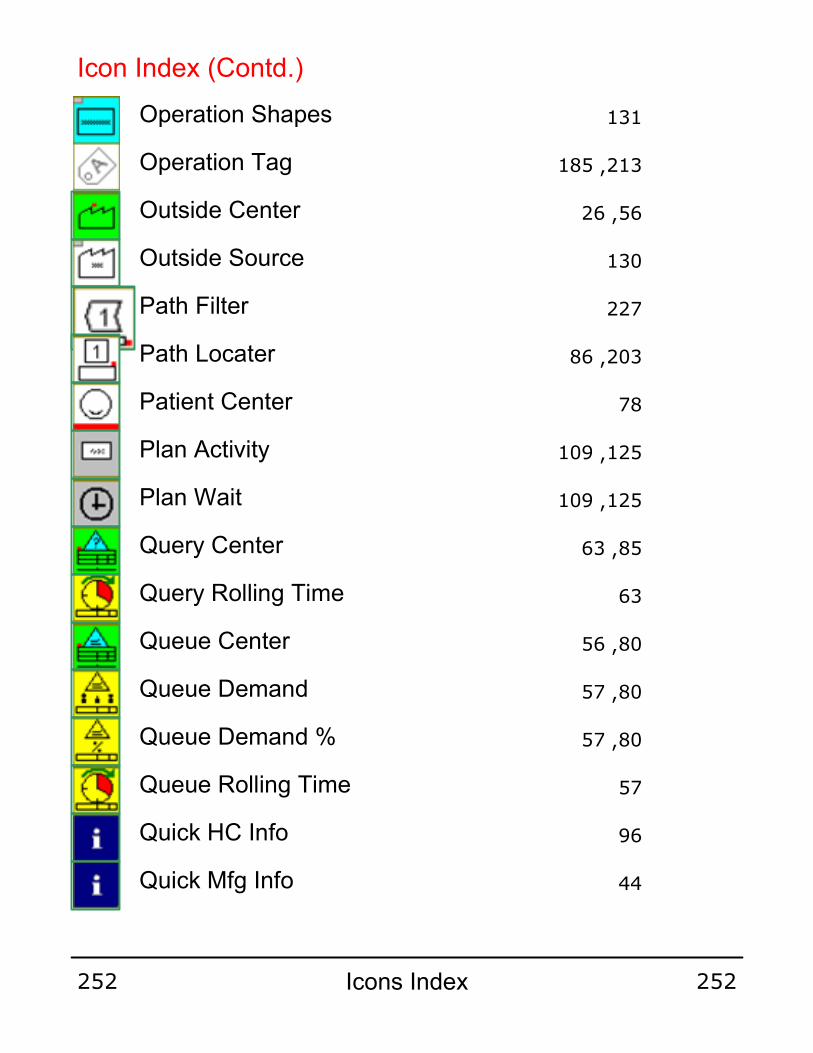
Icon Index (Contd.)
131Operation Shapes
213,185Operation Tag
56,26Outside Center
130Outside Source
227Path Filter
203,86Path Locater
78Patient Center
125,109Plan Activity
125,109Plan Wait
85,63Query Center
63Query Rolling Time
80,56Queue Center
80,57Queue Demand
80,57Queue Demand %
57Queue Rolling Time
96Quick HC Info
44Quick Mfg Info
Icons Index252 252

Icon Index (Contd.)
68Quick Svc Info
89Rolling Time
159Service Depts
159Service People
55Services Data
135Short NVU
110SM Activity
110SM Wait
149Spaghetti Place
149Spaghetti Scale
65,40Staff Summary
4Start eVSM
131,129,113,31Stepped Arrows
135Supermarket
212Swimlane
66Swimlane Frame
210Table
Icons Index253 253

Icon Index (Contd.)
201,89,84,37Tag Seq Arrow
123,107,78,55,25Time Center
91,88,65,54,41,24Time Summary
200Trace Value
90,64,52,35Transmit Center
64Transmit Rolling Time
159,137,136,84Transmit Shapes
90,76,35,22Transport Center
159,136Transport Shapes
137,29Units Converter
43VA / TT Chart
134Value Added
96,68Var Key Creator
79,58Wait Center
79Wait Range
36Wait Rolling Defects
58Wait Rolling Time
Icons Index254 254

Icon Index (Contd.)
112White/Gray Map
227,215XY Chart
Icons Index255 255
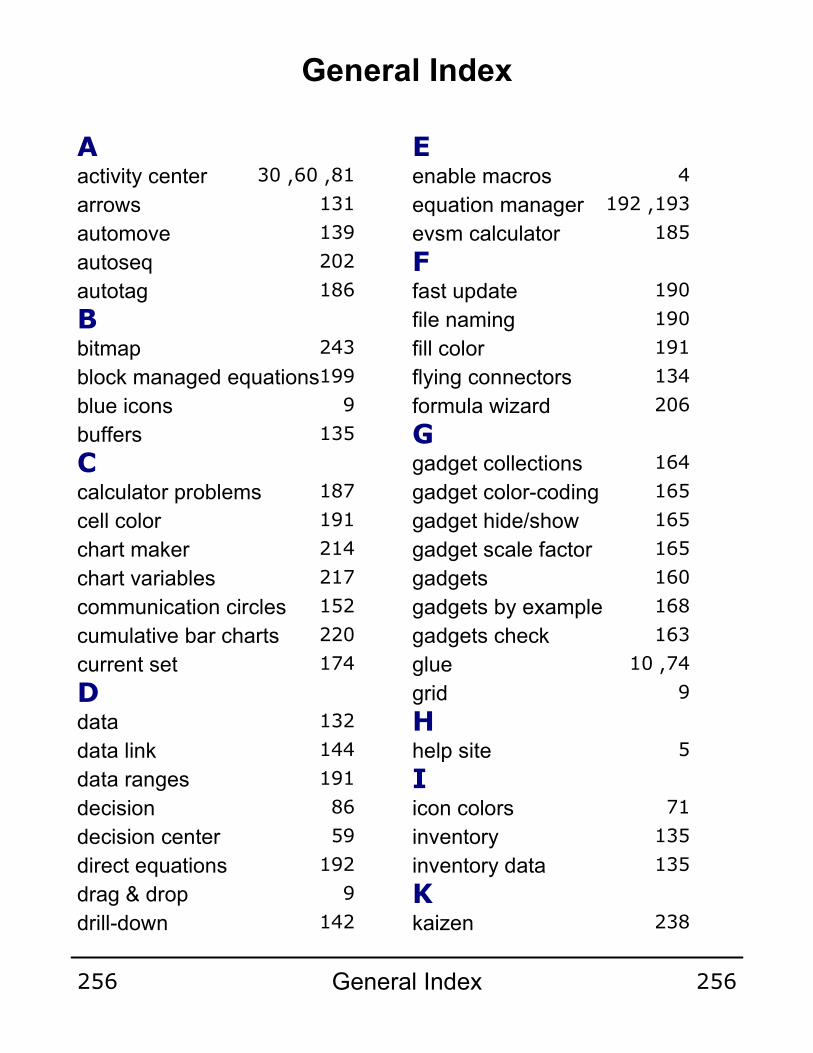
General Index
Aactivity center 81,60,30
arrows 131
automove 139
autoseq 202
autotag 186
Bbitmap 243
block managed equations199
blue icons 9
buffers 135
Ccalculator problems 187
cell color 191
chart maker 214
chart variables 217
communication circles 152
cumulative bar charts 220
current set 174
Ddata 132
data link 144
data ranges 191
decision 86
decision center 59
direct equations 192
drag & drop 9
drill-down 142
Eenable macros 4
equation manager 193,192
evsm calculator 185
Ffast update 190
file naming 190
fill color 191
flying connectors 134
formula wizard 206
Ggadget collections 164
gadget color-coding 165
gadget hide/show 165
gadget scale factor 165
gadgets 160
gadgets by example 168
gadgets check 163
glue 74,10
grid 9
Hhelp site 5
Iicon colors 71
inventory 135
inventory data 135
Kkaizen 238
General Index256 256

General Index (cont'd.)
kaizen cloud 159
kaizen impact matrix 240
kaizen starburst 159
key creator 143
Lladder charts 222
lean enterprise academy 6
lean enterprise institute 6
lean healthcare west 6
Mmacro maker 180
macro shapes 170
main stencil 72
maker 228
managed equations 192
managing improvements 238
migrate maps 142
milestone charts 218
model copy 241,191
multi-unit edit 138
Nname & unit sets 176
non value added 134
number format 191
numeric format 191
nva 134
Ooperation tag 185,76
operation tags 185
operator balance chart 225
outside center 56
Ppage resizing 8
pareto chart 214
path filter 227
path locater 203,24
pdf 242
people 157
pid 80,78
plot charts 214
plot xy charts 215
powerpoint 242
printing 244
printing problems 245
Qquery center 63
queue 135
queue center 56
quick evsm 70,46,16
quick hc 70
quick maker 229
quick mct 114
quick mctlite 98
quick stencil 73
Rresizing shapes 9
General Index257 257
General Index (Contd.)
rolling defects section 34
rolling time 83
rowmaker shapes 187
Ssecurity setting 4
snap 9
snap to grid 9
spaghetti diagram 148
spaghetti place 149
spaghetti report 148
spaghetti scale 149
standard names 170
standardization 170
starter maps 170
stencil 228,7
supermarkets 135
support 5
swim lane 212
Ttag seq arrow 201
tag sequence arrow 201
templatemaker toolbar 234
text editing 11
time summary 88
timeline ladder chart 223
toolbar 5
trace value 200
transmit 136
transport 136
Uunit converters 137
unit family 137
Vva 134
value added 134
visio pages 12
visio viewer 242
Wwait center 58
web 243
Xxy charts 214
Zzoom 13
General Index258 258

General Index (Contd.)
General Index259 259
eVSM Demonstration http://www.evsm.com/demo
Download Trial http://www.evsm.com/trial
Check for Latest Updates http://www.evsm.com/updates
eVSM On-line Help http://www.evsm.com/help
eVSM Installation Help http://www.evsm.com/install
eVSM Training http://www.evsm.com/training
Useful URL’s
13 November 2011
Transfer eVSM to new PC http://www.evsm.com/transfer


