46
(EW-201340) Secure Automated Microgrid Energy System December 2016 This document has been cleared for public release; Distribution Statement A

(EW-201340)
Secure Automated Microgrid Energy System December 2016
This document has been cleared for public release; Distribution Statement A

Page Intentionally Left Blank

This report was prepared under contract to the Department of Defense Environmental Security Technology Certification Program (ESTCP). The publication of this report does not indicate endorsement by the Department of Defense, nor should the contents be construed as reflecting the official policy or position of the Department of Defense. Reference herein to any specific commercial product, process, or service by trade name, trademark, manufacturer, or otherwise, does not necessarily constitute or imply its endorsement, recommendation, or favoring by the Department of Defense.

Page Intentionally Left Blank

i
COST & PERFORMANCE REPORT Project: EW-201340
TABLE OF CONTENTS
Page
EXECUTIVE SUMMARY ............................................................................................................ 1
1.0 MICROGRID CLUSTER INTRODUCTION....................................................................... 1 1.1 BACKGROUND .......................................................................................................... 1 1.2 OBJECTIVES OF THE DEMONSTRATION ............................................................. 2 1.3 REGULATORY DRIVERS ......................................................................................... 4
1.3.1 Executive Order 13514 of October 2009...................................................................... 4 1.3.2 Executive Order 13423 of January 2007 ...................................................................... 4 1.3.3 SECNAV Instruction 4101.3 ........................................................................................ 4 1.3.4 Department of the Navy Smart Power Partnership Initiative (SPPI) ........................... 4
2.0 TECHNOLOGY DESCRIPTION ......................................................................................... 5 2.1 TECHNOLOGY/METHODOLOGY OVERVIEW ..................................................... 5 2.2 ADVANTAGES AND LIMITATIONS OF THE TECHNOLOGY ............................ 7
3.0 PERFORMANCE OBJECTIVES ......................................................................................... 9
4.0 SITE/FACILITY DESCRIPTION ....................................................................................... 11 4.1 SITE/FACILITY LOCATION AND OPERATIONS ................................................ 11
4.1.1 Naval Base San Diego, San Diego, CA ...................................................................... 11 4.1.2 Naval Base Coronado, San Diego, CA ....................................................................... 12 4.1.3 Naval Base Point Loma, San Diego, CA .................................................................... 12
4.2 SITE/FACILITY IMPLEMENTATION CRITERIA ................................................. 13
5.0 TEST DESIGN .................................................................................................................... 15 5.1 CONCEPTUAL TEST/EXPERIMENTAL DESIGN ................................................ 15 5.2 BASELINE CHARACTERIZATION ........................................................................ 15 5.3 DESIGN AND LAYOUT OF TECHNOLOGY COMPONENTS ............................ 16
5.3.1 Iconics ........................................................................................................................ 16 5.3.2 Johnson Controls (Niagara) ........................................................................................ 16 5.3.3 Telvent ........................................................................................................................ 16 5.3.4 Colorado State University Power House .................................................................... 16
5.4 OPERATIONAL TESTING ....................................................................................... 17 5.5 SAMPLING METHODS AND PROTOCOL ............................................................ 20 5.6 SAMPLING RESULTS .............................................................................................. 21
5.6.1 Naval Medical Center ................................................................................................. 21 5.6.2 Naval Base Point Loma .............................................................................................. 21 5.6.3 Naval Base Coronado ................................................................................................. 21

TABLE OF CONTENTS (Continued)
Page
ii
6.0 PERFORMANCE ASSESSMENT ..................................................................................... 23 6.1 SCENARIO 1: ............................................................................................................ 23 6.2 SCENARIO 2: ............................................................................................................ 23 6.3 SCENARIO 3: ............................................................................................................ 23 6.4 SCENARIO 4: ............................................................................................................ 23 6.5 SCENARIO 5: ............................................................................................................ 24 6.6 SCENARIO 6: ............................................................................................................ 24
7.0 COST ASSESSMENT ......................................................................................................... 25 7.1 COST MODEL ........................................................................................................... 26 7.2 COST DRIVERS ........................................................................................................ 26 7.3 COST ANALYSIS AND COMPARISON ................................................................. 27
8.0 IMPLEMENTATION ISSUES ........................................................................................... 29 8.1 EQUIPMENT CALIBRATION ................................................................................. 29 8.2 CONCLUSION ........................................................................................................... 29
APPENDIX A POINTS OF CONTACT.................................................................................. A-1

iii
LIST OF FIGURES
Page
Figure 1. Components of Microgrid Mission Surety ...................................................................... 2
Figure 2. NAVFAC ICS Support Network ..................................................................................... 6
Figure 3. NAVFAC SW Server Room - Building 121 ................................................................... 6
Figure 4. Aerial View of the Three Naval Bases .......................................................................... 11
Figure 5. Naval Base San Diego, Aerial View ............................................................................. 12
Figure 6. Naval Base Coronado, Aerial View .............................................................................. 12
Figure 7. Naval Base Point Loma, Aerial View ........................................................................... 13
Figure 8. Power House Control Room .......................................................................................... 16
Figure 9. Power House Components ............................................................................................ 17
Figure 10. Power Flow Study Based on Power Scenarios ............................................................ 18
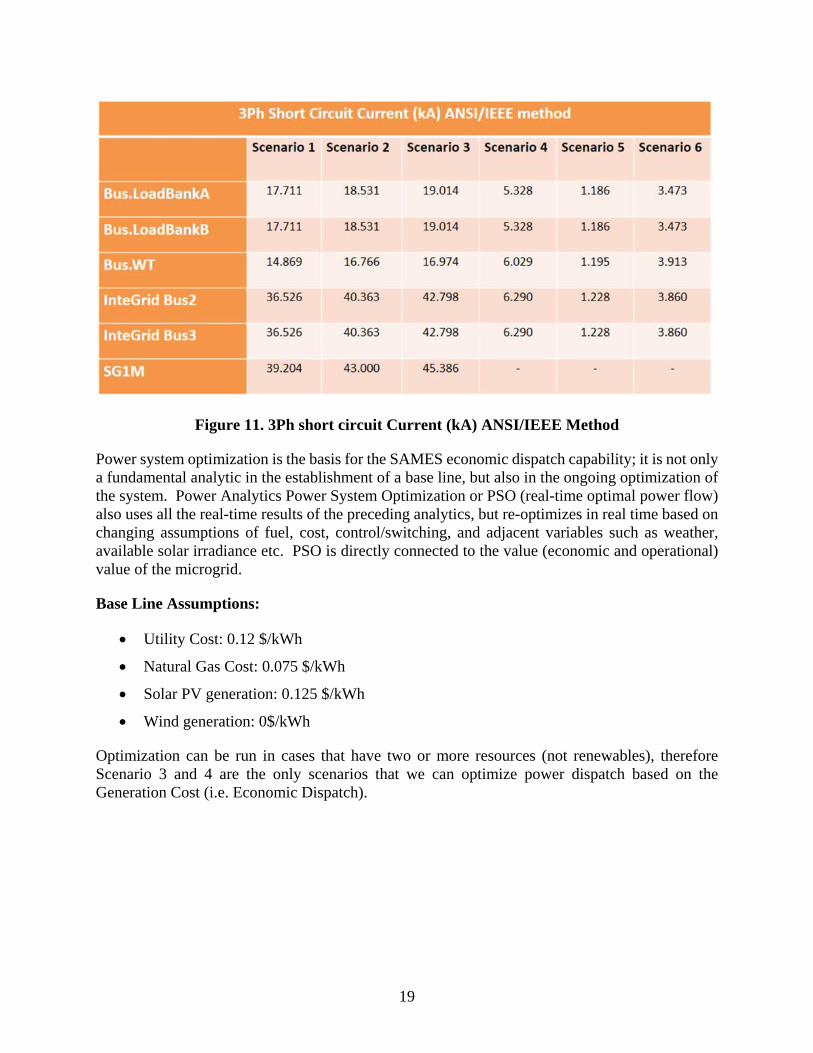
Figure 11. 3Ph short circuit Current (kA) ANSI/IEEE Method ................................................... 19
Figure 12. Optimized for Most Control, Most Savings ................................................................ 20

iv
LIST OF TABLES
Page
Table 1. Performance Objectives .................................................................................................... 9
Table 2. Use Case Results ............................................................................................................. 10
Table 3. Cost Assessment ............................................................................................................. 25
Table 4. Cost Comparison ............................................................................................................. 26

v
ACRONYMS AND ABBREVIATIONS
ATO Authority To Operate ATS Automatic Transfer Switches BMS Business Management System CAISO California Independent Service Operator COTS Commercial-Off-The-Shelf Software DCS Distributed Control System DER Distributed Energy Resources DIACAP Defense Information Assurance Certification and Accreditation Process DoD Department of Defense DoDI Department of Defense Instruction DOE Department of Energy DoN Department of Navy DR Demand Response ESTCP Environmental Security Technology Certification Program FAA Federal Aviation Administration ISO Independent Service Operator kVAR Kilovolt-Ampere Reactive MPMS Microgrid Power Management System NAVFAC SW Naval Facilities Engineering Command Southwest NBC Naval Base Coronado NBPL Naval Base Point Loma NBSD Naval Base San Diego NMC Naval Medical Center O&M Operations and Maintenance PSO Power System Optimization PV Photovoltaic RAID Redundant Array of Independent Disks RBAC Role-based Access Control RFI Request for Information ROI Return on Investment

vi
SAMES Secure Automated Microgrid Energy System SCADA Supervisor Control And Data Acquisition Systems SCED Security Constrained Economic Dispatch SDG&E San Diego Gas and Electric SOA Service Oriented Architecture SPPI Smart Power Purchase Initiative TOPR Task Order Proposal Request UEOC Utility and Energy Operations Center UCSD University of California San Diego VPP Virtual Power Plant

vii
ACKNOWLEDGEMENTS
The Secure Automated Microgrid Energy System (SAMES) project would not have been possible without the help of the team at Naval Facilities Engineering Command (NAVFAC) South West (SW), the support of the Environmental Security Technology Certification Program (ESTCP) Committee and the team members, Spirae, Conner Networks, OSI Soft, and Viridity Energy.
The SAMES team wants to thank Stephen C. Knapp (PE, Executive Director, Power Analytics), Melissa Wiel (Senior Data Scientist), John Arterberry (Program Manager), N. Taylor Brockman (Chief Technology Officer), Sean McGovern (North Carolina State University Intern), Dr. Laura Baker (NAVFAC), Dr. Vahid Salehi (Senior Power Engineer), Oliver Pacific (CTO, Spirae) and Joan Ward (Markets & Financial Consultant).

viii
Page Intentionally Left Blank

ES-1
EXECUTIVE SUMMARY
Local operational control over the production of energy is a priority throughout both military and civilian agencies. This control can be accomplished through the use of renewable energy generation organized within a microgrid. The single driving emerging technology today, at the core of the overall trend worldwide, is the development of distributed generation and renewable generation. Distributed generation, in the form of emergency standby generation, is an integral part of the current military war-readiness mission. The ability to incorporate existing generation, both in the form of emergency standby generation and other forms of renewable generation, including, but not limited to, energy storage, comprise one side of the triad that is the integrated Microgrid (see Figure 1 below). Load management is another side of the triad, and the ability to manage and optimize the system for mission surety is the third side of the triad and the goal of the integrated resource Microgrid.
The Secure Automated Microgrid Energy System (SAMES) demonstration was split between two locations to pre-stage the software and demonstrate control and optimization in an operational system.
A. All aspects associated with the three microgrid circuits on the bases in San Diego; including scenario analysis based on data acquired during the operational phases in San Diego, augmented with relevant time series data for weather.
B. The parallel (mirrored) effort at Colorado State University Power House Integrid Lab.
To the best of the SAMES team's knowledge, this secure microgrid project is the first proposed cluster of microgrids ever attempted. The “cluster” concept is specifically related to the integration of data, dashboards, and procedures from a designated location or any authorized location on the secure network. The cluster concept was possible, in part, because of an existing secure fiber optic network covering all three bases. The application for wheeling of power was not proposed, nor practical, given the time constraints of the Environmental Security Technology Certification Program (ESTCP) process. Additional factors considered in this decision were the cost and intrusive nature that would require reconfiguring circuits to wheel power. Wheeling is defined as the transportation of electric energy (megawatt-hours) from within an electrical grid to an electrical load outside the grid boundaries. Two types of wheeling are: 1) a wheel-through, where the electrical power generation and the load are both outside the boundaries of the transmission system, and 2) a wheel-out, where the generation resource is inside the boundaries of the transmission system but the load is outside.
The system design was also heavily dependent on the creation and use of a very detailed power model, created off line, but implemented in a secure real-time environment. Critical power analysis, such as security constrained load flows, short circuit and real-time arc flash, were also key elements of the approach that have never been previously attempted. The fundamental value of the power system is, in fact, derived from real-time power modeling to determine what is possible, how to continually optimize the system and how to integrate the inherent value of a real-time power model into the Operations and Maintenance (O&M) of base operations.

ES-2
To develop the solutions and demonstrate the value of the fundamental concepts of a microgrid, Power Analytics and its partners created a comprehensive shadow site at Colorado State University (CSU) Power House Integrid Lab to demonstrate the value of real-time power modeling, advanced O&M operations, and the economic value of grid connected/ islanded operation, without the risks associated to real-time live base operations. The mirrored site at CSU Power House Integrid Lab was in effect, a complete separate installation, including the development of new power models for the University, analysis, and real-time capability.
Figure 1. Components of Microgrid Mission Surety
The benefits conveyed in the study’s approach include increasing situational awareness, simulation and training, reduced energy cost, and integration of renewable forms of generation into the overall system.
The SAMES proposal pioneered this approach across three geographically-disperse locations (a cluster) that are interconnected via a secure communications system. The SAMES strategy and methodology was to utilize as much of the existing systems and networks as applicable to minimize the cost and minimize the disruption to base operations. A key to the demonstration was the creation of a secondary (mirrored) site at the Power House Integrid Lab at Colorado State University which was used to demonstrate the control requirements without impacting the base operations. This secondary site which also served as the “hardware in the loop” testing site is incorporated into this final report.

1
1.0 MICROGRID CLUSTER INTRODUCTION
1.1 BACKGROUND
The Department of Defense (DoD) goal of improving energy security while reducing cost has been an ongoing mission. In 2012, the Department of the Navy (DoN), through its Smart Power Partnership Initiative (SPPI), looked to create a pilot regional smartgrid in San Diego, California. SPPI goals were to enhance energy security, reduce costs, integrate renewable power, and export the regional smartgrid concept to other regions. As noted by SPPI, military bases, which have a high power demand or a high need for uninterrupted power, are ideal candidates for microgrids. However, because of the hightened awareness respective to cyber security and operational risks, DoD had not fully realized the potential value of its electrical infrastructure. In SAMES, we were able to demonstrate that a clustered microgrid can offer significant benefits and, in the process, identify areas of focus and challenges to address going forward. SAMES integrates state-of-the-art technologies to deliver new power management capability for microgrid clusters. The targeted cluster comprises circuits at Naval Bases San Diego, Coronado, and Point Loma to represent small microgrids. While clustering microgrids is a new concept, virtual aggregation of the bases to optimize generation and participate in the power market is both practical and possible. The concept, once proven and refined, can be applied to larger geographic areas and more microgrids without compromising the unique needs and missions of the individual bases.
In the SAMES technical approach, the initial software application is Power Analytics’ Paladin suite. Paladin suite lays the foundation for SAMES and is the source of the real-time dynamic microgrid network model. Paladin monitors and manages energy and power as a network to improve system reliability and availability. This microgrid network includes all loads, generation, storage, devices, and switches. The Paladin software provides high end power analytics (Power Flow, Voltage Stability, Energy Security, and Reliability Dispatch) and on-line simulations for “what if” situations. Its core functions are:
• Paladin® DesignBase™ A modeling platform to plan, design, model, analyze, and certify the behavior of complex electrical distribution systems. The computer-aided design-based program will model the base microgrids down to the end use power devices. Over 50+ analysis modules are used to create a comprehensive view of the SAMES electrical infrastructure.
• Paladin® Microgrid™ Power Management System (MPMS) A microgrid power management system that provides management, monitoring, and compliance reporting.

2
In SAMES, it combines information on generators, storage, loads, power quality, utilization and capacity in real-time to allow base operators to optimize their electrical infrastructure, and sell excess capacity. Paladin SPMSTM manages all the steps to reliably transfer onto or off a utility grid as desired.
• Paladin® BlackBoard™ A virtual environment which provides a mirror image of microgrid real time operations for use in planning and risk management. Changes to processes, procedures, hardware, or maintenance activities will be simulated and evaluated before they are implemented. Microgrid simulations will be saved as cases for future study, replay, or review.
The next component in the SAMES solution is Viridity Energy’s VPower™ software. It uses information from distributed resources, energy storage systems, fuels, load and generator forecasts, and controllable loads to develop schedules that have maximum economic value while still meeting an organization’s power availability objectives.
Underlying the SAMES technology is OSIsoft’s PI System®. SAMES will use the PI System to provide a data infrastructure for archiving time-series and relational data. The PI System is designed for mission critical applications. The information is archived as collected and is available for instant access by other applications, for use in other analytics, and for other third-party uses. The SAMES Utility and Utility and Energy Operations Center (UEOC) solution uses the individual technology capabilities from each team member to create a clustered solution. The regional control center will have access to the data from each of the individual microgrids, market data, and forecast information for each base, and will be able to view all the individual base optimization solutions. With this information, the UEOC can determine if it wants to enhance its commercial and energy security value by applying optimizations across the bases. Examples of cross cutting optimizations are:
1. Buying and selling of power from/to the market for each of the bases to minimize energy cost holistically
2. Optimizing Demand Management across the bases for maximum energy reduction to the utility during emergencies
1.2 OBJECTIVES OF THE DEMONSTRATION
The focus of the project is the three interconnected locations, based on existing circuits selected by the Naval Facilities Engineering Command South West (NAVFAC SW), and using existing communications infrastructure (secure fiber optic), existing Supervisor Control and Data Access (SCADA) system (Telvent), existing building management system (Johnson Controls Metasys), and existing metering. One controllable SCADA system for the low voltage system was not integrated (Iconics) because of cyber security concerns, but data was used from the system for the development of scenarios for the site. The objectives of the demonstration were:

3
• Creating a centralized microgrid cluster for monitoring and control of power generation and consumption for the three noncontiguous naval bases: San Diego, Coronado, and Point Loma (see Cover Page);
• Providing comprehensive, real-time situational awareness so that base command and operations can manage power as they manage other critical aspects of their missions. Situational awareness included the creation of three detailed power models for the selected circuits;
• Obtaining existing power model(s), unifying the models and integrating the models into Paladin DesignBase (detailed discussion in SECNAV Instruction 4101.3);
• Using information from the real-time cluster monitoring to optimize the use of assets (generation and load) and to create a baseline power model for the three bases updating with real-time power flows;
• Demonstrating, through market participant simulations at the Colorado State University Power House Integrid Lab, the technology and processes needed to participate in the commercial (wholesale) electric market, including workable communication protocols between the microgrid, the utility, and the Independent System Operator (ISO);
• Developing an energy security model, for validating clustered microgrids. Power Analytics provided a detailed Request for Information (RFI) of the Navy ICS based on the SAMES architecture;
• Integrating energy management functions on a cyber-secure platform to meet current Navy security standards, and be adaptable and scalable for future requirements; and,
• Assessing the challenges to create a technology roadmap for rapid global implementation of clustered military microgrids: − Leveraging technology to maximize the benefit of existing equipment and, − Creating a flexible, scalable solution with alternative energy sources and energy
storage.
The SAMES project was able to directionally show how adopting and deploying energy efficient technologies and processes satisfied the aforementioned objectives. The innovations of this project increased the reliability of the existing electrical infrastructure by detecting potential failure points, thus increasing situational awareness by base personnel. The development of the baseline power model for each of the sites was a critical first step. The power models were developed based on existing power engineering data used for recent arc flash studies, and/or other related reports, made available to Power Analytics from NAVFAC SW (e.g., protective device coordination and short circuit studies).
Utilizing the results from the interim analyses, the SAMES power model accurately determined if existing data/information was up to date. The SAMES project utilized available time series data from base facilities and real-time sources. Employing the power model, the SAMES team demonstrated how renewable energy sources can be easily integrated into an existing base infrastructure. The microgrid management analytics of SAMES allows the bases to island from the local utility and/or export power back to the utility when the bases produced a surplus energy source. The physical testing (simulations) for these capabilities was demonstrated at the Colorado State University Power House Integrid Lab in Fort Collins (Mirrored Site).

4
In addition, the SAMES enterprise system provides the Navy command structure the visibility over their power systems assets as they have over other aspects of their operational missions.
1.3 REGULATORY DRIVERS
1.3.1 Executive Order 13514 of October 2009
This Executive Order mandates that federal agencies increase their energy efficiency and reduce greenhouse gas emissions. Specific goals include: increasing the use of renewable energy sources, developing and implementing innovative policies and practices to reduce greenhouse gas emissions, and increasing the effectiveness of local planning for locally generated renewable energy.
1.3.2 Executive Order 13423 of January 2007
This Executive Order mandates that federal agencies conduct their energy-related activities in an environmentally, economically and fiscally sound, integrated, efficient, and sustainable manner. It also requires that agencies implement renewable energy generation projects on their property, sustainable practices for energy efficiency and greenhouse gas emissions avoidance or reduction, and renewable energy sources.
1.3.3 SECNAV Instruction 4101.3
This Secretary of the Navy Instruction mandates the DoN to effectively manage energy consumption and lead in energy innovation. The foundation of SAMES is a key facilitator to the ability to integrate existing resources to the greatest extent possible for reliable, resilient, and redundant energy sources for critical assets. The Instruction notes that naval force success will depend greatly on the ability to make use of renewable and alternative energy sources, and requires installations to mitigate the risks posed from vulnerable energy supply systems by adopting and deploying energy efficient technologies and processes. The bases must reduce vulnerabilities to the electric grid by lowering their energy dependence and integrating security technologies which enable greater control of distribution.
1.3.4 Department of the Navy Smart Power Partnership Initiative (SPPI)
This initiative was intended to demonstrate the advantages of grouping geographically proximate DoN installations in the San Diego area into regional smart grids that can share power and respond to local distribution and transmission needs. Each regional grid should have mutually beneficial “power partnerships” with external stakeholders such as local utility companies, electricity marketers, regional transmission owners and operators, and federal and state utility regulators.

5
2.0 TECHNOLOGY DESCRIPTION
2.1 TECHNOLOGY/METHODOLOGY OVERVIEW
The Power Analytics, Secure Automated Microgrid Energy System (SAMES), was intended to support the SPPI objectives by creating a cluster of microgrids across Naval Bases San Diego, Coronado, and Point Loma. This concept of a cluster of microgrids is currently of great interest to other stakeholders in civilian and military planning. A cluster can build partnerships with the local utility, such as San Diego Gas & Electric (SDG&E), and regional energy marketers to share power, respond to transmission and distribution needs, and participate in the growing energy markets.
Power Analytics team is currently building upon this concept in wholesale and retail markets as a registered market participant in the North American energy markets. SAMES demonstrates that these changes can be made without compromising system security and while increasing system reliability and energy surety. At the conclusion of this demonstration, NAVFAC SW will have a wealth of knowledge that directly translated to Task Order Proposal Request (TOPR) CT 16-1297, Navy Enterprise Smart Grid Solution Naval Facilities Engineering Command (NAVFAC) / Public Works (PW).
The SAMES approach was based on technologies being demonstrated at the University of California San Diego (UCSD) microgrid, the Federal Aviation Administration (FAA), and several mission critical data centers. The three Navy bases were linked via an existing fiber optic network at an enterprise-level command and control system through the existing UEOC at Naval Base San Diego. Within SAMES, as shown in Figure 2 and Figure 3 below, Power Analytics provided the overall real-time control and reliability management of the microgrid. Viridity Energy provided real-time demand management, energy asset optimization, and load management. Spirae provided the real-time control (Colorado State University Power House Integrid Lab mirrored site only). OSIsoft provided real-time data historian from the existing building management system (Johnson Controls Metasys), medium voltage SCADA system (Telvent SCADA) and supported smart meters. The security architecture incorporates the Honeywell Niagara system to facilitate the original Defense Information Assurance Certification and Accreditation Process (DIACAP) process, as well as the transition to the Risk Management Framework. Conner Networks provided network cyber security and related verification and validation of the installed virtual servers.

6
Figure 2. NAVFAC ICS Support Network
Figure 3. NAVFAC SW Server Room - Building 121

7
SAMES uses a secure, multi-tiered architecture with proven software components integrated into a cyber secure framework. The database layer has a temporal data store and archiving to manage time-series energy data and a relational data warehouse to support associated asset context, business intelligence, situational awareness, and reporting requirements. The application layer provides business logic for managing energy consumption and delivering alerts and analytics to improve commercial value and decision-making. The web layer provides secure access to the user interface through tokenization and credential management.
Power Analytics demonstrated net zero and market/power optimization at the Colorado State University Power House Integrid Lab facility (Mirrored Site). In utility-connect mode or islanded mode, SAMES optimizes distributed generation, renewables, storage, and loads to maximize the microgrid’s ability to serve identified critical loads. The system predicts microgrid uptime, which is the forecasted time that the microgrid can reliably sustain operations, and uses additional dynamic load prioritization and generation optimization to allow the facilities to operate as long as possible in the event of a prolonged outage. To do this, our models consider generator efficiency, the availability of renewable energy and storage, fuel supplies/capacities, and load criticality. Our solution allows a base to behave as a Virtual Power Plant (VPP), responding to the grid operator’s call for demand-side resources and working with other installations as desired. The information from this demonstration was used in a microgrid commercial and energy security model to determine the prospective value for individual or clustered installations.
These innovative technologies, in the context of SAMES, include:
• An energy command and control platform, providing comprehensive, real-time power system situational awareness. This enables senior decision makers to manage the energy infrastructure of multiple bases from a single, centralized control center;
• Use of Security Constrained Economic Dispatch (SCED) to optimize the local generation, storage, and demand response against pricing, environmental constraints, and mission constraints;
• Provide rapid secure communications about power among the microgrid operators and the UEOC;
• Permit the cluster of microgrids to operate as a VPP to be leveraged back to the utility or the ISO for commercial value; and,
• Improve the base power infrastructure by using sophisticated modeling tools to compare the as-designed system to the actual system, allowing electrical issues to be corrected before the system fails.
2.2 ADVANTAGES AND LIMITATIONS OF THE TECHNOLOGY
The SAMES system increased the efficiency of the operations of the base circuits, facilitated the integration of renewable sources of generation into the power system, and improves the organizational performance by increasing situational awareness. At the core of the performance improvements is a granular baseline power model that draws from a detailed power system analysis.

8
This level of accuracy and capability was, and found in most circumstances, not available or not accurate in the existing systems. It is this fundamental baseline analysis that determines what is possible, and, which also defines the critical components of the dynamic analysis in live operation. This underlying model has two major elements: programmatic, automated optimization and control, and user simulation based on the actual physical state of the power network, which can be utilized for O&M, training and advanced planning. Each provides a key capability which is not present in the existing infrastructure.

9
3.0 PERFORMANCE OBJECTIVES
The core objectives of SAMES was to provide the military with demonstrated processes, use cases, performance objectives and metrics which can be the foundation and the building blocks for future microgrid clusters. This process provided through the NAFVAC RFI was central to the eventual Naval ICS TOPR. To increase the military’s understanding of the clustered microgrid process, we demonstrated a suite of use cases (scenarios) at the mirrored site of Colorado State University Power House Integrid Lab, simulating/demonstrating how the system will work in specific situations.
Table 1. Performance Objectives
Performance Objective Results
Microgrid Performance Success Criteria: >99% Analyzed both from the existing data from the SAMES installation in NAVFAC SW and at the Power House Lab
Microgrid Uptime
Success Criteria: 100% uptime in microgrid mode. Analyzed both from the existing data from the SAMES installation in NAVFAC SW and at the Power House Lab
Energy Security
Success Criteria: ≥99% when in microgrid mode using standard Institute of Electrical and Electronics Engineers (IEEE) equations. Analyzed both from the existing data from the SAMES installation in NAVFAC SW and at the Power House Lab. Specific integration to the then DIACAP configuration at the Naval Bases
Data Collection
Success Criteria: 100% data collected Analyzed both from the existing data from the SAMES installation in NAVFAC SW and at the Power House Lab
Scheduling and Settlements
Success Criteria: 100% Transactions confirmed by SDG&E. Not met.
Commercial Value
Success Criteria: $ savings against the baseline Analyzed both from the existing data from the SAMES installation in NAVFAC SW and at the Power House Lab
Energy Efficiency
Success Criteria: kWh reduced versus baseline. Identified
Peak Shedding
Success Criteria: % peak reduced versus baseline. Analyzed both from the existing data from the SAMES installation in NAVFAC SW and at the Power House Lab

10
These use cases are mapped against the performance objectives in Table 2 below for both the Naval Bases and for the mirrored site at Colorado State University
Table 2. Use Case Results
# Performance Objective
Metric Data Requirements
Success Criteria
Results
1 Microgrid Performance
Isolation switch (Yes/No). Successful disconnect from the grid.
Meter reading from Automatic Transfer Switches (ATS) confirming disconnection of the designated circuits
>99% Demonstrated at CSU Power House
2 Microgrid Uptime % Available, Predicting microgrid uptime for facilities
Load forecast, fuel forecast, generation capabilities
100% uptime in microgrid mode
Demonstrated at CSU Power House
3 Energy Security % Reliable operations of the microgrid
Real time Reliability Index, data information from the circuits
>= 99% when in microgrid mode using standard IEEE equations
Demonstrated at CSU Power House
4 Data Collection Data collected for all measured devices for entire testing period
All data streams from designated microgrids
100% data collected
Limited by data and site access, but integrated into analysis
5 Scheduling and Settlements
Scheduling & settlement processes built and tested between microgrid and utility
Generation information, market pricing, metering, market settlements
100% transactions confirmed by SDG&E
Not demonstrated in the project, but currently being demonstrated outside of this project
6 Commercial Value $, Calculating the value of the microgrid power schedules to the market against utility rates and market pricing
Market pricing, utility rates, metering of microgrid generation and loads under control, master meter
$ savings against the baseline
Limited based on data access
7 Energy Efficiency kWh reduction in facilities under control
Building or generation meters
kWh reduced vs. baseline
Demonstrated at CSU Power House
8 Peak Shedding kW reduction during peak demands
Building, generation, master meters
% peak reduced vs. baseline
Demonstrated at CSU Power House

11
4.0 SITE/FACILITY DESCRIPTION
4.1 SITE/FACILITY LOCATION AND OPERATIONS
Field Studies were conducted at the following three locations in addition to the work done at Colorado State University Power House for the hardware in the loop testing and microgrid verification:
• Naval Base San Diego, San Diego, CA
• Naval Base Coronado, San Diego, CA
• Naval Base Point Loma, San Diego, CA
Figure 4. Aerial View of the Three Naval Bases
4.1.1 Naval Base San Diego, San Diego, CA
Naval Base San Diego (NBSD) is one of the largest Navy bases in the region, and the primary regional docking station for ships, excluding aircraft carriers and submarines. The SAMES circuit, for the demonstration, was Circuit 10 (referenced in the green circle in Figure 5). NBSD housed the enterprise cluster and has one of the three microgrid circuits. The NBSD circuit at the Naval Hospital includes gas turbine and diesel generation. The target circuit was Station D, which supports Pier 5 & Pier 6. The ships at these piers provided the load and steam cogeneration. NBSD will also house the SAMES enterprise solution for the clustered environment in the existing server room at the UEOC. The existing infrastructure was adequate to support the demonstration.

12
Figure 5. Naval Base San Diego, Aerial View
Figure 6. Naval Base Coronado, Aerial View
4.1.2 Naval Base Coronado, San Diego, CA
Naval Base Coronado (NBC) is an air operations facility, which supports a wide variety of aircraft. SAMES selected the circuit associated to Station L which is the naval airbase circuit for air operations, aircraft, hangers, support buildings, and on-site generation (referenced in the green circle in Figure 6).
4.1.3 Naval Base Point Loma, San Diego, CA
Naval Base Point Loma (NBPL) is a submarine support base. SAMES selected the circuit associated to Station A, which is a high traffic circuit containing the Admiral Kidd facility, a carport with photovoltaic generation capability, and several additional buildings (referenced in the green circle in Figure 7).

13
Figure 7. Naval Base Point Loma, Aerial View
4.2 SITE/FACILITY IMPLEMENTATION CRITERIA
After a careful review of the options, and discussions with senior leadership and NAVFAC SW, Naval Bases San Diego, Coronado, and Point Loma were chosen for the SAMES project. Senior leadership at NAVFAC SW wanted to ensure the bases were committed to the project, and therefore selected circuits that represented critical loads and provided various types of generation sources. Building 1482, the Grace Murray Hopper Service Center, and Building 7, the Naval Medical Center (NMC), are representative of critical facilities found within naval bases around the world.

14
Page Intentionally Left Blank

15
5.0 TEST DESIGN
5.1 CONCEPTUAL TEST/EXPERIMENTAL DESIGN
Study Variables
• Independent Variable(s): − The independent variables were the operation of the target circuits while connected or
disconnected from the primary circuit or grid (connection status), including the Colorado State University Power House facility.
• Dependent Variable(s): − In the two operating states (connected and paralleled with the primary circuit or grid)
and disconnected (islanded) from the primary circuit or grid, we measured the stability of the system, including: when and how it becomes unstable; what contingency plans are appropriate for the state; how stability relates to the capacity for both generation and load; and, how energy cost (kWh) is affected by the operating states.
• Controlled Variable(s): − The controlled variables are the uninterrupted flow of power for each circuit. Power
flow within the circuit will vary based on the environmental and operational conditions, but should never be zero.
Data sets included meter data from twelve meters at the NMC, two meters from the North Island Coronado Naval Base, and three meters from the anti-submarine Point Loma Naval Base. The dataset includes two quantitative variables for each meter: one for time and one for the kW consumption. The values were recorded every fifteen minutes. Where applicable, the data was corrected using a corresponding meter multiplier value.
5.2 BASELINE CHARACTERIZATION
The reference conditions are primarily the elements of the initial study and operational power system model (feeder size, protective devices, generation sources, controllable loads, transformers, etc.). These power models include all sources and uses of power, with a horsepower equivalent of 10 percent, respective to the loads and generation in the target circuits. In addition, the SAMES team collected: environmental data (real-time and historical temperatures, humidity, solar irradiance, and building operational profiles), energy cost and market programs, and planned and unplanned maintenance schedules for the demonstration period. The collection of baseline data on the existing power network began with the static data, and continued throughout the program.
Data collected included the existing power model data, relevant power data such as current protective device coordination studies, arc flash safety studies, and name plate data from installed significant sources or uses of power. In addition, information on the energy markets, demand response and ancillary services energy programs available, were considered in primary analysis.

16
The principal data collections comprised the existing SCADA data, Building Management Systems (BMS) data, meter data, and publicly available external data on energy cost, weather and other environmental data.
5.3 DESIGN AND LAYOUT OF TECHNOLOGY COMPONENTS
5.3.1 Iconics
• Areas of Monitoring: Naval Medical Center (NMC). Iconics is low voltage control (SCADA) interface including generation. This is the most important control interface in the microgrid. The time series data from Iconics was included in the analysis
NOTE: The Iconics system was not integrated into the demonstration due to cyber security limitations, for the system, during this study. − Spirae hardware, at the Colorado State University Power House Integrid Lab
demonstration facility, was the source for high resolution control data. The Spirae system is several generations advanced over the existing Iconics system.
5.3.2 Johnson Controls (Niagara)
• Areas of Monitoring: North Island and Point Loma (mechanical data source—crack detection, etc.). JCL (Niagara) is the building management system.
• Status: Integration with the Niagara BMS server was critical to obtaining authority to operate. Integration was complete, but not expanded over initial point set.
5.3.3 Telvent
• Areas of Monitoring: North Island and Point Loma (main source of medium voltage electrical data). Telvent is the medium voltage SCADA system.
• Status: JCI and Telvent provide real-time data to the SAMES system; however, connectivity was intermittent due to changes being made by IT to network security.
5.3.4 Colorado State University Power House
Figure 8. Power House Control Room

17
Figure 9. Power House Components
The test design and scenarios are represented here as traditional “one lines” or “single lines” for each test scenario. The single lines are created in Power Analytics DesignBase software and are then integrated into the SAMES system/software in the manner described above. The visual representation of these one-line’s, in real-time, are animated by colors and values based on the real-time data, and each analytic described above is re-run based on the changing conditions.
5.4 OPERATIONAL TESTING
The power flow analysis is the most basic and most critical analysis in the model creation/ evaluation. Power flow determines whether the design will meet the requirements of the power network. Fundamental considerations, will there be sufficient voltage and current, at the locations identified in the power network or microgrid, to meet the requirements of the design. The power flow study further validates the most basic assumptions based on the data provided, and determines from field surveys, if they are required. Once established, the power flow results are also used to compare the models predicted results, (such as, what is energized and what is not), and what the predicted voltage is at a specific location. This baseline is then updated in real-time by feeding in the specific real-time data, and re-running the analytics to identify deviations, (alarms and notifications when the model predicted data is more than a specific percentage variation). Further, the power flow analysis identifies adjusting the model (calibration) to changing control set points based on the requirements of the model for stability, cost, performance or the specific optimization appropriate for the system.

18
Figure 10. Power Flow Study Based on Power Scenarios
The short circuit analysis builds on the power flow analysis verifies and validates the protective device settings or establishes the correct settings if they are not coordinated. The protective device settings are essential to the various operating scenarios being analyzed to again ensure sufficient power is being delivered to the critical loads of the microgrid. The short circuit analysis will also be fundamental to how the system operates if certain branches are energized or de-energized in the dynamic network of the microgrid power network.
19
Figure 11. 3Ph short circuit Current (kA) ANSI/IEEE Method
Power system optimization is the basis for the SAMES economic dispatch capability; it is not only a fundamental analytic in the establishment of a base line, but also in the ongoing optimization of the system. Power Analytics Power System Optimization or PSO (real-time optimal power flow) also uses all the real-time results of the preceding analytics, but re-optimizes in real time based on changing assumptions of fuel, cost, control/switching, and adjacent variables such as weather, available solar irradiance etc. PSO is directly connected to the value (economic and operational) value of the microgrid.
Base Line Assumptions:
• Utility Cost: 0.12 $/kWh
• Natural Gas Cost: 0.075 $/kWh
• Solar PV generation: 0.125 $/kWh
• Wind generation: 0$/kWh
Optimization can be run in cases that have two or more resources (not renewables), therefore Scenario 3 and 4 are the only scenarios that we can optimize power dispatch based on the Generation Cost (i.e. Economic Dispatch).

20
Figure 12. Optimized for Most Control, Most Savings
The data range consists of data collections during a period of 452 days starting March 1, 2014 through May 27, 2015. Most-advanced power analysis technology must support both three-phase balanced and unbalanced state estimation.
5.5 SAMPLING METHODS AND PROTOCOL
The data is primarily real-time sensor or metered data, as well as, information from instrumented generation, loads, and the building management systems. Typical sampling rates are between 1-3 seconds with shorter intervals supported for specialized analysis such as wave form capture (below 20 milliseconds) and associated real-time phasor diagrams. The architecture of the system supports multiple forms of data acquisition, and the publish/subscribe SOA architecture of the Gateway makes the data available to any authorized subscriber to the system. The primary data collection is automatic.
Archival rates vary based on defined thresholds but typical data is minimum, maximum and average over a defined period with advanced compression for time series data on the OSI Pi server. The system architecture is massively scalable. The primary data storage is a Redundant Array of Independent Disks (RAID) 5 that can be expanded as required to ensure there is no loss of data. Offsite data storage and backup is available through Commercial-Off-The-Shelf Software (COTS) and hardware as required.
The system can create, evaluate and archive data points that are aggregates of other points but evaluated as real data. For example, differential pressure is trended and reported as a real data point in each scan cycle but is derived from pressure sensors.

21
5.6 SAMPLING RESULTS
5.6.1 Naval Medical Center
The San Diego Naval Medical Center consumed 16,144,828 kWh over the period starting Pacific Standard Time (PST). Additionally, the campus manifested time-of-year sensitivity, with greater kWh consumption occurring during the summer months of July, August, and September, corresponding to the historical warmer months of the region.
5.6.2 Naval Base Point Loma
The Naval Base Point Loma consumed a total of 3,544,934.9 kWh over the period starting October 22, 2014 through April 11, 2015. The mean daily energy consumption value is 23,476 kWh.
5.6.3 Naval Base Coronado
The Naval Base Coronado consumed a total of 27,438,824 kWh over the period starting October 22, 2014 through April 11, 2015. The daily mean energy consumption value for Naval Base Coronado during this time period was 187,937 kWh.

22
Page Intentionally Left Blank

23
6.0 PERFORMANCE ASSESSMENT
6.1 SCENARIO 1:
A 57.6 kW solar panel array will produce enough energy for Building 66 at Point Loma.
Building 66 consumed 21,940.48 kWh from March 1, 2014 through April 1, 2015. One solar panel will produce 114.1926 kWh. Dividing 21,940.48 kWh by 114.1926 kWh/panel, 191.26 panels are needed. 192 panels, each with a rated power of 0.3 kW, equals a 57.6 kW array. The new 57.6 kW array will produce a total of 21,924.98 kWh in this time frame. The array has the potential to over perform in the spring and summer months, and conversely, the potential to underperform in the fall and winter months. The array would operate in parallel with the utility, and offer the capability to sell surplus energy to the utility.
6.2 SCENARIO 2:
The Naval Medical Center’s solar panels on Building 8 will offset utility energy usage by over 10 percent.
Building 8 of the Naval Medical Center has a solar panel array consisting of 216 solar panels. The study analysis used a calculated baseline for each panel, (rating 0.3 kW and efficiency 0.179). Building 8 consumed a total of 78,911 kWh; the solar panel array, using the baseline calculations, produced 24,665.6 kWh. This implies that the panel array would produce 31.25% percent of what Building 8 consumes. However, the data identified that from September 10, 2014 through December 17, 2014, the solar panel array only produced a total of 4,954.73 kWh. This would indicate that for that date range, the panel array would only offset the utility by 6.28%.percent.
6.3 SCENARIO 3:
A microgrid can island for one-day without compromising mission parameters.
Building 1 is the main hospital on the Naval Medical Center’s campus. During the period starting March 1, 2014 through April 1, 2015, Building 1’s averaged consumption was 21,925 kWh per day. During this same period, the solar panel array located on Building 8 produced, on average, 62.13 kWh per day. From the Iconics dataset, the solar gas turbine averaged 2,467 kWh per day. This implies that the existing microgrid on the Naval Medical Center’s campus is only able to combat 8.67% of the main hospital’s load. Aditionally, there are two back up generators with a combined rating of 2,600 kW, and a 1000 kW load bank, all available to provide support services if required.
6.4 SCENARIO 4:
A microgrid can help when the grid becomes unstable.
Generally, a low measured power factor can identify instability in the grid. L13 is located at Naval Air Station North Island (Coronado). The Telvent data set provided analog breaker data for L13’s power factor and power consumption. Station L is the switching station feeding Vault P12-2363 (L13 circuits to bldg. 1482). Building 1482 is the Grace Murray Hopper Service Center.

24
From the power factor analysis, the root mean square value for L13 was 65.71 percent To achieve a power factor of 90 percent, a 400 Kilovolt-Ampere Reactive (kVAR) capacitor is recommended. Based on market data, Eaton’s 400 kVAR Auto-Capacitor Bank would cost $20,340. The correction in the power factor could provide a potential savings of $14,993.
6.5 SCENARIO 5:
SAMES will reduce kWh during the peak days by 10 percent.
Using the data set consisting of metered data from the Naval Medical Hospital; Building 7 was utilized for this study model. Building 7 indicated an increased kWh consumed during the period starting July 17, 2014 through August 14, 2014. During this period, Building 7’s consumption was 792,272 kWh.
From the Iconics data set, the solar gas turbine production averaged 2,467 kWh per day. During the period starting July 17, 2014 through August 14, 2014, the solar gas turbine would have produced 71,543 kWh. The solar panel array located on Building 8 would have produce 2,203.78 kWh. Coupled together, the solar gas turbine and solar panel array would have produced a total of 73,746.78 kWh. This combined energy resource scenario would offset 9.31% of what Building 7 consumed during this peak time frame.
6.6 SCENARIO 6:
During the September 2014 period when the meter data was collected from the Naval Medical Center, a hurricane impacted the San Diego area. On September 16, 2014, San Diego encountered the remnants of Hurricane Odile. During this time, spikes in energy consumption were identified from meters at the Naval Medical Center. San Diego experienced lightning, heavy rain, hail, and stiff winds causing downed trees and power lines throughtout the regional area. Buildings 1, 4, 5, 6, and 7 all experienced spikes during this time as would be excepted following a catastrophic event such as this.
Operating through extended grid outages is extremely important for critical infrastructure. Natural disasters such as hurricanes, earthquakes, and tornados may render the main grid inoperable by knocking down distribution and transmission lines or disabling other parts of the grid. As the name suggests, it is at precisely these times that critical infrastructure facilities are most needed. Microgrids are self-sufficient systems possessing local power generation sources, with less exposed infrastructure and so are less prone to disruptions and damage during such events. Therefore, critical infrastructure within a microgrid will be much more likely to maintain power and continue operating during emergency events that affect the surrounding macrogrid.

25
7.0 COST ASSESSMENT
SAMES allows bases or microgrids to operate as virtual power plants, gaining from market sales, demand response incentives, optimization of renewables, and energy efficiency improvements. When resources are available for optimization, it can curtail 10-30 percent of normal load through reduced consumption, energy storage, and onsite generation, creating demand savings without comprising reliability. Using SAMES, the military can trade in the energy and capacity markets through the California ISO Direct Access program, processing revenue to benefit the installation, and overcoming commercial barriers for government-related clients. SAMES savings to investment ratio is: for 5 years, 2.5; for 10 years, 4.1; and for 20 years, 5.6 per 1MW of capacity. In general, for southern California, a cluster of bases with advanced load and generation control capabilities can accrue savings as noted in the table below:
Table 3. Cost Assessment
Commercial Value Category
Commercial Value Assumptions
Reduced Demand and Consumption
$100,000 - $200,000/MW per yr. Energy asset optimization & load management
Demand Response (Capacity) $50,000 - $70,000/MW per yr. $7/MW capacity clearing price
Frequency Regulation $252,000/MW per yr. $16/MWh based on FERC 755 Demand Bidding (SDG&E Program)
$500,000 - $1,000,000/MW per yr. $500/MWh for called events
Supply Side Energy Trading $625,000 - $1,125,000/MW per yr. $7.5/MWh Ancillary Service and $250/MWh energy clearing price
Simple Payback Period 1.3 yrs.
Additional DoD benefits include:
• First ever centralized command for energy at a regional level; • Increased situational awareness and delivery of automated alerts about potential problems; • Proactive power outage communications and management with the utility and ISO; • Optimized microgrid management in islanded mode to maximize critical facility uptime; • Better understanding of electric capabilities to leverage for future power purchase,
commodity agreements, or market entry; • Information on the feasibility, efficiencies, and roadmap for clustering solutions across
DoD; • Integration of energy information into a common data warehouse; • Development of an Energy Security Return on Investment (ROI) model; • Possible future participation in Demand Response (DR) requests from the utility resulting
in financial compensation; and,

26
• Centralized management of generation and load resources to reduce Peak Load charges during periods of high demand resulting in cost savings.
7.1 COST MODEL
Table 4. Cost Comparison
Cost Element Data Tracked During the Demonstration
Hardware capital costs
The hardware costs are estimated at $40,000 for the project including decommissioning. Hardware costs are kept at a minimum reflecting the use of existing systems and software.
Installation costs Installation costs include both hardware and software installations. Estimated at $409,175
Consumables Not applicable
Facility operational costs
Operational costs include hard dollar (potential energy savings) both realized and possible by shadowing energy market prices and soft dollar based on economic modeling of reliability and availability
Maintenance Maintenance on SAMES itself is not a significant contributor. However, SAMES’ ability to simulate maintenance and evaluate procedures is potentially significant and will be part of the economic analysis
Hardware lifetime Specific hardware items (e.g., computer servers) are included in the analysis. SAMES can also identify existing infrastructure that is degrading or in need of maintenance which may be useful for the bases.
Operator training Onsite operator training took place in the first quarter of 2014 and will include hands-on training for all software related to the SAMES project and further training was provided in the fourth quarter of 2015.
Salvage Value The salvage value at the end of the project assuming a 25% remaining value is estimated at; $4,105 for the servers; $100,000 for software.
7.2 COST DRIVERS
There three major categories of cost drivers to be considered in any future implementation of a microgrid.
1. Partnership with the host site – Any microgrid implementation of any scale will be disruptive to the normal operations of the location. The level of disruption is directly proportional to the mission of the site and the more specific mission of the targeted assets and resources. Except in very rare cases where the microgrid is so small that it is both economically feasible to implement a completely stand-alone system or one that is entirely new construction or both any organization of generation and load resources will impact the site. This is especially true of programs like ESTCP because the duration of the demonstration frequently will encounter rotation and change of command leadership with changing priorities and interests. In addition, since the civilian personnel do not rotate, concerns about change, disruption as well as real and perceived work load being impacted by a project can add significantly to the resistance of site regarding technology and change required for a microgrid.

27
2. Existing infrastructure – The cost and disruption of implementing a controlled microgrid
for more than emergency standby will require integration of existing infrastructure. This includes generation, load, energy storage, distribution wires, protective devices, existing building management, existing SCADA and more are absolute requirements to helping to manage cost and disruption to the site. The added requirement of a cyber secure system that must interconnect with these existing systems places greater need for planning and detail necessary to use existing infrastructure.
3. Power generation and energy market nexus – This last driver is frequently the primary driver in commercial applications for microgrids. The ability to use generation and load resources, in a coordinated process, to reduce energy demand. This includes power generation (exporting power) in a coordinated, managed approach to markets. When balanced with site mission priorities this can change the fundamentals of the economic model profoundly. Providing power from these distributed generation sources to offset or delay capital cost changes to the macrogrid and to provide access to energy markets.
These concepts and presentations were provided to in detail to NAVFAC facilities engaged in the pre-solicitation (N6833515R0079) in support of the RFI and as part of a team response to the Performance Work Statement (PWS) CT-16-1297 Navy Enterprise Smart Grid Solution.
7.3 COST ANALYSIS AND COMPARISON
Since the beginning of the SAMES demonstration project, Power Analytics and the SAMES team have worked to create an approach that would recognize the unique requirements and limitations encountered in SAMES demonstration. Geographically the top locations in terms of energy cost (and deregulation) include Texas, California, New York, Hawaii, and northeastern states. This includes ISO’s ERCOT, PJM, New England ISO, and the California Independent Service Operator (CAISO). These locations (and several others in process) represent strong desire by the larger grid community to support distributed generation through economic incentives. Power Analytics is also involved in specific programs to combine existing generation assets into energy programs that meet the specific requirements military and civilian agencies. This includes various procurement vehicles available to various agencies and parallel efforts to support cyber secure objectives based on accelerating the Authority to Operate (ATO) based on the Risk Management Framework.
The multiyear project underway as part of the Navy CT-16-1297 will yield baseline system connectivity and integration. This requirement is the most difficult to estimate because of the range, capability and generation of equipment and systems at specific locations. For example, the cluster at the three locations in San Diego would not have been possible during the demonstration period if not for the existing secure fiber optic network. Even with that network, one critical system (the Iconics low voltage SCADA system) was not part of the secure enclave and could not be brought in during the duration of the demonstration period.
Power Analytics is working with commercial partners to develop and introduce microgrid building blocks based on the specific experience of SAMES and related efforts. The building block approach is also the preferred approach to microgrids that might be part of any forward operating base capability.

28
Page Intentionally Left Blank

29
8.0 IMPLEMENTATION ISSUES
8.1 EQUIPMENT CALIBRATION
Calibration of the power systems model is based on annual weather changes or significant variation in predicted power variables and through state estimation from known calibrated data sources. Variation can be an early source of identification of potential equipment failure, so automatic power model calibration is only done on a seasonal basis.
The primary source of data sampling for quality in the operational system is the real-time comparison of key power metrics (real-time values compared to dynamic model simulations and the associated variables).
The demonstrated commercial accuracy embodied in the power systems model that is dynamically updated is a fundamental method for identification of both reasonableness of data and faulty data.
8.2 CONCLUSION
Notwithstanding DoD’s adherence to the mandated focus on cyber security, the SAMES team was able to collect a sufficient amount of informative data representative for the three base’s energy consumptions and costs. The research completed in this report demonstrated that potential migrogrid integration is possible within the confines of the cyber security policies and standards. With changing regulations focused on the reduction of energy consumption from nonrenewable resources, and the transition to renewable energy resources, energy producers such as photovoltaic arrays, or additional forms of distributed energy resources, would ensure reliability, energy surety, and energy reliability to the bases.

30
Page Intentionally Left Blank

A-1
APPENDIX A POINTS OF CONTACT
Point of Contact Name
Organization Name
Address
Phone Fax
Email Role in Project
Kevin Meagher Power Analytics 421 Fayetteville Street, Suite 1303 Raleigh, NC 27601
(919) 349-3151 [email protected]
Principal Investigator
John Arterberry Power Analytics – Contractor 421 Fayetteville Street, Suite 1303 Raleigh, NC 27601
(615) 390-8260 [email protected]
Program Manager-subcontractor
Ben Motten Connor Networks 7007 Mission Gorge Road, Suite 205 San Diego, CA 92120
619-279-4709 [email protected]
Subcontractor
Tisha Smith Power Analytics – Contractor 421 Fayetteville Street, Suite 1303 Raleigh, NC 27601
(619) 247-5735 [email protected]
Program Manager-subcontractor
Karen Cronin Power Analytics – Contractor 421 Fayetteville Street, Suite 1303 Raleigh, NC 27601
(978) 835-4934 [email protected]
Subcontractor
Taylor Brockman Power Analytics – Contractor 421 Fayetteville Street, Suite 1303 Raleigh, NC 27601
(843) 708 3840 [email protected]
Subcontractor
Stephen C. Knapp Power Analytics 421 Fayetteville Street, Suite 1303 Raleigh, NC 27601
(443) 286-6785 [email protected]
Program Manager
Chad Von Eck Viridity Energy 1801 Market Street, Suite 2701 Philadelphia, PA 19103
610-636-3881 [email protected]
Subcontractor
Oliver Pacific Spirae 243 N. College Ave Fort Collins, CO 80524-2404
281-380-2186 [email protected]
Subcontractor
Byron Washam University of California, San Diego 9500 Gilman Drive, La Jolla, CA 92093
925-788-9196 [email protected]
Advisor
Ray Robeson San Diego Gas & Electric 336 Euclid Ave #502, San Diego, CA 92114
858-654-8208 [email protected]
Advisor
Dr. Laura Baker (Juette)
NAVFAC SW Naval Facilities Engineering Command Southwest. 1220 Pacific Highway
619-207-9131 [email protected]
Sponsor


