23
Water use efficiency and economic approach National Study, Cyprus Iacovos Iacovides Final Version Plan Bleu UNEP/MAP Regional Activity Centre Sophia Antipolis July 2011
| Date post: | 30-Mar-2016 |
| Category: |
Documents |
| Upload: | cmi-marseille |
| View: | 232 times |
| Download: | 0 times |
Water use efficiency and economic approach
National Study, Cyprus
Iacovos Iacovides Final Version
Plan Bleu UNEP/MAP Regional Activity Centre
Sophia Antipolis July 2011


3
CONTENTS
INTRODUCTION .............................................................................................................. 4
I. PRIORITY ACTIONS ..................................................................................................... 5
II. NATIONAL EFFICIENCY IMPROVEMENT OBJECTIVES ................................... 8
III. POLICIES AND MEASURES AND PROJECTS IMPLEMENTED ....................... 10
IV. PERFORMANCE INDICATORS USED .................................................................... 16
V. POTENTIAL FINANCIAL SAVINGS THROUGH WATER DEMAND MANAGEMENT ................................................................................................................ 17
1. Case studies .............................................................................................................................................18
2. Method used of economic assesment .................................................................................................... 20
VI. ANNEXES .................................................................................................................... 211. The Water efficiency index (total and by sector) (see excel file) .............................................................21
2. Comments on source, frequency and data availability, coverage, access, etc. (see excel file) ................21
List of Tables ............................................................................................................................................. 22
List of Figures ............................................................................................................................................ 23

4
Introduction The report prepared on the invitation of Blue Plan, presents a national analysis of the basic data for Cyprus that could be used for calculating the water efficiency index, assessing the progress made in terms of water savings and identifying priority actions to be introduced in order to improve water use under national strategies for improving water efficiency. On the basis of these national studies the Blue Plan expects to produce a regional summary that would encourage the exchange of experience and sharing of good practices between countries.
This report is in accord to the first priority field of action of the framework strategy in improving integrated water resources and demand management as per the “Mediterranean Strategy for Sustainable Development” (MSSD) adopted in November 2005 and endorsed by the Barcelona Euro-Mediterranean Summit.
The assistance, discussion and provision of data by Agathi Hadjipanteli, Charis Omorphos and Yianna Nicolaou, Executive Engineers of the Water Development Department is greatly acknowledged.

5
I. Priority actions The management of scarce water resources is among the most significant challenges faced by the Cypriot government. Already one of the most water-poor countries among the E.U. member states, Cyprus has to confront an increasing water demand by tourism whilst the demand for agriculture still continues to be high. With most of the favorable water development schemes already implemented, Cyprus had to turn to non – conventional sources such as desalination and re-use of treated effluent. At the same time it has been realized that the key to a sustainable future lies in managing water demand and improve the water use efficiency.
Improved efficiency in drinking, irrigation and industrial water use is required. Given that the field irrigation efficiency is already generally high, attention needs to be paid to the conveyance efficiency to the irrigated plots. Furthermore, since the industrial water use is very limited, attention has to be paid to the domestic sector where unaccounted water is reported to be high mainly due to an aging water infrastructure, especially in the rural areas. The public awareness regarding the severity of the water problem is associated rather with a temporary on-going dry spell rather than with an endemic water shortage, a misconception that needs to be corrected.
In the text that follows emphasis is placed on priority actions that need to be introduced to improve the collection of basic data for the production of the efficiency index’s various components, accompanied by a cost evaluation for such actions; this is deemed as the first step for taking corrective actions to ameliorate the situation and improve the water use efficiency. The priority actions are:
1) General actions
− Establish a focal point that would be responsible for promoting collection and processing of the basic data and the production of the water use efficiency index’s various components. Such a unit could be set up within the Water Development Department (WDD) and could involve one Technical Assistant full time and a supervising Engineer working part-time (estimated cost €40000 per year).
− Acquire computing facilities (PC, printer, software) to maintain database for water use information, including development of such database (€2500 once).
− Telephone line, fax, Internet facilities (estimated €1000 once and €750 per year)
− Develop network of correspondents (For domestic supply: Treatment Plant managers, WDD District Offices monitoring borehole and spring supply of government domestic supply schemes, Water Boards, Municipality water managers, Village water authorities, large tourist developments and other major consumers outside regular supply networks. For Irrigation water efficiency: Major Government Water Works’ managers including surface, groundwater and treated effluent, for each Irrigation Scheme, Irrigation Division treasurers and other major irrigators. For Industrial Water Efficiency: Major Industrial water consumers managers)
− Develop reporting templates for water volumes produced, distributed, invoiced and paid as well as methods for analysis and reporting.
− Connect with major existing databases (such as WDD’s Water Invoicing System database, major Water Boards and Municipality databases)
− Focus on water audits as a tool to evaluate water use efficiency. As the name implies, a “Water Audit” can be defined as the process of conducting a complete inventory of all water fixtures from the supply source, to the distribution network, to the consumer and identifying leakage locations within it. The quantities of water produced and or purchased compared to the quantities invoiced and or paid by the consumers should provide a good approximation of the network efficiency.
− Organize training workshops for correspondents according to sector (domestic, irrigation, industry) for monitoring and reporting preferably at regional level (3 sectors x 3 regions x €3000 per event = € 27000 once).
− Printing and campaign material (€9000 once)

6
2) Drinking Water use efficiency:
− Identify major water treatment plants and maintain register on water produced and distributed. The same for groundwater quantities (borehole and spring) in major domestic supply schemes.
− Develop a Village Water Supply (VWS) register with particular information on water produced by well/borehole and or spring (including meter readings or information allowing assessment of water produced – yield per hour, hours per day of operation, service reservoir size etc.).
− Identify major clients receiving water in bulk from WDD and maintain register of water distributed to them.
− Obtain information from major water utility clients on the volumes of water distributed and invoiced.
− Work together with major water utilities and VWS authorities in identifying water wastage in water supply, known as unaccounted-for water.
− The problem of diminished reliability of water-meters on the occasion of water rationing (interrupted supply) caused by measuring air finding its way into the system should be investigated and researched together with the major water utility suppliers (Water Boards).
− Maintain register of Village Water Supply quantities of water invoiced and paid by consumers.
− Consider support in maintaining and or installing water-meters at VWS sources (estimated cost 30 water-meters x €1000 purchase & installation = €30000 once and €10000 per year for assistance in general water-meter maintenance)
3) Irrigation Water Use Efficiency:
− Identify major Irrigation Schemes depending on Government Water Works and maintain register of quantities released for transport at the source by networks up to the agricultural plots and the quantities actually distributed to the plots. This should provide the losses and thus the efficiency of irrigation water transports upstream the agricultural plots.
− Survey major Irrigation Schemes and identify irrigation systems used and determine average plot irrigation efficiency (use agriculturists, existing irrigation demonstration experiments etc.) (Assuming 5 day survey by 2 persons in 6 major Irrigation Schemes = 60 man-days x €150 per day including expenses = € 9000 once).
− Identify main Irrigation Divisions outside Government Water Works and maintain register of water produced and actually used. Determine irrigation systems and efficiency used. Consider providing/installing water-meter at source (estimated cost for assumed 15 Irrigation Divisions at €1000 per water-meter = €15000 once).
− Identify major irrigators (large plantations) and maintain register of water produced and used.
− The same information as above should be maintained for the re-use of treated effluent for irrigation.
− Obtain information from major water utility clients on the volumes of water distributed and invoiced (WDD Water Invoicing System database and major Irrigation Divisions).
4) Industrial water efficiency
− Identify major Industries consuming water depending on Government Water Works (and or major water utilities) and maintain register of quantities recycled within the industry.
− Maintain register of water volumes consumed by the industrial process (volume provided to industry and volume recycled).
− Consider supporting the installation/maintenance of water-meter at selected industries/locations (estimated cost for assumed 5 Industries at €1000 per water-meter = €5000 once).
7
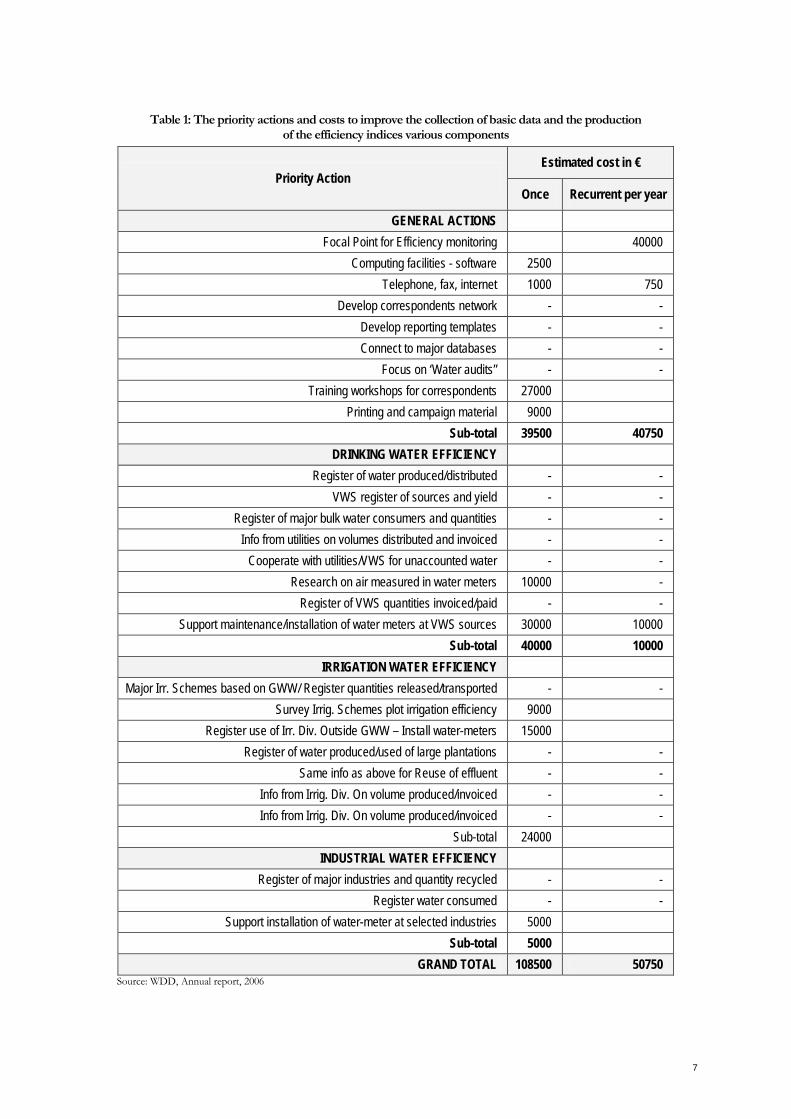
Table 1: The priority actions and costs to improve the collection of basic data and the production of the efficiency indices various components
Priority Action Estimated cost in €
Once Recurrent per year
GENERAL ACTIONS Focal Point for Efficiency monitoring 40000
Computing facilities - software 2500 Telephone, fax, internet 1000 750
Develop correspondents network - - Develop reporting templates - - Connect to major databases - -
Focus on ‘Water audits” - - Training workshops for correspondents 27000
Printing and campaign material 9000 Sub-total 39500 40750
DRINKING WATER EFFICIENCY Register of water produced/distributed - -
VWS register of sources and yield - - Register of major bulk water consumers and quantities - -
Info from utilities on volumes distributed and invoiced - - Cooperate with utilities/VWS for unaccounted water - -
Research on air measured in water meters 10000 - Register of VWS quantities invoiced/paid - -
Support maintenance/installation of water meters at VWS sources 30000 10000 Sub-total 40000 10000
IRRIGATION WATER EFFICIENCY Major Irr. Schemes based on GWW/ Register quantities released/transported - -
Survey Irrig. Schemes plot irrigation efficiency 9000 Register use of Irr. Div. Outside GWW – Install water-meters 15000
Register of water produced/used of large plantations - - Same info as above for Reuse of effluent - -
Info from Irrig. Div. On volume produced/invoiced - - Info from Irrig. Div. On volume produced/invoiced - -
Sub-total 24000 INDUSTRIAL WATER EFFICIENCY
Register of major industries and quantity recycled - - Register water consumed - -
Support installation of water-meter at selected industries 5000 Sub-total 5000
GRAND TOTAL 108500 50750 Source: WDD, Annual report, 2006
8
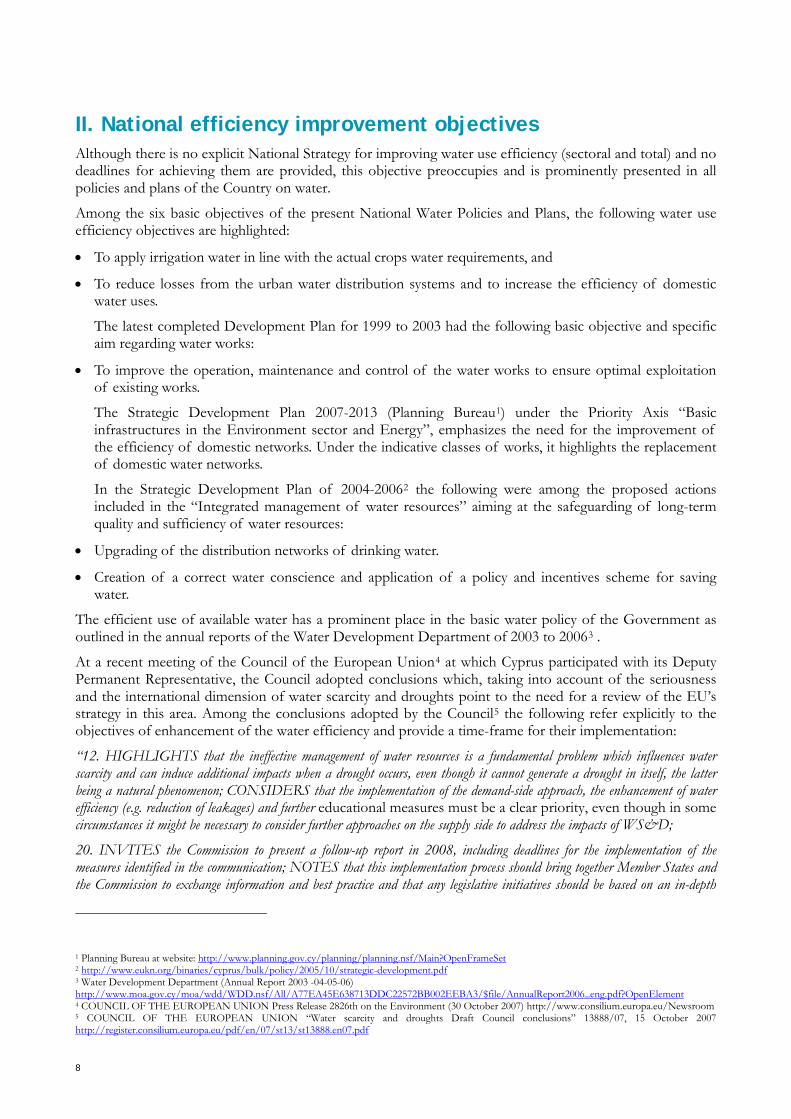
II. National efficiency improvement objectives Although there is no explicit National Strategy for improving water use efficiency (sectoral and total) and no deadlines for achieving them are provided, this objective preoccupies and is prominently presented in all policies and plans of the Country on water.
Among the six basic objectives of the present National Water Policies and Plans, the following water use efficiency objectives are highlighted:
• To apply irrigation water in line with the actual crops water requirements, and
• To reduce losses from the urban water distribution systems and to increase the efficiency of domestic water uses.
The latest completed Development Plan for 1999 to 2003 had the following basic objective and specific aim regarding water works:
• To improve the operation, maintenance and control of the water works to ensure optimal exploitation of existing works.
The Strategic Development Plan 2007-2013 (Planning Bureau1
In the Strategic Development Plan of 2004-2006
) under the Priority Axis “Basic infrastructures in the Environment sector and Energy”, emphasizes the need for the improvement of the efficiency of domestic networks. Under the indicative classes of works, it highlights the replacement of domestic water networks.
2
• Upgrading of the distribution networks of drinking water.
the following were among the proposed actions included in the “Integrated management of water resources” aiming at the safeguarding of long-term quality and sufficiency of water resources:
• Creation of a correct water conscience and application of a policy and incentives scheme for saving water.
The efficient use of available water has a prominent place in the basic water policy of the Government as outlined in the annual reports of the Water Development Department of 2003 to 20063
At a recent meeting of the Council of the European Union
. 4 at which Cyprus participated with its Deputy
Permanent Representative, the Council adopted conclusions which, taking into account of the seriousness and the international dimension of water scarcity and droughts point to the need for a review of the EU’s strategy in this area. Among the conclusions adopted by the Council5
20. INVITES the Commission to present a follow-up report in 2008, including deadlines for the implementation of the measures identified in the communication; NOTES that this implementation process should bring together Member States and the Commission to exchange information and best practice and that any legislative initiatives should be based on an in-depth
the following refer explicitly to the objectives of enhancement of the water efficiency and provide a time-frame for their implementation:
“12. HIGHLIGHTS that the ineffective management of water resources is a fundamental problem which influences water scarcity and can induce additional impacts when a drought occurs, even though it cannot generate a drought in itself, the latter being a natural phenomenon; CONSIDERS that the implementation of the demand-side approach, the enhancement of water efficiency (e.g. reduction of leakages) and further educational measures must be a clear priority, even though in some circumstances it might be necessary to consider further approaches on the supply side to address the impacts of WS&D;
1 Planning Bureau at website: http://www.planning.gov.cy/planning/planning.nsf/Main?OpenFrameSet 2 http://www.eukn.org/binaries/cyprus/bulk/policy/2005/10/strategic-development.pdf 3 Water Development Department (Annual Report 2003 -04-05-06) http://www.moa.gov.cy/moa/wdd/WDD.nsf/All/A77EA45E638713DDC22572BB002EEBA3/$file/AnnualReport2006_eng.pdf?OpenElement 4 COUNCIL OF THE EUROPEAN UNION Press Release 2826th on the Environment (30 October 2007) http://www.consilium.europa.eu/Newsroom 5 COUNCIL OF THE EUROPEAN UNION “Water scarcity and droughts Draft Council conclusions” 13888/07, 15 October 2007 http://register.consilium.europa.eu/pdf/en/07/st13/st13888.en07.pdf

9
impact assessment; CONSIDERS that the need for further measures, namely on drought risk management, should be assessed taking into account these conclusions, experience gained with the implementation of the WFD, and the results from research and technical activities on WS&D which are currently in progress; INVITES the Commission, on this basis, and taking into account the international dimension, to review and further develop the evolving EU strategy for WS&D by 2012.”
The long-term water scarcity management in Cyprus on the demand side encourages6
6 MED Joint Process WFD /EUWI (June 2006) “Water Scarcity management in the context of the WFD - Policy Summary” Water Scarcity Drafting Group Appendix “ Coping with Drought – The Experience of Cyprus” by Charis Omorphos WDD.
the installation of improved farm irrigation systems and promotes the construction of modern efficient conveyance and distribution systems with minor losses.
Leakage detection methods are applied on water distribution systems to reduce water losses and real time telemonitoring and telecontrol are now used in the most important projects to optimize operation and maintenance.

10
III. Policies and measures and projects implemented
• The Auditor General:
Drinking Water use efficiency
In Cyprus the proportion of the non invoiced quantity of water varies between 18 to 38% depending on the water utility company (Water board /Municipality /Community). The natural losses from distribution networks constitute the major part of this quantity. It is estimated that the loss of water from the domestic water networks is of the order of 8 million cubic meters annually.
There are three sources readily available for the estimation of the Non Revenue Water (NRW) loss of domestic water: i) the annual report of the Auditor General, ii) the Water Invoicing System of the Water Development Department, and iii) the Water Boards of the three main cities.
The Auditor General of the Republic audits the accounts of the Municipalities, Community Boards and Town Water Boards annually. In this line the non-revenue water is very often identified and reported. Table 2 presents some of this information for a selected number of water utilities that shows the extent of the problem and its variation throughout the years.
Table 2: NRW for selected Municipalities/Communities and the Water Boards as per the Auditor General’s reports for 2001-2005
Municipality Average Consuption (mil. m3/y)
NRW in % Ave. Eff. (%)
Est. Quant. Lost (mil.m3/y) 2001 2002 2003 2004 2005
Pafos 3.8 -4.5 29.4 29.5 29.4 1.2
Aradippou 1.4-1.5 49 41 33 41 41.0 0.6
Agia Napa 2.1-2.4 31.0 34.3 29.0 45.0 34.8 0.8
Dherynia 0.33-0.45 23.8 29.6 36.0 27.0 29.1 0.1
Germasogeia 1.7-1.8 32.3 30.0 31.1 0.5
Idalion 0.7-0.8 29 24 28 26 27.7 0.2
Average 31.9 3.4
Community Board
Tseri 0.98-1.2 26.0 26.5 27.7 26.7 0.3
Geri 0.16-0.22 21.9 31.8 34.5 38.7 31.7 0.1
Average 29.2 0.4
Water Boards
Nicosia 15.0-18.4 20.45 25.42 22.08 24.45 20.59 22.6 3.8
Limassol 11.4-13.7 18.6 16.4 14.8 17.4 19.0 17.2 2.1
Larnaca 5.6-5.7 36 31.5 30.5 28.0 28.0 30.8 1.7
Average 23.5 7.6 Sources: WDD, the annual report of the Auditor General, the Water Invoicing System of the Water Development Department, and the Water Boards of the three main cities, 2006
From the Table 2 it appears that the NRW for the Municipalities and Communities is larger than that of the Water Boards. A gross estimate of the water lost is of the order of 8 million cubic meters for the selected water utilities.
The high losses are attributed to aging water supply networks, ongoing works on sewage systems and the old water meters. Efforts are under way for leakage tracing equipment and for instant corrective measures, replacement of old network and meters.
11
• The Water Development Department:
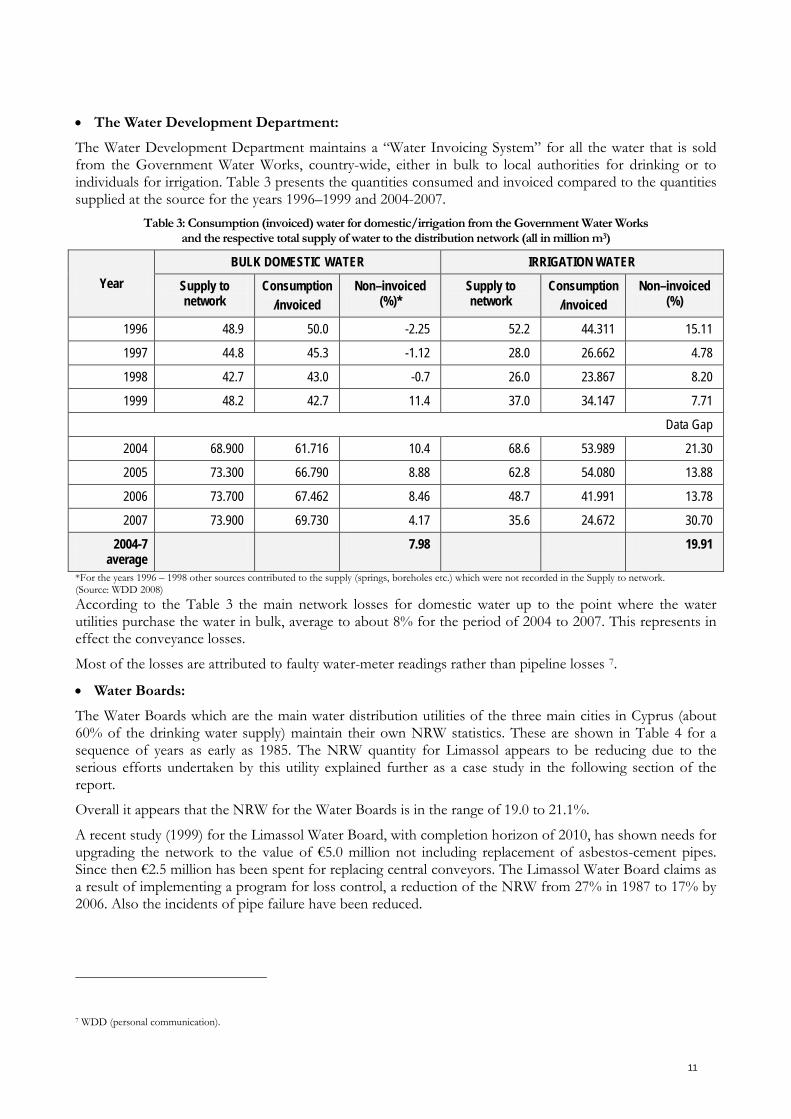
The Water Development Department maintains a “Water Invoicing System” for all the water that is sold from the Government Water Works, country-wide, either in bulk to local authorities for drinking or to individuals for irrigation. Table 3 presents the quantities consumed and invoiced compared to the quantities supplied at the source for the years 1996–1999 and 2004-2007.
Table 3: Consumption (invoiced) water for domestic/irrigation from the Government Water Works and the respective total supply of water to the distribution network (all in million m3)
Year BULK DOMESTIC WATER IRRIGATION WATER
Supply to network
Consumption /invoiced
Non–invoiced (%)*
Supply to network
Consumption /invoiced
Non–invoiced (%)
1996 48.9 50.0 -2.25 52.2 44.311 15.11
1997 44.8 45.3 -1.12 28.0 26.662 4.78
1998 42.7 43.0 -0.7 26.0 23.867 8.20
1999 48.2 42.7 11.4 37.0 34.147 7.71
Data Gap
2004 68.900 61.716 10.4 68.6 53.989 21.30
2005 73.300 66.790 8.88 62.8 54.080 13.88
2006 73.700 67.462 8.46 48.7 41.991 13.78
2007 73.900 69.730 4.17 35.6 24.672 30.70
2004-7 average
7.98 19.91
*For the years 1996 – 1998 other sources contributed to the supply (springs, boreholes etc.) which were not recorded in the Supply to network. (Source: WDD 2008) According to the Table 3 the main network losses for domestic water up to the point where the water utilities purchase the water in bulk, average to about 8% for the period of 2004 to 2007. This represents in effect the conveyance losses.
Most of the losses are attributed to faulty water-meter readings rather than pipeline losses 7
• Water Boards:
.
The Water Boards which are the main water distribution utilities of the three main cities in Cyprus (about 60% of the drinking water supply) maintain their own NRW statistics. These are shown in Table 4 for a sequence of years as early as 1985. The NRW quantity for Limassol appears to be reducing due to the serious efforts undertaken by this utility explained further as a case study in the following section of the report.
Overall it appears that the NRW for the Water Boards is in the range of 19.0 to 21.1%.
A recent study (1999) for the Limassol Water Board, with completion horizon of 2010, has shown needs for upgrading the network to the value of €5.0 million not including replacement of asbestos-cement pipes. Since then €2.5 million has been spent for replacing central conveyors. The Limassol Water Board claims as a result of implementing a program for loss control, a reduction of the NRW from 27% in 1987 to 17% by 2006. Also the incidents of pipe failure have been reduced.
7 WDD (personal communication).
12
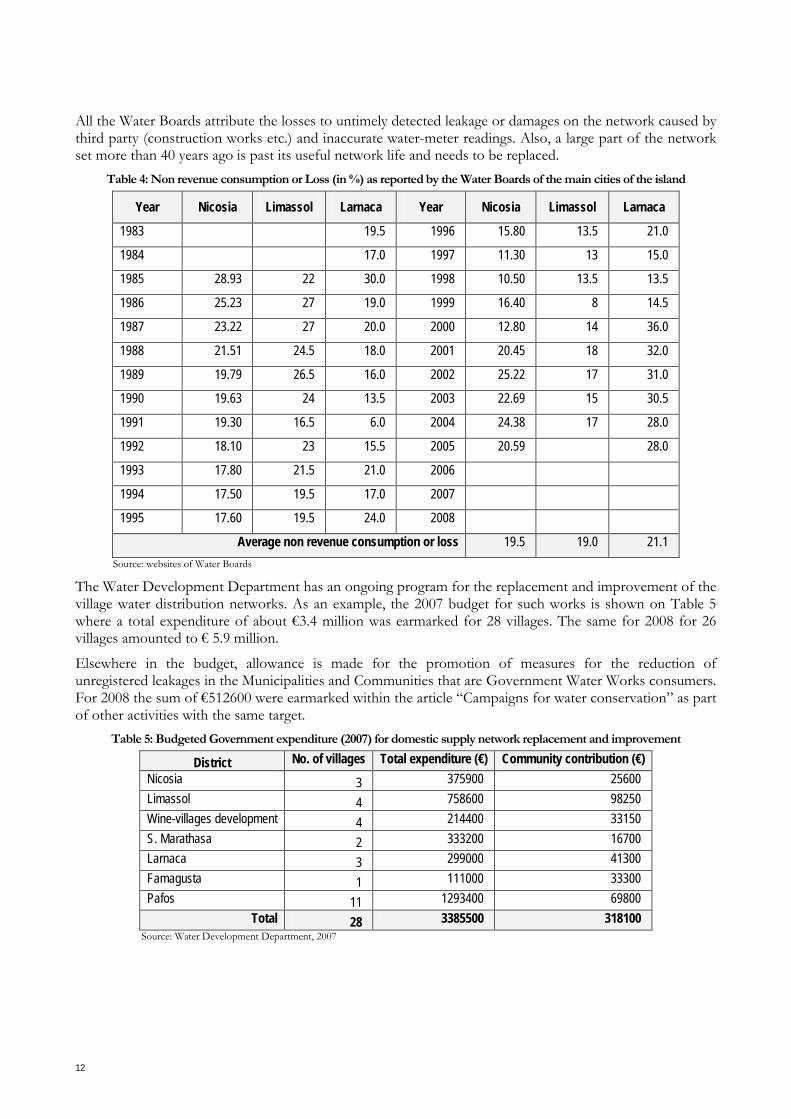
All the Water Boards attribute the losses to untimely detected leakage or damages on the network caused by third party (construction works etc.) and inaccurate water-meter readings. Also, a large part of the network set more than 40 years ago is past its useful network life and needs to be replaced.
Table 4: Non revenue consumption or Loss (in %) as reported by the Water Boards of the main cities of the island
Year Nicosia Limassol Larnaca Year Nicosia Limassol Larnaca
1983 19.5 1996 15.80 13.5 21.0
1984 17.0 1997 11.30 13 15.0
1985 28.93 22 30.0 1998 10.50 13.5 13.5
1986 25.23 27 19.0 1999 16.40 8 14.5
1987 23.22 27 20.0 2000 12.80 14 36.0
1988 21.51 24.5 18.0 2001 20.45 18 32.0
1989 19.79 26.5 16.0 2002 25.22 17 31.0
1990 19.63 24 13.5 2003 22.69 15 30.5
1991 19.30 16.5 6.0 2004 24.38 17 28.0
1992 18.10 23 15.5 2005 20.59 28.0
1993 17.80 21.5 21.0 2006
1994 17.50 19.5 17.0 2007
1995 17.60 19.5 24.0 2008
Average non revenue consumption or loss 19.5 19.0 21.1 Source: websites of Water Boards
The Water Development Department has an ongoing program for the replacement and improvement of the village water distribution networks. As an example, the 2007 budget for such works is shown on Table 5 where a total expenditure of about €3.4 million was earmarked for 28 villages. The same for 2008 for 26 villages amounted to € 5.9 million.
Elsewhere in the budget, allowance is made for the promotion of measures for the reduction of unregistered leakages in the Municipalities and Communities that are Government Water Works consumers. For 2008 the sum of €512600 were earmarked within the article “Campaigns for water conservation” as part of other activities with the same target.
Table 5: Budgeted Government expenditure (2007) for domestic supply network replacement and improvement
District No. of villages Total expenditure (€) Community contribution (€) Nicosia 3 375900 25600 Limassol 4 758600 98250 Wine-villages development 4 214400 33150 S. Marathasa 2 333200 16700 Larnaca 3 299000 41300 Famagusta 1 111000 33300 Pafos 11 1293400 69800
Total 28 3385500 318100 Source: Water Development Department, 2007
13
According to data kept by the Water Development Department
Irrigation Water Use Efficiency 8
Table 3
for all the water that is sold from the Government Water Works, country-wide, either in bulk or to individuals for irrigation, the derived Non Invoiced Water for the years of 2004 – 2007 averages to 19.91% ( ). This represents the losses of irrigation water use upstream of the agricultural plots.
Most of these losses are attributed to faulty water-meter readings rather than to leakages of the network.
In the text that follows the plot irrigation water use efficiency is dealt with in further detail.
The water use improvement project
Under the “Water Use Improvement Project” which started in 1965 the Government provided the farmers with technical and financial assistance to convert to modern irrigation systems and to the application of irrigation schedules in compliance with the actual crop water needs, aiming at the conservation of water resources at the farm level. The project was originally planned for a five year period but it was extended successfully for more than three decades with remarkable results.
The financial assistance consisted of low interest loans and subsidies to install improved irrigation systems. Free technical assistance was offered in the form of planning and design of the irrigation system, the preparation of the irrigation schedule and the follow-up of the installation operation.
The drip method was initially used for irrigation of high value crops only but later with the reduction of the installation cost the use of drippers, mini-sprinklers and low capacity sprinklers was expanded for irrigating trees and field vegetables.
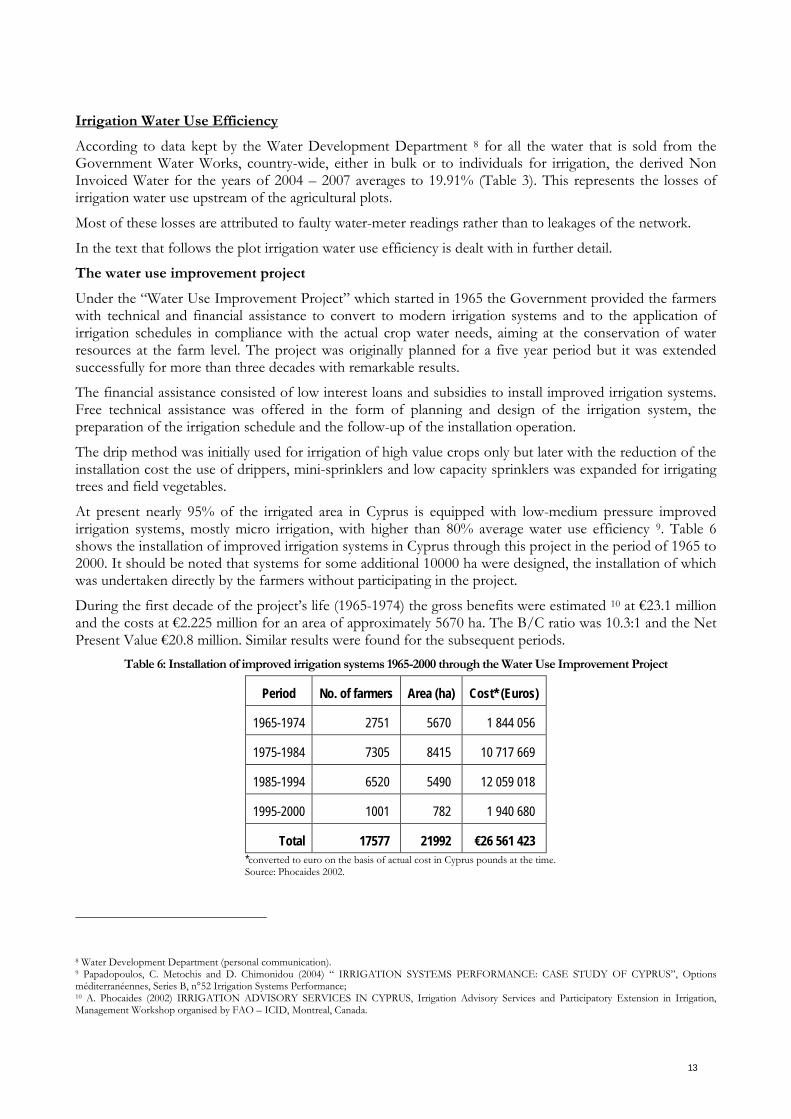
At present nearly 95% of the irrigated area in Cyprus is equipped with low-medium pressure improved irrigation systems, mostly micro irrigation, with higher than 80% average water use efficiency 9 Table 6. shows the installation of improved irrigation systems in Cyprus through this project in the period of 1965 to 2000. It should be noted that systems for some additional 10000 ha were designed, the installation of which was undertaken directly by the farmers without participating in the project.
During the first decade of the project’s life (1965-1974) the gross benefits were estimated 10
Table 6: Installation of improved irrigation systems 1965-2000 through the Water Use Improvement Project
at €23.1 million and the costs at €2.225 million for an area of approximately 5670 ha. The B/C ratio was 10.3:1 and the Net Present Value €20.8 million. Similar results were found for the subsequent periods.
Period No. of farmers Area (ha) Cost* (Euros)
1965-1974 2751 5670 1 844 056
1975-1984 7305 8415 10 717 669
1985-1994 6520 5490 12 059 018
1995-2000 1001 782 1 940 680
Total 17577 21992 €26 561 423 *converted to euro on the basis of actual cost in Cyprus pounds at the time. Source: Phocaides 2002.
8 Water Development Department (personal communication). 9 Papadopoulos, C. Metochis and D. Chimonidou (2004) “ IRRIGATION SYSTEMS PERFORMANCE: CASE STUDY OF CYPRUS”, Options méditerranéennes, Series B, n°52 Irrigation Systems Performance; 10 A. Phocaides (2002) IRRIGATION ADVISORY SERVICES IN CYPRUS, Irrigation Advisory Services and Participatory Extension in Irrigation, Management Workshop organised by FAO – ICID, Montreal, Canada.
14
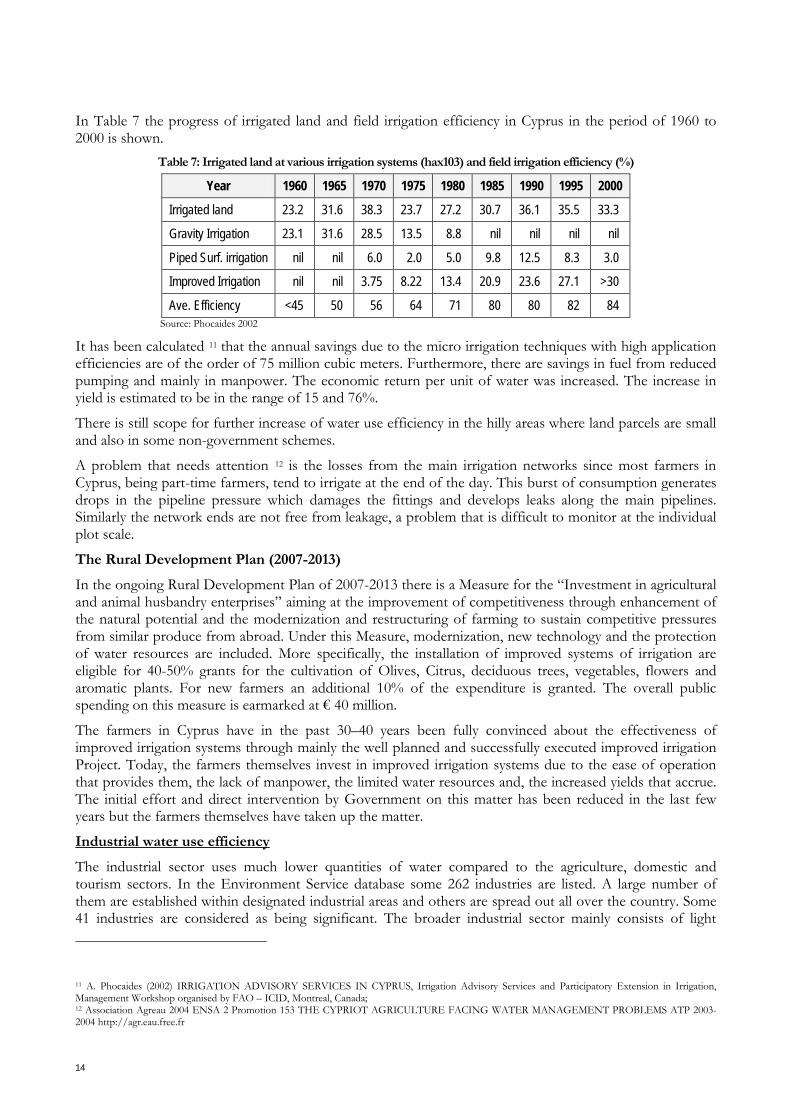
In Table 7 the progress of irrigated land and field irrigation efficiency in Cyprus in the period of 1960 to 2000 is shown.
Table 7: Irrigated land at various irrigation systems (hax103) and field irrigation efficiency (%)
Year 1960 1965 1970 1975 1980 1985 1990 1995 2000
Irrigated land 23.2 31.6 38.3 23.7 27.2 30.7 36.1 35.5 33.3
Gravity Irrigation 23.1 31.6 28.5 13.5 8.8 nil nil nil nil
Piped Surf. irrigation nil nil 6.0 2.0 5.0 9.8 12.5 8.3 3.0
Improved Irrigation nil nil 3.75 8.22 13.4 20.9 23.6 27.1 >30
Ave. Efficiency <45 50 56 64 71 80 80 82 84 Source: Phocaides 2002
It has been calculated 11
A problem that needs attention
that the annual savings due to the micro irrigation techniques with high application efficiencies are of the order of 75 million cubic meters. Furthermore, there are savings in fuel from reduced pumping and mainly in manpower. The economic return per unit of water was increased. The increase in yield is estimated to be in the range of 15 and 76%.
There is still scope for further increase of water use efficiency in the hilly areas where land parcels are small and also in some non-government schemes.
12 is the losses from the main irrigation networks since most farmers in Cyprus, being part-time farmers, tend to irrigate at the end of the day. This burst of consumption generates drops in the pipeline pressure which damages the fittings and develops leaks along the main pipelines. Similarly the network ends are not free from leakage, a problem that is difficult to monitor at the individual plot scale.
The Rural Development Plan (2007-2013)
In the ongoing Rural Development Plan of 2007-2013 there is a Measure for the “Investment in agricultural and animal husbandry enterprises” aiming at the improvement of competitiveness through enhancement of the natural potential and the modernization and restructuring of farming to sustain competitive pressures from similar produce from abroad. Under this Measure, modernization, new technology and the protection of water resources are included. More specifically, the installation of improved systems of irrigation are eligible for 40-50% grants for the cultivation of Olives, Citrus, deciduous trees, vegetables, flowers and aromatic plants. For new farmers an additional 10% of the expenditure is granted. The overall public spending on this measure is earmarked at € 40 million.
The farmers in Cyprus have in the past 30–40 years been fully convinced about the effectiveness of improved irrigation systems through mainly the well planned and successfully executed improved irrigation Project. Today, the farmers themselves invest in improved irrigation systems due to the ease of operation that provides them, the lack of manpower, the limited water resources and, the increased yields that accrue. The initial effort and direct intervention by Government on this matter has been reduced in the last few years but the farmers themselves have taken up the matter.
The industrial sector uses much lower quantities of water compared to the agriculture, domestic and tourism sectors. In the Environment Service database some 262 industries are listed. A large number of them are established within designated industrial areas and others are spread out all over the country. Some 41 industries are considered as being significant. The broader industrial sector mainly consists of light
Industrial water use efficiency
11 A. Phocaides (2002) IRRIGATION ADVISORY SERVICES IN CYPRUS, Irrigation Advisory Services and Participatory Extension in Irrigation, Management Workshop organised by FAO – ICID, Montreal, Canada; 12 Association Agreau 2004 ENSA 2 Promotion 153 THE CYPRIOT AGRICULTURE FACING WATER MANAGEMENT PROBLEMS ATP 2003-2004 http://agr.eau.free.fr

15
manufacturing, mining and electricity. The industrial sector uses the lowest volume of water, compared to the agriculture, domestic and tourism sectors. The industrial sector seems to follow a stabilising trend, both in terms of employment, as well as in terms of economic output. It has been estimated 13
13 WDD/FAO (2002) “Re-evaluation of the Water Resources and Demand of the Island of Cyprus”, WDD, MANRE.
that the total annual water demand of the Industry is of the order of 4.0 million (year 2005) and may increase to 5.0 million cubic meters by the year 2010.
There are no estimates for the efficiency index of industrial water use but these are expected to be of the same order as for the domestic supplies as indicated above since most of the Industries receive water from the Water Boards and it is difficult to ascertain the Industrial Water Efficiency separately.
By applying the same rates of current losses as for the domestic supply, the annual savings that could accrue if these losses are reduced to 15% would amount to 0.2 to 0.5 million cubic meters for current use to 0.3 to 1.0 million cubic meters by 2020.
Control of the industrial water use efficiency is done during the issuing of the permits by the Environment Service and subsequent monitoring for all industries especially those falling under the Integrated Pollution Prevention and Control (IPPC) Council Directive 96/61/EC and the corresponding Cyprus Law Ν.56(Ι)/2003.
More specifically the use of water is controlled and where necessary measures for the prevention and recovery of waste generated by the installation are taken. The reuse of treated liquid wastes is encouraged and the water consumption must be recorded.
Due to the minute quantities of water used by the industry in Cyprus no specific policies and measures are adopted towards improving the industrial water efficiency other than those items specified under the IPPC Directive.
16
IV. Performance indicators used There are no formal performance indicators to assess the above actions other than:
• The recorded Non Revenue Water (NRW) loss of domestic water. Information on this is available at the Water Boards and Municipalities and most of the Communities.
• The annual report of the Auditor General that audits the accounts of the Water Boards and Municipalities, and
• Ad hoc study of the Village Water Supply schemes regarding the water quantities at source and the volumes of water billed to their consumers.
For the main conveyance network efficiency the performance indicators used are the quantity produced and provided at source compared to the actual quantity of water invoiced (either bulk quantities or to individual consumers) as maintained by the Water Invoicing System of the Water Development Department which controls the supply for domestic purpose from all Government Water Works. The same applies for the water that is provided for irrigation purposes.
The performance indicators from year to year cannot be considered as fully reliable since the effectiveness of the measures taken from year to year is masked on many occasions by the availability of water. High performance (translated in reduced losses) may be associated to reduced pressure in the network due to water supply cuts rather than effective control of leakages.
Another performance indicator might be the budgeted annual Government expenditure for domestic supply network replacement and improvement and the actual implementation of this measure.
In the Irrigation sector the performance indicator under the implementation of the “water use improvement project” is the annual number of applications received by farmers and the extent of land equipped with improved irrigation systems.
Similarly the progress of irrigated land and field irrigation efficiency in Cyprus is monitored annually by the Department of Agriculture through its Extension Offices and constitutes another performance indicator.
The number of farmers applying for grants for installing improved irrigation systems under the ongoing Rural Development Plan (2007-2013) will also be another performance indicator.
For the industrial water use efficiency the performance indicator will be the IPPC licensing and the clauses in regard to water use and the subsequent monitoring of the level of implementation by each industry.
17
V. Potential financial savings through water demand management The possible actions for water demand management have been identified and are, in an order of priority: control of leakages; increase of water prices; reduction of demand per capita through conservation education; reduction of the total area of irrigated crops; change of crop planting patterns to more efficient crops; further improvement of irrigation efficiency; limit of water uses; and, use of marginal water for certain uses.
The potential financial savings to be made through the implementation of water demand management measures are difficult to be assessed since no such programs are explicitly defined. Improved efficiency in the various sectors of activity using the water demand management policies have been dealt with in another report 14
14 Iacovos IACOVIDES (2007) National Report on “Monitoring progress and promotion of water demand management policies in Cyprus” Under the
aegis of the Water Development Department and Plan Bleu.
. In that report the control of leakages and improvement of the irrigation efficiency were highlighted.
The efficiency index WAT_PO1 for domestic water was determined to average 76% for the cities and 64% for some major municipalities and the villages. Bringing this index to 85% is generally considered as economical. Further control of leakage may be uneconomic due to diminishing marginal benefits. The possible savings in water through this measure are expected to be of the order of 4 to 12 million cubic meters per year on the current demand of 67 million cubic meters per year increasing to 6 to 18 million cubic meters per year for the projected demand of 100 million cubic meters per year by 2020.
On the basis of the above and considering the average price paid per cubic meter of desalinated water in the island of €0.66 the immediate potential financial savings could amount between €2.64 and €7.92 million/yr on the current demand increasing to the range of €3.96 and €11.88 million/yr by 2020.
It should be noted that the “Drinking Water Efficiency” as shown on the WAT-PO1 spreadsheet template that accompanies this summary report, refers to conveyance losses for the bulk supplies implemented by the WDD only. To this efficiency the distribution efficiency by the Water Boards (which account for 60% of the supply) and of the other communities (40% of the supply) should be added. The estimated values averaged out for all distributors are: 76.7% (1996), 78.9 (1997), 79.3 (1998), 79 (1999), 74.2 (2004), 72.7 (2005), and 73.1% (2006). The reported values provided by the Water Boards refer to “non- revenue water” (or loss) per year thus the quantities produced and sold as required by the template cannot be inserted (see note on template). Similarly, the irrigation efficiency refers to quantities provided for the supply from government waterworks. No data are available for irrigation outside government water works although plot irrigation efficiencies are similar.
For the irrigation water the water efficiency index is already quite high. Irrigation systems generally consist of closed systems with an overall conveyance efficiency averaging 85 - 90 % and the field application efficiency averages 82-84%. Thus, with the present technology no significant additional savings could be expected. Detailed information as to the surface equipped with modern irrigation systems is not readily available but it is estimated that currently the on farm irrigation systems comprise 90% micro-irrigation, 5% sprinkler irrigation and 5% surface irrigation.
Industrial water efficiency falls within the domestic supply efficiency and is already included there.
18
1. Case studies A case study for the control of leakages in a domestic water distribution network is presented here below showing the methodology and approach followed and the results achieved:
The Water Board of Lemesos Case-Study 15
The Water Board established a “water audit” system and has over the years developed its infrastructure in such a way so as to be able to account efficiently and accurately for all water produced or “lost” or “non-revenue water” (
The network of the Water Board of Lemesos, on the south coast of the island of Cyprus, is over 50 years of age and serves approximately 170,000 residents through approximately 64,000 consumer meters in an area of 70 km2. The annual volume of potable water distributed through the network of pipes, of approximate length 795km, is about 13.7x10⁶ m3 and of value €7.0 million.
The Water Board of Lemesos has maintained records of its operational activities since 1963, which include production of water from sources, distribution through district meters and consumption from consumer meters. A Supervisory Control and Data Acquisition (SCADA) telemetry system is connected to meter readings of water sources.
Figure 1). Reduction and control of water loss was achieved through the application of a holistic strategy integral part of which is the establishment of a strategy for pipe break incidents (“pipe breaks policy”).
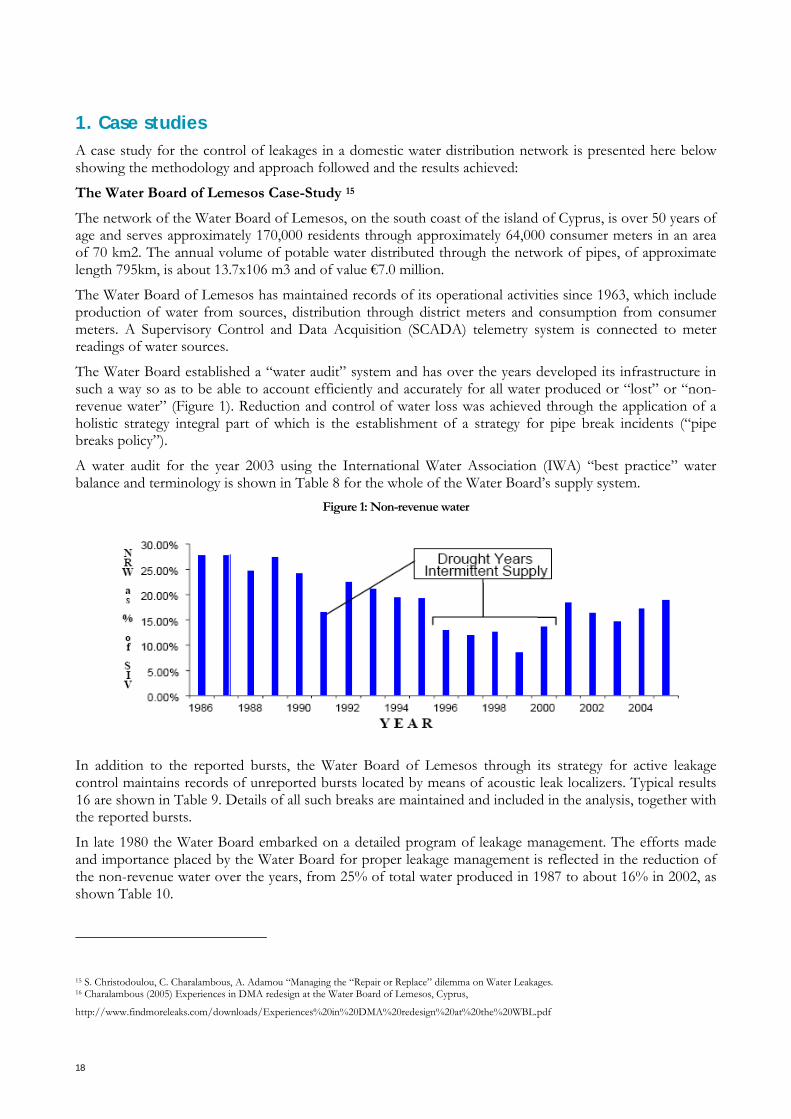
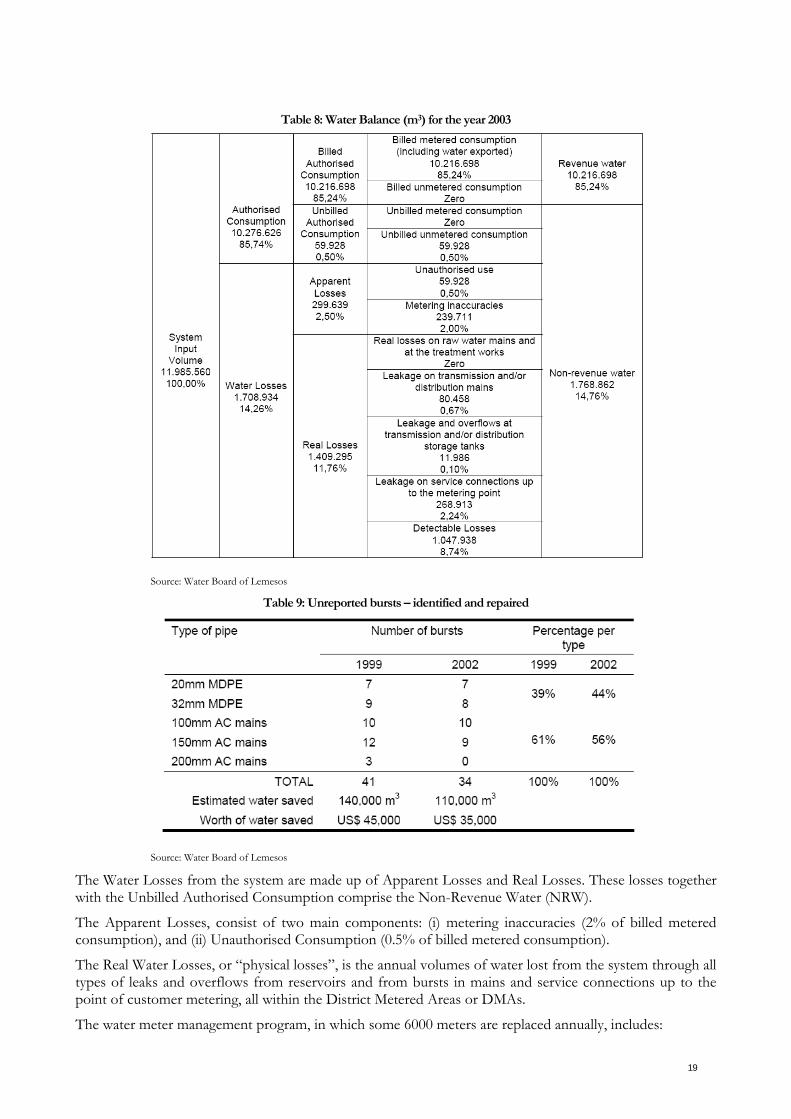
A water audit for the year 2003 using the International Water Association (IWA) “best practice” water balance and terminology is shown in Table 8 for the whole of the Water Board’s supply system.
Figure 1: Non-revenue water
In addition to the reported bursts, the Water Board of Lemesos through its strategy for active leakage control maintains records of unreported bursts located by means of acoustic leak localizers. Typical results 16 Table 9 are shown in . Details of all such breaks are maintained and included in the analysis, together with the reported bursts.
In late 1980 the Water Board embarked on a detailed program of leakage management. The efforts made and importance placed by the Water Board for proper leakage management is reflected in the reduction of the non-revenue water over the years, from 25% of total water produced in 1987 to about 16% in 2002, as shown Table 10.
15 S. Christodoulou, C. Charalambous, A. Adamou “Managing the “Repair or Replace” dilemma on Water Leakages. 16 Charalambous (2005) Experiences in DMA redesign at the Water Board of Lemesos, Cyprus,
http://www.findmoreleaks.com/downloads/Experiences%20in%20DMA%20redesign%20at%20the%20WBL.pdf
19
Table 8: Water Balance (m3) for the year 2003
Source: Water Board of Lemesos
Table 9: Unreported bursts – identified and repaired
Source: Water Board of Lemesos
The Water Losses from the system are made up of Apparent Losses and Real Losses. These losses together with the Unbilled Authorised Consumption comprise the Non-Revenue Water (NRW).
The Apparent Losses, consist of two main components: (i) metering inaccuracies (2% of billed metered consumption), and (ii) Unauthorised Consumption (0.5% of billed metered consumption).
The Real Water Losses, or “physical losses”, is the annual volumes of water lost from the system through all types of leaks and overflows from reservoirs and from bursts in mains and service connections up to the point of customer metering, all within the District Metered Areas or DMAs.
The water meter management program, in which some 6000 meters are replaced annually, includes:

20
• Periodical checking and replacement if necessary of all source, storage and DMA meters,
• Use of high accuracy domestic meters.
• Meter reading and billing error minimization with the use of portable meter reader recorders.
The DMA redesign and the application of pressure reduction has produced favourable results with both background leakage and locatable losses being reduced by approximately 38%. Furthermore the frequency of reported leaks was reduced by approximately 41%. The overall pressure reduction for the fifteen DMAs was of the order of 32%.
The target of the Water Board of Lemesos is to reduce the Non Revenue Water to about 8% of the system input volume, which is considered to be the economic level of leakage. The Water Board demand forecasts indicate an increase of approximately 30% by the year 2020 and the leakage reduction will go some way towards offsetting this increase in demand as well as a provide considerable cost saving.
Table 10: Non-revenue water expressed as a % of water production
YEAR Water Losses (%) YEAR Water Losses (%) YEAR Water Losses (%)
1985 22 1991 16 1997 12
1986 27 1992 23 1998 13
1987 27 1993 21 1999 8
1988 25 1994 19 2000 14
1989 27 1995 19 2001 18
1990 24 1996 13 2002 16 Source: Water Board of Lemesos
2. Method used of economic assesment The method used for the economic assessment of the potential financial savings has been based on the feasible water savings that could be derived from the control of leakage in domestic supply at the cost of the average desalinated water price currently applicable in Cyprus.
21
VI. Annexes
1. The Water efficiency index (total and by sector) (see excel file)
2. Comments on source, frequency and data availability, coverage, access, etc. (see excel file)
22
List of Tables Table 1: The priority actions and costs to improve the collection of basic data and the production of the efficiency indices various components ................................................................................................ 7Table 2: NRW for selected Municipalities/Communities and the Water Boards as per the Auditor General’s reports for 2001-2005 .................................................................................................................... 10Table 3: Consumption (invoiced) water for domestic/irrigation from the Government Water Works and the respective total supply of water to the distribution network (all in million m3) .......... 11Table 4: Non revenue consumption or Loss (in %) as reported by the Water Boards of the main cities of the island ............................................................................................................................................ 12Table 5: Budgeted Government expenditure (2007) for domestic supply network replacement and improvement .................................................................................................................................................... 12Table 6: Installation of improved irrigation systems 1965-2000 through the Water Use Improvement Project ...................................................................................................................................... 13Table 7: Irrigated land at various irrigation systems (hax103) and field irrigation efficiency (%) ........ 14Table 8: Water Balance (m3) for the year 2003 ............................................................................................ 19Table 9: Unreported bursts – identified and repaired ................................................................................ 19Table 10: Non-revenue water expressed as a % of water production ..................................................... 20

23
List of Figures
Figure 1: Non-revenue water ......................................................................................................................... 18


