40
EWRI Congress – May 24, 2012 Ian Paton, P.E., M. ASCE T. Andrew Earles, Ph.D., P.E., M. ASCE Shannon Tillack, EI Wright Water Engineers, Inc.
| Date post: | 14-Apr-2017 |
| Category: |
Technology |
| Upload: | aearles |
| View: | 222 times |
| Download: | 0 times |
EWRI Congress – May 24, 2012
Ian Paton, P.E., M. ASCET. Andrew Earles, Ph.D., P.E., M. ASCE
Shannon Tillack, EI
Wright Water Engineers, Inc.
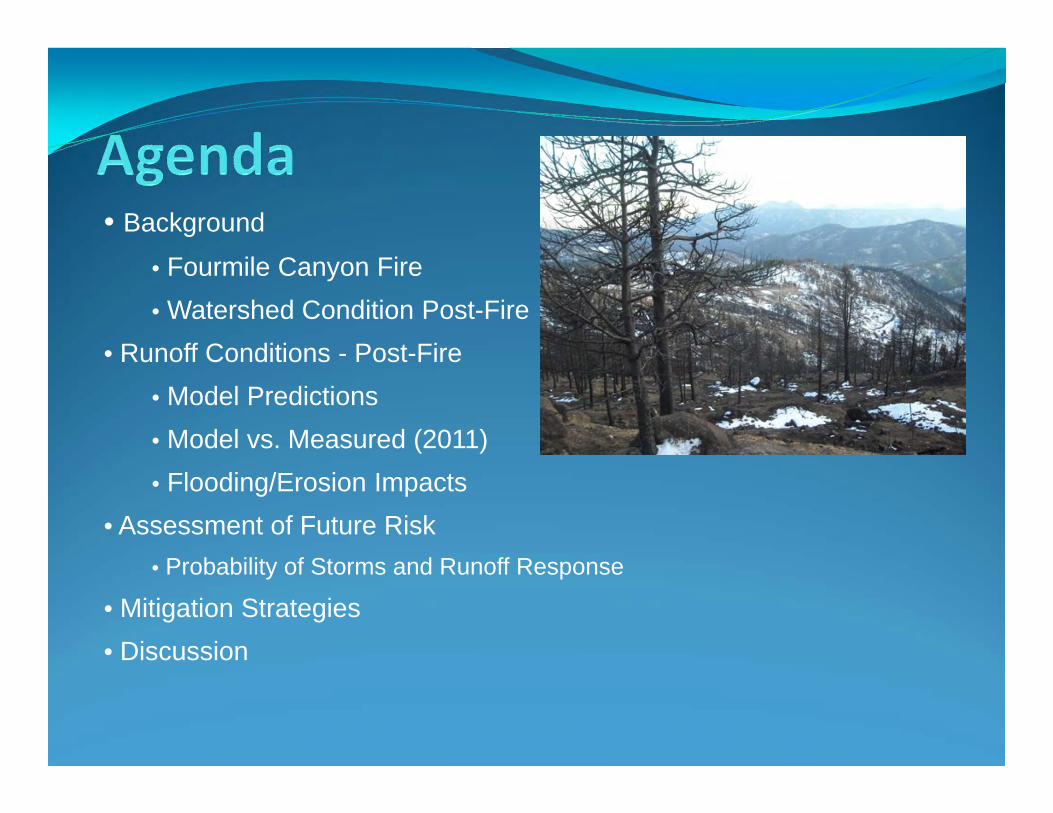
• Background
• Fourmile Canyon Fire• Watershed Condition Post-Fire
• Runoff Conditions - Post-Fire• Model Predictions• Model vs. Measured (2011)• Flooding/Erosion Impacts
• Assessment of Future Risk• Probability of Storms and Runoff Response
• Mitigation Strategies• Discussion
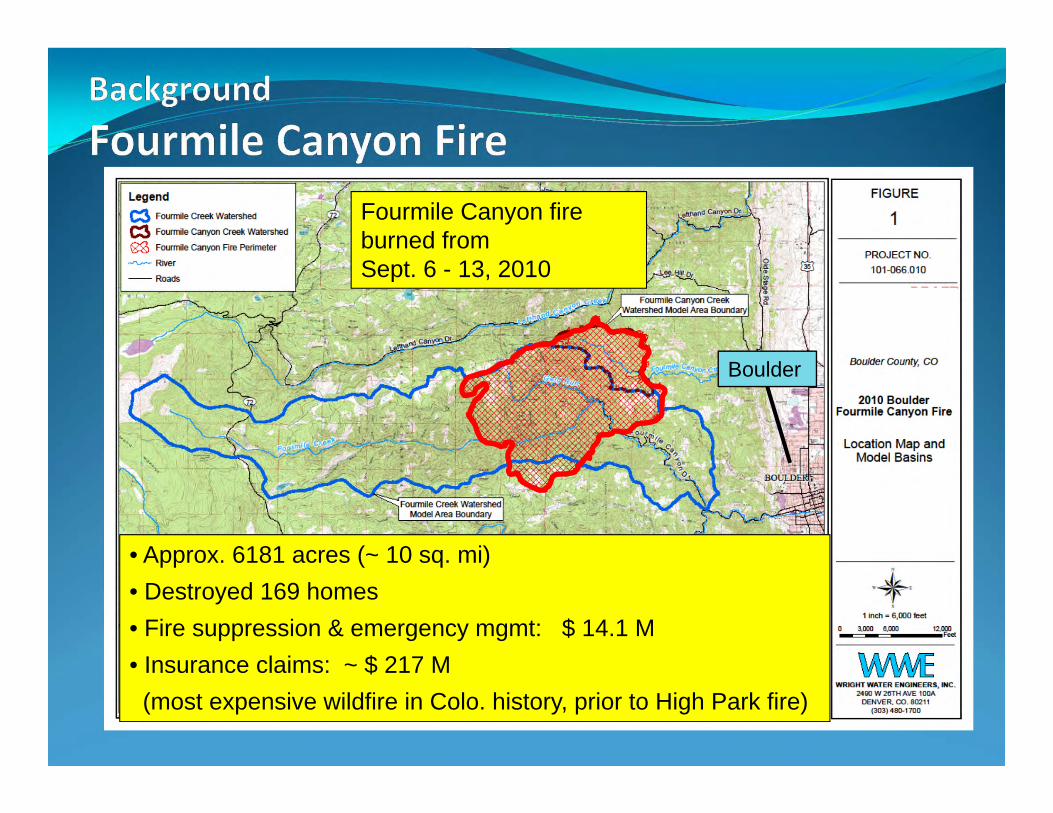
Boulder
Fourmile Canyon fire burned from Sept. 6 - 13, 2010
• Approx. 6181 acres (~ 10 sq. mi)• Destroyed 169 homes• Fire suppression & emergency mgmt: $ 14.1 M• Insurance claims: ~ $ 217 M
(most expensive wildfire in Colo. history, prior to High Park fire)
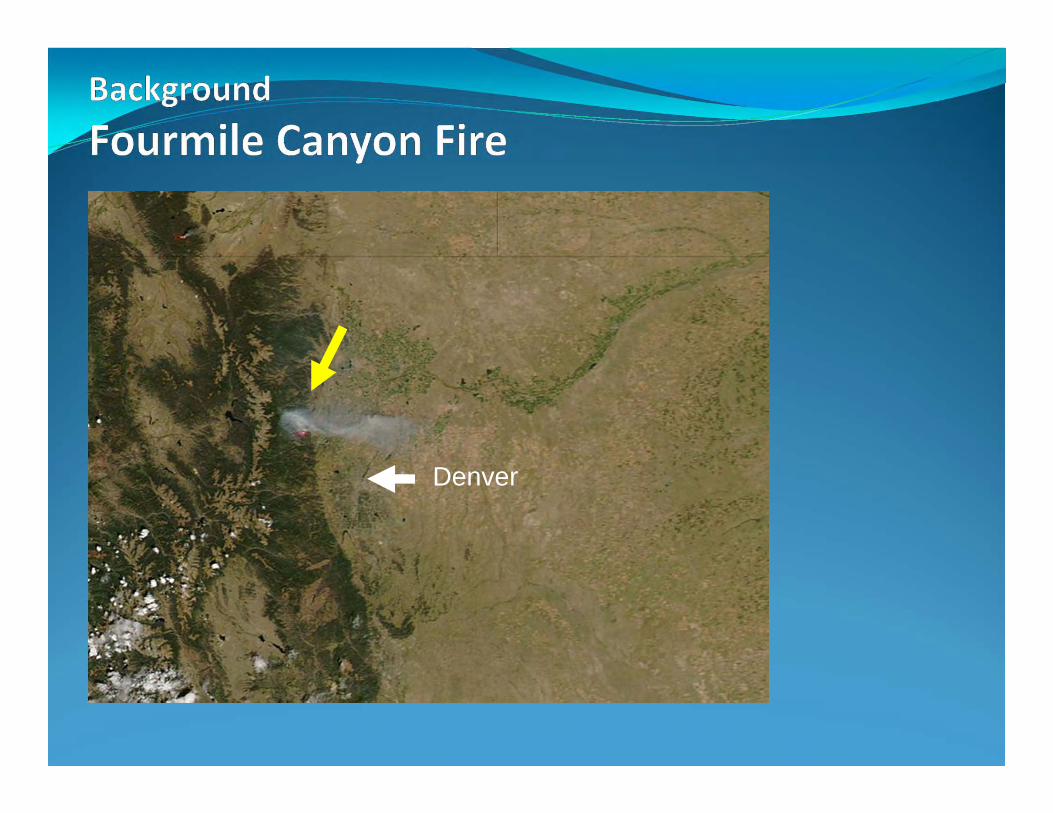
Denver
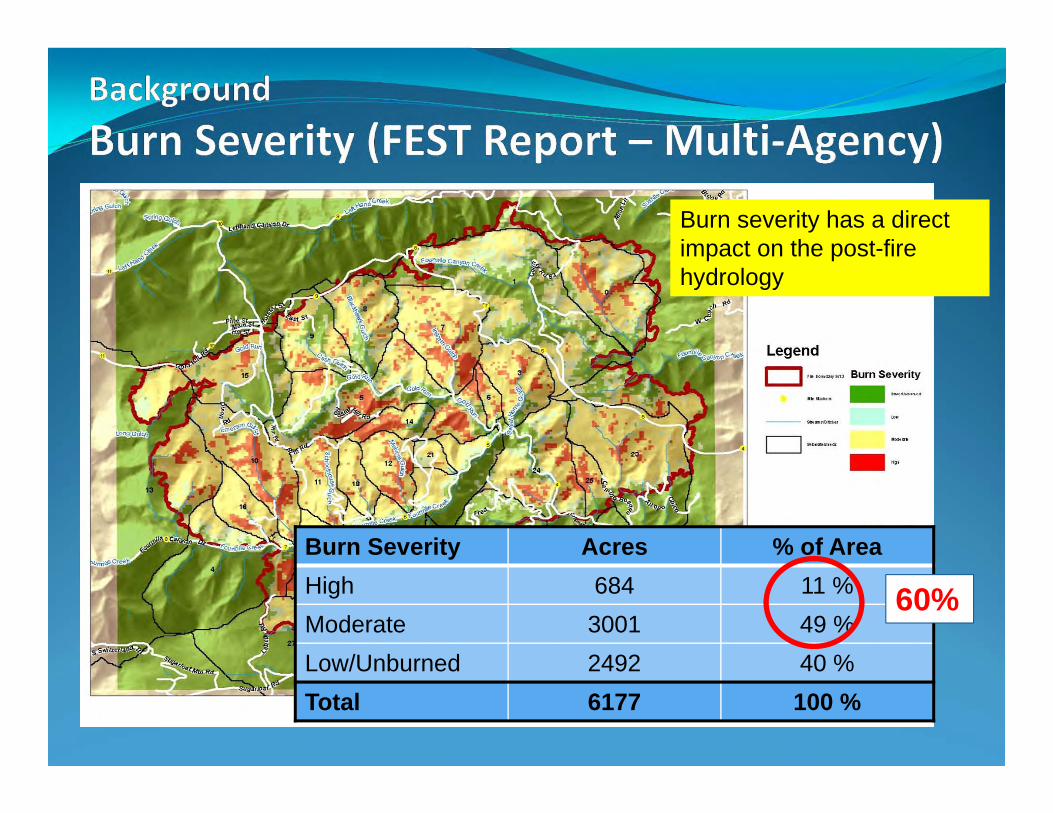
Burn Severity Acres % of AreaHigh 684 11 %Moderate 3001 49 %Low/Unburned 2492 40 %Total 6177 100 %
60%
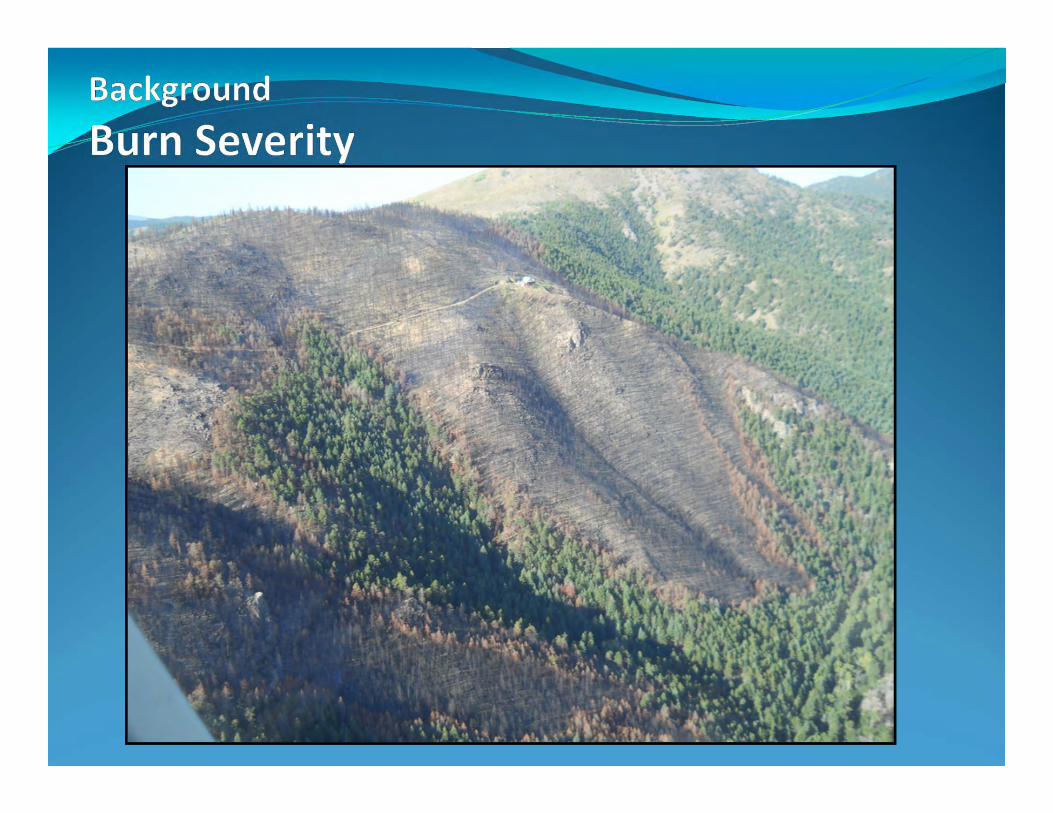
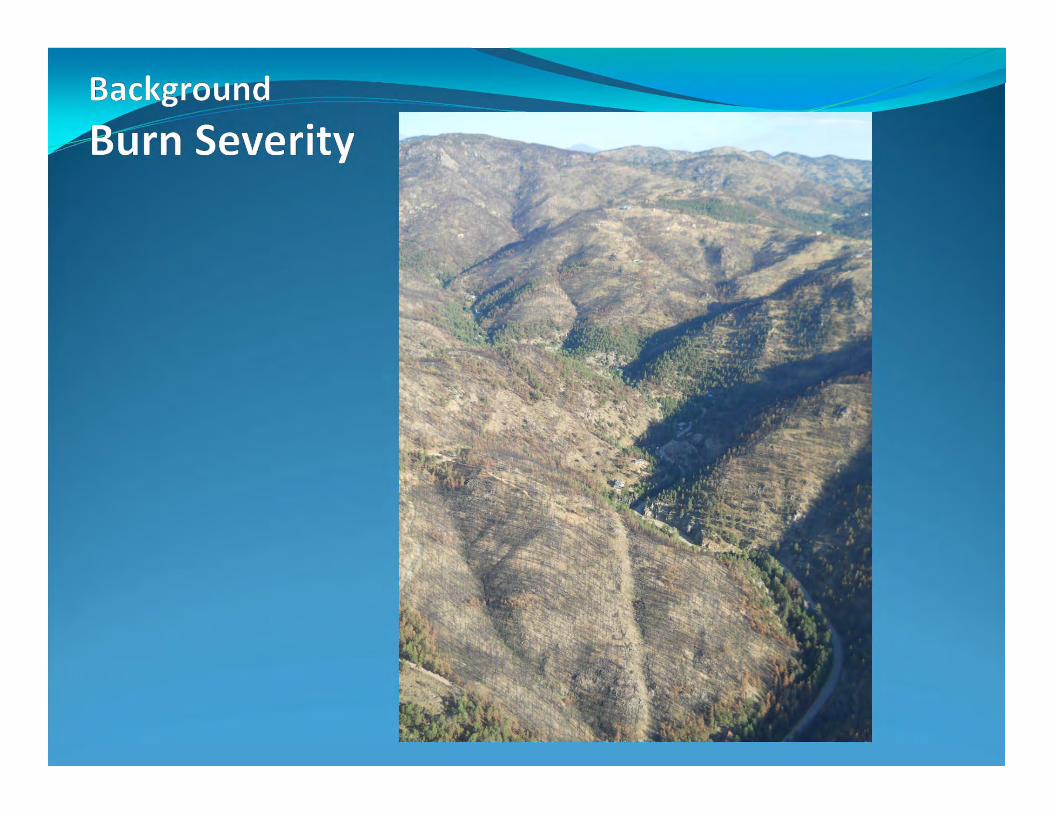
Burn severity has a direct impact on the post-fire hydrology
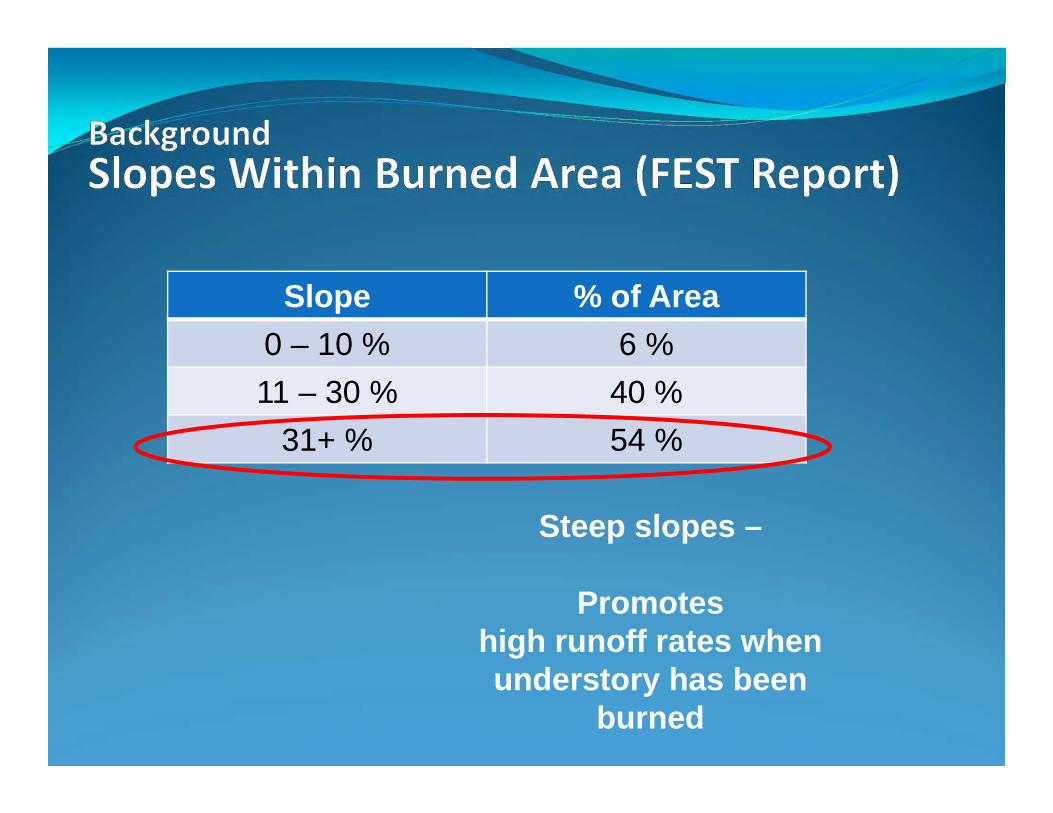
Slope % of Area0 – 10 % 6 %11 – 30 % 40 %
31+ % 54 %
Steep slopes –
Promotes high runoff rates when understory has been
burned
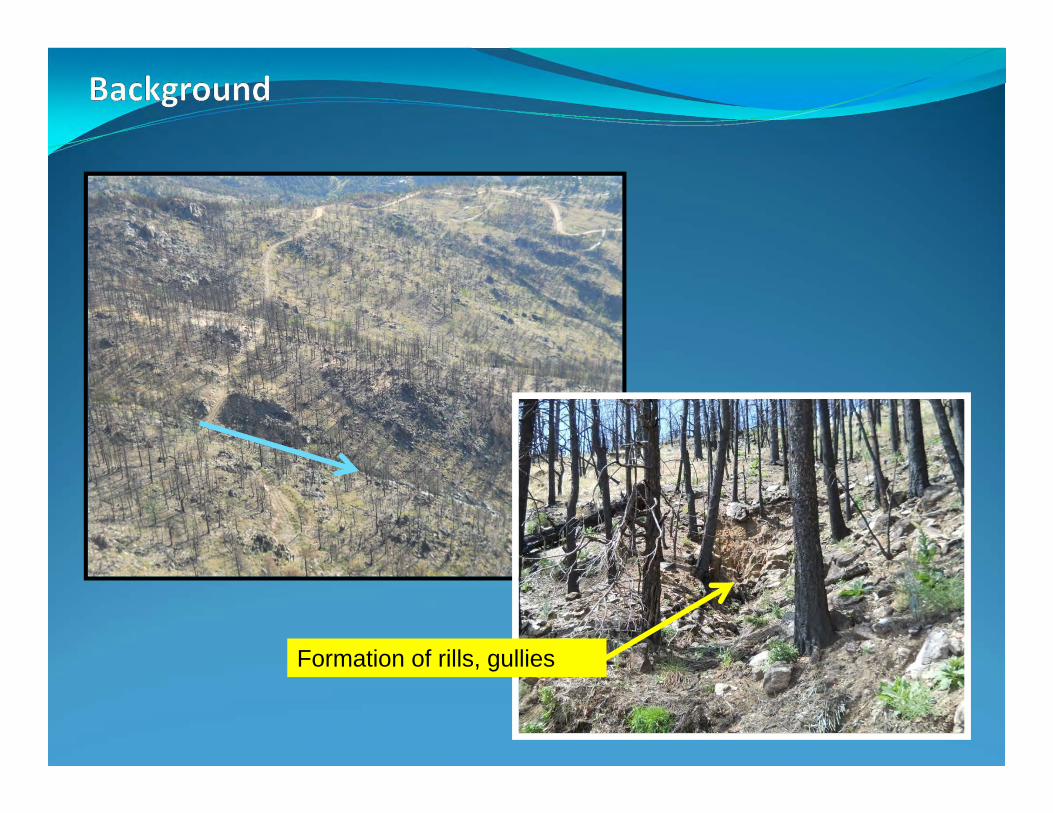
Formation of rills, gullies
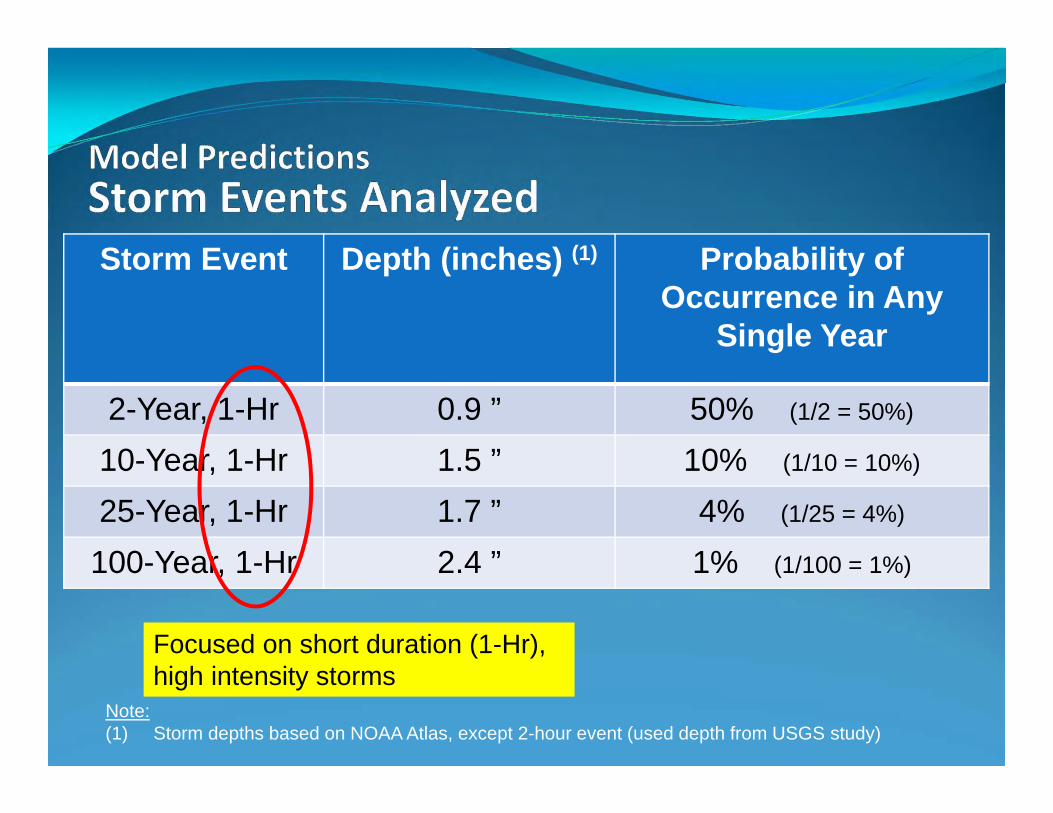
Storm Event Depth (inches) (1) Probability of Occurrence in Any
Single Year
2-Year, 1-Hr 0.9 ” 50% (1/2 = 50%)
10-Year, 1-Hr 1.5 ” 10% (1/10 = 10%)
25-Year, 1-Hr 1.7 ” 4% (1/25 = 4%)
100-Year, 1-Hr 2.4 ” 1% (1/100 = 1%)
Note:(1) Storm depths based on NOAA Atlas, except 2-hour event (used depth from USGS study)
Focused on short duration (1-Hr), high intensity storms
0
3
10121811
7
16 23
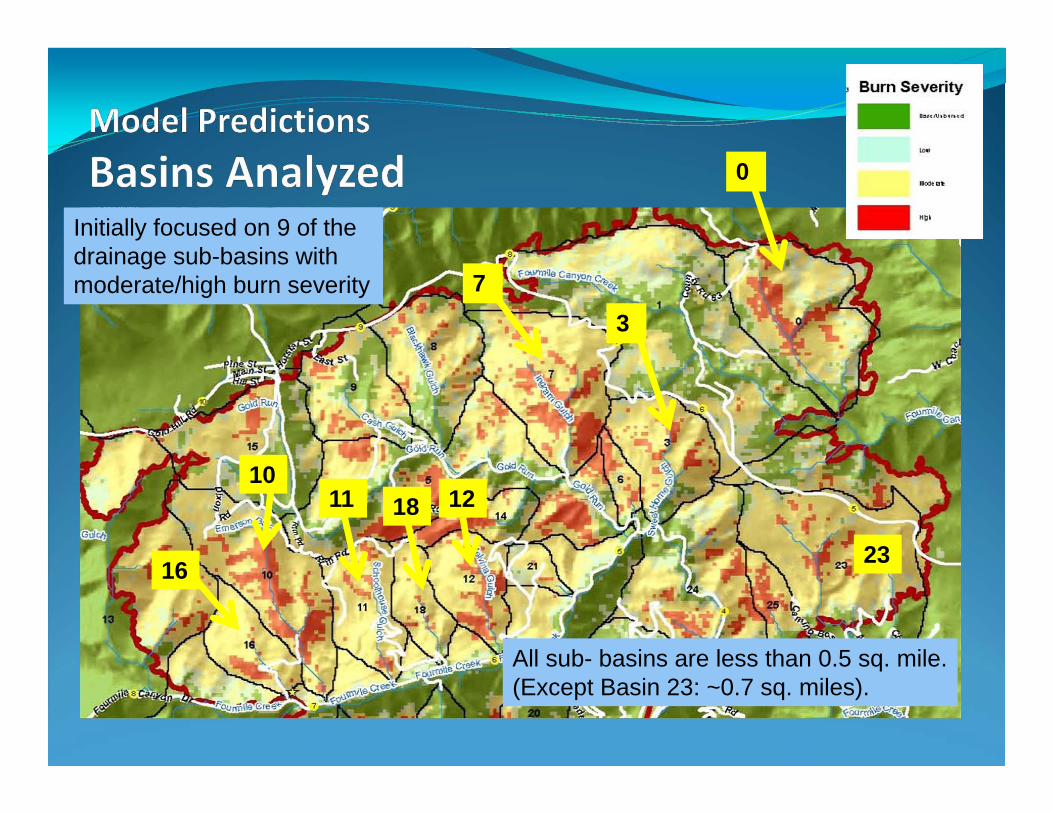
Initially focused on 9 of the drainage sub-basins with moderate/high burn severity
All sub- basins are less than 0.5 sq. mile. (Except Basin 23: ~0.7 sq. miles).
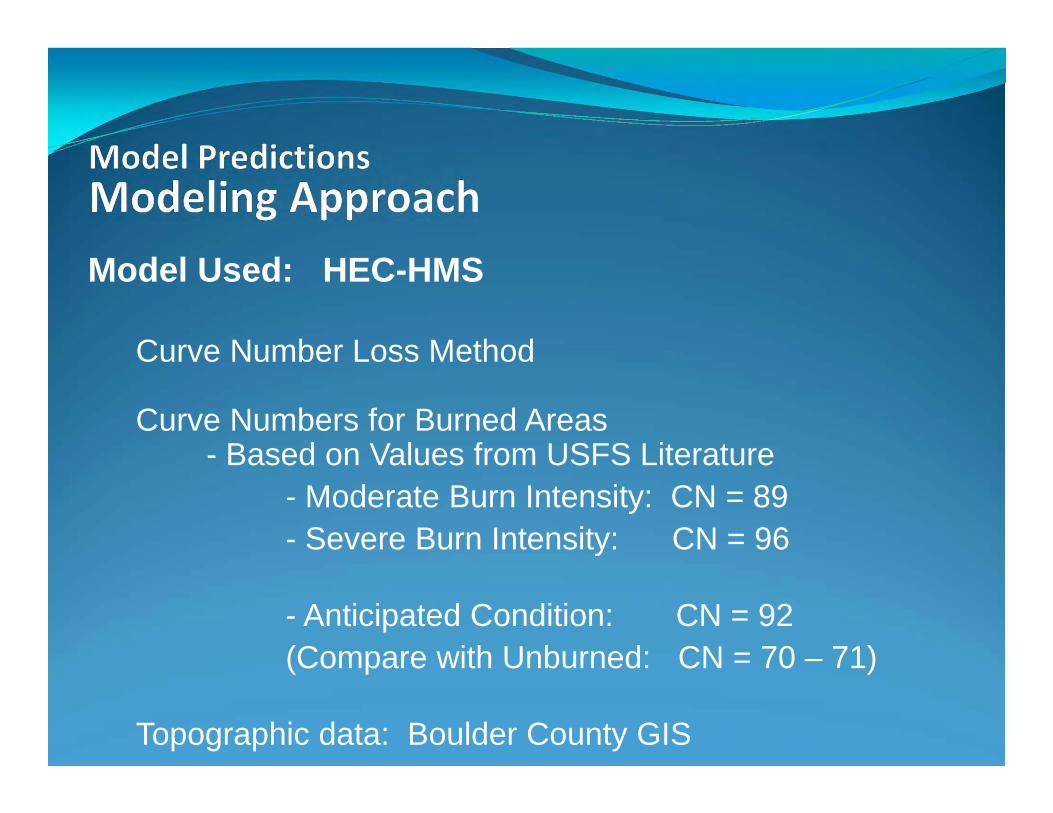
Model Used: HEC-HMS
Curve Number Loss Method
Curve Numbers for Burned Areas- Based on Values from USFS Literature
- Moderate Burn Intensity: CN = 89- Severe Burn Intensity: CN = 96
- Anticipated Condition: CN = 92(Compare with Unburned: CN = 70 – 71)
Topographic data: Boulder County GIS
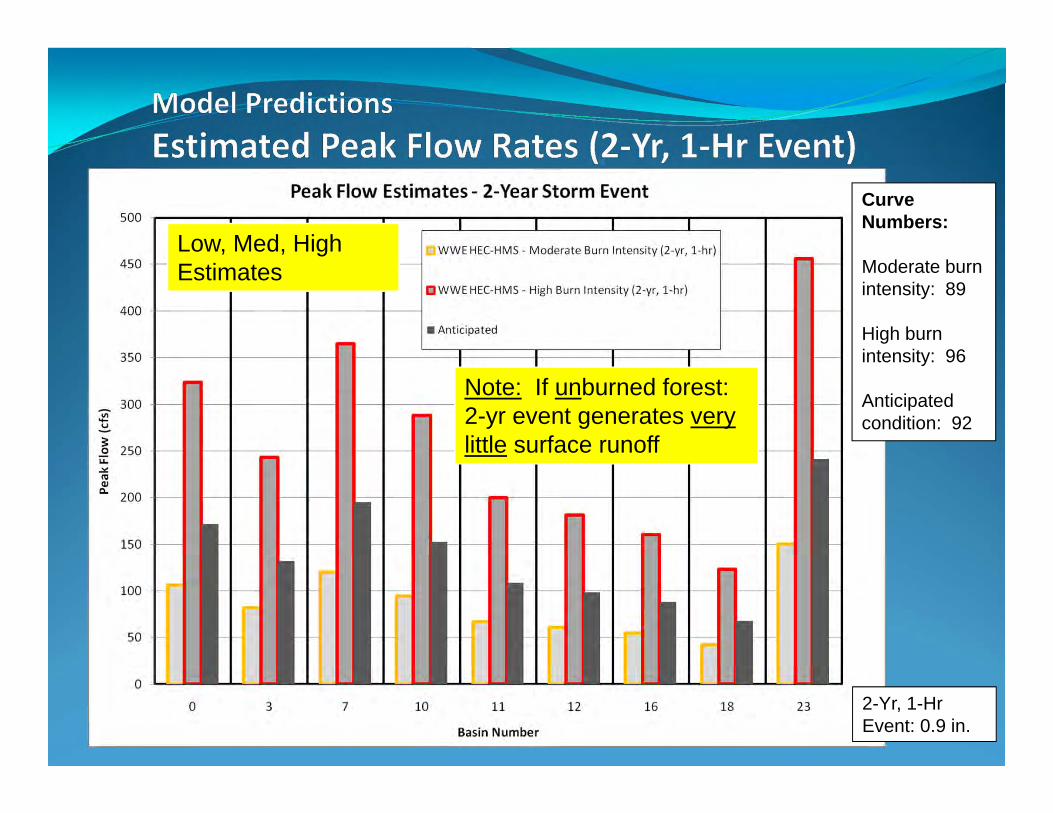
2-Yr, 1-Hr Event: 0.9 in.
Curve Numbers:
Moderate burn intensity: 89
High burn intensity: 96
Anticipated condition: 92
Low, Med, High Estimates
Note: If unburned forest: 2-yr event generates verylittle surface runoff
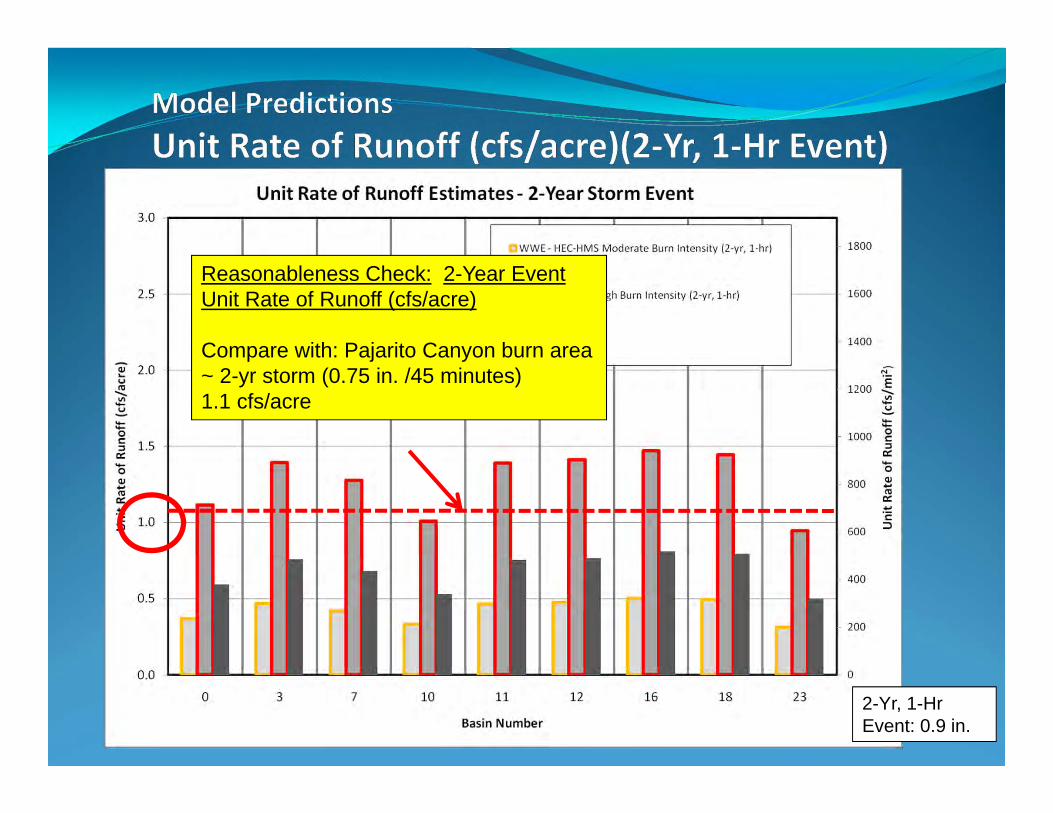
Reasonableness Check: 2-Year EventUnit Rate of Runoff (cfs/acre)
Compare with: Pajarito Canyon burn area~ 2-yr storm (0.75 in. /45 minutes)1.1 cfs/acre
2-Yr, 1-Hr Event: 0.9 in.
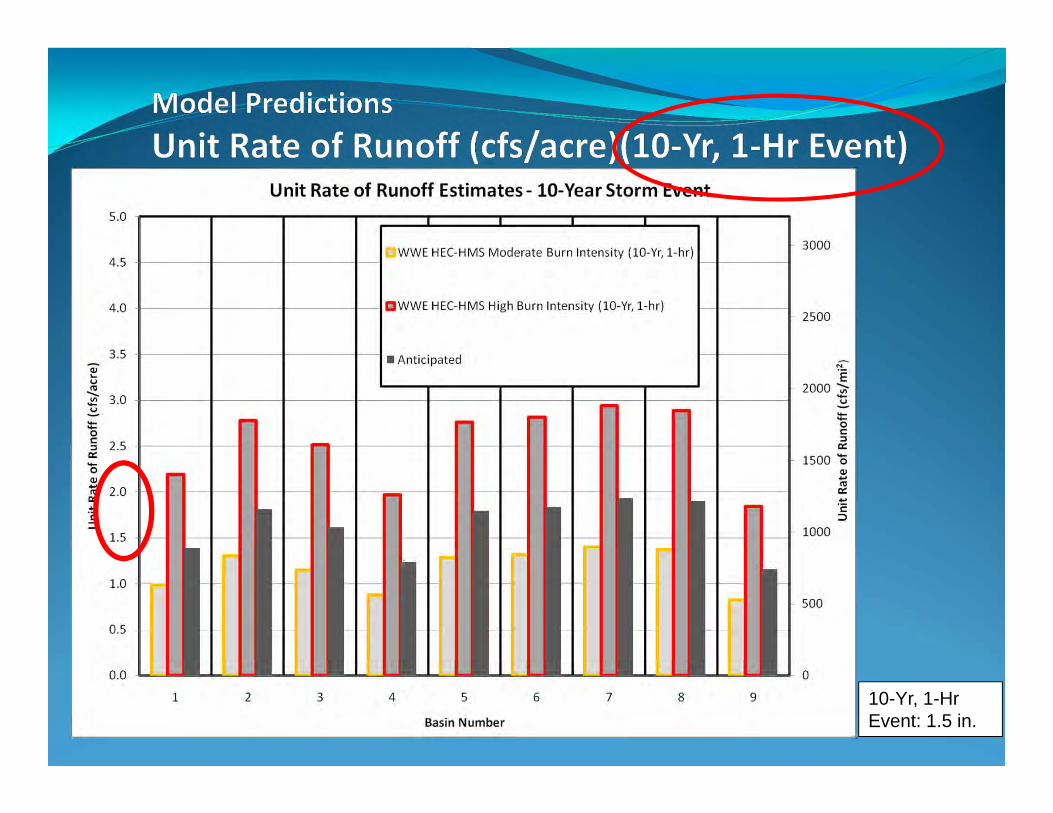
10-Yr, 1-Hr Event: 1.5 in.
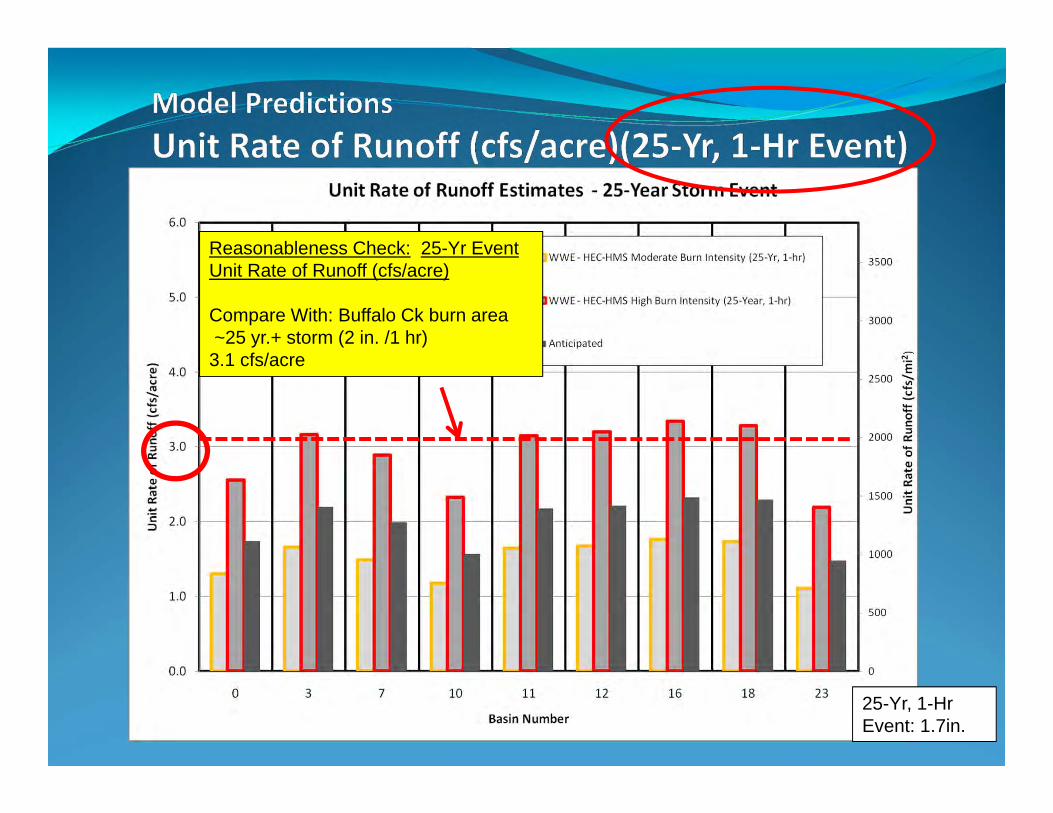
Reasonableness Check: 25-Yr EventUnit Rate of Runoff (cfs/acre)
Compare With: Buffalo Ck burn area ~25 yr.+ storm (2 in. /1 hr)
3.1 cfs/acre
25-Yr, 1-Hr Event: 1.7in.
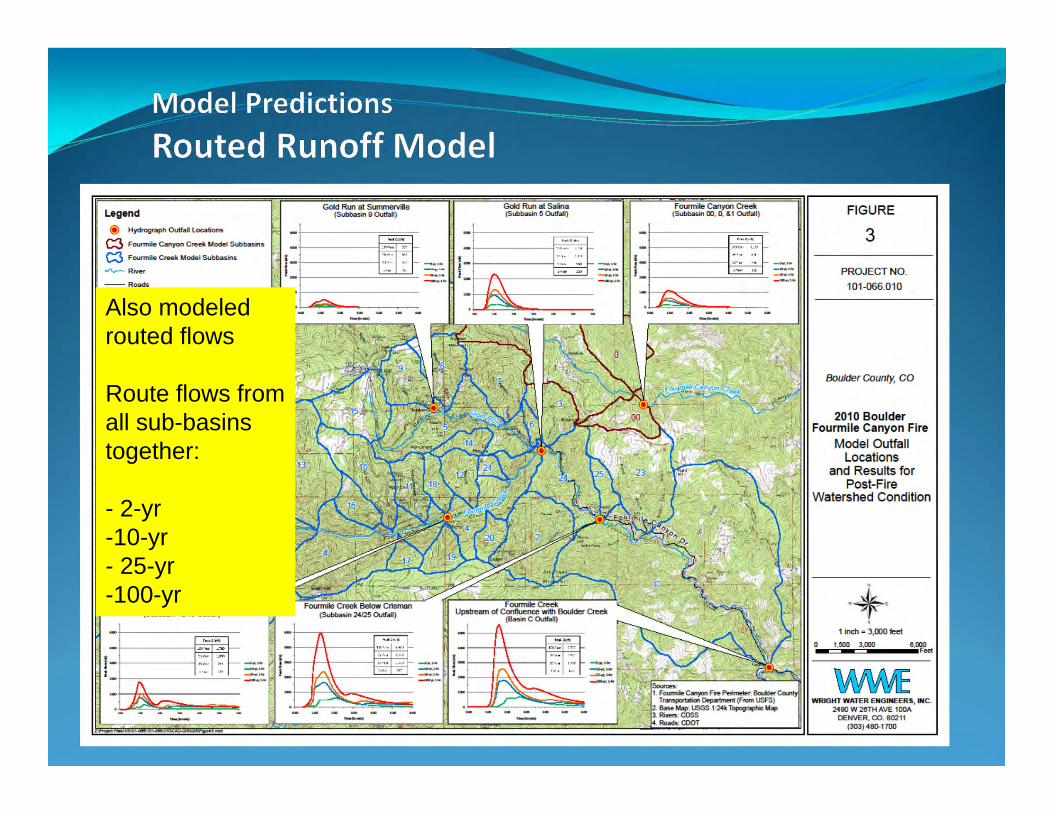
Also modeled routed flows
Route flows from all sub-basins together:
- 2-yr-10-yr- 25-yr-100-yr
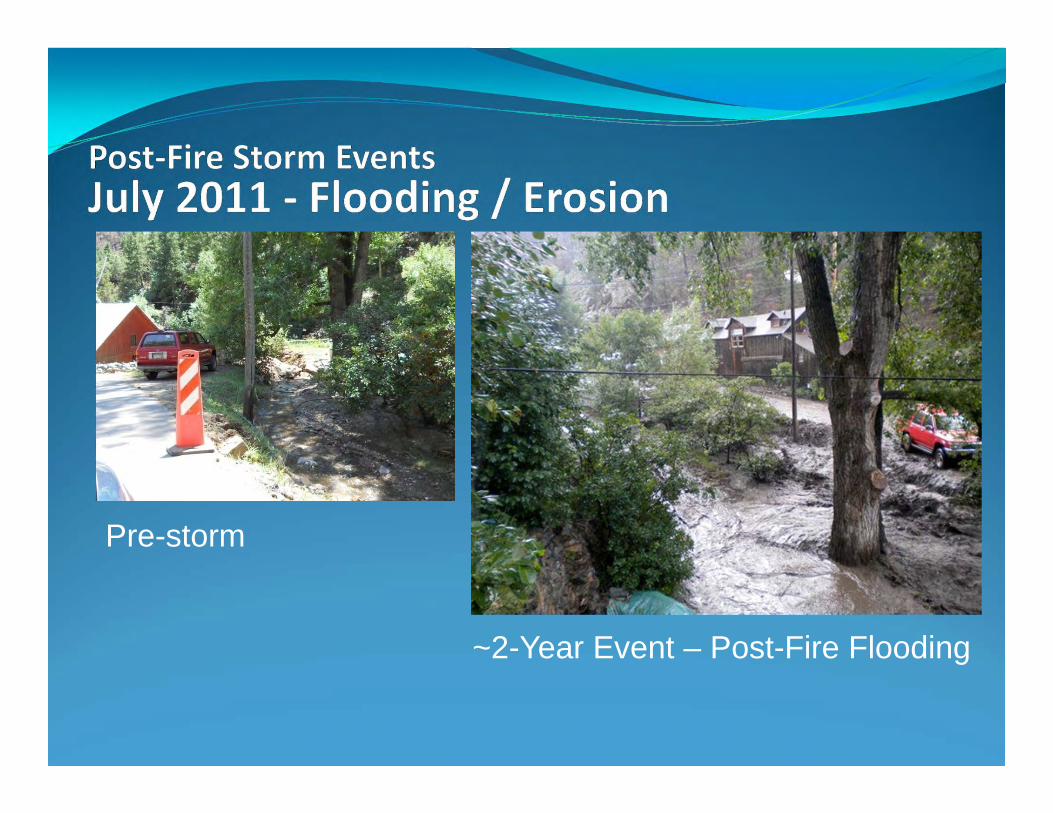
Pre-storm
~2-Year Event – Post-Fire Flooding
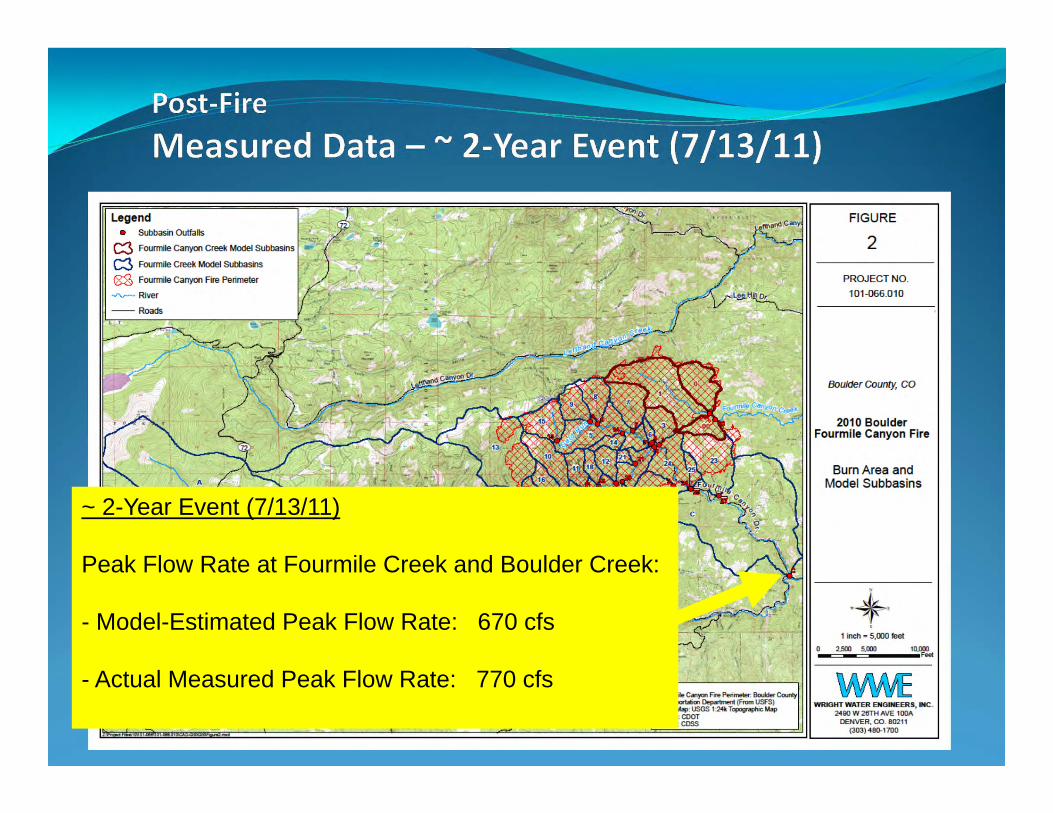
~ 2-Year Event (7/13/11)
Peak Flow Rate at Fourmile Creek and Boulder Creek:
- Model-Estimated Peak Flow Rate: 670 cfs
- Actual Measured Peak Flow Rate: 770 cfs
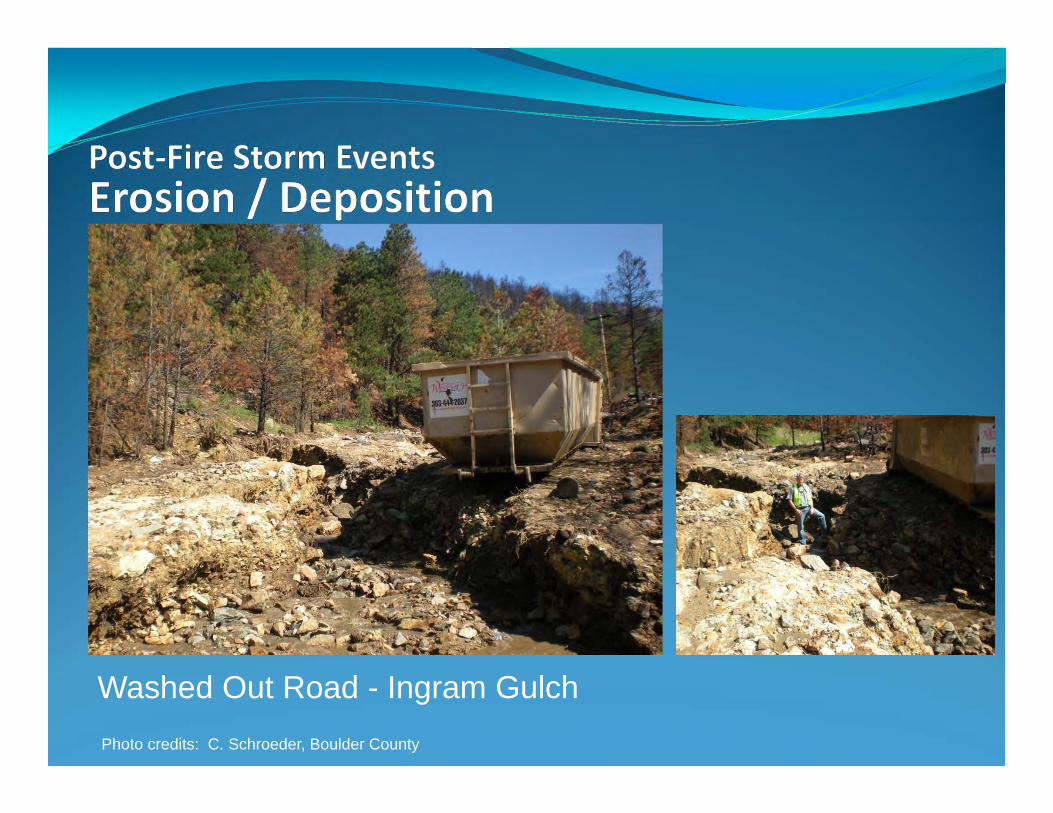
Photo credits: C. Schroeder, Boulder County
Washed Out Road - Ingram Gulch
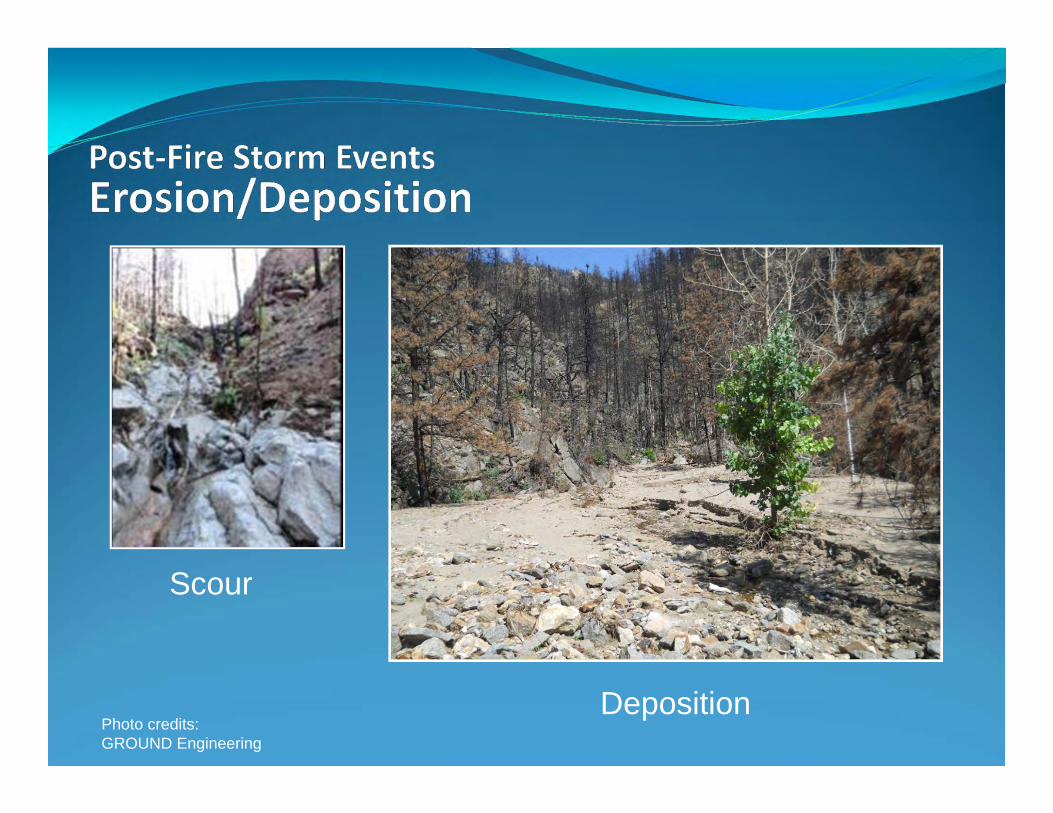
Photo credits: GROUND Engineering
Scour
Deposition
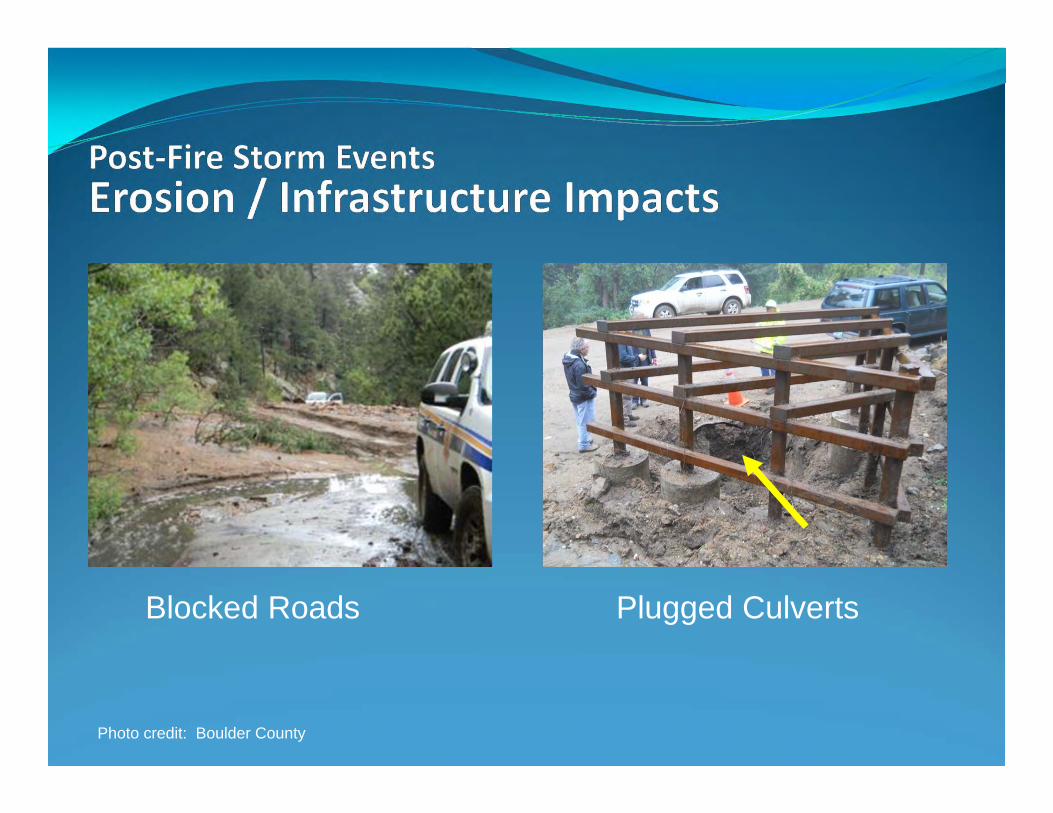
Photo credit: Boulder County
Blocked Roads Plugged Culverts
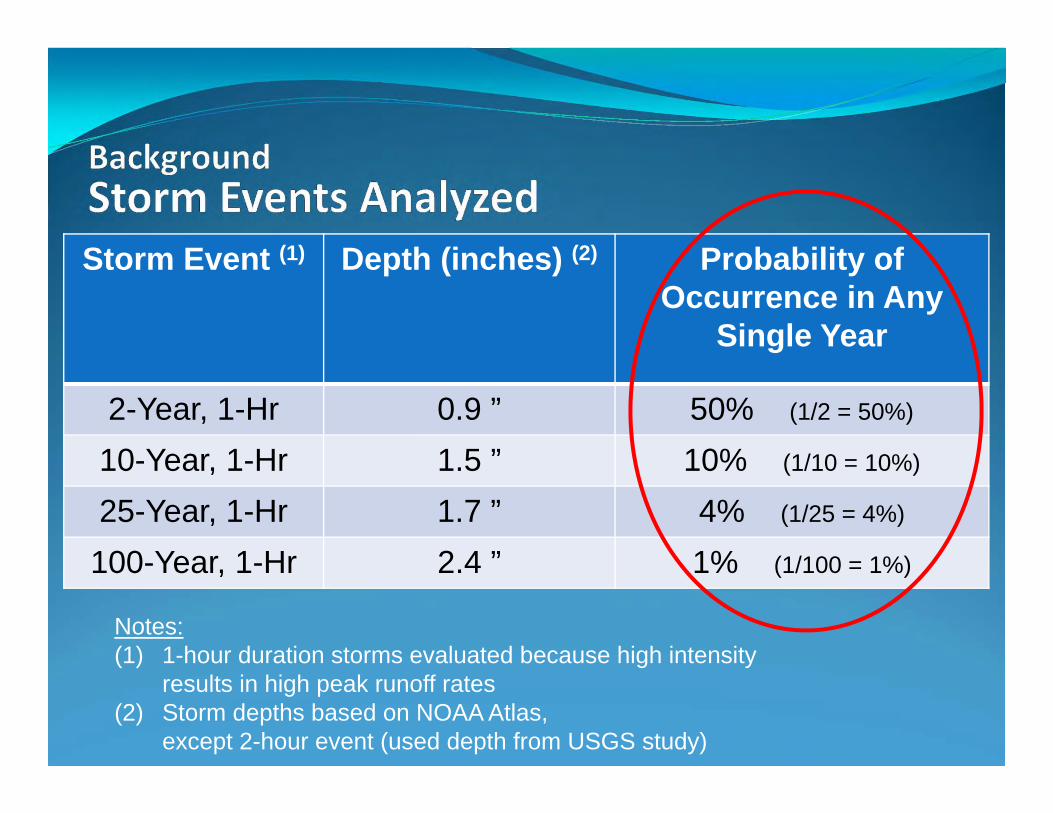
Storm Event (1) Depth (inches) (2) Probability of Occurrence in Any
Single Year
2-Year, 1-Hr 0.9 ” 50% (1/2 = 50%)
10-Year, 1-Hr 1.5 ” 10% (1/10 = 10%)
25-Year, 1-Hr 1.7 ” 4% (1/25 = 4%)
100-Year, 1-Hr 2.4 ” 1% (1/100 = 1%)
Notes:(1) 1-hour duration storms evaluated because high intensity
results in high peak runoff rates(2) Storm depths based on NOAA Atlas,
except 2-hour event (used depth from USGS study)
0%
10%
20%
30%
40%
50%
60%
70%
80%
90%
100%
0 1 2 3 4 5 6 7 8 9 10
Pro
bability
Years After Fire
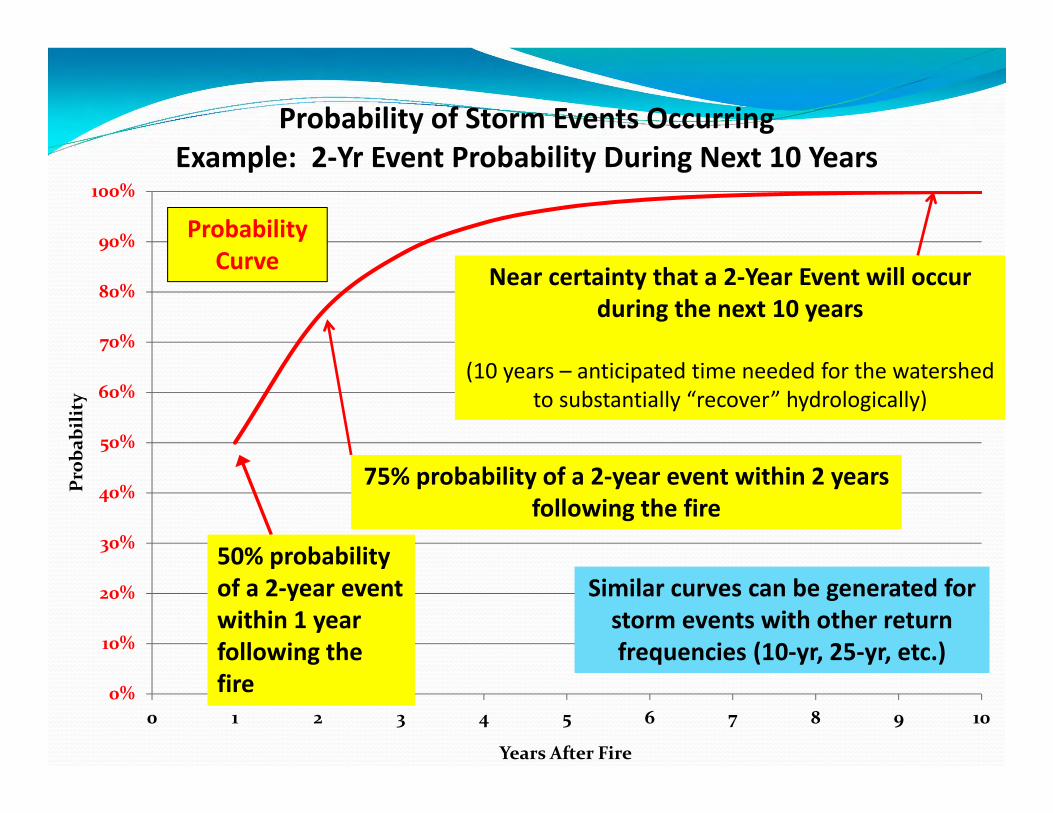
Probability of Storm Events Occurring Example: 2‐Yr Event Probability During Next 10 Years
Probability Curve Near certainty that a 2‐Year Event will occur
during the next 10 years
(10 years – anticipated time needed for the watershed to substantially “recover” hydrologically)
50% probability of a 2‐year event within 1 year following the fire
75% probability of a 2‐year event within 2 years following the fire
Similar curves can be generated for storm events with other return frequencies (10‐yr, 25‐yr, etc.)
1.02.03.04.05.06.07.08.09.010.011.012.013.014.015.016.017.018.019.020.0
0 1 2 3 4 5 6 7 8 9 10
Qbu
rned
/Qpr
e
Years After Fire
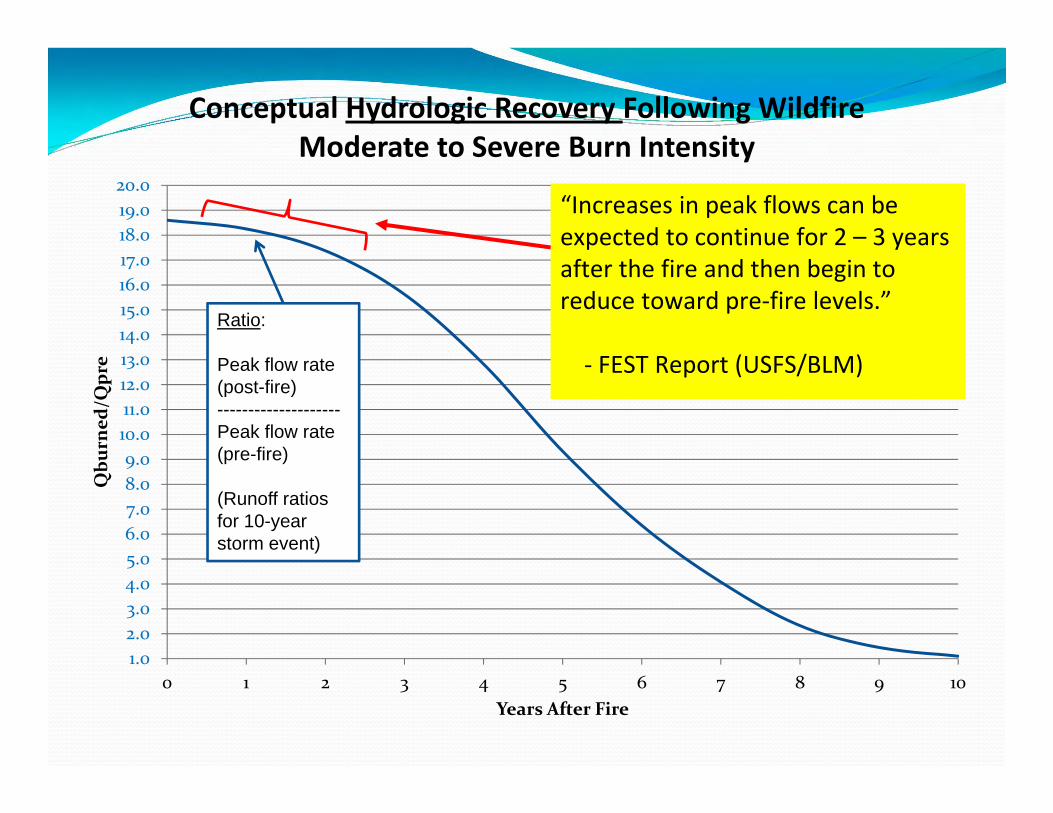
Conceptual Hydrologic Recovery Following Wildfire Moderate to Severe Burn Intensity
“Increases in peak flows can be expected to continue for 2 – 3 years after the fire and then begin to reduce toward pre‐fire levels.”
‐ FEST Report (USFS/BLM)
Ratio:
Peak flow rate (post-fire)--------------------Peak flow rate (pre-fire)
(Runoff ratios for 10-year storm event)
0%
10%
20%
30%
40%
50%
60%
70%
80%
90%
100%
1.02.03.04.05.06.07.08.09.010.011.012.013.014.015.016.017.018.019.020.0
0 1 2 3 4 5 6 7 8 9 10
Pro
bability of A
t Lea
st O
ne 10‐yea
r Eve
nt D
uring Time Pe
riod
Qbu
rned
/Qpr
e
Years After Fire
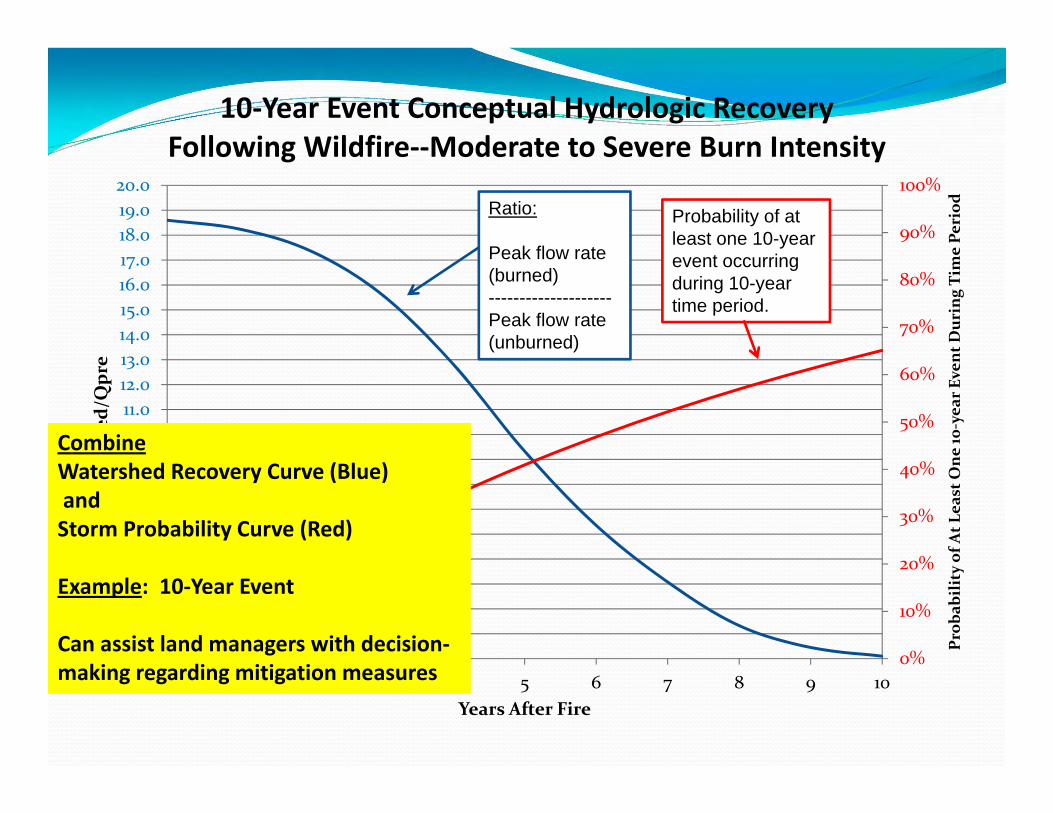
10‐Year Event Conceptual Hydrologic Recovery Following Wildfire‐‐Moderate to Severe Burn Intensity
Probability of at least one 10-year event occurring during 10-year time period.
Ratio:
Peak flow rate (burned)--------------------Peak flow rate (unburned)
Combine Watershed Recovery Curve (Blue)and Storm Probability Curve (Red)
Example: 10‐Year Event
Can assist land managers with decision‐making regarding mitigation measures
0%
10%
20%
30%
40%
50%
60%
70%
80%
90%
100%
1.02.03.04.05.06.07.08.09.010.011.012.013.014.015.016.017.018.019.020.0
0 1 2 3 4 5 6 7 8 9 10
Pro
bability of A
t Lea
st O
ne 10‐yea
r Eve
nt D
uring Time Pe
riod
Qbu
rned
/Qpr
e
Years After Fire
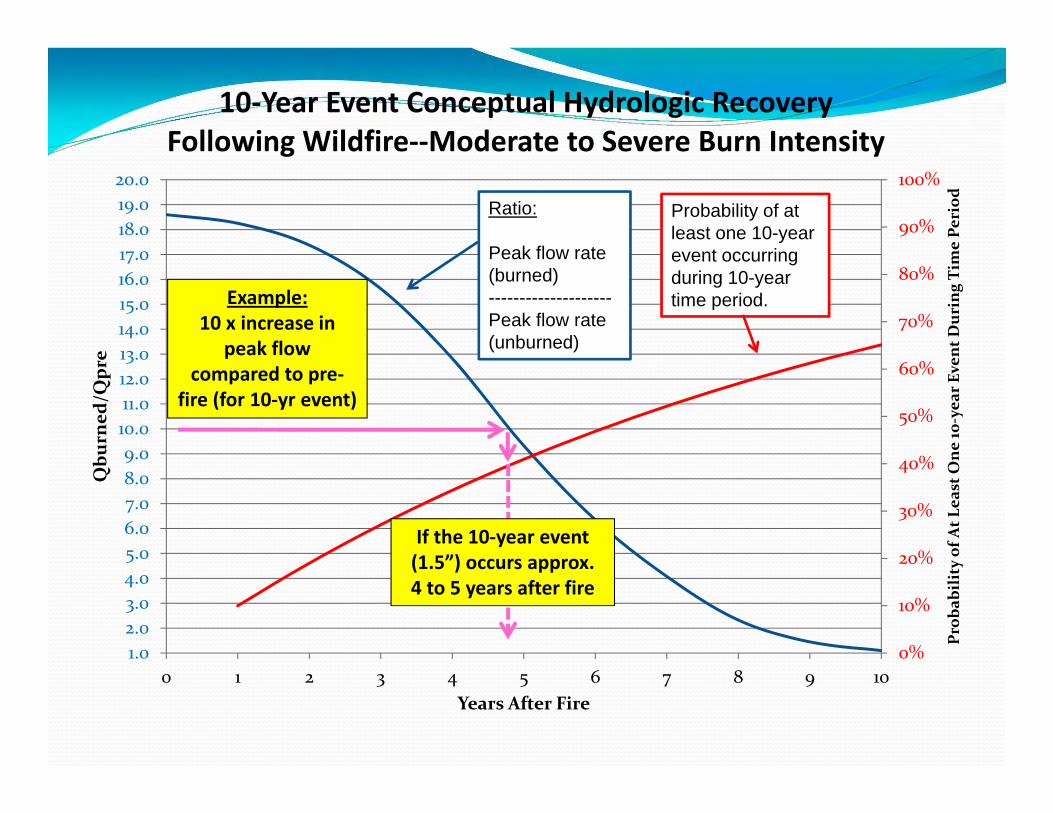
10‐Year Event Conceptual Hydrologic Recovery Following Wildfire‐‐Moderate to Severe Burn Intensity
Probability of at least one 10-year event occurring during 10-year time period.
Ratio:
Peak flow rate (burned)--------------------Peak flow rate (unburned)
If the 10‐year event (1.5”) occurs approx.4 to 5 years after fire
Example:10 x increase in
peak flow compared to pre‐
fire (for 10‐yr event)
0%
10%
20%
30%
40%
50%
60%
70%
80%
90%
100%
1.02.03.04.05.06.07.08.09.010.011.012.013.014.015.016.017.018.019.020.0
0 1 2 3 4 5 6 7 8 9 10
Pro
bability of A
t Lea
st O
ne 10‐yea
r Eve
nt D
uring Time Pe
riod
Qbu
rned
/Qpr
e
Years After Fire
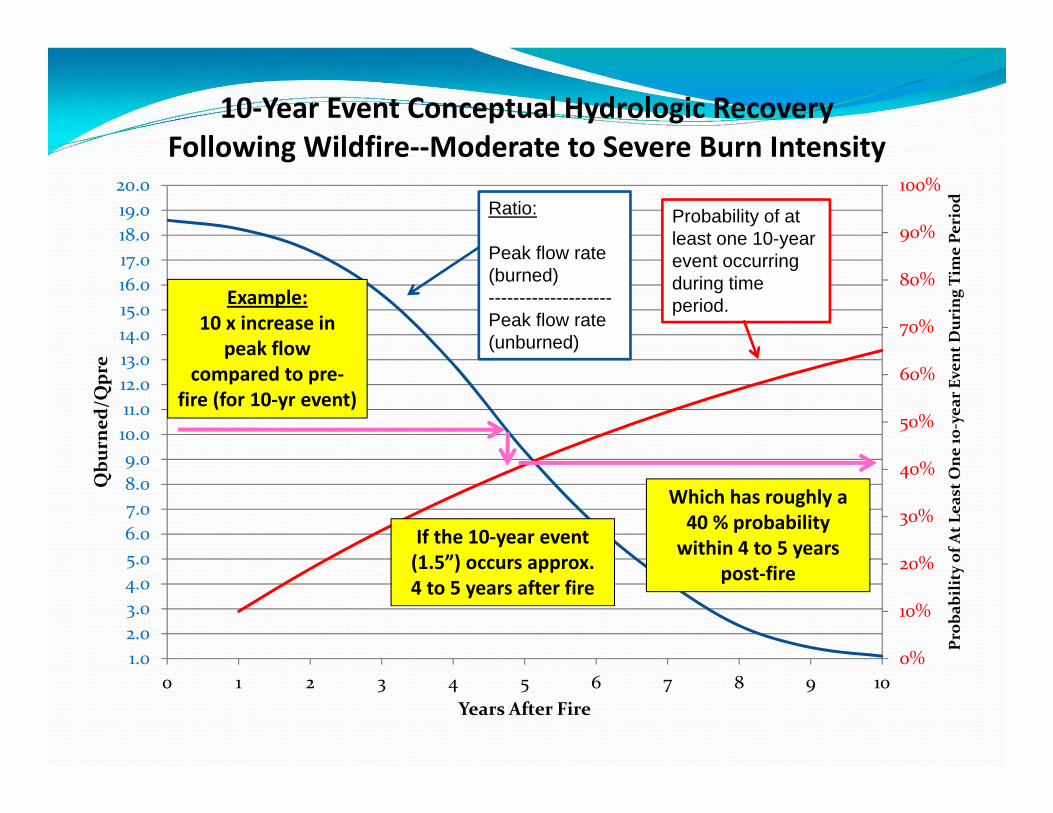
10‐Year Event Conceptual Hydrologic Recovery Following Wildfire‐‐Moderate to Severe Burn Intensity
Probability of at least one 10-year event occurring during time period.
Which has roughly a 40 % probability within 4 to 5 years
post‐fire
Ratio:
Peak flow rate (burned)--------------------Peak flow rate (unburned)
If the 10‐year event (1.5”) occurs approx.4 to 5 years after fire
Example:10 x increase in
peak flow compared to pre‐
fire (for 10‐yr event)
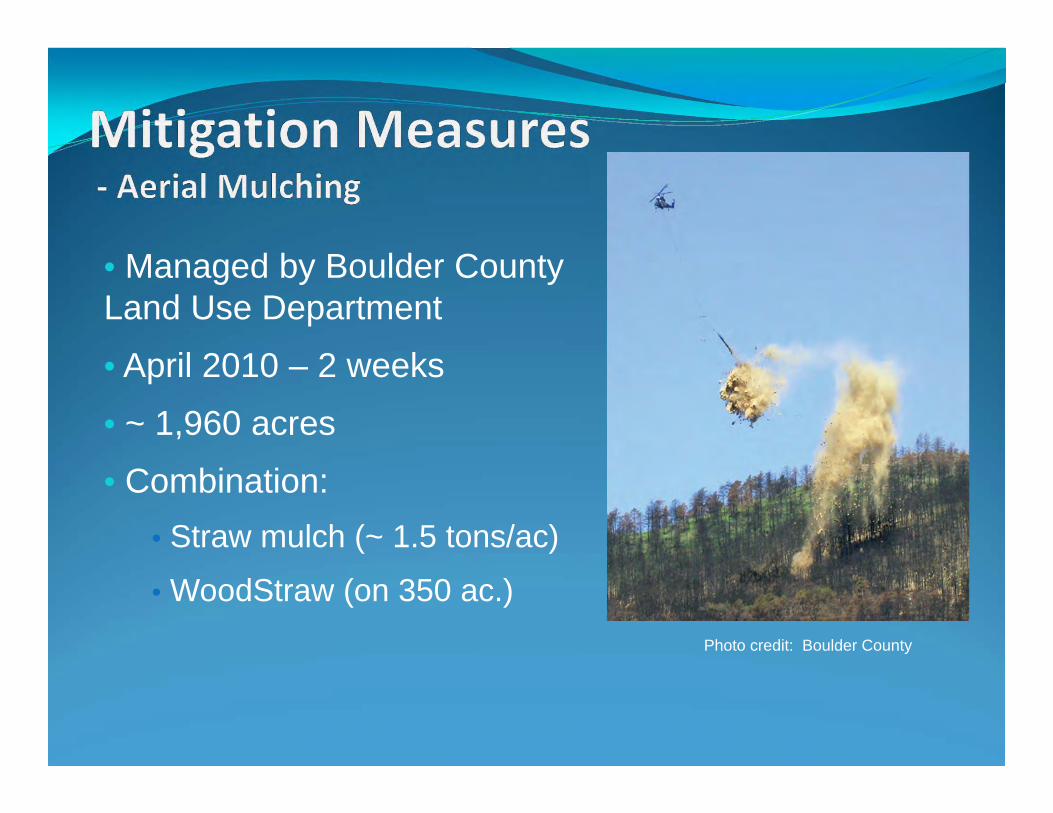
• Managed by Boulder County Land Use Department
• April 2010 – 2 weeks
• ~ 1,960 acres
• Combination:• Straw mulch (~ 1.5 tons/ac)
• WoodStraw (on 350 ac.)Photo credit: Boulder County
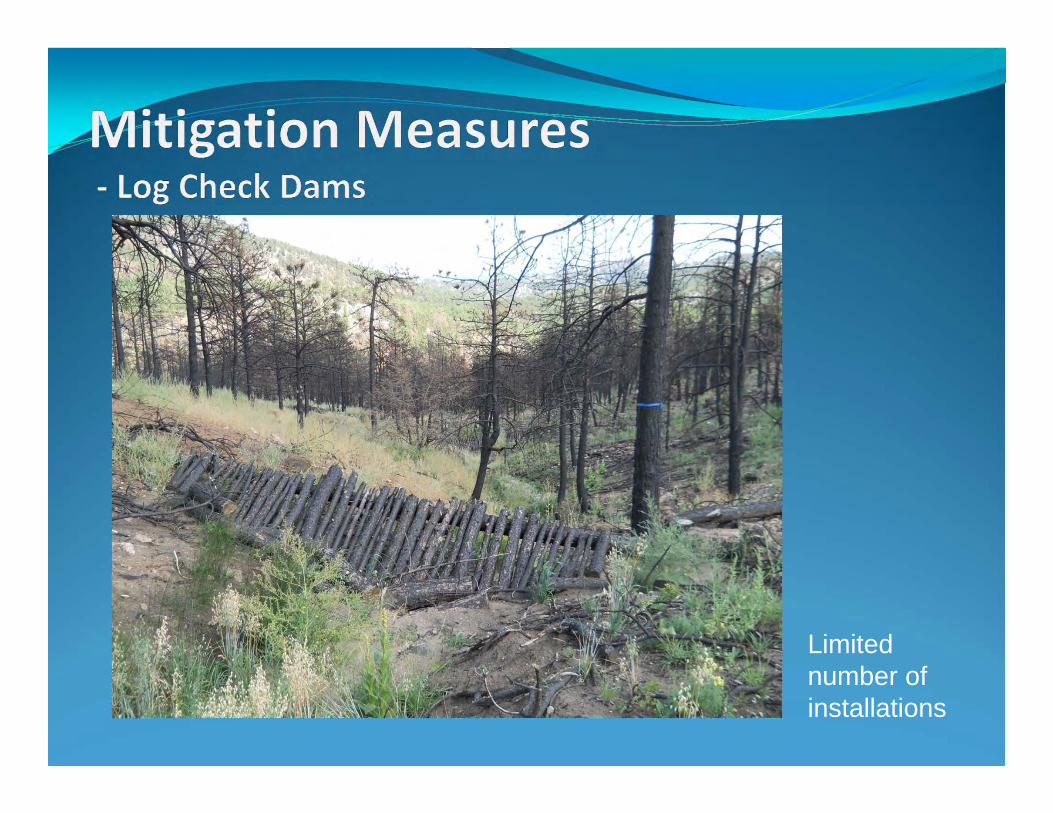
Limited number of installations
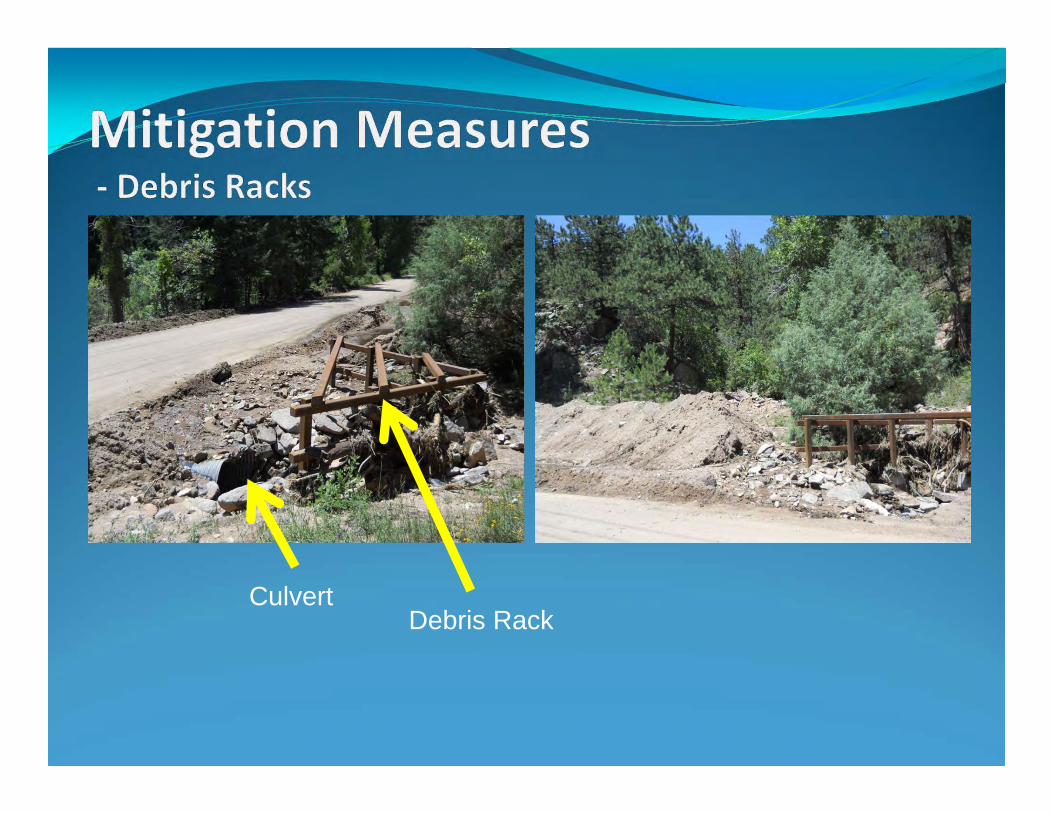
CulvertDebris Rack
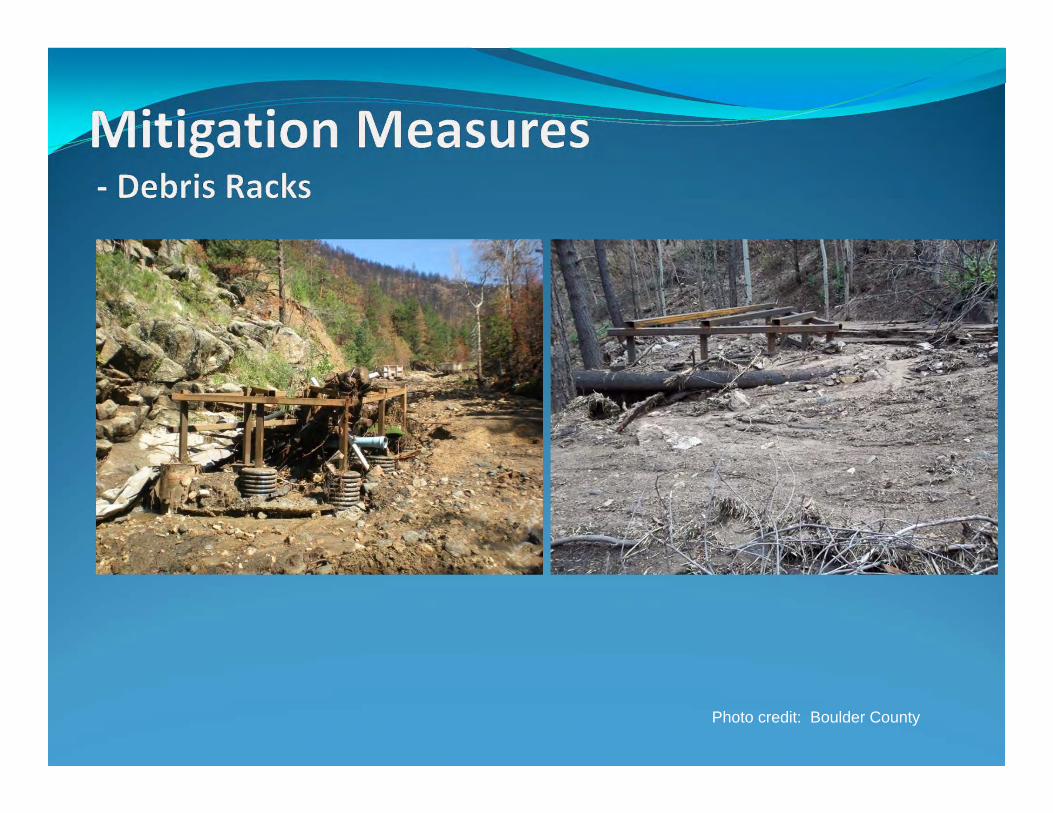
Photo credit: Boulder County
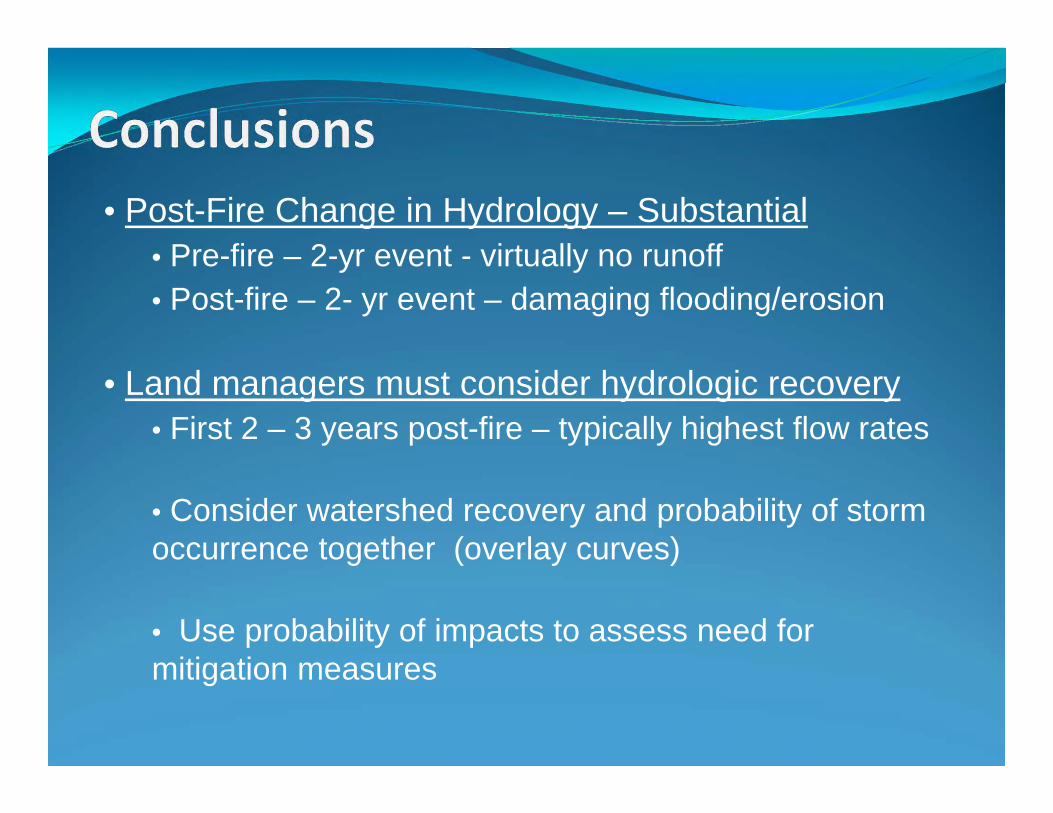
• Post-Fire Change in Hydrology – Substantial• Pre-fire – 2-yr event - virtually no runoff• Post-fire – 2- yr event – damaging flooding/erosion
• Land managers must consider hydrologic recovery• First 2 – 3 years post-fire – typically highest flow rates
• Consider watershed recovery and probability of storm occurrence together (overlay curves)
• Use probability of impacts to assess need for mitigation measures