1984 J. Opt. Soc. Am. A / Vol. 12, No. 9 / September 1995 K.-P. Ho and J. M. Kahn Exact probability-density function for phase-measurement interferometry Keang-Po Ho and Joseph M. Kahn Department of Electrical Engineering and Computer Sciences, 207-90 Cory Hall, University of California, Berkeley, California 94720-1772 Received December 20, 1994; revised manuscript received March 29, 1995; accepted April 19, 1995 Conventional analyses of the accuracy of phase-measurement interferometry derive a figure of merit that is either a variance or a signal-to-noise ratio. We derive the probability-density function of the phase- measurement output, so that the measurement confidence interval can be determined. We include both laser phase noise and additive Gaussian noise, and we consider both unmodulated interferometers and those employing phase or frequency modulation. For both unmodulated and modulated interferometers the confidence interval can be obtained by numerical integration of the probability-density function. For the modulated interferometer we derive a series summation for the confidence interval. For both unmodulated and modulated interferometers we derive approximate analytical expressions for the confidence interval, which we show to be extremely accurate at high signal-to-noise ratios. 1. INTRODUCTION Interferometric phase measurement is a precise method to measure small differences of displacement within one wavelength. 1–9 This technique has been applied most frequently in microscopic surface profiling. 1 – 7,9 In re- cent years, development of solid-state detectors, accu- rate electronic phase-measuring techniques, and digital computers have permitted achievement of measurement accuracies 2,3,6,9 of ly100 – ly1000, where l is the wave- length of the laser source. The basic two-beam interferometer measures an in- terference signal proportional to cossud, where u is the phase difference between the two beams. 10,11 As shown in Fig. 1, most practical phase-measuring interferome- ters use phase or frequency modulation, achieved by vari- ous means, 1–8 to enhance the signal-to-noise ratio (SNR). Recently the accurate direct measurement of cossud with- out phase modulation has been achieved 9 by use of optical feedback into the laser. In this paper we consider phase- measuring interferometers with and without modulation. The accuracy of phase-measuring interferometry is lim- ited by thermal noise, quantum shot noise, and other noise sources. Recently developed laser diodes have been used as sources for optical interferometry because of their stable single-mode operation, frequency tunability, low electric power consumption, compact size, and low cost. 2,11 However, compared with gas and solid-state lasers, diode lasers have much larger phase noise, which limits the per- formance of diode-laser interferometers. In order to re- duce the effect of laser diode phase noise, one can often employ an unbalanced interferometer having a small path length difference. However, there are some interferome- ter structures in which the path difference (or the equiva- lent path difference) is relatively large. 5,9,12 Therefore in this paper we include the impact of phase noise on the measurement sensitivity. Conventional analyses of the accuracy of phase-mea- surement interferometry consider either the variance 4 or the SNR. 8 For a non-Gaussian random variable rep- resenting a measurement, neither the variance nor the SNR is sufficient to specify the measurement accuracy, and it is necessary to use the probability-density function ( p.d.f.) to compute the measurement confidence interval. Therefore, we derive the p.d.f. of the measured phase, and we evaluate the measurement confidence interval. For both unmodulated and phase- (or frequency-) mod- ulated interferometers we express the confidence interval in terms of integrals over explicit functions. For modu- lated interferometers we also provide a series summation that yields the confidence interval. We present numeri- cal results of the 95% confidence interval for both unmod- ulated and modulated interferometers. To our knowl- edge, this is the first paper to consider the confidence interval for phase-measuring interferometry. The remainder of this paper is organized as follows. In Section 2 we consider phase-measuring interferome- ters without modulation. Interferometers with either phase or frequency modulation are analyzed in Section 3. Section 4 presents discussion and conclusions. 2. PHASE-MEASURING INTERFEROMETERS WITHOUT MODULATION In the direct detection of the interference signal, without noise, the signal is proportional to coss4pLyld. If addi- tive Gaussian noise and phase noise are included, the pho- todetected signal can be expressed as S std › k cosf4p Lyl1fstd 2fst 2tdg 1 nstd , (1) where k is the interference amplitude, L is the measuring distance, l is the laser emission wavelength, t › 2Lyc is the lag time between the two beams of light that interfere at the surface of the photodetector, fstd and fst 2td are the phase noises at time t and t 2t, respectively, nstd is the additive Gaussian noise of the system with variance s n 2 , and c is the speed of light. In Appendix A, values 0740-3232/95/091984-06$06.00 1995 Optical Society of America
Transcript
1984 J. Opt. Soc. Am. A/Vol. 12, No. 9 /September 1995 K.-P. Ho and J. M. Kahn
Exact probability-density function forphase-measurement interferometry
Keang-Po Ho and Joseph M. Kahn
Department of Electrical Engineering and Computer Sciences, 207-90 Cory Hall,University of California, Berkeley, California 94720-1772
Received December 20, 1994; revised manuscript received March 29, 1995; accepted April 19, 1995
Conventional analyses of the accuracy of phase-measurement interferometry derive a figure of merit thatis either a variance or a signal-to-noise ratio. We derive the probability-density function of the phase-measurement output, so that the measurement confidence interval can be determined. We include bothlaser phase noise and additive Gaussian noise, and we consider both unmodulated interferometers andthose employing phase or frequency modulation. For both unmodulated and modulated interferometers theconfidence interval can be obtained by numerical integration of the probability-density function. For themodulated interferometer we derive a series summation for the confidence interval. For both unmodulatedand modulated interferometers we derive approximate analytical expressions for the confidence interval, whichwe show to be extremely accurate at high signal-to-noise ratios.
1. INTRODUCTIONInterferometric phase measurement is a precise methodto measure small differences of displacement within onewavelength.1 – 9 This technique has been applied mostfrequently in microscopic surface profiling.1 – 7,9 In re-cent years, development of solid-state detectors, accu-rate electronic phase-measuring techniques, and digitalcomputers have permitted achievement of measurementaccuracies2,3,6,9 of ly100–ly1000, where l is the wave-length of the laser source.
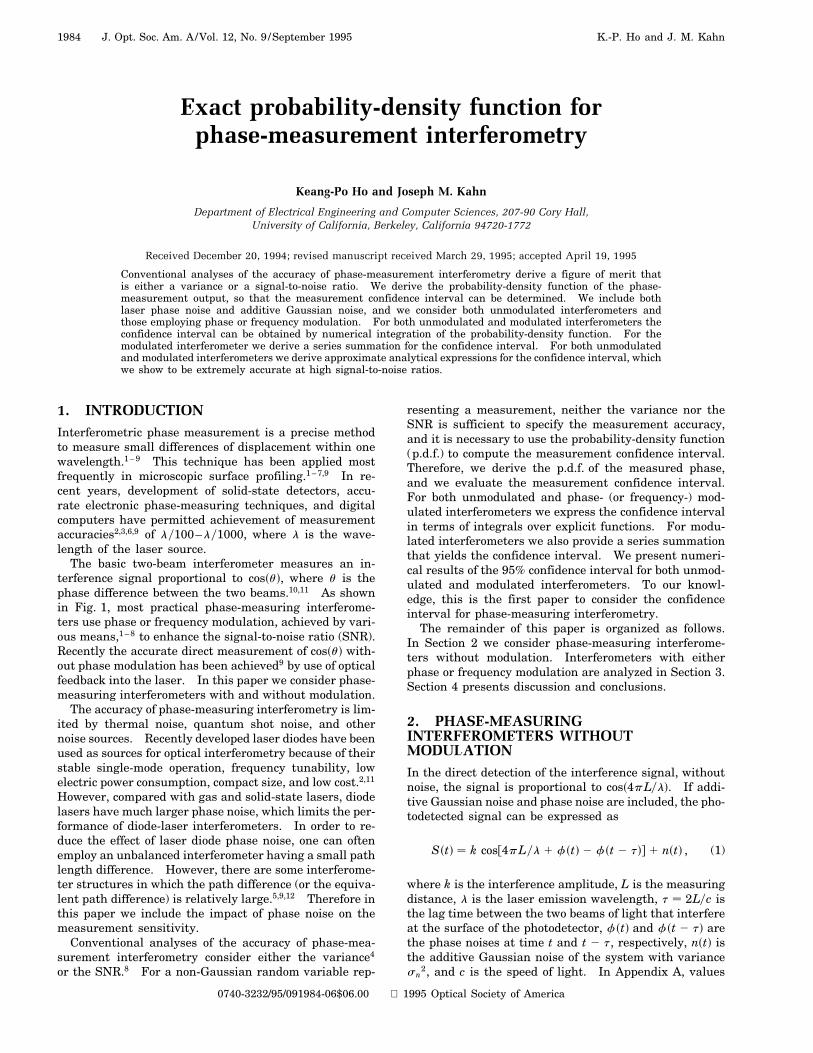
The basic two-beam interferometer measures an in-terference signal proportional to cossud, where u is thephase difference between the two beams.10,11 As shownin Fig. 1, most practical phase-measuring interferome-ters use phase or frequency modulation, achieved by vari-ous means,1 – 8 to enhance the signal-to-noise ratio (SNR).Recently the accurate direct measurement of cossud with-out phase modulation has been achieved9 by use of opticalfeedback into the laser. In this paper we consider phase-measuring interferometers with and without modulation.
The accuracy of phase-measuring interferometry is lim-ited by thermal noise, quantum shot noise, and othernoise sources. Recently developed laser diodes have beenused as sources for optical interferometry because of theirstable single-mode operation, frequency tunability, lowelectric power consumption, compact size, and low cost.2,11
However, compared with gas and solid-state lasers, diodelasers have much larger phase noise, which limits the per-formance of diode-laser interferometers. In order to re-duce the effect of laser diode phase noise, one can oftenemploy an unbalanced interferometer having a small pathlength difference. However, there are some interferome-ter structures in which the path difference (or the equiva-lent path difference) is relatively large.5,9,12 Therefore inthis paper we include the impact of phase noise on themeasurement sensitivity.
Conventional analyses of the accuracy of phase-mea-surement interferometry consider either the variance4
or the SNR.8 For a non-Gaussian random variable rep-
0740-3232/95/091984-06$06.00
resenting a measurement, neither the variance nor theSNR is sufficient to specify the measurement accuracy,and it is necessary to use the probability-density function(p.d.f.) to compute the measurement confidence interval.Therefore, we derive the p.d.f. of the measured phase,and we evaluate the measurement confidence interval.For both unmodulated and phase- (or frequency-) mod-ulated interferometers we express the confidence intervalin terms of integrals over explicit functions. For modu-lated interferometers we also provide a series summationthat yields the confidence interval. We present numeri-cal results of the 95% confidence interval for both unmod-ulated and modulated interferometers. To our knowl-edge, this is the first paper to consider the confidenceinterval for phase-measuring interferometry.
The remainder of this paper is organized as follows.In Section 2 we consider phase-measuring interferome-ters without modulation. Interferometers with eitherphase or frequency modulation are analyzed in Section 3.Section 4 presents discussion and conclusions.
2. PHASE-MEASURINGINTERFEROMETERS WITHOUTMODULATIONIn the direct detection of the interference signal, withoutnoise, the signal is proportional to coss4pLyld. If addi-tive Gaussian noise and phase noise are included, the pho-todetected signal can be expressed as
where k is the interference amplitude, L is the measuringdistance, l is the laser emission wavelength, t 2Lyc isthe lag time between the two beams of light that interfereat the surface of the photodetector, fstd and fst 2 td arethe phase noises at time t and t 2 t, respectively, nstd isthe additive Gaussian noise of the system with variancesn
2, and c is the speed of light. In Appendix A, values
1995 Optical Society of America
K.-P. Ho and J. M. Kahn Vol. 12, No. 9 /September 1995 /J. Opt. Soc. Am. A 1985
Fig. 1. Diagram of a phase-measuring interferometer: aTwyman–Green interferometer employing a frequency-modu-lated laser diode source. In alternative implementations thesource may be a gas or solid-state laser; in such cases, the in-terferometer usually is phase modulated by movement of thereference mirror with use of a piezoelectric transducer (PZT).Some phase-measuring interferometers do not employ frequencyor phase modulation.
of both k and sn2 are provided for typical systems. Al-
though the value of sn2 may depend on the measurement
phase, we do not explicitly include any such possible de-pendence in what follows (see Appendix A).
To measure L̂, which is an estimate of L, we use aphase detector. The phase detector yields a phase es-timate Q 4pL̂yl, which is a random variable given by
Q
8><>:p S , 2kcos21sSykd jSj # k0 S . k
. (2)
It can be shown that the phase detector described byEq. (2) is a least-mean-square estimator of the detectedphase and thus of the measured length.13 We will nowcompute the p.d.f. of Q, allowing us to obtain the mea-surement uncertainty. First of all, for convenience, wedefine a random variable Qp 4pLyl 1 fstd 2 fst 2 td.The p.d.f. of S for a given Qp up is
pSss j Qp upd 1
p2p sn
exp
242ss 2 k cos upd2
2sn2
35 ,
2` , s , ` . (3)
We change the variable to Q,
pQsu j Qp upd
8>>>>>>>>>><>>>>>>>>>>:
rg
psinsudexpf2gscos u 2 cos upd2g
1dsud
2erfcfpg s1 2 cos updg
1dsu 2 pd
2erfcfpg s1 1 cos updg 0 # up # p
0 otherwise
,
(4)
where ds?d is the Dirac d function, erfcsxd 2yp
pR
`
x exps2t2ddt, and we have defined the SNR g k2y2sn
2.
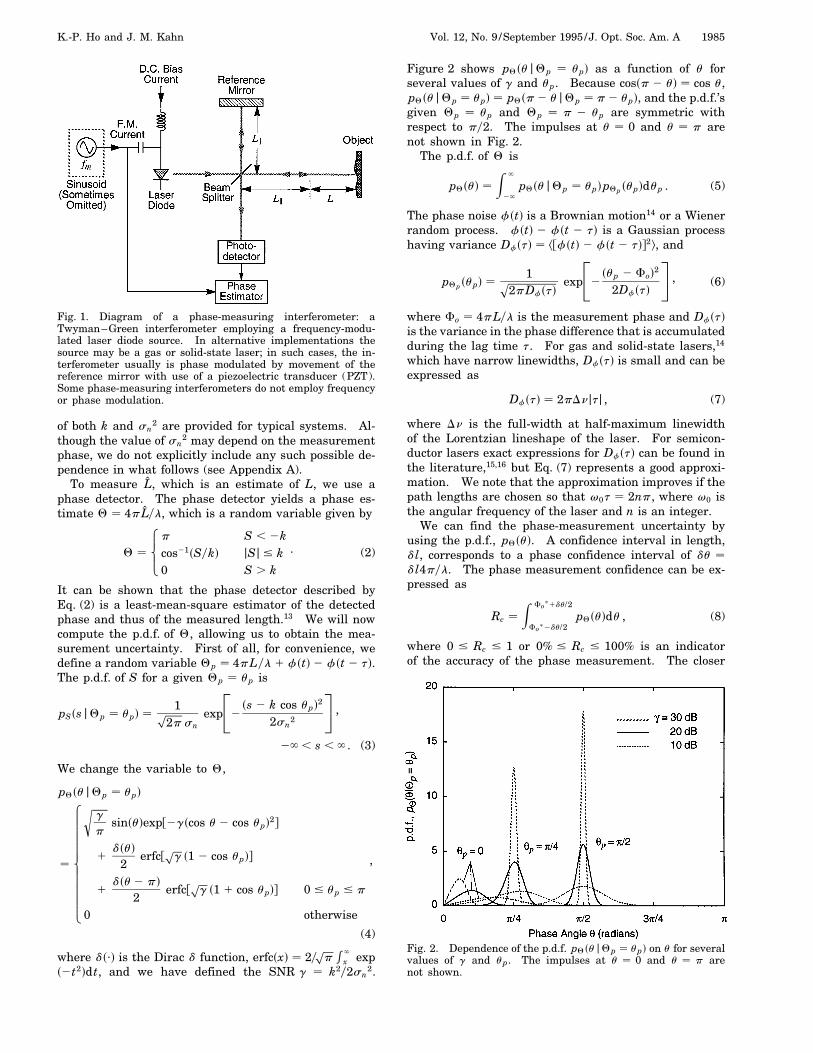
Figure 2 shows pQsu j Qp upd as a function of u forseveral values of g and up. Because cossp 2 ud cos u,pQsu j Qp upd pQsp 2 u j Qp p 2 upd, and the p.d.f.’sgiven Qp up and Qp p 2 up are symmetric withrespect to py2. The impulses at u 0 and u p arenot shown in Fig. 2.
The p.d.f. of Q is
pQsud Z `
2`
pQsu j Qp updpQp supddup . (5)
The phase noise fstd is a Brownian motion14 or a Wienerrandom process. fstd 2 fst 2 td is a Gaussian processhaving variance Dfstd kffstd 2 fst 2 tdg2l, and
pQp supd 1p
2pDfstdexp
242sup 2 Fod2
2Dfstd
35 , (6)
where Fo 4pLyl is the measurement phase and Dfstdis the variance in the phase difference that is accumulatedduring the lag time t. For gas and solid-state lasers,14
which have narrow linewidths, Dfstd is small and can beexpressed as
Dfstd 2pDnjtj , (7)
where Dn is the full-width at half-maximum linewidthof the Lorentzian lineshape of the laser. For semicon-ductor lasers exact expressions for Dfstd can be found inthe literature,15,16 but Eq. (7) represents a good approxi-mation. We note that the approximation improves if thepath lengths are chosen so that v0t 2np, where v0 isthe angular frequency of the laser and n is an integer.
We can find the phase-measurement uncertainty byusing the p.d.f., pQsud. A confidence interval in length,dl, corresponds to a phase confidence interval of du dl4pyl. The phase measurement confidence can be ex-pressed as
Rc Z Fo
p1du/2
Fop2du/2pQsuddu , (8)
where 0 # Rc # 1 or 0% # Rc # 100% is an indicatorof the accuracy of the phase measurement. The closer
Fig. 2. Dependence of the p.d.f. pQ su j Qp upd on u for severalvalues of g and up. The impulses at u 0 and u p arenot shown.
1986 J. Opt. Soc. Am. A/Vol. 12, No. 9 /September 1995 K.-P. Ho and J. M. Kahn
Rc is to unity, the more confidence one may have in themeasurement. Here, 0 # Fo
p cos21scos Fod # p isthe mapping of Fo to the range of the function cos21s?d.The integration of Eq. (8) is difficult to evaluate. Chang-ing the order of integration,
Rc Z `
2`
pQp supddup
Z Fop1du/2
Fop2du/2pQsu j Qp upddu . (9)
The inner integration can be integrated analytically:
Z Fop1du/2
Fop2du/2pQsu j Qp upddu
12
erf fp
g scos F2
2 cos updg 212
erf fp
g scos F1 2 cos updg
1U0,F2
2erfcf
pg s1 2 cos updg
1Up,F1
2erfcf
pg s1 1 cos updg , (10)
where
U0,F2
(1 F2 00 F2 fi 0
Up,F1
(1 F1 p
0 F1 fi p, (11)
and F1 minsp, Fop 1 duy2d, F2 maxs0, Fo
p 2 duy2dare the upper and lower limits of integration, respectively.U0,F2 and Up,F1 are equal to 1 if the integration intervalincludes the impulses at 0 and p, respectively. The errorfunction is erf sxd 2y
pp
Rx0 exps2t2ddt.
For the case of high SNR g, narrow linewidth, and Fop
not close to either 0 or p (corresponding to Fo not closeto np, where n is an integer), the second and third termsof Eq. (4) can be ignored. Therefore
pQsu j Qp upd ør
g
psinsudexpf2gscos u 2 cos upd2g .
(12)
Note that u is close to up, so that sinsud ø sinsupd, cossud 2
cossupd ø 2su 2 updsin up, and
pQsu j Qp upd ør
g
psin up expf2g sin2 upsu 2 upd2g .
(13)
pQsu j Qp upd can be approximated as a Gaussian distri-bution with mean up and variance 1ys2g sin2 upd. Fur-thermore, pQsud is also Gaussian distributed with meanFo and variance of Dfstd 1 1ys2g sin2 F0d, because up isclose to Fo. The approximate measurement confidenceis thus
Rc ø erf
√duy2p
2 su
!, (14)
where
su fDfstd 1 1ys2g sin2 F0dg1/2 . (15)
It is obvious that approximate expression (14) is validonly if Fo
p is away from either 0 or p. Although an
approximate expression that is valid for Fop close to 0
and p can be found, we do not consider those cases here,because, as shown below, poor measurement accuracymakes it undesirable to operate with Fo
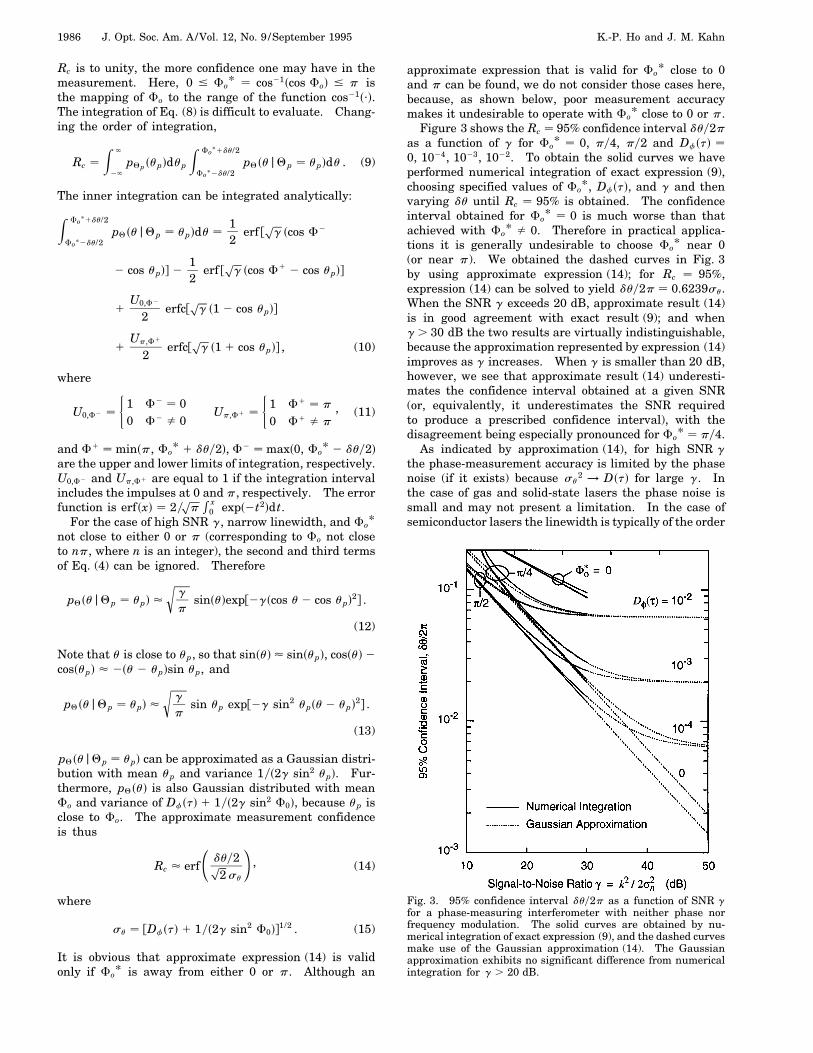
p close to 0 or p.Figure 3 shows the Rc 95% confidence interval duy2p
as a function of g for Fop 0, py4, py2 and Dfstd
0, 1024, 1023, 1022. To obtain the solid curves we haveperformed numerical integration of exact expression (9),choosing specified values of Fo
p, Dfstd, and g and thenvarying du until Rc 95% is obtained. The confidenceinterval obtained for Fo
p 0 is much worse than thatachieved with Fo
p fi 0. Therefore in practical applica-tions it is generally undesirable to choose Fo
p near 0(or near p). We obtained the dashed curves in Fig. 3by using approximate expression (14); for Rc 95%,expression (14) can be solved to yield duy2p 0.6239su.When the SNR g exceeds 20 dB, approximate result (14)is in good agreement with exact result (9); and wheng . 30 dB the two results are virtually indistinguishable,because the approximation represented by expression (14)improves as g increases. When g is smaller than 20 dB,however, we see that approximate result (14) underesti-mates the confidence interval obtained at a given SNR(or, equivalently, it underestimates the SNR requiredto produce a prescribed confidence interval), with thedisagreement being especially pronounced for Fo
p py4.As indicated by approximation (14), for high SNR g
the phase-measurement accuracy is limited by the phasenoise (if it exists) because su
2 ! Dstd for large g. Inthe case of gas and solid-state lasers the phase noise issmall and may not present a limitation. In the case ofsemiconductor lasers the linewidth is typically of the order
Fig. 3. 95% confidence interval duy2p as a function of SNR g
for a phase-measuring interferometer with neither phase norfrequency modulation. The solid curves are obtained by nu-merical integration of exact expression (9), and the dashed curvesmake use of the Gaussian approximation (14). The Gaussianapproximation exhibits no significant difference from numericalintegration for g . 20 dB.
K.-P. Ho and J. M. Kahn Vol. 12, No. 9 /September 1995 /J. Opt. Soc. Am. A 1987
of several megaherz, and a path difference of 1 cm yieldsDfstd ø 5 3 1024, thus providing a phase-measurementlimit of duy2p . 1022 for high SNR g. Although for mostinterferometry systems the path difference can be madevery small, there are some configurations that require alarge path difference,5.9,12 in which cases the phase-noiselimitation cannot be avoided.
3. PHASE OR FREQUENCY MODULATEDINTERFEROMETERSThe laser may be directly frequency modulated5,7 (asshown in Fig. 1), the reference mirror in the interferome-ter can be mounted on a PZT to permit phase modulation,3
or one may use heterodyne techniques.1 The photo-detected signal is
By use of a proper phase-estimation circuit17,18 we obtaintwo random variables sX, Y d, which are equal to
X k cossQpd 1 ncstd, Y k sinsQpd 1 nsstd , (17)
where ncstd and nsstd are identical independent Gaussianrandom processes each having variance sn
2. Values of kand sn
2 for typical systems are specified in Appendix A.Although the noise variance may depend on the mea-surement phase, as discussed in Section 2, we do notinclude here any explicit dependence of sn
2 on Fo (seeAppendix A). The joint p.d.f. of sX, Y d is
pXY sx, y j Qp upd 1
2psn2
3 exp
242sx 2 k cos upd2 1 sy 2 k sin upd2
2sn2
35 ,
2` , x, y , ` . (18)
Using the variables sX, Y d, we can estimate the mea-sured phase by Q tan21sYyXd. If we change variablesfrom sX, Y d to R
pX2 1 Y 2 and Q tan21sYyXd, the
joint p.d.f. of sR, Qd is
pRQsr, u j Qp upd r
2ps2
3 exp
242r2 1 k2 2 2kr cossu 2 upd
2sn2
35 ,
0 # r , `, up # u , up 1 2p . (19)
Integration of pRQsr, ud over r yields the p.d.f. of Q:
pQsu j Qp upd Z `
0pRQsr, u j Qp upddr
1
2pexps2gd
8<:1 1p
2pg cossu 2 upd
3 expfg cos2su 2 updg
3Z p
2g cossu2up d
2`
exps2x2y2ddx
9=; ,
up # u , up 1 2p , (20)
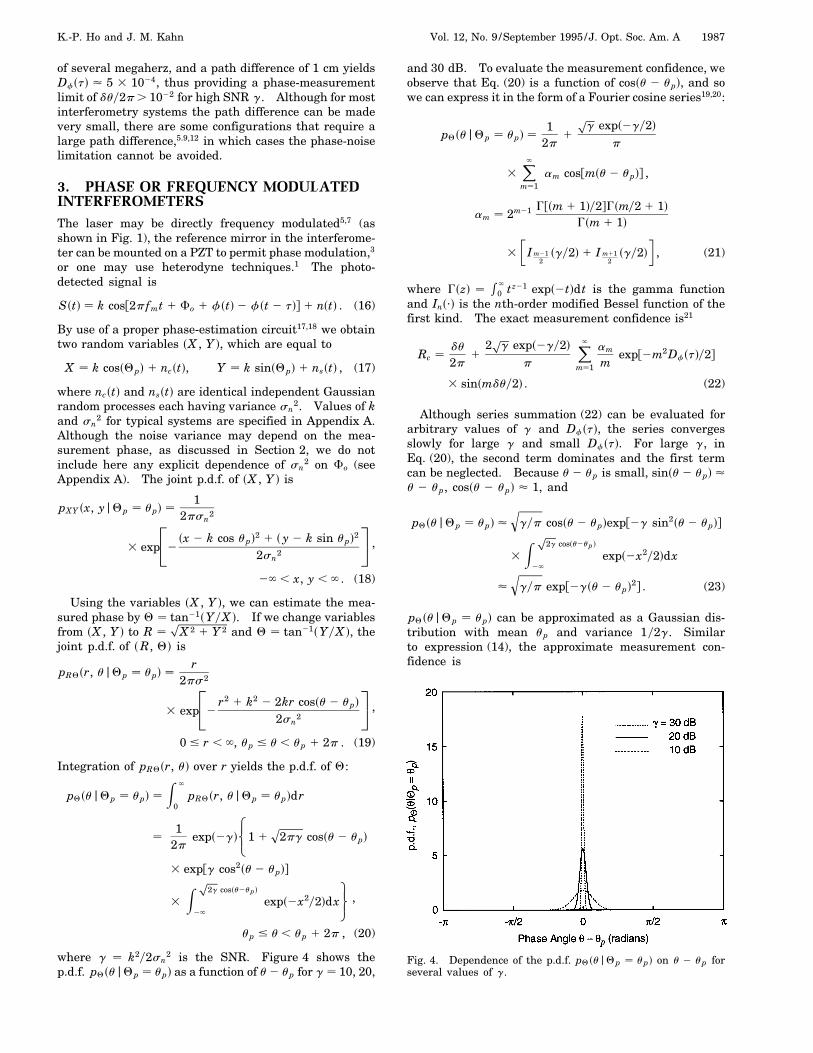
where g k2y2sn2 is the SNR. Figure 4 shows the
p.d.f. pQsu j Qp upd as a function of u 2 up for g 10, 20,
and 30 dB. To evaluate the measurement confidence, weobserve that Eq. (20) is a function of cossu 2 upd, and sowe can express it in the form of a Fourier cosine series19,20:
pQsu j Qp upd 1
2p1
pg exps2gy2d
p
3X̀
m1am cosfmsu 2 updg ,
am 2m21 Gfsm 1 1dy2gGsmy2 1 1dGsm 1 1d
3
∑I m21
2sgy2d 1 I m11
2sgy2d
∏, (21)
where Gszd R`
0 tz21 exps2tddt is the gamma functionand Ins?d is the nth-order modified Bessel function of thefirst kind. The exact measurement confidence is21
Rc du
2p1
2p
g exps2gy2dp
X̀m1
am
mexpf2m2Dfstdy2g
3 sinsmduy2d . (22)
Although series summation (22) can be evaluated forarbitrary values of g and Dfstd, the series convergesslowly for large g and small Dfstd. For large g, inEq. (20), the second term dominates and the first termcan be neglected. Because u 2 up is small, sinsu 2 upd øu 2 up, cossu 2 upd ø 1, and
pQsu j Qp upd øq
gyp cossu 2 updexpf2g sin2su 2 updg
3Z p
2g cossu2up d
2`
exps2x2y2ddx
øq
gyp expf2gsu 2 upd2g . (23)
pQsu j Qp upd can be approximated as a Gaussian dis-tribution with mean up and variance 1y2g. Similarto expression (14), the approximate measurement con-fidence is
Fig. 4. Dependence of the p.d.f. pQ su j Qp upd on u 2 up forseveral values of g.
1988 J. Opt. Soc. Am. A/Vol. 12, No. 9 /September 1995 K.-P. Ho and J. M. Kahn
Fig. 5. 95% confidence interval duy2p as a function of the SNRg for a phase-measuring interferometer with either phase orfrequency modulation. The solid curves are obtained by meansof exact series summation (22), and the dashed curves make useof Gaussian approximation (24). The Gaussian approximationexhibits no observable difference from series summation forg . 20 dB.
Rc ø erf
√duy2p
2 su
!, (24)
where
su sDfstd 1 1y2gd1/2 . (25)
Figure 5 shows the Rc 95% confidence interval duy2p
as a function of g for Dfstd 0, 1024, 1023, 1022. To ob-tain the solid curves, we have employed the exact seriessummation (22), choosing specified values of Fo
p and g
and then varying du until Rc 95% is obtained. Weobtained the dashed curves in Fig. 5 by using approxi-mate expression (24); for Rc 95% expression (24) canbe solved to yield duy2p 0.6239su . From Fig. 5 wesee that when the SNR g exceeds 20 dB, the approximateresult [relation (24)] is in excellent agreement with theexact result [Eq. (22)], whereas for smaller values of g
there are observable, though small, differences betweenthe approximate and the exact results.
As predicted by expression (24), for high SNR g thephase-measurement accuracy of a phase- (or frequency-)modulated interferometer is limited by the phase noise (ifit exists), because su
2 ! Dstd for large g. For large g
the confidence interval for the unmodulated interferome-ter, given by expression (14), is highest when Fo py2,in which case it is identical to expression (24); there-fore the limitation posed by phase noise is the samefor interferometers with and without modulation. Fordirectly frequency-modulated diode lasers, the effectivemodulation index for phase measurement is proportionalto the optical path difference (see Appendix A). As thenoise variance Dfstd is proportional to the optical path
difference, we note that phase noise is a fundamentallimitation of direct frequency-modulated diode-laser in-terferometers. However, this argument does not apply tointerferometers in which the position of the PZT-mountedmirror is modulated3 or to Mach–Zehnder interferome-ters in which the path difference is phase modulated.8
4. DISCUSSION AND CONCLUSIONSIn practice, phase-measuring interferometers with phase(or frequency) modulation are used more frequently thantheir unmodulated counterparts. In the case of mod-ulated interferometers, although the SNR obtained ishigher when the measured object has higher reflectiv-ity, the phase measurement itself is insensitive to the ob-ject’s reflectivity. As shown in Appendix A, if all otherparameters are identical, a modulated interferometer hasa SNR g that is a factor of J1szd smaller than that ofan unmodulated interferometer. However, unlike an un-modulated interferometer, which has poor performanceat Fo np, the modulated interferometer has the sameperformance for all values of the measurement phase Fo,making it preferable in most applications.
In conclusion, we have derived the exact p.d.f. of themeasured phase of a phase-measuring interferometer.This allows us to evaluate the measurement confidence in-terval rather than simply specifying a measurement vari-ance or a SNR. The confidence interval is evaluated bymeans of numerical integration in the case of unmodu-lated interferometers and by series summation in the caseof interferometers that employ phase or frequency modu-lation. We have included the effects of both laser phasenoise and additive Gaussian noise. We have shown thatphase noise is a primary limitation to measurement ac-curacy for interferometers that have large optical pathdifferences and that use a diode-laser source. For bothunmodulated and modulated interferometers we have pro-vided approximate analytical expressions for the confi-dence interval that are highly accurate when the SNRexceeds 20 dB.
APPENDIX A: SIGNAL ANDNOISE IN PHASE-MEASUREMENTINTERFEROMETERSThe simplest way to create a phase-measuring interferom-eter without phase or frequency modulation is to employoptical feedback into the laser 9 or to use a Twyman–Green interferometer (as shown in Fig. 1) withoutmodulation.10 Such systems must be carefully cali-brated, because the absolute interference amplitude de-pends on the reflectivity of the object being measured.Assuming that the system is a Twyman–Green interfero-meter without modulation, then if we ignore noise thephotodetector output current is
I I0
2
"1 1 r
21
pr cos
√4pL
l
!#, (A1)
where r is the reflectivity of the measured object andI0 R0P0, with R0 representing the photodetector respon-sivity and P0 representing the laser output power. Typi-cally, after the reflectivity is calibrated the first term ofEq. (A1) can be subtracted from the detected signal. We
K.-P. Ho and J. M. Kahn Vol. 12, No. 9 /September 1995 /J. Opt. Soc. Am. A 1989
thus obtain the signal component of Eq. (1), with
k p
r I0y2 . (A2)
Assuming that the signal is sampled after a low-pass filterthat has noise bandwidth B, then the noise nstd in Eq. (1)has the variance
sn2
√2eI 1
4kTRL
1 I 2 ? RIN
!B . (A3)
Here, 2eI is the shot noise at the detector, where e is theelectronic charge and I is the photocurrent; 4kTyRL isthe thermal noise, where T is the temperature; RL is theload resistance; and k is the Boltzman constant; I 2 ? RINis the intensity noise of the laser source, where RIN isthe relative intensity noise of the laser. For the caseof a laser feedback interferometer,9 the noise variance isgiven by Eq. (A3), and k can be found in Ref. 9. We notethat since the photocurrent I depends on the measuredphase Fo, the noise variance sn
2 depends on Fo. Inprinciple, when comparing the accuracy of measurementsmade at distinct values of Fo, one may need to employdifferent values of sn
2. To simplify the discussion here,we assume that sn
2 is constant, independent of Fo. Thisis satisfied in most practical systems for one or both oftwo reasons: (1) because of a large imbalance in theinterferometer (typically, r , 1), I often depends onlyweakly on Fo and (2) because sn
2 is often dominated bythe thermal noise, which is independent of I.
In the case of a phase- (or frequency-) modulated in-terferometer with use of least-mean-square phase esti-mation17,18 the signal amplitude need not be calibrated,because it is canceled out in the phase estimator.17,18
Assume the use of a diode laser with direct frequencymodulation by a small current Imstd Im0 coss2pfmtd. Ifwe ignore phase and thermal noise, the current at thedetector is6
I I0
2
(1 1 r
21
pr cos
"z coss2pfmtd 1
4pLl0
#), (A4)
where z s4pyl02dIm0bL0, b describes the frequency-
modulation efficiency of the laser (b has units of wave-length per unit current), and l0 ø l and L0 are theaverage wavelength of the laser and the average measure-ment distance, respectively. The first term in Eq. (A4)contains no information on the measurement phase andcan be ignored. If we consider the first harmonic inEq. (A4), the signal is
Sstd
pr I0J1szd
2cos
√2pfmt 1
4pLl0
!, (A5)
where J1s?d is the first-order Bessel function of the firstkind. Adding the phase and the Gaussian noise, we haveEq. (16) with
k p
r I0J1szdy2 , (A6)
sn2
√2eIdc 1
4kTRL
1 Idc2 ? RIN
!B . (A7)
Here B is the noise bandwidth of the bandpass filter
that the signal passes through, and Idc I0f1 1 r 1
2p
r J0szdcossF0dgy4 is the average current at the detec-tor, where J0s?d is the zeroth-order Bessel function of thefirst kind. We assume that sn
2 is constant, independentof F0; in practice, this is satisfied under conditions ex-plained above.
ACKNOWLEDGMENTSThis work was supported by the Hughes Aircraft Com-pany and by National Science Foundation PresidentialYoung Investigator Award ECS-9157089.
The authors’ telephone number is 510-643–5848; fax,510-642-2739; e-mail, hkpho, [email protected].
REFERENCES1. R. Crane, “Interference phase measurement,” Appl. Opt. 8,
538–542 (1969).2. K. Creath, “Phase-measurement interferometry techniques,”
Prog. Opt. 26, 1960–1966 (1988).3. O. Sasaki and H. Okazaki, “Sinusoidal phase modulating
interferometry for surface profile measurement,” Appl. Opt.25, 3137–3140 (1986).
4. O. Sasaki and H. Okazaki, “Analysis of measurement accu-racy in sinusoidal phase modulating interferometry,” Appl.Opt. 25, 3152–3158 (1986).
5. T. Yoshino, M. Nara, S. Mnatzakanian, B. S. Lee, andT. C. Strand, “Laser diode feedback interferometer for sta-bilization and displacement measurements,” Appl. Opt. 26,892–897 (1987).
6. O. Sasaki and K. Takahashi, “Sinusoidal phase modulat-ing interferometer using optical fibers for displacement mea-surement,” Appl. Opt. 27, 4139–4142 (1988).
7. T. Suzuki, O. Sasaki, and T. Maruyame, “Phase locked laserdiode interferometry for surface profile measurement,” Appl.Opt. 28, 4407–4410 (1989).
8. A. J. Stevenson, M. B. Gray, H.-A. Bachor, and D. E.McClelland, “Quantum-noise-limited interferometer phasemeasurement,” Appl. Opt. 32, 3481 (1993).
9. A. Bearden, M. P. O’Neill, L. C. Osborne, and T. L. Wang,“Imaging and vibrational analysis with laser-feedback inter-ferometry,” Opt. Lett. 18, 238–240 (1993).
10. M. Born and E. Wolf, Principles of Optics, 6th ed.(Pergamon, Oxford, UK, 1980), Chap. 7, p. 259.
11. P. Hariharan, “Interferometry with lasers,” Prog. Opt. 24,105–164 (1987).
12. O. Sasaki and K. Takahashi, “Sinusoidal phase modulat-ing interferometer using optical fibers for displacement mea-surement,” Appl. Opt. 27, 4139–4142 (1988).
13. A. Papoulis, Probability, Random Variables, and Stochas-tic Processes, 2nd ed. (McGraw-Hill, New York, 1984),Chap. 13, pp. 407–414.
14. M. Sargent III, M. O. Scully, and W. E. Lamb, Jr., LaserPhysics (Addison-Wesley, Reading, Mass., 1974), Chap. 20,pp. 335–339.
15. C. H. Henry, “Theory of the linewidth of semiconductorlasers,” IEEE J. Quantum Electron. QE-18, 259–264 (1982).
16. C. H. Henry, “Phase noise in semiconductor lasers,” J. Light-wave Technol. LT-4, 298–311 (1986).
17. J. G. Proakis, Digital Communications, 2nd ed. (McGraw-Hill, New York, 1989), Chap. 4, pp. 258–271.
18. C. J. Morgan, “Least-squares estimation in phase-mea-surement interferometry,” Opt. Lett. 7, 368–370 (1982).
19. N. M. Blachman, “The effect of phase error on DPSK er-ror probability,” IEEE Trans. Commun. COM-29, 364–365(1981).
20. G. Nicholson, “Probability of error for optical heterodyneDPSK system with quantum phase noise,” Electron. Lett.20, 1005–1007 (1984).
21. I. S. Gradshteyn and I. M. Ryzhik, Table of Integrals, Series,and Products (Academic, San Diego, Calif., 1979), Chap. 3,p. 480.