30


Exadata Live!
Graham Wood
Server Technologies, Oracle Corp

© 2009 Oracle Corporation – Proprietary and Confidential
Exadata Live!
Building 1TB Datawarehouse in an Hour
Interpreting the windows
Demonstration menus
Monitoring the Database Machine
Begin loading 1 Terabyte of data
Create Tablespaces
Create Schema Objects
One-Off Load
Gather Statistics

Data Loading

Data Loading

Data Loading
Data Loading

Is Data Loading Really the Problem
Where have Oracle Customers struggled with the
Performance of their Data Warehouse ?
Data Loading ?
Data Validation and Verification ?
ETL and Transformation ?
So what went Wrong ?

Data Warehouse Death Spiral
HW CPU Sizing 10X
Sized like an OLTP System
I/O Sizing 10X
Sized by Space requirements
Cannot use Parallel Query
Using the the incorrect Query Optimization
Techniques 10X
Over Indexed Database
Data Loads and ETL running to Slow
System Over loaded to Make the CPU look Busy
100s of Concurrent Queries taking Hours to Execute

Some Basic Maths
Index Driven Query retrieving 1,000,000 rows
Assume the Index is cache and the data is not.
1,000,000 random IOPS @ 5ms per I/O
This required 5000 Seconds to Execute
This is why queries may take over an hour
How much data could you scan in 5000 Seconds with a fully
sized I/O system able to scan 28 Gig/Sec ?
Clearly For Oracle Data Warehouses the game is
changing
New Design Techniques
Time to Re-Train the DBAs

© 2009 Oracle Corporation – Proprietary and Confidential
Oracle Retail Data Warehouse Schema

© 2009 Oracle Corporation – Proprietary and Confidential
Retail Demonstration
Table Sizes
TABLE SIZE OF SOURCE DATA NUMBER OF RECORDS
Transactions 52 GByte 461M
Payments 54 GByte 461M
Line Items 936 Gbyte 6945M
Total 1042 GByte 7867M
© 2009 Oracle Corporation – Proprietary and Confidential
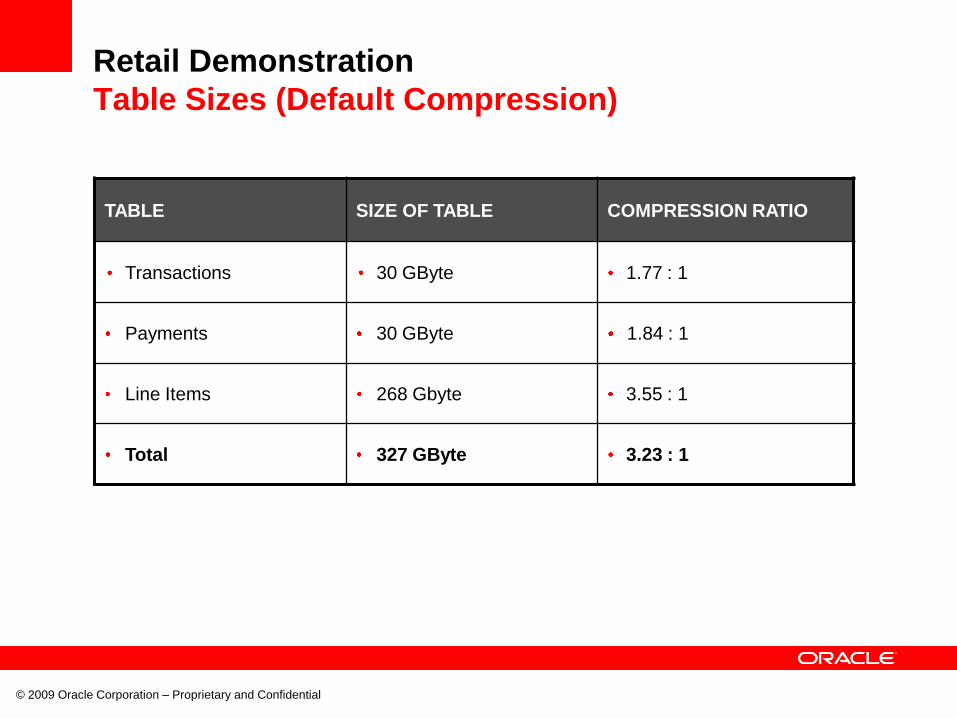
Retail Demonstration
Table Sizes (Default Compression)
TABLE SIZE OF TABLE COMPRESSION RATIO
Transactions 30 GByte 1.77 : 1
Payments 30 GByte 1.84 : 1
Line Items 268 Gbyte 3.55 : 1
Total 327 GByte 3.23 : 1

© 2009 Oracle Corporation – Proprietary and Confidential
Retail Demonstration
Table Sizes (With HCC)
TABLE SIZE OF TABLE COMPRESSION RATIO
Transactions 5 GByte 7.00 : 1
Payments 5 GByte 7.60 : 1
Line Items 54 Gbyte 12.85 : 1
Total 64 GByte 11.98 : 1
NOTE: The compression ratio is compare to the data of no-compression
© 2009 Oracle Corporation – Proprietary and Confidential
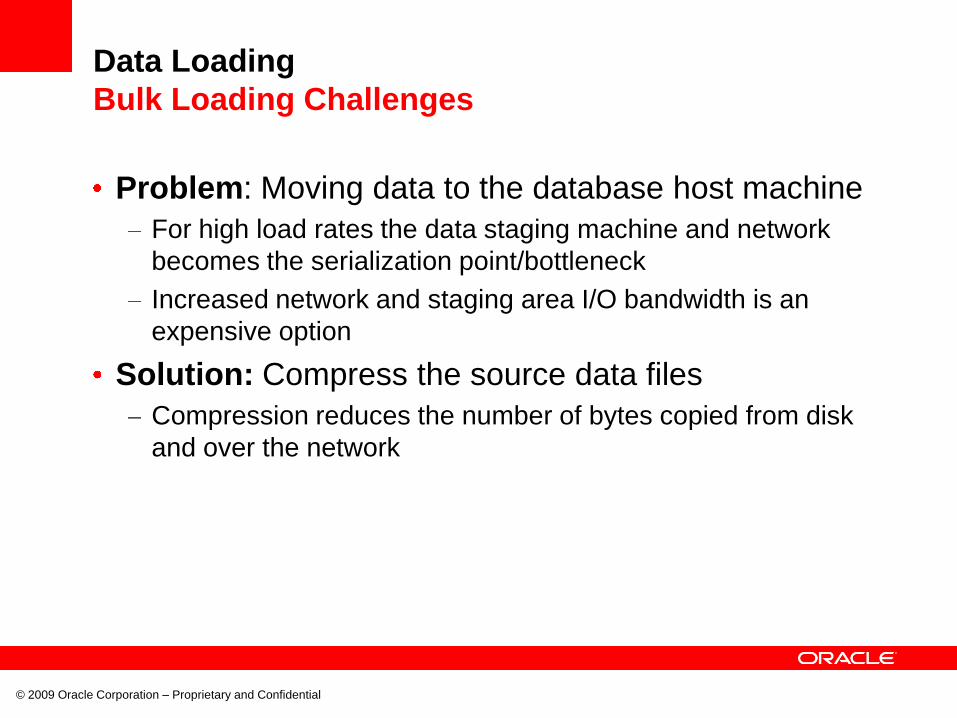
Data Loading
Bulk Loading Challenges
Problem: Moving data to the database host machine
For high load rates the data staging machine and network
becomes the serialization point/bottleneck
Increased network and staging area I/O bandwidth is an
expensive option
Solution: Compress the source data files
Compression reduces the number of bytes copied from disk
and over the network

© 2009 Oracle Corporation – Proprietary and Confidential
Data Loading
Tip #1 Consider the Data Transfer Rate
What would it take to load 1 TByte in one Hour?
17 GByte/minute or 291 MByte/second
This is higher than the specification of most networks
and any portable drive
So compression of source data becomes crucial
1057 Gbyte 136 Gbyte (7.7x compression)
2.3 GByte/minute or 40 MByte/s
This eliminates the first challenge to migrating data
Extraction of the data from legacy systems often
takes much longer than this!

© 2009 Oracle Corporation – Proprietary and Confidential
Data Staging
Data Sources
SOURCE THROUGHPUT
USB Drive 20 MByte/s
Local Disk 30-40 MByte/s
Scalable NFS ServerPotentially at Network
Speeds
DBFSFastest ( assuming data
has been copied !)

© 2009 Oracle Corporation – Proprietary and Confidential
Data Loading
Bulk Loading Challenges
Problem: Data loading is CPU/Memory Constrained
Data loads scale well over multiple CPUs, cores and hosts
(assuming no other form of contention)
Memory usage for meta data associated with highly
partitioned objects can become significant at high DOP
Solution: Use the correct tools and plan accordingly
Use external tables with a parallel SQL statement (e.g. CTAS
or IAS) to minimize on-disk and in-memory meta data. Do
NOT use multiple copies of SQL*Loader
Data types for columns have a huge impact on the CPU
required to load the data. Raw is the cheapest and
Timestamp is the most expensive.

© 2009 Oracle Corporation – Proprietary and Confidential
Loading Data
Tip #2 Learn About Impact of Compression
Compression incurs costs when loading
Increased CPU time
Increased elapsed time
Compression provides benefits
For scans
For backup and recovery
Write-once and Read-many means that compression
is a net benefit, not a cost

© 2009 Oracle Corporation – Proprietary and Confidential
Loading Data
Tip #3 Learn about Impact of Partitioning
Partitioning incurs costs when loading
Increased CPU time
Increased elapsed time
Partitioning provides benefits
For queries
For manageability
Write-once and Read-many means that partitioning is
a net benefit, not a cost

© 2009 Oracle Corporation – Proprietary and Confidential
Gathering Statistics
Strategy For New Databases
Create tables
Optionally Run (or explain) queries on empty tables
Prime / Seed the optimizer
Enable incremental statistics
For large partitioned tables
Load data
Gather statistics
Use the defaults
Create indexes (if required!)

Gathering Statistics
Incremental Statistics
One of the biggest problems with large tables is
keeping the schema statistics up to date and accurate
This is particularly challenging in a Data Warehouse
where tables continue to grow and so the statistics
gathering time and resources grow proportionately
To address this problem, 11.1 introduced the concept
of incremental statistics for partitioned objects
This means that statistics are gathered for recently
modified partitions
© 2009 Oracle Corporation – Proprietary and Confidential

Gathering Statistics
The Concept of Synopses
It is not possible to simply add partition statistics
together to create an up to date set of global statistics
This is because the Number of Distinct Values (NDV)
for a partition may include values common to multiple
partitions.
To resolve this problem, compressed representations
of the distinct values of each column are created in a
structure in the SYSAUX tablespace known as a
synopsis
© 2009 Oracle Corporation – Proprietary and Confidential

Gathering Statistics
Synopsis Example
© 2009 Oracle Corporation – Proprietary and Confidential
Object Column Values NDV
Partition #1 1,1,3,4,5 4
Partition #2 1,2,3,4,5 5
NDV by addition WRONG 9
NDV by Synopsis CORRECT 5

© 2009 Oracle Corporation – Proprietary and Confidential
Using Services To Manage Resources
Services can be used to isolate different workloads
Load Query

Validation Example
Set based processing vs. row by row
© 2009 Oracle Corporation – Proprietary and Confidential
Time
H:MI:SS
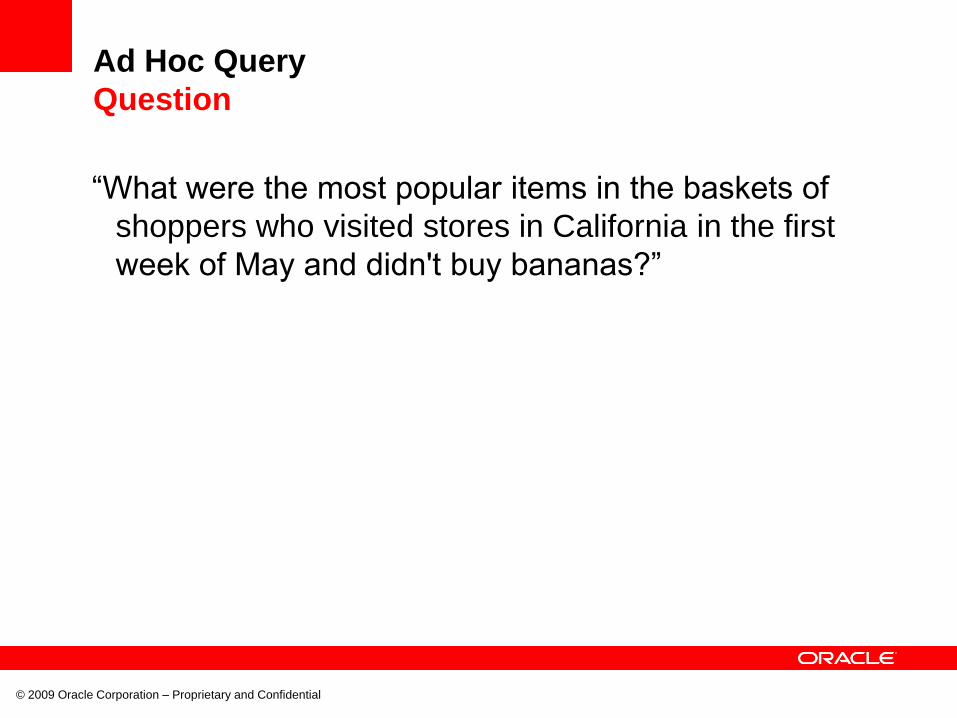
Ad Hoc Query
Question
“What were the most popular items in the baskets of
shoppers who visited stores in California in the first
week of May and didn't buy bananas?”
© 2009 Oracle Corporation – Proprietary and Confidential

Ad Hoc Query
SQL
© 2009 Oracle Corporation – Proprietary and Confidential
with qbuy as
( select rt.TRX_NBR
from DWR_ORG_BSNS_UNIT obu, DWB_RTL_TRX rt, DWB_RTL_SLS_RETRN_LINE_ITEM rsrli, DWR_SKU_ITEM sku
where obu.ORG_BSNS_UNIT_KEY = rt.BSNS_UNIT_KEY
and rt.TRX_NBR = rsrli.TRX_NBR
and rt.DAY_KEY = rsrli.DAY_KEY
and rsrli.SKU_ITEM_KEY = sku.SKU_ITEM_KEY
and rt.DAY_KEY between 20090501 and 20090507
and obu.STATE in 'CA’
and sku.SKU_ITEM_DESC = 'Bananas'),
qall as
( select rt.TRX_NBR
from DWR_ORG_BSNS_UNIT obu, DWB_RTL_TRX rt
where obu.ORG_BSNS_UNIT_KEY = rt.BSNS_UNIT_KEY
and rt.DAY_KEY between 20090501 and 20090507
and obu.STATE in 'CA')
select sku.SKU_ITEM_DESC,q.SCANS
from
( select SKU_ITEM_KEY,count(*) as SCANS,rank() over (order by count(*) desc) as POP
from qall,qbuy, DWB_RTL_SLS_RETRN_LINE_ITEM rsrli
where qall.TRX_NBR = qbuy.TRX_NBR(+)
and qbuy.TRX_NBR IS NULL
and rsrli.TRX_NBR = qall.TRX_NBR
and rsrli.DAY_KEY between 20090501 and 20090507
group by SKU_ITEM_KEY) q, DWR_SKU_ITEM sku
where q.SKU_ITEM_KEY = sku.SKU_ITEM_KEY
order by q.POP asc;
4 Table join to select all transactions buying Bananas in California in the first week of May
2 Table join to select all transactions in California in the first week of May
Join the results sets in an outer join to find the exclusions, then rank,group and sort the results

Concurrent Query Testing
Out of the Box Fixed DoP With Queuing
User 1 76 97 27
User 2 84 101 28
User 3 86 109 30
User 4 99 110 52
User 5 101 112 53
User 6 102 112 55
User 7 107 113 78
User 8 117 113 78
User 9 122 113 81
User 10 264 115 102
User 11 271 115 102
User 12 280 118 103
Average 142 111 66
© 2009 Oracle Corporation – Proprietary and Confidential

Terabyte in One Hour Breakdown
© 2009 Oracle Corporation – Proprietary and Confidential
0
45
30
15


