Thesis work Masters degree Examination of defects and long term crack growth in rolled bars during long term storage Author: Jon Scheutz Mentor: Erik Hedlund Examiner: Anders Eliasson Subject/Main area: Material science Points: 30hp Högskolan Dalarna 791 88 Falun Sweden Tel 023-77 80 00
Transcript
Thesis work
Masters degree
Examination of defects and long term crack growth in
rolled bars during long term storage
Author: Jon Scheutz Mentor: Erik Hedlund Examiner: Anders Eliasson Subject/Main area: Material science
Points: 30hp
Högskolan Dalarna 791 88 Falun Sweden Tel 023-77 80 00
Abstract
This work has had the purpose to examine defects and the cause of crack growth during long term
storage in rolled bars. The bars in question are rolled and stored at Ovako in Hofors. The problem is
approached by theoretically examining the possibilities of hydrogen damage, room temperature
creep and naturally occurring porosity.
Seven bars of three steel type groups and with different rolling dates were selected and examined for
defects with ultrasonic testing. Four of the bars show defects. Specimens containing the defects are
cut out and grinded so that the defects can be examined in the scanning electron microscope and
analyzed with energy dispersive x-ray spectroscopy.
One of the specimens shows some form of cavity containing iron carbide. One of the others shows a
surface with inclusions. The remaining two both shows inclusions and cracks that seem to originate
from inclusions.
The theoretical studies show that there are two types of hydrogen damage that could be in effect in
the studied case and also that room temperature creep could facilitate but not cause crack growth
and that porosity could serve as crack initiation points. Steps should be taken to minimize the
problems mentioned above when they are suspected causes. Further examination of inclusions in
different steel types should be made if considered a problem.
Sammanfattning
Detta arbete har haft syftet att undersöka defekter och orsaken till spricktillväxt under
långtidsförvaring av spårvalsade stänger. Stängerna i undersökningen är valsade och lagrade hos
Ovako i Hofors. Problemet är angripet genom att teoretiskt undersöka risken för väteskador, kryp i
rumstemperatur och naturligt förekommande porositet.
Sju stänger indelade i tre stålsortsgrupper och med olika valsningsdatum valdes ut och undersöktes
med ultraljud. Fyra av stängerna visade på defekter. Prov innehållande dessa defekter blev utkapade
och slipade så att defekterna kan bli undersökta i svepelektronmikroskop och analyserade med
energidispersiv röntgenanalys.
Ett av proverna visar på ett hålrum innehållande en järnkarbid. Ett av de andra proverna visar på en
yta med inneslutningar. De två återstående proverna visar på inneslutningar och sprickor som verkar
utgå från inneslutningar.
De teoretiska studierna visar att det finns två typer av väteskador som är aktuella i det studerade
fallet och även att kryp vid rumstemperatur kan underlätta spricktillväxt men inte orsaka den och att
porositet kan tjäna som sprickinitieringsställen. Åtgärder för att minimera de nämnda problemen bör
tas i fall där de är misstänkta orsaker. Ytterligare undersökningar av inneslutningsbilden bör göras om
inneslutningar anses vara ett problem.
Table of Contents 1. Introduction ..................................................................................................................................... 1
diffusion; nucleation and growth (bubble formation)
Hydrogen diffusion; nucleation and growth of bubble; steam
formation Hydrogen diffusion to voids
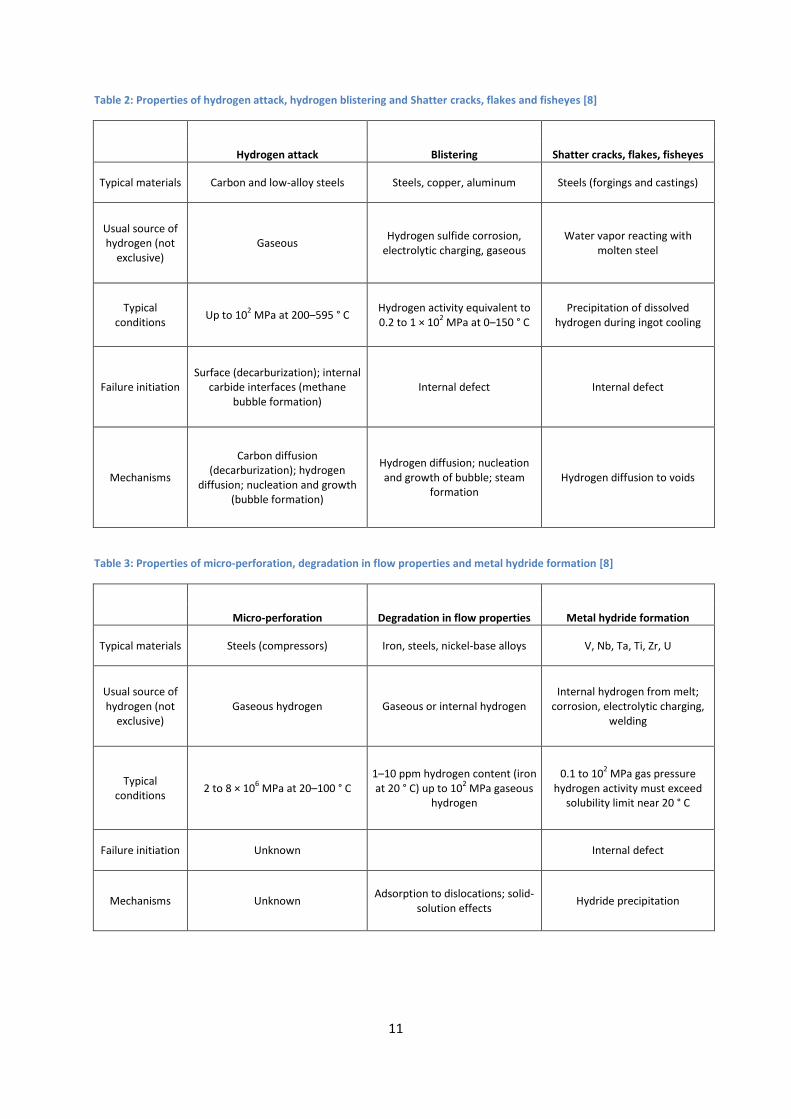
Table 3: Properties of micro-perforation, degradation in flow properties and metal hydride formation [8]
Micro-perforation Degradation in flow properties Metal hydride formation
Typical materials Steels (compressors) Iron, steels, nickel-base alloys V, Nb, Ta, Ti, Zr, U
Usual source of hydrogen (not
exclusive) Gaseous hydrogen Gaseous or internal hydrogen
Internal hydrogen from melt; corrosion, electrolytic charging,
welding
Typical conditions
2 to 8 × 10⁶ MPa at 20–100 ° C
1–10 ppm hydrogen content (iron at 20 ° C) up to 10
2 MPa gaseous
hydrogen
0.1 to 102 MPa gas pressure
hydrogen activity must exceed solubility limit near 20 ° C
Failure initiation Unknown
Internal defect
Mechanisms Unknown Adsorption to dislocations; solid-
solution effects Hydride precipitation
12
3.1. Hydrogen embrittlement Hydrogen embrittlement can be subdivided into three or four different categories. Here four types of
hydrogen damage are put under hydrogen embrittlement: [7, 8]
Loss in tensile ductility
Hydrogen stress cracking
Hydrogen environment embrittlement
Embrittlement due to hydride formation
3.1.1. Loss in tensile ductility
Loss in tensile ductility occurs when distortions of the metal lattice caused by hydrogen atoms
restricts dislocation movement. This phenomenon is only observed during slow strain rate testing
and causes no visible defects, chemical products or cracking. It becomes more pronounced as the
strain rate decreases. The extent of loss in area reduction as a function of hydrogen content is shown
in Figure 5. This kind of damage is most often encountered in lower strength steel alloys and is fully
reversible. By heating the metal it is possible to drive out the hydrogen and the rate of recovery is
dependent on time and temperature. However, if heated to temperatures above 315° C, there is
danger of high temperature hydrogen attack which will be explained in chapter 3.4. [7, 8]
Figure 5: The change in reduction in area in percent as a function of hydrogen content in ppm [7]
3.1.2. Hydrogen stress cracking
Hydrogen stress cracking (HSC), which can also be referred to as hydrogen induced cracking (HIC),
hydrogen assisted cracking (HAC), static fatigue or delayed failure, is a form of damage that affects
normally ductile metal alloys. These alloys experiences crack growth and possibly brittle fractures
during static load. These loads could be external, internal, caused by transformation, cold working or
13
hardening. The total hydrogen concentration needed can be as low as 0.1 ppm even though local
concentration values are substantially higher. Subsurface sites where the triaxial stresses are highest
are good initiation sites for cracks if there are no cracks initiated in other manners available. The
locally high hydrogen concentration ahead of the initiated crack tip then helps the subcritical crack to
grow. [7]
The fracture time increases with decreasing load down to a steel strength and hydrogen environment
dependent threshold level. Below this threshold there is no HSC. This threshold is higher for steel
with lower yield- and tensile strength and this phenomenon usually does not affect steels below
certain tensile strength levels. This means that the sensitivity to HSC increases with increasing
ultimate tensile strength as can be seen in Figure 6. For ferrous alloys there is generally also a
minimum hardness required at 22 HRC. [7]
Figure 6: Ductility versus hydrogen content for various steels at various strength levels. The numbers in parentheses indicate the ultimate tensile strength in MPa [7].
Room temperature is the ultimate temperature for HSC. At this temperature the rate of hydrogen
diffusion is such that there is a hydrogen buildup at crack nucleation sites and crack tips which is
what creates this phenomenon. The need for diffusion of hydrogen makes this a delayed fracture
mechanism dependent on hydrogen gas pressure and temperature. At temperatures well below
room temperature the hydrogen diffusion is slow which makes the buildup slow. Therefore, HSC is
not observed below -100° C. If the temperature reaches above 100° C the hydrogen tends to be
homogeneously distributed in the metal lattice and the necessary buildup might not occur. [7, 8]
14
As can be seen in Figure 7 the HSC effect is reversible. If the hydrogen is removed by baking the steel
at 150° C higher applied stress is needed for fracture after a certain time. Longer baking time
increases the applied stress necessary. This work as long as the hydrogen has not formed any
chemical bonding in the steel or if damage has already occurred before baking. [7, 8]
Figure 7: Static fatigue curves for various hydrogen concentrations obtained by different baking times at 150° C. Sharp notch strength steel specimens 1590 MPa; Normal notch strength: 2070 MPa [8]
Hydrogen can also induce cracking at slower strain rates. This hydrogen induced cracking has been
observed during mechanical testing in hydrogen environments. As for delayed failure there is a
minimum level of applied stress. This phenomenon is for the most part observed in higher strength
steels and there is similar temperature dependence. This embrittlement of steel increases with
decreasing strain rate because at higher strain rates the hydrogen does not diffuse fast enough for
embrittlement to occur. This phenomenon can be seen in Figure 8. [7, 8]
15
Figure 8: Notch tensile strength of high strength steel plotted against testing temperature for three strain rates [7, 8]
The highest resistance to embrittlement in steels is found in highly tempered martensitic structure
with equiaxed ferrite grains and spheroidized carbides evenly distributed throughout the matrix
when comparing with normalized or bainitic steels at equivalent strength levels. The resistance also
increases with decreasing prior austenitic grain size or if there is any retained austenite in the matrix.
Individual alloying elements effect on crack susceptibility is associated with their effect on heat
treatment, microstructure, and strength of the steel. Susceptibility increases with increasing
strength. Generally, carbon, phosphorus, sulfur, manganese and chromium increases susceptibility
while titanium decreases it because it decreases the amount of hydrogen available for cracking. [7, 8]
Fcc structure is relatively impermeable to diffusion of atomic hydrogen which makes the
susceptibility if austenitic steels low. If heavily cold worked there is a risk for deformation induced
martensite which increases the susceptibility of the steel. The martensitic steels are susceptible
because of their high strength while ferritic steels are highly resistant because of their low hardness.
In general, cold working and aging increases the susceptibility to cracking, the former due to the
increase in strength and the latter because of segregation of sulfur and phosphorus to the grain
boundaries. [7]
Intergranular cracks are generally observed in steels affected by hydrogen embrittlement. An
example of an Intergranular crack can be observed in Figure 9. HSC usually produces sharp singular
cracks like that one. The mode of fracture might be changed from the one normally observed into
another. At higher stress intensities there have been reports of transgranular cracks in steel. The
addition of silicon to an iron-carbon alloy also produced transgranular cracks. [7, 8]
16
Figure 9: Intergranular crack resulting from hydrogen embrittlement during chromium plating [7]
3.1.3. Hydrogen environment embrittlement
The characteristic for this kind of hydrogen embrittlement is comparable to HSC and there is
therefore some debate if it is a phenomenon of its own or if it should be seen as HSC. It is
encountered when performing plastic deformation of hydrogen free materials in hydrogen gas and it
is strain rate dependent. The pressure of the hydrogen gas is between 35 and 70 MPa and it is most
severe at room temperature just as for HSC. [7, 8]
3.1.4. Embrittlement due to hydride formation
This form of hydrogen embrittlement is found in a number of transition, rare earth and alkaline earth
metals. The formation of hydride particles makes the former ductile metal become embrittled. It
does not affect steel and is therefore not explained more thoroughly here. [7, 8]
3.2. Hydrogen blistering The phenomenon of hydrogen blistering is caused by the pressure created when atomic hydrogen
combines into molecular hydrogen. This can happen when a high enough concentration of atomic
hydrogen accumulates at internal defects such as voids or inclusions in low strength unhardened
steels. This could show as the formation of surface bulging, known as blisters, as can be seen in
Figure 10 or delamination caused by internal blistering at grain boundaries as can be seen in Figure
11. It occurs predominantly in low strength alloys. [7, 8]
Figure 10: Blisters in a carbon steel plate formed by hydrogen [7]
17
Figure 11: Delamination of a steel plate as a result of hydrogen blistering [7]
3.3. Flakes, fish-eyes and shatter cracks Flaking refers to small internal fissures that occur in steel when cooled from temperatures in the
order of 1100° C. They are also described by the terms fish-eyes and shatter cracks and are common
features of hydrogen damage in forgings, weldments and castings. At higher temperatures of
melting, welding or heat treatment in the austenitic range the solubility of hydrogen atoms is higher
than in the solidified or lower temperature bcc state. The excess hydrogen accumulates at internal
defects and the hydrogen atoms combine to form gaseous hydrogen. The mechanism for this as well
as many features of it is similar to hydrogen blistering and it may therefore be considered a special
case of hydrogen blistering. The extent of the damage is dependent on the time of exposure to a
hydrogen containing environment. [7, 8]
3.4. Hydrogen attack Absorbed hydrogen reacts with iron carbides or absorbed carbon to form hydrocarbon like methane.
This takes place in carbon and low alloy steels exposed to high pressure hydrogen gas at high
temperatures. The temperature has to be above 540° C for surface reaction and above 200° C for
internal reaction. This phenomenon is called hydrogen attack and leads to weakening of the steel
either by decarburization or by the defects and cracks generated by the hydrocarbon gas pressure.
[7, 8]
The initial point of attack is often found at areas of high stress concentration since hydrogen diffuses
to those areas. To prevent hydrogen attack from occurring it is a good idea to add carbide stabilizing
elements such as vanadium, titanium, chromium or molybdenum. It does not occur in austenitic
stainless steels which make them good choices for this kind of environments if they are suitable from
other considerations. Operation limits of carbon steel and some alloy steels are shown in the Nelson
curve in Figure 12. [7]
18
Figure 12: Nelson curves showing the operation limits of carbon and alloy steels in contact with hydrogen at high temperature and pressure [4]
3.5. Microperforation In extremely high hydrogen pressure a network of small fissures can be formed. This occurs
predominately in steels at room temperature and allows permeation of the alloy by gases and liquid.
[8]
3.6. Degradation in flow properties This is a form of hydrogen damage that occurs at ambient temperatures for iron and steel and at
elevated temperatures for several other alloy systems. [8]
3.7. Preventive methods For the different kinds of hydrogen damage there are different things that can be done to prevent
the damage from occurring. Some of the things are similar between the types while some of the
things only prevent one type of damage. [7]
3.7.1. Preventing hydrogen blistering or flaking
Blistering and flaking is similar which makes their prevention also similar and it is listed together. [6]
Inclusions play a big role in blistering and flaking. Minimizing these is a good way of
preventing blistering. Sulfur and sulfides have an especially poisonous effect on hydrogen
evolution and the usage of low sulfur steels is recommended. The addition of rare earth
elements can favor the formation of less detrimental globular sulfides. Hot rolled or
annealed steel is preferred to cold rolled. [7]
Material selection plays a big role in preventing blistering and flakes. It is good to avoid steels
that contain a lot of voids like rimmed steels. Nickel containing steels are good since they
generally have low hydrogen diffusion rates. [7]
In finished products like tanks and containers, coatings can be used to prevent hydrogen
penetration from the environment. [7]
Removal of sulfides, arsenic compounds, cyanides and phosphorus containing ions greatly
reduces hydrogen blistering. [7]
19
When expecting hydrogen blistering design aspects has to be considered. For example,
external support pads should not be continuously welded to the vessel itself to avoid
hydrogen entrapment at the interface. [7]
The decreased solubility of hydrogen in bcc structured steel compared to the fcc structure
leads to flaking when cooling steel from high temperature. The faster the cooling is the more
aggravated the damage gets because of hydrogen sensitive martensitic microstructure
forming. At slower cooling rates the hydrogen will also have more time to be released from
the steel and thereby eliminating the damage. [7]
3.7.2. Preventing hydrogen embrittlement
In general, the susceptibility to hydrogen embrittlement increases with increasing tensile
strength. For many steels a stress threshold exists. For non-acidic environments the
threshold is considered to be around 1000 MPa. Choosing materials below this threshold
and/or below 22 HRC is a good way to prevent this kind of damage. [7, 8]
To remove hydrogen from a steel baking can be used. It is a heat treatment at low
temperature (up to 200° C) for a longer period of time; se Figure 7.This can restore the
mechanical properties almost to their normal levels as long as no irreversible damage has
occurred. Heat treatment to improve the microstructure, especially untempered martensite
which is the most susceptible phase, is a good way to prevent hydrogen embrittlement.
Quenched and tempered microstructures fairs better than normalized and tempered ones.
[7]
Alloying the steel with hydride forming elements like titanium, molybdenum and vanadium
reduces susceptibility. [7]
Pickling is often the source for hydrogen pickup. The addition of inhibitors to reduce the
corrosion of the base metal can largely decrease hydrogen pickup. [7]
Proper cleaning and degreasing procedures and the use of dry electrodes and maintenance
of dry conditions is important for avoiding hydrogen embrittlement when welding.
Preheating and a postweld heat treatment are also recommended. [7]
If the steel is in a gaseous environment the addition of 0.4-0.7 % oxygen is efficient at
inhibiting the hydrogen embrittlement in the steel. This is though not effective in hydrogen
sulfide gas environments. [7]
3.7.3. Preventing hydrogen attack
Carbide forming elements like chromium and molybdenum increases the resistance to
hydrogen attack. Low carbon content should be used as higher carbon content means
decreased resistance. Austenitic stainless steels are immune to hydrogen attack but atomic
hydrogen can still diffuse through thin sections and can affect nonresistant substrate
materials. [7]
The operation limit of any steel regarding hydrogen attack can be found in its Nelson curve,
se Figure 12 for an example. The curves are based on long term refinery experience rather
than laboratory studies and they are reviewed regularly. [7]
20
3.8. Room temperature creep Time dependent plastic deformation is generally considered a high temperature phenomenon, above
0.4 times the melting point (about 440° C). But a form called room temperature creep (RTC) is
common behavior in most steels and alloys such as stainless steels, pipeline steels and high strength
steels. This deformation is the result of mobile dislocations and the creep rate gradually decreases
and reduces to zero when the dislocation density is exhausted. Therefore, RTC alone may not cause
serious failure in components. However it may affect stress corrosion cracking by causing local
rupture of the surface passivation film or by enhancing hydrogen diffusion through dislocation
movement. RTC is an important factor affecting crack propagation behavior even though no direct
crack propagation is observed due to it even after hold times of several days. [9, 10]
3.9. Ultrasonic testing Ultrasonic testing is more than 40 years old. It uses ultrasonic oscillations for detection of flaws in
different materials. The principle is based on that solid materials are good conductors of sound
waves. The sound waves are not just reflected on the interfaces but also on internal flaws. An
ultrasonic pulse is transmitted into the material. Reflected parts of the ultrasonic pulse generate an
electric signal that is displayed. Internal flaws as well as the edges of the material generate this
signal. [11]
To determine the sizes of any internal flaws, a reference flaw, called a flat bottom hole, of known size
is analyzed. The strength of the ultrasonic signal from the material tested is then compared to the
value from the flaw of known size. The result size is presented as percentage of the known flaw size.
[11]
21
4. Materials Here there will be a brief description of the different steel types and their properties and possible
application. In Table 4 a list of the different steel specimens with their steel types, diameter, rolling
date, charge number and a brief description is shown. All of the steel specimens were round bars
rolled with profile rolling.
Table 4: A list of Ovako steel type, diameter, rolling date, Ovako charge number and a brief description for the materials tested
Ovako steel type
Diameter (mm)
Rolling date (y-m-d)
Ovako charge number
Description of steel type
157C 190 2012-11-12 V9083 Ovako 157 is a high cleanliness case hardening steel used for bearing and transmission components.
157B 190 2012-06-03 V7817
157B 190 2012-03-10 V6337
826B 190 2013-03-13 D1103 Ovako 826B is a through hardening bearing steel that is mainly used for medium and large sized bainitic bearing rings, but it can also be used for machine components that require high tensile strength, hardness and toughness.
826B 190 2011-10-23 V5265
281P 210 2013-03-06 D1051 Ovako 281 is an oil and water hardening microalloyed steel. Used for machine components etc. that require high tensile strength, good machinability and weldability
281T 210 2011-12-11 V5845
In Table 5 the composition of the different steel types, their approximate hardness values (HB) and
Tabular HRC and HV values derived from those are shown.
Table 5: Official composition of the steel types, their given HB values and tabular HRC and HV values [12-18]
Ovako steel type
Composition in weight%
C Si Mn P S Cr Ni Mo Approximate hardness after hot rolling (HB)
Tabular HRC
Tabular HV
157 B min 0.17 0.20 0.55 - - 0.50 1.65 0.90 250 25 250
For every charge at Ovako the hydrogen amount is measured and registered. The registered values
for the charges used in this work are given in Table 6.
22
Table 6: The amount of hydrogen in parts per million measured in each of the charges that the specimens used came from [12]
Charge number H (ppm)
V9083 1.1
V7817 1.1
V6337 1.1
D1103 1.0
V5265 0.7
D1051 1.7
V5845 0.7
Figure 13, Figure 14 and Figure 15 shows CCT diagrams for the different steel types. Since Ovako in
Hofors do not produce a finished product they are cooled in air and the exact cooling speed is not
known and therefore neither is the exact structure they end up with. [12]
Figure 13: CCT diagram for Ovako steel type 157C [12]
23
Figure 14: CCT diagram for Ovako steel type 826B [12]
Figure 15: CCT diagram for Ovako steel type 281P [12]
24
5. Methods and equipment Several sources of information was found and used to formulate an initial approach to the task. Then
the steel type to be studied was selected. Here consideration had to be taken to what material was
available. Three different steel types were selected where both materials newly rolled and material
with older rolling dates was available.
5.1. Ultrasonic testing The selected bars were examined with portable ultrasonic testing to find a part with an available
defect to study. Two pieces were cut out from each bar, se Figure 16. One of the two was between 2
and 3 dm long and the other was between 1 and 2 dm long. The smaller one was cut out to include
defects if any were found. The longer were cut out next to it.
Figure 16: Picture of the cut out pieces from three bars of steel type 157B and 157C.
The longer one was send to Ovako’s lab where they were annealed and cut into a rectangular shapes
around its center and analyzed in their ultrasonic testing machine calibrated against a 0.2mm FBH.
The shorter ones were sent to Högskolan Dalarna. At Högskolan Dalarna an ultrasonic examination
were made to try and localize the defects. The ultrasonic testing equipment used was Karl Deutsch D-
5600 Wuppertal 1 type: 1013.0511 F-Nr 3033. With the nozzle: Karl Deutsch s12 HB4 art.nr
1411.0031 F-Nr 3105.
5.2. XRF analysis The specimens that defects were found in were cut, during water cooling, into smaller pieces. The
pieces where the defects were located were examined with the same ultrasonic testing equipment
again to get a better estimation of the defect location. Then they were cut so that the pieces
containing defects only needed to be cut once or twice more to be of appropriate size for grinding. At
this stage the pieces containing defects were by mistake mixed with a few pieces without defects.
25
Two or three pieces of each steel type were present in this mix. A few was possible to identify by
visual cue. To identify all of them X-ray fluorescence (XRF) analysis were used. The equipment used
was Thermo Scientific Nitron XL3t XRF Analyser.
To have something to compare with pieces from all of the involved material was used as a reference.
From comparing the composition of these pieces with the result of the XRF analysis it was possible to
sort out most of the pieces. To separate the ones with very similar composition from each other
visual cues and their dimension was used to link them to each other and to the right steel type. It was
possible to determine which pieces that contained defects by visual markings distinguishable when
sorted in groups of each steel type.
5.3. Defect examination The final cutting of the pieces with defects was made so that they were of the appropriate size for
grinding. These were then grinded approximately 0.3mm at a time with 320P grinding paper. After
grinding 0.3mm a 800P grinding paper was used to create a finer surface. The surface was then
examined in an optical microscope to search for internal defects. This was repeated until a surface
with defects was found. Example pictures were taken with the optical microscope of the found
defects.
If the defect found was in the form of a crack or cracks the specimen were grinded with 1200P
grinding paper to create a finer surface and then etched with a 3% Nital solution. If the defect was in
the form of a pit or pits the specimen was not grinded further or etched. These samples were then
examined in a scanning electron microscope and the compositions of the bulk material as well as any
interesting defects found were analyzed with energy-dispersive X-ray spectroscopy.
5.4. Hardness testing Pieces without defect were cut from each of the original specimens except one. The two specimens
from the steel type 826B proved hard to cut because of their hardness. To cut out a piece from one
of them an angle grinder was forced to be used. Cooling by water could only be made while not
cutting which made the possibility of heating effects higher. Therefore only one of the original
specimens was cut up. These pieces were cut into the appropriate size and baked into bakelite pucks.
These steel specimens were then tested for their hardness by two methods. HRC with a HRC LECO
KT-240 hardness tester with a load of 150kg and HV with a Vickers Matsu Zawa MxT50 Micro
hardness tester with a load of 1Kg.
For HRC five test of each specimen was done and an average calculated. For HV three tests were
done for each specimen with an average calculated. From the HV values an estimated tensile
strength were calculated.
26
6. Results
6.1. Hardness testing Measured hardness values and tensile strength estimated from the HV value are shown in Table 7
and Table 8.
Table 7: Measured hardness value in HRC for the tested specimens.
Ovako charge number Steel type HRC1 HRC2 HRC3 HRC4 HRC5 Average HRC
V9083 157C 10 16 38 14 38 23
V7817 157B 51 20 35 32 21 32
V6337 157B 20 19 19 25 33 23
D1103 826B 37 36 37 37 45 38
D1051 281P 5 9 7 24 25 14
V5845 281T 13 18 19 22 16 18
Table 8: Measured hardness value in HV and estimated tensile strength for the tested specimens.
Ovako charge number Steel type HV1 HV2 HV3 Average HV Estimated tensile strength (3,33*HV) [18]
V9083 157C 260.6 234.3 253.6 250,0 833
V7817 157B 264.3 265.6 264.3 265,0 882
V6337 157B 272.7 258.1 246.1 259,0 863
D1103 826B 380 390 324.8 365,0 1216
D1051 281P 250.1 272.1 243.8 255,0 849
V5845 281T 263.7 280.5 239.1 261,0 869
6.2. Ultrasonic testing Four of the seven selected bars showed signs of defects when using ultrasonic testing at Ovako. The
cut out pieces from the same bars also showed defects when tested at Högskolan Dalarna. These can
be seen in in Table 9.
Table 9: This table shows which of the seven bars that showed signs of defects when using ultrasonic testing at Ovako and Högskolan Dalarna and if the signal came from a single point or from an area
Ovako charge number
Steel type
Defect found at Ovako (ultrasonic testing)
Defect found at Högskolan Dalarna (ultrasonic testing)
V9083 157C Yes Yes (signal from one point)
V7817 157B Yes Yes (signal from an area)
V6337 157B Yes Yes (signal from an area)
D1103 826B No No
V5265 826B No No
D1051 281P Yes Yes (signal from an area)
V5845 281T No No
In Figure 17-Figure 23 the results from the ultrasonic testing in the lab at Ovako are shown. The test
is calibrated so that 100% = 0.2 mm flat bottom hole.
27
Figure 17: Ultrasonic testing in the lab at Ovako for steel specimen with charge number v9083, steel type 157C and rolling date 2012-11-12
Figure 18: Ultrasonic testing in the lab at Ovako for steel specimen with charge number v7817, steel type 157B and rolling date 2012-06-03
28
Figure 19: Ultrasonic testing in the lab at Ovako for steel specimen with charge number v6337, steel type 157B and rolling date 2012-03-10
Figure 20: Ultrasonic testing in the lab at Ovako for steel specimen with charge number D1103, steel type 826B and rolling date 2013-03-13
29
Figure 21: Ultrasonic testing in the lab at Ovako for steel specimen with charge number v5265, steel type 826B and rolling date 2011-10-23
Figure 22: Ultrasonic testing in the lab at Ovako for steel specimen with charge number D1051, steel type 281P and rolling date 2013-03-06
30
Figure 23: Ultrasonic testing in the lab at Ovako for steel specimen with charge number v5845, steel type 281T and rolling date 2011-12-11
6.3. XRF analysis Table 10 shows the results from the XRF analysis of the pieces that were mixed together. From this
information and from visual comparison it was possible to figure out which pieces that was from the
same charge number. The ones named are the reference pieces or pieces possible to identify with
visual cues. The latter ones are the ones whose names are followed by a 2.
Table 10: Results from the XRF analysis of the mixed together specimens and the reference pieces.
SAMPLE Fe Cr Ni Mn Mo Cu V
unknown1 96.17 0.52 1.72 0.60 0.27 0.06 -
unknown2 95.99 0.45 1.84 0.52 0.97 0.19 -
unknown3 96.13 0.43 1.74 0.51 0.98 0.17 -
unknown4 97.89 0.23 0.10 1.41 0.04 0.20 0.12
unknown5 97.54 0.24 0.13 1.40 0.03 0.14 0.13
unknown6 96.14 0.43 1.70 0.52 1.00 0.18 -
d1051 97.89 0.23 0.10 1.41 0.04 0.15 0.11
d1051,2 97.86 0.25 0.12 1.42 0.04 0.17 0.10
v6337 96.05 0.44 1.78 0.49 0.96 0.18 -
v6337,2 95.96 0.43 1.83 0.51 1.00 0.20 -
v7817 96.03 0.44 1.69 0.53 1.01 0.15 -
v9083 96.17 0.51 1.64 0.63 0.27 0.07 -
v9083,2 96.06 0.52 1.78 0.60 0.26 0.07 -
31
6.4. Optical microscope analysis Pictures taken in optical microscope of the defects surfaces examined further are shown in Figure 24-
Figure 27.
Figure 24: Picture from optical microscope showing a defect in the steel with charge number v9083. The picture width is 210 µm
Figure 25: Picture from optical microscope showing defects in the steel with charge number v7817. The picture width is 520 µm
32
Figure 26: Picture from optical microscope showing defects in the steel with charge number v6337. The picture width is 1030 µm
Figure 27: Picture from optical microscope showing defects in the steel with charge number d1051. The picture width is 210 µm
33
6.5. Electron scanning microscope analysis
6.5.1. Steel specimen with charge number v9083
In this specimen one defect was found. EDX analysis of the bulk material was made in an area and on
one point in the defect. The results are shown in Figure 28 and Table 11.
Table 11: Bulk Material and defect EDX analysis and compositions
Figure 28: Bulk Material and defect EDX analysis and compositions
6.5.2. Steel specimen with charge number v7817
In this specimen one chain of defects were found as well as several smaller defects. EDX analysis of
the bulk material as well as on representative defects was made. A SEM picture of a chain of defects
in the sample is shown in Figure 30. The defect length is in the rolling direction. The results from the
EDX analyses are shown in Figure 29, Figure 31, Table 12 and Table 13.
Bulk material composition (Pink area)
Element Weight% Atomic%
Si 0.50 1.00
Cr 0.68 0.73
Mn 0.68 0.69
Fe 95.79 95.50
Ni 1.96 1.86
Mo 0.39 0.23
Defect point composition (rightmost point)
Element Weight% Atomic%
C 18.63 51.41
Si 0.50 0.59
Cr 0.50 0.32
Mn 0.70 0.42
Fe 78.16 46.40
Ni 1.52 0.86
34
Table 12: Bulk Material and defect EDX analysis and compositions for steel specimen with charge number v7817
Figure 29: Bulk Material and defect EDX analysis and compositions for steel specimen with charge number v7817
Figure 30: SEM picture of a chain of defects in steel specimen with charge number v7817. Picture width is 250 µm.
Bulk material composition (Pink area)
Element Weight% Atomic%
Si 0.38 0.75
Cr 0.47 0.50
Mn 0.54 0.55
Fe 95.78 95.95
Ni 1.61 1.54
Mo 1.22 0.71
Defect point composition (topmost point)
Element Weight% Atomic%
Mg 0.34 0.59
S 38.21 51.28
Cr 0.62 0.51
Mn 58.22 45.60
Fe 2.61 2.01
35
Table 13: EDX analysis of two points in the defect in Figure 30
Figure 31: EDX analysis of two points in the defect in Figure 30
6.5.3. Steel specimen with charge number v6337
In this specimen several chains of defects were found. Three pictures of three of them can be found
in Figure 32-Figure 34. The defect length is in the rolling direction. EDX analysis of the bulk material
as well as on two representative parts of the defects was made. The results of the analysis of the bulk
material and the defects are shown in Figure 35, Figure 36, Table 14 and Table 15. There were also
small darker defects in this sample that is not captured in the pictures.
Figure 32: SEM picture of a chain of defects in steel specimen with charge number v6337. Picture width is 730 µm.
Composition at the left point
Element Weight% Atomic%
Mg 2.22 3.83
Al 0.65 1.00
Si 0.19 0.28
S 38.25 49.93
Ca 0.95 0.99
Cr 0.34 0.27
Mn 54.97 41.88
Fe 2.43 1.82
Composition at the right point
Element Weight% Atomic%
O 46.07 59.93
Mg 9.13 7.82
Al 37.62 29.02
S 1.94 1.26
Mn 3.44 1.30
Fe 1.80 0.67
36
Figure 33: SEM picture of a chain of defects in steel specimen with charge number v6337. Picture width is 250 µm.
Figure 34: SEM picture of a chain of defects in steel specimen with charge number v6337. Picture width is 370 µm.
37
Table 14: Bulk Material and defect EDX analysis and compositions for steel specimen with charge number v6337
Figure 35: Bulk Material and defect EDX analysis and compositions for steel specimen with charge number v6337
Table 15: EDX analysis of the defect point and its compositions for steel specimen with charge number v6337
Figure 36: EDX analysis of the defect point and its compositions for steel specimen with charge number v6337
Composition of the bulk material (pink area)
Element Weight% Atomic%
Si 0.44 0.87
Cr 0.56 0.60
Mn 0.68 0.70
Fe 94.94 95.15
Ni 1.92 1.83
Mo 1.47 0.86
Defect point composition (rightmost point)
Element Weight% Atomic%
S 37.12 50.33
Cr 0.26 0.22
Mn 55.42 43.85
Fe 7.19 5.60
Defect point composition
Element Weight% Atomic%
S 37.26 50.46
Cr 0.26 0.22
Mn 58.55 46.28
Fe 3.92 3.05
38
6.5.4. Steel specimen with charge number D1051
In this specimen a lot of defects were scattered about on the surface. A SEM picture is shown in
Figure 37. EDX analysis of the bulk material as well as on two representative defects was made. The
results of the analysis of the bulk material and a few representative analyses of the defects are
shown in Figure 38 and Table 16.
Figure 37: SEM picture of steel specimen with charge number D1051. Picture width is 1180 µm.
39
Table 16: Bulk Material and defect EDX analysis and compositions for steel specimen with charge number D1051
Figure 38: Bulk Material and defect EDX analysis and compositions for steel specimen with charge number D1051
Composition of the bulk material (pink area)
Element Weight% Atomic%
Si 0.42 0.82
Cr 0.35 0.37
Mn 1.60 1.62
Fe 97.64 97.19
Defect point composition (bottommost point)
Element Weight% Atomic%
Mg 0.72 1.27
Al 0.44 0.70
S 37.65 50.25
Ca 0.62 0.67
Mn 56.88 44.30
Fe 3.68 2.82
Defect point composition (topmost point)
Element Weight% Atomic%
O 47.31 60.87
Mg 8.62 7.30
Al 39.55 30.17
Fe 4.51 1.66
40
7. Discussion
7.1. Theoretical study of hydrogen damage, creep and porosity When evaluating hydrogen damage two kinds are applicable to this situation, hydrogen stress
cracking and shatter cracks. For hydrogen stress cracking the main mechanism is internal diffusion to
stress concentrations where crack initiation leads to failure. The steels that were examined contained
between 0.7 and 1.7 ppm hydrogen and HSC can occur with as little as 0.1 ppm hydrogen content. All
the tested steels had HRC values above the minimum of 22 and estimated tensile strength above 800
MPa. All this and the fact that this is observed between -100° and 100° Celsius make it a theoretically
possible phenomenon for the situation. [7, 8]
Shatter cracks typically occur in forgings and castings. The source of hydrogen is most often water
vapor that reacts with the molten steel. Since Ovako do not preheat the scrap metal before melting
this could be a source for that water vapor. Other sources could be water from the slag or from the
refractory material in the furnace. Excess hydrogen created from its lower solubility in bcc than fcc
diffuse to internal defects like voids or inclusions where the hydrogen atoms form hydrogen
molecules. The pressure can then give the stresses necessary to form internal defects known as
flakes. [7, 8]
Except for lowering the hydrogen content the ways to avoid these two hydrogen damage types differ
a bit. For HSC baking is usable as long as irreversible damage has not yet occurred. If possible it is also
a good idea to choose materials below 22 HRC and 1000 MPa tensile strength. For shatter cracks
minimizing inclusions and voids is important. Sulfides are also important to consider since they
increase the potential of the hydrogen. Slowing down the cooling rate also decreases the risk of
shatter cracks. [7, 8]
Room temperature creep is a mechanism that can facilitate hydrogen diffusion which could increase
the risk of hydrogen damage. RTC itself does not pose a big threat because it does not propagate
cracks on its own. Avoiding pores could be a good way to decrease the available defects to which the
hydrogen diffuses. Pores in themselves do not apply any tension since they are just a void in the steel
matrix but they are a stress concentration point and therefore sensitive to stresses of different kinds.
[3, 6, 11]
The best way to seal pores is to make sure the ingots is deformed enough during forming. To achieve
this, bigger ingots could be used. Or it is possible to consider forging instead of rolling for large
dimensions since forging deforms the steel more. [4, 5]
7.2. Ultrasonic testing and XRF analysis When doing the ultrasonic testing at Ovako it was not known which part of the bar the pieces came
from. Because of different amounts of segregation in different parts of the ingot after casting it is not
possible to compare the ultrasonic analysis to each other. Even if comparing those of the same steel
type to each other only those from steel type 826B shows more defects in the older specimen
compared to the newer. [2, Figure 17-Figure 23]
When looking at the XRF analysis of the unknown samples (after accidentally mixing them together)
it is possible to identify most immediately. Unknown4 and unknown5 both contain vanadium. The
only steel type that contains this element is the one with charge number d1051 which means that
41
these two are of that steel type. Unknown1 contains 0.27 weight% molybdenum. The only steel type
that contains this amount is the one with charge number v9083 which means that this on is of that
type. The ones that are left have very equal composition which is not strange because they are of the
same steel type. They were separated by visual comparison instead which was possible because of
size differences. [Table 5, Table 10]
7.3. Examination in optical and electron scanning microscope As can be seen in the pictures from the optical microscope, defects were found in all the samples
were defects were indicated by ultrasonic testing. The steel specimen with charge number v9083
shows some form of pit or void while the others show one or more cracks. Except in the case of the
steel specimen with charge number v9083 the defects on these pictures might not have been the
ones studied in the scanning electron microscope. This is because these samples had to be grinded
with 1200p paper. This removes some of the material meaning it is not the exact same surface
studied in SEM as in optical microscope. [Table 9, Figure 24 - Figure 27]
The SEM analysis of the steel specimen with charge number v9083 shows a pit of some sort. The bulk
materials composition is in many cases slightly higher than the given intervals. The analysis of the
defect point shows a high amount of carbon. If the fact that the SEM analysis overestimates carbon
content is taken into account the analyzed particle is likely to be some kind of iron carbide. The
amounts of other alloying elements probably come from the surrounding bulk material. [Table 11,
Figure 28]
For the steel specimen with charge number v7817 there seems to be a number of different
inclusions. The first one contains manganese, sulfur, magnesium, chromium and iron. The iron and
chromium is most likely from the bulk material. The similar atomic percentages of manganese and
sulfur indicate a manganese sulfide inclusion. The shape also indicates a ductile inclusion like that
one. The magnesium is probably from a magnesium oxide. Unless found in large amounts oxygen is
omitted from the analysis since it cannot be quantified accurately. [1, Table 12, Table 13, Figure 29 -
Figure 31]
The first point on the second inclusion also contains high amounts of manganese and sulfur which
again indicates a manganese sulfide. The iron and chromium is most likely from the bulk. The
calcium, aluminum, magnesium and silicon are probably from calcium silicates, calcium aluminates,
aluminum and magnesium oxides and/or MgO-Al2O3-spinels. The second point on the inclusion
contains high amounts of aluminum and oxygen. This indicates an aluminum oxide. The iron is from
the bulk. The manganese and sulfur probably from a manganese sulfide close by. The magnesium is
either from magnesium oxide or from MgO-Al2O3-spinels or both. [1, Table 12, Table 13, Figure 29 -
Figure 31]
The analysis of the other inclusions seen in the pictures was omitted because they have similar
composition as the ones already analyzed. The darker ones are aluminum oxide and the lighter ones


![FATIGUE CRACK INITIATION AND PROPAGATION IN … Library/101. Fatigue Crack... · 3 or predict fatigue life [15, 20]. In this paper we have conducted a detailed examination of fatigue](https://static.documents.pub/doc/80x56/5ab7a8aa7f8b9ad5338bd8f5/fatigue-crack-initiation-and-propagation-in-library101-fatigue-crack3-or.jpg)
