EXAMINATION OF THE COMPONENTS OF THE INTERIM FISCAL POLICY PAPER WHICH WAS LAID BEFORE THE HOUSES OF PARLIAMENT
ON SEPTEMBER 26, 2017
INDEPENDENT AUDITOR’S REPORT THE AUDITOR GENERAL OF JAMAICA
APRIL TO JULY 2017
Examination of FPP FY2017/2018 Interim Report Ministry of Finance and the Public Service
October 2017
2
The Auditor General is appointed by the Governor General and is required by the Constitution, Financial Administration and Audit Act, other sundry acts and letters of engagement, to conduct audits at least once per year of the accounts, financial transactions, operations and financial statements of central government ministries and departments, local government agencies, statutory bodies and government companies. The Department is headed by the Auditor General, Pamela Monroe Ellis, who submits her reports to the Speaker of the House of Representatives in accordance with Section 122 of the Constitution of Jamaica and Section 29 of the Financial Administration and Audit Act. This report was prepared by the Auditor General’s Department of Jamaica for presentation to the House of Representatives.
Auditor General of Jamaica
Auditor General’s Department
40 Knutsford Boulevard
Kingston 5, Jamaica, W.I.
www.auditorgeneral.gov.jm
Examination of FPP FY2017/2018 Interim Report Ministry of Finance and the Public Service
October 2017
3
Table of Contents
The Auditor General’s Review ........................................................................................................................ 5
Responsibilities of the Minister of Finance ................................................................................................ 5
Responsibilities of the Auditor General ...................................................................................................... 6
Methodology .............................................................................................................................................. 6
Key Comments ............................................................................................................................................ 7
Recommendation ....................................................................................................................................... 8
Part A: Fiscal Management ............................................................................................................................. 9
Total Debt ................................................................................................................................................... 9
Tax Revenue .............................................................................................................................................. 10
Bauxite Levy .............................................................................................................................................. 11
Non-Tax Revenue ...................................................................................................................................... 12
Grants ....................................................................................................................................................... 13
Wages and Salaries .................................................................................................................................. 14
Interest Cost .............................................................................................................................................. 15
Recurrent Programme Expenditure .......................................................................................................... 16
Capital Expenditure .................................................................................................................................. 17
Primary Balance ........................................................................................................................................ 18
Fiscal Balance ........................................................................................................................................... 19
Part B: Deviation of the Fiscal Indicators ..................................................................................................... 20
Examination of FPP FY2017/2018 Interim Report Ministry of Finance and the Public Service
October 2017
4
This page is intentionally left blank
Bauxite Alumina Aluminium
Examination of FPP FY2017/2018 Interim Report Ministry of Finance and the Public Service
October 2017
5
The Auditor General’s Review
1. I have examined the components of the Fiscal Policy Paper FY2017/18 Interim Report. The Fiscal
Policy Paper FY2017/18 Interim Report was tabled in Parliament on September 26, 2017, within
six months of the passage of the Appropriation Act, in keeping with the requirement of the
Financial Administration and Audit (FAA) Act.
2. The report comprised the Fiscal Responsibility Statement, Macroeconomic Framework and Fiscal
Management Strategy. I reviewed the outturn for FY2016/17, the fiscal performance for April to
July 2017 and projections to end FY2017/18 and medium-term.
Responsibilities of the Minister of Finance
3. Section 48B(2) of the FAA Act provides that:
“Upon presentation of the annual Estimates of Revenue and Expenditure, the Minister shall lay
before both Houses of Parliament –
a) a Fiscal Policy Paper containing the information specified in the Third Schedule and setting out, in accordance with this section – i. a Fiscal Responsibility Statement;
ii. a Macroeconomic Framework; and iii. a Fiscal Management Strategy.”
4. Section 48E of the Financial Administration and Audit (FAA) (Amendment) Act requires that the
Minister shall cause to be tabled in both Houses of Parliament within six months of the passage
of the Appropriation Act for the financial year to which the relevant Estimates of Revenue and
Expenditure relate, a Fiscal Policy Paper which shall, in addition to the matters set out in the
Third Schedule, include:
b) The outturn of the previous financial year;
c) The performance of the first quarter of the financial year;
d) Projections to the end of the current financial year; and
e) Projections for the succeeding financial year and medium-term.
5. Section 48B (5(d) (ii) of the FAA Act requires the Minister to compare the outcome of the fiscal
indicators with the targets established for the previous financial year and give reasons for any
deviations.
6. Section 48D of the FAA Act requires that, the Minister shall act in conformity with the following fiscal management principles:
a) The total debt is to be reduced to, and thereafter maintained at a prudent and sustainable level;
b) Fiscal risks are to be managed prudently with particular reference to their quality and level;
Examination of FPP FY2017/2018 Interim Report Ministry of Finance and the Public Service
October 2017
6
c) Borrowings are to be geared toward investment activities that support productivity and economic growth; and
d) Expenditure is to be managed in a manner that is consistent with the level of revenue.
Responsibilities of the Auditor General 7. My responsibility, as set out in Section 48B (6) of the FAA Act, is to examine the components of
the Fiscal Policy Paper and provide a report to the Houses of Parliament indicating whether:-
a) the conventions and assumptions underlying the preparation of the Fiscal Policy Paper
comply with the principles of prudent fiscal management specified in Section 48D;
b) the reasons given, pursuant to subsection (5) (d) (ii) are reasonable having regard to the
circumstances;
c) pursuant to my application of criteria prescribed pursuant to regulations made under
Section 50 (1), there are public bodies that do not form part of the specified public
sector, and identifying those bodies (if any) which in the preceding financial year formed
part of the specified public sector;
d) a public private partnership involves only minimal contingent liabilities accruing to the
Government.
Methodology 8. In examining the FPP FY2017/18 Interim report, I reviewed the following:
The Fiscal Policy Paper for FY2017/18 and Errata (February 2017);
The outturn for FY2016/17 relative to budget in the context of projections at February
2017 and September FY2016/17; as well as the evidence and clarifications provided by
the Ministry of Finance and Public Service (MoFPS) regarding deviation from targets;
Projections provided to end FY2017/18 and the medium-term including an assessment of
fiscal risks; and
Other information from the MoFPS and publications from other external sources.
9. I also performed other procedures considered necessary to enable the review process. In the
conduct of my review of the FPP FY2017/18 Interim report, I adhered to the standards issued by
the International Association of Supreme Audit Institutions and International Standard on
Assurance Engagement (ISAE) 3000 – Assurance Engagements Other than Audits or Reviews of
Historical Information, issued by the International Auditing and Assurance Standards Board.
Examination of FPP FY2017/2018 Interim Report Ministry of Finance and the Public Service
October 2017
7
Key Comments
10. My comments are largely related to the information provided on central government
performance; supported by information from other credible sources, where applicable. Notably,
the Interim FPP Report was provided for my review on October 2, 2017, one week after tabling.
11. The Interim Report contained the outturn for FY2016/17 compared to budget, the performance
for April to July 2017 and projections to the end of FY2017/18 and the medium-term. Whereas I
am required under Section 48B (6) (b) of the FAA Act to confirm that the reasons given for
deviations are reasonable, I could not verify this for Non-Tax revenue as no explanation was
provided for the wide variation between the actual outturn and the estimate in the February FPP.
Non-Tax revenue was estimated to exceed budget for FY2016/17 by 13.4 per cent, whereas the
Interim FPP reported actual Non-Tax Revenue as being below budget by 7.2 per cent.
12. In conducting my assessment of the February FY2017/18 FPP, I had sought to clarify whether
there was a change in the bauxite levy regime as stated in that report. Although the Ministry
subsequently responded that there was no change, the Interim FPP FY2017/18 indicates that a
decline in the FY2017/18 budget for Bauxite Levy reflects the GOJ’s decision to enter into a
profit-sharing arrangement as part of a temporary change in the bauxite levy regime. This is
contrary to the Ministry’s previous response. In correspondence dated October 23, 2017, the
Ministry stated, “the Bauxite Levy Act had not been removed or repealed. So the provisions of
the Bauxite Levy Act can be re-imposed by the Minister subject to terms and conditions of MOUs
with the particular bauxite entity.”
13. The Interim FPP FY2017/18 report indicated that the final wage settlement for public sector
workers could exceed the contingency provision in the budget. This is a risk to the expenditure
budget and the overall fiscal programme, which requires the attainment of the legislated target
of 9 per cent of GDP by FY2018/19. Of note, Section 48D of the FAA Act requires that fiscal risks
are to be managed prudently with particular reference to their quality and level.
14. The Interim FY2017/18 FPP ascribed the continued reduction in debt servicing costs for
FY2016/17 and for the April to July 2017 period, mainly to the execution of liability management
operations, delays in debt management operations and a stronger than expected Jamaica Dollar.
However, the Report did not provide a value for the savings in interest payments arising from
liability management operations to enable an assessment of reasonableness.
15. Reference was made to Public Private Partnerships (PPPs) transactions in progress and further,
that the Enterprise Team had approved the Business Case and Procurement Plan for the Schools
Solar Energy PPP in August 2017. In accordance with the FAA Act, I am required to assess
whether ‘a public private partnership involves only minimal contingent liabilities accruing to the
Government’. This assessment would be undertaken once the business case and financial
Examination of FPP FY2017/2018 Interim Report Ministry of Finance and the Public Service
October 2017
8
arrangements are finalized. However, in a context where the Schools Energy project is a
‘Government Pays PPP’1, an assessment for contingent liability risk would not be relevant, as the
contingent liability risk is explicit with clear fiscal implications for the GOJ.
Recommendation
16. In the interest of transparency and in accordance with the FAA Act, the Ministry should ensure
that it provides reasonable explanations for deviations particularly where outturns are
significantly at variance with previous estimates indicated in the FPPs.
Pamela Monroe Ellis, FCCA, FCA, CISA Auditor General
1 Government Pays– Project that requires GOJ funding/ support for operations, e.g. schools or hospitals. This will be covered in
the budget as well as the public debt ceiling.
Examination of FPP FY2017/2018 Interim Report Ministry of Finance and the Public Service
October 2017
9
Part A: Fiscal Management
Total Debt
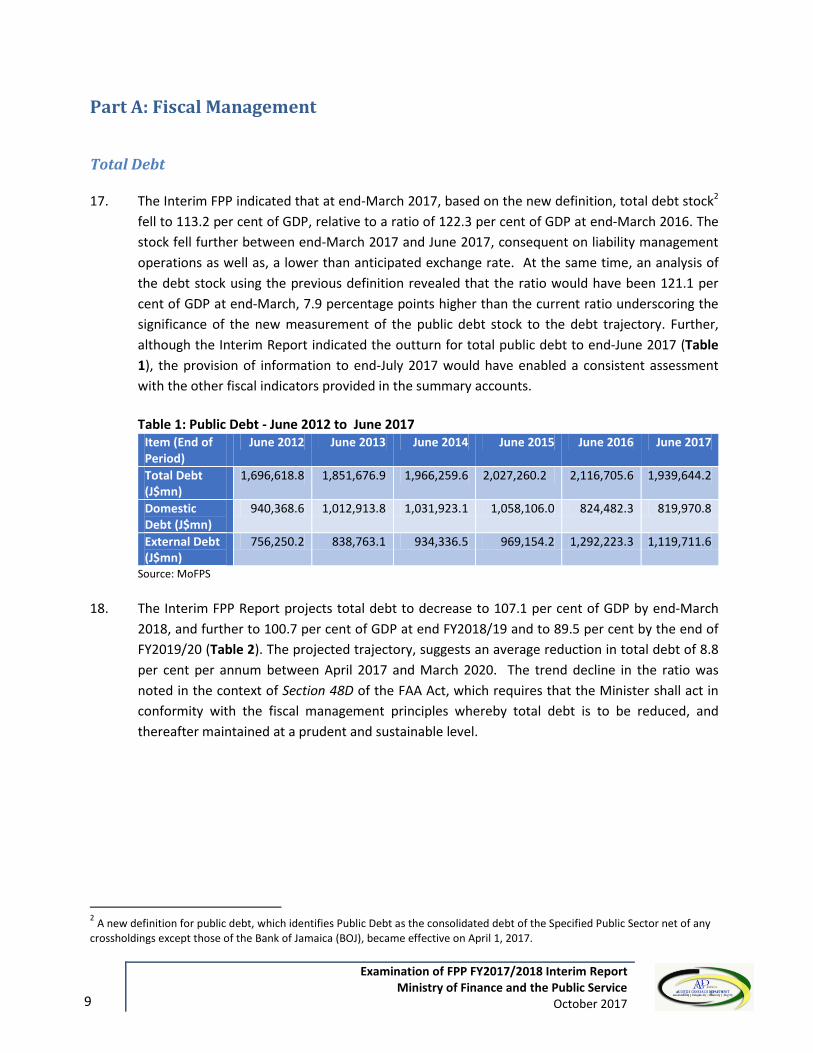
17. The Interim FPP indicated that at end-March 2017, based on the new definition, total debt stock2
fell to 113.2 per cent of GDP, relative to a ratio of 122.3 per cent of GDP at end-March 2016. The
stock fell further between end-March 2017 and June 2017, consequent on liability management
operations as well as, a lower than anticipated exchange rate. At the same time, an analysis of
the debt stock using the previous definition revealed that the ratio would have been 121.1 per
cent of GDP at end-March, 7.9 percentage points higher than the current ratio underscoring the
significance of the new measurement of the public debt stock to the debt trajectory. Further,
although the Interim Report indicated the outturn for total public debt to end-June 2017 (Table
1), the provision of information to end-July 2017 would have enabled a consistent assessment
with the other fiscal indicators provided in the summary accounts.
Table 1: Public Debt - June 2012 to June 2017
Item (End of Period)
June 2012 June 2013 June 2014 June 2015 June 2016 June 2017
Total Debt (J$mn)
1,696,618.8 1,851,676.9 1,966,259.6 2,027,260.2 2,116,705.6 1,939,644.2
Domestic Debt (J$mn)
940,368.6 1,012,913.8 1,031,923.1 1,058,106.0 824,482.3 819,970.8
External Debt (J$mn)
756,250.2 838,763.1 934,336.5 969,154.2 1,292,223.3 1,119,711.6
Source: MoFPS
18. The Interim FPP Report projects total debt to decrease to 107.1 per cent of GDP by end-March
2018, and further to 100.7 per cent of GDP at end FY2018/19 and to 89.5 per cent by the end of
FY2019/20 (Table 2). The projected trajectory, suggests an average reduction in total debt of 8.8
per cent per annum between April 2017 and March 2020. The trend decline in the ratio was
noted in the context of Section 48D of the FAA Act, which requires that the Minister shall act in
conformity with the fiscal management principles whereby total debt is to be reduced, and
thereafter maintained at a prudent and sustainable level.
2 A new definition for public debt, which identifies Public Debt as the consolidated debt of the Specified Public Sector net of any
crossholdings except those of the Bank of Jamaica (BOJ), became effective on April 1, 2017.
Examination of FPP FY2017/2018 Interim Report Ministry of Finance and the Public Service
October 2017
10
Table 2: Public Debt Performance and Vulnerability Ratios Public Debt Indicators FY2012/13 FY2013/14 FY2014/15 FY2015/16 FY2016/17 FY2017/18
Proj.
Total Debt (J$mn) 1,812,635.5 1,946,005.0 2,041,693.7 2,068,759.2 2,017,999.2 2,027,815.6
Debt Vulnerability Ratio
Total Debt/GDP% 135.2 133.3 130.2 122.3 113.2 107.1
Interest/Tax Revenue 39.7 32 33.5 30.7 30.4 29.1
Interest/GDP 9.5 7.0 7.9 7.5 7.8 7.4
Debt Service/Tax Revenue 66.9 63.0 57.2 113.7 46.9 78.5
Source: MoFPS
Tax Revenue 19. The Interim FPP Report ascribed the excess 3.0 per cent in Tax Revenue over the budget for
FY2016/17, to improved economic activity, reflected in the growth of real GDP, which boosted
collections (Table 3). This resulted in a Tax Revenue to GDP ratio of 25.7 per cent, which
exceeded the ratio for the previous year and the 5-year average of 23.7 per cent. I found this a
reasonable explanation in a context where nominal GDP growth of 5.6 per cent was reported for
FY2016/17 in Table 2D of the FY2017/18 Interim Report.
Table 3: Tax Revenue Actual vs Budget
Fiscal Year FY2011/12 FY2012/13 FY2013/14 FY2014/15 FY2015/16 FY2016/17
Tax Revenue Budget (J$mn)
190,308.3 335,625.1 360,517.6 384,286.0 411,882.3 445,161.6
Tax Revenue Actual (J$mn)
289,882.2 319,764.9 343,836.1 370,877.5 411,854.0 458,323.4
Variance Actual/Budget (J$mn)
-7,337.1 -15,860.2 -16,681.5 -13,408.5 -28.3 13,161.8
Taxes Actual/GDP (%) 23.0 23.9 23.6 23.6 24.4 25.7
Source: MoFPS
20. Tax Revenue for April-July 2017, was reported to have surpassed the budgeted amount by 3.7 per
cent. Tax Revenues reflected real growth of 3.0 per cent relative to the similar period of 2016.
The improved collections supports the assertion of gains from strengthened administrative
procedures noted in the Interim FPP. A disaggregation of Tax Revenue indicated that receipts
from Production & Consumption (local SCT & GCT) and Income & Profits (‘other companies’)
exceeded their respective targets, while International Trade (import-related-SCT)
underperformed relative to target. Collections from GCT and SCT combined, reflected an
increased share of Tax Revenue, accounting for more than 51.6 per cent relative to the five-year
average of 47.4 per cent (Chart 1). This performance is consistent with the GOJ’s move towards
indirect taxation measures and less emphasis on direct taxation.
Examination of FPP FY2017/2018 Interim Report Ministry of Finance and the Public Service
October 2017
11
21. The Interim FPP indicated that the FY2017/18 tax budget exceeded actual receipts for FY2016/17,
by 4.3 per cent. Growth in tax collections was predicated on revised growth of 6.2 per cent in
nominal GDP, as well as, the impact from other macroeconomic variables; and that the over
performance in Tax Revenue is projected to slow over the remainder of the fiscal year to 0.7 per
cent above the budgeted amount. I believe this to be a reasonable assumption, given the
downward revision of real GDP growth to 1.7 percent from the 2.3 per cent reported in the
February FY2017/18 FPP. Over the medium-term, Tax Revenue is forecasted (passive) at 24.6 per
cent of GDP, while increasing to $580,305.0mn by FY2020/21.
Chart 1: SCT and GCT- April to July
Bauxite Levy
22. The Interim FPP indicated that Bauxite Levy collections for FY2016/17 were 27 per cent below
budget, while for FY2017/18 collections are budgeted at 93.3 per cent below receipts for the
previous fiscal year. The Report stated that the decline reflected GOJ’s decision to enter into a
profit-sharing arrangement as part of a temporary change in the bauxite levy regime. This
appears contrary to the Ministry’s previous response that there was no change, as suggested in
the February FY2017/18 FPP. In subsequent correspondence dated October 23, 2017, the
Ministry has informed, “the Bauxite Levy Act had not been removed or repealed. So the
provisions of the Bauxite Levy Act can be re-imposed by the Minister subject to terms and
conditions of MOUs with the particular bauxite entity.”
23. The Interim FPP indicated that for April to July 2017, collections from the Bauxite Levy were
relatively in line with budget of $131.0mn. The Ministry noted that these flows reflected a
US$1.0mn legacy payment relating to bauxite levy arrears made by the new owners of Noranda
Examination of FPP FY2017/2018 Interim Report Ministry of Finance and the Public Service
October 2017
12
in accordance with the new agreement with GOJ. At the same time, we note that a profit-sharing
arrangement was only established with Noranda3. On the other hand, indications are that
Windalco is currently benefitting from a full waiver of levy payments through to end-March 2018,
while, Jamalco has operated under a special arrangement since 20034.
24. Over the medium-term, Bauxite Levy is projected to be nil through to FY2021/22. However, this
forecast appears inconsistent with expectations for continued legacy payments by the owners of
Noranda, which, according to the Letter of Intent with the GOJ, should be paid in annual tranches
over an eight-year period beginning FY2017/185. Further, with the impending expiry of the
waiver on Windalco’s levy payments, it is expected that the medium-term forecasts would
include levy payments from this entity. This underscores the need for greater clarity regarding
the bauxite levy regime. The Ministry have since informed that the omission of bauxite levy
projections was an oversight, and will be included in the next FPP.*
Non-Tax Revenue
25. The Interim report revealed that actual Non-Tax Revenue for FY2016/17 was 7.2 per cent below
the budget or 1.9 per cent of GDP, a decline relative to the 2.1 per cent of GDP recorded for
FY2015/16. Additionally, Non-tax revenue as a share in Revenues & Grants fell to 6.8 per cent
from 7.8 per cent. However, no explanation was provided for the underperformance in a context
where the February 2017/18 FPP had estimated Non-Tax revenue to exceed budget for
FY2016/17 by $4.1bn (13.4 per cent).
Table 4: Non-Tax Revenue
Fiscal Year FY2012/13 FY2013/14 FY2014/15 FY2015/16 FY2016/17 FY2017/18 Proj.
Non -Tax Revenue Budget (J$mn)
5,207.4 8,198.0 8,909.1 7,795.5 5,471.8 10,309.2
Non-Tax Revenue Actual (J$mn)
5,264.2 8,776.2 9,210.0 6,515.0 7,363.9 10,363.6
Variance Actual/Budget (J$mn)
56.8 578.2 300.9 -1280.5 1,892.0 54.4
Non-Tax Actual/ Rev & Grant (%)
5.1 7.4 7.6 4.8 4.8 6.2
Source: MoFPS
3 The Ministry did not provide information regarding other players in the industry in relation to the new regime.
4 Jamalco pays no Bauxite levy, but pays a special royalty ranging from US$1.00 – US$1.75 per tonne of bauxite.
5 The Letter of Intent notes that a total of US$12.6mn in legacy payments related to bauxite levy arrears is to be paid by the
owners of Noranda over an 8-year period (US$1.0mn per annum for the first 4 years and US$2.15mn per annum for a further 4
years). The first tranche for FY2017/18 was paid.
Examination of FPP FY2017/2018 Interim Report Ministry of Finance and the Public Service
October 2017
13
26. For April to July 2017, Non-Tax Revenue collections of $10,363.6mn was in line with budgeted
amount of $10,309.2mn. Non-Tax Revenue represented a greater share of Revenue & Grants, at
6.2 per cent, relative to the previous year and the 5-year average (Table 4). Notwithstanding, net
transfers to GOJ from Self-Financing Public Bodies (SFPBs) was below budget, partly due to
underperformance in dividend distribution which represents one of the main contributors to
Non-Tax Revenue.
27. For FY2017/18, the projection is for Non-Tax Revenue to exceed actual receipts for FY2016/17 by
54.4 per cent, which translates to a share of 9.7 per cent in Revenue & Grants relative to 7.4 per
cent for FY2016/17. The projection is largely predicated on enhanced distributions from the
SFPBs and Executive Agencies as well the de-earmarking of revenue flows from three Public
Bodies. The Interim FPP indicated that the increase is also supported by the proceeds from the
profit-sharing agreement, based on the temporary suspension of the Bauxite Levy regime as well
as expected increase in pension contributions. The forecast is for Non-tax Revenue to remain
stable at 2.9 per cent of GDP over the medium-term, primarily supported by the distributions
from the NHT. The share in Revenue & Grants is also forecasted at a constant 10 per cent.
Grants 28. Grants for FY2016/17 was 18.7 per cent below budget (Table 5). The Grants to GDP ratio was 0.3
per cent, same as that budgeted for FY2017/18 and accounted for 1.1 per cent of total Revenue
and Grants, in line with the budget. The budgeted level of grants for FY2017/18 is the lowest
amount since FY2012/13.
Table 5: Grants - Budgeted vs Actual
Fiscal Year FY2011/12 FY2012/13 FY2013/14 FY2014/15 FY2015/16 FY2016/17
Grants Budget (J$mn)
5,113.2 4,412.0 9,422.3 8,644.9 9,539.0 6,509.8
Grants Actual (J$mn)
3,448.8 3,940.5 10,428.5 5,017.8 5,463.6 5,292.8
Variance (J$mn) -1,664.4 -471.5 1,006.2 -3,627.1 -4,075.4 -1,217.0
Grants/GDP (Actual %)
0.3 0.3 0.7 0.3 0.3 0.3
Source: MoFPS
29. For the period April to July 2017, Grants was $1,838.2mn or $448.8mn (32.3 per cent) above
budget (Table 6). The Ministry indicated that increased flows reflect improvements in the
implementation of projects and there were no carryover amounts from FY2016/17.
Examination of FPP FY2017/2018 Interim Report Ministry of Finance and the Public Service
October 2017
14
Table 6: Grants - April to July
Outturn (April-July) FY2012/13 FY2013/14 FY2014/15 FY2015/16 FY2016/17 FY2017/18
Grants Budget (J$mn) 695.0 1,229.6 2,963.5 3,275.1 916.3 1,389.4
Grants Actual (J$mn) 332.7 650.6 608.7 1,762.5 2,491.5 1,838.2
Variance (J$mn) -362.3 -579.0 -2,354.8 -1,512.6 1,575.2 448.8
Source: MoFPS
30. The FAA Act requires that Expenditure be managed in a manner that is consistent with the level
of revenue. In this regard, we note that for FY2016/17, there was a narrowing in the gap between
revenue and expenditure to $3.5bn from $4.9bn the previous year. Critical to the management of
the expenditure budget, has been containment in Wages & Salaries and interest costs.
Wages and Salaries
31. Wages are projected to fall to 9 per cent of GDP by March 31, 2019, in line with the legislative
target set out in Section 48C (c) of the FAA Act, which was amended in 2016. However, the
Interim FPP 2017/18 Report indicated that the new round of wage negotiations for the
FY2017/19 contract period are yet to be completed. Further, the FY2017/18 budget includes a
contingency provision for the wage adjustment, which takes into consideration the legislated
target of 9 per cent. The Interim FPP 2017/18 Report states that the final wage settlement could
exceed the contingency provision, increasing the risk to the expenditure budget and the overall
fiscal programme including the attainment of the legislated target.
32. For FY2016/17, Wages & Salaries was 9.3 per cent of GDP and 1.3 per cent below budget. The
Interim FPP FY2017/18 projects wages and salaries to increase to 9.5 per cent of GDP by end
March 2018 (Table 7).
Table 7: Wages and Salaries (J$ million)
Fiscal Year FY2016/17 (Act)
FY2017/18 (Proj)
FY2018/19 (Proj)
FY2019/20 (Proj)
FY2020/21 (Proj)
FY2021/22 (Proj)
Wages 166,484.7 179,546.4 184,953.7 196,656.1 211,293.4 227,617.7
Wages/GDP Ratio (%)
9.3 9.5 9.0 9.0 9.0 9.0
Source: MoFPS
33. For April to July 2017, the Interim FPP reported wages & salaries as $59,354.1mn, while the
outturn as published on the MoFPS website was $58,354.1mn. In light of this, the Ministry should
seek to ensure consistency and reliability of information provided. Wages & Salaries accounted
for 46.5 per cent of non-debt Expenditure for April to July 2017 and 34.5 per cent of total
expenditure. Wages& Salaries share of Total Expenditure was however below the average of 38.9
per cent for the April to July period of the past five years (Table 8). Notwithstanding the
Examination of FPP FY2017/2018 Interim Report Ministry of Finance and the Public Service
October 2017
15
downward trend, Wages & Salaries continued to command the largest share of the Expenditure
budget.
Table 8: Wages & Salaries - April to July
Outturn April to July
FY2012/13 FY2013/14 FY2014/15 FY2015/16 FY2016/17 FY2017/18 Budget FY2017/18
Wages & Salaries (J$mn)
52,401.5 53,471.9 53,409.0 53,087.8 54,295.5 59,354.1 57,731.1
Wages &Salaries/Total Expenditure (%)
46.3 43.0 38.2 34.5 32.4 34.5 32.2
Wages & Salaries/Non-Debt Expenditure (%)
60.9 57.2 55.4 48.8 46.3 46.5 44.0
Source: MoFPS
Interest Cost
34. For FY2016/17, interest cost was 0.5 per cent below budget while the interest cost to GDP ratio
at 7.8 per cent was below the five-year average of 8.4 per cent (Table 9). Interest expense
accounted for 27.7 per cent of total Expenditure for FY2016/17 relative to 27.3 per cent for
FY2015/16. For FY2017/18, interest cost is budgeted at 7.4 per cent of GDP and 25.5 per cent of
total Expenditure.
Table 9: Interest Cost - Budgeted vs. Actual Fiscal Year FY2011/12 FY2012/13 FY2013/14 FY2014/15 FY2015/16 FY2016/17
Interest Payment Budget (J$mn)
131,083.9 136,533.8 119,566.8 132,669.1 131,614.3 140,126.3
Interest Payment Actual ($Jmn)
120,635.1 126,937.5 109,919.5 124,512.7 125,679.5 139,356.2
Variance Actual/Budget (J$mn)
(10,448.8) (9,596.3) (9,647.3) (8,156.4) (5,934.8) (770.1)
Interest Actual/GDP (%) 9.5 9.5 7.5 7.9 7.4 7.8
Source: MoFPS
35. For the April to July 2017 period, interest cost was 6.7 per cent less than budgeted while, the
ratio of Interest cost to Tax Revenue was 28.9 per cent compared the budgeted ratio of 32.2 per
cent and the average ratio of 33.2 per cent for an April to July period of the past five years.
Interest cost represented 25.8 per cent of Total Expenditure for April to July 2017, which was less
than budget, and below the average of 27.8 per cent for the corresponding period of the past 5
years (Table 10).
Examination of FPP FY2017/2018 Interim Report Ministry of Finance and the Public Service
October 2017
16
Table 10: Interest Cost - April to July
Sourc Source: MoFPS
36. The Interim FY2017/18 FPP ascribed the continued reduction in debt servicing costs for
FY2016/17 and for the April to July 2017 period, mainly to the execution of liability management
operations, delays in debt management operations and a stronger than expected Jamaica Dollar.
However, the Report did not provide a value for the savings in interest payments arising from
liability management operations to enable an assessment of reasonableness.
Recurrent Programme Expenditure 37. Recurrent Programmes expenditure for FY2016/17 was 0.3 per cent lower than budget however,
the ratio to GDP of 8.0 per cent was broadly in line with the budgeted ratio of 8.1 per cent but
exceeded the 5-year average of 7.0 per cent (Table 11). Recurrent Programmes expenditure
accounted for 28.4 per cent of Total Expenditure for FY2016/17 and was marginally below the
previous year of 28.9 per cent. For FY2017/18, the share in Total Expenditure is budgeted to rise
to 30.5 per cent.
Table 11: Recurrent Programmes Expenditure – Budgeted vs. Actual
Fiscal Year FY2011/12 FY2012/13 FY2013/14 FY2014/15 FY2015/16 FY2016/17
Programmes Budget (J$mn) 87,215.1 92,160.7 93,664.2 110,281.1 135,735.3 143,467.9
Programmes Actual (J$mn) 89,699.4 87,201.4 91,971.7 112,696.7 133,502.4 142,976.4
Variance Actual/Budget
(J$mn)
2,484.3 (4,959.3) (1,692.5) 2,415.6 (2,232.9) (491.5)
Programmes Actual/GDP
(%)
7.1 6.5 6.3 7.2 7.9 8.0
Source: MoFPS
38. For the period April to July 2017, Recurrent Programmes was below budget by 7.4 per cent and
accounted for 42.5 per cent of non-debt Expenditure relative to a target of 44.6 per cent. As a
proportion of Total Expenditure, Recurrent Programmes expenditure accounted for 31.5 per
cent, below the budgeted ratio of 32.7 per cent but above the average of 26.3 per cent for an
April to July period of the past 5 years (Table 12).
Outturn April-July FY2012/13 FY2013/14 FY2014/15 FY2015/16 FY2016/17 FY2017/18 Budget FY2017/18
Interest Cost (J$mn) 27,084.7 30,873.3 43,320.5 45,252.2 50,307.1 44,543.9 47,758.7
Interest/Tax (%) 27.8 28.4 38.8 35.6 35.3 28.9 32.2
Interest/Total Expenditure (%)
23.9 24.8 31.0 29.4 30.0 25.8 26.8
Examination of FPP FY2017/2018 Interim Report Ministry of Finance and the Public Service
October 2017
17
Table 12: Recurrent Programmes - April to July Outturn April-July FY2012/13 FY2013/14 FY2014/15 FY2015/16 FY2016/17 FY2017/18 Budget
FY2017/18
Programmes (J$mn) 27,216.8 28,764.5 35,197.8 46,195.2 48,607.5 54,302.7 58,613.3
Programmes/Total Expenditure (%)
24.1 23.1 25.2 30.0 29.0 31.5 32.7
Programmes/Non-Debt Expenditure (%)
31.6 30.7 36.5 42.5 41.4 42.5 44.6
Source: MoFPS
39. The FPP FY2017/18 Interim Report noted that Programmes for the April to July 2017 period,
included utility payments of approximately $2.0bn, Caribbean Catastrophe Risk Insurance Facility
(CCRIF) payment of $795.7mn and pension payments of approximately $8.0bn. Notably,
Programme spending was $5,695.2mn higher than the corresponding period in 2016.
Capital Expenditure 40. Against the background of the additional fiscal space provided by a reduction in the Primary
Balance target for FY2016/17, Capital Expenditure for FY2016/17 (2.4 per cent of GDP), exceeded
the spending for FY2015/16 by 28.1 per cent. However, the outturn represented a 2.4 per cent
shortfall relative to budget (Table 13). Capital Expenditure also accounted for 8.3 per cent of
total Expenditure for FY2016/17 and the share is budgeted to increase to 9.1 per cent and exceed
the five-year average to FY2016/17.
Table 13: Capital Expenditure – Budgeted vs. Actual
Fiscal Year FY2011/12 FY2012/13 FY2013/14 FY2014/15 FY2015/16 FY2016/17
Capital Expenditure
Budget (J$mn)
60,415.4 39,493.0 44,721.8 34,628.2 30,409.0 43,000.8
Capital Expenditure
Actual (J$mn)
53,230.9 37,758.0 36,988.9 23,019.1 32,747.4 41,955.3
Variance (J$mn) -7,184.5 -1,735.0 -7,732.9 -11,609.1 2,338.4 7,327.2
Capital/GDP (Actual %) 4.2 2.8 2.5 1.5 1.9 2.4
Source: MoFPS
41. For April to July 2017, Capital Expenditure was $827.6mn below budget and accounted for 7.3
per cent of non-debt Expenditure, relative to the targeted ratio of 7.7 per cent for the four-
month period (Table 14). The outturn was almost in line with the budgeted ratio of 6.6 per cent
of Total Expenditure and the five-year average of 6.5 per cent.
Examination of FPP FY2017/2018 Interim Report Ministry of Finance and the Public Service
October 2017
18
Table 14: Capital Expenditure: April - July
Outturn (April-July) FY2012/13 FY2013/14 FY2014/15 FY2015/16 FY2016/17 FY2017/18 Budget
FY2017/18
Capital Expenditure
(J$mn)
6,405.9 11,297.3 7,803.1 9,516.2 10,434.9 9,301.1 10,128.7
Capital Expenditure /
Total Expenditure (%)
5.7 9.1 5.6 6.2 6.2 5.4 5.7
Capital Expenditure /
Non-Debt Expenditure (%)
7.4 12.1 8.1 8.7 8.9 7.3 7.7
Source: MoFPS
Primary Balance
42. The Primary Surplus for FY2016/17 was 7.6 per cent of GDP, exceeding the budget of 7.0 per cent
(Table 15). The actual outturn for FY2016/17 of $135,880.0mn also exceeded the estimate of the
$126,598.5mn reported in the February FY2017/18 FPP. The Primary Balance target for
FY2017/18 is 7.0 per cent of GDP.
Table 15: Primary Balance: Budgeted vs. Actual
Fiscal Year FY2011/12 FY2012/13 FY2013/14 FY2014/15 FY2015/16 FY2016/17
Primary Balance Target
(J$mn)
69,264.2 83,558.3 111,121.2 121,275.0 126,727.7 122,126.0
Primary Balance
Target/GDP (%)
5.2 6.0 7.5 7.5 7.5 7.0
Primary Balance Actual
(J$mn)
39,662.7 72,336.6 111,657.1 117,241.7 120,795.8 135,880.0
Primary Balance
Actual/GDP (%)
3.1 5.4 7.7 7.5 7.4 7.6
Source: MoFPS
43. For the period April to July 2017, the primary surplus amounted to $38,565.1mn, $9,554.6mn or
32.9 per cent better than target (Table 16). This outturn exceeded the average of $26,474.9mn
for an April to July period of the previous five years.
Table 16: Primary Balance: April to July
Outturn (April - July) FY2012/13 FY2013/14 FY2014/15 FY2015/16 FY2016/17 FY2017/18 Budget
FY2017/18
Primary Balance
(J$mn)
17,621.7 25,140.3 25,348.7 27,833.2 36,430.6 38,565.1 29,010.5
Source: MoFPS
Examination of FPP FY2017/2018 Interim Report Ministry of Finance and the Public Service
October 2017
19
Fiscal Balance 44. Central Government recorded a fiscal deficit of 0.2 per cent of GDP for FY2016/17 compared to
the budgeted deficit of 1.0 per cent of GDP (Table 17).
Table 17: Fiscal Balance: Budgeted vs. Actual
Fiscal Year FY2011/12 FY2012/13 FY2013/14 FY2014/15 FY2015/16 FY2016/17
Fiscal Balance Target
(J$mn)
-61,819.9 -52,975.5 -8,045.7 -11,394.1 -4,880.9 -16,332.8
Fiscal Balance
Target/GDP (%)
-4.6 -3.8 -3.8 -0.7 -0.3 -1.0
Fiscal Balance Actual
(J$mn)
-80,972.4 -54,610.5 1,737.6 -7,270.8 -4,883.7 -3,476.2
Fiscal Balance
Actual/GDP (%)
-6.4 -4.1 0.1 -0.5 -0.3 -0.2
Source: MoFPS
45. For FY2017/18, the Fiscal Deficit is budgeted at 0.4 per cent of GDP. For the first four months of
FY2017/18, the deficit was $12,769.3mn less than budgeted and less than the average of
$12,892.64mn for an April to July period of the previous five years (Table 18).
Table 18: Fiscal Balance: April to July
Outturn
(April -
July)
FY2012/13 FY2013/14 FY2014/15 FY2015/16 FY2016/17 FY2017/18 Budget
FY2017/18
Fiscal
Balance
(J$mn)
-9,463.0 -5,732.9 -17,971.8 -17,419.0 -13,876.5 -5,978.8 -18,748.1
Source: MoFPS
Examination of FPP FY2017/2018 Interim Report Ministry of Finance and the Public Service
October 2017
20
Part B: Deviation of the Fiscal Indicators 46. I have reviewed the explanations provided in the FPP FY2017/18 Interim Report. In making a
determination of reasonableness of the explanations provided by the Minister of Finance, the
following were undertaken:
a) A review of the macroeconomic framework provided in the Interim Report in context of
Budget Assumptions indicated in the FPP FY2017/18 February 2017;
b) A review of estimated revenue gains/losses from the FY2017/18 Revenue Measures;
c) A review of risks in the FY2017/18 Fiscal Policy Paper and Debt Management Strategy to
determine if any has materialized or were excluded from initial projections;
d) A review of emerging risks discussed in the Interim Report;
e) Confirmation where possible, of the Minister’s explanations with observed data.
47. My comments on variances provided in Table 19 are confined to those elements for which
adequate information was provided in the FY2017/18 Interim FPP and by the Ministry of Finance.
Table 19: Comments on the Explanations for the Fiscal Deviations for April to July 2017 relative to Budget (J$mn)
Key Tax Types Provisional Budget Deviation from budget projection (%)
Share of Tax Revenue
GOJ's Explanation Stated in FPP FY2017/18 Interim
Audit Comments Ministry's Response
Tax Revenue April-July
$153,626.6 $148,175.4 3.7 The over-performance was attributable to the approved revenue measures announced in February 2017 and the continued strengthening of administrative procedures.
The measures tabled in March 2017 exceeded the budget gap. Hence, the Interim report should have explained how these measures performed for April to July relative to target.
Revenue Measures for the current FY would not be included in the FPP. These would be tabled in a Ministry Paper.
Income & Profits
$34,548.7 $32,981.9 4.8 23.1 Over-performance in Corporate Taxes influenced better than budgeted performance.
Other Companies
$13,139.2 $9,835.4 33.6 8.6 Improved compliance, increased profitability of the companies and growth in the number of tax paying companies.
The number of companies paying CIT increased to 776 in July from 700 in April.
Agreed
PAYE $17,007.2 $17,825.7 -4.6 11.1 The Ministry assumed that this resulted from increase in employment of persons below the personal income tax threshold.
Production & Consumption
$59,504.5 $54,252.2 9.7 38.8 Improvements in the real sector.
Despite overall downturn in real GDP, Manufacture;
Examination of FPP FY2017/2018 Interim Report Ministry of Finance and the Public Service
October 2017
22
Key Tax Types Provisional Budget Deviation from budget projection (%)
Share of Tax Revenue
GOJ's Explanation Stated in FPP FY2017/18 Interim
Audit Comments Ministry's Response
Food, Beverage & Tobacco subsectors increased, which are key components for SCT (local)
SCT (local) $11,320.1 $7,868.7 43.9 7.4 Partly attributable to greater than projected production at the local petroleum refinery.
Petroleum production for April to July 2017 was below amount for corresponding period in 2016, and the last five years.
The better performance was due to PetroJam having no credits to set off against local amounts due, as well as higher production taking place in April to July.
GCT (local) $28,750.6 $28,130.7 2.2 18.7 The Interim report did not provide an explanation for variance.
An oversight. This tax type benefited from improvements in Administrative Systems
Education Tax $8,675.5 $7,907.0 9.7 5.6 Higher levels of employment and personal income.
This is consistent with increase in employment.
International Trade
$59,573.3 $60,941.3 -2.2 38.8 Shortfalls in SCT (imports) was the main contributor.
GCT (imports) $25,477.4 $25,589.0 -0.4 16.6 The Interim report did not provide an explanation for variance.
Examination of FPP FY2017/2018 Interim Report Ministry of Finance and the Public Service
October 2017
23
Key Tax Types Provisional Budget Deviation from budget projection (%)
Share of Tax Revenue
GOJ's Explanation Stated in FPP FY2017/18 Interim
Audit Comments Ministry's Response
SCT (Imports) $13,799.5 $16,642.3 -17.1 9.0 Notable shifts in preferences for cars with smaller engine capacity possibly due to their mileage efficiency and affordability.
We could not validate this explanation.
Customs Duty $12,059.5 $11,569.8 4.2 7.8 The Interim report did not provide an explanation for variance.
An oversight. Customs duty was driven by increased volumes and higher CIF values.
Bauxite Levy $125.7 $131.0 -2.7 0.1 Profit sharing regime that forms part of the temporary bauxite levy modification for the sector. Slower than projected depreciation of the exchange rate.
Minor deviation was due to lower than projected exchange rate outturn for the period.
Non-Tax Revenue
$10,363.6 $10,309.2 0.5 6.7 The Interim report did not provide an explanation for variance.
This was broadly in line with budget with a variance of less than 1%.
Grants $1,838.2 $1,389.4 32.3 1.2 The Interim report did not provide an explanation for variance.
An oversight. The performance was due to improvements in the execution of capital projects.