Page 1
EXAMINING THE EFFECTS OF AN ECO-DRIVING SYSTEM ON DRIVER
DISTRACTION
by
HOSSEIN ROUZIKHAH
Master of Road and Transportation Engineering, University of Tehran, Iran
Bachelor of Civil Engineering, University of Tabriz, Iran
A THESIS
Submitted in partial fulfillment of the requirements for the degree
MASTER OF APPLIED SCIENCE (HL84)
The Centre for Accident Research and Road Safety – Queensland (CARRS-Q)
QUEENSLAND UNIVERSITY OF TECHNOLOGY
Brisbane, Australia
June 2012
Supervisors:
Dr. Mark King
Professor Andry Rakotonirainy
Page 3
One who has wisdom is powerful. Ferdowsi (940–1020 CE)
Page 4
Examining the Effects of an Eco-driving System on Driver Distraction
Page I
Abstract
Driver distraction has recently been defined by Regan as “the diversion of attention away
from activities critical for safe driving toward a competing activity, which may result in
insufficient or no attention to activities critical for safe driving (Regan, Hallett & Gordon, 2011,
p.1780)”. One source of distraction is in-vehicle devices, even though they might provide other
benefits, e.g. navigation systems. Currently, eco-driving systems have been growing rapidly in
popularity. These systems send messages to drivers so that driving performance can be improved
in terms of fuel efficiency. However, there remain unanswered questions about whether eco-
driving systems endanger drivers by distracting them. In this research, the CARRS-Q advanced
driving simulator was used in order to provide safety for participants and meanwhile simulate real
world driving. The distraction effects of tasks involving three different in-vehicle systems were
investigated: changing a CD, entering a five digit number as a part of navigation task and
responding to an eco-driving task. Driving in these scenarios was compared with driving in the
absence of these distractions, and while drivers engaged in critical manoeuvres. In order to
account for practice effects, the same scenarios were duplicated on a second day. The three in-
vehicle systems were not the exact facsimiles of any particular existing system, but were designed
to have similar characteristics to those of system available.
In general, the results show that drivers’ mental workloads are significantly higher in
navigation and CD changing scenarios in comparison to the two other scenarios, which implies
that these two tasks impose more visual/manual and cognitive demands. However, eco-driving
mental workload is still high enough to be called marginally significant (p ~ .05) across
manoeuvres. Similarly, event detection tasks show that drivers miss significantly more events in
the navigation and CD changing scenarios in comparison to both the baseline and eco-driving
scenario across manoeuvres.
Analysis of the practice effect shows that drivers’ baseline scenario and navigation scenario
exhibit significantly less demand on the second day. However, the number of missed events
across manoeuvres confirmed that drivers can detect significantly more events on the second day
for all scenarios.
Distraction was also examined separately for five groups of manoeuvres (straight, lane
changing, overtaking, braking for intersections and braking for roundabouts), in two locations for
each condition. Repeated measures mixed ANOVA results show that reading an eco-driving
message can potentially impair driving performance. When comparing the three in–vehicle
distractions tested, attending to an eco-driving message is similar in effect to the CD changing
Page 5
Page II
task. The navigation task degraded driver performance much more than these other sources of
distraction.
In lane changing manoeuvres, drivers’ missed response counts degraded when they engaged
in reading eco-driving messages at the first location. However, drivers’ event detection abilities
deteriorated less at the second lane changing location. In baseline manoeuvres (driving straight),
participants’ mean minimum speed degraded more in the CD changing scenario. Drivers’ lateral
position shifted more in both CD changing and navigation tasks in comparison with both eco-
driving and baseline scenarios, so they were more visually distracting. Participants were better at
event detection in baseline manoeuvres in comparison with other manoeuvres. When approaching
an intersection, the navigation task caused more events to be missed by participants, whereas eco-
driving messages seemed to make drivers less distracted. The eco-driving message scenario was
significantly less distracting than the navigation system scenario (fewer missed responses) when
participants commenced braking for roundabouts.
To sum up, in spite of the finding that two other in-vehicle tasks are more distracting than the
eco-driving task, the results indicate that even reading a simple message while driving could
potentially lead to missing an important event, especially when executing critical manoeuvres.
This suggests that in-vehicle eco-driving systems have the potential to contribute to increased
crash risk through distraction. However, there is some evidence of a practice effect which
suggests that future research should focus on performance with habitual rather than novel tasks. It
is recommended that eco-driving messages be delivered to drivers off-line when possible.
Page 6
Page III
Dedication
This thesis is dedicated to my father, who passed away a few months ago but left invaluable
good memories for his family. It is also dedicated to all of my family members, especially my
wife, Shabnam, for her endless support.
Page 7
Page IV
Contents
Chapter 1 - Introduction ........................................................................................................... 1
1-1- Introduction .................................................................................................................. 2
1-2- Road Safety Overview Worldwide .............................................................................. 2
1-3- Road Safety Status in Australia .................................................................................. 2
1-4- What is Driver Distraction?......................................................................................... 3
1-5- Is Driver Distraction a Road Safety Issue? ................................................................ 4
1-6- Eco-driving systems and Eco-driving behaviour ....................................................... 6
Chapter 2 - Literature Review .................................................................................................. 9
2-1- Introduction ................................................................................................................ 10
2-2- In-vehicle Distraction ................................................................................................. 11
2-3- In-vehicle Navigation Systems ................................................................................... 13
2-4- Radio Tuning/CD players .......................................................................................... 17
2-5- Eco-driving .................................................................................................................. 19
2-6- Practice Effect ............................................................................................................. 20
2-7- Location of Distraction ............................................................................................... 22
2-8- Individual Differences in Driver Distraction ........................................................... 23 2-8-1- Age .................................................................................................................................................... 24 2-8-2- Distraction Caused by Mobile Phone & Age .................................................................................... 25 2-8-3- Relationship between Age and Driving Experience.......................................................................... 29 2-8-4- Gender ............................................................................................................................................... 30 2-8-5- Conclusion ........................................................................................................................................ 31
2-9- Measures of Driver Distraction ................................................................................. 32 2-9-1- Mental Workload .............................................................................................................................. 32 2-9-2- Driver Distraction and Situational Awareness .................................................................................. 33 2-9-3- Measures of Driving Distraction ....................................................................................................... 35 2-9-4- Secondary Task Mental Measurement .............................................................................................. 38 2-9-5- Choosing Driving Performance Measures ........................................................................................ 41 2-9-6- Reference Tasks ................................................................................................................................ 42
2-10- Application of Cognitive and Behavioural Models in Driver Distraction ........... 42 2-10-1- Introduction ..................................................................................................................................... 42 2-10-2- Driver Behaviour Model ................................................................................................................. 43 2-10-3- The Multiple Resource Model Theory ............................................................................................ 44 2-10-4- Summary and Conclusion ............................................................................................................... 46
2-11- Research Questions .................................................................................................. 47
2-12- Scope of Research ..................................................................................................... 49
Chapter 3 - Methodology and Research Design .................................................................... 50
3-1- Introduction ................................................................................................................ 51
3-2- Design of Research...................................................................................................... 52 3-2-1- Network Creation for the Proposed Research ................................................................................... 52
3-2-2-Dependent and Independent variables ................................................................... 54
3-2-3- Peripheral Detection Task ...................................................................................... 56
Page 8
Page V
3-3- Participants/Sample.................................................................................................... 56
3-4- Procedure .................................................................................................................... 59
3-5- Apparatus .................................................................................................................... 65 3-5-1- Advanced Driving Simulator ............................................................................................................ 65 3-5-2- Driving Lab Simulator ...................................................................................................................... 68 3-5-3- Communication System and Data Synchronisation .......................................................................... 68 3-5-4- Eco-driving System ........................................................................................................................... 69 3-5-5- Navigation System ............................................................................................................................ 70 3-5-6- CD player .......................................................................................................................................... 71
3-6- Data Analysis............................................................................................................... 72
3-7- Research Ethics/Statement ........................................................................................ 74
Chapter 4 - Data Analysis and Results ................................................................................... 75
4-1-Introduction ................................................................................................................. 76
4-2- Data Analysis for the First Day (entire road network) ........................................... 76 4-2-1- DALI Mental Workload .................................................................................................................... 76 4-2-2- Missed Response Count .................................................................................................................... 80 4-2-3- Summary ........................................................................................................................................... 81
4-3- Analysis of Manoeuvres (first day) ........................................................................... 82 4-3-1- Summary Results for No Particular Manoeuvre (baseline manoeuvre) ............................................ 82 4-3-2- Summary Results for Lane Changing Manoeuvres ........................................................................... 83 4-3-3- Summary Results for Overtaking Manoeuvres ................................................................................. 84 4-3-3- Summary Results for Commence Braking Task at Intersections ...................................................... 85 4-3-5- Summary Results for Commence Braking Task at Roundabouts ..................................................... 86 4-3-6- Summary of First Day Data Analysis ............................................................................................... 87
4-4- An Analysis on the Practice Effect (entire road network) ...................................... 89 4-4-1- DALI Mental Workload .................................................................................................................... 89 4-4-2- Missed Response Count .................................................................................................................... 91 4-4-3- Wrong Response Count .................................................................................................................... 92 4-4-4- Summary for Practice Effect on Entire Network .............................................................................. 93
4-5- Practice Effect on Driving Measures Based on Type of Manoeuvre ..................... 94 4-5-1 Practice Effect for Baseline Manoeuvre ............................................................................................. 94 4-5-2 Practice Effect for Lane Changing Manoeuvre .................................................................................. 96 4-5-3 Practice Effect for Overtaking Manoeuvre ......................................................................................... 97 4-5-4 Practice Effect for Braking for Intersections Manoeuvre ................................................................... 99 4-5-5 Practice Effect for Braking for Roundabouts Manoeuvre ................................................................ 100 4-5-6 Summary Results of Practice Effect on Driving Measures Based on Type of Manoeuvre .............. 101
4-6- Manoeuvres Comparison Based on Distraction Measures (first day) ................. 101 4-6-1- Straight, Lane Changing and Overtaking Manoeuvres ................................................................... 102 4-6-2- Intersections and Roundabouts ....................................................................................................... 114
Chapter 5 - Discussion and Conclusions ............................................................................. 116 5-1- Summary ............................................................................................................................................ 117 5-1- Thesis Outcomes Based on Research Questions ................................................................................ 117 5-1-1- Does the Use of an Eco-driving System Distract Drivers in a Driving Simulator more than Two
Other In-Vehicle Activities? ...................................................................................................................... 118 5-1-2- Is There a Practice Effect which Reduces the Level of Distraction under the Study Circumstances?
................................................................................................................................................................... 120 5-1-3-Do the Systems Have an Effect on Driver Performance When Drivers Engage in Particular
Manoeuvres? .............................................................................................................................................. 122 5-1-4- Are There any Differences between Young (Novice) and Middle-Aged (Experienced) Drivers, or
Between Male and Female Drivers when They Get Distracted? ............................................................... 123 5-1-4-1- Age Differences ........................................................................................................................... 123
Page 9
Page VI
5-1-4-2- Gender Differences ...................................................................................................................... 124 5-2- Summary and Implications ................................................................................................................. 124 5-3- Limitations ......................................................................................................................................... 125 5-4- Future Work ....................................................................................................................................... 127 5-5- Contribution to Knowledge ................................................................................................................ 128
References/Bibliography .................................................................................................. 220
Page 10
Page VII
List of Tables Table 1: Factors affecting workload extracted from (de Waard, 1996, p.20) ...................................... 33
Table 2: Measuring locations order ...................................................................................................... 61
Table 3: Summary of drivers rating to Motion Sickness Assessment Questionnaire (MSAQ); first day
.............................................................................................................................................................. 63
Table 4: Summary of drivers’ ratings for Motion Sickness Assessment Questionnaire (MSAQ); second
day ......................................................................................................................................................... 64
Table 5: Descriptive statistics of DALI for entire network .................................................................... 76
Table 6: Pair-wise comparisons of DALI mental workload in entire network ...................................... 78
Table 7: Descriptive statistics of DALI based on gender ....................................................................... 78
Table 8: Pair-wise comparisons of DALI mental workload based on gender........................................ 78
Table 9: Descriptive statistics of DALI based on age group .................................................................. 79
Table 10: Pair-wise comparisons of DALI mental workload based on aged group ............................... 79
Table 11 : Descriptive statistics of MRCs for entire network ................................................................ 80
Table 12: Pair-wise comparisons of MRCs ............................................................................................ 81
Table 13: Summary of significant results, baseline manoeuvre, first day ............................................ 83
Table 14: Summary of significant results, lane-changing, first day ...................................................... 84
Table 15: Summary of significant results, overtaking, first day ............................................................ 85
Table 16: Summary of significant results, Intersection, first day.......................................................... 86
Table 17: Summary of significant results, braking at roundabouts, first day ....................................... 87
Table 18: Summary of significant pair-wise comparisons of eco-driving scenario with all other
scenarios (Lane changing, overtaking and baseline manouveres) ....................................................... 88
Table 19: Summary of significant pair-wise comparisons of eco-driving scenario with all other
scenarios (Roundabouts and intersections) ......................................................................................... 88
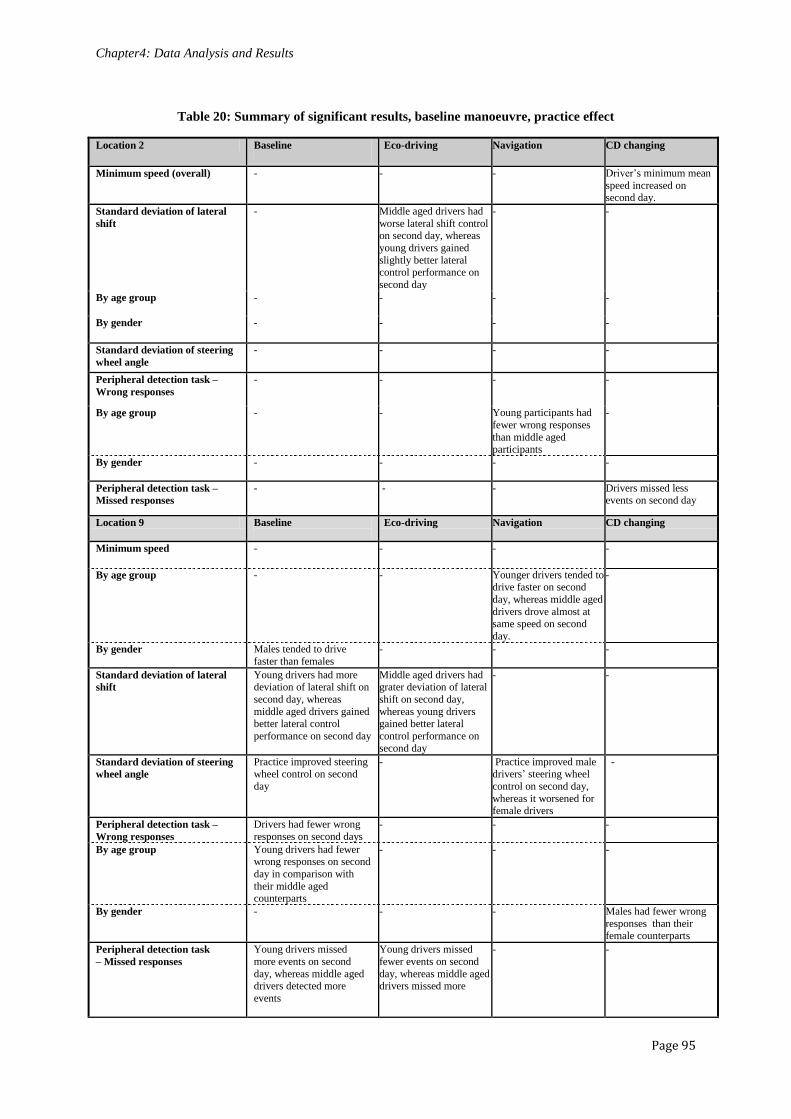
Table 20: Summary of significant results, baseline manoeuvre, practice effect .................................. 95
Table 21: Summary of significant results, lane-changing, practice effect ............................................ 97
Table 22: Summary of significant results, overtaking, practice effect .................................................. 98
Table 23: Summary of significant results, intersection, practice effect ............................................... 99
Table 24: Summary of significant results, braking at roundabouts, practice effect ........................... 101
Table 25: Descriptive statistics of Minimum speed for baseline scenario.......................................... 102
Table 26: Pair-wise comparisons of minimum speed for baseline scenario ....................................... 103
Table 27: Descriptive statistics of Minimum speed for in-motion locations in eco-driving scenario . 104
Table 28: Pair-wise comparisons of Minimum speed for in-motion locations in eco-driving scenario
............................................................................................................................................................ 104
Table 29: Descriptive statistics of Minimum speed for navigation scenario ...................................... 105
Table 30: Pair-wise comparisons of Minimum speed for navigation scenario ................................... 106
Table 31: Descriptive statistics of Min speed for CD changing scenario ............................................ 107
Table 32: Pair-wise comparisons of Minimum speed for CD changing scenario ................................ 107
Table 33: Descriptive statistics of MRC for baseline scenario ............................................................ 108
Table 34: Pair-wise comparisons of MRC for baseline scenario ......................................................... 109
Table 35: Descriptive statistics of MRC for eco-driving scenario ........................................................ 109
Table 36: Pair-wise comparisons of MRC for eco-driving scenario .................................................... 110
Table 37: Descriptive statistics of MRC for navigation scenario ......................................................... 111
Table 38: Pair-wise comparisons of MRC for navigation scenario ...................................................... 111
Page 11
Page VIII
Table 39: Descriptive statistics of MRC for CD changing scenario ...................................................... 112
Table 40: Pair-wise comparisons of MRC for CD changing scenario3 ................................................ 112
Table 41: Summary of significant results in comparisons between all manoeuvres and first straight
driving at location ............................................................................................................................... 113
Table 42: Pair-wise comparisons of MRC for baseline scenario (intersections and roundabouts) .... 114
Table 43: Descriptive statistics of minimum speed across scenarios at location 2 ............................ 136
Table 44: Descriptive statistics of standard deviation of lane lateral shift for location 2 .................. 138
Table 45: Descriptive statistics of standard deviation of steering wheel at location 2 ...................... 139
Table 46: Pair-wise comparisons of standard deviation of steering wheel at location 2 ................... 140
Table 47: Descriptive statistics of MRCs across scenarios at location 2 ............................................. 141
Table 48: Descriptive statistics of minimum speed at location 9 ....................................................... 142
Table 49: Descriptive statistics of standard deviation of lane lateral shift at location 9 .................... 144
Table 50: Descriptive statistics of standard deviation of steering wheel at location 9 ...................... 145
Table 51: Pair-wise comparisons of standard deviation of steering wheel at location 9 ................... 146
Table 52: Descriptive statistics for minimum speed at location 1 ...................................................... 148
Table 53: Descriptive statistics of standard deviation of lateral shift at location 1 ........................... 150
Table 54: Descriptive statistics of standard deviation of steering wheel ........................................... 151
Table 55: Descriptive statistics of WRCs at location 1 ........................................................................ 152
Table 56: Descriptive statistics of MRCs at location 1 ........................................................................ 154
Table 57: Pair-wise comparisons of MRCs at location 1 ..................................................................... 155
Table 58: Descriptive statistics of minimum speed at location 4 ....................................................... 156
Table 59: Descriptive statistics of Standard deviation of steering wheel across scenarios at location 4
............................................................................................................................................................ 157
Table 60: Descriptive statistics of WRCs for young and middle aged drivers at location 4 ................ 159
Table 61: Descriptive statistics of MRCs across scenarios at location 4 ............................................. 161
Table 62: Descriptive statistics of minimum speed at location 5 ....................................................... 163
Table 63: Descriptive statistics of lane lateral shift at location 5 ....................................................... 164
Table 64: Descriptive statistics of Standard deviation of steering wheel at location 5 ...................... 166
Table 65: Descriptive statistics of MRCs at location 5 ........................................................................ 167
Table 66: Descriptive statistics Mean minimum speed of drivers across scenarios at location 10 ... 168
Table 67 : Descriptive statistics of lane lateral shift at location 10 .................................................... 169
Table 68: Descriptive statistics of standard deviation of steering wheel at location 10 .................... 170
Table 69: Descriptive statistics of MRC at location 10 ........................................................................ 170
Table 70: Descriptive statistics of MRCs at location 3 ........................................................................ 172
Table 71: Descriptive statistics of MRCs at location 8 ........................................................................ 173
Table 72: Descriptive statistics of speed at location 6 ........................................................................ 175
Table 73: Descriptive statistics of MRCs at location 6 ........................................................................ 175
Table 74: Descriptive statistics of acceleration at location 6 ............................................................. 177
Table 75: Descriptive statistics of speed at location 7 ........................................................................ 178
Table 76: Descriptive statistics of MRCs at location 7 ........................................................................ 179
Table 77: Descriptive statistics of acceleration at location 7 ............................................................. 181
Table 78: Descriptive statistics of standard deviation of lateral shift over 2 consecutive days (eco-
driving scenario) .................................................................................................................................. 183
Table 79: Descriptive statistics of standard deviation of lane lateral shift across 2 consecutive days
............................................................................................................................................................ 187
Page 12
Page IX
Table 80: Descriptive statistics of standard deviation of lateral shift over 2 consecutive days at
location 9 (eco-driving scenario)......................................................................................................... 188
Table 81: Descriptive statistics for standard deviation of steering wheel over 2 consecutive days at
location 9 (navigation scenario) .......................................................................................................... 190
Table 82: Descriptive statistics of MRCs over 2 consecutive days at location 9 (baseline scenario) . 191
Table 83: Descriptive statistics of MRCs over 2 consecutive days at location 9 (eco-driving scenario)
............................................................................................................................................................ 192
Table 84: Gender practice differences on standard deviation of lateral shift in CD changing scenario
at location 4 (CD changing scenario) .................................................................................................. 198
Table 85: Descriptive statistics of standard deviation of steering wheel over 2 consecutive days at
location 5 (eco-driving scenario)......................................................................................................... 204
Table 86: Descriptive statistics of minimum speed over 2 consecutive days at location 10(baseline
scenario) .............................................................................................................................................. 206
Table 87: Descriptive statistics of standard deviation of steering wheel over 2 consecutive days at
location 10 (baseline scenario) ........................................................................................................... 208
Table 88: Descriptive statistics of MRCs over 2 consecutive days at location 10 (CD changing
scenario) .............................................................................................................................................. 210
Table 89: Descriptive statistics of acceleration over 2 consecutive days at location 6 (Age group) .. 215
Table 90: Descriptive statistics of acceleration over 2 consecutive days at location 6 (Gender) ....... 216
Page 13
Page X
List of Figures Figure 1: Dashboard view of an eco-driving system extracted from Barbé and Boy (2006) ................ 20
Figure 2: Relative risk of in-vehicle distraction fatalities and injuries extracted from Lam (2002) ...... 25
Figure 3: Relationship between workload and performance extracted from de Waard (1996, p.24) . 33
Figure 4: The information processing of driving task; situational awareness outlook extracted from
Ma and Kaber (2005, p.942) ................................................................................................................. 34
Figure 5: Driver behaviour model used by TNO (Keith et al., 2005, p.19) ............................................ 43
Figure 6: The theory of planned behaviour (Ajzen, 1991, p.182) ......................................................... 44
Figure 7: The 4-D dimensional resource model (Wickens, 2008, p.450) .............................................. 46
Figure 8: The network of simulated road in driving simulator ............................................................. 53
Figure 9: SCANeR software and created network of the study ............................................................ 54
Figure 10: Participants’ level of education ........................................................................................... 57
Figure 11: Participants’ previous experience with eco-driving ............................................................. 58
Figure 12: Participants’ frequency of changing CDs ............................................................................. 58
Figure 13: Participants’ frequency of navigation system usage ........................................................... 59
Figure 14: Driving simulator’s average motion sickness symptom changes in two days ..................... 65
Figure 15: CARRS-Q Advanced Driving simulator (CARRS-Q, 2010) ...................................................... 68
Figure 16: RTMaps diagram for synchronising sent messages in a PDA and SCANeR .......................... 69
Figure 17: Position of PDA holder in front of windscreen .................................................................... 70
Figure 18: Eco-driving messages on PDA .............................................................................................. 70
Figure 19: PDA screen in navigation scenario ....................................................................................... 71
Figure 20: CDs and CD player position .................................................................................................. 72
Figure 21: DALI mental workload for entire network across scenarios ................................................ 77
Figure 22: DALI of male and female drivers across scenarios ............................................................... 79
Figure 23: DALI of young and middle aged drivers across scenarios .................................................... 80
Figure 24: Missed response counts for entire network across scenarios ............................................. 81
Figure 25: Effect of practice on drivers’ DALI mental workload ........................................................... 91
Figure 26: Effect of practice on drivers’ MRCs ...................................................................................... 92
Figure 27: Effect of practice on drivers’ WRCs...................................................................................... 93
Figure 28: Minimum speeds in all in-motion manoeuvres in baseline scenario ................................ 103
Figure 29: Minimum speed for in-motion manoeuvres in eco- driving scenario ............................... 105
Figure 30: Minimum speed of in-motion manoeuvres in navigation scenario ................................... 106
Figure 31: Minimum speed of in-motion manoeuvres in CD changing scenario ................................ 108
Figure 32: MRCs of in-motion manoeuvres in baseline scenario ....................................................... 109
Figure 33: MRCs of in-motion manoeuvres in eco-driving scenario ................................................... 110
Figure 34: MRCs of in-motion manoeuvres in navigation scenario .................................................... 111
Figure 35: MRCs of in move manoeuvres in CD changing scenario .................................................... 113
Figure 36: MRCs of intersections and roundabouts in baseline scenarios ......................................... 114
Figure 37: Minimum speed across scenarios at location 2 ................................................................. 136
Figure 38: Minimum speed of young and middle aged drivers across scenarios at location 2 .......... 137
Figure 39: Minimum speed for male and female drivers across scenarios at location 2 ................... 138
Figure 40: Standard deviation of lateral shift across scenarios at location 2 ..................................... 139
Figure 41: Mean standard deviation of steering wheel across scenarios at location 2...................... 140
Figure 42: WRCs across scenarios in location 2 .................................................................................. 141
Page 14
Page XI
Figure 43: MRCs across scenarios at location 2 .................................................................................. 142
Figure 44: Minimum speed across scenarios at location 9 ................................................................. 143
Figure 45: Minimum speed of young and middle aged drivers across scenarios at location 9 .......... 143
Figure 46: Minimum speed of male and female drivers across scenarios at location 9 ..................... 144
Figure 47: Standard deviation of lateral shift across scenarios at location 9 ..................................... 145
Figure 48: Standard deviation of steering wheel across scenarios at location 9................................ 146
Figure 49: WRCs of drivers across scenarios at location 9 .................................................................. 147
Figure 50: MRCs of drivers across scenarios at location 9 .................................................................. 147
Figure 51: Minimum speed of young and middle aged drivers across scenarios at location 1 .......... 149
Figure 52: Minimum speed of male and female drivers across scenarios at location 1 ..................... 149
Figure 53: Standard deviation of lateral shift across scenarios at location 1 ..................................... 150
Figure 54: Standard deviation of steeing wheel across scenarios for location 1 ............................... 151
Figure 55: Standard deviation of steering wheel for male and female drivers across scenarios at
location 1 ............................................................................................................................................ 152
Figure 56: WRCs across scenarios at location 1 .................................................................................. 153
Figure 57: Young and middle aged drivers’ WRCs across different scenarios at location 1 ............... 153
Figure 58: Male and female drivers’ WRCs across different scenarios at location 1 ......................... 154
Figure 59: MRCs across different scenarios in location 1 ................................................................... 154
Figure 60: Minimum speed of drivers across scenarios at location 4 ................................................. 156
Figure 61: Standard deviation of lateral shift across scenarios at location 4 ..................................... 157
Figure 62: Standard deviation of steering wheel across scenarios at location 4................................ 158
Figure 63: WRCs across scenarios at location 4 .................................................................................. 159
Figure 64: WRCs of young and middle aged drivers across scenarios at location 4 ........................... 160
Figure 65: WRCs of male and female drivers across scenarios at location 4 ...................................... 160
Figure 66: MRCs across scenarios at location 4 .................................................................................. 161
Figure 67: MRCs for young and middle aged drivers across scenarios at location 4 .......................... 162
Figure 68: MRCs for male and female drivers across scenarios at location 4 .................................... 162
Figure 69: Minimum speed of drivers across scenarios at location 5 ................................................. 163
Figure 70: Lateral shift of drivers across scenarios at location 5 ........................................................ 164
Figure 71: Lateral shift of young and middle aged drivers across scenarios at location 5 ................. 165
Figure 72: Lateral shift of male and female drivers across scenarios at location 5 ............................ 165
Figure 73: Standard deviation of steering wheel across scenarios at location 5................................ 166
Figure 74: MRCs across scenarios at location 5 .................................................................................. 167
Figure 75: Minimum speed of drivers across scenarios at location 10 ............................................... 169
Figure 76: Lateral shifts across scenarios at location 10..................................................................... 169
Figure 77: Standard deviation of steering wheel across scenarios at location 10.............................. 170
Figure 78: MRCs across scenarios at location 10 ................................................................................ 171
Figure 79: MRCs across scenarios at location 3 .................................................................................. 173
Figure 80: MRCs across scenarios at location 8 .................................................................................. 174
Figure 81: Mean speed of drivers across scenarios at location 6 ....................................................... 175
Figure 82: MRCs across scenarios in location 6 .................................................................................. 176
Figure 83: MRCs of male and female drivers across scenarios at location 6 ...................................... 177
Figure 84: Acceleration across scenarios at location 6 ....................................................................... 178
Figure 85: Mean speed across scenarios at location 7 ....................................................................... 179
Figure 86: MRCs across scenarios at location 7 .................................................................................. 180
Page 15
Page XII
Figure 87: MRCs across scenarios at location 7 .................................................................................. 180
Figure 88: Acceleration across scenarios at location 7 ....................................................................... 181
Figure 89: Standard deviation of lateral shift for young and middle aged drivers over 2 consecutive
days at location 2 (eco-driving scenario) ............................................................................................ 183
Figure 90: Minimum speed for male and female drivers over 2 consecutive days at location 9
(baseline scenario) .............................................................................................................................. 186
Figure 91: Minimum speed for young and middle aged drivers over 2 consecutive days at location 9
(navigation system) ............................................................................................................................. 187
Figure 92: Standard deviation of lateral shift for young and middle-aged drivers over 2 consecutive
days at location 9 (baseline scenario) ................................................................................................. 188
Figure 93: Standard deviation of lane lateral shift for young and middle-aged drivers over 2
consecutive days at location 9 (eco-driving scenario) ........................................................................ 189
Figure 94: Standard deviation of steering wheel for males and females over 2 consecutive days at
location 9 (navigation system) ............................................................................................................ 190
Figure 95: MRCs of young and middle-aged drivers over 2 consecutive days at location 9 (baseline
scenario) .............................................................................................................................................. 192
Figure 96: MRCs of young and middle-aged drivers across over 2 consecutive days at location 9 (eco-
driving scenario) .................................................................................................................................. 193
Figure 97: Minimum speed of young and middle aged drivers over 2 consecutive days at location 1
(Baseline scenario) .............................................................................................................................. 194
Figure 98: Minimum speed of male and female drivers over 2 consecutive days at location 1 (Eco-
driving scenario) .................................................................................................................................. 195
Figure 99: Standard deviation of lateral shift of male and female drivers over 2 consecutive days at
location 4 (CD changing scenario) ....................................................................................................... 198
Figure 100: WRCs of young and middle aged drivers over 2 consecutive days at location 4 (Baseline
scenario) .............................................................................................................................................. 199
Figure 101: WRCs of young and middle aged drivers over 2 consecutive days at location 4 (navigation
system) ................................................................................................................................................ 200
Figure 102: Standard deviation of steering wheel for young and middle-aged drivers over 2
consecutive days at location 5 (eco-driving scenario) ........................................................................ 204
Figure 103: Minimum speed of male and females drivers over 2 consecutive days at location 10
(baseline scenario) .............................................................................................................................. 206
Figure 104: Standard deviation of steering wheel for young and middle-aged drivers over 2
consecutive days at location 10 (baseline scenario) ........................................................................... 208
Figure 105: MRCs for male and female drivers over 2 consecutive days at location 10 (CD changing
scenario) .............................................................................................................................................. 210
Figure 106: MRCs of male and female drivers over 2 consecutive days at location 8 (CD changing
scenario) .............................................................................................................................................. 213
Figure 107: Acceleration of male and female drivers over 2 consecutive days at location 6 (Age
group) .................................................................................................................................................. 216
Figure 108: Acceleration of male and female drivers over 2 consecutive days at location 6 (Gender)
............................................................................................................................................................ 217
Page 16
Page XIII
Appendices
Appendix 1 : Motion Sickness Assessment Questionnaire (MSAQ) ................................................. 131
Appendix 2 : DALI (Driving Activity Load Index) Mental Workload Questionnaire ......................... 132
Appendix 3 : Demographic questionnaire ......................................................................................... 134
Appendix 4 : Summary of Participants Response to Demographic Questionnaire ......................... 135
Appendix 5 : Analysis of Manoeuvres at First Day ............................................................................ 136
Appendix 6 : Detailed analysis of Practice Effect Based on Driving Measures and ......................... 182
Page 17
Page XIV
Glossary of Terms and Abbreviations
ABS Anti-lock Braking System
ADAM The German Advanced Driver Attention Metrics Program
ADAS
Advanced Driver Assistance Systems
AHS Automated Highway Systems
ANOVA Analysis of Variance
CAMP The Consortium of the Collision Avoidance Metrics Partnership
CARRS-Q Centre for Accident Research and Road Safety - Queensland
CDS Crashworthiness Data System
COSMODRIVE Cognitive Simulation Model of the Driver
CRC Correct Response Count
DALI Driving Activity Load Index
DWM Driver Workload Metrics
EID Ecological Interface Design
GNP Gross National Product
HASTE Human Machine Interface and the Safety of Traffic in Europe
HMI Human Machine Interface
ISO International Standards Organization
IVIS In-Vehicle Information Systems
MRC Missed Response Count
MRT Multiple Resource Model Theory
NASA-TLX NASA Task Load Index
NHTSA National Highway Traffic Safety Administration
OECD The Organisation for Economic Co-Operation and Development
OED Objects and Events Detection
OP Observed Power
PASW Predictive Analytics Software
PDA Personal Digital Assistant
PDT Peripheral Detection Task
QUT Queensland University of Technology
RBT Random Breath Testing
Rtmaps Real Time Multisensor Advanced Prototyping Software
SA Situational Awareness
SD Standard Deviation
SPSS Statistical Package for the Social Sciences
SWOV Institute for Road Safety Research, the Netherlands
TNO The Netherlands Organisation for Applied Scientific Research
WHO World Health Organization
WRC Wrong Response Count
Page 18
Page XV
Statement of Original Authorship
“The work contained in this thesis has not been previously submitted to meet requirements
for an award at this or any other higher education institution. To the best of my knowledge
and belief, the thesis contains no material previously published or written by another person
except where due reference is made.”
Signature
Date 14 November 2012
QUT Verified Signature
Page 19
Page XVI
Acknowledgement
It is a pleasure to thank those who made this thesis possible. First, I would like to sincerely
thank my principal supervisor, Dr. Mark King, for his great support in my research. I am also
grateful to my associate supervisor, Professor Andry Rakotonirainy, for his support during the
last two years.
I greatly thank Andrew Haines for his help in the preparation stage in the simulator lab. I also
received an invaluable amount of his time during data collection in the advanced driver simulator
room. I owe my deepest gratitude to Dale Steinhardt for his help in the data management stage
and extracting data using the R statistical package. I would also like to acknowledge Dr Husnain
Malik’s efforts in core programming of communication system using C++.
I also would like to thank Luke Daly, Angela Watson, and Dr Grégoire Larue for their
assistance and advice for my study.
My special thanks go to all research participants in both pilot tests and actual driving tests for
their time and research support.
I received constructive suggestions from my panel members, Professor Barry Watson,
Director of the Centre for Accident Research and Road Safety - Queensland (CARRS-Q) and Ms
Genevieve Graves, Manager of Sustainable Transport at RACQ. I sincerely appreciate their time
and consideration.
Thank you to QUT and CARRS-Q for their financial support and the scholarships they
offered in my masters degree.
I am indebted to all CARRS-Q staff and students for establishing a friendly and supportive
environment. In particular, I would like to thank Mrs Kate Redford and Dr Judy Fleiter for their
attention and kindness.
Page 21
Page 1
Chapter 1 - Introduction
Page 22
Chapter1: Introduction
Page 2
1-1- Introduction
In this chapter an overview of road safety as both a global issue and in Australia is given.
More specifically driver distraction is defined, and the road safety issues associated with it are
discussed. Chapter 1 provides an introduction to the literature review and signposts the broad
context of the thesis.
1-2- Road Safety Overview Worldwide
“Although road traffic collisions kill more than 1.2 million people a year around the world,
they are largely neglected as a health issue” (World Health Organization, 2004). This sentence,
which was declared by the World Health Organization (WHO) on Global Road Safety Day in
2004, shows that the world will face widening road safety issues if no major actions and
innovations in road safety world-wide are considered in the near future.
In plain words, approximately 3000 people lose their lives in road-related crashes around the
globe every day, which is comparable to seven 747 jumbo jets with full passenger complements
going down (Australian Transport Safety Bureau, 2004). In addition, road crashes constitute a
major proportion of the injuries category, around 25% of all deaths around the globe (Peden et al.,
2004). One study has projected that by 2020, driving-related fatalities will grow by 66%
worldwide, decreasing by 28% in developed countries, but rocketing in countries such as China
(by 92%) and India (by 147%) (Boyle & Lee, 2010).
Additionally, it is estimated that annual cost of road crashes account for approximately 1 to
3% of Gross National Product (GNP) for each country. Developing countries currently lose $100
billion every year, which is approximately twice the total development assistance they receive
worldwide (World Bank, 2002). The Australian Transport Safety Bureau (2004) estimated that
the global cost of road crashes was about US$518 billion in 1997. Therefore, road safety is a
major concern. In particular, the nature of road safety issues is changing because of higher speed
vehicles and the development of new in-vehicle entertainment technologies.
1-3- Road Safety Status in Australia
In developed countries such as Australia, the number of road crash fatalities appeared to have
reached a plateau. From 1997 until the present, the average annual number of fatalities in
Australia has remained approximately 1600 to 1700 (Australian Transport Safety Bureau, 2007).
However, the fact that only 30% of global fatalities occur in developed countries shows that the
countermeasures that have been implemented were effective in these countries. It remains a
challenging task to decrease the fatality rate considerably. Drink driving and speeding are the
major contributing factors to most road crash fatalities in Australia (Leung & Starmer, 2005).
Page 23
Chapter1: Introduction
Page 3
However, it seems that other factors require more consideration. For instance, Regan (2007)
believes that there is still little understanding about the cause of distraction in Australia.
According to the Australian Transport Safety Bureau data, Australia was the eleventh country
amongst OECD nations in terms of having fewest road crash deaths per 100 thousand people
(8.9) in 2001 (Australian Transport Safety Bureau, 2004). In 2005, the rate was even lower with
8.0 road crash deaths per 100 thousand people (Australian Transport Safety Bureau, 2007).
However, on average, five people are killed every day in road crashes in the country (Australian
Transport Safety Bureau, 2004).
In Australia, it was estimated that the cost of road crashes was $17.85 billion in 2006. This
represented 1.7% of Australian GDP (Department of Infrastructure Transport Regional
Development and Local Government, 2009) and is a considerable amount of money, which could
potentially be reduced with appropriate road safety countermeasures.
1-4- What is Driver Distraction?
Around the year 1915, it was believed that vehicles’ windscreen wipers could potentially
distract or hypnotise drivers (Karlsson, 2005), while nowadays, listening to music, changing CDs,
or even using a navigation system in-vehicle, are considered as everyday driving activities.
However, potential danger of these tasks is still being debated.
Attention is necessary in order to achieve complete perception in driving tasks (Castro, 2009).
Castro (2009, p.75) stated that distraction is the dysfunctional side of attention, and he noted that
“Distraction is attention to irrelevant stimuli or actions, and this implies a definition of what is
relevant or irrelevant for a given goal.” In these circumstances, momentary lapses are created by
driver distraction. The lapses can affect safe driving in practice (Victorian Automobile Chamber
Of Commerce, 2005). Considering this definition, distraction effects seem to be common events
for road users. However, not all of them lead to traffic crashes (Castro, 2009). In many self-
reported crash reports, drivers explicitly cite that “I was distracted” or “I had my mind elsewhere”
(Castro, 2009, p.77). The reasoning behind this answer may be the fact that drivers have often
experienced distracting tasks as a common part of everyday driving, but they do not expect
themselves to be involved in road crashes. Now the question is what driver distraction is?
Generally, there is no internationally acknowledged definition of driver distraction (Ranney,
2008). The International Standards Organization (ISO) introduced the following basic definition:
“Distraction is attention given to a non-driving-related activity, typically to the detriment of
driving performance” (Ranney, 2008, p.2). Stutts et al. (2001) differentiated distraction from
other types of driver inattention. They defined that distraction is a delay “in the recognition of
Page 24
Chapter1: Introduction
Page 4
information needed to safely accomplish the driving task because some event, activity, object, or
person within or outside the vehicle compels or induces the driver’s shifting attention away from
the driving task” (Ranney, 2008, p.2). It is agreed that a triggering activity is a critical component
of the distraction definition (Ranney, 2008). Horberry, Anderson, Regan, Triggs and Brown
(2006, p.186) stated that “distraction occurs when a triggering event induces an attentional shift
away from [the main driving task]”. However, the Australian Road Safety Board (2006) offered
the following widely used definition:
“Driver distraction is the voluntary or involuntary diversion of attention from the primary
driving tasks not related to impairment (from alcohol, drugs, fatigue, or a medical condition)”
(Ranney, 2008, p.2). The definition clarifies that “the diversion occurs because the driver is
performing an additional task (or tasks) and temporarily focusing on an object, event, or person
not related to the primary driving tasks” (Ranney, 2008, p.2).
Ranney (2008) stated one of the important positive points about the definition as being
involved in a secondary task, which presents a clear boundary between distraction and other types
of inattention.
Regan, Hallett and Gordon (2011, p.1780), who believe that all previous definitions are not
consistent and their relationships are not clear, propose an alternative definition. They defined
driver inattention as “insufficient or no attention to activities critical for safe driving” (p. 1780)
and offer Driver Diverted Attention as a synonym of driver distraction. Finally, they defined
Driver Diverted Attention as “The diversion of attention away from activities critical for safe
driving toward a competing activity, which may result in insufficient or no attention to activities
critical for safe driving” (Regan et al., 2011, p.1780).
Distraction has been categorised into four different types: visual, auditory, bio-mechanical
(physical) and cognitive distraction (Young, Regan & Hammer, 2003). When the driver does not
give enough attention to the road, visual distraction happens. In this case, instead of focusing
visual attention on the road, distracted drivers look at another target for a certain period.
Similarly, auditory distraction takes place when the driver focuses their attention on auditory
stimuli instead of on the road environment. Biomechanical or physical distraction happens when
drivers manipulate an object by hand(s) rather than keeping their hands on the steering wheel, and
cognitive distraction could be defined as any thoughts that attract the driver’s attention in a way
that they are not able to drive safely anymore (Young & Regan, 2007). After defining driver
distraction, we must now answer the question, “Is driver distraction a road safety issue?”
1-5- Is Driver Distraction a Road Safety Issue?
Page 25
Chapter1: Introduction
Page 5
There is general agreement in the literature that driving tasks require the concurrent
implementation of a range of cognitive, physical, sensory and psychomotor activities (Harvey,
Stanton, Pickering, McDonald & Zheng, 2011; Young & Regan, 2007). In spite of these
complexities, it is common to drive a vehicle while being engaged in various non driving-related
tasks, from talking with passengers and listening to music, to even drinking a coffee and reading
a map. With the introduction of IT technologies such as navigation systems, eco advising
systems, and more advanced entertainment facilities, it is becoming more a point of concern for
side effects of these technologies on driving performance (Young & Regan, 2007).
Driving tasks become mostly automated with more driving experience. Therefore, drivers are
often capable of allocating their attention between tasks at the same time with little or no
impairment of their driving performance. In addition, drivers use an adapting strategy in order to
compensate for their decreased attention, and thus to compensate for their impaired driver
performance. Despite these points, drivers can be distracted to the extent that they do not allocate
sufficient attention to the main task (Young & Regan, 2007). Distraction can also be associated
with lapses in controlling a vehicle and result in unintended speed variations or allowing the
vehicle to move outside the lane borders (Ranney, 2008) and, therefore, safety of distracted
drivers can be compromised. In this sense, when drivers’ cognitive processes in sharing their
attention between tasks and their adaptive strategies fail, they are not able to separate adequately
their attention between secondary tasks and the main task. As a result, they cannot maintain a
satisfactory level of driving performance. In other words, driver distraction can take place due to
complexity of the secondary tasks or high demand of the driving task itself (Young & Regan,
2007).
Many previous studies have shown that driver distraction is problematic. A naturalistic study
found that about 78% of crashes and 65% of near-crashes involved inattention as a contributing
factor (Klauer, Dingus, Neale, Sudweeks & Ramsey, 2006). The percentage figures may seem big
if it is not considered that, in the study, inattention included fatigue, general inattention to the
road, and distraction or secondary task demand (Regan, Lee & Young, 2009). Regan et al. (Regan
et al., 2009) suggest that to distinguish distraction from inattention, it is essential to look into the
nature of an activity or state. They suggested that distraction involves an “explicit activity” that
attracts the driver’s attention, such as texting or thinking, in comparison with inattention, which
involves a “cognitive state” and decreases the driver’s mindfulness to the driving task, such as
drowsiness or fatigue (Regan et al., 2009, p.32).
In a ‘100-Car Naturalistic Driving Study’, it was found that distraction was a contributing
factor in 23% of crashes and near-crashes (Young & Lenné, 2010). Another study previously
Page 26
Chapter1: Introduction
Page 6
showed that between 13% and 50% of all crashes occurred due to driver distraction or inattention
(Lee, 2007).
Using the Crashworthiness Data System (CDS) in the US, it has been calculated that over the
period from 1995 to 2003, about 10.5% of distracted drivers were involved in crashes severe
enough to require at least one of the vehicles to be towed from the scene of the crash (Ranney,
2008). It found that distracted drivers were 50% more prone to be seriously injured or killed in
their crashes, compared to attentive drivers. Compared to the crashes of attentive drivers,
distracted drivers were more likely to crash during night time or evening hours. They also had
less chance of crashes on high-speed, multi-lane roadways, curved parts of road, and at
intersections (Ranney, 2008). In an epidemiological study, using 699 Toronto drivers who had a
crash and also owned a mobile phone, it was found that the risk of crash while using a mobile
phone was four-fold larger than when they were not using a mobile phone (Young & Regan,
2007). The issue may worsen in future. Strayer, Watson and Drews (2011) believe that new
sources of driver distraction (e.g., email sending, internet browsing) could potentially be more
cognitively distracting than old sources of distracters (e.g., eating, listening to music, talking with
a passenger).
To sum up, distraction can increase the risk of crashes as well as the magnitude of crash
severity on roads. It is especially important because of the fact that new vehicles are being
equipped with different types of technology, which can bring more potentially in-vehicle
distracting activities.
1-6- Eco-driving systems and Eco-driving behaviour
About 20% of world greenhouse gas emissions are caused by road transport (Young, Birrell
& Stanton, 2011). Twenty five years ago, it was acknowledged that it was necessary to develop
an in-vehicle device to give instant and precise fuel consumption information to the driver
without actually distracting him/her from the main task or driving (Barkenbus, 2010). To date,
such devices have been installed in new vehicles by many car manufacturers to provide drivers
with instant feedback on fuel economy performance. They are called “eco-driving” systems or
“smart driving” tools. They first came to market on hybrid-electric vehicles and perhaps the best-
selling hybrid-electric car is produced by Toyota (Toyota Prius). It attracted a lot of attention for
its dashboard centre-prominently-mounted display (Barkenbus, 2010).
Fuel economy information can be sent by three different methods to drivers: an immediate
kilometre per litre figure, a 5 minute average kilometre per litre figure, and a trip duration
kilometre per litre figure. Some other hybrid-electric vehicles not only offer driver feedback, but
also set up driving parameters in the vehicle that can aid in eco-driving. Honda, for instance, is
Page 27
Chapter1: Introduction
Page 7
installing a driver-activated ECON mode that adjusts characteristics of performance to the most
fuel-efficient condition in its hybrid vehicle (Barkenbus, 2010).
Apart from in-vehicle technology which informs drivers about their smart driving behaviour,
previous studies found that just requesting drivers to drive economically can decrease fuel
consumption by 10 to 15% (Young et al., 2011). Drivers generally interpret driving economically
as going slower (Young et al., 2011). It has also been shown that heavy vehicle drivers reduced
their fuel consumption 27% when trained in eco-driving (Caird & Hallihan, 2011). It should be
noted that a speed between 60 and 80 km/h is the most fuel efficient speed to overcome both road
surface resistance and wind resistance (Young et al., 2011).
In fact, there are also a number of other factors which can affect fuel consumption. It has been
shown that “avoiding unnecessary stops, maintaining low deceleration levels, minimising the use
of 1st and 2nd gears, increasing the use of 5th gear, and block changing gears where possible”
can reduce fuel consumption (Young et al., 2011, p.535). It has also been shown that applying the
maximum acceleration rate of a vehicle can increase fuel consumption by up to 60% (Young et
al., 2011). Previously, it has been shown that excessive braking and acceleration can raise fuel
consumption by up to 39% (Caird & Hallihan, 2011).
Young et al. (2011, p.535) reviewed observations in previous studies and provided the
following guidelines for a “green driving” style:
Plan ahead to avoid stopping
Use moderate engine speeds and a uniform throttle for steady speeds
Change gear up as soon as possible using positive (but not heavy) acceleration
Avoid sharp braking
Use engine braking for smooth deceleration.
It should be noted that there is some association between safe driving behaviour and fuel
consumption. Speed is a major factor in driving safely, but relatively less critical for fuel
consumption. However, acceleration is perhaps important in both safe driving and fuel economy.
Nevertheless, the relationship between driving safely and fuel economy is not always positive
(Young et al., 2011). For example, keeping a steady speed through trying to avoid braking may
compromise safe driving headways. Using the highest possible gear in a trip could possibly have
a negative effect on vehicle control. Interestingly, however, Haworth and Symmons (2002)
reported an approximate 35% decrease in crash rates and 11% decrease in fuel reduction when
drivers were trained in eco-driving.
The purpose of this research was therefore to investigate how in-vehicle tasks analogous to
some of these new technologies might contribute to driver distraction.
Page 28
Chapter1: Introduction
Page 8
The thesis includes five chapters. After a brief introduction in Chapter 1, in Chapter 2, a
literature review will be presented. In Chapter 3, the methodology and research deign will be
explained in detail. All data analysis and results are presented in Chapter 4. The last chapter,
Chapter 5, presents the discussion and conclusions.
Page 29
Page 9
Chapter 2 - Literature Review
Page 30
Chapter2: Literature Review
Page 10
2-1- Introduction
One of the causes of driver distraction is in-vehicle driver assistant systems (Horberry et al.,
2006; Lee, Forlizzi & Hudson, 2008; Lee, 2007). In most developed countries, advanced in-
vehicle systems have become as prevalent as ABS or seatbelts. Car manufacturing companies
have focused more on in-vehicle driver assistance systems (Castro, 2009) and promoted them as a
privilege through the media. However, there is little understanding of the side effects of most new
technologies on safe driver performance. In addition, little research has been conducted on
distraction or inattention caused by various in-vehicle technologies (Lee et al., 2008; Lee, Caven,
Haake & Brown, 2001).
Leung and Starmer (2005) explained that for over twenty years the Australian government has
introduced numerous strategies to lower road fatalities, such as reducing speeds in suburbs,
introducing provisional licences, adopting speed cameras and Random Breath Testing (RBT), and
designing education material for speeding and drink-driving. However, some major contributing
factors to crashes, like distraction, are still in the research stages. One interesting study (n=70)
showed that distractions are “a common component of everyday driving” and in total, drivers
spent 14.5% of the total time while driving, excluding conversation with other passengers in-
vehicle, on distracting activities (Stutts et al., 2005, p.1100). Although many aspects of
distraction have been revealed in the last decade, more projects should be conducted to address
the problem of distraction. Moreover, over the past two decades, various devices have been
introduced to the market to assist and entertain drivers. It has been estimated that navigation
systems, touch-screen displays and Bluetooth interfaces will be provided as standard or optional
equipment for, respectively, more than 80%, 55%, and nearly 70% of 2008 model vehicles
(Castro, 2009). These devices have the ability to distract drivers. Much research has been devoted
to characterising the potential causes of distraction and determining how new in-vehicle systems
may distract drivers.
In general, three sources of distraction are defined: visual distraction, where the eyes are taken
off the road to attend to an in-vehicle system: manual distraction, where the hands are taken off
the wheel to use a device; and cognitive distraction, where drivers’ attention is taken away from
information processing (Strayer et al., 2011). Because of the complexity of the driving task,
various concurrent cognitive, physical, sensory, and psychomotor skills are required (Young &
Regan, 2007). Many in- and out-vehicle features may endanger the attention needed by a driver
and increase the risk of crashes. Examples of in-vehicle sources of distraction include eating,
drinking, talking to other people, and changing CD volume. Out-of-car distraction activities, such
as advertising billboards or talking to someone outside the car, are also common. Young drivers
in particular are more vulnerable to distraction by infotainment systems (Lee, 2007).
Page 31
Chapter2: Literature Review
Page 11
In the real world, vehicle control degradation and missing object/event detection are signs of a
withdrawal of attention. The mechanism of inattention is eye glances away from the road scene in
the case of visual inattention. In distraction, the selective withdrawal of attention and driver’s
vehicle control, such as speed maintenance and lane keeping, remain greatly unaffected.
However, distraction causes degradation in object and event detection. Moreover, distraction
caused by biomechanical interference may degrade vehicle control (Tijerina, 2000). In general
terms, distraction deterioration affects drivers’ ability to recognise information at a perceptual
level (Karlsson, 2005).
In this chapter, the main focus is presentation of a literature review on topics that are relevant
to the study. Therefore after reviewing in-vehicle driver distraction, studies related to distractions
from CD changing, navigation system usage and eco-driving system usage will be discussed.
Secondary aims of the study are to investigate the practice effect and the effect of different kinds
of manoeuvres on driver distraction. These two topics are also considered in the literature review.
As an exploratory analysis, it is intended to look at individual differences (age and gender). A
section has been assigned in the literature review on this topic. In addition two cognitive and
behavioural models are discussed in terms of their contribution to a better understanding of driver
distraction in the study.
2-2- In-vehicle Distraction
The importance of in-vehicle distraction has previously been investigated. In a study, an
analysis on a database of police fatal accident reports in England and Wales showed that in-
vehicle distraction, with the involvement of mobile telephones and entertainment systems, was a
contributory factor in 2% of fatal crashes over the period 1985–1995 (Stevens & Minton, 2001).
In a US study, it was estimated that eradicating mobile phone use while driving could decrease
crash occurrence by 6%. In other words, 330,000 injuries, 12,000 critical injuries, and 2,600 road
crash fatalities would be prevented if nobody used mobile phone in the US while the vehicle was
in motion (Cohen & Graham, 2003).
The question is, what is happening in distracted drivers that may lead to crashes? In case of
using a mobile phone, Strayer, Watson and Drews (2011) believe that using a mobile phone while
driving brings inattention blindness, which is the cause of driver failure to perceive information in
his/her sight line, whereas conversation with passengers does not. However, the level of
attentional demand at which a driver may fail to perceive information is not discussed.
Interactions with in-vehicle devices divert the eyes of drivers away from the roadway and in
consequence degrade scanning behaviour. Drivers generally like to concentrate on the road and
Page 32
Chapter2: Literature Review
Page 12
do not look away for a long time, but in-vehicle devices can increase in-vehicle glance durations
and frequency. More time is spent looking at in-vehicle systems so that drivers are at more risk of
missing critical events or information (Castro, 2009). The extent of looking away depends on the
traffic circumstances, and drivers in situations of increased complexity spend more time and have
greater frequency of glances in the vehicle. National Highway Traffic Safety Administration
(NHTSA, 2006) considered distraction times of two seconds unacceptable (Castro, 2009). The
Alliance of Automobile Manufacturers has included the criteria “that visual-manual tasks
performed while the vehicle is in motion should require no more than 20s total glance time and
that single-glance durations should not exceed 2s” (Regan et al., 2009, p.101). In-vehicle tasks
are considered safe if drivers comply with these criteria while driving (Regan et al., 2009).
Another important aspect of distraction studies is the location of the in-vehicle system,
relative to not only the road and the driver, but also the type and layout of its controls. The visual
angle from the road and location of the in-vehicle system in the simulator should match the
placement of them in real vehicles “because its distance from the forward view directly
contributes to the degree of distraction it imposes on drivers” (Regan et al., 2009, p.90). The
location of in-vehicle systems in simulators relative to real vehicle on the road needs to be
considered in simulator studies. Regan et al. (2009, p.90) believe that ”Discrepancies in the
location and design of the in-vehicle system between simulated and real vehicles may lead drivers
to interact with the system differently in the simulator and, thus, lead to driving performance
being differentially affected across the simulated and real-world environments”.
Many studies have shown that, regardless of the type of technology, some level of driver
distraction is created by the use of in-vehicle technologies. Mobile phone distraction studies have
received most attention among all new in-vehicle technologies (Horrey & Wickens, 2006;
McCartt, Hellinga & Bratiman, 2006). This might be because it is believed that it is the most
widespread source of driver distraction that is also likely to lead to road fatalities. In an
Australian study, “30% of people surveyed had used text messaging while driving and that 16%
regularly used text messaging while driving” (Lee, 2007, p.203). In an internet survey study
among 287 Victorian drivers, Young and Lenné (2010) found almost 60% of drivers used mobile
phones while driving. A high percentage of them used audio entertainment systems, but only a
few used visual displays such as DVD players. Young drivers (18-25) were more likely to be
engaged in activities like using mobile phones, CD players, eating or drinking than their middle-
aged and older counterparts. However, it is not clear from this study whether their reported results
are based on the drivers’ travelled mileage or their number of trips. Furthermore, the types of
roads, speeds at which they engaged in in-vehicle activities, traffic conditions and road
environment when they engaged in distracting activities are not reported. In a driving simulator
Page 33
Chapter2: Literature Review
Page 13
study, Horberry et al. (2006) studied two in-vehicle distraction tasks: operating the entertainment
system and using a simulated hands-free mobile phone. They found that entertainment systems
had the strongest effect on drivers’ distraction in three different age groups and environmental
complexities. Lee et al. (2001) studied the effect of speech based email on driver attention to the
roadway. Their results showed a 30% increase in reaction time with a speech based system. They
concluded that a “speech based interface is not a panacea that eliminates the potential distraction
from in-vehicle computers” (2001, p.631). In addition, there are endeavours to eliminate or at
least decrease distraction by in-vehicle technologies. For instance, one study showed that
applying contextually optimised navigation information can reduce a driver‘s perceptual load
significantly (Lee et al., 2008).
Currently, eco-driving systems have been growing rapidly in popularity. These systems send
messages to drivers so that driving performance can be improved in terms of fuel efficiency. Due
to demand for decreasing fuel consumption and environmentally friendly transport, eco-driving
systems are becoming common in the market. However, there remain unanswered questions as
how eco-driving systems may influence driving behaviour; and whether they might distract
drivers, particularly during potentially dangerous manoeuvres like overtaking.
After this overview of in-vehicle driver distraction, the next section reviews previous
driver distraction studies on navigation systems, CD players and eco-driving systems.
2-3- In-vehicle Navigation Systems
In-vehicle navigation systems are intended to guide drivers to a specified destination. Drivers
enter an address and the technology provides a path from the vehicle’s current location to the
destination. The systems are helpful for drivers in unfamiliar places. However, in several ways,
they could potentially distract drivers: physical distraction associated with manual destination
entry; the visual distraction once looking at the display; the vocal distraction while listening to
turn-by-turn instructions; and also the cognitive distraction once the driver thinks about the
received information (Ranney, 2008). Distraction caused by these systems has attracted more
attention in recent years.
It is estimated that more than 60% of good vehicles and over 20% of passenger vehicles are
equipped with navigation systems in the Netherlands ("SWOV Fact sheet; Safety effects of
navigation systems," 2010). In a study by the Netherlands Organisation for Applied Scientific
Research (TNO, 2007), analysis on data of 1,144 drivers showed that 28% of drivers owned a
navigation system. Over 35% of the drivers applied it on 20% of their trips and more than 15%
applied it on 80% of their trips. The navigation system was primarily applied for unfamiliar
Page 34
Chapter2: Literature Review
Page 14
destinations. The drivers who owned a navigation system were found to drive more per year than
the drivers without such a navigation system. More specifically, 60% of navigation owners drive
more than 20 thousand kilometre per year, while only 40% of non-owners drive more than 20
thousand kilometre per annum ("SWOV Fact sheet; Safety effects of navigation systems," 2010).
In another study, destination entry in the visual/manual systems showed a higher possible
distraction than the voice activated system. There was evidence of “longer completion times,
more frequent glances at the device, longer eyes-off-road times, and a greater number of lane
exceedances” (Ranney, 2008, p.16). The author stated that voice recognition technology in
destination entry tasks could be less distracting than entering addresses manually (Ranney, 2008).
A survey of 130 navigation system users found that just 10% of respondents utilise voice input to
enter destination information and 25% frequently enter destination addresses manually while
driving (Young et al., 2003). Of great concern, entering destination information in navigation
systems is a time consuming task and is a very distracting activity for the driver. It may take up to
nine minutes to enter a destination address. It should be added that it depends on the type of
navigation system and the method of entering the information into it (Young et al., 2003). An
outline of studies that have addressed the issue follows.
In one study, Tijerina, Parmer and Goodman (1998) investigated the effects of different
methods of entering destination address in four different navigation systems: three visual-manual
destination entry and one voice input and output entry method in a 12 km test truck study. Sixteen
participants with equal number of males and females in two groups of younger (35 years or
younger) and older (55 years or older) drivers were recruited to drive an instrumented vehicle.
Mean glance time, number of lane exceedances, and time taken to enter destination information,
were collected for each of the navigation systems. The authors reported that all three visual-
manual systems were associated with longer times of entering destination information, longer
eyes-off-road duration, more number of glances at the device, and a greater frequency of lane
exceedances in comparison with the voice activated system. The result also revealed that drivers
younger than 35 years old took on average over one minute to complete the task manually, while
the older took twice the time to finish the same task. In conclusion, it was found that voice-
recognition navigation systems are safer than the visual-manual systems in information entry task
while driving. However, they did not report other aspects of driving performance, such as steering
control, lane keeping, and speed.
One of the most prominent studies on distraction caused by navigation systems, is the camera
car study conducted by the NHTSA (Dingus, McGeehee, Hulse, Jahns, & Manakkal, 1995). In
the study, four different navigation systems were considered: turn-by-turn guidance screens, with
voice guidance and without voice guidance, and an electronic route map with voice guidance, and
Page 35
Chapter2: Literature Review
Page 15
without voice guidance (Young & Regan, 2007). In addition, two distracting conditions were
examined, which directions were written on paper, and a paper map. Thirty participants drove an
instrumented “camera car” while applying all of the navigation systems one by one. The
electronic map without voice guidance and the paper map caused the greatest degradations in
performance of drivers (Young & Regan, 2007). Engaging in electronic route map activities
without voice guidance produced high visual attention demand. Thus, drivers spent longer time to
retrieve information, and had more braking errors and lane deviations in comparison with other
navigation systems. Conventional map usage also showed a need for a high level of cognitive
attention, due to the high number of abrupt braking manoeuvres and high self-reported workload
ratings. The best performance was for the turn-by-turn navigation screen with voice guidance.
Therefore, it is believed that navigation systems that provide turn-by-turn instructions are less
distractive and are the most useable means of navigation (Young & Regan, 2007). However, the
study was conducted in 1995, and advances in the technology have possibly created more
distracting navigation systems both visually and cognitively, due to higher quality screens and an
increase in amount of information delivered to drivers.
Similarly, using a high fidelity driving simulator, Srinivasan and Jovanis (1997) examined
driving performance while interacting with complex navigation systems. The study was designed
to determine whether voice guidance or a turn-by-turn display make the usability of navigation
systems better. Eight participants drove in a simulator while interacting with four types of
navigation systems (Young & Regan, 2007): a map display, map and visual turn-by-turn displays,
map and voice guidance, and a paper map. It was found that the vocal guidance system was the
best in terms of driving performance degradation, with the fewest navigational errors, lowest
workload, and fastest speeds. The author interpreted this to mean that due to instructing drivers to
keep to the posted speed limit, slower speeds resulted in drivers facing greater distraction. The
results also showed that drivers drove slower and had most navigational errors using the paper
map, and thus they faced the highest workload (Ranney, 2008). However, the voice guidance
feature could add another layer of distraction to drivers, especially in a complex environment.
According to a survey in the Netherlands, 85% of drivers use both audio and visual
navigation facilities, 12% use only the display form of direction, and only 3% prefer voice
instructions alone. As mentioned previously, visual distracters weaken the driver’s attention more
than the audio distracters ("SWOV Fact sheet; Safety effects of navigation systems," 2010).
Summing up, an in-vehicle device can potentially distract drivers to a degree which is
influenced by the design of the device. Furthermore, applying visual-manual means of entering
destination information into navigation systems shows a more deleterious effect on driving
performance than voice input technology. Similarly, navigation systems that give instructions via
Page 36
Chapter2: Literature Review
Page 16
voice show less distraction and are more functional than visual displays, especially for a complex
map display (Young & Regan, 2007). However, the level of distraction still needs clarification. In
other words, what is called less distracting could still be dangerous for drivers.
In an instrumented vehicle study (Feenstra, Hogema & Vonk, 2008), a navigation system was
used for a task involving an unknown destination and in unfamiliar surroundings, and mental
workload was tested using a Peripheral Detection Task (PDT) and a questionnaire. Thirty-six
people were recruited. Participants’ ages were limited to 50 years old and they were required to
have at least five years driving experience with at least 10 thousand kilometres per year driving
and also six weeks experience in using navigation systems. They were allowed to choose a
navigation system or a map in the free condition. In the second condition, they used a
conventional method (map) to pass through a few waypoints. In the navigation condition, they
used a TomTom® navigation system without manipulating the device. The authors concluded
that the drivers’ workload decreased while using a navigation system in their driving tasks due to
reductions in subjective workload as well as objective workload (Feenstra et al., 2008). However,
they did not consider many other aspects of distraction in their study. For example, drivers may
change their navigation setting while driving, which may lead to the driver being faced with
greater distraction. More importantly, scanning behaviour of drivers was an important aspect in
this study, but it is not reported. Similarly, drivers’ errors in both conditions could have provided
more insight into driver distractions.
On the other hand, navigation systems may benefit road safety in many ways. First, they can
decrease exposure of navigation users to road networks. For example, in navigation systems, the
user can usually choose the fastest or the shortest route. The fastest route option can minimise the
amount of time users spend in traffic, and on the shortest route option he/she can choose to drive
the least number of kilometres. In either case, navigation systems lessen drivers’ exposure, which
has positive benefits for road safety. In a study by TNO (Vonk et al., 2007), instrumented
vehicles equipped with navigation systems were driven in an unfamiliar area. The results show
that navigation systems decreased 16% of travel distance and 18% of journey time. It was
speculated that this might be because less time was spent in a stationary state and motorway
routes were selected more frequently ("SWOV Fact sheet; Safety effects of navigation systems,"
2010). Secondly, a navigation system can ensure that the drivers do not search for the routes to
reach a destination. As a result, he/she could pay more attention to the surrounding traffic. It is
noted that about 60% of the participants used the system because it reduces driving effort. Based
on TNO’s study (Vonk et al., 2007), about 80% of drivers believed that a navigation system
helped them to have more control in their journeys and approximately 70% thought that it
reduced stress. Additionally, 60% of drivers believed that the navigation system assisted drivers
Page 37
Chapter2: Literature Review
Page 17
to keep their attention on the roadway ("SWOV Fact sheet; Safety effects of navigation systems,"
2010).
More importantly, TNO has also applied a navigation system in an instrumented vehicle with
36 drivers to investigate the drivers’ mental effort ("SWOV Fact sheet; Safety effects of
navigation systems," 2010). Based on both drivers’ self-reported and objective measurements,
drivers with a navigation system need less mental effort than their counterparts who did not use a
navigation system. However, most navigation users studied by Oei (2002) believed that
navigation systems could be dangerous if the system manipulated while driving ("SWOV Fact
sheet; Safety effects of navigation systems," 2010). Furthermore, it should be noted that out-of-
date navigation information leads to wrong or at least unsuitable routes. In another study, about
half of the respondents remembered when they updated their own map. However, nearly 60% of
them had not refreshed the map for two years due to expense (36%) or because it was too much
trouble (19%) ("SWOV Fact sheet; Safety effects of navigation systems," 2010). This issue could
be more problematic in places like south east Queensland that have frequent road network
changes as the population is growing rapidly.
2-4- Radio Tuning/CD players
Tuning the radio and changing CDs in-vehicles are nowadays as common as the driving task
itself. The development of in-vehicle audio systems has included radio, 8-track, cassette, CD, and
MP3 players. The vast majority of drivers use entertainment systems while driving. About 92%
of drivers were observed, in a naturalistic study, using audio devices while driving (Ranney,
2008). In the past, a few studies have investigated whether operating vehicle radios or other
entertainment systems (e.g., cassette, CD) make drivers distracted or not. It is believed that
secondary tasks of these systems generally pose acceptable levels of distraction. However, it has
been demonstrated that manipulating volume or even listening to a radio can distract drivers and
thus degrade driving performance while driving (Ranney, 2008). A previous study has also shown
that operating a CD player could be even more distracting than eating or dialling a mobile phone
while driving (Ranney, 2008). In another study, it was found that adjusting the radio/cassette/CD
was a contributing factor to about 11% of all crashes, in contrast with 1.7% for
talking/listening/dialling on a mobile phone (Chisholm, Caird & Lockhart, 2008). In particular,
operating a CD player has been shown to increase risk of crashes several times (Klauer et al.,
2006).
Page 38
Chapter2: Literature Review
Page 18
Young et al. (2003) believe that changing a CD and choosing a new track is likely to be
comparatively more distracting than simpler tasks, such as listening to music because of their
greater visual and physical demand on drivers.
Using the Crashworthiness Data System for 1995-1999, different sources of driver distraction
were categorised: outside person, object or event (29.4%); adjusting radio, cassette, CD (11.4%);
other occupant in-vehicle (10.9%); moving object in-vehicle (4.3%); other device/object brought
into vehicle (2.9%); adjusting vehicle/climate controls (2.8%); eating or drinking (1.7%); using or
dialling mobile phone (1.5%); smoking (0.9%); other distracting activities (25.6%); and unknown
distraction (8.6%) (Stutts, Reinfurt, Staplin & Rodgman, 2001). As can be seen, distraction due to
adjusting a radio/cassette or CD accounts for about 11.4% of all distracting in-vehicle tasks. This
is a relatively high figure and suggests that it is common to be distracted by this particular task.
Young drivers are more likely to engage in a distracting task like adjusting a radio/cassette or CD
(Stutts et al., 2001). Similarly, male drivers have greater rate of engaging in distraction activities
than their female counterparts (Stutts et al., 2001). Therefore, studying distraction caused by
adjusting a radio/cassette or CD needs more attention.
Young et al. (2003) reviewed one of the studies which demonstrate that operating a CD player
while driving is more distracting than dialling a mobile phone (Jenness, Lattanzio, O’Toole &
Taylor, 2002). The researchers studied how continuously operating a CD player affects drivers’
performance in a simulator study. Twenty-six participants were recruited to complete five driving
scenarios: having a cheeseburger while driving, reading directions, using a voice-activated system
to dial on a mobile phone, dialling manually on a mobile phone and continuously loading a CD,
choosing a track on CD, ejecting the CD and putting it back in its placeholder. In the study, speed
violations, lane-keeping errors, and road glances away time were measured. The results indicated
that participants had more lateral lane deviations and glances away times when operating the CD
player in comparison with the eating task or dialling numbers using a mobile phone.
However, preliminary evidence found that utilising voice-activation in using CD players
while driving could minimise the distraction. In a study by Gärtner, König and Wittig (2001),
driving performance was examined using manual and speech- activation approaches to operate a
radio, CD player, telephone and a navigation system. Sixteen participants were recruited to drive
a vehicle equipped with a radio, CD player, telephone, and navigation system. The vehicle also
provided a speech input system. Drivers performed 12 simple tasks, such as changing the radio
station and complex tasks, such as using the navigation system. The finding showed that using
the voice-input method helped drivers have less lane deviation and it forced drivers to drive more
slowly.
Page 39
Chapter2: Literature Review
Page 19
2-5- Eco-driving
In contrast to the large volume of research on distraction caused by mobile phones and some
other in-vehicle technologies, there is little research into the road safety impact of rapidly
booming eco-driving technologies. In a recent paper presented by Caird and Hallihan (2011), the
effect of a hybrid interface on driver distraction was investigated using the University of Calgary
Driving Simulator. It was found that the hybrid interface significantly lowered drivers’
acceleration. Participants also spent less time looking at the road when they were driving an
interface-equipped vehicle. The duration of eye glances to the hybrid interface was not more than
1.6 seconds.
Another prominent project on eco-driving is ‘Foot-LITE’. The project aims to develop an on-
board eco-driving system which will attempt to persuade drivers to drive greener and safer
through instant real-time advice on driving style and post driving feedback for longer-term
suggestions and information (Young et al., 2011). The in-vehicle system includes an on-board
diagnostic system that gives feedback on speed, gear use, acceleration, headway, and lane
position. Trip data is accessible through a web-based system for later data analysis. The system
can send feedback to the driver via coaching modules. The main aim of the system is to provide
advisory information to improve drivers’ safe and green driving style, which recognised as
‘smart’ driving (Young et al., 2011). However, distraction caused by the system is not reported.
In another project, GERICO, Barbé and Boy (2006) designed an on-board system to optimise
fuel consumption. They designed an eco-driving system which was able to give speed and gear
advice, and show a visual warning for a driver to alter his/her optimal speed, gear or both. It
shows fuel consumption relative to an optimal reference figure, and has a built-in navigation
system. The system also sends auditory messages to the driver to avoid visual overload. The
auditory messages in the system include navigation, advice, and an eco-driving warning. Similar
to the previous study, it appears that the authors did not investigate the distracting effects of their
eco-driving system in relation to all aspects of driver distraction.
Page 40
Chapter2: Literature Review
Page 20
Figure 1: Dashboard view of an eco-driving system extracted from Barbé and Boy (2006)
In another research study, two prototype systems were presented. One drew on principles of
Ecological Interface Design (EID) and the other on the conventional dashboard (Young, Birrell &
Stanton, 2009). In a subsequent study, Birrell and Young (2009) reviewed the two prototype
designs in terms of distraction and driver workload. Their results showed that real time smart
driving did not increase driver workload or adversely affect driver distraction. However, the
distraction effect did decrease driver mean speed. They concluded that in-vehicle Information
Systems do not increase drivers’ workload and thus, do not make them distracted, if appropriately
designed. Nevertheless, their study did not investigate current or other versions of eco-driving
systems and they did not mention how their systems may affect drivers’ subjective and objective
measurements during demanding manoeuvres.
2-6- Practice Effect
The practice effect has rarely been considered in previous distraction studies. One interesting
study by Shinar, Tractinsky and Compton (2005) investigated the effect of practice on a phone
call task while driving over five successive days. They believed that practice occurs with a
learning process for both the driving itself and the distraction task. In other words, not only does
practice lead to greater competence in the main driving task, practice also decreases the effects of
distraction on the task. They observed that over five sessions practice, performance of the driving
measures improved. In particular, a learning effect was observed on the mean and standard
deviations of lane position, steering angle, and speed (Cooper & Strayer, 2008). Shinar et al.
(2005) concluded that previous practice research was prone to overestimate real-world
Page 41
Chapter2: Literature Review
Page 21
impairment by not being able to repeat the driving condition, using abnormal phone
conversations, and using a required driving pace. However, in another study, Cooper and Strayer
(2008, p.893) stated that “practice is unlikely to eliminate the disruptive effects of concurrent cell
phone use on driving.” In their study, they asked sixty participants to drive 90 minutes in
simulated driving sessions on four consecutive days. They recruited two groups of participants,
participants with self-reported response of either high (41% of their trips) or low in-vehicle
mobile phone use (novice). In addition, participants carried out four days of simulator practice in
a city or on a highway and then drove in a new city or highway transfer network in order to assess
the extent and generalisability of any increase in practice effect. They found no evidence of
differences between the expert and novice mobile phone users. Both groups were impaired when
they were engaging in dual task conditions. In their study, they expected participants who could
predict the events would have better results with practice and that their impairment caused by
mobile use would diminish. They found that on the fourth day the number of collisions was
significantly lower than the number on the first day. However, there were still twice the numbers
of collision in comparison with the placebo condition. More interestingly, when they transferred
participants to a new driving scenario, the collision rate was not significantly different from the
first day of practice. In other words, practice does not appear to improve the ability to reduce
distraction while talking on a mobile phone. Collision rates reduced only because the scenario
was learned, not because of greater experience with using the mobile phone while driving.
However, Strayer et al. (2011) assert that practice makes driver performance better in some
instances. They agree with what Schneider and Shiffrin (1977) have previously stated: “A
necessary condition for improvement is a consistency in the environment that can be capitalized
upon with practice” (Strayer et al., 2011, p.49). The implication is that repeatedly using a mobile
phone will lead to performance improvement with practice and may diminish impairment of the
driving task over a period. However, it is important to remain mindful that reacting to unexpected
events is one vital aspect of the driving task, so that it is not realistic to expect all driving tasks to
become automatic (Strayer et al., 2011).
In one of the earliest studies of mobile phone use in vehicles, Brookhuis et al. (1991)
recruited 12 participants with no in-vehicle mobile phone experience to drive an instrumented
vehicle in real traffic conditions for about one hour per day for 15 days. In general, heart rate
variability as indicative of mental workload, and errors on the surrogate-dialling task, were
sensitive to practice. On the other hand, dual-task improvement was not detected on driving
variables (Cooper & Strayer, 2008). However, driver performance measures and driver errors
were not investigated, which is unfortunate as they are more robust measures of driver distraction
than heart rate.
Page 42
Chapter2: Literature Review
Page 22
In another simulator study, 19 participants completed experimental sessions in seven
successive weeks at the University of Calgary. While using an iPod, drivers were asked to engage
in a number of critical events, which included a pedestrian entering the roadway, a vehicle
pullout, and a lead vehicle braking. Hazard responses, variation in steering wheel angle, and eye
movement, were analysed. Chisholm et al. (2008) concluded that multi-interaction tasks, such as
performing complex iPod tasks, harm perceptions and responses of drivers to hazards and raise
the frequency of collisions. Although practice reduced the problem of slow responses to driving
hazards somewhat, the decrement remained high relative to the baseline condition. Therefore,
they suggest curtailing access to iPod tasks while driving. (Chisholm et al., 2008).
An important point to note is that task structure is the key determinant of skill learning and
multi-tasking performance. Two tasks with separated resource demands and steady stimulus
requirements lead to the least dual-task interference, while two tasks that fight for similar
resources and have contradictory stimulus response requirements normally cause the greatest
driver impairment (Cooper & Strayer, 2008). Therefore, the practice effect might have more
impact when two tasks have separated resource demands. This hypothesis needs to be
investigated in future.
2-7- Location of Distraction
Driving situations can differ in their demand on attention. In particular, drivers’ information
processing and attentional resources can be different in various manoeuvres. For example, a
driver may experience more resource demand when performing in-vehicle tasks than when he/she
is driving straight. In addition, some manoeuvres may need more visual processing than others
(Angell et al., 2007). Therefore, the location of distraction in relation to type of driver manoeuvre
can play an important role in the amount of distraction imposed on drivers. A few studies
explicitly considered the location of driver distraction.
In one study, the effects of car-phone contact on driving performance while approaching
signalised intersections was measured in relation to driver aggression (Liu & Ozguner, 2007). Six
aggressive and six non-aggressive drivers were recruited. During the sessions, which were
conducted both on-road and in the laboratory, the subjects were asked to drive through
intersections and brake with or without associated car-phone demand. Measurements included
task response time, correct response rate, driving performance, physiological responses, and
drivers’ compensatory behaviour. Analysis revealed a mean correct response rate of 90% for tests
in the laboratory; in on-road tests this decreased to 87.5% in city conditions and 75.8% at
intersections. The mean response time was 3.8 seconds for tests in the laboratory, 4.5 seconds in
Page 43
Chapter2: Literature Review
Page 23
city conditions, and 5.6 seconds at intersections. The study results verified that decision making
and car-phone communication together at signalised intersections increases accident risk, and the
distraction causes drivers to react later to red lights, and therefore, as compensatory behaviour
drivers commence braking harder.
In another study, forty-two drivers experienced responding to an in-vehicle phone, and at the
same time making a crucial stopping decision at a test track facility (Hancock, Lesch & Simmons,
2003). Each driver completed a task practice and then performed 24 blocks of trials. Half of them
were control conditions without the stoplight activation and the in-vehicle phone triggering. Four
trials required only a stoplight response, whilst the other four required only a phone response. The
last four trials required completion of both tasks simultaneously. The presentation order of trials
was randomised and the whole scenario was repeated. Therefore, there were 48 trials per driver.
Results demonstrated a slower response to light change in the dual-task condition and that as a
compensatory behaviour drivers braked more extremely. They also found that in the presence of
the phone distraction, non-response rate to the stoplight increased a critical 15%. The researchers
concluded that in-vehicle technologies endanger drivers’ safe performance margin and distract
them from vehicle control.
Most driving involves a level of attentional demand that is easy for drivers to meet without
much evidence of distraction; however, in some manoeuvres, such as overtaking, the attentional
needs are high. During overtaking, drivers must make a dangerous decision (Gray & Regan,
2005), so distraction may result in tragedy. Examining exacerbating factors, like distraction,
during high demand manoeuvres, such as overtaking, will help to improve the understanding of
the causes of such crashes, and in particular the influence of in-vehicle devices.
2-8- Individual Differences in Driver Distraction
Diverting attention away from the main tasks in driving is not the only factor that can
compromise the safety of drivers. Many other interaction factors can interfere or moderate the
outcomes, including driver factors such as age, gender, experience, state, and willingness to
engage in in-vehicle activities. Drivers’ abilities in relation to the main task could be affected by
all of these factors while conducting competing activities (Regan et al., 2009). There is a large
body of anecdotal evidence that the distracting effects of secondary activities can be influenced
by many individual factors, such as driver age, driving experience, and gender. These factors can
influence drivers’ willingness to engage in distracting activities, their ability of dividing attention
between main and secondary task(s), and their self-regulation in driving, in order to keep
appropriate safety margins after being distracted (Regan et al., 2009).
Page 44
Chapter2: Literature Review
Page 24
In this section, the effect of individual differences or driver characteristics, such as driver age,
driving experience, and gender on driver distraction has been reviewed briefly. Most previous
studies have been conducted on the effect of mobile phone use on driver distraction, more than
any other in-vehicle or out-of-vehicle distraction studies. Moreover, many of them have
investigated the effect of age as it relates to this issue. It seems that other types of distraction
sources and individual differences need to be considered in future research. In particular, there is
a need for more precisely designed studies to research the effects of driver experience and gender
on driver distraction. As explained in the following sections, these two characteristics (i.e., age
and gender) need consideration via experimental design in order to obtain reliable results relating
to the influence of individual differences.
2-8-1- Age Because of visual ability degradation and information processing capacity impairment, older
drivers are suspected to have a lower ability to maintain divided attention while driving.
Therefore, distraction could affect their car control abilities much more than their younger
counterparts (Regan et al., 2009). It should be noted that visual impairment in older drivers,
caused by cataracts, glaucoma and visual functions such as reduction in visual fields, motion
sensitivity, contrast sensitivity, and visual attention, have been shown to affect older individuals’
driving performance (Wood, Chaparro & Hickson, 2009), and this would be expected to affect
performance on concurrent tasks. For instance, a study by Wood et al. (2009) showed that there
was a significant interaction between visual impairment and distracting tasks in degrading driving
performance among participants, including 20 young (mean age 27 years old) and 19 older (mean
age 70 years old) participants with normal corrected vision. However, studies have shown that
visual attention allocation for experienced drivers (29–44 years old) is better than visual attention
allocation in novice drivers (18–24 years old) (McCartt et al., 2006).
Moreover, inexperienced young drivers often have less well developed driving skills to drive
with “minimal attentional resources” (Regan et al., 2009, p.348). Therefore, they may not have
”sufficient spare attentional capacity to devote to secondary activities” (Regan et al., 2009,
p.348). Young drivers are prone to more risk taking and have poorer judgment of risky behaviour.
Therefore, they engage in more risky behaviours and are also more vulnerable in risky conditions
(Regan et al., 2009). In general, willingness among teenage (16–17 years old) and younger (18–
24 years old) drivers to engage in the use of in-vehicle technologies is greater than middle age
(25–59 years old) or older (60 and older) drivers (McCartt et al., 2006). Age of drivers could
influence the tendency to engage in distracting activities. Research has shown that young drivers
Page 45
Chapter2: Literature Review
Page 25
(18-30 years old) engage in distracting activities more than their older counterparts (50-65 years
old) (Regan et al., 2009) and also rate the risk of distracting activities as lower than older drivers.
Figure-2 shows that the relative risks of in-vehicle distraction-related fatalities and injuries
rises from the age of 20–24 age group, though it decreases for the 40–49 age group before
increasing again. Apart from the drop in the 40-49 year age group, this study supports previous
findings “that the ability to share attention between tasks performed while driving tends to
decrease as age increases” and “age is an important factor in the development of mental capacity,
which allows an individual to have better cognitive functioning” (2002, p.417). The anomalous
figure for the 40-49 age group could be related to exposure. Drivers may drive less than their
younger counterparts, but be subject to an age effect which manifests itself increasingly from 50
years of age.
Figure 2: Relative risk of in-vehicle distraction fatalities and injuries extracted from Lam (2002)
2-8-2- Distraction Caused by Mobile Phone & Age A few US studies examined rates of handheld mobile phone use and driver characteristics.
According to these studies, although there is no gender discrepancy in the rate of drivers
distracted by handheld mobile phones, age plays an important role among mobile phone users. In
summary, drivers aged 60 years and older used mobile phones significantly less frequently than
younger drivers did. It is also estimated that the youngest drivers (16-24) use mobile phones ten
times more than their oldest counterparts (70 and older) (McCartt et al., 2006). In addition, in an
exploratory study in Australia by Lam (2002), the relationship between in- and out-of-vehicle
distractions and risk of traffic crash injury and fatalities among different age groups was
investigated. Using New South Wales (NSW) Australia police data, he noted, “In-vehicle
distractions, apart from handheld phone usage, affect drivers of nearly all ages, although to
different extents.” He added that age has a considerable influence on the relationship “between
in-vehicle distractions and the risk of crash injury” (Lam, 2002, p.417).
Page 46
Chapter2: Literature Review
Page 26
Most studies on distraction have been investigated involving mobile phone use while driving.
A large number of them have been conducted to study the effects of drivers’ age on distraction
(Regan et al., 2009). Therefore, there is a large gap in individual differences’ studies in terms of
the effect of drivers’ age on drivers’ distraction using various in- and out-of-vehicle systems.
Additionally, slightly more than one third of the simulator studies included just drivers 35 years
old or younger, and approximately a third included older drivers, 60 years old or older (McCartt
et al., 2006). These figures show almost uniform distribution of a number of studies among
different age groups on driver distraction, which makes it possible to investigate the effect of age
on distraction in different aspects of previous studies (Regan et al., 2009). Results of a few key
studies are presented below. Event detection is a popular task for examining the influence of
distraction on drivers. A few studies have been conducted on this topic. In a simulator study, it
was found that middle and older age drivers (46–80 years old) had more deficits in responding to
traffic signals when talking on a mobile phone than younger drivers (17– 45 years old). However,
in another simulator study, teenage drivers (16–18 years old) could detect fewer events on a
roadway while dialling a handheld phone than drivers aged 25–66 years. The author also reported
that teen drivers have a higher lane violation rate while using voice mails. In another study it was
reported that older (mean age = 57) drivers’ ability was impaired to detect front and peripheral
events when driving and using a voice recognition phone to dial. However, the younger and
middle-aged drivers (mean age = 23) showed no performance decrement while using the same
devices (Regan et al., 2009).
Hancock, Lesch and Simmons (2003) also found that age and gender factors could affect
distracted drivers when they a use mobile phone. In their test track study, they recruited 42
licensed drivers to test their response time in a crucial stopping decision making task using an in-
vehicle phone concurrently. They also investigated the effect of driver gender and age on the
response capacities. Their results showed that for the dual-task, drivers’ response time was slower
to light changes. Driver compensative behaviour for slower response was braking more intensely.
They reported “a critical 15% increase in non-response to the stop-light in the presence of the
phone distraction task” (Hancock et al., 2003, p.501). In the other words, stoplight violations
increased when the driver was using a mobile phone. They added that “these response patterns
varied by driver age and driver gender. In particular, age had a large effect on task components
that required speed of response to multiple, simultaneous demands” (Hancock et al., 2003, p.501).
As far as age-related distraction is concerned, it seems that more studies are needed to investigate
which aspects of older or younger drivers’ abilities are vulnerable. In other words, clinical
investigation is required to separate issues relevant to immaturity or inexperience in order to
apply them to driver distraction reduction.
Page 47
Chapter2: Literature Review
Page 27
One of the necessary driver safety measures is drivers’ reaction time. In a simulator study,
Warshawsky-Livne and Shinar (2002) investigated perception-reaction time and brake-movement
time for 72 subjects. They reported an increase in drivers’ reaction time when age increased.
However, age did not affect brake movement time (Warshawsky-Livne & Shinar, 2002). In
another study in 1999, they examined drivers’ brake response times in a critical driving
manoeuvre at a signalised intersection while drivers were using a mobile phone. Their results
demonstrated that mobile phone use could delay brake response time by about one-third of a
second for older drivers (55–65 years). However, it increased by approximately one-tenth of a
second for younger drivers (25–35 years). It is important to note that older drivers tended to brake
intensely to compensate for their poorer brake response (Lesch & Hancock, 2004). Similarly, in a
simulator study, it was found that phone use increased drivers’ reaction times in a braking event.
This response was significantly greater for older drivers (60 or older) than their younger
counterparts (below 60 years) (Regan et al., 2009). In another mobile phone distraction study,
Strayer and Drew (2004, p.640) used 20 older adults (70 years old) and 20 younger adults (20
years old) to examine the distraction effects of conversing using a hands-free mobile phone. They
also found driving reaction time decrease for both younger and older adults by mobile phone
conversations. Reaction times of drivers using mobile phones were 18% slower in comparison
with a single task condition. They found equivalent degrading results for both younger and older
adults and “Interestingly, the net effect of having younger drivers converse on a cell phone was to
make their average reactions equivalent to those of older drivers who were not using a cell
phone” (Strayer & Drew, 2004, p.640). To sum up, almost all studies have shown that driver
reaction time increases when participant age goes up.
In general, most of driver distraction studies have focused on driver performance. Thus, many
studies have considered age differences. A driving simulator study showed that driving
performance such as speed control and lane keeping, among older drivers (60–71 years old) was
more significantly affected than among drivers younger than 33 years old when they were
conversing on a mobile phone (Regan et al., 2009). In a simulator study, Horberry, Anderson,
Regan, Triggs and Brown (2006) examined the effects of operating the vehicle entertainment
system and conducted a simulated hands-free mobile phone conversation on driving performance
in three age groups, 10 young drivers (under 25 years old, mean= 21), 11 mid-age drivers ( 30–45
years old, mean= 37) and 10 older drivers (60–75 years old, mean=66 ) in both simple and
complex road environments (Horberry et al., 2006). In the study, two in-vehicle distractions
resulted in degradation of driving performance and worsen responses to hazards. Distractions also
caused an increase in drivers’ subjective workload. All age groups showed decrements in driver
performance after in-vehicle distraction. “One key difference was that older drivers travelled at
Page 48
Chapter2: Literature Review
Page 28
lower mean speeds in the complex highway environment compared with younger drivers”
(Horberry et al., 2006, p.185). Although drivers’ performance was more affected by
entertainment system distraction, “these degradations were relatively stable across different driver
age groups and different environmental complexities” (Horberry et al., 2006, p.185). In addition,
“it seem that older drivers were more responsive to severe hazards because they slowed to lower
minimum speeds, this is probably because their mean speeds were lower and so it is likely that
their speed when encountering these hazards was lower than that of younger drivers” (Horberry et
al., 2006, p.190). It is interesting to note that although older drivers changed their driving
behaviour while conversing on a mobile phone, their performance in comparison with the
younger drivers indicates, “they did not trade-off mobile phone performance to enable them to
drive safely. They slow down and give themselves an increased margin for error because they
know they cannot respond to hazards as quickly” (Horberry et al., 2006, p.190). A study by Reed
and Green (1999) showed that handheld mobile phones could degrade driving performance, and
older drivers were more negatively affected. In addition, age relationships were also noted by
McKnight and McKnight (1993) who found that driver performance was affected in a similar
way by both mobile phone use and radio tuning based on different age groups (Horberry et al.,
2006). However, older drivers would converse less with their mobile phone due to the awareness
of their vulnerability in driving.
Greenberg, et al. (2003) studied the effects of eight different in-vehicle tasks on driver
distraction in an advanced driving simulator with 48 adults (35- 66 years old) and 15 teenagers.
Their tasks were handheld and hands-free phone dialling, voicemail retrieval and incoming calls,
manual radio tuning, and climate control adjustment. Drivers were asked to move suddenly in
surrounding traffic. They found that the teens chose “unsafe following distances, have poor
vehicle control skills and to be more prone to distraction from handheld phone tasks” in
comparison with the adults (Greenberg et al., 2003, unpaged). They also measured the average
secondary task performances in duration and found a low of 8.5 seconds for the climate control
task to over 170 seconds for the voicemail retrieval handheld mobile phone task. As expected,
task durations tended to increase with higher ages, especially for the oldest age group. In
addition, in general the hands-free tasks demonstrated less variation than the handheld tasks when
age increased (Greenberg et al., 2003).
The effect of roadside advertisements on distraction has been reviewed in another study.
Authors stated that distraction caused by roadside advertisements might be exacerbated in older
drivers due to their impaired visual and cognitive abilities, and similarly in young novice drivers,
due to their driving experience and attentional capacity in the driving task; even effects of
distraction could degrade younger drivers’ performance more (Horberry et al., 2006).
Page 49
Chapter2: Literature Review
Page 29
There is an important issue related to previous studies, which have been conducted to evaluate
the association between age and distraction; the classification of younger, middle age and older
drivers varies significantly between different studies. It is difficult to draw a firm conclusion from
previous studies about the effect of age on drivers’ distraction. For instance, younger drivers have
been classified as 17 to 25 years, 16 to 18 years, and 18 to 22 years old while old driver ages
range from 46 to 80 years, 56 to 71 years, and 60 to 71 years (Regan et al., 2009). Thus, it is
difficult to compare results across studies with such different age groups.
It should be mentioned that learning effects may vary between different age group of
distracted drivers. In this regard, Shinar et al. (2005) found significant learning effects in using a
hands-free phone and its correlation with age groups. They noted “conversations on many driving
tasks were reduced or eliminated with continued practice, albeit at a faster rate for younger
drivers (ages 18–33) than for older drivers (ages 60–71)” (McCartt et al., 2006, p.94).
In summary, mobile phone related studies have attracted the most attention in distraction
research. Almost all of them show that many aspects of driving performance, such as reaction
time, speed control and lane keeping, degrade in older drivers more than their younger
counterparts. However, in event detection, in some cases older drivers acted better than their
younger participants did. “Younger drivers, due to their developing cognitive capacity, may find
it difficult to cope with distractions... This also applies to older drivers where their deteriorating
cognitive functioning… will further be jeopardized when being distracted” (Lam, 2002, p.417).
In addition, it is more likely for younger drivers to engage in secondary task activities. Therefore,
they are suspected to have more exposure on open roads and have a greater crash risk. However,
older drivers apply compensative behaviour, especially speed reduction, in order to keep their
margins of safety. In this regard, they demonstrated lower lane violation and better response to
hazards, for example. However, older drivers spend longer time on secondary tasks.
2-8-3- Relationship between Age and Driving Experience Typically, young drivers have less experience in driving and older drivers are mostly
experienced drivers. In other words, driver age and driving experience are highly correlated. In
most driver distraction studies, the effect of age was not separated from driver experience.
However, “discriminating between the effects of age and inexperience, particularly for younger
drivers” is difficult (Regan et al., 2009, p.343). It is important to note that some other factors may
confound the age and driving experience relationship, such as personality characteristics.
Personality characteristics may impact when drivers obtain their driving licence either early or
late (Regan et al., 2009).
Page 50
Chapter2: Literature Review
Page 30
Due to the correlation between age and experience, it is important that subjects be selected
based on their age and a measure of exposure (e.g., kilometre travelled per year). In this way,
researchers can distinguish whether a young driver is an experienced driver or not. Additionally,
a mature driver may not necessarily have enough experience to be called an experienced driver.
For example, many women may prefer not to drive at all when their husband can manage their
everyday needs. In general, it has been shown that female drive less than male drivers (Laapotti,
Keskinen & Rajalin, 2003). Thus, a middle aged woman may not necessarily be an experienced
driver.
2-8-4- Gender In comparison with age, gender differences in drivers’ distraction studies have rarely been
examined. In general, willingness among male drivers to engage in the use of in-vehicle
technologies is greater than among female drivers (McCartt et al., 2006). However, in some
studies it is reported that male drivers use mobile phones more often than their female
counterparts do, whereas others report the opposite. Thus, the relationship between gender and
driver exposure in in-vehicle distracting activities are quite mixed. This discrepancy could be due
to age differences between studies. Similarly, mixed results have been reported for effects of
gender differences on driving performance (Regan et al., 2009). Some studies have found that
distraction degrades female driver performance more, whereas others show that distraction could
worsen male driver performance more than that of female drivers. Discrepancies in the results can
also result from age differences among studies, because most of these studies used older
participants. In contrast, studies which have not reported gender differences have recruited
mainly younger people (Regan et al., 2009).
Hancock et al. (2003) found in their study that gender of the drivers affected red light
compliance. Interestingly, in this study, female drivers were more compliant in the non-
distracting experiments. However, when introducing a phone task as a distractive device, “female
drivers were disadvantaged to a greater extent than their male peers” (Hancock et al., 2003,
p.511). In another study, no considerable gender differences on reaction times were found when
drivers were conversing under the influence of a handheld mobile phone (McCartt et al., 2006).
Cooper and Zheng (2002) investigated drivers’ turning gap acceptance decision-making while
they were distracted in an instrumented car. They did not find a considerable gender impact.
However, they mentioned that other studies “have reported that males tend to accept shorter gaps
than females” (Cooper & Zheng, 2002). Warshawsky-Livne and Shinar (2002) believe that
gender did not show to have an influence on drivers’ perception-reaction time, but rather affected
brake-movement time.
Page 51
Chapter2: Literature Review
Page 31
Briem and Hedman (1995) studied driving performance when drivers used a hands-free and
handheld mobile phone. They recruited 20 subjects to form two groups, including subjects 19-26
years old (mean= 21) and 40-51 years old (mean= 45.5), such that five females and five males
participated in each group. Half the drivers drove on slippery roads and the other half on a normal
condition road in a simulator. They found that “the female subjects tended to perform less well
than male subjects while driving on a slippery road” (Briem & Hedman, 1995, p.2536). They
concluded that males controlled cars better in difficult conditions.
In one study, drivers’ awareness of their performance decrements was examined by different
age groups (Lesch & Hancock, 2004). In this study, drivers’ confidence in coping with distracters
was investigated and their mental demands were evaluated with their actual performance when
they were using a mobile phone. The results showed that while for male drivers, higher
confidence ratings correlated with better driving performance during distraction, for females, this
association did not hold; “in fact, for older females, as confidence increased, performance
decreased” (Lesch & Hancock, 2004, p.471). Additionally, women also estimated their driving
task as less demanding than men did. However, distraction influenced their performance more.
In the previously mentioned study by Lesch and Hancock (2004), although all performance
measures were influenced by age of the driver, braking response time and “stop light compliance”
were the only two items that were influenced by drivers’ gender (Lesch & Hancock, 2004, p.472).
Female drivers were delayed by a quarter of a second in brake response time in comparison with
one-tenth of a second for males, and obedience of red light was 25% for females versus 4% for
males (Lesch & Hancock, 2004).
One interesting question that arises is whether gender differences impact on coping with
distraction? It is likely that male drivers have more practice in driving than their female
counterparts. Therefore, they potentially gain better skills in multitasking through practising
more. This question should be investigated in future studies in order to distinguish gender
differences and driving experience differences.
2-8-5- Conclusion Mobile phone studies have attracted the most attention in studying individual differences in
distraction. Many aspects of driving performance, such as reaction time, event detection, speed
control, and lane keeping, degrade to a greater extent for older drivers than their younger
counterparts while using hands-free and handheld mobile phones. Unfortunately, there is no
consistency among research with regard to age effects on driver distraction. However, most
studies reported that older drivers apply compensative behaviour, especially speed reduction, in
Page 52
Chapter2: Literature Review
Page 32
order to keep their driving safe. In this regard, they demonstrated lower lane violation and better
response to hazards, for example, but spend longer time on secondary task performances.
In terms of effect of gender differences on distraction, it has been found that willingness
among male drivers to engage in the use of in-vehicle technologies is greater than for female
drivers. However, there are mixed results for mobile phone usage rate among male and female
drivers. Similar to age, this discrepancy could be due to age differences between studies. Further
studies, specifically designed to examine gender differences are required in order to understand
whether discrepancies between women and men are due to biological differences or because of
multitasking practice.
Last but not least, although age and gender have generally been considered in driver
distraction studies, other factors such as driving experience, driving record, and experience with
using a certain type of in-vehicle device are often neglected (McCartt et al., 2006).
In conclusion, there is some evidence of age and gender differences in driver distraction.
Therefore, these factors should be included in future distraction research.
2-9- Measures of Driver Distraction
2-9-1- Mental Workload Mental workload is a basic concept in every distraction study. It refers to a concept of mental
demand estimation. It is also relative and is defined as the ratio of demand to allocated resources
(de Waard, 1996). There are two modes of information processing: automatic versus controlled
processing. Mental workload has been linked to the ‘controlled mode’ of processing. “Automatic
processing is fast, not conscious, and rigid, requires almost no resources or attention, and can be
performed in parallel” (de Waard, 1996, p.16). Automation comes with frequent and consistent
practice. However, “Controlled processing is effortful, serial, conscious, and is flexible” (de
Waard, 1996, p.16). It requires application of information in working memory, and hence needs
attention. Information processing time in the controlled mode reflects level of mental effort. Also,
a task in which there is a higher mental demands leads to an increase in controlled processing
time (de Waard, 1996).
Michon (1985) proposed that driving tasks could be categorised by a minimum of three
hierarchical levels. At the top is the strategic level, such as the goal of a trip. At the mid level, the
manoeuvring level, driver behaviours in specific situations, such as reactions to other road users,
are important. In the control level, the lowest level, the actual processes of vehicle control occur,
such as lateral positioning. At this lowest level, the process of driving is automatic, whereas at
higher levels, driver behaviours are managed by a controlled processing mode (de Waard, 1996).
Page 53
Chapter2: Literature Review
Page 33
Therefore, the strategic and manoeuvring levels can affect distraction. Factors affecting workload
at these levels are presented in Table 1 below.
Table 1: Factors affecting workload extracted from (de Waard, 1996, p.20)
Driver State Affecting
Factors
Monotony
Fatigue
sedative drugs
Alcohol
Driver Trait Factors
Experience
Age
Strategy
Environmental Factors
road environment demands
traffic demands
vehicle ergonomics
Automation
Feedback
In Figure 3, the relationship between driver workload and driving performance is shown. In
deactivation region, D, effort required for driving or the primary-task is not yet started.
Performance in region A2 is optimal and a driver can easily tackle the task and display an
adequate level of performance. In the regions A1 and A3, performance of a driver is unaffected,
but to preserve an undisturbed level of performance, effort has to be exerted. In region B,
maintaining, the level of performance is no longer possible, so it declines. In region C,
performance is at a minimum level. In other words, the driver is overloaded (de Waard, 1996).
Figure 3: Relationship between workload and performance extracted from de Waard (1996, p.24)
2-9-2- Driver Distraction and Situational Awareness The primary variables which a driver must respond to in the driving task are environmental,
and include roadway, weather and vehicle variables. A driver chooses an action based on
Page 54
Chapter2: Literature Review
Page 34
information received from all these variables. In other words, decisions about slowing down,
overtaking another vehicle, braking, etc., are made by the driver using detected information about
these environmental variables. Situational Awareness (SA) effectively explains this construct (Ma
& Kaber, 2005). Ma and Kaber (2005) see the driving task as consisting of five stages:
information processing, perception, comprehension, projection, decision making and
implementing an action. The first three stages, perception, comprehension, and projection, are the
basis of situational awareness.
SA theory recognised three levels of SA. Level 1 SA is explained as “perception of elements
in the environment”, Level 2 SA as “comprehension of their meaning in relation to task goals”
and Level 3 SA as “projection of their status in the near future” (Ma & Kaber, 2005, p.941).
Ward (2000) and Matthews et al. (2001) previously classified three types of driving tasks (i.e.,
operational, tactical and strategic tasks) into levels of situational awareness (perception,
comprehension, and projection). Driving tasks at the operational level involve controlling the car
in stable conditions. This task has need of Level 1 SA in order to operate the car appropriately.
Level 2 SA can be activated if an error message is generated. However, the tactical level needs
both Level 1 and Level 2 SA. It also may need some projection (Level 3 SA) on the driving
environment. There is a high need for Level 3 SA and some elements of Level 2 SA, in order to
perceive and comprehend the driving task at the strategic level. A small amount of Level 1 SA is
needed because it is the foundation of two other levels of SA (Ma & Kaber, 2005). Figure 4
below shows the information processing of the driving task.
Figure 4: The information processing of driving task; situational awareness outlook extracted from Ma
and Kaber (2005, p.942)
Many previous studies have shown that many aspects of driving performance, such as lane
keeping, steering control, and speed degrade due to driver distraction. The question raised by the
Page 55
Chapter2: Literature Review
Page 35
SA model is how distraction affects information processing and situational awareness and, thus,
how it affects safe driving.
In a simulator study, Ma and Kaber (2005) found that driver operational actions (i.e., braking
and accelerating) depend mainly on perception and comprehension. They also found that visual
and cognitive distraction (a handheld mobile phone distraction) has a negative effect on the driver
triangle of situational awareness, i.e., perception, comprehension and projection.
Rogers, Zhang, Kaber, Liang and Gangakhedkar (2011) discussed another study, including
operational, tactical and strategic tasks, conducted by Jin and Kaber (2009). Rogers et al. (2011)
believe that tactical tasks depend on all three aspects of SA in driving task. However, strategic
tasks did not need to use any particular one of the three aspects of SA. They also proposed that
operational actions are mostly dependent on driver perception.
In another driving simulator experiment, Rogers et al. (2011) recruited 20 young drivers in
order to study effects of distraction on vehicle control at operational and tactical level caused by
listening to auditory instructions from a navigation system (cognitive distraction) or by using a
navigation system (visual distraction). Their experiment involved passing another car and a car
following task. They found that passing a car needs more SA than a car following manoeuvre.
They also observed a greater decrease in driver SA when they were distracted in passing another
car, which involved both the perception and comprehension parts of SA. They concluded “visual
distraction to affect all aspects of driver situation awareness. Cognitive distraction affected
comprehension and projection of roadway and vehicle states” (Rogers et al., 2011, p.186). They
also concluded that the decrement in SA that results from driver distraction is associated with
driver performance degradation.
2-9-3- Measures of Driving Distraction Around the world many consortia of researchers, government agencies, and automotive
manufacturers have focused on the measurement of distraction, including the European project
HASTE (Human machine interface And the Safety of Traffic in Europe), Driver Workload
Metrics (DWM), the Consortium of the Collision Avoidance Metrics Partnership (CAMP), and
the German Advanced Driver Attention Metrics (ADAM) program (Ranney, 2008).
Eight European partners and Canada have worked on the HASTE program. The goal of the
program was to build up methodologies and procedures for the assessment of In-Vehicle
Information Systems (IVIS). Many experiments were carried out across Europe and Canada. One
of the main finding of the study was that “the effects of cognitive distraction differ considerably
from those of visual distraction on driving performance” (Ranney, 2008, p.6). They reported
where the differences lay: “Secondary tasks that were mostly visual led to decrements in steering
Page 56
Chapter2: Literature Review
Page 36
and lateral vehicle control. In contrast, secondary tasks that were mostly cognitive led to
decrements in longitudinal vehicle control, particularly car-following” (Ranney, 2008, p.6). One
out-of-the-ordinary finding was that “when secondary task cognitive demands increased, drivers’
lateral control was found to improve. Analysis of drivers’ eye glance patterns revealed that when
cognitive demands increased, drivers increased their concentration on the road centre and
decreased looking at the periphery” (Ranney, 2008, p.6-7). Therefore, drivers can no longer
monitor their periphery under the load of a secondary cognitive task and therefore will not detect
hazardous conditions in surrounding area if they are not directly in the front of their vehicles.
This points to the importance of monitoring drivers’ eye glance patterns in order to understand
the attentional mechanisms in driver distraction (Ranney, 2008). The results could potentially be
used to predict driving performance once drivers are distracted.
In the CAMP project, the major conclusion was that the distraction caused by in-vehicle
secondary tasks is multidimensional and there in no single metric which is able to measure all
effects. Similar to the HASTE results, the CAMP researchers also found that visual-manual tasks
were different from auditory-vocal tasks in performance profiles. They also concluded that eye-
glance data are important in assessing the distraction effects of both visual-manual and auditory-
vocal tasks, and that cognitive distraction has a much smaller effect than visual distraction.
Finally, since their finding of performance degradation in the laboratory could not be confirmed
under real road driving conditions, they warned that laboratory conditions are not sufficient in
assessing the driver distraction caused by secondary tasks (Ranney, 2008).
Previous studies have shown that engagement in a range of compensatory behaviours is a
driver strategy to maintain safe driving at an adequate level. The compensatory or adaptive
behaviour can take place from the strategic level to the operational level. For example, many
older drivers prefer not to use a mobile phone when they are driving as their compensatory
behaviour in their strategic level (Young & Regan, 2007). On the other hand, at the operational
level, it has been found that drivers try to reduce their workload and moderate their exposure to
risk of interacting with in-vehicle devices through different means, such as: decreasing their
speed, increasing distance between their vehicle and the vehicle in front of them, balancing their
amount of attention between driving and non-driving tasks according to changes in the road
environment, and a temporary degrading in certain tasks, such as checking their mirrors less often
(Young & Regan, 2007). In the following section, performance-based measures of distraction and
degradation associated with distraction caused by in-vehicle devices are discussed in more detail.
This is important for this research thesis where measures will be needed to compare results of
different types of distraction.
Page 57
Chapter2: Literature Review
Page 37
2-9-3-1- Longitudinal Control Speed measures, such as mean, 85th percentile speed, minimum speed, maximum speed, and
the standard deviation of speed, have previously been used in many distraction studies (Regan et
al., 2009). Several simulator studies have shown that drivers have a tendency to reduce their
mean speed when undertaking secondary task activities. Engaging in a mobile phone task either
using handheld and hands-free mobile phones, for example, can cause drivers to decrease their
speed (Young & Regan, 2007). Other kinds of driver distraction can have the same driver speed
degradation. For example it was found that drivers reduced their speed when they entered
destination details into a navigation system (Young & Regan, 2007). Similarly, Horberry,
Anderson, Regan, Triggs and Brown (2006) have shown that mean speed decreased when drivers
interacted with an in-vehicle radio and CD-player.
Increasing one’s following distance is another compensatory behaviour that has been found
while drivers are interacting with in-vehicle devices. In a driving simulator study, Strayer, Drews
and Johnston (2003) found that talking on a hands-free mobile phone led to increasing following
distance. In another simulator study, Strayer and Drews (2004) also found a 12% increase in
drivers’ following distance while conversing on a hands-free mobile phone. Finally, in a driving
simulator study, Jamson, Westerman, Hockey and Carsten (2004) discovered that drivers chose
longer headways while applying speech-based email systems. However, Young and Regan
(2007) believe that in all three studies, increased headway in general was often not an adequate
means of avoiding collisions with other road users.
2-9-3-2- Lateral Control Lane keeping means ability of the driver to maintain position in the travelling lane and the
measure refers to the lateral position of a vehicle in the lane relative to the centre of the lane.
Changes in lateral position are applied as a measurement tool for secondary task load. Lateral
position metrics include mean lane position, standard deviation of lane position, and number of
lane exceedances. It has been shown that maintaining lateral position is adversely affected by the
performance of secondary tasks, mainly when the secondary task requires large amounts of visual
attention (Regan et al., 2009).
As noted above, entering an address into a navigation system has been shown to make drivers
have a greater number of lane deviations and exceedances compared with using vocal commands.
Interacting with a CD player can also degrade lane position control. There is also strong evidence
that moderate cognitive load leads to better lateral control, whereas visual load increases lane
keeping variation (Regan et al., 2009).
Page 58
Chapter2: Literature Review
Page 38
2-9-3-3- Steering Wheel Control Measures of steering wheel movement include standard deviation of steering wheel angle,
steering wheel reversal rate, steering wheel angle high-frequency component (HFC), steering
wheel action rate, and steering entropy. Steering wheel movements have been shown to be an
indicator of secondary task load. In driving without a secondary task, some small steering wheel
movements are expected to maintain lateral position. However, interacting with a secondary task,
in particular a visual-manual task, causes drivers to correct their steering more often (Regan et al.,
2009).
2-9-3-4- Event Detection Responding to objects and events came across the driving task is crucial for safe driving.
Unsuccessful response to unexpected objects and events is a contributing factor to crashes. One
of the applications of Objects and Events Detection (OED) is the assessment of driver distraction
(Regan et al., 2009). Various types of event detection measure have been used, such as number of
missed, correct and wrong responses. In this study an artificial event detection method was used,
Peripheral Detection Task (PDT), which is explained in detail in section 2-9-4-2. It has been
shown that drivers’ ability to detect external objects when they engage in secondary tasks can be
impaired. For instance, previous studies show that a handheld or hands-free mobile phone can
amplify drivers’ reaction times to events by up to 30% (Regan et al., 2009).
As another compensatory behaviour, it is found that when drivers interact with in-vehicle
devices, they change the amount of attention that they assign to the primary and secondary tasks
at any one time according to driving environment changes. For example, it was found more
attention, measured by duration of glance time, was given to the roadway and less to details of a
destination entering task when drivers were driving on a freeway rather than in the city, which
was attributed to heavier traffic and higher speeds associated with freeway driving (Young &
Regan, 2007). However, eye glance time alone cannot signal the changes in assigning attention
between primary and secondary tasks, since looking at something does not mean it is the subject
of cognitive attention.
2-9-4- Secondary Task Mental Measurement
2-9-4-1-Subjective Mental Workload Many methods and metrics can be used to evaluate the impact of secondary tasks on driving
performance. However, the nature of the underlying task and the characteristics of the method
itself determine the selection of measurement methods for driver distraction research. A
measurement technique is considered an appropriate method when it is valid, reliable and shows
Page 59
Chapter2: Literature Review
Page 39
sensitivity. The results obtained must also show external validity and generalisability, which
means it should be possible to generalise the result to the real-world (Regan et al., 2009).
In distraction studies, three groups of metrics for assessing mental workload have been used:
self-reports of mental workload, task performance measures, and physiological measures (Castro,
2009; de Waard, 1996; Rubio, Díaz, Martín & Puente, 2004). Due to advantages of subjective
measures (self-reports of mental workload) such as NASA-TLX (Task Load Index) in practice,
researchers recommend use of subjective workload rather than objective measures (Pauzié, 2009).
Use of subjective methods is an evaluative approach to mental workload, in contrast to measuring
and setting up relative comparisons. In addition, mental subjective evaluation should be
associated with objective measures (Pauzié, 2009) in order to gain a better sense of distraction by
secondary tasks.
Subjective workload is a self-reported measure in which participants rate their perceived level
of mental workload. Several subjective mental workload measures have been used in previous
studies such as the NASA Task Load Index (NASA TLX), the Subjective Workload Assessment
Technique (SWAT), the Modified Cooper Harper Scale (MCH), the Rating Scale Mental Effort
(RSME), and the Driving Activity Load Index (DALI). Subjective mental workloads measures
are low cost, easy and quick to do, and nonintrusive. However, Cao, Chintamani, Pandya and
Ellis (2009) believe that there are some disadvantages to these methods. Participants may forget
different aspects of their driving task. In addition, it cannot be determined if their reports are the
average of overall workload rating for whole tasks or if they are their peak performance ratings.
The NASA-TLX is a popular technique in subjective mental workload measurement (Cao et
al., 2009). It is also one of the most widely used tools for subjective workload assessment and “a
robust measure of subjective workload” (Noyes & Bruneau, 2007, p.514). In the NASA-TLX
method, it is assumed that mental demand, physical demand, temporal demand, performance,
frustration level, and effort, contribute to driver workload. This method is superior to other
methods because of its sensitivity (Pauzié, 2009). The first three subscales in NASA-TLX
describe the subject demands, whereas the others relate to the subject-task interaction (Cao et al.,
2009). Ratings and weights are two main parts of the NASA TLX. After the completion of a task,
ratings are taken for each of the six subscales. Subjects choose the response most relevant to
workload for them from a pair of choices, so weights can be computed. The weights vary from
zero to five. Finally, an overall workload score is obtained from a combination of the ratings and
weights (Cao et al., 2009).
Some other simplified NASA-TLX methods have since been developed. For example, Raw
Task Load Index (RTLX) is a method in which paired comparison weights are not required in this
method (de Waard, 1996). More recently, DALI (Driving Activity Load Index) has been
Page 60
Chapter2: Literature Review
Page 40
developed as a multidimensional workload measure to evaluate the level of workload related with
secondary tasks (Pauzie, 2008). In fact, it is an amended version of NASA-TLX. Factors making
up the mental workload score in DALI-TLX are adapted from the driving context. The six factors
in the DALI are effort of attention, visual demand, auditory demand, temporal demand,
interference, and situational stress. The DALI is probably the best method for studying driver
distraction as it is designed for in-vehicle distraction, while the NASA-TLX is designed and used
primarily by the aviation industry.
2-9-4-2- Peripheral Detection Task (PDT) While self-reported mental workload indices (such as NASA-TLX and DALI) measure driver
mental workload after a task is completed, it is vital to determine a recognised approach to the
evaluation of driver workload and distraction during the task. Jahn, Oehme, Krems, and Gelau
(Jahn, Oehme, Krems & Gelau, 2005, p.257) stated that for workload assessment, among
different methods, “those aiming at visual attention and overall workload are of special interest
for IVIS [In-Vehicle Information and communication System] assessment.” A secondary visual
task, the peripheral detection task (PDT), has been chosen to measure driver distraction in many
previous studies. This method is common for objectively assessing workload while driving, and
for evaluating distraction and workload caused by IVIS (Birrell & Young, 2009).
The Peripheral Detection Task (PDT), as a method for measuring driver workload, was
developed by van Winsum et al. in 1999 (Olsson & Burns, 2000). PDT was inspired by research
about “the effects of driving demand on peripheral vision and detection” conducted by Miura
(Regan et al., 2009, p.152). It is a secondary task measure, which was designed to assist in
evaluating advanced driver assistance systems (ADAS), and has been successfully used in field
conditions (Patten, 2007). “The key idea behind the PDT is to exploit this apparent narrowing of
the visual field to obtain a method that is sensitive to workload but has a minor impact on the
other tasks” (Regan et al., 2009, p.152). Therefore, when driving mental workload increases,
drivers will decrease glance time in the periphery of their vision, including the periphery of their
forward vision and scanning of vehicles’ instruments, like mirrors (Birrell & Young, 2009). In
this method, drivers respond to random targets in their peripheral view. Distracted drivers
respond more slowly and miss more event targets. The PDT is a very sensitive measure of driver
workload, “The more demanding the task, the more cues will be missed and the longer the
response times to the Peripheral Detection Task” (Martens & Van Winsum, 2000, p.1).
Not only is PDT a reliable measure for assessing driver workload, particularly for simulator
testing (Young et al., 2009), but it is also a promising tool for measuring mental workload and
visual distraction in a real car (Olsson & Burns, 2000). It is important to note that PDT is a
Page 61
Chapter2: Literature Review
Page 41
method for indirect cognitive workload measurement rather than a visual measure (Patten, 2007).
PDT also has several advantages. First, it is “less resource demanding and less obstructive than
most known secondary tasks” (Jahn et al., 2005 p.257). It can be easily utilised in driving
scenarios. It can also be conducted with simple and inexpensive equipment, and data analysis is
straightforward (Jahn et al., 2005). However, it is an artificial method that may increase driver
workload by itself. It also attracts drivers’ attention to respond to PDT, and therefore drivers may
try to focus on responding to the task instead of completion of the primary and secondary tasks.
2-9-5- Choosing Driving Performance Measures Regan (2009) believes that no single measure can capture all aspects of driver distraction. In
other words, “driver distraction is a multidimensional construct” (Regan et al., 2009, P.98). He
also think that “the decision regarding which set of measures to use should be guided by the
specific research question under examination” (Regan et al., 2009, P.98).
It is essential in driver distraction study to choose performance measures appropriate to the
research question. As previously mentioned, it has been shown that visual distraction affects
driving performance measures differently than cognitive distraction. Particularly, visual
distraction affects lateral control measures to a greater degree, whereas cognitive distraction has
shown greater effects on visual scanning behaviour rather than visual distraction (Regan et al.,
2009). It is also shown that Object and Event Detection (OED) measures can be used to assess
auditory-vocal tasks. However, lateral and longitudinal measures cannot discriminate between
lower and higher auditory-vocal workload and driving without secondary driving tasks. Selected
lateral and longitudinal control measures can be used to discriminate between visual-manual tasks
in both simulator and real road conditions (Angell et al., 2007). Regan et al. suggested that all we
“can do is use a range of driving measures that are valid, reliable, and sensitive to the type of
distraction being evaluated” (Regan et al., 2009, p.98).
As Young and Regan (2007) state, we should keep in mind that drivers are able to adapt their
driving behaviour when engaging in non-driving tasks. However, these adaptive behaviours can
significantly degrade driving performance. The potential for a secondary task to distract a driver
is also decided by the composite interaction of different factors, including task complexity,
driving demands, driver experience, and the willingness of engagement in the secondary task. A
secondary task may distract drivers and degrade their driving in one situation, whereas it may not
distract them in another situation. In addition, secondary tasks may change driver behaviour
differently when participants are chosen from different populations of driver.
Page 62
Chapter2: Literature Review
Page 42
2-9-6- Reference Tasks A reference task is a benchmark task, which defines the highest point of secondary task
demand that is considered as an acceptable level to cope with (Regan et al., 2009). Driving
performance in a reference task is usually compared with its counterpart when engaging with a
secondary task. One approach to defining a reference task is to presume that it has no secondary
task. However, some researchers have proposed manual radio turning as a reference task for
investigating mobile phone distraction effect. Another good example is a navigation system.
Some researchers accept a paper map as a baseline task and others think that the best baseline
task is simply not having a task (Regan et al., 2009). However, using a baseline that could be
distracting raises questions about the robustness of the results.
Regan et al. (2009) believe that there is no agreed “best” reference task across the world. It
might depend on the type of in-vehicle system and the type of distraction. Ideally, a reference
task should be clearly defined, repeatable across all scenarios, and be subject to the same sort of
distraction as the other task under study. In this thesis it was decided that the baseline task should
be a scenario without any distraction.
2-10- Application of Cognitive and Behavioural Models in Driver Distraction
2-10-1- Introduction A useful tool, which may be applied to assist better understanding of driver distraction, is
modelling. However, “From a general standpoint, generating driver models can be seen as
equivalent to developing a comprehensive description of scientific knowledge about drivers”
(Cacciabue, 2007, p.27). Driving is an everyday activity. However, it is a complex task because it
involves human cognition. Cognitive models explain the mental activities of drivers and
investigate methods to understand drivers’ behaviour (Keith et al., 2005). Researchers divide
these models into conceptual and computational (see Table 2). Conceptual models help our
understanding of “the representational and procedural components of the driving task” and
computational models “compute, simulate, and predict various aspects of driver behaviour”
(Salvucci, 2006, p.362). Computational models are useful tools to both study the theory of driver
behaviour (e.g., to study the perception-action aspects of steering) and develop real-world driver
assistant systems (e.g., lane keeping system) (Salvucci, 2006). In addition, these models are
microscopic traffic models which have been used to investigate human-centred design and
analysis (Keith et al., 2005). “Driver modelling” consists of different activities of the driving task
and various kinds of modelling. A distinction should be made between behavioural and cognitive
models. “Behavioural models focus on the driving performance, while cognitive models focus on
the cognitive processes underlying the performance” (Mathern, Bellet & Mille, 2010, p.86).
Page 63
Chapter2: Literature Review
Page 43
The model most relevant to this research is Multiple Resource Model Theory, which is
designed to study distraction and differentiate different types of driver mental and physical
demand. However, other models such as the Driver Behaviour Model can assist in understanding
driver decision making processes in the context of driver distraction. In the following section, the
application of driver behaviour and cognitive models to driver distraction is discussed in order to
provide a better explanation and conceptualisation of this issue.
2-10-2- Driver Behaviour Model In Figure 5 the driver behaviour model which has been developed by TNO is shown. This
model guides human factors researchers on the qualitative descriptions of driver behaviour and
focuses on driver behavioural measures, such as performance (speed, headway, time to collision,
steering angle and frequency, lateral placement, detection time, reaction time), visual attention
(viewing time, number of glances) and workload (peripheral detection task, subjective ratings,
physiological measures). The Driver Behaviour Model is a conceptual model, which can be used
for drivers’ performance assessment (Keith et al., 2005). The Driver Behaviour Model evaluates
driver behaviour, performance, and workload. It provides an input of traffic flow model, such as
the MIXIC driver model and the human-kinetic traffic flow model (Cacciabue, 2007).This Driver
Behaviour Model focuses on units and it is based on an individual driver and an individual
vehicle (Cacciabue, 2007).
Figure 5: Driver behaviour model used by TNO (Keith et al., 2005, p.19)
According to this model, drivers’ attitude, subjective norm, and perceived behavioural control
determine drivers’ intention of travelling, which influences all drivers, behaviour components,
such as perception, information processing, decision making, and handling. One of the positive
points of this model in comparison to previous models is the ability to measure drivers’ workload.
Attitude
Cognitive
Belief
Emotion
Intention
Perception Information
processing
Decision
making
Handling
Vehicle
speed,
heading, etc.
Traffic
engineering
Road
environment
Subjective
norm
Perceived
behavioural
control
Driver
Page 64
Chapter2: Literature Review
Page 44
In addition, it can be matched with peripheral detection tasks, which is a useful method to
estimate level of driver distraction. The model is able to predict driver performance after being
distracted. However, it does not differentiate between various resources which lead to distraction.
This model has incorporated the theory of planned behaviour, developed by Ajzen (1991),
and widely used in driver behaviour research (see Figure 6).
Figure 6: The theory of planned behaviour (Ajzen, 1991, p.182)
2-10-3- The Multiple Resource Model Theory The Multiple Resource Model Theory (MRT) addresses issues related to the divided attention
limitation of drivers (in our field of study) when they are engaging in multitasking while driving
(see Figure 7) (Regan et al., 2009). The MRT explains drivers’ multiple task performance based
on theory. This model is useful for either practical or theoretical implications. In the practical
implications, this model can predict human performance ability in driving in high workload
multi-tasking condition environments. This model is also able to predict interference between two
concurrent tasks. MRT considers neuro-physiological mechanisms and can explain different
theories in human information processing (Wickens, 2002). Wickens (2002) believe that
relationship between the multiple resources and the mental workload should be evidence based;
“mental workload describes the relation between the (quantitative) demand for resources imposed
by a task and the ability to supply those resources by the operator” (Wickens, 2002, p161). MRT
is also able to explain driver performance in the overload situation, where a person performs two
or more concurrent tasks (Wickens, 2002).
In MRT, task demand level and the overlap level of the tasks for common resources can
predict the degree to which time sharing between tasks is in a critical condition (Regan et al.,
2009). The MRT has four “categorical and dichotomous dimensions that account for variance in
time-sharing performance” (Wickens, 2002, p.163). The multiple dimensions in this model are
the processing stage, the processing code, the perceptual modality, and the visual channel. Every
demanding resource can be placed along multiple dimensions. The Processing stage consists of
perceptual-cognitive versus action, the processing code consists of verbal versus spatial, the
perceptual modality consists of auditory versus visual, and the visual channel consists of focal
Attitude
Subjective norm
Perceived
behavioural control
Intention Behaviour
Page 65
Chapter2: Literature Review
Page 45
versus ambient. Since driving (both hazard monitoring and lane keeping) is primarily a visual-
spatial-motor task, it is predicted (and observed) to be efficiently time shared with tasks that are
auditory and language based (both in perception, i.e., hearing, and in action, i.e., speaking)
(Regan et al., 2009). “Furthermore, because ambient and focal vision use separate resources, lane
keeping and hazard monitoring can be well time shared, as long as the latter has foveal vision
available” (Regan et al., 2009, p.65). A short description of every dimension of the model is
presented as follows:
- Stages processing
The resources for perceptual, cognitive (e.g., involving working memory) activities are the
same, and are separated from the selection and execution of responses (Wickens, 2002)
- Perceptual modalities
Apparently, dividing attention between an auditory channel and a visual channel can be less
distracting than if they both are auditory channels or both visual channels. Thus, it seems that
“cross-modal time-sharing is better than intra-modal time-sharing” (Wickens, 2002, p.164).
- Visual channels
In addition to dividing attention between auditory and visual modalities, focal and ambient
vision use separate resources in time-sharing. “Focal vision...is required for fine detail and pattern
recognition (e.g., reading text, identifying small objects)” (Wickens, 2002, p.165). However,
”ambient vision heavily (but not exclusively) involves peripheral vision, and is used for sensing
orientation and ego motion (the direction and speed with which one moves through the
environment)” (Wickens, 2002, p.165).
- Processing codes
The processing code dimension differentiates between spatial and verbal processes. Previous
studies on multiple tasks show that spatial (tracking, steering, joystick or mouse movement) and
verbal (speaking) processes “functioning in perception, working memory or response, depend on
separate resources” (Wickens, 2002, p.166).
The MRT can be used to predict driver performance while doing two tasks at the same time.
The model is used to predict the level of interference between two time-shared tasks (Wickens,
2002). For instance, in many circumstances, in the case of using the eyes (visual processing) and
the ears (auditory processing), dual task performance is poorer if two visual tasks share time than
if the same information is presented via the audio channel for one of the tasks instead of the
visual channel. A driver will perform better at driving while listening to instructions than when
Page 66
Chapter2: Literature Review
Page 46
reading the same instructions (Wickens, 2002). “Thus, to the extent that two tasks use different
levels along each of the three dimensions, timesharing will be better” (Wickens, 2008, p.450).
Figure 7: The 4-D dimensional resource model (Wickens, 2008, p.450)
As an example to clarify this model, driving while conversing on a mobile phone as a
concurrent task has been considered a dangerous activity. According to this model, because
drivers use the visual module for looking at a mobile phone (as a secondary task) and road (as a
main task), the result could adversely affect driving ability. However, if drivers use voice to
answer the phone, the level of distraction caused by a mobile phone could be lower. The
distraction is mainly because of using two different modules (visual and auditory). It seems that
this model can explain many aspects of driver distraction in detail and can predict different levels
of driver distraction. Although it cannot consider upper level factors such as strategic behaviour,
which may affect driver behaviour, it can also arguably predict driver control behaviour better
than other models. This is beyond the scope of the current research; however, the Multiple
Resource Model will be used to assist with discussion of the results.
2-10-4- Summary and Conclusion This section reviewed two models relevant to driver distraction studies. The Driver Behaviour
model has a more psychological approach to evaluation of distraction level. It uses drivers’
attitude, subjective norm, and perceived behavioural control to determine drivers’ intention of
travelling, which influences all drivers’ behaviour components, such as perception, information
processing, decision-making, and handling. One of the positive points of this model in
comparison with previous models is the ability to measure drivers’ workload. In addition, it can
be matched with a peripheral detection task, which is a useful method to estimate level of driver
Page 67
Chapter2: Literature Review
Page 47
distraction. The model is able to predict driver performance after being distracted. However, it
does not differentiate between various resources which lead to distraction. The most relevant
model to the study of distraction appears to be the Multiple Resource Model. It can be used to
predict driver performance while doing two tasks at the same time. It can also differentiate among
different types of task relevant to driver distraction (i.e., cognitive, manual, visual, auditory,
verbal and spatial). Further endeavours are required to integrate these models in order to develop
comprehensive models to use in driver distraction studies.
2-11- Research Questions
As presented in the literature review, in contrast to the large volume of research on distraction
caused by mobile phones and some other in-vehicle technologies, there is little research into the
road safety impact of rapidly booming eco-driving technologies. Therefore, the study is designed
to examine the effects of an eco-driving system on driver distraction. The study is not intended to
investigate all types of eco-driving systems and since there were limitations in budget and timing,
a simulation of an eco-driving text message has been chosen for the study. Given that the main
aim of the study is to investigate distraction with a Human Machine Interface (HMI) point of
view, the study aims to investigate driver performance when they interact with a text message
reading task.
In addition, the practice effect has an important role in distraction studies. A study by Shinar,
Tractinsky and Compton (2005) found that practice occurs with a learning process for both the
driving itself and the distraction task. Therefore, due to the importance of the practice effect in in-
vehicle distraction studies, it is included for investigation in the study.
As becomes evident from the literature review, driving situations can differ in their demand
on attention. In particular, drivers’ information processing and attentional resources can be
different in various manoeuvres (Angell et al., 2007). Most driving involves a level of attentional
demand that is easy for drivers to meet without much evidence of distraction; however, in some
manoeuvres, such as overtaking, the attentional needs are high. During overtaking, drivers must
make a dangerous decision (Gray & Regan, 2005), so distraction may result in tragedy.
Examining exacerbating factors, like distraction, during high demand manoeuvres, such as
overtaking, will help to improve the understanding of the causes of such crashes, and in particular
the influence of in-vehicle devices. Therefore, five different manoeuvres (driving straight, lane
changing, overtaking, braking for an intersection and braking for a roundabout) have been chosen
to review distraction of three in-vehicle system, eco-driving systems (an eco-driving system, CD
changing, and a navigation system).
Page 68
Chapter2: Literature Review
Page 48
As outlined in the literature review, many aspects of driving performance, such as reaction
time, event detection, speed control, and lane keeping, degrade to a greater extent for older
drivers than their younger counterparts while using hands-free and handheld mobile phones. Most
studies reported that older drivers apply compensation behaviour, especially speed reduction, in
order to keep their driving safe. In this regard, they demonstrated lower lane violation and better
response to hazards, for example, but spent longer on secondary task performance. Additionally,
in terms of effect of gender differences on distraction, it has been found that willingness among
male drivers to engage in the use of in-vehicle technologies is greater than for female drivers.
However, there are mixed results for mobile phone usage rate among male and female drivers.
Although age and gender have generally been considered in driver distraction studies, other
factors such as driving experience, driving record, and experience with using a certain type of in-
vehicle device are often neglected (McCartt et al., 2006). In this study, gender differences as well
as age differences were considered as an exploratory analysis. Driver experience in using in-
vehicle devices and their kilometres travelled figure were also taken into account.
The experiment was designed to answer the study’s questions. This research was intended to
examine distraction effects of an eco-driving system on drivers’ workload and performance. To
achieve this goal, the level of distraction caused by two other in-vehicle tasks (changing CDs in a
CD player and entering a five digit number in a PDA) was compared with the distraction due to
reading an eco-driving message. A “no distraction” (Baseline) condition was also included in the
study in order to compare distraction measures of the three in-vehicle tasks with this condition.
The CD changing task was chosen as it might be common among drivers to change their CDs
while driving. Entering a five digit number was also used in the study because of the complexity
of this task which is similar to the use of a navigation system. Both of these are common tasks
with demands that are known to many drivers, and therefore provide a readily understandable
comparison for an eco-driving task. In developing the eco-driving task efforts were made to
ensure that it was not too complex and that it took up about the same time as the other tasks. The
following questions were the focus of the research:
1- Does the use of an eco-driving system distract drivers in a driving simulator more than two
other in-vehicle activities (changing CDs and entering a number in a PDA)?
2- Is there a practice effect which reduces the level of distraction under the study
circumstances?
3- Do the systems have an effect on driver performance when drivers are engaged in particular
manoeuvres?
4- Are there any differences between young (novice) and middle aged (experienced) drivers, or
between male and female drivers, when they get distracted?
Page 69
Chapter2: Literature Review
Page 49
2-12- Scope of Research
The research utilises tasks analogous to those required for some eco-driving and navigation
systems as well as a CD changing task. Analogous systems have been used instead of actual
systems because of cost, feasibility and time constraints of the study. In addition, using an actual
eco-driving system was not practical due to licence issues and availability of product information.
The CARRS-Q advanced driver simulator has been used in the study rather than on-road tests,
due to cost, ethical and logistical constraints.
Page 70
Page 50
Chapter 3 - Methodology and Research Design
Page 71
Chapter3: Methodology and Research Design
Page 51
3-1- Introduction
In this chapter, the designed process of the study is explained and then the stages of research
implementation and the methodology are presented in detail. As presented in Chapter 2, in
contrast to the large volume of research on distraction caused by mobile phones and some other
in-vehicle technologies, there is little research into distraction effect of eco-driving technologies.
Therefore, the study is designed to examine the effects of an eco-driving system on driver
distraction. In addition, effects of other factors, such as the practice effect, driving situations
(manoeuvres), and individual differences, are taken into consideration. Driver experience in using
in-vehicle devices and their kilometres travelled figure were also examined as influential factors.
To achieve this goal, the level of distraction caused by two other in-vehicle tasks, including
changing CDs in a CD player and entering a five digit number in a PDA, was compared with the
distraction due to reading an eco-driving message. It is important to note that these in-vehicle
tasks are not exact duplications of real world tasks. For example, entering a five digit number into
a navigation system is a simple navigation manipulation task. In real on-road conditions, entering
an address into the system may require much more time. Similarly, the eco-driving task is a
simple reading eco-driving message task rather than a real fuel estimation, driver behaviour
analysis and choosing the best eco-driving advice. The current study has investigated one type of
eco-driving system. Other systems may be different in many aspects, such as the eco-driving
message algorithm, spatial location in the vehicle, and so on. Therefore, the study focus was on
Human Machine Interface (HMI) tasks with demands analogous to some eco-driving, navigation
systems, and CD changing tasks.
Two other common in-vehicle activities are used to compare level of distraction induced by
them to that of the eco-driving system. However, they are not exactly the same in terms of their
demands. An eco-driving message is a cognitive/visual distracter, whereas CD changing is a
manual/visual/auditory distracter, and navigation is a manual/visual/cognitive task. The main
reason for choosing these three in-vehicle systems is that they all need almost same amount of
time to perform the task in a stationary condition. The second reason for choosing the CD
changing and navigation tasks was that they are common in-vehicle tasks, but they have not
attracted as much attention as they should. There were also time and budget constraints in the
study that led to choosing tasks that were possible to develop and test.
When a driver manipulates a CD player, he/she looks at the CD player for a few seconds and
thinks about tuning and choosing a song, for example. When drivers apply eco-driving, smart
driving feedback is presented via messages, and drivers may look at the gauge and think about
their driving behaviours. Both seem to be simple devices, but slightly different in use of visual/
Page 72
Chapter3: Methodology and Research Design
Page 52
cognitive/manual effort while manipulating them. Furthermore, distraction by a PDA was
investigated, since it seemed likely that PDA navigation systems would cause more visual/
cognitive/manual demand. In addition, in recent years, usage of PDAs as navigation systems has
become common, but there is no research on these devices. Therefore, a manipulation of a PDA
navigation system was included in our experimental design. PDA navigation is likely to be more
distracting than manipulating a CD player, and they are different in terms of pattern of use, such
as frequency, location, keys, etc.
3-2- Design of Research
Information from the literature review was applied to the design of the research methodology
to be able to evaluate distraction caused by three in-vehicle systems. The program of research
implemented in several stages. After completing the literature review and the designing research
questions, a network was created in a fixed based driver simulator in a lab environment. All signs,
terrains, and scenarios were designed, created, and tested many times, and necessary changes
were made. A core communication system between the PDA application, driving simulator
software (SCANeR®ΙΙ), and synchronisation software (RTmaps) was implemented by a software
engineer and developed by the candidate to suit to the study requirements. Establishment of the
project, with the design of the simulation, programming, and synchronisation, was a complex
project in itself and involved several people in addition to the candidate. Issues with the simulator
software and RTmaps resulted in a lot of effort and time extended. In particular, a new version of
simulator software caused many technical issues both in the lab and in the advanced simulator
room. The methodology of the study was tested several times with volunteer participants in a
pilot study, after transferring all apparatus to the advanced driving simulator.
3-2-1- Network Creation for the Proposed Research A copy of a road network in a mixed urban/semi-rural area was created using the terrain
creation module of SCANeR®ΙΙ software. This section of road network selected because it has
number of roundabouts, intersections and enough straight section of road to implement the study.
The original road network is in the northern suburbs of the greater metropolitan area of Brisbane.
The figure below, extracted using Google Map, shows the network and surrounding area.
Page 73
Chapter3: Methodology and Research Design
Page 53
Figure 8: The network of simulated road in driving simulator
The next step was to simplify the network according to the characteristics of terrain creation
software in SCANeR®ΙΙ and the goal of the study. In practice, the network had to be simplified
due to software issues which arose while creating it. All elevation was assumed to be the same in
different sections of the road.
Participants were asked to start driving from Beams Road next to Ridley Road (point A in
Figure 8), and after turning left onto Gympie Road, they turned right into Hoyland Street and
continued through Bracken Street to Deagon Street and then Southerden Street. The network
continued to Board Street and Depot Road and then finally participants went through Telegraph
Road and stopped at a stop sign which was installed just before a railway crossing. The length of
the route was nearly 15 kilometres and it took around 14 minutes to complete each trial drive for
scenarios and familiarisation sessions. Speed zones ranged between 60 km/h and 100 km/h along
the real route, but the speed zones for the simulation were set at 80 km/h.
Figure 9 below shows the network created with the terrain creation facility of SCANeR®ΙΙ.
The first aim was to duplicate the actual surrounding area (buildings, trees, etc) in the simulated
network using 3D Max. However, because of the high cost of the programming required and its
extremely time consuming nature, the network environment was created using sample galleries of
buildings and other features in SCANeR. Due to the resulting simplicity of the created
environment, it can be categorised as a low mental demand network. It should be stressed that
Page 74
Chapter3: Methodology and Research Design
Page 54
road environment may increase mental workload of drivers, in particular if older drivers are
involved (Horberry et al., 2006).
A few signs were also designed to instruct drivers to commence their manoeuvres in
predefined locations.
Figure 9: SCANeR software and created network of the study
A low traffic environment condition was utilised. In lane changing manoeuvres a truck was
parked ahead in a position such that participants were required to change lanes. The speed of
overtaken passenger cars was set to 50 kilometres per hours in order to make sure that
overtaking manoeuvres could take place at predesignated locations. Vehicles were set to
circulate in each of the roundabouts to force participants to give way and decelerate before
entering the roundabouts.
3-2-2-Dependent and Independent variables
As noted earlier, no single measure can capture all aspects of driver distraction, therefore
several measures were employed. These measures (dependent variables) can be summarised as
follows:
• Longitudinal Control Measures (Speed measures)
• Lateral Control Measures (Lateral position metrics)
Page 75
Chapter3: Methodology and Research Design
Page 55
• Steering Wheel Control Measures
• Objects and Events Detection (OED) (Peripheral Detection Task)
• Subjective Mental Workload (Driving Activity Load Index/ DALI)
It would have been desirable to capture eye glance data as well, but this was not possible for
technical reasons. Minimum speed has been used as the longitudinal measure. Since drivers were
asked to keep to the speed limit of 80 kilometres per hour, which would have established a
threshold effect on maximum speed, it was expected to observe a decrease in speed of drivers
when they interacted with the in-vehicle systems with more distracting tasks being expected to
result in a more marked decrease in speed. However, in most cases, no differences were found in
minimum speeds between different scenarios and locations.
Both lane position shift and standard deviation of lane position shift have been analysed in the
study. Similarly, both steering wheel angle and standard deviation of steering wheel angle were
used as other measures of distraction.
To measure mental workload across a whole scenario, the Driving Activity Load Index
(DALI) was used. In addition, the Peripheral Detection Task (PDT) was used as a measure of
Object and Event Detection (OED) in order to investigate driver mental workload in different
locations for any of the manoeuvres.
These choices are consistent with the identification in the literature review of the most
appropriate and sensitive measures of driver distraction:
• Visual secondary tasks lead to decrements in steering and lateral vehicle control
• Cognitive secondary tasks lead to decrements in longitudinal vehicle control, particularly
car-following and visual scanning behaviour
• The Object and Event Detection (OED) measure is a robust tool to assess auditory-vocal
tasks
• Selected lateral and longitudinal control measures can be used to discriminate between
visual-manual tasks
All the dependent variables have been compared across four different scenarios for day 1 data
analysis in the entire road network, across different scenarios for each of the locations, and across
two days for the practice effect. Acceleration rate was also used as another dependent variable for
the braking task for both roundabouts and intersections.
Page 76
Chapter3: Methodology and Research Design
Page 56
3-2-3- Peripheral Detection Task
As noted in the literature review, subjective mental workload measures are low cost, easy and
quick to do, and nonintrusive. However, one of the disadvantages to these methods is that it
cannot be determined if their reports are the average of overall workload rating for whole tasks or
if they are their peak performance ratings. Therefore, in addition to DALI mental workload,
drivers’ event detection abilities were measured for the whole network and for the sections in
which each manoeuvre was performed. Moreover, self reported mental workload is reported by
participants and might be different to their actual mental workload, thus event detection abilities
could present another useful insight. In this study, peripheral detection tasks, or PDT, have been
applied. SCANeR can be programmed to implement PDT using its scripting features.
Red dots were programmed to appear on the right hand side of the screen in a designated area
ranging horizontally between 74 to 81% of screen length (5-25 degrees) above the eyes of the
subject and to the right hand side of the drivers’ eyes between 49 to 57% of screen height (2-5
degrees). The red dot was big enough to be easily visible and appeared on the screen randomly
every 3-6 seconds for about 1-2 seconds. Throughout different driving scenarios, these red dots
appeared on the front screen. The driver was instructed to respond to the red dots as soon as they
noticed their appearance by engaging a high beam flash. Three variables were defined to be
calculated: Correct response counts (CRC), wrong response counts (WRC), and missed response
counts (MRC). If the driver was able to recognise and use the high beam flash when a red dot was
on the screen, one count was added to CRC. If they delayed in detecting the red dot or using the
high beam flash when there was no red dot on the screen, WRC increased. Finally, if they could
not see red dots at all or did nothing, MRC increased by one. MRC is considered the most useful
rate because when drivers are engaging in in-vehicle activities or when their mental workload
increases, they cannot see the events and miss them.
3-3- Participants/Sample
The participants were approached using a flyer, email invitation letter, on QUT campuses and
via the CARRS-Q website. In addition, a press interview helped to attract enough participants for
the study. Each participant was given an Information Sheet prior to the simulator study that
outlined the purpose of the study, what the participant was requested to do, and the confidentiality
and voluntary nature of the participation. They were also asked to complete a brief demographic
survey, which included items such as gender, age, education level, driving experience, and their
use of eco-driving systems, CD players, and PDAs while driving.
Page 77
Chapter3: Methodology and Research Design
Page 57
In the project we matched the SOP (Standard Operating Procedure) in terms of maintaining
the same exclusionary criteria (epilepsy and neck/back injuries), but for our specific project,
additional criteria were applied. Drivers were also required to have a current valid driver’s
licence. Young participants (18-23) were also required to have held their licence for less than 3
years and to have driven less than 10,000 km per year. Middle aged (25-66) drivers were required
to have held their licence for more than 5 years and to have driven more than 10,000 km per year.
As previously explained, this criterion was selected to distinguish between young/inexperience
drivers and middle aged/experience drivers. They also should not have had experience in a
driving simulator previously and needed to be able to participate over two successive days.
Appendix 3 provides detailed demographic information of the recruited participants.
Overall, 22 participants were recruited. Their age range was from 18 to 66 years of the
participants, in which the mean was 33.50 years old and standard deviation was 13.866. Six out
of 22 were young drivers, age mean=20, standard deviation=2.098, range=18-23, whereas 16
were middle aged drivers, age mean=38.56, standard deviation=12.941, range=25-66. Similarly,
17 out of 22 were male participants, age mean=31.76, standard deviation=14.990, range=18-66,
whereas five of them were female drivers, age mean=39.40, standards deviation=7.369,
range=31-47. Education level of participants also was asked in the questionnaire. Figure 10
below shows the participants’ level of education.
Figure 10: Participants’ level of education
Page 78
Chapter3: Methodology and Research Design
Page 58
Frequency of using different in-vehicle systems was also asked of drivers, as summarised in
Figures 11, 16 and 17 below. Only one of the participants reported having used an eco-driving
system. Four of participants reported having often changed their CDs, whereas 7 participants
reported having used their navigation system while driving often or very often.
Figure 11: Participants’ previous experience with eco-driving
Figure 12: Participants’ frequency of changing CDs
Page 79
Chapter3: Methodology and Research Design
Page 59
Figure 13: Participants’ frequency of navigation system usage
To thank participants (other than first year Psychology students seeking course credit), as well
as to reimburse them for their travel costs (e.g., taxi costs), for each 1.5 to 2 hour session,
participants who completed the 14 minute familiarisation session were offered $10 cash. For
those participants who completed the entire driving session, a further $20 was offered to thank
them for the time they provided to participate in the study. For their participation in the two
sessions, over 2 days, a total of $60 was offered.
First year Psychology students were offered the opportunity to gain course credit for
participating in the study. In accordance with the policies and procedures laid down by the School
of Psychology and Counselling, these participants could not receive an incentive payment.
Recruitment of first year Psychology students was undertaken through the Sona system (QUT
Psychology Research Management System).
3-4- Procedure
Before starting the data collection, pilot tests were scheduled in order to make all necessary
changes in methodology and to ensure that communication systems among different devices were
working appropriately.
In the data collection stage, first, recruited participants read and signed a consent form to
inform them about the voluntary nature of research project involvement. After signing off on the
consent form, the pre-drive questionnaire was provided to the participants. It included
Page 80
Chapter3: Methodology and Research Design
Page 60
demographic information like gender, age, education level, annual average travelled kilometres,
and their use of eco-driving system, CD players or PDAs while driving (Appendix 3). Gender and
age were used in an exploratory factor analysis. Education level was asked to find out its
distribution among participants. Annual average travelled kilometres was part of participants’
required information, and it was used to distinguish between young/inexperienced drivers and
middle aged/experienced drivers. Participants were also asked about their previous experience
using three in-vehicle systems to assess their previous practice with these distracting activities.
Total time of the test was approximately 2 hours for the first day and 1.5 hours for the second
day. Participants were instructed to drive as they normally would, and close to the speed limit (80
kilometres per hour). Even though the real speed zones on this route varied, it was considered
important for control purposes that a standard speed limit applied throughout the research.
Each driver was to complete driving in every scenario with each of the interfaces (the three
in-vehicle systems) and the baseline condition within about 14 minutes. Before starting each
scenario, participants filled out DALI mental workload questionnaires. This also provided an
opportunity to rest before commencement of the next scenario. Participants were given a practice
run of one complete session in the simulator to get used to the controls in the simulator
environment and the PDT before the experimental trials began. At the end of this practice run,
participants were offered opportunities to repeat the practice until they felt comfortable with the
controls and procedures. Once they were confident with the controls, PDT method, and
manoeuvres, the baseline conditions were implemented. The baseline conditions were always
completed first and other scenarios were presented at random. Various types of measure of driver
performance, such as mean driving speed, acceleration, lateral position, and steering wheel angle,
were recorded by simulator software.
Five measuring manoeuvres were used as demanding tasks which would be sensitive enough
to show the effects of driver distraction (Table 3). Each manoeuvre had to be carried out at two
specific points in the network, so that there were 10 predefined locations, in total, included in the
network. All road characteristics, signs, markings, and traffic lights were compatible with road
standard manuals. The locations in which drivers started to engage in distracting activities are
also listed in Table 3.
Page 81
Chapter3: Methodology and Research Design
Page 61
Table 2: Measuring locations order
Location Manoeuvres Number
1 Lane changing 1
2 Driving straight (baseline manoeuvre) 1
3 Stopping for an controlled intersection 1
4 Lane changing 2
5 Overtaking 1
6 Braking for a roundabout 1
7 Braking for a roundabout 2
8 Stopping for a controlled intersection 2
9 Driving straight (baseline manoeuvre) 2
10 Overtaking 2
After finishing each of the scenarios, participants were instructed to fill out a DALI (Driving
Activity Load Index) questionnaire (Appendix 2) to measure their overall workload. This also
provided an opportunity for resting. In order to measure driving mental workload in each of the
particular locations, participants were asked to respond to stimuli of the PDT (Peripheral
Detection Task) as soon as they could. The four scenarios were as follows:
The baseline scenario (14 minutes), measurements were taken while drivers were driving on
the road for five manoeuvres (10 locations). No in-vehicle-system was used in the baseline
scenario.
Scenario 1 (14 minutes): In this scenario the first in-vehicle system, the eco-driving system,
was used. While driving, eco-driving system messages were delivered to drivers at the pre-
designated baseline scenario locations, and measurements were collected.
Scenario 2 (14 minutes): In this scenario the second in-vehicle system, the CD player, was
used. While driving, drivers were instructed to manipulate a CD player at the same locations as in
the first scenario, and measurements were collected.
Scenario 3 (14 minutes): In this scenario the third in-vehicle system, PDA navigation, was
used. While driving, drivers were instructed to use the PDA for navigating at the same locations
as in the first scenario and measurements were collected.
In order to be sure unfamiliarity with the simulator was not going to affect the results of the
study, a familiarisation session was completed by all participants on the first day and before the
actual driving sessions. The driving simulator operator and the researcher conversed with
participants throughout the drive and gave all instructions necessary to execute all tasks and
manoeuvres correctly and appropriately. Using the familiarisation session for conversation helped
to prevent any other interaction with participants in actual sessions. After completing the
familiarisation session, and in compliance with standard operation procedures for the simulator
(approved by QUT’s Human Research Ethics Committee), a simulator motion sickness
Page 82
Chapter3: Methodology and Research Design
Page 62
questionnaire (Brooks et al., 2010), was given to participants to evaluate whether they were able
to continue with the experiment. Table 4 below shows participants’ average ratings on the
questionnaire items. The raw questionnaire is attached in Appendix 1; 16 symptoms of motion
sickness are listed and participants were asked to rate each of them from 0 (very low) to 10 (very
high). If the participants indicated high ratings in their motion sickness items, they were asked to
rest for a while, and then only if they did not feel sickness anymore and they were happy to
continue, they were permitted to commence the rest of the experiment. Six out of 22 participants
reported that they did not feel comfortable driving in the advanced driving simulator either after
finishing the entire familiarisation session or after only a few seconds.
If drivers were happy to continue, the scenarios were presented to them. Each session
consisted of four different scenarios, as outlined below. The baseline scenario was always first in
all experiments. Other scenarios were presented randomly. A list of scenario sequences for each
participant was designed and assigned to them in order.
A significant relationship was found between motion sickness rating and missed response
counts, t(21) =-12.976, p<.05. Similarly, there was a significant relationship between motion
sickness rating and DALI rating, t(21)=-11.676, p<.05. Therefore, driving mental workload and
performance seem to be affected by simulator discomfort on the first day.
Page 83
Chapter3: Methodology and Research Design
Page 63
Table 3: Summary of drivers rating to Motion Sickness Assessment Questionnaire (MSAQ); first day
Participant Number Symptom
1 2 3 4 5 6 7 8 9 10 11 12 13 14 15 16 Sum
1 0 2 0 0 1 3 0 0 1 0 1 0 3 3 0 0 14
2 6 0 1 1 7 3 1 2 3 1 7 3 3 4 6 6 54
3 0 0 0 1 0 0 0 0 0 2 0 0 0 0 0 0 3
4 2 0 0 0 3 3 0 0 0 0 3 0 3 2 2 1 17
5 1 0 0 0 2 0 0 0 0 0 2 0 0 0 0 0 7
6 1 3 0 0 3 4 2 0 0 2 1 0 2 0 0 0 18
7 2 1 0 2 6 5 1 0 5 1 2 0 5 6 0 4 40
8 0 1 0 0 1 0 0 0 2 0 0 0 1 0 0 1 6
9 4 1 2 2 6 6 4 2 7 2 7 7 7 5 5 5 72
10 0 1 0 0 0 3 0 0 1 0 0 0 2 2 0 2 11
11 0 0 0 0 0 1 0 0 2 0 0 0 0 1 0 1 5
12 0 0 0 0 0 0 0 0 0 0 0 0 0 0 0 0 0
13 0 1 0 0 0 2 0 0 1 0 0 0 1 0 0 1 6
14 0 0 0 0 0 0 0 0 0 0 0 0 0 0 0 0 0
15 6 6 6 0 6 6 0 0 3 2 6 0 3 2 2 3 51
16 1 2 0 0 2 0 0 0 1 1 1 0 0 0 0 0 8
17 1 0 0 0 1 0 0 0 0 0 0 0 0 0 0 0 2
18 0 1 0 0 1 2 0 0 0 0 0 0 1 1 0 0 6
19 0 0 0 0 0 0 0 0 0 0 0 0 0 0 0 0 0
20 0 0 0 0 1 1 0 0 0 0 1 0 1 1 0 0 5
21 0 0 0 0 3 0 0 0 4 0 2 0 2 0 1 0 12
22 0 0 0 0 0 2 0 0 0 0 0 0 0 0 0 0 2
After the first day, the scenarios, in the same order as presented on the first day, were repeated
in order to evaluate the practice effect. All aspects of scenarios and tasks were exactly the same
as the first day. This was to investigate whether practice interacting with each of the in-vehicle
systems mitigated the potential negative effect. All participants were able to complete the second
day session except one who felt uncomfortable hours after the first day session completion.
It should be mentioned that before commencing second day trials, participants were asked to
fill out another motion sickness questionnaire. As presented in Table 5 below, most of the
participants who did not feel any symptoms of motion sickness on the day did not develop any
Table Item Symptom description Table Item Symptom description
1. Sick to my stomach 9. Disorientated
2. Faint-like 10. Tired/fatigued
3. Annoyed/irritated 11. Nauseated
4. Sweaty 12. Hot/warm
5. Queasy 13. Dizzy
6. Lightheaded 14. Like I am spinning
7. Drowsy 15. As if I might vomit
8. Clammy/cold sweat 16. Uneasy
Page 84
Chapter3: Methodology and Research Design
Page 64
symptoms by the following day. Figure 14 below also shows that symptom of motion sickness is
higher than one for “sick to your stomach”, “queasy”, “lightheaded”, “disorientated”, nauseated”,
“dizzy”, “like I am spinning” and “uneasy” on first day. Figure 14 shows that any symptoms of
motion sickness decrease dramatically on the second day. However, average ratings for some
items, in particular “drowsy” and “tired/fatigued”, show that some of the symptoms remained to
some extent in participants after the first day. Additionally, it seems that the first experience with
the driver simulator leads drivers to experience reach higher levels of motion sickness symptoms.
Table 4: Summary of drivers’ ratings for Motion Sickness Assessment Questionnaire (MSAQ); second
day
Participant Number Symptom*/severity
1 2 3 4 5 6 7 8 9 10 11 12 13 14 15 16 Sum
1 0 1 0 0 1 1 0 0 0 0 1 0 1 2 0 0 7
2 0 0 0 1 0 0 2 0 0 2 0 2 0 0 0 0 7
3 0 0 0 0 0 0 0 0 0 1 0 0 0 0 0 0 1
4 0 0 0 0 0 0 0 0 0 0 0 0 0 0 0 0 0
5 0 0 0 0 0 0 0 0 0 0 0 0 0 0 0 0 0
6 0 1 0 0 1 1 1 0 0 1 0 0 0 0 0 1 6
7 0 0 0 0 0 0 0 0 0 0 0 0 0 0 0 0 0
8 0 0 0 0 0 0 0 0 0 0 0 0 0 0 0 0 0
9 0 0 0 0 0 0 0 0 0 0 0 0 0 0 0 0 0
10 0 0 0 0 0 0 0 0 0 0 0 0 0 0 0 0 0
11 0 0 0 0 0 0 0 0 0 0 0 1 0 0 0 0 1
12 0 0 0 0 0 0 0 0 0 0 0 0 0 0 0 0 0
13 0 0 0 0 0 0 0 0 0 1 0 0 0 0 0 0 1
14 0 0 0 0 0 0 0 0 0 0 0 0 0 0 0 0 0
15 0 0 0 0 0 0 0 0 0 0 0 0 0 0 0 0 0
16 0 0 0 0 0 0 1 0 0 1 0 0 0 0 0 0 2
17 0 0 0 0 0 0 0 0 0 0 0 0 0 0 0 0 0
18 0 0 0 0 0 0 0 0 0 0 0 0 0 0 0 0 0
19 0 0 0 0 0 0 0 0 0 0 0 0 0 0 0 0 0
20 0 0 0 0 0 0 0 0 0 0 0 0 0 0 0 0 0
21 0 0 0 0 0 0 0 0 0 0 0 0 0 0 0 0 0
22 0 0 0 0 0 1 0 0 0 0 0 0 0 0 0 0 1
Table Item Symptom description Table Item Symptom description
1. Sick to my stomach 9. Disorientated
2. Faint-like 10. Tired/fatigued
3. Annoyed/irritated 11. Nauseated
4. Sweaty 12. Hot/warm
5. Queasy 13. Dizzy
6. Lightheaded 14. Like I am spinning
7. Drowsy 15. As if I might vomit
8. Clammy/cold sweat 16. Uneasy
Page 85
Chapter3: Methodology and Research Design
Page 65
Figure 14: Driving simulator’s average motion sickness symptom changes in two days
3-5- Apparatus
3-5-1- Advanced Driving Simulator The use of driving simulators for behavioural studies has significantly increased in recent
years. It is a convenient and safe method of assessing driver behaviours. Driving simulators
enable the evaluation of a wider range of driving situations, especially those that are deemed
dangerous. Driving simulators have been recognised as useful tools for researching driver
behaviour without endangering road users in a completely controlled environments (Lee, 2002;
Shechtman, Classen, Awadzi & Mann, 2009). They provide safe conditions to assess driver
behaviour when driving errors would be costly in terms of both life and property. Driving
simulators provide well controlled and repeatable conditions, which leads to efficient data
collection (Shechtman et al., 2009). Many researchers have shown that observations given by
driving simulators are a reliable indicator of driving behaviour (Farah, Bekhor & Polus, 2009).
They also have some other advantages such as control of extraneous factors and ability to closely
monitor studies. Therefore, they are a promising research tool, which provides safety and an
experimentally well-controlled environment. However, driving simulators have a few
disadvantages. In the data collection process, learning effects may affect the study. In addition,
participants’ behaviour may be affected by knowing that they are being monitored. Simulator
sickness may also undermine measuring performance. Older drivers and females are more likely
to encounter simulator discomfort or driver sickness, which can affect driving performance and
“confound the measurement of distraction-related performance decrements” (Regan et al., 2009,
0 0.2 0.4 0.6 0.8
1 1.2 1.4 1.6 1.8
2
Dri
ver
s' r
atin
g (
1-1
6)
Motion sickness symptom
First day
Second day
Page 86
Chapter3: Methodology and Research Design
Page 66
p.88-89). Installing and managing driving simulators can be expensive, and their operation
requires a higher level of expertise as well as needing other equipment to measure driver
distraction.
Priorities in performing main and secondary tasks in a driving simulator are one of the most
important issues in simulator studies. In other words, the cognitive resources for primary and
secondary tasks in the simulator may have a significant difference from actual roads (Regan et al.,
2009). Therefore, the discrepancy between driving simulators and real world conditions is a
controversial issue in simulator research. In the debate, the question is how valid are the results in
studies such as driver distraction research (Regan et al., 2009). This problem mostly refers to
simulator external validity (Karlsson, 2005). In other words, how much does a simulator
duplicate results of the real world? However, simulators have advantages that justify their
application.
Basic simulators include a mock car structure with controls like clutch, gas pedal, gearshift,
and steering wheel. However, there are a wide range of driving simulators in use, from a laptop to
a more modern and advanced technology which is controlled by several computers in a real car
using a 6-degrees-of-freedom platform. Simulators are classified into three levels of fidelity: low,
medium, and high. The low level has a PC, monitor, and simple cab. A mid-level simulator
consists of advanced imaging technology, a big projection screen, and a realistic cab. The most
advanced simulators include wide field of view and a moving base for a realistic cab experience
(Kaptein, Theeuwes & Horst, 1996). In addition, the cost of simulators varies considerably.
Another important aspect of simulators is validity. The simulator fidelity required in a study
depends on the type of research. A question arises as to what aspects of simulator fidelity are
important in distraction studies. Driving performance, which is affected by distraction, might give
insights into important aspects of a driving simulator. For instance, it has been shown that
maintaining lateral position is affected by distraction. In addition, it has been shown that “a lack
of motion and visual cues” affects lateral position control to a greater degree in simulators than
real vehicles (Regan et al., 2009, p.90). Therefore, in order to measure distraction effects on
lateral control, it is important to replicate precisely the motion and visual cues in the simulator. It
has also been shown that distraction affects visual scanning and event detecting patterns in the
periphery. Having a wide field of view is an important aspect of a driving simulator in order to
present events in the periphery. Thus, the level of simulator fidelity can affect its sensitivity to the
effects of distraction (Regan et al., 2009).
In the HASTE program, eight European partners and Canada “found that driving was
degraded more on real roads than in simulators when drivers performed the same secondary tasks.
Page 87
Chapter3: Methodology and Research Design
Page 67
They speculated that the relatively limited fidelity of existing simulators may have been the main
reason for this discrepancy” (Ranney, 2008, p.6). However, they emphasised that the assessment
environment can be obtained in driving simulators more efficiently and is more easily reproduced
than real-road driving. They also believed that an assessment method with a reasonably advanced
driving simulator in rural road driving scenarios, can offer meaningful and potentially trustworthy
results (Ranney, 2008). CAMP researchers also concluded that since degradation found in the
laboratory could not be found in real road driving, that the laboratory was not sufficient in
assessing the driver distraction caused by secondary tasks (Ranney, 2008).
“It has been suggested that higher fidelity levels are required for research where the results of
the simulation are used to draw conclusions about real-world driving performance, as when
assessing whether interaction with an in-vehicle device distracts drivers” (Regan et al., 2009,
p.88-89). Therefore, in this study, the CARRS-Q advanced driving simulator, a high fidelity
driving simulator located at QUT, Kelvin Grove campus O-Block was used in order to provide
safety for driver participants and simulate real world conditions. CARRS-Q’s $1.5 million
simulator consists of a Bosch Rexroth E-Motion-1500 Electric Motion System, providing motion
with 6 degrees of freedom (surge +716,-602mm, sway +/-603mm, heave +407,-422mm, roll +/-
27º, pitch +27,-24º, yaw +/-39º) and is capable of supporting a load of up to 1500kg. Six HP
Z800 workstations, each with a GeForce XFX GTX285 1 GB graphics card, provide running
components of the simulation software in a distributed fashion. Three Projection Design F22 sx+
2100 Lumens projectors display the forward image, projecting on three flat 4 x 3m screens at
1400x1050 resolution to give a forward field of view of approximately 180º horizontal and 45º
vertical. Three 8 inch LCD screens replace the side and central mirrors, each displaying a
simulated rear view at 800x600 resolution. A complete Holden VE Calais vehicle body, with
working vehicle controls and instruments, provides a realistic control cabin and the ability to
include up to 5 vehicle occupants (maximum 300kg total weight) during a simulation. Stereo
simulation sound is generated using the vehicle’s existing speaker system and an additional
subwoofer to produce engine and external sounds, including Doppler effect. Finally, OKTAL
SCANeR Studio v1.0 simulation software is used.
Page 88
Chapter3: Methodology and Research Design
Page 68
Figure 15: CARRS-Q Advanced Driving simulator (CARRS-Q, 2010)
3-5-2- Driving Lab Simulator Before implementing all designed parts of the research in the advanced driving simulator, a
test-run was designed and conducted using a fixed-base low-fidelity driving simulator located at
QUT, Kelvin Grove campus, K-block. It includes an HP Z800 workstation with GeForce XFX
GTX285 1Gb graphics card, an Epson EMP-400W 1800 Lumens short throw projector, giving a
projected forward image of approximately 1.45 x 1.28 m size at 1400x1050 resolution, Logotech
MOMO Force feedback steering wheel and pedals and Stereo sound with subwoofer, producing
engine and external sounds, including Doppler effect. The lab simulator software was also
OKTAL SCANeR Studio v1.0 simulation software.
3-5-3- Communication System and Data Synchronisation In order to send distracting messages to drivers, a communication system was designed using
RTMaps software. The software is primarily designed to connect devices together through a
computer. It can synchronise and connect simulation software, SCANeR ΙΙ, and application
written for the PDA through a router. The PDA was programmed by Microsoft embedded visual
C++.
It was also required to develop another component (SKD) to synchronise locations in which
message had to be sent to the PDA in SCANeR ΙΙ and RTMaps. The following image shows a
design diagram for such a synchronisation in an RTMaps interface. Scaner_ΙΙ_interface_3 is a
component that recognises the location of a driven vehicle in a simulator and when it reaches a
Page 89
Chapter3: Methodology and Research Design
Page 69
particular position it activates an application installed in the PDA. In this diagram, the PDA input
port has been simulated by a “Raw_socket_server_4” component. The application on the PDA
was activated for 15 seconds unless drivers finished the task of interacting with it in less time.
RTMaps was also programmed to send generated data to a .txt data file. Same data are also
recorded by SCANeR ΙΙ. If RTMaps crashed during data collection for any reason, the data was
extracted from SCANeR ΙΙ output. RTMaps created text file output directly, whereas SCANeR ΙΙ
had a designated piece of software to extract data from a main data file.
Figure 16: RTMaps diagram for synchronising sent messages in a PDA and SCANeR
3-5-4- Eco-driving System Eco-driving message were sent to drivers on a PDA mounted in front of the windscreen. The
messages were set to be visible by drivers at the same location that appropriate signage instructed
them to execute the manoeuvres. To be sure that participants would notice the message, a vocal
beep sound accompanied the messages. An example of a message is shown in Figure 18. Two
messages were shown to drivers.
*Eco-driving system* Your performance: High fuel consumption. Due to speeding
and over deceleration. (for intersections and roundabouts)
*Eco-driving system* Your performance: High fuel consumption. Due to speeding
and over acceleration. (for baseline, overtaking and lane changing)
Drivers were asked to read the whole text message each time that they received one of them
provided they felt safe to do so while driving.
Page 90
Chapter3: Methodology and Research Design
Page 70
Figure 17: Position of PDA holder in front of windscreen
Figure 18: Eco-driving messages on PDA
3-5-5- Navigation System An application was programmed to pop up on the PDA screen. As with the eco-driving
message, it was received near to installed signs in order to be sure that drivers executed the
manoeuvres in predesigned positions. The navigation application had an image of current location
of drivers, a box to enter the five digit number (86349) and an “OK” button. Drivers were asked
to try to not touch any other keys other than numbers in order to avoid closing the application by
accident during the data recording process. They were also asked to touch “OK” after entering the
number.
Page 91
Chapter3: Methodology and Research Design
Page 71
Figure 19: PDA screen in navigation scenario
3-5-6- CD player
Two CDs were provided with two well-known music pieces, Symphony No. 9 (Scherzo) 1and
"Highway Blues"2. The songs repeated throughout entire network when drivers were driving.
One of the CDs was located in the car’s middle console and the other one was playing in the CD
player when drivers wanted to start the CD changing scenario. Using a SCANeR ΙΙ scripting
future, a vocal message activated so that participants executed their manoeuvres in designed
locations. The vocal message was “please change your CD here”.
1 - By Ludwig van Beethoven, composer. Seattle Symphony. Gerard Schwarz, director
2 - By Marc Seales, composer. New Stories. Ernie Watts, saxophone
Page 92
Chapter3: Methodology and Research Design
Page 72
Figure 20: CDs and CD player position
3-6- Data Analysis
Objective and subjective variables were collected for each participant in all the scenarios.
These variables are within factors measures (i.e., repeated measures), as they have been measured
in all four scenarios using the same participants. In addition, as an exploratory investigation, two
between factors measures, age group (18-24 years old and 25-66 years old) and gender (male and
female) have been chosen for further analysis. These measures were selected to be able to answer
the research questions. Quantitative methodology has been applied using repeated measures
mixed Analysis of Variance (mixed ANOVA) to analyse collected data.
Data management for extracting data from SCANeR and RTmaps output was undertaken
using the R statistical package. Data cleaning to detect and correct inaccurate records from data
was undertaken using Microsoft Excel. The cleaned data set in Excel format was imported to
PASW (SPSS) software. A few series of data were extracted for data analysis. The first data set
was for the entire network on the first day. This data was used to investigate the effect of
distraction for each scenario from a holistic point of view. It provides an overview or average of
distraction measures for all type of manoeuvres for each scenario. The second series of data was
extracted for each scenario and at every location. Therefore, data was extracted for every
manoeuvre in order to compare distraction of participants based on types of manoeuvre. To
investigate the practice effect, a series of data were extracted for the entire network for the second
day as well as a series of data for each of the locations. This enabled a comparison between
Page 93
Chapter3: Methodology and Research Design
Page 73
overall performance on the entire network on the first and second days as well as comparisons
between each location on the two days. The practice effect was tested by comparing overall
performance on the first and second days as well as by making comparisons across different
conditions on the first and second days. The first approach was similar to the approach taken in
previous practice effect studies and therefore enabled comparison.
All data analysis was conducted with PASW 18 software. The results of Mauchly’s Test of
Sphericity for all variables of repeated measures within scenarios were checked. If the
assumption of sphericity was violated for any of the variables, the Greenhouse-Geisser correction
method was used. All of the main effects, interactions, and any significant contrasts, are reported
in the following pages and in the appendices. In the study, if p < .05 for a particular measure, the
effect of the measure is reported as a significant result.
Sphericity creates issues for the F ratio in repeated-measures ANOVA and causes
complications for post hoc tests. The complications can be avoided with the Bonferroni method
when the assumption of sphericity is violated (Field, 2009). In this study, the Bonferroni method
is always used, even if the assumption of sphericity is not violated, to prevent any confusion. It is
also believed that the Bonferroni method is the most robust method in the univariate techniques,
particularly for power analysis and managing the Type Ι error rate (Field, 2009).
The standard post hoc test is not available in repeated-measures ANOVA. However, some
basic post doc analyses can be undertaken. The Bonferroni method is chosen for this analysis.
It is acknowledged that “just because a test statistic is significant doesn’t mean that the effect
it measures is meaningful or important” (Field, 2009, p.56), so it is also important to report the
effect size: “An effect size is simply an objective and usually standardized measure of the
magnitude of observed effect” (Field, 2009, p.56). SPSS provides an effect size measure of
partial eta squared or for repeated measures ANOVA. Cohen (1988) suggested
should be
interpreted at three levels, as below:
- =.01 (small effect)
- =.09 (medium effect)
- =.25 (large effect)
The power of the analyses is also reported, as Cohen (1992) emphasised that power of
analysis is an important aspect of behavioural statistical analysis. He considered .80 a good
benchmark and appropriate power for behavioural studies.
Finally, it is also important to note that due to time constraints and the nature of the study,
which required about four hours time for each participant over two consecutive days, only 22
people were recruited. The recruiting stage took more than seven months using flyers, email
Page 94
Chapter3: Methodology and Research Design
Page 74
invitation letters, QUT campus advertisements, the CARRS-Q website, and a local newspaper
interview.
3-7- Research Ethics/Statement
This research involved humans and therefore required ethical approval. Before commencing
data collection, ethical approval for the project was granted from QUT's Human Research Ethics
Committee. The QUT Ethics Approval Number is 1000001292.
Page 95
Page 75
Chapter 4 - Data Analysis and Results
Page 96
Chapter4: Data Analysis and Results
Page 76
4-1-Introduction
To measure driver distraction, the following objective and subjective variables have been
collected for each participant in all the scenarios. Four selected manoeuvres included lane
changing, overtaking, commence braking for roundabouts, and commence braking for
intersections. We also collected data on travel in a straight pathway without any specific
manoeuvre as a baseline drive. Each participant was asked to execute a manoeuvre twice at two
locations. The location of the start point for each manoeuvre was notified to drivers by a relevant
installed roadside sign. All participants managed to finish all sessions, except one who was not
able to execute her overtaking task in the navigation scenario at the first location. In this report,
all analyses have been presented according to the types of manoeuvre, and two data analysis
results have been presented for each of the locations.
The measures within subjects include: speed, lateral shift from centre of the driving lane,
standard deviation of lateral shift from centre of driving lane, steering wheel angle, standard
deviation of steering wheel angle, correct response counts (CRC), missed response counts
(MRC), and DALI mental workload (amended version of NASA TLX).
Due to unequal numbers of males and females, as well as young and middle-aged
participants, and small sample size, all results of individual differences are exploratory data
results and need further investigation.
4-2- Data Analysis for the First Day (entire road network)
4-2-1- DALI Mental Workload The repeated measures mixed ANOVA tests whether there are differences between the DALI
mental workload across the four scenarios. The results show a significant difference in drivers’
mental workload between the scenarios F(3, 57) = 15.862, p < .05, (partial eta squared) =.455,
Observed Power (OP) = 1.000. The means and standard deviations for the measure are listed in
the table 6 below.
Table 5: Descriptive statistics of DALI for entire network
Gender = Total, Grouped age = Total
Mean Std. Deviation N
Baseline scenario(1) 52.105909 20.4178080 22
Eco-driving scenario(2) 59.7955 23.18343 22
Navigation system scenario(3) 76.6668 17.25237 22
CD changing scenario(4) 71.3177 16.78453 22
Page 97
Chapter4: Data Analysis and Results
Page 77
Figure 21: DALI mental workload for entire network across scenarios
As shown in the summary table of pair-wise comparisons below (Table 7), both navigation
(76.68, 17.25) and CD changing (71.32, 16.78) scenarios are significantly different in mental
workload when compared with baseline scenarios (52.11, 20.42) using the Bonferroni correction.
There is also a significant difference between the eco-driving scenario (59.80, 23.18) and the
navigation system (76.68, 17.25). However, no significant differences were found between
baseline (52.11, 20.42) and eco-driving scenarios (59.80, 23.18), nor between eco-driving (59.80,
23.18) and CD changing scenarios (71.32, 16.78). In addition, DALI mental workload was not
found to be significantly different between navigation (76.68, 17.25) and CD changing (71.32,
16.78) scenarios.
Page 98
Chapter4: Data Analysis and Results
Page 78
Table 6: Pair-wise comparisons of DALI mental workload in entire network
Measure: DALI
(I) Scenario (J) Scenario
Mean
Difference (I-J) Std. Error Sig.
95% Confidence Interval for
Difference
Lower Bound Upper Bound
1 2 -8.081 2.913 .073 -16.658 .495
3 -24.816 3.644 .000 -35.545 -14.087
4 -18.887 3.779 .000 -30.014 -7.761
2 1 8.081 2.913 .073 -.495 16.658
3 -16.735 4.175 .005 -29.024 -4.445
4 -10.806 4.206 .113 -23.188 1.576
3 1 24.816 3.644 .000 14.087 35.545
2 16.735 4.175 .005 4.445 29.024
4 5.929 2.484 .165 -1.384 13.241
4 1 18.887 3.779 .000 7.761 30.014
2 10.806 4.206 .113 -1.576 23.188
3 -5.929 2.484 .165 -13.241 1.384
Differences between male and female drivers were not significant according to between-
subjects analyses. Table 8 shows the mean of DALI mental workload for males and females.
Table 9 shows the pair-wise comparisons between male and female. The mental workload across
different scenarios is shown in Figure 22.
Table 7: Descriptive statistics of DALI based on gender
Measure: DALI
Gender Mean Std. Error
95% Confidence Interval
Lower Bound Upper Bound
Male 64.994 4.534 55.504 74.483
Female 64.048a 7.990 47.325 80.772
Table 8: Pair-wise comparisons of DALI mental workload based on gender
Measure: DALI
(I) Gender (J) Gender
Mean
Difference (I-J) Std. Error Sig.b
95% Confidence Interval for
Differenceb
Lower Bound Upper Bound
Male Female .945a 9.187 .919 -18.283 20.174
Female Male -.945c 9.187 .919 -20.174 18.283
Page 99
Chapter4: Data Analysis and Results
Page 79
Figure 22: DALI of male and female drivers across scenarios
Similarly, differences between young and middle aged drivers were not significant according
to between-subjects analyses. Table 10 shows the mean of DALI mental workload for males and
females. Table 11 shows the pair-wise comparisons between male and female. The mental
workload across different scenarios is shown in Figure 23.
Table 9: Descriptive statistics of DALI based on age group
Measure: DALI
Grouped age Mean Std. Error
95% Confidence Interval
Lower Bound Upper Bound
Young 64.147a 7.294 48.880 79.413
Middle age 64.945 4.818 54.860 75.029
Table 10: Pair-wise comparisons of DALI mental workload based on aged group
Measure: DALI
(I) Grouped age (J) Grouped age
Mean
Difference (I-J) Std. Error Sig.b
95% Confidence Interval for
Differenceb
Lower Bound Upper Bound
Young Middle age -.798a 8.742 .928 -19.095 17.499
Middle age Young .798c 8.742 .928 -17.499 19.095
Page 100
Chapter4: Data Analysis and Results
Page 80
Figure 23: DALI of young and middle aged drivers across scenarios
4-2-2- Missed Response Count There were significant differences between the scenarios in their MRC, F(3, 57) = 13.571, p <
.05, = .417, OP = 1.000. Table 12 below shows their means and standard deviations.
Table 11 : Descriptive statistics of MRCs for entire network
Gender = Total, Grouped age = Total
Mean Std. Deviation N
Baseline scenario(1) 25.77 8.574 22
Eco-driving scenario(2) 28.32 11.227 22
Navigation system scenario(3) 38.55 13.900 22
CD changing scenario(4) 37.18 16.939 22
Pair-wise comparison were undertaken to identify where the differences occurred between
scenarios. As Table 13 shows below, both baseline (25.77, 8.574) and eco-driving (28.32, 11.227)
scenarios are significantly different with both navigation (38.55, 13.900) and CD changing
(37.18, 16.939) scenarios. However, no measurable differences were found between baseline
(25.77, 8.574) and eco-driving (28.32, 11.227) scenarios, and similarly for navigation (38.55,
13.900) and CD changing (37.18, 16.939) scenarios.
Page 101
Chapter4: Data Analysis and Results
Page 81
Table 12: Pair-wise comparisons of MRCs
Measure: MRCs in entire network
(I)
Scenario
(J)
Scenario
Mean Difference
(I-J)
Std.
Error Sig.
95% Confidence Interval for Difference
Lower Bound Upper Bound
1 2 -2.253a 1.852 1.000 -7.706 3.201
3 -12.759a,*
2.055 .000 -18.809 -6.708
4 -10.637a,*
2.590 .004 -18.261 -3.013
2 1 2.253a 1.852 1.000 -3.201 7.706
3 -10.506a,*
1.962 .000 -16.281 -4.731
4 -8.385a,*
2.330 .011 -15.244 -1.525
3 1 12.759a,*
2.055 .000 6.708 18.809
2 10.506a,*
1.962 .000 4.731 16.281
4 2.121a 1.873 1.000 -3.392 7.634
4 1 10.637a,*
2.590 .004 3.013 18.261
2 8.385a,*
2.330 .011 1.525 15.244
3 -2.121a 1.873 1.000 -7.634 3.392
Figure 24: Missed response counts for entire network across scenarios
4-2-3- Summary The results of the data analysis for the entire network show that participants rated mental
workload as significantly less in the baseline scenario in comparison with the navigation system
and CD changing scenarios. However, the eco-driving system was not significantly different
compared with the baseline scenario. In other words, it was no more physically, cognitively, or
visually demanding as the driving task alone. The eco-driving scenario was also significantly
different compared with the navigation system, but not compared with the CD changing task. One
Page 102
Chapter4: Data Analysis and Results
Page 82
way this result could be interpreted is that the eco-driving system was almost as distracting as the
CD changing task, but not as much as the navigation system.
Although missed response count comparisons suggest similarly significant differences
between baseline scenario and both navigation and CD changing scenarios, and also between eco-
driving and navigation system (similar to mental workload comparisons), there were also
significant differences between the eco-driving scenario and the CD changing scenario. In
general, drivers’ missed response counts in the eco-driving task were higher than in the baseline
scenario, but not as much as for the CD changing and navigation tasks.
It is interesting to observe that the CD changing task was quite distracting in comparison with
other in-vehicle activities. It was similar to the navigation task in terms of drivers’ mental
workload and missed response counts.
The next set of analyses examine whether the results for the entire network were similar to the
results for each manoeuvre and location. In other words, the eco-driving message may not be
distracting in the context of the entire network data, whereas it may be distracting when focusing
on a specific location and manoeuvre. To answer this question, data analyses have been
conducted for each of the ten locations individually. In the following sections, results of ANOVA
analyses for each of the studied manoeuvres have been presented. Appropriate measures have
been chosen for each of the manoeuvres and the results are demonstrated for all locations
separately. For lane changing manoeuvres, baseline manoeuvres, and overtaking manoeuvres,
relevant measures were minimum speed, lateral shift measures, steering wheel angle measures,
and peripheral detection task measures. However, for intersections, the only relevant measure
appeared to be missed response counts. Besides mean speed and missed response counts,
acceleration rate was also considered as another factor that may be affected by driver distraction
at roundabouts.
4-3- Analysis of Manoeuvres (first day)
4-3-1- Summary Results for No Particular Manoeuvre (baseline manoeuvre) All detailed results for locations 2 and 9 are presented in Appendix 5, section A5-1 and A5-2,
and summary of the significant results shown in Table 14 below. In both locations, participants’
minimum speeds were significantly different between CD changing and baseline scenarios.
However, in the first baseline manoeuvre (location 2), CD changing was also significantly
different from the eco-driving manoeuvre. It seems that CD changing distraction caused greater
speed decrement. The results also show that both CD changing and navigation tasks degraded
lateral position control measures more than other scenarios. On the other hand, the baseline and
Page 103
Chapter4: Data Analysis and Results
Page 83
eco-driving system had less deleterious effects on the vehicle lateral control. MRC differences
also demonstrated that despite gender and age differences in the first location, there was no
significant difference between these two factors in the second location. Therefore, we could
conclude that young drivers and male drivers showed improvement in their response to event
detection in the second location of the baseline manoeuvre.
Table 13: Summary of significant results, baseline manoeuvre, first day
Location 2 Overall By age By gender
Minimum speed Less in CD changing
scenario than both
baseline and eco-driving
scenarios
- -
Standard deviation
of lateral shift
Higher in navigation
system than both baseline
and eco-driving scenarios
- -
Steering wheel angle Less in both baseline and
eco-driving scenarios
than both Navigation and
CD changing scenarios
- -
Peripheral detection
task – Missed
responses
Less in baseline scenario
than navigation system
Less in young driver
than middle aged
driver
Higher for male drivers
than female drivers
Location 9 Overall By age By gender
Minimum speed
Higher in Baseline than
CD changing
- -
Standard deviation
of lateral shift
Less in baseline than any
other scenarios
- -
Steering wheel angle Less in both baseline and
eco-driving scenarios
than both navigation and
CD changing scenarios
- -
Peripheral detection
task – Missed
responses
- - -
4-3-2- Summary Results for Lane Changing Manoeuvres Detailed results for locations 1 and 4 are presented in Appendix 5, sections A5-3 and A5-4,
and a summary of the significant results is shown in Table 15 below. To sum up, there was some
evidence of drivers’ performance degradation in both locations when drivers were engaged in
reading eco-driving messages. However, degradation of performance was less in the second lane
changing location compared with the first lane changing location.
Apparently, despite the familiarisation session in which drivers drove the entire network,
when they received distracting messages at the first lane changing location, they experienced
Page 104
Chapter4: Data Analysis and Results
Page 84
their highest level of distraction, so that their performance parameters showed that their ability to
control the vehicle was worse than in the second lane changing location. In lane changing
manoeuvres, in the first location, there were significant differences between young and middle
aged drivers in their minimum speeds (middle aged drivers tended to drive slower than their
counterparts), whereas in the second lane changing location no significant results were found.
One interpretation of this result could be that middle aged drivers, when compared with young
drivers, were more conservative in interacting with in-vehicle systems in their first lane changing
task, which was also the first location they were distracted. However, they apparently felt more
comfortable in the second lane changing location.
Table 14: Summary of significant results, lane-changing, first day
Location 1 Overall By age By gender
Minimum speed - Younger drivers drove
faster for navigation and
CD,
Older drivers drove more
slowly for all distracting
tasks
-
Standard deviation of
lateral shift
Significant overall, both
eco scenario and baseline
scenario less than
navigation
- -
Steering wheel angle
- - -
Peripheral detection
task – Wrong
responses
All more than baseline
scenario
- -
Peripheral detection
task – Missed
responses
All more than baseline,
Eco-driving more than
navigation and CD
changing
- -
Location 4 Overall By age By gender
Minimum speed
- - -
Standard deviation of
lateral shift
- - -
Steering wheel angle Less in eco-driving than
navigation
- -
Peripheral detection
task – Wrong
responses
- -
Peripheral detection
task – Missed
responses
Higher in navigation than
baseline
- -
4-3-3- Summary Results for Overtaking Manoeuvres
Page 105
Chapter4: Data Analysis and Results
Page 85
All detailed results for locations 5 and 10 are presented in Appendix 5, section A5-5 and A5-
6, and a summary of the significant results is shown in Table 16 below. In general, drivers
preferred to drive faster at the second overtaking location, possibly because it was last manoeuvre
in the network. The results show participants had significantly lower minimum speeds when they
were engaged in the CD changing task in comparison with both baseline and eco-driving scenario
at the second overtaking location. One interesting result is that participants’ lateral shift control
performance deteriorated more when interacting with the CD changing task at higher speeds. In
their overtaking task, at the first location, the navigation system degraded drivers’ minimum
speed more than both the baseline and eco-driving scenarios. However, at the second overtaking
location, the CD changing task degraded drivers’ lane lateral shifts more. Furthermore, the
drivers missed more events in both navigation system and CD changing scenarios in the first
overtaking manoeuvres in comparison with the baseline scenario. However, despite the finding of
a significant difference in the second overtaking manoeuvre, no significant pair-wise comparisons
were found for the location.
Table 15: Summary of significant results, overtaking, first day
Location 5 Overall By age By gender
Minimum speed
- - -
Lane lateral shift Higher in navigation than
both baseline and eco –
driving scenario
Higher in younger
drivers than middle
aged drivers
-
Standard deviation of
Steering wheel
Higher in navigation
scenario than eco-driving
scenario
- -
Peripheral detection
task – Missed responses
Less in baseline than both
navigation and CD
changing scenario,
Less in eco-driving than
navigation scenario
- -
Location 10 Overall By age By gender
Minimum speed CD changing scenario
more than both baseline
and navigation system
- -
lane lateral shift Higher in CD changing
than both baseline and
eco-driving scenario
- -
Standard deviation of
Steering wheel
- - -
Peripheral detection
task – Missed responses
Significant overall, but
not for any pairs
- -
4-3-3- Summary Results for Commence Braking Task at Intersections
Page 106
Chapter4: Data Analysis and Results
Page 86
All detailed results for locations 3 and 8 are presented in Appendix 5, section A5-7 and A5-8,
and a summary of the significant results is shown in Table 17 below. When approaching an
intersection, the navigation task caused more events to be missed by participants, whereas eco-
driving messages seemed to make drivers less mentally distracted. One possible explanation for
these results is that approaching an intersection needs drivers’ attention in order to safely stop in
the stopping bar. Therefore, drivers may have preferred to not engage in the in-vehicle activities
at the instructed locations.
Table 16: Summary of significant results, Intersection, first day
Location 3 Overall By age By gender
Peripheral detection
task – Missed responses
Less in baseline scenario
than navigation and CD
changing scenarios
- -
Location 8 Overall By age By gender
Peripheral detection
task – Missed responses
Less in baseline scenario
than navigation scenario
- -
4-3-5- Summary Results for Commence Braking Task at Roundabouts All detailed results for locations 6 and 7 are presented in Appendix 5, section A5-9 and A5-
10, and a summary of the significant results is shown in Table 18 below. There were significant
differences in MRCs between eco-driving message and navigation system scenarios at both
locations, which means drivers were mentally less distracted by the messages than any other
distracting scenarios at roundabouts. In addition, in both locations, significant differences were
found between male and female drivers in their number of missed events. Females detected more
red dots on the screen than males. In other words, females became less distracted than males.
Furthermore, the navigation system needed greater mental engagement with the task in
comparison with the baseline scenario, so that participants’ deceleration rates were higher in this
scenario.
Page 107
Chapter4: Data Analysis and Results
Page 87
Table 17: Summary of significant results, braking at roundabouts, first day
Location 6 Overall By age By gender
Mean speed
- - -
Peripheral detection task
– Missed responses
Less in Baseline than
navigation scenario
- Less for females
than males
Acceleration
- - -
Location 7 Overall By age By gender
Mean speed Less in navigation
scenario than both
baseline and eco driving
scenarios
- -
Peripheral detection task
– Missed responses
Less in navigation system
than both baseline and
eco driving scenarios
- Less for females
than males
Acceleration
Higher in navigation
scenario than baseline
scenario
- -
4-3-6- Summary of First Day Data Analysis Subjective and objective factors of driver distraction were examined for three in-vehicle
activities (reading eco-driving message, entering a five digit number in the navigation system and
CD changing) while executing five different manoeuvres at two locations each in the CARRS-Q
advanced driving simulator. It was found that, in general, the navigation and CD changing
scenarios were most distracting scenarios, and the eco-driving scenario was the least distracting.
However, in comparison with baseline scenarios all three in-vehicle systems induced some degree
of distraction. Additionally, the eco-driving message degraded many aspects of driving
performance. In particular, as per Table 19 below, drivers’ minimum speeds degraded in the CD
changing scenario more than in any other scenario in comparison with the eco-driving scenario.
The navigation system scenario degraded drivers’ lateral shift more than in any other scenario in
comparison with the eco-driving system scenario. The navigation scenario also resulted in more
event detection degradation. It is interesting, though, both the navigation and CD changing
system scenarios were different in steering wheel control compared with eco-driving. However,
all together, although eco-driving degraded some aspects of drivers’ performance, its degradation
abilities may be located somewhere between the baseline scenarios and CD changing scenarios.
Page 108
Chapter4: Data Analysis and Results
Page 88
It is important to add that observation of drivers struggling to change CDs and enter the
numbers in the navigation system supports the idea that CD changing and using a navigation
system while a vehicle is in motion are much more physically demanding than an eco-driving
scenario.
Some evidence of both gender and age group differences were also found in some measures
of certain manoeuvres. More investigation is needed on the matter.
Table 18: Summary of significant pair-wise comparisons of eco-driving scenario with all other scenarios
(Lane changing, overtaking and baseline manoeuvres)
Manoeuvres Locations Min speed Standard
deviation of
lateral shift
MRC Standard
deviation of
steering wheel
B N C G A B N C G A B N C G A B N C G A
Lane changing Location 1 - - - - Y - Y - - - Y Y - - - - - - - -
Location 2 - - - - - - - - - - - - - - - - - - - -
Overtaking Location 1 - - - - - - Y - - - - Y - - - - - - - -
Location 2 - - Y - - - - Y - - - Y - - - - Y - - -
No manoeuvres Location 1 - - Y - - - Y - - - - - - Y Y - Y Y - -
Location 2 - - - - - Y - - - - - - - - - - Y Y - -
B: Baseline scenario
N: Navigation scenario
C: CD changing scenario
G: gender difference
A: age difference
Y: yes, there is significant difference between eco-driving scenario and the selected scenario.
The results for intersections and roundabouts are not promising and need more investigation
in later studies. However, drivers’ missed response counts were significantly different between
the eco-driving system and navigation system scenarios, but were not significant between eco-
driving and any other scenario. In addition, gender differences in detection of events while
interacting with the navigation system also needs further study.
Table 19: Summary of significant pair-wise comparisons of eco-driving scenario with all other scenarios
(Roundabouts and intersections)
Manoeuvres Locations Mean speed Acceleration MRC
B N C G A B N C G A B N C G A
Roundabouts Location 1 - - - - - - - - - - - Y - Y -
Location 2 - Y
- - - - - - - - - Y - Y -
Intersections Location 1 - - - - - - - - - - - - - - -
Location 2 - - - - - - - - - - - - - - -
B: Baseline scenario
N: Navigation scenario
C: CD changing scenario
G: gender difference
A: age difference
Page 109
Chapter4: Data Analysis and Results
Page 89
Furthermore, the entire network data show that drivers’ mental workload in the eco-driving
scenario was significantly different compared with the navigation system, but it was not
significantly different compared with any other scenario. However, a MRC comparison between
scenarios in the entire network shows that drivers’ detection abilities in eco-driving tasks were
quite similar to baseline scenarios and significantly different from navigation and CD changing
scenarios.
4-4- An Analysis on the Practice Effect (entire road network)
In this section, the practice effect on variables measured on the first day compared to second
day will be presented. Each participant was required to repeat the full range of scenarios and
manoeuvres a day after the first day. Every aspect of the experiment on the second day was
exactly the same as on the first day, except it was not essential to do familiarisation sessions on
the second day because participants were familiar enough with the simulator and tasks. Therefore,
on the first day it took around 2 hours to finish every aspect of the experiment, and on the second
day participants spent around one and a half hours to complete the entire sessions. Twenty-one of
the 22 participants completed the second day. One of the participants reported experiencing
driving simulator discomfort after finishing the first day and was not happy to continue and do
the same tasks for the second day.
4-4-1- DALI Mental Workload The repeated measures mixed ANOVA used to determine the significant differences in the
DALI mental workload over 2 consecutive days for each of the scenarios. The results are
presented below for each of the scenarios.
Baseline scenario The results show a significant difference in drivers’ mental workload between day 1 (mean =
52.43, standard deviation = 20.86) and day 2 (36.94, 17.87) in the baseline scenario, F(1, 18) =
35.185, p < .05, = .662, OP = 1.000. Using a Bonferroni pair-wise comparison, it was
confirmed that drivers’ mental workload was significantly higher on the first day (mean
difference = 15.722, range: 10.580~20.864). However, no significant differences were found as a
result of between factors analyses of gender or age groups. Young drivers (mean = 37.194,
standard error = 7.787) and middle aged drivers (47.650, 5.224) rated almost the same in the
baseline scenario, F(1, 18) = 1.145, p = .299, = .060, OP = 0.173. Similarly, male participants’
Page 110
Chapter4: Data Analysis and Results
Page 90
(mean = 42.464, standard error = 4.925) mental workload was almost equal to that of their female
counterparts (47.567, 8.531), F(1, 18) = .000, p = .987, = .000, OP = 0.050.
Eco-driving The results show no significant difference in drivers’ mental workload between day 1 (mean
= 59.87, standard deviation = 23.75) and day 2 (59.29, 23.55) in the eco-driving scenario, F(1,
18) = 0, p = .984, = .0, OP = .050. Similarly, no significant differences were found as a result
of between factors analyses of gender or age groups. Young drivers (mean = 57.488, standard
error = 9.723) and middle aged drivers (60.841, 6.523) rated almost the same in the baseline
scenario, F(1, 18) = .028, p = .869, = .002, OP = 0.053. Likewise, male participants’ (mean =
58.519, standard error = 6.150) mental workload was almost equal to that of their female
counterparts (62.132, 10.651), F(1, 18) = .039, p = .845, = .002, OP = 0.054.
Navigation system Similar to the baseline scenario, participants rated their mental workload as significantly
different on day 1 (76.21, 17.54) compared to day 2 (65.62, 24.34) when they were interacting
with the navigation system, F(1, 18) = 8.497, p < .05, = .321, OP = .787. A Bonferroni pair-
wise comparison found the same results as for the baseline scenario, mean difference = 9.893,
range = 3.587~16.198, p < .05. However, no significant differences were found as a result of
between factors analyses of gender or age groups. Young drivers (mean = 70.363, standard error
= 8.595) and middle aged drivers (71.733, 5.766) rated almost the same in the baseline scenario,
F(1, 18) = .002, p = .969, = .000, OP = 0.050. Similarly, male participants’ (mean = 70.148,
standard error = 5.436) mental workload was almost equal to that of their female counterparts
(73.532, 9.416), F(1, 18) = .097, p = .759, = .005, OP = 0.060.
CD changing scenario Same as for the eco-driving system scenario, drivers did not rate day 1 (70.49, 16.73) and day
2 (65.78, 20.97) as significantly different for the CD changing scenario, F(1, 18) =1.687, p =
.210, = .086, OP = .234. Moreover, no significant differences were found as a result of
between factors analyses of gender or age groups. Young drivers (mean = 71.083, standard error
= 7.707) and middle aged drivers (66.408, 5.170) rated almost the same in the baseline scenario,
F(1, 18) = .097, p = .759, = .005, OP = 0.060. Similarly, male participants’ (mean = 69.567,
standard error = 4.875) mental workload was almost equal to that of their female counterparts
(64.766, 8.443), F(1, 18) = .101, p = .754, = .006, OP = 0.060.
Page 111
Chapter4: Data Analysis and Results
Page 91
Figure 25 below summarises the practice effect on the DALI mental workload for each of the
scenarios.
Figure 25: Effect of practice on drivers’ DALI mental workload
4-4-2- Missed Response Count
Baseline scenario Results show that participants’ MRCs were significantly different on the first day (24.48,
6.194) and second day (17.57, 6.712), F(1, 18) = 14.115, p < .05, = .440, OP = .944. The same
results were found with a pair-wise comparison, mean difference = 6.611, range = 3.379~9.843, p
< .05. However, no gender or age differences were found for MRC over the 2 days.
Eco-driving There was a marginally significant difference for practice effect of MRC in the eco-driving
scenario between day 1 (27.05, 9.749) and day 2 (22.62, 7.318), F(1, 18) = 4.236, p = .054, =
.190, OP = .495. A pair-wise comparison supported result, mean difference = 4.222, range =
.356~8.091, p < .05. Practice caused drivers to miss fewer events on the second day.
Navigation system Day 1 (36.62, 10.823) and day 2 (26.43, 7.922) were also significantly different in
participants’ MRC, F(1, 18) = 35.673, p < .05, = .665, OP = 1.000. Similarly, practice showed
a significant effect using a pair-wise comparison, mean difference = 10.267, range =
6.926~13.607, p < .05.
0.0
10.0
20.0
30.0
40.0
50.0
60.0
70.0
80.0
90.0
Baseline Eco-driving Navigation CD changing
DA
LI
men
tal
work
load
Scenarios
First day
Second day
Page 112
Chapter4: Data Analysis and Results
Page 92
CD changing Similar to the first three scenarios, in the CD changing scenario, practice decreased MRCs on
the second day (26.55, 10.475) when compared with the first day data (34.35, 11.518), F(1, 18) =
24.880, p < .05, = .594, OP = .997. A pair-wise comparison suggested the same results, mean
difference = 8.100, range = 4.911~11.289, p < .05.
Figure 26 below has summarises the practice effect on MRCs for each of the scenarios.
Figure 26: Effect of practice on drivers’ MRCs
4-4-3- Wrong Response Count
Baseline scenario There were no significant WRC’ differences between day 1 (9.14, 3.229) and day 2 (7.76,
4.888) in the baseline scenario, F(1, 18) = 1.095, p = .309 = .057, OP = .168.
Eco-driving There were also no significant WRC’ differences between day 1 (11.71, 5.649) and day 2
(9.86, 4.661) in the eco-scenario, F(1, 18) = 2.884, p = .107, = .138, OP = .363.
Navigation system There was a significant effect of practice between day 1 (13.62, 6.241) and day 2 (10.43,
4.812) for the navigation system scenario, F(1, 18) = 7.680, p < .05, = .299, OP = .746. A pair-
0
5
10
15
20
25
30
35
40
45
Baseline Eco-driving Navigation CD changing
Dri
ver
s' m
isse
d r
esponse
counts
(Num
ber
)
Scenarios
First day
Second day
Page 113
Chapter4: Data Analysis and Results
Page 93
wise comparison supported this effect with a similarly significant result, mean difference = 3.511,
range = .826~6.196, p < .05. Drivers had less wrong response counts in the second day.
CD changing There were significant differences in WRCs between day 1 (14.10, 4.633) and day 2 (11.50,
5.125) in the CD changing scenario, F(1, 17) = 5.544, p < .05, = .246, OP = .603. The same
result was found with a pair-wise comparison, mean difference = 2.667, range = .464~4.870, p <
.05.
Figure 27: Effect of practice on drivers’ WRCs
4-4-4- Summary for Practice Effect on Entire Network The results show that practice certainly decreased participants’ mental workload rating in both
baseline and navigation scenarios. However, there were no significant improvements for eco-
driving and CD changing scenarios. One possible reason for this could be that affected drivers
rated the second day mental workload in the baseline scenario as less than for the first day due to
the order of the experiments. Drivers were required to do the baseline scenario first. Therefore,
they rated the baseline mental workload higher. It can also be claim that the navigation system
proved to be the most sensitive scenario to practice because of the higher differences. However,
a MRC comparison between the two days suggests that both navigation and CD changing
scenarios could be less mentally demanding with practice. Drivers also showed fewer mistakes in
responding to events after they practised.
0
2
4
6
8
10
12
14
16
Baseline Eco-driving Navigation CD changing
Dri
ver
s' w
rong r
esponse
counts
(Num
ber
)
Scenarios
First day
Second day
Page 114
Chapter4: Data Analysis and Results
Page 94
4-5- Practice Effect on Driving Measures Based on Type of Manoeuvre
4-5-1 Practice Effect for Baseline Manoeuvre All detailed results for locations 2 and 9 are presented in Appendix 6, section A6-1 and A6-2,
and a summary of the significant results in shown in Table 21 below. Drivers’ minimum mean
speed had a significant increase on the second day when drivers interacted with the CD player in
location 2. However, younger participants drove faster than middle aged drivers in the navigation
scenario at location 9. In addition, male drivers showed a tendency to drive faster than their
female counterparts in the baseline scenario at the second baseline manoeuvre. Interestingly,
though, middle aged drivers had worse lateral shift performance on the second day of the eco-
driving scenario at both locations. This suggests that they felt more confident in interacting with
eco-driving. However, the eco-driving scenario caused more lateral changes on the second day.
Similarly, young drivers had worse lateral shift performance on the second day on the baseline
scenario for location 9. Practice also worsened drivers’ steering wheel performance on the second
day, which was unexpected. There is also some evidence that drivers responded incorrectly at a
lesser rate on the second day in the baseline scenario. Similarly, younger drivers were better in
not responding incorrectly to the event on the second day for the baseline scenario. In addition, in
general, male drivers were better than their female counterparts in responding correctly to events
in the CD changing scenario. There is also evidence that practice had caused drivers to miss
fewer events in the CD changing scenario.
Page 115
Chapter4: Data Analysis and Results
Page 95
Table 20: Summary of significant results, baseline manoeuvre, practice effect
Location 2 Baseline
Eco-driving
Navigation CD changing
Minimum speed (overall) - - - Driver’s minimum mean
speed increased on second day.
Standard deviation of lateral
shift
- Middle aged drivers had
worse lateral shift control on second day, whereas
young drivers gained
slightly better lateral control performance on
second day
- -
By age group
- - - -
By gender - - - -
Standard deviation of steering
wheel angle
- - - -
Peripheral detection task –
Wrong responses
- - - -
By age group
- - Young participants had
fewer wrong responses
than middle aged participants
-
By gender
- - - -
Peripheral detection task –
Missed responses
- - - Drivers missed less events on second day
Location 9 Baseline
Eco-driving
Navigation CD changing
Minimum speed
- - - -
By age group
- - Younger drivers tended to drive faster on second
day, whereas middle aged
drivers drove almost at
same speed on second
day.
-
By gender
Males tended to drive
faster than females
- - -
Standard deviation of lateral
shift
Young drivers had more deviation of lateral shift on
second day, whereas
middle aged drivers gained better lateral control
performance on second day
Middle aged drivers had grater deviation of lateral
shift on second day,
whereas young drivers gained better lateral
control performance on
second day
- -
Standard deviation of steering
wheel angle
Practice improved steering wheel control on second
day
- Practice improved male drivers’ steering wheel
control on second day,
whereas it worsened for female drivers
-
Peripheral detection task –
Wrong responses
Drivers had fewer wrong
responses on second days
- - -
By age group
Young drivers had fewer wrong responses on second
day in comparison with
their middle aged counterparts
- - -
By gender
- - - Males had fewer wrong
responses than their female counterparts
Peripheral detection task
– Missed responses
Young drivers missed
more events on second
day, whereas middle aged drivers detected more
events
Young drivers missed
fewer events on second
day, whereas middle aged drivers missed more
- -
Page 116
Chapter4: Data Analysis and Results
Page 96
4-5-2 Practice Effect for Lane Changing Manoeuvre All detailed results for locations 1 and 4 are presented in Appendix 6, section A6-3 and A6-4,
and a summary of the significant results is shown in Table 22 below. It is evident that practice has
an effect based on gender and age groups. Young drivers tended to drive faster on the second day,
whereas their middle aged counterparts preferred to drive slower in the baseline scenario. One
interpretation could be that drivers felt more confident in driving in the advanced driving
simulator, and thus they decreased their speed less on the second day. Male drivers also drove
faster on the second day when they were interacting with the eco-driving system, whereas their
female counterparts were slower. Males had more standard deviation of lateral shift on the second
day, which suggests that they felt more comfortable in interacting with CD changing on the
second day. Practice also showed a positive effect on steering wheel control in the CD changing
scenario. Young drivers had fewer responses to detecting red dots in comparison with their
middle aged counterparts in the baseline scenario. However, in the navigation scenario, opposite
results were found between young and middle aged drivers in two locations. Female drivers
were also more accurate in responding to events in the CD changing scenario. Moreover, missed
response count comparison strongly suggested that, in general, practice produces better event
detecting skills for all scenarios, as drivers had lower missed response counts on the second day.
Page 117
Chapter4: Data Analysis and Results
Page 97
Table 21: Summary of significant results, lane-changing, practice effect
Location 1 Baseline
Eco-driving
Navigation CD changing
Minimum speed (overall) Young drivers were faster on second day, whereas
middle aged drivers drove slightly more slowly on
second day
Male drivers were faster on second day, whereas
female drivers drove more slowly on second
day
- -
By age group
- - - -
By gender - - -
Standard deviation of lateral
shift
- - - -
Steering wheel angle
- - - -
Peripheral detection task –
Wrong responses
- - - -
By age group
Young participants had
fewer wrong responses than middle aged
participants
- Young participants had
fewer wrong responses than middle aged
participants
-
By gender
- - - -
Peripheral detection task –
Missed responses
- Drivers missed fewer events on second day
Drivers missed fewer events on second day
Drivers missed fewer events on second day
Location 4 Baseline
Eco-driving
Navigation CD changing
Minimum speed
- - - -
Standard deviation of lateral
shift
- - - Males had more lateral shift on second day,
whereas females had less
lateral shift on second day
Steering wheel angle - - - Practice improved
steering wheel control on
second day
Peripheral detection task –
Wrong responses
- - Middle aged drivers were better at not
missing events than
young drivers
By age group
Young drivers were better at not missing events than
middle aged drivers
- - -
By gender
- - - Males responded incorrectly to the events
more often than females
Peripheral detection task
– Missed responses
Drivers missed more
events on first day
- - Drivers missed more
events on first day
By age group
- - - -
By gender
- - - Males missed more
events than female
4-5-3 Practice Effect for Overtaking Manoeuvre All detailed results for locations 5 and 10 are presented in Appendix 6, section A6-5 and A6-
10, and a summary of the significant results in shown in Table 23 below. In location 10, female
drivers tended to drive faster on the second day, whereas male drivers drove almost the same on
both days. Drivers had more lateral shift on the second day of the baseline scenario at location 5.
Apparently, drivers again felt more confident in the advanced driver simulator in the baseline
Page 118
Chapter4: Data Analysis and Results
Page 98
scenario. There are also a few individual differences in lateral shift at location 5. Middle aged
drivers had less lateral shift on the second day in the eco-driving scenario. Young drivers also had
less lateral shift in both the navigation and CD changing scenarios. At location 10, middle aged
drivers had better steering wheel control, whereas young drivers’ steering wheel angle changed
more on the second day for the baseline scenario. Similarly, experienced drivers had better
steering wheel control on the second day, whereas inexperienced drivers had more steering wheel
angle changes on the second day for the eco-driving scenario at location 5. In both locations,
female participants missed fewer events in on the second day in comparison with their male
counterparts. It was also shown that practice had a positive effect on drivers’ missed response
counts in the navigation scenario at location 5. Furthermore, female drivers missed fewer events
on the second day, whereas male drivers missed the same number of events on both days in the
CD changing scenario.
Table 22: Summary of significant results, overtaking, practice effect Location 5 Baseline
Eco-driving
Navigation CD changing
Minimum speed (overall) - - - -
Lateral shift Drivers had more lateral shift
on second day
- - -
By age group
- Middle aged drivers had less
lateral shift
Young drivers had less
lateral shift
Young drivers had less
lateral shift
By gender - - - -
Standard deviation of steering
wheel angle
- Young drivers had more
steering wheel angle changes
on second day, whereas
middle aged drivers were
better in steering wheel
control on second day
- -
Peripheral detection task – Missed
responses
- - Drivers missed fewer
events on second day
-
By age group
- - - -
By gender
- Females missed fewer events
on second day
- -
Location 10 Baseline
Eco-driving
Navigation CD changing
Minimum speed
Females drove faster on second
day, whereas males drove
almost the same on both days
- - -
Lateral shift - - - -
Standard deviation of steering
wheel angle
Young drivers had more
steering wheel angle changes
on second day, whereas middle
aged drivers were better in
steering wheel control on the
second day
- - -
Peripheral detection task
– Missed responses
- - - Female drivers missed
fewer events on second
day, whereas male drivers
missed the same number as
first day
By age group
- - - -
By gender
- Female drivers missed fewer
events in comparison with
male drivers
- -
Page 119
Chapter4: Data Analysis and Results
Page 99
4-5-4 Practice Effect for Braking for Intersections Manoeuvre All detailed results for locations 3 and 8 are presented in Appendix 6, section A6-7 and A5-8,
and a summary of the significant results is shown in Table 24 below. Middle aged (experienced)
drivers were better in steering wheel control than their younger counterparts the in baseline
scenario at location 3. Missed response count decreased on the second day for the navigation
system at location 3. In addition, females missed more events on the second day, whereas male
participants missed fewer events on the second day for the CD changing scenario at location 8.
Table 23: Summary of significant results, intersection, practice effect Location 3 Baseline
Eco-driving
Navigation CD changing
Standard deviation of lateral
shift
- - - -
By age group
- - - -
By gender - - - -
Steering wheel angle
- - - -
By age group
Middle aged drivers were
better in steering wheel control than younger
drivers
- - -
By gender - - - -
Peripheral detection task –
Missed responses
- - Drivers missed fewer events on the second day
-
By age group
- - - -
By gender
- - - -
Location 8 Baseline
Eco-driving
Navigation CD changing
Standard deviation of lateral
shift
- - - -
By age group
- - - -
By gender
- - - -
Steering wheel angle - - - -
By age group
- - - -
By gender
- - - -
Peripheral detection task
– Missed responses
- - - Females missed more event on the second day, whereas
males missed fewer events
on second day
By age group
- - - -
By gender
- - - -
Page 120
Chapter4: Data Analysis and Results
Page 100
4-5-5 Practice Effect for Braking for Roundabouts Manoeuvre All detailed results for locations 5 and 10 are presented in Appendix 6, section A6-9 and A6-
10, and a summary of the significant results is shown in Table 25 below. At roundabouts,
participants tended to drive faster on the second day for one of the locations for the baseline,
navigation and CD changing scenarios, which means they felt that these in-vehicle activities were
less distracting on the second day. In addition, at the first location of the eco-driving scenario,
young drivers drove faster than middle aged drivers and female drivers drove faster than male
drivers on the second day. At both locations, drivers missed fewer events on the second day for
baseline scenarios. In addition, at location 7, drivers missed fewer events on the second day for
the navigation scenario. There were also individual differences in missed response counts for
braking at roundabouts. Young drivers missed more events than their middle aged counterparts
on the second day at location 7. In addition, female drivers were more accurate on the second day
of the eco-driving scenario. Acceleration rate for the braking task also showed that drivers
decelerated more on the second day for the baseline scenario (location 6) and for the navigation
scenario (location 7). Middle aged drivers also decelerated more on the second day for the
navigation scenario at location 6. Furthermore, gender difference is evident in the navigation
scenario at location 6, as female drivers braked harder than their male counterparts.
Page 121
Chapter4: Data Analysis and Results
Page 101
Table 24: Summary of significant results, braking at roundabouts, practice effect Location 6 Baseline
Eco-driving
Navigation CD changing
Speed Drivers drove faster on second day
- - -
By age group
- Young drivers drove faster than middle aged
drivers
- -
By gender - Females drove faster than males
- -
Peripheral detection task –
Missed responses
Drivers missed fewer
events on second day
- - -
By age group
- - - -
By gender
- Males missed more
events than females
- -
Acceleration Acceleration rate was more
on second day
Middle aged drivers
braked more severely on second day,
whereas, young
drivers used same brake acceleration
-
By age group
- - - -
By gender
- - Females braked more severely than males
-
Location 7 Baseline
Eco-driving
Navigation CD changing
Speed - - Participants drove faster on second day
Participants drove faster on second day
Peripheral detection task
– Missed responses
Drivers missed fewer
events on second day
- Drivers missed fewer
events on second day
-
By age group
Younger drivers missed
more events than middle aged drivers
- - -
By gender
- - - -
Acceleration - - Acceleration rate was more on second day
-
4-5-6 Summary Results of Practice Effect on Driving Measures Based on Type of
Manoeuvre All detailed analysis of practice effect on ten different locations is presented in Appendix 6.
One interesting finding is that male and female drivers had the same significant differences as
young and middle aged drivers in many aspects of their driving performance, as shown by a
between factor analysis for practice effect. Young drivers tended to drive faster on the second
day. However, middle aged drivers preferred to decrease their speed. Similarly, male drivers went
faster and female drivers drove more slowly on the second day. In general, young drivers’
abilities to control lateral shift improved, but middle aged drivers’ lateral control worsened. Age
and gender difference needs to be investigated in future studies with an appropriate sample size.
4-6- Manoeuvres Comparison Based on Distraction Measures (first day)
Page 122
Chapter4: Data Analysis and Results
Page 102
In this section, different manoeuvres have been compared using appropriate measures
included in the study. The manoeuvres have been divided into two groups: lane changing and
overtaking manoeuvres, which were compared with no particular manoeuvre; and braking for
roundabouts and intersections were compared to each other. The main aim of these comparisons
was to find out the most distracting manoeuvres among each group of manoeuvres. Mean
minimum speed and missed response count were used for comparing lane changing and
overtaking manoeuvres with no particular manoeuvre. These two measures seem the most
relevant to the purpose of this section. Minimum speed was chosen because, in general,
distracting tasks tend to decrease drivers’ speed. Therefore, less speed means more distraction.
Similarly, missed response counts have shown to be a sensitive measure in distracting activities at
a particular location.
In order to compare a benchmark location with other locations, univariate analysis was
applied using SPSS 18.
4-6-1- Straight, Lane Changing and Overtaking Manoeuvres
a) Minimum mean speed
Baseline Table 26 below shows means and standard deviations of minimum mean speed for all
locations. Minimum mean speed is chosen because it is the most appropriate measure of speed in
the study, as drivers were instructed to keep the speed limit (80 kilometre per hour), and a
decrease in speed means driver performance increment. Pair-wise comparison shows that these
three locations were significantly different from each other in mean minimum speeds, F(5,126) =
51.577, p < .05, = .672, OP = 1.000.
Table 25: Descriptive statistics of Minimum speed for baseline scenario
Location Mean Std. Deviation N
Lane changing 1 70.5837763 6.99350089 22
Straight 1 77.2866325 2.30916322 22
Lane changing 2 66.0694075 6.60804826 22
Overtaking 1 48.7794574 11.53566949 22
Straight 2 74.2319922 5.80465228 22
Overtaking 2 59.2571279 4.58610063 22
Total 66.0347323 11.81268687 132
Pair-wise comparisons in Table 27 below revealed more details about locations which were
significantly different from the baseline location (driving on straight section of road in location
1).
Page 123
Chapter4: Data Analysis and Results
Page 103
Table 26: Pair-wise comparisons of minimum speed for baseline scenario
(I) Location (J) Location
Mean Difference
(I-J)
Std.
Error Sig.
95% Confidence Interval for
Differences
Lower
Bound Upper Bound
Straight 1 Lane changing 1 6.703 2.081 .024 .477 12.928
Lane changing 2 11.217 2.081 .000 4.992 17.443
Overtaking 1 28.507 2.081 .000 22.282 34.733
Straight 2 3.055 2.081 1.000 -3.171 9.280
Overtaking 2 18.030 2.081 .000 11.804 24.255
Figure 28: Minimum speeds in all in-motion manoeuvres in baseline scenario
The results show that all distracting activities were caused a decrease in speed. However, the
speed reduction was more for overtaking manoeuvres and less for lane changing manoeuvres in
baseline scenario.
Eco-driving The Table 28 below shows means and standard deviations of minimum mean speed for all
locations. Results show that locations were significantly different in mean minimum speeds,
F(5,126) = 42.814, p < .05, = .629, OP = 1.000.
Page 124
Chapter4: Data Analysis and Results
Page 104
Table 27: Descriptive statistics of Minimum speed for in-motion locations in eco-driving scenario
Location Mean Std. Deviation N
Lane changing 1 69.3590582 8.89255747 22
Straight1 75.8345160 4.12030990 22
Lane changing 2 64.9583792 7.60773753 22
Overtaking 1 49.9410144 3.69092482 22
Straight 2 72.1080736 7.59253299 22
Overtaking 2 60.0001961 6.69336081 22
Total 65.3668729 10.80831450 132
Pair-wise comparison in Table 29 revealed that location no 1 (straight) was significantly
different from all other locations expect location straight no 2. The results are the same as for the
baseline scenario. In other words, when participants were engaging the eco-driving task, they
were driving faster in the baseline manoeuvre (straight) than in the overtaking or lane changing
manoeuvres.
Table 28: Pair-wise comparisons of Minimum speed for in-motion locations in eco-driving scenario
(I)
location (J) location
Mean Difference (I-
J)
Std.
Error Sig.
95% Confidence
Interval for Differences
Lower
Bound Upper Bound
Straight 1 Lane changing 1 6.475 2.023 .026 .423 12.528
Lane changing 2 10.876 2.023 .000 4.824 16.928
Overtaking 1 25.894 2.023 .000 19.841 31.946
Straight 2 3.726 2.023 1.000 -2.326 9.778
Overtaking 2 15.834 2.023 .000 9.782 21.886
Page 125
Chapter4: Data Analysis and Results
Page 105
Figure 29: Minimum speed for in-motion manoeuvres in eco- driving scenario
Similar to the baseline scenario, the results show that all distracting activities caused a
decrease in speed. However, the speed reduction was more for overtaking manoeuvres and less
for lane changing manoeuvres in the eco-driving scenario.
Navigation system Table 30 below shows means and standard deviations of minimum mean speeds for all
locations. Results show that locations were significantly different in mean minimum speeds,
F(5,126) = 8.385, p < .05, p2 = .250, OP = 1.000.
Table 29: Descriptive statistics of Minimum speed for navigation scenario
Location Mean Std. Deviation N
Lane changing 1 63.9706243 15.90392773 22
Straight 1 72.7981556 16.91086140 22
Lane changing 2 63.4622672 11.55756957 22
Overtaking 1 52.0250083 8.09912097 22
Straight 2 70.9640840 7.54319968 22
Overtaking 2 60.9443341 9.12322245 22
Total 64.0274123 13.69766926 132
Pair-wise comparison in Table 31 reveals more details about the differences. It shows that
minimum speed in overtaking manoeuvres while interacting with the navigation system was
significantly lower when compared to driving at the straight line location (location 1). In other
Page 126
Chapter4: Data Analysis and Results
Page 106
words, overtaking tasks were demanding to the extent that participants had to reduce their speed
more in order to execute a safe manoeuvre.
Table 30: Pair-wise comparisons of Minimum speed for navigation scenario
(I)
location (J) location
Mean Difference
(I-J)
Std.
Error Sig.
95% Confidence Interval
for Differences
Lower
Bound Upper Bound
Straight 1 Lane changing 1 8.828 3.648 .254 -2.087 19.742
Lane changing 2 9.336 3.648 .175 -1.579 20.251
Overtaking 1 20.773 3.648 .000 9.858 31.688
Straight 2 1.834 3.648 1.000 -9.081 12.749
Overtaking 2 11.854 3.648 .022 .939 22.769
Figure 30: Minimum speed of in-motion manoeuvres in navigation scenario
The results show that overtaking and being distracted were caused the most decrease in speed.
However, the speed reduction was not significant for other manoeuvres in navigation scenario in
comparison with first baseline manoeuvre.
Page 127
Chapter4: Data Analysis and Results
Page 107
CD changing The Table 32 below shows means and standard deviations of minimum mean speeds for all
locations. Results show that locations were significantly different in mean minimum speeds,
F(5,126) = 20.345, p < .05, p2 = .447, OP = 1.00.
Table 31: Descriptive statistics of Min speed for CD changing scenario
Location Mean Std. Deviation N
Lane changing 1 65.8152587 10.46370618 22
Straight 1 71.1049571 7.84425827 22
Lane changing 2 61.7552736 7.85713871 22
Overtaking 1 49.8837023 4.50549718 22
Straight 2 68.6746795 6.94302006 22
Overtaking 2 63.6207461 7.74790993 22
Total 63.4757696 10.23115167 132
Pair-wise comparison in Table 33 revealed more details about the differences. It shows that
minimum speed in overtaking manoeuvres while interacting with the CD player was significantly
lower than for the same task of just driving in straight line location (location 1).
Table 32: Pair-wise comparisons of Minimum speed for CD changing scenario
(I) location (J) location
Mean Difference
(I-J)
Std.
Error Sig.
95% Confidence
Interval for Differences
Lower
Bound
Upper
Bound
Straight 1 Lane changing 1 5.290 2.340 .382 -1.711 12.290
Lane changing 2 9.350 2.340 .002 2.349 16.350
Overtaking 1 21.221 2.340 .000 14.220 28.222
Straight 2 2.430 2.340 1.000 -4.571 9.431
Overtaking 2 7.484 2.340 .026 .483 14.485
Page 128
Chapter4: Data Analysis and Results
Page 108
Figure 31: Minimum speed of in-motion manoeuvres in CD changing scenario
Similar to the navigation scenario, the results show that overtaking and being distracted were
caused the greatest decrease in speed. However, lane changing manoeuvres at location 2 were
also significantly different in mean minimum speed with driving straight at location 1.
b) Missed response count
Baseline Table 34 below shows means and standard deviations of MRCs for all locations. Results show
significant differences across locations, F(5,126) = 5.840, p < .05, p2 = .188, OP = .993.
Table 33: Descriptive statistics of MRC for baseline scenario
Location Mean Std. Deviation N
Lane changing1 .50 .673 22
Straight 1 .27 .456 22
Lane changing 2 1.09 .921 22
Overtaking 1 .86 .710 22
Straight 2 .77 .612 22
Overtaking 2 1.32 .945 22
Total .80 .805 132
Pair-wise comparison in Table 35 demonstrated the significant differences between one of the
lane changing and one of the overtaking manoeuvres. Therefore, in general, it can be argued that
Page 129
Chapter4: Data Analysis and Results
Page 109
drivers were mentally more distracted when they were executing overtaking and lane changing
manoeuvres than just driving on a straight section of road.
Table 34: Pair-wise comparisons of MRC for baseline scenario
(I) location (J) location
Mean Difference
(I-J) Std. Error Sig.
95% Confidence Interval for
Differences
Lower Bound Upper Bound
Straight 1 Lane changing 1 -.227 .223 1.000 -.894 .440
Lane changing 2 -.818 .223 .005 -1.485 -.151
Overtaking 1 -.591 .223 .136 -1.258 .076
Straight 2 -.500 .223 .400 -1.167 .167
Overtaking 2 -1.045 .223 .000 -1.713 -.378
Figure 32: MRCs of in-motion manoeuvres in baseline scenario
Eco-driving Table 36 below shows means and standard deviations of MRCs for all locations in the eco-
driving scenario. Results show significant differences across locations, F(5,126) = 4.742, p < .05,
p2 = .158, OP = .974.
Table 35: Descriptive statistics of MRC for eco-driving scenario
Location Mean Std. Deviation N
Lane changing 1 1.18 .958 22
Straight 1 .55 .596 22
Lane changing 2 1.41 1.182 22
Overtaking 1 1.23 .612 22
Straight 2 .73 .827 22
Overtaking 2 1.64 1.002 22
Total 1.12 .949 132
Page 130
Chapter4: Data Analysis and Results
Page 110
Pair-wise comparison in Table 37 shows significant differences between just driving straight
and both the overtaking and the lane changing scenarios.
Table 36: Pair-wise comparisons of MRC for eco-driving scenario
(I)
location (J) location
Mean Difference
(I-J)
Std.
Error Sig.
95% Confidence Interval
for Difference
Lower
Bound Upper Bound
Straight 1 Lane changing 1 -.636 .268 .285 -1.438 .165
Lane changing 2 -.864 .268 .024 -1.665 -.062
Overtaking 1 -.682 .268 .181 -1.483 .119
Straight 2 -.182 .268 1.000 -.983 .619
Overtaking 2 -1.091 .268 .001 -1.892 -.290
Figure 33: MRCs of in-motion manoeuvres in eco-driving scenario
Navigation system Table 38 below shows means and standard deviations of MRCs for all locations. Results show
significant differences across locations, F(5,125) = 3.718, p < .05, p2 = .129, OP = .924.
Page 131
Chapter4: Data Analysis and Results
Page 111
Table 37: Descriptive statistics of MRC for navigation scenario
Location Mean Std. Deviation N
Lane changing 1 2.36 1.329 22
Straight 1 1.27 .985 22
Lane changing 2 2.09 1.192 22
Overtaking 1 2.10 1.136 21
Straight 2 1.32 1.086 22
Overtaking 2 1.91 .684 22
Total 1.84 1.142 131
However, just one of the lane changing manoeuvres (location 1) was significantly different
compared with the baseline manoeuvre (straight 1) in the CD changing task (Table 39).
Table 38: Pair-wise comparisons of MRC for navigation scenario
(I)
location (J) location
Mean Difference
(I-J)
Std.
Error Sig.
95% Confidence Interval
for Differences
Lower
Bound Upper Bound
Straight 1 Lane changing 1 -1.091 .328 .017 -2.072 -.110
Lane changing 2 -.818 .328 .208 -1.799 .163
Overtaking 1 -.823 .332 .217 -1.815 .170
Straight 2 -.045 .328 1.000 -1.026 .935
Overtaking 2 -.636 .328 .816 -1.617 .344
Figure 34: MRCs of in-motion manoeuvres in navigation scenario
CD changing
Page 132
Chapter4: Data Analysis and Results
Page 112
Table 40 below shows means and standard deviations of MRCs for all locations in the CD
changing scenario. Results show significant differences across locations, F(5,126) = 3.077, p <
.05, p2 = .109, OP = .825.
Table 39: Descriptive statistics of MRC for CD changing scenario
Location Mean Std. Deviation N
Lane changing 1 2.18 1.332 22
Straight 1 1.09 .971 22
Lane changing 2 2.05 1.214 22
Overtaking 1 1.86 1.207 22
Straight 2 1.27 1.202 22
Overtaking 2 1.82 1.006 22
Total 1.71 1.208 132
A pair-wise comparison shows that just one of the lane changing tasks was significantly
different compared with the baseline manoeuvre (driving straight in location 2).
Table 40: Pair-wise comparisons of MRC for CD changing scenario3
(I) location (J) location
Mean Difference
(I-J)
Std.
Error Sig.
95% Confidence Interval for
Differences
Lower
Bound Upper Bound
Straight 1 Lane changing 1 -1.091 .351 .034 -2.140 -.042
Lane changing 2 -.955 .351 .111 -2.003 .094
Overtaking 1 -.773 .351 .439 -1.821 .276
Straight 2 -.182 .351 1.000 -1.231 .867
Overtaking 2 -.727 .351 .600 -1.776 .321
Page 133
Chapter4: Data Analysis and Results
Page 113
Figure 35: MRCs of in move manoeuvres in CD changing scenario
Table 42 below shows a summary of all significant results in different scenarios. Mean
minimum speed decreased in overtaking manoeuvres more than any other manoeuvres across all
scenarios. On the other hands, overtaking manoeuvres demanded more of drivers’ attention while
conducting distracting activities. However, missed response count measures in lane changing
manoeuvres resulted in more significant differences with baseline manoeuvres at location 2.
Table 41: Summary of significant results in comparisons between all manoeuvres and first straight
driving at location
Measure Scenario Lane
changing 1
Lane
changing 2
Overtaking
1
Straight
2
Overtaking
2
Mean
minimum
speed
Baseline
scenario
Sig. Sig. Sig. - Sig.
Eco driving
scenario
Sig. Sig. Sig. - Sig.
Navigation
scenario
- - Sig. - Sig.
CD changing
scenario
- Sig. Sig. - Sig.
Missed
response
counts
Baseline
scenario
- Sig. - - Sig.
Eco driving
scenario
- Sig. - - Sig.
Navigation
scenario
Sig. - - - -
CD changing
scenario
Sig. - - - -
Page 134
Chapter4: Data Analysis and Results
Page 114
4-6-2- Intersections and Roundabouts
a) Missed response counts
Baseline The results show significant differences between different locations in drivers MRCs, F(3, 84)
= 7.988, p < .05, p2 = .222, OP = .988. Pair-wise comparison is shown below in Table 43.
It reveals that participants generally had fewer missed responses at intersections than at
roundabouts when they were not involved in any in-vehicle interaction. The relevant results are
not always statistically significant.
Table 42: Pair-wise comparisons of MRC for baseline scenario (intersections and roundabouts)
(I) location (J) location
Mean
Difference (I-J) Std. Error Sig.
95% Confidence Interval for
Differences
Lower Bound Upper Bound
Intersection 1 Roundabout 1 -.955* .211 .000 -1.525 -.384
Roundabout 2 -.409 .211 .337 -.980 .162
Intersection 2 -.136 .211 1.000 -.707 .434
Roundabout 1 Intersection 1 .955* .211 .000 .384 1.525
Roundabout 2 .545 .211 .069 -.025 1.116
Intersection 2 .818* .211 .001 .247 1.389
Roundabout 2 Intersection 1 .409 .211 .337 -.162 .980
Roundabout 1 -.545 .211 .069 -1.116 .025
Intersection 2 .273 .211 1.000 -.298 .844
Intersection 2 Intersection 1 .136 .211 1.000 -.434 .707
Roundabout 1 -.818* .211 .001 -1.389 -.247
Roundabout 2 -.273 .211 1.000 -.844 .298
Figure 36: MRCs of intersections and roundabouts in baseline scenarios
Page 135
Chapter4: Data Analysis and Results
Page 115
Generally speaking, participants missed more events at roundabouts than intersections.
Eco-driving No significant differences between different locations in drivers’ MRCs, F(3, 84) = .841, p =
.475, p2 = .029, OP = .226, were found when drivers were using the eco-driving system.
Navigation system No significant differences between different locations in drivers’ MRCs, F (3, 84) = 2.006, p
= .119, p2 = .067, OP = .499, were found when drivers were using the navigation system.
CD Changing No significant differences between different locations in drivers’ MRCs, F(3, 84) = .358, p =
.783, p2=.013, OP = .118, found when drivers were using CD player.
It is interesting that differences in the baseline conditions did not hold in the other scenarios.
As it was observed before, this might be because of order of the baseline scenario in the study.
Page 136
Page 116
Chapter 5 - Discussion and Conclusions
Page 137
Chapter5: Discussion and Conclusions
Page 117
5-1- Summary In this study, distractions caused by three different in-vehicle systems were compared to a
baseline condition without distraction. The CARRS-Q advanced driving simulator was used to
simulate a safe and controlled driving environment. A road network was created using a module
in the simulator software. All necessary signs and markings were designed to guide drivers in the
network. Drivers were asked to execute four different manoeuvres, including lane changing,
stopping for a controlled intersection, overtaking, and braking for a roundabout, using instruction
signs which were installed in eight locations (two for each manoeuvre). There was also a driving
task on a straight section of roadway (baseline manoeuvre) at two locations.
Three distraction tasks were included in the study. One was an eco-driving message, which
was a simple message that informed drivers on their driving habits in terms of fuel efficiency.
The message was sent to participants using a communication system designed using a PDA
application, simulation software (SCANeR), and RTMaps synchronisation software. The PDA
was always mounted in the same position on the front screen windshield. The second distracting
activity was to enter a five-digit number in the PDA as a surrogate of a simple task of using a
navigation GPS system. The last task was to change CDs at exactly the same locations where two
previous distracting activities had been initiated. The four scenarios were conducted in random
order (except the baseline scenario was always first in order).
Relevant demographic information was collected before starting the driving tasks. Three
groups of data were gathered. Drivers’ subjective mental workload was collected using the
Driving Activity Load Index (DALI) questionnaire. Drivers’ objective performance was recorded
using simulation software and a scripted program, i.e., driving speed, lateral lane shift, and
steering wheel control measures. In order to measure mental workload of drivers in each of the
scenarios at every location, event detection ability of participants was measured in a Peripheral
Detection Task (PDT) by programming the appearance of red dots on the front screen.
Twenty-two participants were recruited from the QUT university student body and from the
Brisbane public. As an exploratory analysis of individual differences, age group (young and
middle aged) and gender differences were measured in the study. The participants’ age and
driving experience (drivers’ travelled kilometre per annum) were considered in order to diminish
age-experience interaction and to properly distinguish between young, inexperienced participants
and middle-aged, experienced drivers.
5-1- Thesis Outcomes Based on Research Questions
Page 138
Chapter5: Discussion and Conclusions
Page 118
The main aim of the study was to examine distraction effects of an eco-driving system on
drivers’ workload and performance. To achieve this goal, the level of distraction caused by two
other in-vehicle tasks, including changing CDs in a CD player and entering a five-digit number in
a PDA, were compared to reading an eco-driving message on the same PDA. It is important to
mention again that the current study has investigated an analogous of one type of eco-driving
system. Other systems may be different in many aspects, such as the eco-driving message
algorithm, spatial location in the vehicle, and so on. Therefore, the study focus was on Human
Machine Interface (HMI) tasks with demands analogous to some eco-driving, navigation systems,
and CD changing tasks. Moreover, the nature of distraction was not meant to be equal. Eco-
driving was a visual/cognitive task. The navigation system was a visual/manual task. The CD
changing task was also mainly a visual/manual/vocal task.
This study was designed to contribute to a better understanding of the level of distraction
caused by all of these three in-vehicle systems and how they may affect driver behaviour. In the
discussion section, the research questions have been answered according to the results of the
study in previous chapters.
5-1-1- Does the Use of an Eco-driving System Distract Drivers in a Driving
Simulator more than Two Other In-Vehicle Activities? Participants rated mental workload as significantly less in the baseline scenario compared
with the navigation system and CD changing scenarios. However, the eco-driving system was not
significantly different from the baseline scenario. This suggests that eco-driving messages did not
increase drivers’ mental workload over the network as a whole. The eco-driving scenario was
also significantly different from the navigation scenario but not the CD changing task. Therefore,
there is evidence that the eco-driving system induced slightly less mental workload in comparison
to the CD changing task, but perhaps not as much as the navigation system. Nevertheless, missed
response count was significantly different between the eco-driving scenario and the baseline
scenario. Therefore, it appears that drivers’ mental workload in the eco-driving scenario was
higher than in the baseline scenario, but the same was not found for the CD changing and
navigation tasks. In other words, the eco-driving scenario was less mentally demanding than the
two other distracting scenarios. The significant finding in the missed response counts for eco-
driving could indicate that the eco-driving task distracted drivers more visually than mentally.
Engaging in reading the message requires drivers to take their eyes off the road, and therefore to
miss events. However, it was not mentally as distracting as other in-vehicle systems. This might
be accounted for by the observation that drivers did not engage enough in reading and
Page 139
Chapter5: Discussion and Conclusions
Page 119
comprehending the eco-message message. This result is consistent with a previous study by
Birrell and Young (2009), who reviewed two prototype designs and examined driver distraction
through driver workload. Their results showed that real time smart driving did not increase driver
workload. Moreover, while the tasks differed in the kinds of demand they imposed, irrespective
of whether they were about eco-driving, navigation, etc., the less active nature of the demands of
eco-driving were shown by the research, but demonstrated only modest effects on distraction.
Despite the partial weak support for distracting effects of eco-driving, strong evidence of
distraction was found in the CD changing and navigation system scenarios in comparison with
baseline scenarios. Both scenarios were found to degrade steering wheel control more than the
eco-driving system scenario. Observation of drivers struggling to change CDs and enter the
numbers in the navigation system supports the idea that CD changing and using a navigation
system while a vehicle is in motion are much more physically demanding than an eco-driving
scenario.
It is believed that cognitive distraction degrades drivers’ performance much less than visual
distraction (Ranney, 2008). In addition, visual distraction causes mostly decrements in drivers’
steering wheel control and lateral position control, whereas cognitive distraction has an effect on
longitudinal vehicle control (Ranney, 2008). Therefore, it could be concluded that participants in
the current study did not cognitively engage in the eco-driving message as the study predicted,
and if they had, it would have resulted in a greater degree of driving performance decrements. In
addition, due to generally good speed control in all scenarios, it can be argued that cognitive
distraction level in all scenarios (including eco-driving) was low because there is anecdotal
evidence that when drivers’ cognitive mental workload increases up to a certain level, drivers’
ability in lateral control improves (Ranney, 2008).
From the perspective of Wickens’ Multiple Resource Theory Model, CD changing and
navigation scenarios both have visual and manual demands. However, the eco-driving scenario
has visual/cognitive demand. The main difference between scenarios is their manual demand, and
because this competes with one of the main tasks of the driving task itself, it may affect drivers’
performance to a greater degree. To sum up, it appears that eco-driving is less distracting because
it is less manually distracting. However, as mentioned before it does not appear that drivers
engaged cognitively in the eco-driving system.
One application of the study results may be to provide support for the banning of both CD
changing and manually entering addresses while driving. Indeed, many previous studies have
shown that voice recognition tools in navigation systems can decrease drivers’ mental workload
significantly (Ranney, 2008; Tijerina et al., 1998; Young & Regan, 2007; Young et al., 2003).
Page 140
Chapter5: Discussion and Conclusions
Page 120
There is also some evidence that utilising voice-activation for CD players while driving could
minimise distraction (2001). These two tasks led to greater decrements in drivers’ lateral control
and event detection abilities. This suggests that drivers were more visually distracted than for the
baseline and eco-driving scenarios. Furthermore, the physical requirement of these tasks added to
the demands on drivers’ control abilities. These results are consistent with HASTE’s results
which suggested that visual distraction led to greater lateral deviation. Another similarity to
HASTE’s finding was that drivers did not show decrements in their speed in any of the scenarios,
presumably because cognitive demand was not high enough.
5-1-2- Is There a Practice Effect which Reduces the Level of Distraction under the
Study Circumstances? In the study, it has been shown that practice decreases participants’ mental workload in both
baseline and navigation scenarios for the entire network. However, it did not decrease driver
mental workload for eco-driving. Missed response count comparison over two days suggests that
both navigation and CD changing scenarios were less distracting on the second day. In other
words, drivers showed fewer mistakes in responding to events after practice. However, the same
significant results were not found for the eco-driving system scenario.
In general, it is probable that practice can mitigate distraction effects in tasks such as CD
changing and entering numbers in a navigation system, but it less likely to decrease in simpler
tasks, such as with an eco-driving distracter. Previously, Chisholm et al. (2008) also found that
multi-interaction tasks, such as a complex iPod task, harm drivers’ perception and response to
hazards and increase the frequency of collisions. Although practice reduced the extent of slow
responses to driving hazards somewhat, the decrement remained high relative to the baseline
condition. It is also possible that the tasks are less distracting on the second day because of task
learning rather than a decrease in the distracting effects of the task through practice. This is
consistent with Shinar, Tractinsky and Compton’s (2005) results. They believe that practice
involves a learning process for both the driving itself and the distraction task. In this study, the
road network was created in such a way that driver did not need to find their destination.
Furthermore a familiarisation session was held before the actual runs. This should have decreased
the likelihood of a task learning effect. However, simulator motion sickness apparently had an
effect on performance of drivers on first day and could have affected the practice results.
There are also limitations in the approach taken to the practice effect in the current study.
First of all, practice should be investigated a few times over period of time to consider the
variation of results over time. However, it was logistically impossible for the study to investigate
Page 141
Chapter5: Discussion and Conclusions
Page 121
the practice effect over more sessions (i.e. on 3 to 5 consecutive days) because of problems with
recruiting participants. This could have been addressed if it had been possible to offer a much
larger financial incentive.
Apart from evidence of practice effects on the entire network, there is also evidence of
practice effects and individual differences in practice effects for various manoeuvres. In the first
lane changing manoeuvre, individual differences were found for the practice effect. Recalling that
the lane changing manoeuvre was the first manoeuvre in all scenarios, it is worth noting that there
were subsequent gender differences in the eco-driving scenario for lane changing. In the eco-
driving scenario, male drivers also drove faster on the second day.
In general, in overtaking manoeuvres, as was found for driving on a straight section of road,
there is some evidence of age and gender effect on practice. Young and female drivers
demonstrated more confidence in engaging in in-vehicle activities and executing manoeuvres on
the second day, while middle-aged and male drivers tended to have the same style of driving on
the second day. In other words, it could be interpreted that male drivers were performing better
than female drivers when they were distracted. Middle-aged drivers (experienced drivers) were
also better than their younger counterparts in being exposed to distracting activities.
At intersections, there is some evidence of age differences in standard deviation of steering
wheel in the baseline scenario. Similarly, there is some evidence of gender differences in MRCs
in the CD changing scenario. MRCs also decreased with practice on the second day of the
navigation scenario.
At roundabouts, there were also differences between males and females, and also between
young and middle-aged drivers, in their performance on the second day.
Overall, one of the interesting findings is that similarly significant differences in many
aspects of driving performance were found between male and female drivers as between young
and middle-aged drivers, as shown by a between factor analysis for practice effect. Young drivers
tended to drive faster on the second day. However, middle-aged drivers preferred to decrease
their speed. Similarly, male drivers went faster and female drivers drove slower on the second
day. In general, young drivers’ abilities to control lateral shift became better, but middle-aged
drivers’ lateral control worsened. Male drivers also decelerated harder on the second day than
female drivers.
In conclusion, it has been found that a practice effect has implications for future research
using the simulator – that some degree of practice and familiarisation is needed, otherwise the
results are less likely to be valid. From the research, it is not possible to say how long this would
Page 142
Chapter5: Discussion and Conclusions
Page 122
be, and it also appears that it depends on the task – a task which is initially less demanding
appears to exhibit less of a practice effect.
5-1-3-Do the Systems Have an Effect on Driver Performance When Drivers Engage
in Particular Manoeuvres? Amount of attention demand can be determined by driving situations (i.e., road environment,
types of manoeuvre, drivers’ state, and weather condition). In particular, drivers’ information
processing and attentional resources can be different in various manoeuvres (Angell et al., 2007).
In some manoeuvres such as overtaking, the attentional needs are high (Gray & Regan, 2005).
Therefore, in order to evaluate the effect of driver distraction on driver performance, driver
performance at each of the locations in which a specific manoeuvre was executed should be
reviewed.
In lane changing manoeuvres, drivers’ missed response counts degraded when they engaged
in reading eco-driving messages at the first location. However, drivers’ event detection abilities
deteriorated less at the second lane changing location. Drivers’ vehicle longitudinal control and
lateral control were almost the same as in the baseline scenario, so visual and cognitive
distraction by the eco-driving message did not lead to significant deterioration in driver
performance. However, visual distraction by the eco-driving task was high enough to make
drivers to miss some of the events.
In baseline manoeuvres (just driving straight), participants’ mean minimum speed degraded
more in the CD changing scenario. It seems that the CD changing task had a greater effect on
drivers’ speed decrements. As mentioned before, this is due to high cognitive demand (Ranney,
2008). Drivers’ lateral position shifted more in both CD changing and navigation tasks in
comparison with both eco-driving and baseline scenarios, so they were more visually distracting.
On the other hand, in the baseline and eco-driving system scenarios, the vehicle lateral control
deteriorated less, so these scenarios were also less cognitively demanding. However, missed
response count data results show the eco-driving message did not deteriorate drivers’ event
detection ability. Apparently, participants were better in event detection in baseline manoeuvres
in comparison with other manoeuvres. In other words, driving situations can determine the
amount of cognitive demand (Angell et al., 2007), so the baseline manoeuvres (straight line) were
cognitively the simplest manoeuvres.
When approaching an intersection, the navigation task caused more events to be missed by
participants, whereas eco-driving messages seemed to make drivers less mentally distracted. The
results show no significant deterioration in drivers’ performance if they read eco-messages in
Page 143
Chapter5: Discussion and Conclusions
Page 123
their driving task in overtaking manoeuvres. This scenario was similar to the baseline scenario in
degrading driver performance.
The eco-driving message scenario was significantly less distracting than the navigation
system scenario (fewer MRCs) when participants commenced braking for roundabouts.
Therefore, they braked harder for roundabouts as compensatory behaviour in the navigation
scenario. This is consistent with results of a car-phone distraction study by Liu and Ozguner
(2007). The study results verified that decision making and car-phone communication together at
signalised intersections increases accident risk, and the distraction causes drivers to react later to
red lights and, therefore, as compensatory behaviour, drivers commence braking harder (Liu &
Ozguner). Overall the eco-driving system exhibited its greatest distraction effects for particular
manoeuvres, mostly decrements in event detections. However it did not have same effect in the
baseline condition. This suggests that drivers’ event detection abilities degraded when they were
engaged in manoeuvres and not while just driving without executing manoeuvres.
5-1-4- Are There any Differences between Young (Novice) and Middle-Aged
(Experienced) Drivers, or Between Male and Female Drivers when They Get
Distracted? There is anecdotal evidence that distracting activities can be influenced by an individual’s
age, experience, and gender (Regan et al., 2009). In the current study, young drivers (18-23) were
defined as having held a valid driver’s license for less than 3 years and having driven less than
10,000 kilometres per year, and middle-aged (25-66) drivers were asked to participate in the
study only if they had driven more than 10,000 kilometres per year and had held their driver’s
licence for more than 5 years. These requirements were set to prevent any unwanted confounding
effect due to interaction between participants’ age and experience in the study. Therefore,
younger drivers were inexperienced drivers, and middle-aged drivers were experienced drivers.
Novice/inexperienced drivers were also differentiated from middle-aged/experienced drivers as
described in the sections below.
It is also crucial to mention that due to unequal numbers of males and females, as well as
young and middle-aged participants, and small sample size, all results of individual differences
are exploratory and need further investigation.
5-1-4-1- Age Differences In lane changing manoeuvres, at the first location, there were significant differences between
young and middle-aged drivers in their minimum speeds, whereas, at the second lane changing
location, no significant results were found. One interpretation of the results could be that middle-
Page 144
Chapter5: Discussion and Conclusions
Page 124
aged drivers were more conservative than young drivers in interacting with an in-vehicle system
at their first lane changing location, which was also the first location where they were distracted.
However, they evidently felt more comfortable at the second lane changing location. This is
consistent with findings of other studies. Young drivers are prone to more risk taking and have
poorer judgment of risky behaviour (Turner & McClure, 2003). Therefore, they engage in more
risky behaviours and are more vulnerable in risky conditions. Young drivers also estimate risk of
distracting activities lower than older drivers’ estimations (Regan et al., 2009).
In baseline manoeuvres, MRC differences also demonstrated, despite age differences at the
first location, that there were no significant differences between young and middle-aged
participants at the second location. It could be concluded that young drivers showed improvement
in their responses to event detection at the second location. Previous studies have shown that
visual attention allocation for experienced drivers (29–44 years old) is better than visual attention
allocation in novice drivers (18–24 years old) (McCartt et al., 2006).
5-1-4-2- Gender Differences In baseline manoeuvres, similar to age differences, MRC differences demonstrated, despite
gender differences at the first location, that there were no significant differences at the second
location. Therefore, male drivers showed improvement in their responses to event detection at the
second location of baseline manoeuvres.
In addition, significant differences were found between male and female drivers in their
number of missed events when participants commenced braking for both roundabouts. In these
locations, females detected more red dots on the screen than males.
5-2- Summary and Implications This research confirmed that the eco-driving system presents a distraction risk for drivers,
although the risk is not as high as for tasks which involve manual as well as cognitive demands.
However, when drivers engaged in manoeuvres, it caused a decrease in drivers’ event detection
abilities. Therefore, in particular, eco-driving text messages should not be delivered to drivers
when they are executing manoeuvres.
The CD changing task had the greatest effect on speed control, whereas the navigation system
had the most effect on lateral control shift and steering wheel control. There were consistent with
other finding in the literature.
The evidence of a practice effect has implications for simulator-based research in general,
especially when performance on novel tasks is being compared with familiar tasks. The amount
Page 145
Chapter5: Discussion and Conclusions
Page 125
of practice needed to become familiar with the task will vary, and this presents methodological
challenges.
Apparently age and gender had an effect on the results of the study. Therefore, it is suggested
that future studies take these factors into account. Furthermore, further studies with a large
sample size need to be undertaken to find out more about these two factors.
Overall, the research questions, which had emerged from a review of the literature, proved to
be effective at highlighting areas of importance for current and future research and practice.
5-3- Limitations There are many points of strength in the study. First, driver distraction studies have mostly
been conducted using a fixed base driver simulator. The CARRS-Q advanced driver simulator
enables the investigation of driver distraction using state-of-the-art technology with a potentially
higher degree of fidelity in the study. A novel aspect of the research was that, driver distraction
was investigated for various manoeuvre options, which can facilitate a better understanding of
driver distraction in by manoeuvres. Another positive point in the study was that both distraction
in the entire network and distraction in specific locations were investigated. This provides better
understanding of driver distraction for all three in-vehicle systems. The eco-driving system was
compared with two other in-vehicle systems. The comparison has given an opportunity to
eliminate confounding factors that could potentially affect the results of the study, such as
simulator validity. Last but not least, the investigation of the practice effect was another
advantage of the study.
There are also limitations in the study. First of all, it is important to note that the study was
executed using three different in-vehicle systems in which all had their own characteristics. In
other words, they are not representative of all of these devices. There were also limitations in
manipulating the devices. In navigation, entering a five digit number is not the same as entering a
real address. The CD player location and CD changing task could be different in different
vehicles, and drivers may insert a few CDs in their CD players instead of ejecting a CD and
inserting another each time they want to change their CDs.
Because of familiarity of drivers with task occurrence order, they expected to be distracted at
particular locations and they also knew beforehand that they would be asked to execute the
manoeuvres at these locations. This raises the question of how much mental workload may have
been imposed on them if they had not expected to receive messages or if they had been reading
an eco-driving message and suddenly had to respond to an event. Despite eco-driving messages
apparently being less distracting, they could possibly endanger drivers in critical manoeuvres and
Page 146
Chapter5: Discussion and Conclusions
Page 126
locations. The study was not designed to answer this question. More studies are needed on the
issue.
A significant relationship was found between the motion sickness rating and missed response
counts. Similarly, there was a significant relationship between the motion sickness rating and the
DALI rating. Therefore, driving mental workload and performance seem to be affected by
simulator discomfort on the first day. This suggests that the setting for the CARRS-Q Advanced
Driving Simulator needs to be adjusted for future studies at least for driver distraction.
Another limitation of the study is that in the eco-driving task, perhaps drivers were
cognitively engaged with the message the first time they received the message (they read and
thought about the message, which changed their driving style), whereas, at other locations, they
may not have appreciated the implications of the messages or did not think about the meaning.
However, the main reason for sending messages to drivers while driving was to inform them
about their driving behaviour in terms of fuel efficiency and environmentally friendly behaviour.
Thus, in this case, the eco-driving messages were not intended to improve driving style, but were
rather just a reading task. Therefore, further study about the topic seems necessary.
Another important note that should be mentioned here is that in the eco-driving task,
sometimes participants delayed in reading the messages. They preferred to read them a little bit
later or to look at the message a few times to complete the task. It appears this is how participants
wanted to mitigate mental workload demand. This strategy was the same for the navigation and
CD changing scenarios. Therefore, drivers’ mitigation outputs were part of the study.
The baseline scenario was run before any other scenarios. Apparently, it affected drivers’
subjective and objective measures in the study. Therefore, if the baseline scenario had been a
random scenario like other scenarios in the study, it may have been found that eco-driving was
more distracting.
It was intended to investigate gender and age differences in the study. The participant
recruitment process was not as easy as expected. For unknown reasons, young and female people
appeared not to be willing to participate in the study, such that after a few months of recruitment
from various sources, only five females and six young drivers had participated. Exploratory
analysis showed individual differences did exist, but further research with larger samples is
required to confirm this.
Similarly, although many simulator studies have been conducted with a sample size less than
30, the power of some of the analyses was less than the 80 percent recommended in the literature.
One of the main reasons for recruitment problems could be number of days (two days) required to
participate in the study, as well as number of hours they had to spend in the simulator room (two
Page 147
Chapter5: Discussion and Conclusions
Page 127
hours). There were also limitations to access of the simulator rooms; in particular, no access was
available during weekends.
Finally, validity of an advanced simulator is an important aspect of every simulator study.
This study was the first study conducted using the CARRS-Q advanced driving simulator, and the
success of the simulator in faithfully representing performance on the road will need to be
establishes in future studies.
5-4- Future Work Interacting with other vehicles in medium- to high-traffic environments, and adding a more
realistic roadside environment, are recommended in future studies, as they increase mental
workload.
Online eco-driving feedback for drivers according to their real performance will help to send
an appropriate message to drivers, and they might be more interested in reading the message
consciously. The fact that participants were aware of where they would be distracted may have
changed their actual behaviour in the real world and should be considered in future studies.
As mentioned in the limitations of the study, there is a variety of different eco-driving
systems with different characteristics which need consideration in future research.
There is some evidence of individual differences in the study. Age and gender difference
needs to be investigated in future studies with an appropriate sample size.
It is important for future studies to investigate the practice effect over several consecutive
days or weeks, and not just once. The trend of changes in different distraction measures is an
interesting topic and needs further investigation. This may imply that drivers’ performance could
be improved by practice for some measures, but it may remain consistent or even worse for other
measures.
Distraction studies based on manoeuvres as well as distraction in an unexpected situation,
have attracted limited attention and need further study.
The validity of the CARRS-Q advanced driving simulator should also be investigated in
future studies on driver distraction.
Motion sickness found to have an effect on the results of the first day. Motion sickness needs
to be investigated in future in relation to its effect on drivers’ performance.
At a broader level, the rapid uptake of eco-driving systems raises the possibility that the social
benefits of reductions in emissions due to eco-driving might be outweighed by safety costs such
as distraction. The variation in distraction by manoeuvre implies that the determination of the
balance between costs and benefits is likely to be difficult to achieve. The existence of gender
Page 148
Chapter5: Discussion and Conclusions
Page 128
differences and age differences adds a further layer of complexity that merits exploration. Thus,
further studies are needed.
5-5- Contribution to Knowledge It is anticipated that this research will contribute to an understanding of the potential
distracting effects of an eco-driving system. Various types of eco-driving systems are currently
on the market. Some of them come already installed by the manufacturer and others come as
aftermarket products. However, there is little evidence of the safety of these devices. In
particular, some of them give drivers feedback in the form of text messages. This study can help
to improve future designs; for example, it is recommended that eco-driving text messages not be
sent to drivers when they are executing critical manoeuvres. This may result in sending these
messages off-line rather than on-line, or when vehicles are stationary. Previous studies on this
area are quite limited and have used ideal design conditions to locate the eco-driving system in
the vehicles and to design the eco-driving system. However, they do not consider the importance
of the location of distracting messages as well as studying text-messaging as a means of
delivering eco-driving messages. As an ultimate goal, the results of this research will assist in
development of ways to reduce crash injuries and fatalities due to the distracting effects of such
systems.
This study also contributes to the knowledge of the comparative degree of distraction caused
by three in-vehicle systems. All systems were distracting in different ways. The eco-driving
system degraded drivers’ abilities in detecting events. The CD changing and the Navigation tasks
could contribute to losing control of a vehicle in the worst case scenario. These in-vehicle
distracting activities deserve more attention from legislators and in driver distraction campaigns,
which tend to focus mainly on mobile phones.
In this project, the practice effect has also been evaluated, by examining whether distraction
by such devices reduces over time or not. For example, if there is a lower degree of distraction
after one day of practice, it would be worthwhile designing a training course to be undertaken
before using these new devices. Since people listen to music as an everyday task, and often they
need to change CDs to listen to another series of music while driving, changing CDs in the study
helps to provide a basis for comparison with eco-driving systems. The authors could not find
studies in a literature review on the distraction caused by a PDA when it is used as a navigation
system. Therefore, reviewing the distraction attributed to these devices will contribute to
examining distraction of it in comparison with two other in-vehicle systems.
Page 149
Chapter5: Discussion and Conclusions
Page 129
It was also found that driver motion sickness can decrease driving performance in advanced
driving simulator studies, and therefore this should be considered when such research is being
planned. The issue should also be investigated in more detail to establish the relationship between
driver motion sickness and driver performance in the context of driver distraction studies.
To sum up, this study addresses a gap in previous driver distraction studies and provides more
information on the distraction caused by various in-vehicle devices in comparison with each
other. In particular, an eco-driving system, a CD player and a PDA are elements that the research
has used to study the effects of distraction on driver work load and performance in a high fidelity
driving simulator.
Page 150
Page 130
Appendices
Page 151
Appendix 1
131
Appendix 1 : Motion Sickness Assessment Questionnaire (MSAQ)
Motion Sickness Assessment Questionnaire (MSAQ)
Adapted from Brooks et al. (2010)
Symptom severity
Item Symptom Not at all Severely
1. Sick to my stomach 0 1 2 3 4 5 6 7 8 9 10
2. Faint-like 0 1 2 3 4 5 6 7 8 9 10
3. Annoyed/irritated 0 1 2 3 4 5 6 7 8 9 10
4. Sweaty 0 1 2 3 4 5 6 7 8 9 10
5. Queasy 0 1 2 3 4 5 6 7 8 9 10
6. Lightheaded 0 1 2 3 4 5 6 7 8 9 10
7. Drowsy 0 1 2 3 4 5 6 7 8 9 10
8. Clammy/cold sweat 0 1 2 3 4 5 6 7 8 9 10
9. Disorientated 0 1 2 3 4 5 6 7 8 9 10
10. Tired/fatigued 0 1 2 3 4 5 6 7 8 9 10
11. Nauseated 0 1 2 3 4 5 6 7 8 9 10
12. Hot/warm 0 1 2 3 4 5 6 7 8 9 10
13. Dizzy 0 1 2 3 4 5 6 7 8 9 10
14. Like I am spinning 0 1 2 3 4 5 6 7 8 9 10
15. As if I might vomit 0 1 2 3 4 5 6 7 8 9 10
16. Uneasy 0 1 2 3 4 5 6 7 8 9 10
Page 152
Appendix 2
132
Appendix 2 : DALI (Driving Activity Load Index) Mental Workload Questionnaire
DALI Mental Workload Weighting
For each of the pairs listed below, circle the scale title that represents the more important contributor
to workload in the display.
Effort of attention demand
or
Visual demand
Effort of attention demand
or Auditory demand
Effort of attention demand
or
Temporal demand
Effort of attention demand
or Interference
Effort of attention demand
or
Situational stress
Visual demand
or Auditory demand
Visual demand
or
Temporal demand
Visual demand
or Interference
Visual demand
or
Situational stress
Auditory demand or Temporal demand
Auditory demand or Interference
Auditory demand or Situational stress
Temporal demand
or Interference
Temporal demand
or
Situational stress
Interference or Situational stress
Page 153
Appendix 2
133
DALI Mental Workload Rating Scale
Please place an “X” along each scale at the point that best indicates your experience with the display
configuration.
Effort of attention demand
How much effort of attention by the activity was required (to think about, to decide, to choose, to look
for and so on, etc.)?
Visual demand
How much visual demand was required for the activity?
Auditory demand
How much auditory demand was required for the activity?
Temporal demand
How much time pressure did you feel due to the rate or pace at which the tasks or task elements
occurred? Was the pace slow and leisurely or rapid and frantic?
Interference
How much possible disturbance did you receive when running the driving activity simultaneously
with any other supplementary task such as using navigation system, changing CD or obtaining eco-
driving messages, and so on?
Situational stress
How much level of constraints/stress such as fatigue, insecure feeling, irritation, and discouragement
and so on did you feel while conducting the activity?
Page 154
Appendix 3
134
Appendix 3 : Demographic questionnaire
We would like to know more about you and your driving background. Please answer each of the questions
below as accurately as you can.
Age:
Sex: Male Female
Education level:
Year of driver license issue:
How much do you approximately drive each year (kilometres)?
Less than 10,000 km per year More than 10,000 km per year
Do you use an eco-driving system (in-vehicle system which helps you to drive environmentally
friendly) in your car?
Yes No
How often do you change a CD in your CD player while driving?
Very often
Often
Seldom
Never
I don’t have CD player in my car.
How often have you previously utilised an in-vehicle navigation system while driving?
Very often
Often
Seldom
Never
Page 155
Appendix 4
135
Appendix 4 : Summary of Participants Response to Demographic Questionnaire No. Age Gender Education Number of
years holding
driver licence
Drive
more
than
10000
Eco-
driving
experience
CD
changing
frequency
usage
Navigation
frequency
usage
1 47 F PhD 29 Y No Seldom Never
2 31 F Honours
degree
12 Y No Never Never
3 31 M Postgraduate 13 Y No Seldom Seldom
4 22 M Bachelor 1 N No Never Seldom
5 43 F Postgraduate 17 Yes No Often Seldom
6 25 M Postgraduate 8 Yes No Often Seldom
7 19 M Uni student 3 N No Often Very often
8 20 M Uni student 1 N No Seldom Seldom
9 18 M Uni student 1 N No Never Seldom
10 25 M Year 12 7 Yes No Often Often
11 44 F PhD 27 Yes No Seldom Never
12 25 M Bachelor 9 Yes No Seldom Often
13 36 M PhD 17 Yes No Seldom Never
14 23 M Bachelor 6 N No Seldom Seldom
15 64 M Bachelor 47 Yes No Seldom Never
16 34 M Bachelor 23 Yes No Never Often
17 32 F Bachelor 15 Yes No Seldom Never
18 32 M PhD 15 Yes No Seldom Seldom
19 31 M Year 12 15 Yes No Never Often
20 18 M High school 3 N No Never Often
21 51 M Year 12 40 Yes No Seldom Seldom
22 66 M Year 12 50 Yes Yes Seldom Often
Page 156
Appendix 5
136
Appendix 5 : Analysis of Manoeuvres at First Day
A5-1 Location Number 2 (Baseline manoeuvre)
a) Minimum Speed
Minimum mean speed of drivers in location 2 was not significantly different across scenarios,
F(1.377, 26.154) = 1.617, p = .219, = .078, OP = .264. Similarly, no significant results were
found as an interaction between scenario*age groups, F(1.377, 26.154) = 1.396, p = .259, =
.068, OP = .234, and interaction of scenario*gender, F(1.377, 26.154) = 1.365, p = .269, =
.066, OP = .227. However, pair-wise comparison indicated significant differences between
baseline scenario and CD changing scenario (mean: 6.226 range: 1.408~11.045), and also
between eco-driving scenario and CD changing scenario (mean: 5.001 range: 1.051~8.950).
Therefore, CD changing scenarios degraded driving minimum speed more than any other
scenario.
Table 43: Descriptive statistics of minimum speed across scenarios at location 2
Gender = Total, Grouped age = Total
Mean Std. Deviation N
Baseline scenario(1) 77.2866325 2.30916322 22
Eco-driving scenario(2) 75.8345160 4.12030990 22
Navigation system scenario(3) 72.7981556 16.91086140 22
CD changing scenario(4) 71.1049571 7.84425827 22
Figure 37: Minimum speed across scenarios at location 2
Page 157
Appendix 5
137
It seems again that in this task again young drivers were keeping a higher minimum speed
when they were engaging with the navigation system. However, both young and middle aged
participants adopted lowest speed when they were changing CDs.
Figure 38: Minimum speed of young and middle aged drivers across scenarios at location 2
Minimum speed of male and female drivers showed that males generally chose a lower
minimum speed when they were engaging with in-vehicle systems. However, females decreased
their speed more when they were changing CDs.
Page 158
Appendix 5
138
Figure 39: Minimum speed for male and female drivers across scenarios at location 2
b) Lane keeping
Results indicate that participants’ standard deviation of lane lateral shifts were significantly
different in the four scenarios, F(3, 57) = 7.967, p < .05, = .295, OP = .986. There were also
significant differences as an interaction of scenario*age group F(3, 57) = 2.830, p < .05, =
.130, OP = .650. The means and standard deviations for the measures in all scenarios are
presented in the Table 45 below.
Table 44: Descriptive statistics of standard deviation of lane lateral shift for location 2
Gender=Total
Mean Std. Deviation N
Baseline scenario(1) Young .070172 .0532643 6
Middle aged .096785 .0559529 16
Total .089527 .0553073 22
Eco-driving scenario(2) Young .184936 .1269654 6
Middle aged .110359 .0490532 16
Total .130699 .0819301 22
Navigation system scenario(3) Young .310279 .2113590 6
Middle aged .214071 .1025210 16
Total .240310 .1416587 22
CD changing scenario(4) Young .150268 .0678090 6
Middle aged .185924 .1512870 16
Total .176199 .1330690 22
Examination of these means suggests that participants had more lane lateral movement in the
navigation distraction task in comparison with baseline, eco-driving, and CD changing scenarios.
Page 159
Appendix 5
139
The navigation scenario was significantly different in standard deviation of lateral shift with
baseline scenario (mean difference = .155, .061~ .249) and eco-driving (mean difference = .104,
.015~.192). Therefore, participants were more erratic in lane keeping when they were interacting
with navigation systems in comparison with the two other scenarios.
Figure 40: Standard deviation of lateral shift across scenarios at location 2
The mixed ANOVA also assessed whether there were gender and age group differences in
lane keeping as a between factors analysis. Results indicated no significant effect of age and
gender on standard deviation of lane shifts.
c) Steering wheel control
Results show significant standard deviation of steering wheel differences across scenarios,
F(1.508, 28.647) = 10.501, p < .05, = .356, OP = .951.
Table 45: Descriptive statistics of standard deviation of steering wheel at location 2
Gender = Total, Grouped age = Total
Mean Std. Deviation N
Baseline scenario(1) .007084 .0038845 22
Eco-driving scenario(2) .011298 .0091435 22
Navigation system scenario(3) .027614 .0237535 22
CD changing scenario(4) .021499 .0122982 22
Page 160
Appendix 5
140
Further pair-wise comparisons revealed that both baseline and eco-driving scenarios were
significantly different compared with both navigation and CD changing scenarios. Table 47
below shows a summary of the means, ranges and upper and lower bounds.
Table 46: Pair-wise comparisons of standard deviation of steering wheel at location 2
Measure: Standard deviation of steering wheel
(I) Scenario (J) Scenario
Mean
Difference (I-J) Std. Error Sig
95% Confidence Interval for
Difference
Lower Bound Upper Bound
1 2 -.004 .002 .219 -.009 .001
3 -.022 .005 .003 -.037 -.006
4 -.014 .002 .000 -.021 -.007
2 1 .004 .002 .219 -.001 .009
3 -.018 .005 .019 -.033 -.002
4 -.010 .002 .003 -.016 -.003
3 1 .022 .005 .003 .006 .037
2 .018 .005 .019 .002 .033
4 .008 .005 .732 -.006 .022
4 1 .014 .002 .000 .007 .021
2 .010 .002 .003 .003 .016
3 -.008 .005 .732 -.022 .006
Figure 41: Mean standard deviation of steering wheel across scenarios at location 2
No significant between-subjects differences were found for standard deviation of steering
wheel.
Page 161
Appendix 5
141
d) Peripheral detection task
The repeated measures mixed ANOVA evaluated whether there were significant differences
between the average WRC and MRC across the four scenarios. There was no significant effect of
different scenarios on drivers’ wrong response counts of red dots, F(3, 57) = .838, p = .479, =
.042, OP = .221. Similarly, no significant effect was found for age groups or gender differences.
Figure 42: WRCs across scenarios in location 2
However, MRC was significantly different for all scenarios, F(3, 57) = 4.073, p < .05, =
.177, OP = .819. The means and standard deviations for the measure are listed in Table 48 below.
Table 47: Descriptive statistics of MRCs across scenarios at location 2
Gender = Total, Grouped age = Total
Mean Std. Deviation N
Baseline scenario(1) .27 .456 22
Eco-driving scenario(2) .55 .596 22
Navigation system scenario(3) 1.27 .985 22
CD changing scenario(4) 1.09 .971 22
Further, pair-wise comparison showed a significant difference in MRCs at PDT between
baseline and navigation scenarios (mean difference = -.888, range:-1.616~-.160 p <.05).
Between object analyses revealed that MRC was significantly different between young and
middle aged drivers, F(1, 19) = .8.599, p < .05, = .312, OP = 0.794, and between male and
female drivers, F(1, 19) = .5.078, p < .05, = .211, OP = 0.571.
Page 162
Appendix 5
142
Figure 43: MRCs across scenarios at location 2
A5-2 Location Number 9 (Baseline manoeuvre)
a) Minimum speed
Minimum mean speed of drivers in the no manoeuvre location was not significantly different
across the scenarios, F(3, 57) = 2.324, p = .085, = .109, OP = .555. Similarly, no significant
results were found for an interaction between scenario and age groups, F(3, 57) = 1.777, p = .321,
= .058, OP = .252, or interaction of scenario and gender, F(3, 57) = .439, p = .726,
= .023,
OP = .133.
Table 48: Descriptive statistics of minimum speed at location 9
Gender = Total, Grouped age = Total
Mean Std. Deviation N
Baseline scenario(1) 74.2319922 5.80465228 22
Eco-driving scenario(2) 72.1080736 7.59253299 22
Navigation system scenario(3) 70.9640840 7.54319968 22
CD changing scenario(4) 68.6746795 6.94302006 22
In general, participants decreased their minimum speed when they were engaged in
distracting activities. There was a significant difference between baseline and CD changing
scenarios (mean: 5.071, range: 1.736~8.406). This indicates that the CD changing task compelled
drivers to drive more slowly than in any other scenario.
Page 163
Appendix 5
143
Figure 44: Minimum speed across scenarios at location 9
Figures 45 and 50 below show differences between age group and gender, respectively, across
all scenarios. In both cases, engaging in a CD changing task was more demanding for middle
aged and female participants.
Figure 45: Minimum speed of young and middle aged drivers across scenarios at location 9
Page 164
Appendix 5
144
Figure 46: Minimum speed of male and female drivers across scenarios at location 9
b) Lane keeping
Results indicate that participants’ standard deviation of lane lateral shifts were significantly
different in the four scenarios, F(3, 57) = 8.455, p < .05, = .308, OP = .990. The means and
standard deviations for the measure are presented in Table 50 below.
Table 49: Descriptive statistics of standard deviation of lane lateral shift at location 9
Gender = Total, Grouped age = Total
Mean Std. Deviation N
Baseline scenario(1) .091573 .0360837 22
Eco-driving scenario(2) .136278 .0507325 22
Navigation system scenario(3) .207318 .0917944 22
CD changing scenario(4) .168110 .0596851 22
These means suggest that participants have significantly more lane lateral movement in all
scenarios in comparison with the baseline scenario. The baseline scenario is significantly
different in standard deviation of lateral shift for eco-driving (mean difference = -.042, .081~
.003), navigation system (mean difference = -.103, -.158~-.049), and CD changing scenarios
(mean difference = -.077, -.122~-.032).
The mixed ANOVA also assessed whether there was gender and age differences in lane
keeping as a between-subjects factor. Results indicate no significant effect of age and gender on
standard deviation of lane shifts.
Page 165
Appendix 5
145
Figure 47: Standard deviation of lateral shift across scenarios at location 9
c) Steering wheel control:
Results show that standard deviation of steering wheel was significantly different across
scenarios F(1.897, 36.048) =11.922, p < .05, = .386, OP = .989.
Table 50: Descriptive statistics of standard deviation of steering wheel at location 9
Grouped age = Total, Gender = Total
Mean Std. Deviation N
Baseline scenario(1) .009241 .0050984 22
Eco-driving scenario(2) .012381 .0103803 22
Navigation system scenario(3) .032384 .0224529 22
CD changing scenario(4) .026942 .0214741 22
Further pair-wise comparisons indicate that both the baseline scenario (.009, .005) and the
eco-driving scenario (.012, .010) were significantly different compared with both the navigation
scenario (.032, .022) and the CD changing scenario (.027, .021). Table 52 below shows the
summary of the comparisons.
Page 166
Appendix 5
146
Table 51: Pair-wise comparisons of standard deviation of steering wheel at location 9
Measure: Standard deviation of steering wheel
(I) Scenario (J) Scenario
Mean
Difference (I-J) Std. Error Sig
95% Confidence Interval for
Difference
Lower Bound Upper Bound
1 2 -.002a .002 .814 -.007 .002
3 -.021a,*
.005 .001 -.035 -.007
4 -.017a,*
.004 .005 -.029 -.004
2 1 .002a .002 .814 -.002 .007
3 -.019a,*
.004 .001 -.030 -.007
4 -.014a,*
.003 .000 -.022 -.006
3 1 .021a,*
.005 .001 .007 .035
2 .019a,*
.004 .001 .007 .030
4 .004a .004 1.000 -.007 .016
4 1 .017a,*
.004 .005 .004 .029
2 .014a,*
.003 .000 .006 .022
3 -.004a .004 1.000 -.016 .007
Figure 48: Standard deviation of steering wheel across scenarios at location 9
Although there were no significant gender and age group differences, the pattern of
differences was similar to the main results.
d) Peripheral detection task
The repeated measures mixed ANOVA evaluated whether there were differences between the
average WRC and MRC across the four scenarios. There was no significant effect of different
scenarios on drivers’ wrong response counts, F(3, 57) = 1.969, p = .129, = .094, OP = .481.
Page 167
Appendix 5
147
Figure 49: WRCs of drivers across scenarios at location 9
Similarly, there was no significant result for MRCs across different scenarios, F(3, 57) =
1.912, p = .138, = .091, OP = .469.
Figure 50: MRCs of drivers across scenarios at location 9
Page 168
Appendix 5
148
A 5-3 Location Number 1 (Lane Changing)
a) Minimum speed
Minimum mean speed of drivers in lane changing manoeuvres was not significantly different
across various scenarios, F(3, 57) = .651, p = .586, = .033, OP = .178. However, as shown in
the Table 53 below, minimum speed decreased in all distracting scenarios. There was also greater
decrement in the last two scenarios (navigation and CD changing) than in the first two scenarios
(baseline and eco-driving).
Table 52: Descriptive statistics for minimum speed at location 1
Gender = Total
Grouped age Mean Std. Deviation N
Baseline scenario(1) Young 66.5886968 9.38182380 6
Middle age 72.0819311 5.50951670 16
Total 70.5837763 6.99350089 22
Eco-driving scenario(2) Young 69.2066197 7.27671798 6
Middle age 69.4162226 9.64601581 16
Total 69.3590582 8.89255747 22
Navigation system scenario(3) Young 71.9009438 3.40598758 6
Middle age 60.9967544 17.76661151 16
Total 63.9706243 15.90392773 22
CD changing scenario(4) Young 72.5094833 6.01699099 6
Middle age 63.3049245 10.79674913 16
Total 65.8152587 10.46370618 22
In addition, the effect of speed shows significant results when interaction of scenarios and age
groups were investigated, F(3, 57) = 4.660, p < .05, = .197, OP = .778. Younger drivers tended
to go faster when they were engaged in both the navigation task ((71.90, 3.41) versus (60.10,
17.77)) and the CD changing task ((72.51, 6.02) versus (63.30, 10.80)), and on the opposite hand,
middle aged participants displayed more confidence in dealing with the baseline scenario ((72.08,
5.51) versus (66.59, 9.38)). One interesting result for drivers’ minimum speed was that middle
aged drivers decreased their minimum speed when they were engaged with in-vehicle devices.
However, young drivers may have felt overconfident in their ability to control the car and,
therefore, their minimum speed was even higher in more distracting tasks in comparison with
baseline scenarios. More studies are recommended on the topic.
Page 169
Appendix 5
149
Figure 51: Minimum speed of young and middle aged drivers across scenarios at location 1
Male and female comparison results show no significant difference. However, in general,
male participants tended to keep lower minimum speed when they were engaging with eco-
driving and in-vehicle navigation system activities in comparison with their female counterparts.
They were also more confident in changing their CDs while driving.
Figure 52: Minimum speed of male and female drivers across scenarios at location 1
Page 170
Appendix 5
150
b) Lane keeping
Lateral shift Results indicate that participants’ standard deviation of lane lateral shifts were significantly
different in the four scenarios, F(3, 57) = 6.646, p < .05, = .259, OP = .965. However, no
significant result was found as an interaction of scenario*age group and scenario*gender. The
means and standard deviations for the measure are presented in Table 54 below.
Table 53: Descriptive statistics of standard deviation of lateral shift at location 1
Gender = Total, Grouped age = Total
Mean Std. Deviation N
Baseline scenario(1) .553820 .0669624 22
Eco-driving scenario(2) .548756 .0730774 22
Navigation system scenario(3) .665866 .1126795 22
CD changing scenario(4) .574055 .0812593 22
Figure 53: Standard deviation of lateral shift across scenarios at location 1
Examination of these means suggests that participants had more lane lateral movement in the
navigation distraction task in comparison with baseline and eco-driving scenarios. The navigation
scenario (.67, .11) was significantly different in standard deviation of lateral shift when compared
with baseline (.55, .07) (mean difference = .104, .027~.181, p < .05) and eco-driving scenarios
(.55, .07) (mean difference = .111, .029~.193, p < .05). Therefore, participants were more erratic
in the lane keeping measure when interacting with the navigation system in comparison with both
baseline and eco-driving scenarios.
Page 171
Appendix 5
151
No significant results were found as a result of between-subjects analyses. However, the
pattern of standard deviation of lateral shifts variations remained almost the same among
participants between young and middle aged, and between male and female.
c) Steering wheel control
Results show no significant differences between scenarios on the standard deviation of
steering wheel as a within factor or between factor measure. Not surprisingly, however,
navigation and CD changing scenarios produced more steering wheel angle changes.
Table 54: Descriptive statistics of standard deviation of steering wheel
Gender = Total, Grouped age = Total
Mean Std. Deviation N
Baseline scenario(1) .000144 .0018122 22
Eco-driving scenario(2) .000051 .0017743 22
Navigation system scenario(3) .000498 .0019453 22
CD changing scenario(4) .000352 .0017796 22
In addition, it seems that middle aged (experienced) drivers were more capable of controlling
steering wheels than younger (unexperienced) drivers when they were using in-vehicle devices.
Figure 54: Standard deviation of steeing wheel across scenarios for location 1
Page 172
Appendix 5
152
Furthermore, male and female drivers were almost the same in controlling their steering
wheel angle. Nevertheless, in the baseline scenario, generally, females changed the wheel
position more often than males.
Figure 55: Standard deviation of steering wheel for male and female drivers across scenarios at location 1
d) Peripheral Detection Task
The repeated measures mixed ANOVA evaluated whether there were differences between the
average WRC and MRC across the four scenarios. The results revealed that there was a
significant effect of scenarios on drivers’ wrong response count of red dots in the PDT
(Peripheral Detection Task), F(3, 57) = 5.355, p < .05, = .220, OP = .917. The means and
standard deviations for the measure are listed in the Table 56 below:
Table 55: Descriptive statistics of WRCs at location 1
Gender = Total, Grouped age = Total
Mean
Std.
Deviation N
Baseline scenario(1) .18 .395 22
Eco-driving scenario(2) .59 .590 22
Navigation system scenario(3) .68 .716 22
CD changing scenario(4) .91 .811 22
Pair-wise comparison shows a significant difference in number of WRC between baseline and
eco-driving scenarios (mean difference = -.519, range:-.977~-.061 p < .05), and between baseline
and navigation scenarios (mean difference = -.529, range:-1.031~-.27 p < .05), and between
baseline and CD changing scenarios (mean difference = -.815, range:-1.330~-.300 p < .05).
Page 173
Appendix 5
153
Figure 56: WRCs across scenarios at location 1
The between-subjects analysis shows no significant result for age and gender differences.
However, middle aged drivers had more wrong responses detected in two apparently more
difficult scenarios, navigation system and CD changing tasks.
Figure 57: Young and middle aged drivers’ WRCs across different scenarios at location 1
Similarly, female drivers had more mistakes or delayed responses in PDT in all distracting
scenarios.
Page 174
Appendix 5
154
Figure 58: Male and female drivers’ WRCs across different scenarios at location 1
There was also a significant effect of scenarios on drivers’ MRCs, F(3, 57) = 14.226, p < .05,
= .428, OP = 1.000.
Table 56: Descriptive statistics of MRCs at location 1
Gender = Total, Grouped age = Total
Mean Std. Deviation N
Baseline scenario(1) .50 .673 22
Eco-driving scenario(2) 1.18 .958 22
Navigation system scenario(3) 2.36 1.329 22
CD changing scenario(4) 2.18 1.332 22
Figure 59: MRCs across different scenarios in location 1
Page 175
Appendix 5
155
Pair-wise comparison showed more detailed results, indicating significant differences
between all scenarios. However, navigation and CD changing scenarios were not significantly
different from each other.
Table 57: Pair-wise comparisons of MRCs at location 1
Measure: MRC
(I) Scenario (J) Scenario
Mean
Difference (I-J)
Std.
Error Sig
95% Confidence Interval for Difference
Lower Bound Upper Bound
1 2 -.813 .269 .042 -1.605 -.022
3 -1.786 .261 .000 -2.554 -1.018
4 -1.835 .328 .000 -2.801 -.870
2 1 .813 .269 .042 .022 1.605
3 -.973 .294 .022 -1.839 -.107
4 -1.022 .266 .007 -1.807 -.238
3 1 1.786 .261 .000 1.018 2.554
2 .973 .294 .022 .107 1.839
4 -.049 .363 1.000 -1.118 1.019
4 1 1.835 .328 .000 .870 2.801
2 1.022 .266 .007 .238 1.807
3 .049 .363 1.000 -1.019 1.118
However, no gender and age group differences were found for the first lane changing
manoeuvre.
Page 176
Appendix 5
156
A5-4 Location Number 4 (Lane Changing)
a) Speed
Same as for location 1, minimum mean speed of drivers in the lane changing manoeuvre was
not significantly different across the scenarios, F(2.132, 40.507) = 2.486, p = .093, = .116, OP
= .486. However, unlike the first lane changing location, no significant results were found
between different age groups across different scenarios. There was also no significant difference
between the two gender groups.
Table 58: Descriptive statistics of minimum speed at location 4
Gender = Total, Grouped age = Total
Mean Std. Deviation N
Baseline scenario(1) 66.0694075 6.60804826 22
Eco-driving scenario(2) 64.9583792 7.60773753 22
Navigation system scenario(3) 63.4622672 11.55756957 22
CD changing scenario(4) 61.7552736 7.85713871 22
Figure 60: Minimum speed of drivers across scenarios at location 4
b) Lane keeping
Results indicate that participants’ standard deviation of lane lateral shifts were not
significantly different in the four scenarios, F(3, 57) = 0.606, p = .614, = .031, OP = .168.
Similarly, no significant result was found as an interaction of scenario*age group and
scenario*gender. The same result was found for standard deviation of lane lateral shifts.
However, the pattern for standard deviation of lane lateral shift was the same as for the first lane
changing location.
Page 177
Appendix 5
157
Figure 61: Standard deviation of lateral shift across scenarios at location 4
c) Steering wheel control
Results show significant differences between scenarios for standard deviation of steering
wheel, F(3, 57) = 2.811, p < .05, = .129, OP = .646. The general trend showed that participants
were more erratic in wheel control in navigation and CD changing scenarios. A further pair-wise
comparison showed that there was a significant difference between eco-driving and navigation
scenarios (mean differences:-.009, range:-.018~.000, p < .05).
Table 59: Descriptive statistics of Standard deviation of steering wheel across scenarios at location 4
Gender = Total, Grouped age = Total
Mean Std. Deviation N
Baseline scenario(1) .054127 .0162047 22
Eco-driving scenario(2) .051829 .0113510 22
Navigation system scenario(3) .061842 .0187110 22
CD changing scenario(4) .059040 .0172046 22
Page 178
Appendix 5
158
Figure 62: Standard deviation of steering wheel across scenarios at location 4
Means of standard deviation of steering wheel angle were not significantly different for a
between factors analysis.
d) Peripheral detection task
The repeated measures mixed ANOVA evaluated whether there were differences between the
average WRC and MRC across the four scenarios. There was no significant effect of different
scenarios on drivers’ wrong response counts in the PDT, F(3, 57) = 1.406, p = .250, = .069,
OP = .354. However, interaction of age groups and scenarios showed a significant difference in
number of WRC, F(3, 57) = 3.545, p < .05, = .157, OP = .758.
Page 179
Appendix 5
159
Table 60: Descriptive statistics of WRCs for young and middle aged drivers at location 4
Gender = Total
Grouped age Mean Std. Deviation N
Baseline scenario(1) Young .17 .408 6
Middle aged .63 .806 16
Total .50 .740 22
Eco-driving scenario(2) Young .67 .816 6
Middle aged .44 .629 16
Total .50 .673 22
Navigation system scenario(3) Young 1.33 .816 6
Middle aged .44 .512 16
Total .68 .716 22
CD changing scenario(4) Young .83 .983 6
Middle aged .69 .704 16
Total .73 .767 22
Figure 63: WRCs across scenarios at location 4
Page 180
Appendix 5
160
Figure 64: WRCs of young and middle aged drivers across scenarios at location 4
As Figure 65 below shows, it is likely that female drivers are better able to recognise events
correctly.
Figure 65: WRCs of male and female drivers across scenarios at location 4
Page 181
Appendix 5
161
Furthermore, there is a significant effect of different scenarios on drivers’ MRCs (MRC), F(3,
57) = 3.292, p < .05, = .148, OP = .723. Pair-wise comparison indicated a significant
difference between baseline and navigation scenarios, mean differences= -1.006, range:-1.974~-
.038.
Table 61: Descriptive statistics of MRCs across scenarios at location 4
Gender = Total, Grouped age = Total
Mean Std. Deviation N
Baseline scenario(1) 1.09 .921 22
Eco-driving scenario(2) 1.41 1.182 22
Navigation system scenario(3) 2.09 1.192 22
CD changing scenario(4) 2.05 1.214 22
Figure 66: MRCs across scenarios at location 4
It seems that middle aged drivers are better in detecting red dots in distracting activities. It is
also true for female drivers when compared with their counterparts.
Page 182
Appendix 5
162
Figure 67: MRCs for young and middle aged drivers across scenarios at location 4
Figure 68: MRCs for male and female drivers across scenarios at location 4
Page 183
Appendix 5
163
A5-5 Location Number 5 (Overtaking)
a) Speed
Minimum mean speed of drivers in the lane changing manoeuvre was not significantly
different across scenarios, F(3, 54) =1.767, p = .164, = .085, OP = .437.
Table 62: Descriptive statistics of minimum speed at location 5
Gender = Total, Grouped age = Total
In general, drivers tended to keep higher minimum speeds when they were engaging with in-
vehicle activities. The main reason for this was probably that they preferred to increase their
speed to be in a better position relative to the overtaken vehicle. In other words, this was drivers’
mitigation strategy to avoid risk of interacting with in-vehicle devices while they were
overtaking. The strategy was more likely to be adopted by middle aged (experienced) and female
drivers (less risky drivers).
Figure 69: Minimum speed of drivers across scenarios at location 5
b) Lane keeping
A repeated measures mixed ANOVA was conducted to evaluate whether there were
differences between the average lane keeping measures in the four scenarios. Results indicate that
participants’ lane lateral shifts were significantly different in the four scenarios, F(3, 57) = 3.874,
Mean Std. Deviation N
Baseline scenario(1) 48.7794574 11.53566949 22
Eco-driving scenario(2) 49.9410144 3.69092482 22
Navigation system scenario(3) 52.0250083 8.09912097 22
CD changing scenario(4) 49.8837023 4.50549718 22
Page 184
Appendix 5
164
p < .05, = .177, OP = .796. However, no significant result was found for an interaction of
scenario*age group and scenario*gender.
Table 63: Descriptive statistics of lane lateral shift at location 5
Gender=Total, Grouped age=Total
Mean Std. Deviation N
Baseline scenario(1) .400367 .1385857 21
Eco-driving scenario(2) .442645 .1492901 21
Navigation system scenario(3) .525144 .1425383 21
CD changing scenario(4) .491261 .1461625 21
The above means suggest that participants had more lane lateral movement in the navigation
distraction task than in any other scenario. Particularly, the navigation scenario (.525, .143) was
significantly different in lateral shift with the baseline scenario (.400, .139) (mean difference =
.114, .212~ .017) and the eco-driving scenario (.443, .149) (mean difference = .083, .165~.002).
Therefore, participants were more erratic in the lane keeping measure when they were interacting
with the navigation system than in two other distracting scenarios.
Figure 70: Lateral shift of drivers across scenarios at location 5
The mixed ANOVA also assessed whether there were gender and age differences in lane
keeping across different scenarios. Results indicate a significant effect of age on lane lateral
shifts, F(1, 18) = 8.051, p < .05, = .309, OP = .765. However, no gender differences were
found for their mean lateral changes.
Page 185
Appendix 5
165
Figure 71: Lateral shift of young and middle aged drivers across scenarios at location 5
Figure 72: Lateral shift of male and female drivers across scenarios at location 5
c) Steering wheel control:
Results show no significant difference between scenarios for standard deviation of steering
wheel as a within factors measure, F(2.122, 54) = 3.167, p = .051, = .150, OP = .589.
Page 186
Appendix 5
166
However, a pair-wise comparison shows that the eco-driving system scenario (.050, .012) was
significantly different from navigation system scenario (.059, .015), mean (-.008), range (-.015~-
.001).
Table 64: Descriptive statistics of Standard deviation of steering wheel at location 5
Gender = Total, Grouped age = Total
Mean Std. Deviation N
Baseline scenario(1) .049608 .0076394 21
Eco-driving scenario(2) .050433 .0116731 21
Navigation system scenario(3) .058886 .0147070 21
CD changing scenario(4) .060730 .0202682 21
Figure 73: Standard deviation of steering wheel across scenarios at location 5
d) Peripheral Detection Task
The repeated measures mixed ANOVA evaluated whether there were differences between the
means of the MRC across the four scenarios. There was a significant effect of different scenarios
on drivers’ MRCs in PDT, F(3, 54) = 6.671, p < .05, = .270, OP = .965. There was also
significant interaction between scenario and grouped ages, F(3, 54) = 3.442, p < .05, = .161,
OP = .742.
Page 187
Appendix 5
167
Table 65: Descriptive statistics of MRCs at location 5
Gender = Total
Grouped age Mean Std. Deviation N
Baseline scenario(1) Young 1.17 .983 6
Middle aged .73 .594 15
Total .86 .727 21
Eco-driving scenario(2) Young 1.33 .516 6
Middle aged 1.20 .676 15
Total 1.24 .625 21
Navigation system scenario(3) Young 2.50 1.049 6
Middle aged 1.93 1.163 15
Total 2.10 1.136 21
CD changing scenario(4) Young 1.17 .983 6
Middle aged 2.20 1.207 15
Total 1.90 1.221 21
Pair-wise comparisons show more detailed results. The baseline scenario (.86, .727) was
significantly different compared with both the navigation (2.10, 1.136) (mean difference = -
1.255, range:-2.218~-.292 p < .05) and CD changing scenarios (1.90, 1.221) (mean difference = -
.879, range:-1.733~-.024 p < .05). There were also significant differences between the eco-
driving (1.24, .625) and navigation scenarios (2.10, 1.136), mean difference = -1.040, range:-
1.862~-.219 p < .05).
No significant differences were found between male and female drivers or between young and
middle aged drivers.
Figure 74: MRCs across scenarios at location 5
Page 188
Appendix 5
168
A5-6 Location Number 10 (overtaking) a) Minimum speed
Mean minimum speed of drivers in overtaking manoeuvre is not significantly different across
scenarios at location 10, second overtaking location, F(1.941, 36.874) = 2.548, p = .093, =
.118, OP = .471. However, as previous first overtaking task, location no.5, drivers tend to keep
higher minimum speed when they were engaged with in-vehicle activities.
Table 66: Descriptive statistics Mean minimum speed of drivers across scenarios at location 10
Grouped age = Total, Gender = Total
Mean Std. Deviation N
Baseline scenario(1) 59.2571279 4.58610063 22
Eco-driving scenario(2) 60.0001961 6.69336081 22
Navigation system scenario(3) 60.9443341 9.12322245 22
CD changing scenario(4) 63.6207461 7.74790993 22
At location number 10, pair-wise comparisons show significant differences between the
baseline scenario (59.26, 4.59) and CD changing scenario (63.62, 7.75) (mean:-4.527, range:-
8.734~-.320), and also between the eco-driving scenario (60.00, 6.693) and CD changing
scenario (63.62, 7.75) (mean:-4.254, range:-8.448~-.060). The locality of location number 10 in
the network may have caused slightly different compared results with location number 5 due to
the fact that this was the last task in all scenarios and drivers may have preferred to go faster to
finish the last manoeuvre.
Page 189
Appendix 5
169
Figure 75: Minimum speed of drivers across scenarios at location 10
b) Lane keeping
Results indicate that participants’ lane lateral shifts were significantly different in the four
scenarios, F(3, 57) = 2.864, p < .05, = .131, OP = .656. However, no significant result was
found for an interaction of scenario*grouped age and scenario*gender.
Table 67 : Descriptive statistics of lane lateral shift at location 10
Gender = Total, Grouped age = Total
Mean Std. Deviation N
Baseline scenario(1) .464032 .1163858 22
Eco-driving scenario(2) .456304 .1250077 22
Navigation system scenario(3) .529910 .1371633 22
CD changing scenario(4) .556214 .1117594 22
The CD changing scenario (.556, .112) was significantly different in lateral shift compared
with the baseline scenario (.464, .116) (mean difference=.092, .007~ .177) and eco-driving
scenario (.456, .125) (mean difference = .091, .008~.174). Therefore, participants were more
erratic in the lane keeping measure when they were interacting with the CD player than in the
first two scenarios.
The mixed ANOVA also assessed whether there were gender and age differences in lane
keeping across different scenarios. Results found no significant differences.
Figure 76: Lateral shifts across scenarios at location 10
c) Steering wheel control
Page 190
Appendix 5
170
Results show no significant standard deviation of steering wheel across scenarios, F(1.938,
36.829) = 1.328, p = .277, = .277, p = .265.
Table 68: Descriptive statistics of standard deviation of steering wheel at location 10
Gender=Total, Grouped age=Total
Mean Std. Deviation N
Baseline scenario(1) .039240 .0125982 22
Eco-driving scenario(2) .042938 .0169941 22
Navigation system scenario(3) .052457 .0208435 22
CD changing scenario(4) .055267 .0400166 22
Figure 77: Standard deviation of steering wheel across scenarios at location 10
d) Peripheral Detection Task
There was a significant effect of different scenarios on drivers’ MRCs of red dots, F(3, 57) =
2.951, p < .05, = .134, OP = .670.
Table 69: Descriptive statistics of MRC at location 10
Gender=Total, Grouped age=Total
Mean Std. Deviation N
Baseline scenario(1) 1.32 .945 22
Eco-driving scenario(2) 1.64 1.002 22
Navigation system scenario(3) 1.91 .684 22
CD changing scenario(4) 1.82 1.006 22
Page 191
Appendix 5
171
Figure 78: MRCs across scenarios at location 10
Page 192
Appendix 5
172
A5-7 Location Number 3 (Intersection)
a) Steering wheel control:
Results show no significant differences of standard deviation of steering wheel across
scenarios, F(3, 57) = .434, p = .730, = .022, OP = .131. The same applied to between-subjects’
analyses.
b) Peripheral Detection Task
The repeated measures mixed ANOVA evaluated whether there were differences between the
means of the MRC across the four scenarios. MRC was significantly different for each scenario,
F(3, 57) = 8.918, p < .05, = .319, OP = .993. The means and standard deviations for the
measure in all scenarios are listed in order of scenario in Table 71 below.
Table 70: Descriptive statistics of MRCs at location 3
Gender = Total, Grouped age = Total
Mean Std. Deviation N
Baseline scenario(1) .64 .658 22
Eco-driving scenario(2) 1.32 1.249 22
Navigation system scenario(3) 2.32 .945 22
CD changing scenario(4) 1.68 1.323 22
Pair-wise comparison also show significant differences of number of missed responses in
PDT between the baseline (.64, .658) and navigation scenarios (2.32, .945) (mean difference = -
1.748, range:-2.413~-1.084 p<.05) and between the baseline (.64, .658) and CD changing
scenarios (1.68, 1.323) (mean difference = -.980, range:-1.779~-.181 p<.05).
Page 193
Appendix 5
173
Figure 79: MRCs across scenarios at location 3
However, no significant differences were found in a between factors analysis.
A5-8 Location Number 8 (Intersection) a) Steering wheel control:
Results show no significant standard deviation of steering wheel differences across scenarios,
F(1.683, 31.974) = .879, = .408, p = .177. The same applied to between-subjects analyses.
b) Peripheral Detection Task
The repeated measures mixed ANOVA evaluated whether there were differences between the
means of the MRCs across the four scenarios. MRCs were significantly different for each
scenario, F(3, 57) = 5.616, p < .05, = .228, OP = .930. There were also gender differences
across different scenarios, F(3, 57) = 2.803, p < .05, = .129, OP = .645. The means and
standard deviations for the measure are presented in Table 72 below.
Table 71: Descriptive statistics of MRCs at location 8
Gender = Total, Grouped age = Total
Mean Std. Deviation N
Baseline scenario(1) .77 .612 22
Eco-driving scenario(2) 1.09 .921 22
Navigation system scenario(3) 1.68 .839 22
CD changing scenario(4) 1.36 1.255 22
Page 194
Appendix 5
174
Pair-wise comparison found a significant difference between the baseline (.77, .612) and
navigation scenarios (1.68, .839), mean:-1.026, range:-1.528~-.524.
A between-subjects analysis showed no significant differences between male and female
drivers or between young and middle-aged drivers.
Figure 80: MRCs across scenarios at location 8
Page 195
Appendix 5
175
A5-9 Location Number 6 (Roundabout)
a) Speed
Mean speed of drivers in the braking task for the roundabout was not significantly different
across different scenarios, F(2.368, 44.996) = 1.580, p = .214, = .077, OP = .344. This means
all drivers’ speeds were almost the same in all scenarios.
Table 72: Descriptive statistics of speed at location 6
Gender = Total, Grouped age = Total
Mean Std. Deviation N
Baseline scenario(1) 30.963038 3.7229471 22
Eco-driving scenario(2) 34.395806 9.6160612 22
Navigation system scenario(3) 30.713239 9.5537850 22
CD changing scenario(4) 31.836267 9.9678490 22
Figure 81: Mean speed of drivers across scenarios at location 6
b) Peripheral detection task
MRC was significantly different for each scenario, F(3, 57) = 2.994, p < .05, = .136, OP =
.677. The means and standard deviations for the measure are listed in Table 74 below.
Table 73: Descriptive statistics of MRCs at location 6
Gender = Total, Grouped age = Total
Mean Std. Deviation N
Baseline scenario(1) 1.59 .854 22
Eco-driving scenario(2) 1.27 .703 22
Navigation system scenario(3) 2.05 .999 22
CD changing scenario(4) 1.64 .902 22
Page 196
Appendix 5
176
A pair-wise comparison also shows a significant difference in number of missed responses to
PDT between the eco-scenario (1.27, .703) and the navigation scenario (2.05, .999) (mean
difference = -.739, range:-1.285~-.194 p < .05).
Figure 82: MRCs across scenarios in location 6
There was also a significant difference between male (1.714, .149) and female (1.200, .262)
drivers in their MRCs of red dots, F(1, 19) = 4.717, p < .05, = .199, OP =.540.
Page 197
Appendix 5
177
Figure 83: MRCs of male and female drivers across scenarios at location 6
c) Acceleration
At the location, there were no significant differences in acceleration force across scenarios
F(2.423, 46.038) = .431 p = .690, = .022, OP = 0.122.
Table 74: Descriptive statistics of acceleration at location 6
Gender = Total, Grouped age = Total
Mean Std. Deviation N
Baseline scenario(1) -1.021966 .3090717 22
Eco-driving scenario(2) -1.144792 .4072002 22
Navigation system scenario(3) -1.057884 .4897672 22
CD changing scenario(4) -1.079186 .4719221 22
Page 198
Appendix 5
178
Figure 84: Acceleration across scenarios at location 6
A5-10 Location Number 7 (Roundabout)
a) Speed
Mean speed of drivers in braking for the roundabout was significantly different across
different scenarios, F(3, 57) = 5.440, p < .05, = .223, OP = .921. No significant results were
found for an interaction between scenario and grouped age or interaction of scenario*gender.
Table 75: Descriptive statistics of speed at location 7
Gender = Total, Grouped age = Total
Mean Std. Deviation N
Baseline scenario(1) 41.059017 8.8524191 22
Eco-driving scenario(2) 40.945790 11.6753428 22
Navigation system scenario(3) 33.517199 10.6163893 22
CD changing scenario(4) 37.264067 11.7478209 22
Pair-wise comparison revealed that the navigation scenario (33.52, 10.62) was significantly
different compared with the baseline (41.06, 8.85) (mean difference = -8.872, range:-15.768~-
1.977 p < .05) and eco-driving scenarios (40.95, 11.68) (mean difference = -8.949, range:-
17.145~-.753 p < .05).
Page 199
Appendix 5
179
Figure 85: Mean speed across scenarios at location 7
b) Peripheral Detection Task
The repeated measures mixed ANOVA evaluated whether there were differences between the
means of MRCs across four scenarios. MRCs were significantly different for each scenario, F(3,
57) = 4.835, p < .05, = .203, OP = .885.
Table 76: Descriptive statistics of MRCs at location 7
Gender = Total, Grouped age = Total
Mean Std. Deviation N
Baseline scenario(1) 1.05 .653 22
Eco-driving scenario(2) .91 .868 22
Navigation system scenario(3) 1.95 .653 22
CD changing scenario(4) 1.45 1.184 22
Pair-wise comparisons show significant differences in number of missed responses in PDT
between baseline (1.05, .653) and navigation system (1.95, .653) scenarios, mean difference = -
.900, range:-1.434~-.366 p < .05, and also between eco-scenario (.91, .868) and the navigation
scenario (1.95, .653), mean difference=-1.008, range:-1.713~-.303 p < .05.
Page 200
Appendix 5
180
Figure 86: MRCs across scenarios at location 7
There was also a significant difference between male and female drivers in their MRC of red
dots, F(1, 19) = 4.717, p < .05, = .199, OP = .540.
Figure 87: MRCs across scenarios at location 7
c) Acceleration
There were significant differences in acceleration force in different scenarios F(2.149, 40.833)
= 5.326, p < .005, = .219, OP = 0.830. A pair-wise comparison shows drivers decelerated
more aggressively in the navigation scenario (-1.195, .508) when compared to the baseline
scenario (-1.557, .419), mean difference = -.405, range:-.753~-.056, p < .05.
Page 201
Appendix 5
181
Table 77: Descriptive statistics of acceleration at location 7
Grouped age = Total, Gender = Total
Mean Std. Deviation N
Baseline scenario(1) -1.556678 .4187729 22
Eco-driving scenario(2) -1.468117 .4169920 22
Navigation system scenario(3) -1.195042 .5057809 22
CD changing scenario(4) -1.342715 .3997807 22
Figure 88: Acceleration across scenarios at location 7
Page 202
Appendix 6
182
Appendix 6 : Detailed analysis of Practice Effect Based on Driving Measures and
Type of Manoeuvre
A6-1 Location 2 (Baseline Manoeuvre)
a) Minimum speed
Baseline The results show that there was no significant difference between minimum speeds in
baseline scenarios on day 1 (77.25, 2.36) and day 2 (77.87, 2.03).
Eco-driving There were also no significant differences in mean minimum speeds of participants between
the eco-driving scenario on day 1(76.30, 3.59) and day 2 (77.57, 3.06).
Navigation system No differences were found between minimum speeds of drivers on day 1 (73.32, 17.15) and
day 2 (76.65, 4.99) when they were engaging with the navigation system.
CD changing There was a significant difference between minimum speeds of drivers on day 1 (71.70, 7.51)
and day 2 (74.54, 7.07) when engaging with the CD changing task, F(1, 18) = 4.407, p < .05, =
.197, OP = .511.
b) Standard deviation of lateral shift
Baseline There was no practice effect between day1 (.09, .06) and day2 (.11, .08) on standard deviation
of lateral shift in the baseline scenario.
Eco-driving There was no practice effect between day 1 (.13, .08) and day 2 (.17, .07) on SD of lateral
shift in the eco-driving scenario. However, there were significant age group differences between
day 1 and day 2, F(1, 18) = 4.694, p < .05, = .207, OP = .536. Table 79 below shows their
means and standard deviations.
Page 203
Appendix 6
183
Table 78: Descriptive statistics of standard deviation of lateral shift over 2 consecutive days (eco-driving
scenario)
Gender=Total
Grouped age Mean Std. Deviation N
Standard deviation of lane lateral shift
for baseline scenario-day 1
Young .184936 .1269654 6
Middle age .109990 .0507519 15
Total .131403 .0838851 21
Standard deviation of lane lateral shift
for baseline scenario-day 2
Young .177446 .0837370 6
Middle age .169179 .0717385 15
Total .171541 .0732810 21
Figure 89: Standard deviation of lateral shift for young and middle aged drivers over 2 consecutive days
at location 2 (eco-driving scenario)
Navigation system There was no practice effect between day1 (.25, .14) and day 2 (.23, .09) on standard
deviation of lateral shift in the navigation driving scenario.
CD changing There was no practice effect between day 1 (.17, .13) and day 2 (.23, .24) on standard
deviation of lateral shift in the navigation driving scenario.
c) Standard deviation of steering wheel
Baseline
Page 204
Appendix 6
184
Results show no significant differences between SD of steering wheel on day 1 (.01, .00) and
SD of steering wheel on day 2 (.01, .01) in the baseline scenario.
Eco-driving Results show no significant differences between SD of steering wheel on day 1 (.01, .01) and
SD of steering wheel on day 2 (.01, .01) in the eco-scenario.
Navigation system Results show no significant differences between SD of steering wheel on day 1 (.03, .02) and
SD of steering wheel on day 2 (.02, .01) in the navigation scenario.
CD changing Results show no significant differences between SD of steering wheel on day 1 (.02, .01) and
SD of steering wheel on day 2 (.02, .01) in the CD changing scenario.
d) WRC
Baseline There were no significant differences between WRC on day 1 (.14, .359) and day 2 (.10, .30)
in the baseline scenario.
Eco-driving Results show no significant differences between WRC on day 1 (.33, .483) and WRC on day
2 (.33, .577) in the eco-driving scenario.
Navigation system Results show no significant differences between WRC on day 1 (.48, .680) and WRC on day
2 (.38, .590) in the navigation scenario. However, pair-wise comparison reveals that young and
middle age drivers were significantly different in their wrong response counts, mean difference =
-.433, range = -.813~-.054, p < .05.
CD changing Results show no significant differences between WRC on day 1 (.62, .590) and WRC on day
2 (.38, .669) in the CD changing scenario.
e) MRC
Baseline No significant differences were found between MRC of the first day (.24, .436) and MRC of
the second day (.19, .402) when drivers did not interact with any sort of in-vehicle systems.
Page 205
Appendix 6
185
Eco-driving MRCs were not significantly different between day 1 (.52, .602) and day 2 (.81, .680) when
engaging with eco-driving devices.
Navigation system There were not any significant differences between day 1 (1.19, .928) and day 2 (.76, .944)
for participants’ MRCs.
CD changing Drivers were not significantly different in missing red dots between day 1 (1.00, .894) and
day 2 (.71, .845) in the CD changing scenario. However, a Bonferroni pair-wise comparison
found significant differences between day 1 and day 2, mean difference = .944, range =
.376~1.513, p < .05
A6-4 Location 2 (Baseline Manoeuvre)
a) Minimum speed
Baseline The results show that there was no significant difference between minimum speeds in
baseline scenarios on day 1 (74.87, 5.06) and day 2 (74.74, 5.91). However, significant
differences were found between males and females for a between-subjects factor analysis, F(1,
18) = 12.240, p < .05, = .405, OP = .911. Pair-wise comparison also found significant
differences between males and females, mean difference = 6.356, range = 2.280~10.432, p < .05.
Page 206
Appendix 6
186
Figure 90: Minimum speed for male and female drivers over 2 consecutive days at location 9 (baseline
scenario)
Eco-driving There were also no differences in mean minimum speeds of participants in the eco-driving
scenario between day 1 (72.52, 7.52) and day 2 (74.31, 4.10).
Navigation system No differences were found between minimum speeds of drivers on day 1 (71.46, 7.35) and
day 2 (72.13, 6.10) when they were engaging with the navigation system. However, drivers’ age
group significantly affected minimum speed from day 1 (71.46, 7.35) to day 2 (72.13, 6.10), F(1,
18) = 5.140, p < .05, = .222, OP = 574.
Page 207
Appendix 6
187
Figure 91: Minimum speed for young and middle aged drivers over 2 consecutive days at location 9
(navigation system)
CD changing There was no significant difference between minimum speeds of drivers on day 1 (69.63,
5.41) and day 2 (69.71, 8.01) when they were engaging with the CD changing task.
b) Standard deviation of lateral changes
Baseline There was no practice effect between day 1 (.09, .04) and day 2 (.10, .04) on SD of lateral
shift in the baseline scenario. However, there was a significant difference as an interaction of
practice and age groups between day 1 and day 2, F(1, 18) = 4.789, p < .05, = .210, OP = .544.
Table 80 below shows descriptive statistics for the analysis.
Table 79: Descriptive statistics of standard deviation of lane lateral shift across 2 consecutive days
Gender=Total
Grouped age Mean Std. Deviation N
Standard deviation of lane lateral shift for
baseline scenario-day 1
Young .076770 .0296451 6
Middle age .098271 .0385684 15
Total .092128 .0368787 21
Standard deviation of lane lateral shift for
baseline scenario-day 2
Young .128353 .0527499 6
Middle age .085092 .0239852 15
Total .097452 .0387218 21
Page 208
Appendix 6
188
Figure 92: Standard deviation of lateral shift for young and middle-aged drivers over 2 consecutive days
at location 9 (baseline scenario)
Eco-driving There was no practice effect between day 1 (.14, .05) and day 2 (.13, .05) on SD of lateral
shift in the eco-driving scenario. However, the interaction of the age group practice on day 1 and
day 2 shows marginally significant connection, F (1, 18) = 4.177, p = .056, = .188, OP = .490.
Table 80: Descriptive statistics of standard deviation of lateral shift over 2 consecutive days at location 9
(eco-driving scenario)
Gender=Total
Grouped age Mean
Std.
Deviation N
Standard deviation of lane lateral
shift for eco-driving scenario –
day1
Young .150303 .0693482 6
Middle age .130717 .0450071 15
Total .136313 .0519850 21
Standard deviation of lane lateral
shift for eco-driving scenario –
day2
Young .096199 .0292679 6
Middle age .144366 .0548651 15
Total .130604 .0530890 21
Page 209
Appendix 6
189
Figure 93: Standard deviation of lane lateral shift for young and middle-aged drivers over 2 consecutive
days at location 9 (eco-driving scenario)
Navigation system There was no practice effect between day 1 (.21, .09) and day 2 (.23, .12) on SD of lateral
shift in the navigation driving scenario.
CD changing There was no practice effect between day 1 (.16, .06) and day 2 (.15, .07) on SD of lateral
shift in the navigation driving scenario.
c) Standard deviation steering wheel
Baseline Results show significant differences between SD of steering wheel on day 1 (.0091, .0052)
and SD of steering wheel on day 2 (.0068, .0041), F(1, 18) = 7.879, p < .05, = .304, OP =
.756.
Eco-driving Results show no significant differences between SD of steering wheel on day 1 (.0123, .0106)
and SD of steering wheel on day 2 (.0091, .0057) in the eco-scenario.
Navigation system
Page 210
Appendix 6
190
Results show no significant differences between SD of steering wheel on day 1 (.0329, .0229)
and SD of steering wheel on day 2 (.0252, .0189) in the navigation scenario. However, significant
differences were found for males and females between day 1 and day 2, F(1, 18) = 5.294, p < .05,
= .227, OP = .586.
Table 81: Descriptive statistics for standard deviation of steering wheel over 2 consecutive days at
location 9 (navigation scenario)
Grouped age=Total
Gender Mean
Std.
Deviation N
Standard deviation of steering wheel
for navigation scenario-day 1
Male .036328 .0252011 16
Female .022059 .0060563 5
Total .032931 .0228569 21
Standard deviation of steering wheel
for navigation scenario-day 2
Male .024928 .0201092 16
Female .026180 .0165222 5
Total .025226 .0189257 21
Figure 94: Standard deviation of steering wheel for males and females over 2 consecutive days at location
9 (navigation system)
CD changing Results show no significant differences between SD of steering wheel on day 1 (.0244, .0191)
and SD of steering wheel on day 2 (.0200, .0118) in the CD changing scenario.
d) WRC
Page 211
Appendix 6
191
Baseline There were no significant differences between WRC on day 1 (.33, .483) and day 2 (.00, .00)
in the baseline scenario. However, pair-wise comparison suggests that there was a significant
difference between the 2 days, mean difference = .267, range = .065~.468, p < .05.
Between-subjects analysis shows that there were also significant differences between young
and middle-aged participants ((0, .086) versus (.2, .058)), F(1, 18) = 7.594, p < .05, = .297, OP
= .741.
Eco-driving Results show no significant differences between WRC on day 1 (.33, .483) and WRC on day
2 (.33, .483) in the eco-driving scenario.
Navigation system Results show no significant differences between WRC on day 1 (.38, .805) and WRC on day
2 (.24, .436) in the navigation scenario.
CD changing Results show no significant differences between WRC on day 1 (.65, .587) and WRC on day
2 (.45, .510) in the CD changing scenario. However, between-subjects analyses revealed a
significant difference between males and females in their WRC ((.5, .092) versus (.8, .150)), F(1,
18) = 4.772, p < .05, = .219, OP = .540
e) MRC
Baseline No significant differences were found between MRC of the first day (.71, .561) and MRC of
the second day (.29, .561) when drivers did not interact with any sort of in-vehicle systems.
However, there were significant age group differences across the 2 days, F(1, 18) = 9.890, p <
.05, = .355, OP = .845.
Table 82: Descriptive statistics of MRCs over 2 consecutive days at location 9 (baseline scenario)
Gender=Total
Grouped age Mean
Std.
Deviation N
MRC for baseline scenario- day 1 Young .33 .516 6
Middled age .87 .516 15
Total .71 .561 21
MRC for baseline scenario- day 2 Young .67 .816 6
Middled age .13 .352 15
Total .29 .561 21
Page 212
Appendix 6
192
Figure 95: MRCs of young and middle-aged drivers over 2 consecutive days at location 9 (baseline
scenario)
Eco-driving MRCs were not significantly different between day 1 (.71, .845) and day 2 (.90, .539) when
engaging with eco-driving devices. However, young and middle aged were significantly different
across the 2 days, F(1, 18) = 5.394, p <.05, = 231, OP = .594.
Table 83: Descriptive statistics of MRCs over 2 consecutive days at location 9 (eco-driving scenario)
Gender=Total
Grouped age
Mea
n Std. Deviation N
MRC for eco-driving scenario-day1 Young 1.17 1.169 6
Middled age .53 .640 15
Total .71 .845 21
MRC for eco-driving scenario-day2 Young .50 .548 6
Middled age 1.07 .458 15
Total .90 .539 21
Page 213
Appendix 6
193
Figure 96: MRCs of young and middle-aged drivers across over 2 consecutive days at location 9 (eco-
driving scenario)
Navigation system There were not any significant differences between day 1 (1.38, 1.071) and day 2 (.90, .831)
in participants’ MRCs.
CD changing Drivers were not significantly different in missing red dots between day 1 (1.15, 1.089) and
day 2 (.70, .801) in the CD changing scenario.
Page 214
Appendix 6
194
A6-3 Location 1 (Lane changing)
a) Minimum speed
Baseline The results show that there was no significant difference between minimum speeds in
baseline scenarios on day 1 (71.03, 6.83) and day 2 (72.63, 6.48), F(1, 18) = 1.541, p =
.230, .079, OP = .217. However, a significant difference was found between young and
middle aged drivers in the baseline scenario, F(1, 18) = 6.577, p < .019, .268, OP = .679.
Reviewing the mean shows that young drivers increased their speed from day 1 (66.59, 9.38) to
day 2 (74.83, 4.81).
Figure 97: Minimum speed of young and middle aged drivers over 2 consecutive days at location 1
(Baseline scenario)
Eco-driving There was no measurable difference in mean minimum speed of participants between the eco-
driving scenario on day 1 (70.74, 6.24) and day 2 (71.97, 6.36). It was the same between young
drivers on day 1 (69.21, 7.28) and day 2 (72.82, 6.27). However, male and female drivers were
significantly different in their mean minimum speed on day 1 and day 2, F(1, 18) = 8.795, p <
.05, .328, OP = .801. Males (n=16) tended to increase their speed from (70.91, 6.01) to
(73.62, 4.13), whereas females decreased their speed from (70.20, 7.65) to (66.66, 9.60).
Page 215
Appendix 6
195
Figure 98: Minimum speed of male and female drivers over 2 consecutive days at location 1 (Eco-driving
scenario)
Navigation system No considerable differences were found in minimum speed of drivers between day 1 (64.78,
15.82) and day 2 (67.28, 8.64) when they were engaging in entering a number in the navigation
system.
CD changing No considerable differences were found in minimum speed of drivers between day 1 (66.60,
10.03) and day 2 (68.78, 5.54) in the CD changing scenario.
b) WRC
Baseline There were no significant differences in WRC between day 1 (.14, .359) and day 2 (.19, .40)
in the baseline scenario. However, between-subjects analysis shows that there were significant
differences between young and middle aged participants, F(1, 18) = 4.561, p < .05, = .202, OP
= .524. A pair-wise comparison also shows a marginally significant result between young and
middle aged drivers, mean difference:-.225, range -.459~.009, p = .059.
Eco-driving Results show no significant differences in WRC between day 1 (.62, .590) and WRC in day 2
(.48, .680) in the eco-driving scenario.
Page 216
Appendix 6
196
Navigation system Results show no significant differences in WRC between day 1 (.67, .730) and day 2 (.29,
.561) in the navigation scenario. However, significant differences were found between younger
and middle aged drivers in a between-subjects analysis, F(1, 18) = 5.209, p < .035, = .224, OP
= .579. A Pair-wise comparison also presents a significant result, mean difference:-.433, range:-
.813~-.054, p < .05.
CD changing Results show no significant differences in WRC between day 1 (.90, .831) and day 2 (.71,
.845) in the CD changing scenario.
c) MRC
Baseline No significant differences were found in MRC between day 1 (.48, .680) and day 2 (.14, .359)
when drivers did not interact with any sort of in-vehicle systems. However, the general trend
shows that participants missed fewer red dots on the second day.
Eco-driving MRCs were significantly different between day 1 (1.19, .981) and day 2 (.76, .768) when
participants were engaging with eco-driving devices F(1, 18) = 5.667, p < .05, = .239, OP =
.615. Similarly, a Bonferroni’ pair-wise comparison revealed significant differences between the
two days, mean difference = .544, range: .020~1.069, p < .05.
Navigation system There were significant differences between day 1 (2.29, 1.309) and day 2 (1.71, .902) for
participants’ MRCs, F(1, 18) = 4.590, p < .05, = .203, OP = .527.
CD changing Drivers were significantly different in missing red dots between day 1 (2.10, 1.30) and day 2
(1.33, 1.155) in the CD changing scenario F(1, 18) = 13.999, p < .05, = .437, OP = .942. A
pair-wise comparison provided a similar result, mean difference = .944, range = .376~1.513, p <
.05.
A6-4 Location 4 (Lane changing)
a) Minimum speed
Page 217
Appendix 6
197
Baseline No significant differences were found between mean speeds of day 1 (66.82, 5.74) and day 2
(65.82, 6.42) in the baseline scenario. Similarly, no differences were found between young
(63.98, 6.62) and middle aged (66.60, 2.53) drivers’ minimum speeds.
Eco scenario No significant result was found for location 4 as a practise effect on minimum speed in the
eco-driving scenario, day 1 (66.03, 5.87), day 2 (66.21, 5.27).
Navigation system No differences were found in minimum speeds of drivers between day 1 (64.20, 11.31) and
day 2 (64.64, 5.59) when engaging with the navigation system.
CD changing No differences were found in minimum speeds of drivers between day 1 (62.51, 7.18) and day
2 (62.20, 8.03) when engaging with the CD changing task.
b) Standard deviation of lateral changes
Baseline There was no practice effect from day 1 (.56, .06) to day 2 (.54, .06) on standard deviation of
lateral shift in the baseline scenario.
Eco-driving There was no practice effect from day 1 (.56, .09) to day 2 (.54, .06) on standard deviation of
lateral shift in the eco-driving scenario.
Navigation system There was no practice effect from day 1 (.64, .15) to day 2 (.58, .12) on standard deviation of
lateral shift in the navigation driving scenario.
CD changing There was no practice effect from day 1 (.55, .09) to day 2 (.59, .09) on standard deviation of
lateral shift in the navigation driving scenario. However, there were significant differences
between male and female drivers in their standard deviation of lateral shift when they were
engaging in CD changing, F(1, 18) = 5.029, p < .05, .218, OP = .564. Table 85 below shows
the descriptive statistics of the scenario.
Page 218
Appendix 6
198
Table 84: Gender practice differences on standard deviation of lateral shift in CD changing scenario at
location 4 (CD changing scenario)
Grouped age = Total
Gender Mean Std. Deviation N
Standard deviation of lane lateral
shift for CD changing task-day 1
Male .539230 .0922640 16
Female .590335 .0671191 5
Total .551398 .0882211 21
Standard deviation of lane lateral
shift for CD changing task-day 2
Male .604551 .0982985 16
Female .527641 .0469925 5
Total .586239 .0938899 21
Figure 99: Standard deviation of lateral shift of male and female drivers over 2 consecutive days at
location 4 (CD changing scenario)
c) Standard deviation of steering wheel
Baseline Results show no significant differences in standard deviations of steering wheel between day
1 (.05, .02) and day 2 (.05, .01) in the baseline scenario.
Eco-driving Results show no significant differences in standard deviations of steering wheel between day
1 (.07, .02) and day 2 (.07, .03) in the eco-driving scenario.
Navigation system
Page 219
Appendix 6
199
Results show no significant differences in standard deviations of steering wheel between day
1 (.06, .02) and day 2 (.06, .02) in the navigation scenario.
CD changing Results show significant differences in standard deviations of steering wheel between day 1
(.06, .02) and day 2 (.05, .02) in the CD changing scenario, F(1, 19) = 5.872, p < .026, =
5.872, OP = .630. A pair-wise comparison also shows significant differences between day 1 and
day 2, mean difference=.009, range = 0.0~.049.
d) WRC
Baseline There were no significant differences in WRC between day 1 (.52, .75) and day 2 (.05, .218)
in the baseline scenario. However, a between-subjects analysis shows that there was a marginally
significant difference between young and middle aged participants in their wrong response
counts, F(1, 18) = 4.063, p = .059, = .184, OP = .479.
Figure 100: WRCs of young and middle aged drivers over 2 consecutive days at location 4 (Baseline
scenario)
Eco-driving Results show no significant differences in WRC between day 1 (.52, .680) and day 2 (.52,
.750) in the eco-driving scenario.
Navigation system
Page 220
Appendix 6
200
Results show no significant difference in WRC between day1 (.52, .680) and day 2 (.52, .750)
in the navigation scenario. However, there was a significant difference between young and
middle aged drivers across the two days, F(1, 18) = 7.759, p < .05, = .301, OP = .750.
Figure 101: WRCs of young and middle aged drivers over 2 consecutive days at location 4 (navigation
system)
CD changing Results show no significant differences between WRC in day1 (.76, .768) and WRC in day
2(.71, .784) under CD changing scenario. However there is gender differences as a result of
between-subjects analysis, F (1, 18) =12.208, p<.05, =.404, OP=.910.Pair wise comparison
reveal same significant differences, mean differences=.708, range=.311~1.105, p<.05.
e) MRC
Baseline scenario There was a significant difference between MRC of the first day (1.05, .921) and MRC of the
second day (.52, .750) when drivers did not interact with any sort of in-vehicle systems, F(1, 18)
= 5.749, p < .05, = .242, OP = .621. The same result was found between the two days using a
Bonferroni pair-wise comparison, mean difference = .633, range = .059~1.207.
Eco-driving There was no significant difference between day 1 (1.38, 1.203) and day 2 (.76, .768) when
drivers engaged with an eco-driving system in the simulator. However, the general trend shows
that participants had less MRCs on the second day.
Page 221
Appendix 6
201
Navigation system There was no significant difference between day 1 (2.10, 1.221) and day 2 (1.67, .796) for
participants’ MRCs, F(1, 18) = 3.586, p = .074, = .166, OP = .434.
CD changing There was a significant difference in drivers’ MRC between day 1 (1.90, 1.044) and day 2
(1.10, 1.044), F(1, 18) = 6.433, p < .05, = .263, OP = .670. A pair-wise comparison produced
the same result, mean difference = .789, range = .196~1.382. A pair-wise comparison also
indicated a significant difference between male and female drivers in their MRCs, mean
difference = .925, range = .066~1.784, p < .05.
Page 222
Appendix 6
202
A6-5 Location 5 (Overtaking Manoeuvre)
a) Minimum speed
Baseline The results show that there were no significant differences between minimum speeds in
baseline scenarios on day 1 (48.86, 11.81) and day 2 (50.16, 5.62).
Eco-driving There were also no considerable differences in mean minimum speeds of participants between
eco-driving scenario on day 1 (49.92, 3.78) and day 2 (49.01, 2.62).
Navigation system No differences were found between minimum speeds of drivers on day 1 (51.65, 8.11) and
day 2 (49.68, 3.28) when they were engaging with the navigation system.
CD changing No differences were found between minimum speeds of drivers on day 1 (49.56, 4.34) and
day 2 (50.03, 3.86) when they were engaging with the CD changing task.
b) Lateral shift
Baseline There was significant practice effect between day 1 (.38, .17) and day 2 (.46, .14) on lateral
shift in the baseline scenario, F(1, 18) = 5.545, p < .05, = .235, OP = .606. Pair-wise
comparison also presents significant differences between the 2 days, mean differences = -.088,
range = -.162~-.014, p < .05.
Eco-driving There was no practice effect between day 1 (.44, .15) and day 2 (.46, .15) on lateral shift in
the eco-driving scenario. However, between-subjects effects tests revealed that there were
significant differences between young and middle-aged participants in their lateral shift, F(1,18)
= 4.676, p < .05, = .206, OP = .534. No significant differences found using pair-wise
comparison between young and middle aged drivers, mean differences = -.094, range = -
.229~.014, p = .160.
Navigation system There was no practice effect between day 1 (.53, .15) and day 2 (.49, .13) on lateral shift in
the navigation scenario. However, between-subjects effects revealed that young and middle-aged
Page 223
Appendix 6
203
drivers were significantly different in their lateral shift, F(1, 17) = 15.116, p < .056, = .471,
OP = .955. Pair-wise comparison also found significant differences between young and middle-
aged drivers, mean differences = -.187, range = -.287~-.087, p < .05.
CD changing There was no practice effect between day 1 (.50, .14) and day 2 (.50, .19) on lateral shift in
the CD changing scenario. However, a between age groups analysis revealed significant
differences between young and middle-aged drivers (1, 18) = 9.843, p < .05, = .354, OP =
.843. Pair-wise comparison suggests the same result, mean difference = -.190, range = -.322~-
.059, p < .05.
c) Standard deviation of lateral changes
Baseline There was no practice effect between day 1 (.41, .10) and day 2 (.43, .07) on SD of lateral
shift in the baseline scenario.
Eco-driving There was no practice effect between day 1 (.43, .07) and day 2 (.42, .06) on SD of lateral
shift in the eco-driving scenario.
Navigation system There was no practice effect between day 1 (.45, .08) and day 2 (.43, .06) on SD of lateral
shift in the navigation scenario.
CD changing There was no practice effect between day 1 (.46, .09) and day 2 (.43, .06) on SD of lateral
shift in the CD changing scenario.
d) Standard deviation of steering wheel
Baseline Results show no significant differences between SD of steering wheel on day 1 (.05, .008)
and SD of steering wheel on day 2(.05, .011) in the baseline scenario.
Eco-driving Results show no significant differences between SD of steering wheel on day 1 (.05, .012)
and SD of steering wheel on day 2 (.05, .009) in the eco-scenario. However, significant
Page 224
Appendix 6
204
differences were found between two age groups across 2 consecutive days, F(1, 18) = 10.598, p <
.05, = .371, OP = .868.
Table 85: Descriptive statistics of standard deviation of steering wheel over 2 consecutive days at location
5 (eco-driving scenario)
Gender=Total
Grouped age Mean
Std.
Deviation N
Standard deviation of steering wheel
for eco-driving scenario-day 1
Young .043299 .0102348 6
Middle aged .054384 .0120843 15
Total .051217 .0124394 21
Standard deviation of steering wheel
for eco-driving scenario-day 2
Young .053381 .0083496 6
Middle aged .050401 .0094780 15
Total .051252 .0090673 21
Figure 102: Standard deviation of steering wheel for young and middle-aged drivers over 2 consecutive
days at location 5 (eco-driving scenario)
Navigation-system Results show no significant differences between SD of steering wheel on day 1 (.06, .02) and
SD of steering wheel on day 2 (.06, .02) in the navigation scenario.
CD changing Results show no significant differences between SD of steering wheel on day 1 (.06, .02) and
SD of steering wheel on day 2 (.06, .02) in the CD changing scenario.
Page 225
Appendix 6
205
e) MRC
Baseline No significant differences were found between MRCs on the first day (.90, .700) and MRCs
on the second day (.67, .483) when drivers did not interact with any sort of in-vehicle systems.
However, the general trend shows that participants missed fewer red dots on the second day.
Eco-driving MRCs were not significantly different between day 1 (1.19, .602) and day 2 (1.05, .921) when
engaging with eco-driving devices. However, a test of between-subjects effects revealed
significant gender differences, F(1, 18) = 11.045, p < .05, = .380, OP = .881. Pair-wise
comparison supported the significant results, mean difference = .625, range = .118~1.132, p <
.05.
Navigation system There were significant differences between day 1 (2.00, 1.076) and day 2 (1.35, .745) in
participants’ MRCs, F(1, 17) = 4.668, p < .05, = .215, .531. The results were supported by
pair-wise comparison, mean difference = .711, range = .013~1.109, p < .05.
CD changing Drivers were not significantly different in missing red dots between day 1 (1.76, 1.136) and
day 2 (1.43, 1.165) in the CD changing scenario.
A6-6 Location 10 (Overtaking Manoeuvre) a) Minimum speed
Baseline The results show that there were no significant differences between minimum speeds in
baseline scenarios on day 1 (59.06, 4.60) and day 2 (59.41, 6.98). However, male and female
drivers were significantly different between day 1 and day 2, F(1, 18) = 4.910, p <.05, = .214,
OP = .554. Pair-wise comparison found the same significant results between males and females,
mean difference = -5.376, range = -10.739~-.013, p = .050.
Page 226
Appendix 6
206
Table 86: Descriptive statistics of minimum speed over 2 consecutive days at location 10(baseline
scenario)
Grouped age=Total
Gender Mean
Std.
Deviation N
Minimum speed for baseline
scenario-day 1
Male 50.8781429 5.27075415 16
Female 42.5094909 22.94443939 5
Total 48.8856067 11.80952879 21
Minimum speed for baseline
scenario-day 2
Male 50.4008430 4.99927226 16
Female 49.3959894 7.93670094 5
Total 50.1615922 5.61561362 21
Figure 103: Minimum speed of male and females drivers over 2 consecutive days at location 10 (baseline
scenario)
Eco-driving There was also no measurable differences in mean minimum speeds of participants between
the eco-driving scenario on day 1 (59.72, 6.73) and day 2 (59.03, 5.16).
Navigation system No differences were found between minimum speeds of drivers on day 1 (60.76, 9.31) and
day 2 (58.18, 5.43) when they were engaging with the navigation system.
CD changing
Page 227
Appendix 6
207
No differences were found between minimum speeds of drivers on day 1 (63.54, 8.14) and
day 2 (61.68, 7.69) when they were engaging with the CD changing task.
b) Lateral changes
Baseline There was no significant practice effect between day 1 (.47, .12) and day 2 (.46, .14) on
lateral shift in the baseline scenario.
Eco-driving There was no practice effect between day 1 (.46, .12) and day 2 (.48, .12) on lateral shift in
the eco-driving scenario.
Navigation system There was no practice effect between day 1 (.53, .14) and day 2 (.46, .19) on lateral shift in
the navigation driving scenario.
CD changing There was no practice effect between day 1 (.56, .12) and day 2 (.55, .16) on lateral shift in
the navigation driving scenario.
c) Standard deviation of lateral changes
Baseline There was no practice effect between day 1 (.48, .07) and day 2 (.48, .06) on SD of lateral
shift in the baseline scenario.
Eco-driving There was no practice effect between day 1 (.48, .05) and day 2 (.47, .06) on SD of lateral
shift in the eco-driving scenario.
Navigation system There was no practice effect between day 1 (.47, .07) and day 2 (.47, .09) on SD of lateral
shift in the navigation driving scenario.
CD changing There was no practice effect between day 1 (.47, .07) and day 2 (.46, .05) on SD of lateral
shift in the navigation driving scenario.
Page 228
Appendix 6
208
d) Standard deviation of steering wheel
Baseline Results show that there were no significant differences between SD of steering wheel on day
1 (.04, .013) and SD of steering wheel on day 2 (.04, .017) in the baseline scenario. However,
significant age group differences were found in drivers’ SD of steering wheel between day 1 and
day 2, F(1,18)=4.832, p < .05, = .212, OP = .548.
Table 87: Descriptive statistics of standard deviation of steering wheel over 2 consecutive days at location
10 (baseline scenario)
Gender=Total
Grouped age Mean
Std.
Deviation N
Standard deviation of steering wheel for
baseline scenario- Day 1
Young .034691 .0052437 6
Middle-aged .041502 .0145171 15
Total .039556 .0128194 21
Standard deviation of steering wheel for
baseline scenario- Day 2
Young .049454 .0164804 6
Middle-aged .039696 .0162381 15
Total .042484 .0165190 21
Figure 104: Standard deviation of steering wheel for young and middle-aged drivers over 2 consecutive
days at location 10 (baseline scenario)
Eco-driving Results show no significant differences between SD of steering wheel on day 1 (.04, .017)
and SD of steering wheel on day 2 (.05, .017) in the eco scenario.
Page 229
Appendix 6
209
Navigation system Results show no significant differences between SD of steering wheel on day 1 (.06, .02) and
SD of steering wheel on day 2 (.06, .02) in the navigation scenario.
CD changing Results show no significant differences between SD of steering wheel on day 1 (.06, .04) and
SD of steering wheel on day 2 (.05, .03) in the CD changing scenario.
e) MRC
Baseline No significant differences were found between MRC of the first day (1.33, .966) and MRC of
the second day (1.14, .910) when drivers did not interact with any sort of in-vehicle systems.
However, the general trend shows that participants missed fewer red dots on the second day.
Eco-driving MRCs were not significantly different between day 1 (1.67, 1.017) and day 2 (1.19, 1.030)
when engaging with eco-driving devices. However, a test of between-subjects effects revealed
significant gender differences, F(1, 18) = 5.461, p < .05, = .233, OP = .599. The results are
supported by pair-wise comparison between males and females, mean difference = .800, range =
.037~1.563, p < .05
Navigation system There were no significant differences between day 1 (1.86, .655) and day 2 (1.71, .845) in
participants’ MRCs.
CD changing Drivers were not significantly different in counts of missing red dots between day 1 (1.75,
1.020) and day 2 (1.65, .875) in the CD changing scenario. However, males and females were
significantly different in practice effect for day 1 and day 2, F(1, 17) = 4.976, p < .05, = .226,
OP = .557.
Page 230
Appendix 6
210
Table 88: Descriptive statistics of MRCs over 2 consecutive days at location 10 (CD changing scenario)
Grouped age=Total
Gender Mean Std. Deviation N
MRC for CD changing scenario-
day 1
Male 1.67 1.047 15
Female 2.00 1.000 5
Total 1.75 1.020 20
MRC for CD changing scenario-
day 2
Male 1.80 .941 15
Female 1.20 .447 5
Total 1.65 .875 20
Figure 105: MRCs for male and female drivers over 2 consecutive days at location 10 (CD changing
scenario)
Page 231
Appendix 6
211
A6-7 Location3 (Intersection)
a) Standard deviation of steering wheel
Baseline Results show no significant differences between SD of steering wheel on day 1 (.085, .038)
and SD of steering wheel on day 2 (.103, .056) in the baseline scenario. However, between-
subjects analysis revealed significant group age differences, F(1, 18) = 8.825, p < .05, = .329,
OP = .802. Pair-wise comparison also found a significant difference between young and middle-
aged participants, mean difference = .050, range = .015~.085, p < .05.
Eco-driving Results show no significant differences between SD of steering wheel on day 1 (.094, .057)
and SD of steering wheel on day 2 (.103, .067) in the eco-scenario.
Navigation system Results show no significant differences between SD of steering wheel on day 1 (.100, .047)
and SD of steering wheel on day 2 (.093, .064) in the navigation scenario.
CD changing Results show no significant differences between SD of steering wheel on day 1 (.099, .031)
and SD of steering wheel on day 2 (.094, .031) in the CD changing scenario.
b) MRC
Baseline No significant differences were found between MRC of the first day (.57, .598) and MRC of
the second day (.57, .746) when drivers did not interact with any sort of in-vehicle systems.
However, the general trend shows that participants missed less red dots on the second day.
Eco-driving MRCs were not significant different between day 1 (1.33, 1.278) and day 2 (1.05, 1.071)
when engaging with eco-driving devices.
Navigation system There were significant differences between day 1 (2.29, .956) and day 2 (1.48, .928) in
participants’ MRCs, F(1, 18) = 8.712, p < .05, = .326, .797. Pair-wise comparison also
suggests evidence of significant differences between day 1 and day 2, mean difference = .911,
range = .268~1.554, p < .05.
Page 232
Appendix 6
212
CD changing Drivers were not significantly different in missing red dots between day 1 (1.52, 1.123) and
day 2 (1.14, 1.352) in the CD changing scenario.
A6-8 Location 8 (Intersection)
a) Standard deviation of steering wheel
Baseline Results show no significant differences between SD of steering wheel on day 1 (.050, .022)
and SD of steering wheel on day 2 (.059, .031) in the baseline scenario.
Eco-driving Results show no significant differences between SD of steering wheel on day 1 (.065, .045)
and SD of steering wheel on day 2 (.053, .026) in the eco scenario.
Navigation system Results show no significant differences between SD of steering wheel on day 1 (.081, .086)
and SD of steering wheel on day 2 (.058, .037) in the navigation scenario.
CD changing Results show no significant differences between SD of steering wheel on day 1 (.080, .100)
and SD of steering wheel on day 2 (.073, .051) in the CD changing scenario.
b) MRC
Baseline
No significant differences were found between MRC of the first day (.76, .625) and MRC of
second the day (.62, .805) when drivers did not interact with any sort of in-vehicle systems.
Eco-driving MRCs were not significantly different between day 1 (1.05, .921) and day 2 (.76, .995) when
engaging with eco-driving devices.
Navigation system There were not any significant differences between day 1 (1.67, .856) and day 2 (1.43, 1.076)
in participants’ MRCs.
Page 233
Appendix 6
213
CD changing Drivers were not significantly different in missing red dots between day 1 (1.20, 1.152) and
day 2 (1.30, .865) in the CD changing scenario. However, significant differences were found
between males and females on day 1 and day 2, F(1, 17) = 5.333, p < .05, = .239, OP = .586.
Figure 106: MRCs of male and female drivers over 2 consecutive days at location 8 (CD changing
scenario)
A6-9 Location 6 (Roundabout)
a) MRC
Baseline
Page 234
Appendix 6
214
Results show no significant differences between MRC on day 1 (1.57, .870) and day 2 (1,
.632) in the baseline scenario. However, pair-wise comparison revealed significant differences,
mean differences: .456, p < .05, range: .071~.840.
Eco-driving Results show no significant differences between MRC on day 1 (1.19, .602) and MRC on day
2 (1.33, .856) in the eco-scenario. However, between-subjects analyses found that males
(mean=1.250, standard error=.109) and females (1.100, .189) were significantly different in their
MRC, F(1, 18) = 5.273, p < .05, = .227, OP = .584.
Navigation system Results show no significant differences between MRC on day 1 (1.95, .921) and MRC on day
2 (1.43, .870) in the navigation scenario.
CD changing Results show no significant differences between MRC on day 1 (1.57, .870) and MRC on day
2 (1.14, .854) in the CD changing scenario.
b) SPEED
Baseline There were significant differences between day 1 (31.16, 3.69) and day 2 (34.76, 4.38) in
drivers’ speed in the baseline scenario (1, 18) = 12.728, p < .05, = .414, OP = .921. Similarly,
pair-wise comparison also found significant differences, mean difference = -3.542, range = -
5.419~-1.665, p < .05.
Eco-driving There were no significant differences in speed of participants between day 1 (34.69, 9.75) and
day 2 (36.62, 13.60). However, between-subjects data analyses revealed that there were
significant differences between young (mean = 40.347, standard error = 3.174) and middle-aged
(35.351, 2.129) drivers in their mean speeds, F(1,18) = 5.837, p < .05, = .245, OP = .628, and
the same was found between male (mean = 35.496, standard error = 2.008) and female (40.056,
3.477) drivers, F(1,18) = 4.883, p < .05, = .213, OP = .552.
Navigation system Results show no significant differences between speed on day 1 (31.17, 9.54) and speed on
day 2 (33.63, 10.75) in the navigation scenario.
Page 235
Appendix 6
215
CD changing Results show no significant differences between speed on day 1 (32.26, 9.98) and speed on
day 2 (33.90, 11.24) in the CD changing scenario.
c) Acceleration
Baseline Results show significant differences between acceleration on day 1 (-1.04, .306) and speed on
day 2(-1.24, .298) in the navigation scenario (1, 18) = 7.054, p < .05, = .282, OP = .710.
Similarly, significant differences were found in drivers’ acceleration between the first and second
days, mean difference = .188, range = .055~.322, p < .05.
Eco-driving Results show no significant differences between acceleration on day 1 (-1.16, .409) and day 2
(-1.268, .534) in the eco-scenario. However, there were significant differences between young
and middle-aged drivers on day 1 and day 2, F(1, 18) = 4.452, p < .05, = .198, OP = .515.
There were also significant gender differences revealed in between-subjects analyses, F(1, 18) =
6.092, p < .05, = .253, OP = .646.
Table 89: Descriptive statistics of acceleration over 2 consecutive days at location 6 (Age group)
Gender=Total
Grouped age Mean Std. Deviation N
Acceleration for eco-driving
scenario-day 1
Young -1.359100 .6639933 6
Middle aged -1.083828 .2402914 15
Total -1.162477 .4085061 21
Acceleration for eco-driving
scenario-day 2
Young -1.358248 .4289249 6
Middle aged -1.231701 .5806476 15
Total -1.267857 .5342583 21
Page 236
Appendix 6
216
Figure 107: Acceleration of male and female drivers over 2 consecutive days at location 6 (Age group)
Table 90: Descriptive statistics of acceleration over 2 consecutive days at location 6 (Gender)
Grouped age=Total
Gender Mean Std. Deviation N
Acceleration for eco-driving
scenario-day 1
Male -1.152644 .4591116 16
Female -1.193945 .2057273 5
Total -1.162477 .4085061 21
Acceleration for eco-driving
scenario-day 2
Male -1.120475 .3710177 16
Female -1.739481 .7389414 5
Total -1.267857 .5342583 21
Page 237
Appendix 6
217
Figure 108: Acceleration of male and female drivers over 2 consecutive days at location 6 (Gender)
Navigation system Results show no significant differences between acceleration on day 1 (-1.085, .484) and day
2 (-1.160, .490) in the navigation scenario.
CD changing Results show no significant differences between acceleration on day 1 (-1.102, .471) and day
2 (-1.193, .413) in the CD changing scenario.
A6-10 Location7 (Roundabout)
a) MRC
Baseline Results show significant differences between MRC on day 1 (1.57, .870) and day 2 (1, .632)
in the baseline scenario, F(1, 18) = 5.886, p < .05, = .246, OP = .631. Pair-wise comparison
also found significant differences between participants’ missed response counts over 2 days,
mean difference = .511, range = .138~.884, p < .05.
In addition, between-subjects analysis revealed significant age group differences, F(1, 18) =
6.128, p < .05, = .254, OP = .649. Similarly, pair-wise comparison found significant
differences between younger and middle-aged participants’ missed response counts, mean
difference = .508, range = .077~.939, p < .05
Page 238
Appendix 6
218
Eco-driving Results show no significant differences between MRC on day 1 (.90, .889) and MRC on day 2
(.86, .573) in the eco-scenario.
Navigation system Results show significant differences between MRC on day 1 (1.90, .625) and MRC on day 2
(1.19, .512) in the navigation scenario, F(1, 18) = 17.092, p < .05, = .487, OP = .974. Using
pair-wise comparison, the same results were found between 2 consecutive days, mean difference
= .767, range = .388~1.146, p < .05.
CD changing Results show no significant differences between MRC on day 1 (1.38, 1.16) and MRC on day
2 (.71, 1.007) in the CD changing scenario.
b) Speed
Baseline There were no significant differences between day 1 (41.27, 9.01) and day 2 (45.53, 10.21) in
drivers’ speeds in the baseline scenario.
Eco-driving There were no significant differences in speeds of participants between day 1 (38.87, 10.50)
and day 2 (40.88, 10.65).
Navigation system Results show significant differences between speeds on day 1 (34.07, 10.55) and day 2
(39.33, 11.66) in the navigation scenario, F(1, 18) = 8.248, p < .05, = .314, OP = .775. Pair-
wise comparison also found significant differences between day 1 and day 2, mean difference = -
5.954, range = -10.281~-1.628, p < .05.
CD changing Results show no significant differences between speed on day 1 (37.97, 11.54) and day 2
(43.38, 14.42) in the navigation scenario. However, pair-wise comparison found significant speed
differences between the 2 days while drivers were interacting with the CD changing task, mean
difference = -5.413, range = -10.671~-.154, p < .05.
Page 239
Appendix 6
219
c) Acceleration
Baseline Results show no significant differences between acceleration on day 1 (-1.58, .417) and day 2
(-1.74, .412) in the navigation scenario.
Eco-driving Results show no significant differences between acceleration on day 1 (-1.48, .426) and day 2
(-1.46, .334) in the eco-scenario.
Navigation system Results show significant differences between acceleration on day 1 (-1.22, .503) and day 2 (-
1.470, .549) in the navigation scenario, F(1, 18) = 5.222, p < .05, = .225, OP = .580. Similarly,
a significant result was found using a Bonferroni pair-wise comparison, mean difference = .273,
range = .033~.512, p < .05.
CD changing Results show no significant differences between acceleration on day 1 (-1.375, .379) and day
2(-1.554, .534) in the CD changing scenario.
Page 240
References
220
References/Bibliography
Ajzen, I. (1991). The theory of planned behavior. Organizational Behavior and Human
Decision Processes, 50(2), 179-211.
Angell, L., Auflick, J., Austria, P., Biever, W., Diptiman, T., Hogsett, J., et al. (2007). Driver
Workload Metrics Project, Task 2 Final Report.
Australian Transport Safety Bureau (2004). Road safety in Australia: a publication
commemorating World Health Day 2004: Australian Transport Safety Bureau.
Australian Transport Safety Bureau (2007). Road crash casualties and rates, Australia, 1925
to 2005. Canberra: Commonwealth of Australia.
Barbé, J., & Boy, G. (2006). On-board system design to optimise energy
managementEuropean Annual Conference on Human Decision-Making and Manual
Control Citeseer.
Barkenbus, J. N. (2010). Eco-driving: An overlooked climate change initiative. Energy
Policy, 38(2), 762-769.
Birrell, S. A., & Young, M. S. (2009). Smart Driving Aids and Their Effects On Driving
Performance and Driver Distraction. Paper presented at the First International
Conference on Driver Distraction and Inattention. Gothenburg, Sweden. from
www.chalmers.se/safer/driverdistraction‐en
Boyle, L. N., & Lee, J. D. (2010). Using driving simulators to assess driving safety. Accident
Analysis & Prevention, 42(3), 785-787.
Briem, V., & Hedman, L. R. (1995). Behavioural effects of mobile telephone use during
simulated driving. Ergonomics, 38(12), 2536 - 2562. Retrieved October 24, 2010
Brooks, J. O., Goodenough, R. R., Crisler, M. C., Klein, N. D., Alley, R. L., Koon, B. L., et
al. (2010). Simulator sickness during driving simulation studies. Accident Analysis
& Prevention, 42(3), 788-796.
Cacciabue, P. (2007). Modelling driver behaviour in automotive environments: critical issues
in driver interactions with intelligent transport systems: Springer-Verlag New York
Inc.
Caird, J. K., & Hallihan, G. M. (2011). Effects of Hybrid-Interface on Eco-Driving and
Driver DistractionTRB 2011 Annual Metting.
Cao, A., Chintamani, K. K., Pandya, A. K., & Ellis, R. D. (2009). NASA TLX: Software for
assessing subjective mental workload. Behavior Research Methods, 41(1), 113-117.
CARRS-Q (2010). http://www.carrsq.qut.edu.au/simulator/
Castro, C. (2009). Human factors of visual and cognitive performance in driving: CRC Press,
USA.
Page 241
References
221
Chisholm, S. L., Caird, J. K., & Lockhart, J. (2008). The effects of practice with MP3 players
on driving performance. Accident Analysis & Prevention, 40(2), 704-713.
Cohen, J. (1988). Statistical power analysis for the behavioral sciences: Lawrence Erlbaum.
Cohen, J. (1992). A power primer. Psychological bulletin, 112(1), 155.
Cohen, J. T., & Graham, J. D. (2003). A revised economic analysis of restrictions on the use
of cell phones while driving. Risk Analysis, 23(1), 5-17.
Cooper, J. M., & Strayer, D. L. (2008). Effects of Simulator Practice and Real-World
Experience on Cell-Phone—Related Driver Distraction. Human Factors: The Journal
of the Human Factors and Ergonomics Society, 50(6), 893-902.
Cooper, P. J., & Zheng, Y. (2002). Turning gap acceptance decision-making: the impact of
driver distraction. Journal of Safety Research, 33(3), 321-335.
de Waard, D. (1996). The measurement of drivers' mental workload. University of
Groningen. Retrieved from
http://dissertations.ub.rug.nl/FILES/faculties/ppsw/1996/d.de.waard/09_thesis.pdf
Department of Infrastructure Transport Regional Development and Local Government
(2009). Cost of road crashes in Australia 2006-Report 118. Canberra, Australia.
Farah, H., Bekhor, S., & Polus, A. (2009). Risk evaluation by modeling of passing behavior
on two-lane rural highways. Accident Analysis & Prevention, 41(4), 887-894.
Feenstra, P. J., Hogema, J. H., & Vonk, T. (2008). Traffic safety effects of navigation
systemsIntelligent Vehicles Symposium, June 4-6, 2008 IEEE (pp. 1203-1208).
Field, A. P. (2009). Discovering statistics using SPSS: SAGE publications Ltd.
Gärtner, U., König, W., & Wittig, T. (2001). Evaluation of manual vs. speech input when
using a driver information system in real traffic.
Gray, R., & Regan, D. M. (2005). Perceptual Processes Used by Drivers During Overtaking
in a Driving Simulator. Human Factors: The Journal of the Human Factors and
Ergonomics Society, 47, 394-417.
Greenberg, J., Tijerina, L., Curry, R., Artz, B., Cathey, L., Grant, P., et al. (2003). Evaluation
of driver distraction using an event detection paradigmTRB 2003 Annual Meeting (p.
Unpaged). from http://www.ltrc.lsu.edu/TRB_82/TRB2003-001393.pdf
Hancock, P. A., Lesch, M., & Simmons, L. (2003). The distraction effects of phone use
during a crucial driving maneuver. Accident Analysis & Prevention, 35(4), 501-514.
Harvey, C., Stanton, N. A., Pickering, C. A., McDonald, M., & Zheng, P. (2011). To twist or
poke? A method for identifying usability issues with the rotary controller and touch
screen for control of in-vehicle information systems. Ergonomics, 54(7), 609-625.
Page 242
References
222
Haworth, N., & Symmons, M. (2002). The Relationship Between Fuel Economy And Safety
Outcomes Monash University Accident Research Centre.
Horberry, T., Anderson, J., Regan, M. A., Triggs, T. J., & Brown, J. (2006). Driver
distraction: The effects of concurrent in-vehicle tasks, road environment complexity
and age on driving performance. Accident Analysis & Prevention, 38(1), 185-191.
Horrey, W. J., & Wickens, C. D. (2006). Examining the Impact of Cell Phone Conversations
on Driving Using Meta-Analytic Techniques. Human Factors: The Journal of the
Human Factors and Ergonomics Society, 48, 196-205.
Jahn, G., Oehme, A., Krems, J. F., & Gelau, C. (2005). Peripheral detection as a workload
measure in driving: Effects of traffic complexity and route guidance system use in a
driving study. Transportation Research Part F: Traffic Psychology and Behaviour,
8(3), 255-275.
Jamson, A. H., Westerman, S. J., Hockey, G. R. J., & Carsten, O. M. J. (2004). Speech-Based
E-Mail and Driver Behavior: Effects of an In-Vehicle Message System Interface.
Human Factors: The Journal of the Human Factors and Ergonomics Society, 46(4),
625-639.
Kaptein, N. A., Theeuwes, J., & Horst, R. V. D. (1996). Driving Simulator Validity: Some
Considerations Journal of the Transportation Research Board, 1550, 30-36.
Karlsson, R. (2005). Evaluating driver distraction countermeasures (Vol. 6, pp. 21): VTI.
Keith, K., Trentacoste, M., DePue, L., Granda, T., Huckaby, E., Ibarguen, B., et al. (2005).
Roadway human factors and behavioral safety in europe: Publication FHWA-PL-05-
005. FHWA, US Department of Transportation
Klauer, S., Dingus, T. A., Neale, V. L., Sudweeks, J. D., & Ramsey, D. J. (2006). The impact
of driver inattention on near-crash/crash risk: An analysis using the 100-car
naturalistic driving study data: National Highway Traffic Safety Administration.
Laapotti, S., Keskinen, E., & Rajalin, S. (2003). Comparison of young male and female
drivers' attitude and self-reported traffic behaviour in Finland in 1978 and 2001.
Journal of Safety Research, 34(5), 579-587.
Lam, L. T. (2002). Distractions and the risk of car crash injury: The effect of drivers' age.
Journal of Safety Research, 33(3), 411-419.
Lee, H. C. (2002). The Validity of Driving Simulator to Measure On-Road Driving
Performance of Older Drivers24th Conference of Australian Institutes of Transport
Research School of Civil and Envirnmental Engineering, University of New South
Wales. from www.sidrasolutions.com/documents/CAITR2002_HoeLeePaper.pdf
Lee, J., Forlizzi, J., & Hudson, S. E. (2008). Iterative design of MOVE: A situationally
appropriate vehicle navigation system. International Journal of Human-Computer
Studies, 66(3), 198-215.
Page 243
References
223
Lee, J. D. (2007). Technology and teen drivers. Journal of Safety Research, 38(2), 203-213.
Lee, J. D., Caven, B., Haake, S., & Brown, T. L. (2001). Speech-Based Interaction with In-
Vehicle Computers: The Effect of Speech-Based E-Mail on Drivers' Attention to the
Roadway. Human Factors: The Journal of the Human Factors and Ergonomics
Society, 43, 631-640.
Lesch, M. F., & Hancock, P. A. (2004). Driving performance during concurrent cell-phone
use: are drivers aware of their performance decrements? Accident Analysis &
Prevention, 36(3), 471-480.
Leung, S., & Starmer, G. (2005). Gap acceptance and risk-taking by young and mature
drivers, both sober and alcohol-intoxicated, in a simulated driving task. Accident
Analysis & Prevention, 37(6), 1056-1065.
Liu, Y., & Ozguner, U. (2007). Human Driver Model and Driver Decision Making for
Intersection Driving (pp. 642-647).
Ma, R., & Kaber, D. B. (2005). Situation awareness and workload in driving while using
adaptive cruise control and a cell phone. International Journal of Industrial
Ergonomics, 35(10), 939-953.
Martens, M. H., & Van Winsum, W. (2000). Measuring distraction: the peripheral detection
task. from http://www-nrd.nhtsa.dot.gov/departments/Human%20Factors/driver-
distraction/PDF/34.PDF
Mathern, B., Bellet, T., & Mille, A. (2010). An interative approach to develop a cognitive
model of the driver for human centred design of ITS. Paper presented at the Human
Centred Design for Intelligent Transport Systems. Germany. from
http://www.conference2010.humanist-vce.eu/document/Proceedings/1b_Mathern.pdf
McCartt, A. T., Hellinga, L. A., & Bratiman, K. A. (2006). Cell Phones and Driving: Review
of Research. Traffic Injury Prevention, 7(2), 89 - 106. Retrieved April 22, 2010
Noyes, J. M., & Bruneau, D. P. J. (2007). A self-analysis of the NASA-TLX workload
measure. Ergonomics, 50(4), 514 - 519. Retrieved May 27, 2010
Olsson, S., & Burns, P. C. (2000). Measuring driver visual distraction with a peripheral
detection task.
Patten, C. J. D. (2007). Cognitive Workload and the Driver. Stockholm University,
Stockholm. Retrieved from Stockholm
Pauzie, A. (2008). A method to assess the driver mental workload: The driving activity load
index (DALI). Intelligent Transport Systems, IET, 2(4), 315-322.
Pauzié, A. (2009). Method to Evaluate Driver’s Workload in Real Road Context. Digital
Human Modeling, 453-462.
Page 244
References
224
Peden, M., Scurfield, R., Sleet, D., Mohan, D., Hyder, A. A., Jarawan, E., et al. (2004).
World report on road traffic injury prevention. Geneva: World Health Organization.
Ranney, T. (2008). Driver distraction: A review of the current state-of-knowledge: National
Highway Traffic Safety AdministrationVehicle, U.S. Department of Transportation.
Regan, M. A. (2007). Driver distraction: Reflections on the past, present and
future,Australasian College of Road Safety. (pp. 29-73). Sydney. from
http://www.acrs.org.au/srcfiles/3Regan.pdf
Regan, M. A., Hallett, C., & Gordon, C. P. (2011). Driver distraction and driver inattention:
Definition, relationship and taxonomy. Accident Analysis & Prevention, 43(5),
1771-1781.
Regan, M. A., Lee, J. D., & Young, K. L. (2009). Driver distraction: Theory, effects, and
mitigation: CRC Press, USA.
Rogers, M., Zhang, Y., Kaber, D., Liang, Y., & Gangakhedkar, S. (2011). The Effects of
Visual and Cognitive Distraction on Driver Situation Awareness
Engineering Psychology and Cognitive Ergonomics. In D. Harris (Ed.), (Vol. 6781, pp. 186-
195): Springer Berlin / Heidelberg.
Rubio, S., Díaz, E., Martín, J., & Puente, J. M. (2004). Evaluation of subjective mental
workload: A comparison of SWAT, NASA-TLX, and workload profile methods.
Applied Psychology-an International Review, 53(1), 61-86.
Salvucci, D. (2006). Modeling driver behavior in a cognitive architecture. Human Factors,
48(2), 362.
Shechtman, O., Classen, S., Awadzi, K., & Mann, W. (2009). Comparison of Driving Errors
Between On-the-Road and Simulated Driving Assessment: A Validation Study.
Traffic Injury Prevention, 10(4), 379-385.
Shinar, D., Tractinsky, N., & Compton, R. (2005). Effects of practice, age, and task demands,
on interference from a phone task while driving. Accident Analysis & Prevention,
37(2), 315-326.
Stevens, A., & Minton, R. (2001). In-vehicle distraction and fatal accidents in England and
Wales. Accident Analysis and Prevention, 33(4), 539-546.
Strayer, D., & Drew, F. (2004). Profiles in driver distraction: Effects of cell phone
conversations on younger and older drivers. Human Factors, 46(4), 640.
Strayer, D. L., Drews, F. A., & Johnston, W. A. (2003). Cell phone-induced failures of visual
attention during simulated driving. Journal of experimental psychology: Applied, 9(1),
23.
Strayer, D. L., Watson, J. M., & Drews, F. A. (2011). Cognitive Distraction While
Multitasking in the Automobile. In The Psychology of Learning and Motiviation
(Ed.), (Vol. 54, pp. 29-58). Burlington: Academic Press.
Page 245
References
225
Stutts, J., Feaganes, J., Reinfurt, D., Rodgman, E., Hamlett, C., Gish, K., et al. (2005).
Driver's exposure to distractions in their natural driving environment. Accident
Analysis & Prevention, 37(6), 1093-1101.
Stutts, J. C., Reinfurt, D. W., Staplin, L., & Rodgman, E. A. (2001). The role of driver
distraction in traffic crashes: AAA Foundation for Traffic Safety Washington, DC.
SWOV Fact sheet; Safety effects of navigation systems (2010). SWOV, Leidschendam, the
Netherlands.
Tijerina, L. (2000). Issues in the evaluation of driver distraction associated with in-vehicle
information and telecommunications systems: Transportation Research Inc.
Tijerina, L., Parmer, E., & Goodman, M. J. (1998). Driver workload assessment of route
guidance system destination entry while driving: A test track study5th ITS World
Congress (pp. 12-16). Seoul, Korea: Citeseer.
Turner, C., & McClure, R. (2003). Age and gender differences in risk-taking behaviour as an
explanation for high incidence of motor vehicle crashes as a driver in young males.
Injury Control and Safety Promotion, 10(3), 123-130.
Victorian Automobile Chamber Of Commerce (2005). Driver Distraction Prepared for the
Parliament of Victoria Road Safety Committee Inquiry.
Warshawsky-Livne, L., & Shinar, D. (2002). Effects of uncertainty, transmission type, driver
age and gender on brake reaction and movement time. Journal of Safety Research,
33(1), 117-128.
Wickens, C. (2002). Multiple resources and performance prediction. Theoretical Issues in
Ergonomics Science, 3(2), 159-177.
Wickens, C. (2008). Multiple resources and mental workload. Human Factors, 50(3), 449.
Wood, J., Chaparro, A., & Hickson, L. (2009). Interaction between visual status, driver age
and distracters on daytime driving performance. Vision Research, 49(17), 2225-2231.
World Bank (2002). Road Safety. Retrieved 32-01-2011, from
http://www.worldbank.org/transport/roads/safety.htm
World Health Organization (2004). World Health Day - 2004: road safety. Retrieved
28/01/2011, from http://www.who.int/world-health-day/previous/2004/en/
Young, K., & Regan, M. A. (2007). Driver distraction: A review of the literature. 379-405.
Young, K., Regan, M. A., & Hammer, M. (2003). Driver Distraction:A Review of the
Literature: Monash University.
Young, K. L., & Lenné, M. G. (2010). Driver engagement in distracting activities and the
strategies used to minimise risk. Safety Science, 48(3), 326-332.
Page 246
References
226
Young, M., Birrell, S., & Stanton, N. (2009). Design for Smart Driving: A Tale of Two
Interfaces. Engineering Psychology and Cognitive Ergonomics, 477-485.
Young, M. S., Birrell, S. A., & Stanton, N. A. (2011). Safe driving in a green world: A
review of driver performance benchmarks and technologies to support ‘smart’
driving. Applied Ergonomics, 42(4), 533-539.