Page 1
EXAMINING THE RELATIONSHIP BETWEEN PERFECTIONISM,
SELF-ESTEEM, BODY SATISFACTION, AND BULIMIC BEHAVIOR
A Thesis
by
CRYSTAL ANNE PEARSON
Submitted to the Office of Graduate Studies ofTexas A&M University
in partial fulfillment of the requirements for the degree of
MASTER OF SCIENCE
May 2003
Major Subject: Psychology
Page 2
EXAMINING THE RELATIONSHIP BETWEEN PERFECTIONISM,
SELF-ESTEEM, BODY SATISFACTION, AND BULIMIC BEHAVIOR
A Thesis
by
CRYSTAL ANNE PEARSON
Submitted to Texas A&M Universityin partial fulfillment of the requirements
for the degree of
MASTER OF SCIENCE
Approved as to style and content by:
____________________________ _____________________________David H. Gleaves Mary W. Meagher
(Chair of Committee) (Member)
____________________________ _____________________________Linda G. Castillo W. Steve Rholes (Member) (Head of Department)
May 2003
Major Subject: Psychology
Page 3
iii
ABSTRACT
Examining the Relationship Between Perfectionism, Self-Esteem,
Body Satisfaction, and Bulimic Behavior. (May 2003)
Crystal Anne Pearson, B.A., Mississippi State University
Chair of Advisory Committee: Dr. David H. Gleaves
A variety of risk factors for bulimia nervosa have been proposed including both
environmental factors (e.g., family environment) and personal characteristics (e.g., body
dissatisfaction, self-esteem, and perfectionism). The main goal of this study was to further
examine the relationship between body satisfaction, self-esteem, and perfectionism in the
development of bulimic symptoms. A confirmatory factor analysis on the construct of
perfectionism was conducted to determine if it was best explained as a unidimensional or
a multidimensional construct. Perfectionism was best explained as a construct consisting
of three factors—normal perfectionism, neurotic perfectionism, and orderliness. The
relationship between body satisfaction, self-esteem, and perfectionism in the development
of bulimic behaviors was also examined using structural equation modeling. We did not
find support for a hypothesized three-way interaction among body satisfaction, self-
esteem, and neurotic perfectionism in the development of bulimic behavior. We did find
support for a pair of two-way interactions predicting bulimic behaviors. Interactions
between body satisfaction and self-esteem and body satisfaction and neurotic
perfectionism were predictive of bulimic symptom development.
Page 4
iv
TABLE OF CONTENTS
Page
ABSTRACT . . . . . . . . . . . . . . . . . . . . . . . . . . . . . . . . . . . . . . . . . . . . . . . . . . . . . . . . iii
TABLE OF CONTENTS . . . . . . . . . . . . . . . . . . . . . . . . . . . . . . . . . . . . . . . . . . . . . . iv
LIST OF FIGURES . . . . . . . . . . . . . . . . . . . . . . . . . . . . . . . . . . . . . . . . . . . . . . . . . . . v
LIST OF TABLES . . . . . . . . . . . . . . . . . . . . . . . . . . . . . . . . . . . . . . . . . . . . . . . . . . . vi
INTRODUCTION . . . . . . . . . . . . . . . . . . . . . . . . . . . . . . . . . . . . . . . . . . . . . . . . . . . 1
METHOD . . . . . . . . . . . . . . . . . . . . . . . . . . . . . . . . . . . . . . . . . . . . . . . . . . . . . . . . . 11
Participants . . . . . . . . . . . . . . . . . . . . . . . . . . . . . . . . . . . . . . . . . . . . . . . . . . . 11Procedure . . . . . . . . . . . . . . . . . . . . . . . . . . . . . . . . . . . . . . . . . . . . . . . . . . . . 11Measures . . . . . . . . . . . . . . . . . . . . . . . . . . . . . . . . . . . . . . . . . . . . . . . . . . . . . 11
Demographics . . . . . . . . . . . . . . . . . . . . . . . . . . . . . . . . . . . . . . . . . . . . . . . 11Perfectionism . . . . . . . . . . . . . . . . . . . . . . . . . . . . . . . . . . . . . . . . . . . . . . . . 11Eating disorder symptoms . . . . . . . . . . . . . . . . . . . . . . . . . . . . . . . . . . . . . . 15Self-esteem . . . . . . . . . . . . . . . . . . . . . . . . . . . . . . . . . . . . . . . . . . . . . . . . . 17Body satisfaction . . . . . . . . . . . . . . . . . . . . . . . . . . . . . . . . . . . . . . . . . . . . . 18
Data Analysis . . . . . . . . . . . . . . . . . . . . . . . . . . . . . . . . . . . . . . . . . . . . . . . . . . 20Quality of indicators . . . . . . . . . . . . . . . . . . . . . . . . . . . . . . . . . . . . . . . . . . 20Confirmatory factor analysis of perfectionism . . . . . . . . . . . . . . . . . . . . . . . . 20Structural modeling analyses . . . . . . . . . . . . . . . . . . . . . . . . . . . . . . . . . . . . 21
RESULTS . . . . . . . . . . . . . . . . . . . . . . . . . . . . . . . . . . . . . . . . . . . . . . . . . . . . . . . . . 26
Quality of Indicators . . . . . . . . . . . . . . . . . . . . . . . . . . . . . . . . . . . . . . . . . . . . 26Confirmatory Factor Analysis of Perfectionism . . . . . . . . . . . . . . . . . . . . . . . . . 26Structural Modeling Analyses . . . . . . . . . . . . . . . . . . . . . . . . . . . . . . . . . . . . . . 30
DISCUSSION AND CONCLUSION . . . . . . . . . . . . . . . . . . . . . . . . . . . . . . . . . . . . 41
REFERENCES . . . . . . . . . . . . . . . . . . . . . . . . . . . . . . . . . . . . . . . . . . . . . . . . . . . . . 46
VITA . . . . . . . . . . . . . . . . . . . . . . . . . . . . . . . . . . . . . . . . . . . . . . . . . . . . . . . . . . . . 54
Page 5
v
LIST OF FIGURES
FIGURE Page
1 One, Two, and Three Factor Models of Perfectionism . . . . . . . . . . . . . . . . . . . 22
2 Measurement Model with All Variables . . . . . . . . . . . . . . . . . . . . . . . . . . . . . . 23
3 Measurement Model with Four Factors . . . . . . . . . . . . . . . . . . . . . . . . . . . . . . 25
4 Three Factor Model of Perfectionism with LISREL Estimates . . . . . . . . . . . . . 29
5 LISREL Estimates for the Six Factor Measurement Model . . . . . . . . . . . . . . . . 33
6 Final Measurement Model . . . . . . . . . . . . . . . . . . . . . . . . . . . . . . . . . . . . . . . . 35
7 Path Coefficients (with Standard Errors) for the Body Satisfaction by NeuroticPerfectionism Interaction . . . . . . . . . . . . . . . . . . . . . . . . . . . . . . . . . . . . . . . . . 37
8 Path Coefficients (with Standard Errors) for the Body Satisfaction by Self-EsteemInteraction . . . . . . . . . . . . . . . . . . . . . . . . . . . . . . . . . . . . . . . . . . . . . . . . . . . . 37
Page 6
vi
LIST OF TABLES
TABLE Page
1 Alphas (on Diagonal), Convergent, and Discriminant Validity Coefficients . . . . 13
2 Comparing Models in the CFA of Perfectionism . . . . . . . . . . . . . . . . . . . . . . . . 28
3 Comparing Models in the CFA of Perfectionism without the BPS . . . . . . . . . . . 28
4 Comparing Measurement Models Containing All Variables . . . . . . . . . . . . . . . 31
5 Correlation Estimates (with Standard Errors) between Factors for the Six Factor Model . . . . . . . . . . . . . . . . . . . . . . . . . . . . . . . . . . . . . . . . . . . . . . . 32
6 Comparing Measurement Models Containing the Four Primary Variables . . . . . 32
7 Comparing Two-Way Interaction among the Variables . . . . . . . . . . . . . . . . . . . 36
8 Relationship between Body Satisfaction and Bulimic Symptoms by Level of Neurotic Perfectionism . . . . . . . . . . . . . . . . . . . . . . . . . . . . . . . . . . . . 39
9 Relationship between Body Satisfaction and Bulimic Symptoms byLevel of Self-Esteem . . . . . . . . . . . . . . . . . . . . . . . . . . . . . . . . . . . . . . . . . . . . 40
Page 7
1
This thesis follows the style and format of The Journal of Counseling Psychology.
INTRODUCTION
Numerous risk factors for bulimia nervosa have been proposed, encompassing
both environmental factors, such as family environment, as well as personal
characteristics, including body dissatisfaction, self-esteem, and perfectionism. Although
some of these factors, such as body dissatisfaction, dieting and low self-esteem, have been
consistently found to relate to eating disorders, the relationship between eating pathology
and other factors, such as perfectionism, has been less well defined. One factor that may
contribute to inconsistent findings regarding perfectionism and bulimia nervosa is an
unaccounted for interaction with other risk factors. The purpose of this study was to
further examine the relationship between body satisfaction, self-esteem, and perfectionism
in the development of bulimic symptoms. Additionally, this study explored the nature of
perfectionism, in order to gain a better understanding of the construct itself and its role in
the development of bulimia nervosa.
Dissatisfaction with one’s body has long been proposed as a risk factor for the
development of bulimia nervosa. According to Rosen (1995), “body image dissatisfaction
is the most relevant and immediate antecedent” to the development of an eating disorder
(p. 369). Furthermore, body dissatisfaction is also an important risk factor because it
predicts dieting, which has been found to precede binge eating (Fairburn & Wilson,
1993). Discrepancy between actual and ideal self has been associated both with body
Page 8
2
dissatisfaction and with bulimic behaviors (Strauman, Vookles, Berenstein, Chaiken, &
Higgins, 1991).
Goldfein, Walsh, and Midlarsky (2000) compared three measures of excessive
concern about shape and weight in bulimia nervosa–influence of shape and weight,
overconcern with shape and weight, and dissatisfaction with shape and weight. Compared
to a group of restrained eaters and a group of control participants, the bulimia nervosa
patients scored significantly higher on almost all measures of eating psychopathology, on
discrepancy between current and ideal body shape, on lowest adult weight, and on
measures of general psychopathology. Influence and overconcern but not dissatisfaction
itself was found to successfully discriminate the bulimia nervosa group from controls but
not from the group of restrained eaters. The distinction between the three measures of
concern was made based on the theory that it is the excessive contribution of shape and
weight concerns to self-esteem and not dissatisfaction, per se, that is central to the
concept of bulimia nervosa.
Low self-esteem is another factor which has often been implicated in the
development of bulimia nervosa. Fairburn and Wilson (1993) reported that binge eating
occurs more often in individuals with low self-esteem than those with higher self-esteem.
In one examination (Joiner, Schmidt, & Wonderlich, 1997), the self-esteem of bulimia
nervosa patients was more dependent on body satisfaction than was the self-esteem of the
control group. However, when compared to a sample of depressed patients, the
Page 9
3
relationship between body satisfaction and self-esteem was similar to that of the group
with bulimia nervosa.
Perfectionism is a term frequently researched but rarely well-defined. Perhaps the
central feature of perfectionism is the setting of high standards, but the setting of high
standards is not necessarily, by itself, pathological. Many researchers argue that
perfectionism must be thought of as a multidimensional, rather than unidimensional,
construct. A distinction must be made between normal or adaptive perfectionism, which
allows one to pursue one’s goals, and neurotic or maladaptive perfectionism which may
encompass the more detrimental aspects of perfectionism (Frost, Marten, Lahart, &
Rosenblate, 1990; Hamachek, 1978; Mitzman, Slade, & Dewey, 1994). Hamachek
(1978) described normal perfectionists as those who set high standards but are able to re-
evaluate those standards when needed. Neurotic perfectionism, on the other hand,
typically involves the setting of unrealistically high standards and the inability to accept
mistakes. The normal aspect of perfectionism allows for the setting of realistic goals and
feelings of satisfaction when these goals are achieved. The neurotic aspect of
perfectionism may involve a fear of failure motivational component and may lead to
negative feelings about oneself due to the inability to achieve true perfection (Mitzman,
Slade, & Dewey, 1994).
Perfectionism has been found to relate to many types of psychopathology (see
Frost et al., 1990), including both attitudes and behaviors associated with eating
disorders. Perfectionism has also been found to relate to body dissatisfaction, which as
Page 10
4
described above also influences the development of eating disorders. After previous
findings reported that both normal and neurotic perfectionism were positively related to
body dissatisfaction, Davis (1997) found that rather than functioning in an additive
manner, these aspects of perfectionism related to body esteem in an interactive fashion.
When neurotic perfectionism was low, normal perfectionism was positively associated
with body satisfaction; however, when levels of neurotic perfectionism were high, normal
perfectionism was negatively associated with body satisfaction.
Looking to further examine the construct of perfectionism and its role in eating
disorders, Ashby, Kottman, and Schoen (1998) compared a clinical sample of 24 women
with various types of eating disorders with a group of 166 undergraduate women on
measures of adaptive and maladaptive perfectionism. The maladaptive, or neurotic,
factor consisted of discrepancy, intimacy, anxiety, procrastination, concern over mistakes,
personal expectations, parental criticism, and doubts about actions. The adaptive, or
normal, factor consisted of personal standards, order, standards, and organization.
Although no significant differences between the groups were found on levels of adaptive
perfectionism, the clinical sample had significantly higher scores on maladaptive
perfectionism. In relation to the Eating Disorder Inventory (EDI; Garner, Olmstead, &
Polivy, 1983) maladaptive perfectionism was positively correlated with body
dissatisfaction, ineffectiveness, perfectionism, interpersonal distrust, and interoceptive
awareness, and adaptive perfectionism was not significantly related to any of the EDI
subscales. Those with eating disorders differed on a component of maladaptive
Page 11
5
perfectionism, indicating that they are more likely to engage in the potentially more
damaging aspects of perfectionism than those women without an eating disorder. All of
these results emphasize the importance of evaluating the construct in a multidimensional
manner, in order to gather a more complete understanding of the role of perfectionism in
eating disorders, as normal and neurotic perfectionism may be separate factors and not
merely on opposite ends of a continuum.
In another study, Suddarth and Slaney (2001) found support for the idea that
perfectionism is a multidimensional construct. They conducted an exploratory factor
analysis on three perfectionism scales: Frost et al.’s (1990) MPS, Hewitt and Flett’s
(1991) MPS, and the APS-R (Slaney et al., 1998). They found three orthogonal
factors–Unhealthy Perfectionism (i.e., neurotic perfectionism), Healthy Perfectionism
(i.e., normal perfectionism), and Orderliness. This finding provides additional support for
the concept of normal and neurotic factors of perfectionism, along with a third factor
pertaining to an individual’s need for order.
Hewitt and Flett (1991) also proposed that perfectionism is a multidimensional
construct but with three dimensions, including both personal and social components, and
that these components contribute to severe levels of psychopathology. Their three
proposed dimensions included the following: self-oriented, other-oriented, and socially
prescribed perfectionism. Self-oriented perfectionism is the setting of perfectionistic
standards for onself and the evaluation of one’s behavior based on these high standards,
regardless of how realistic these standards may be. This component of perfectionism also
Page 12
6
includes a motivational aspect, which consists of efforts to avoid failure as well as efforts
to achieve perfection. If one fails to meet the excessively high standards, self-oriented
perfectionism may result in “self-criticism and self-punishment” (p. 457). With other-
oriented perfectionism, the emphasis is on the perfection of others. This component is the
setting of unrealistic standards for others and the strict evaluation of significant others
based on these high standards. If others do not live up to these expectations, the result
may be “other-directed blame, lack of trust, and feelings of hostility towards others”
(p.457). This may also lead to difficulties in interpersonal relationships because
perfectionists may continually strive to find others who can meet their high unrealistically
high standards and may be continually disappointed. Socially prescribed perfectionism
includes the desire to achieve the goals and expectations that significant others have set.
In this domain, perfectionists believe that others have set extremely high standards for
them and expect them to be perfect. Those high in socially prescribed perfectionism may
have greater fears of negative evaluation and may experience feelings of anger and
depression if they are unable to meet the goals set for them by others.
In addition to the three proposed dimensions of perfectionism, Hewitt, Flett, and
Ediger (1995) also proposed that perfectionism consists of social facets involving self-
presentation styles. This self-presentation component is also thought to consists of three
components: “the need to appear perfect, the need to avoid appearing imperfect, and the
need to avoid disclosure of imperfection” (p. 318). In a study of female university
students, Hewitt et al. found self-oriented perfectionism related only to anorexic
Page 13
7
symptoms. Socially-prescribed perfectionism and the dimensions of perfectionistic self-
presentation were related to eating disorder symptoms in general, as well as to body
image avoidance and self-esteem.
Pliner and Haddock (1996) examined Hewitt and Flett’s (1991) three-dimensional
model of perfectionism in weight-concerned and unconcerned participants. Based on
findings that anorexics have been described as high in socially prescribed perfectionism,
the goal of this study was to examine the extent to which these standards were
internalized as self-oriented perfectionism. Participants were 100 college females who
scored above 20 (weight-concerned) or below 6 (unconcerned) on the Eating Attitudes
Test (EAT; Garner & Garfinkel, 1979). In addition to the EAT, subjects completed the
EDI, the Multiple Affect Adjective Check List, and questionnaires designed for use in the
study. Subjects were put into a performance task in which they were asked to generate
uses for common objects and were either assigned high or low goals or asked to select
their own goals. Additionally, participants were asked for their personal goals for each
trial. Subjects were then given false feedback indicating success or failure, and their mood
was measured. Those participants in weight-concerned group were more likely to strive
for an unrealistically high goal set by the experimenter and set lower personal goals when
compared to the controls. Additionally, when measuring mood, the high-scoring group
was more reactive to the feedback, regardless of whether it was positive or negative.
These findings indicate that the weight-concerned group are responding to socially-
prescribed perfectionism rather that self-oriented perfectionism.
Page 14
8
While working to develop The Neurotic Perfectionism Questionnaire (NPQ) as a
measure specifically related to eating disorders, Mitzman et al. (1994) found that this
questionnaire also discriminated between normal and neurotic perfectionism. Examining
the relationship between the various proposed factors of perfectionism (e.g.,
normal/neurotic perfectionism versus self-oriented/other-oriented/socially prescribed
perfectionism), they reported that items at the normal end of the NPQ were mainly
composed of questions representing self-oriented perfectionism, whereas items at the
neurotic end tended to consist of a mixture of both self-oriented and socially prescribed
perfectionism. Very few items appeared to be tapping the idea of other-oriented
perfectionism, which they argued was an indication that this dimension was less relevant
in the study of eating disorders.
Seeking to account for some of the proposed risk factors for an eating disorder,
including perfectionism, Vohs, Bardone, Joiner, Abramson, and Heatherton (1999)
proposed a 3-factor model in which self-esteem, perfectionism, and perceived weight
status interacted to predict bulimic symptom development. In a prospective examination
of 342 female college students, Vohs et al. had the participants complete the EDI-Bulimia
and Perfectionism subscales and the State Self-Esteem Scale (SSES; Heatherton &
Polivy, 1991) and to report whether they perceived themselves as being overweight. An
interaction among these risk factors was found, such that women who reported high
levels of perfectionism and who considered themselves to be overweight, showed
symptoms of bulimia nervosa only if they had low self-esteem. Those women with high
Page 15
9
self-esteem were much less likely to report bulimic symptoms even when they considered
themselves to be overweight and reported highly perfectionistic attitudes. Bardone, Vohs,
Abramson, Heatherton, and Joiner (2000) proposed several implications for this model in
the areas of assessment, treatment, and prevention of bulimic symptoms and suggested
that altering any one of the three factors should result in lower levels of reported bulimic
symptoms.
The primary goal of this study was to further explore the relationship among the
proposed risk factors in the model of Vohs et al. (1999). Before this model can be used as
a guide, the factors in the model itself needed to be more adequately tested to address
potential concerns about the way in which they were initially measured and to ensure that
these findings remain consistent. For example, as described above, perfectionism had been
postulated to consist of more than one dimension, although there was disagreement
regarding exactly how many dimensions compose this construct. More comprehensive
measures of general perfectionism, including proposed dimensions, were employed to
more thoroughly assess this construct. A confirmatory factor analysis of perfectionism
was conducted to determine if it was best explained as a multidimensional or a
unidimensional construct. Based on the previous research, it was expected that the
construct of perfectionism would be multidimensional, consisting of either two or three
factors. Additionally, both self-esteem and body dissatisfaction were more completely
assessed using self-report measures of these constructs.
Page 16
10
To further examine the relationship between the three factors in the model,
comprehensive measures of self-esteem, body satisfaction, and perfectionism, including
proposed dimensions were utilized to test the hypothesis that these variables interact to
predict bulimic symptoms. More specifically, it was predicted that high levels of body
dissatisfaction would predict bulimic symptoms only among those participants who had
high levels of neurotic perfectionism, and that this relationship would occur only among
those with low levels of self-esteem.
Page 17
11
METHOD
Participants
Initial participants were 304 female college students, ages 16 to 23 (M = 18.75,
SD = 1.00) from introductory psychology classes at a large southwestern university.
Eighty-three percent of the students were Caucasian, 2% were African-American, 10%
were Hispanic, 3% were Asian-American, and 2% were classified as Other. Participants
received course credit for their participation. Data from 18 participants were deleted
listwise for having 10 or more missing data points; therefore, 286 participants were used
for all analyses.
Procedure
A group administration format was used. After giving informed consent,
participants completed a packet consisting of all the measures, presented in random order.
Most participants completed the study in 35 to 70 minutes.
Measures
Demographics. Each participant completed a questionnaire providing basic
demographic information including age, race, height, and weight. See Table 1 for the
alpha and validity coefficients of the measures.
Perfectionism. Frost’s Multidimensional Perfectionism Scale (MPS: Frost et al.,
1990) is a 35-item scale designed to measure normal and neurotic perfectionism using a
5-point Likert scale (1 = “strongly disagree” to 5 = “strongly agree”). It contains the
following subscales: Personal Standards, Concern over Mistakes, Organization, Doubting
Page 18
12
Actions, Parental Expectations, and Parental Criticism. The total score is computed by
summing all of the subscales scores with the exception of Organization, which did not
correlate well with the other subscales. According to Frost et al., (1990), coefficient
alphas for the subscales ranged from .77 to .93, and the reliability of the total scale was
.90. In this sample, alphas for the subscales ranged from .65 to .93.
The Burns Perfectionism Scale (BPS; Burns, 1983) is a 10-item measure of
neurotic aspects of perfectionism. It is scored on a 5-point Likert scale, ranging from “I
disagree strongly” to “I agree very much.” The BPS has been found to have a test-retest
coefficient of .78 over a 6-week period and .63 over a 2-month period, and tests of
internal consistency produced coefficient alphas ranging from .70 to .78 (Hewitt,
Mittelstaedt, & Wollert,1989). In the current study, alpha for the BPS was .81.
Page 19
13
Tabl
e 1
Alph
as (o
n D
iago
nal),
Con
verg
ent,
and
Dis
crim
inan
t Val
idity
Coe
ffici
ents
12
34
56
78
910
1112
1314
1516
1718
1920
21
1.M
PS-C
M.8
8
2.M
PS-P
E.29
.65
3.M
PS-P
C.46
.62
.86
4.M
PS-D
A.66
.33
.54
.78
5.A
PSR
-
DIS
C
.69
.32
.48
.69
.93
6.B
PS.76
.23
.35
.57
.61
.81
7.N
PQ.75
.37
.57
.77
.78
.67
.94
8.M
PS-P
S.3
2.1
2.0
2.1
6.1
6.4
4.2
2.8
1
9.A
PSR
-
STA
N.0
7.0
0-.1
3-.0
3-.0
3.2
3-.0
2.63
.84
10.M
PS-O
.04
.00
-.09
.04
-.01
.13
-.03
.27
.33
.93
11.A
PSR
-
O
RD
.10
.01
-.05
.07
.04
.21
.02
.31
.40
.87
.88
12.B
IA.1
7.0
6.1
4.2
1.2
4.1
2.2
6.0
8-.0
7.0
3.0
3N
A
13.B
ES-
W
T-.3
3-.1
0-.2
6-.3
3-.3
9-.3
1-.4
2.0
4.1
4.0
5.0
1-.61
.92
14.B
SS-
B
OD
.38
.19
.31
.37
.42
.31
.43
.01
-.09
-.03
-.04
.39
-.66
.80
15.B
SQ.4
3.1
9.2
7.4
6.4
6.3
8.5
6.0
8-.0
3.0
6.0
9.61
-.76
.52
.97
Page 20
14
Tabl
e 1
Con
tinue
d
Alph
as (o
n D
iago
nal),
Con
verg
ent,
and
Dis
crim
inan
t Val
idity
Coe
ffici
ents
12
34
56
78
910
1112
1314
1516
1718
1920
21
16.S
ES-.6
2-.1
9-.4
2-.6
0-.6
6-.5
0-.7
2.0
5.2
3.0
8.0
4-.2
5.5
0-.4
7-.5
1.9
1
17.S
EI.5
2.2
7.4
8.6
4.6
1.4
4.7
0-.0
8-.2
3-.0
8-.0
7.2
1-.3
7.4
2.4
2-.66
.80
18.S
EIJ
-.72
-.29
-.53
-.69
-.69
-.59
-.80
-.03
.24
.09
.05
-.26
.45
-.45
-.48
.82
-.71
--
19.E
AT-
B
UL
.15
.08
.19
.24
.17
.17
..26
.06
.03
.13
.03
.28
-.25
.18
.43
-.16
.23
-.20
.89
20.B
ULI
T.3
9.1
7.2
8.4
5.4
4.4
0.5
3.0
9.0
5.0
2.0
5.5
2-.6
0.4
3.8
3-.4
8.3
9-.4
6.56
.96
21.B
ITE-
S
YM
.39
.15
.25
.46
.44
.40
.52
.09
.06
.02
.06
.51
-.57
.44
.76
-.46
.43
-.47
.48
.85
.86
Page 21
15
The Neurotic Perfectionism Questionnaire (NPQ) was developed by Mitzman et
al. (1994) to assess the specific attitudes and experiences of neurotic perfectionism
hypothesized to be related to eating disorders. The NPQ consists of 42 items rated on a
5-point scale (1 = strongly disagree to 5 = strongly agree), with higher scores indicating
neurotic perfectionism. Mitzman et al. (1994) found internal consistency of the NPQ to
be satisfactory (alpha = .95) and found it to discriminate normal from neurotic
perfectionism. An alpha of .94 was found in the current study.
The Almost Perfect Scale-Revised (APS-R; Slaney et al., 1998) consists of 23
items that measure positive and negative dimensions of perfectionism. The APS-R
contains 3 subscales: Standards, Order, and Discrepancy (Slaney et al., 2001). The
Standards subscale examines personal standards, the Order subscale was found to
measure organization and the need for order, and the Discrepancy subscale measures the
level of distress that occurs when a person experiences a disparity in performance and
personal standards. Higher scores indicate higher levels of the aspect of perfectionism
measured by that subscale. In an examination by Slaney et al. (2001), internal consistency
of the subscales ranged from .82 to .91 and good convergent and divergent validity for
the scale was found. In the current sample, alphas for the subscales ranged from .84 to
.93. Again, see Table 1 for details.
Eating disorder symptoms. The Bulimia Test (BULIT) was developed in 1984 by
Smith and Thelen. The BULIT was a 32 item, multiple choice inventory constructed by
comparing the responses of a clinical sample of bulimic subjects with normal female
Page 22
16
college students on 75 questions based on the DSM-III criteria for bulimia (Smith &
Thelen, 1984). In 1991, the BULIT was revised to be consistent with criteria for bulimia
nervosa in the DSM-III-R (Thelen, Farmer, Wonderlich, & Smith, 1991). The BULIT-R
contains 36 items and is highly correlated with the original version (Williamson,
Anderson, & Gleaves, 1996). Brelsford, Hummel, and Barrios (1992) found support for
the internal consistency of the revised measure (coefficient alpha of .90 for the binge
eating measures and an alpha of .93 for purging measures) and for the test-retest
reliability of the measure. They also found support for the construct validity of the
inventory by evaluating the correlations between the BULIT-R and self-monitored binge
eating and purging. In the current examination, internal consistency of the BULIT-R was
satisfactory (alpha = .96).
The BULIT-R has also been found to measure the symptoms of bulimia nervosa
as defined by DSM-IV criteria (Thelen, Mintz, & Vander Wal, 1996). Using DSM-IV
criteria, the sensitivity, specificity, and negative predictive power were all found to be
above .90, and the positive predictive power was found to be .81 (Thelen et al., 1996).
These figures were computed using a cut score of 104 to differentiate bulimics from non-
bulimics; however, all of the false positives for bulimia were classified with a diagnosis of
eating disorder not otherwise specified.
The Eating Attitudes Test (EAT; Garner & Garfinkel, 1979) was designed to
assess thoughts and behaviors related to anorexia nervosa. Internal consistency of the
EAT was found to be .79 (Garner & Garfinkel, 1979) and test-retest reliability was .84
Page 23
17
over a 2-3 week period (Carter & Moss, 1984). The EAT originally contained 40 items
but after factor analysis, a 26-item version (EAT-26) was developed to eliminate
unnecessary items. Items are scored on a 6-point Likert-type format ranging from
“always” to “never.” The EAT and the EAT-26 were found to be highly correlated
(Garner, Olmstead, Bohr, & Garfinkel, 1982). The EAT-26 consists of 3 subscales:
Dieting, Bulimia and Food Preoccupation, and Oral Control (Garner et al., 1982). The
Bulimia and Food Preoccupation subscale was used in this study, as the primary concern
was predicting bulimic symptomatology. The internal consistency of the Bulimia subscale
of the EAT-26 was found to be .89 in this study.
The Bulimic Investigatory Test, Edinburgh (BITE; Henderson & Freeman, 1987)
consists of 33 items designed to detect and describe binge eating. It contains 2
subscales–symptom and severity. Cutoff scores of 20 on the symptom scale and of 5 on
the severity scale have been suggested to define bulimia. Henderson and Freeman (1987)
reported internal consistencies of .96 for the symptom subscale and of .62 for the severity
subscale. Test-retest reliability at 1-week was .86 and at 15-weeks was .68 (Henderson &
Freeman, 1987). The BITE was found to correlate significantly with other measures of
binge eating (Henderson & Freeman, 1987; Waller, 1992). The symptom scale of the
BITE was used in this study as a measure of bulimic behaviors, and the internal
consistency of this scale was found to be .86.
Self-esteem. The Rosenberg Self-Esteem Scale (SES; Rosenberg, 1965) consists
of 10-items measuring global self-esteem. Respondents provide answers based on a 4-
Page 24
18
point scale, ranging from “strongly agree” to “strongly disagree,” with higher scores
indicating higher levels of self-esteem. Griffiths et al., (1999) found that the SES has
strong construct and convergent validity when used in a dieting disordered sample, and it
was also a strong predictor of psychopathology related to disordered eating behaviors
and attitudes. The SES was found to have a coefficient alpha of .91 in the current sample.
The Coopersmith Self-Esteem Inventory (SEI; Coopersmith, 1967) is a 25-item
measure of self-evaluative attitudes across several domains. Although the SEI was
originally designed for use with children, an adult form is also available for individuals
ages 16 and older (Blascovich & Tomaka, 1991; Pervin, 1993). Acceptable reliability and
validity have been reported for the SEI (Blascovich & Tomaka, 1991). For the SEI, the
alpha was found to be .80 in this study. The Self-Esteem Inventory (SEI-J; Jerabek,
1996) assesses evaluative attitudes toward the self and consists of 30 items. Internal
consistency for the SEI-J could not be calculated by the examiner, as this measure was
scored on-line yielding only a total scale score.
Body satisfaction. The Body Esteem Scale (BES; Franzoi & Shields, 1984)
consists of 35 items, listing both body parts and functions. Respondents assess the items
on a 5-point Likert scale, ranging from “have strong negative feelings” to “have strong
positive feelings.” Three separate subscales have been identified for both males and
females. The female subscales include Sexual Attractiveness, Weight Concern, and
Physical Condition. The Sexual Attractiveness subscale deals with items relating to
physical attractiveness. The body parts on this factor are those that generally can only be
Page 25
19
altered through cosmetic or surgical enhancement. Body parts that can be altered through
physical exercise or diet are included on the Weight Concern subscale. The final subscale
includes items relating to agility and strength. The BES has been found to have high test-
retest reliability over a 3-month period (Franzoi, 1994). For females, test-retest reliability
ranged from .75 for the Physical Condition subscale to .87 for the Weight Concern
subscale. Due to its emphasis on measuring concerns about one’s body and appearance,
the Weight Concern subscale was used to assess body dissatisfaction, with lower scores
indicating greater levels of dissatisfaction. In this study, the alpha of the BES Weight
Concern subscale was .92.
The Body Image Assessment Procedure (BIA; Williamson, Davis, Bennett,
Goreczny, & Gleaves, 1989) was originally developed to be administered individually as a
measure of body image disturbance. Ratings of current and ideal body size are used to
compute a measure of body dissatisfaction (current-ideal discrepancy). This study used a
group administration format of the BIA (Williams, Gleaves, Cepeda-Benito, Erath, &
Cororve, 2001) that consists of nine female silhouettes, ranging from very thin to very
obese. Participants were asked to look at the randomly arranged silhouettes and selected
the one that most closely resembled their ideal and current body sizes. The group
administered format has been found to have good test-retest reliability and construct
validity (Williams et al., 2001).
The Body Shape Questionnaire (BSQ; Cooper, Taylor, Cooper, & Fairburn,
1987) contains 34 items designed to measure concerns with body shape. Participants rate
Page 26
20
items on a 6-point Likert scale, ranging from “never” to “always.” In this sample, the
BSQ had an alpha of .97. The Body Satisfaction Scale-Body Subscale (BSS-BOD; Slade,
Dewey, Newton, Brodie, & Kiemle, 1990) examines satisfaction with 8 body parts and
was found to have a coefficient alpha of .80 in the current study.
Data Analysis
Quality of indicators. Preliminary steps were taken to examine the quality of each
potential indicator by first examining Chronbach’s alpha to assess the internal consistency
of each measure. Then, a correlation matrix of all the variables was examined as a
preliminary check of convergent and discriminant validity.
Confirmatory factor analysis of perfectionism. Using the LISREL 8.52 program
(Jöreskog & Sörbom, 2002), a confirmatory factor analysis was conducted on the
perfectionism measures to determine the number of dimensions that best fit the construct.
It was predicted that either a two-factor model, representing the dimensions of normal
and neurotic perfectionism, or a three-factor model, with an added dimension of
orderliness, would best fit the data. These models were compared to a unidimensional
model. See Figure 1 for a diagram of the factor structures to be compared and the
subscales comprising the factors in each model. The fit of the model was determined by
examining the P2 statistic, the Goodness-of-Fit Index (GFI; Jöreskog & Sörbom, 1998),
the Adjusted Goodness-of-Fit Index (AGFI), the Comparative Fit Index (CFI; Bentler,
1990), the Normed Fit Index (NFI; Bentler & Bonett, 1980), the Tucker-Lewis Index
(TLI; see Marsh, Balla, & McDonald, 1988) and the root mean square error of
Page 27
21
approximation (RMSEA; Browne & Cudeck, 1993). Values of the GFI, AGFI, CFI, NFI,
and TLI range from zero to 1.00. Higher values indicate better fit, and values at .8 or
above are considered to indicate a good fit. When evaluating the RMSEA, values of .05
or lower are considered to be a close fit, and values less than .08 are considered to be an
adequate fit. The fit of the individual parameters of the model were determined by
examining t-values, standardized residuals, and modification indices. Models were
compared using P2 difference tests. On the model with the most support, discriminant
validity was tested by examining confidence intervals around factor intercorrelations.
Structural modeling analyses. A two-step approach was used in the structural
modeling analyses (Anderson & Gerbing, 1989). In the first step, the measurement model
was examined in two stages using confirmatory factor analysis. Initially, all of the
variables were examined to determine if the data best fit a five-dimensional model with
latent dimensions of normal perfectionism, neurotic perfectionism, self-esteem, body
dissatisfaction, and bulimic behaviors. This five-dimensional model was tested against an
alternative model with one dimension and a model with an added sixth dimension of
orderliness, as suggested by the previous factor analysis of perfectionism. The purpose of
this analysis was to further examine discriminant validity among all the variables. Figure 2
illustrates the measurement model with six dimensions.
Page 28
22
APSR
-STAN
MPS-PS
APSR
-DISC
NPQ
APSR-O
RD
BPS
MPS-O
MPS-PC
MPS-CM
MPS-D
A
Perfectionism
APSR
-STAN
MPS-PS
APSR
-DISC
NPQ
APSR-O
RD
BPS
MPS-O
MPS-PC
MPS-CM
MPS-PC
MPS-CM
MPS-D
A
Perfectionism
MPS-PC
APSR-STA
N
MPS-PS
APSR-D
ISC
NPQ
APSR-O
RD
BPS
MPS-O
MPS-C
M
MPS-D
A
NeuroticPerfectionism
NormalPerfectionism
MPS-PC
APSR-STA
N
MPS-PS
APSR-D
ISC
NPQ
APSR-O
RD
BPS
MPS-O
MPS-C
M
MPS-D
A
MPS-PC
APSR-STA
N
MPS-PS
APSR-D
ISC
NPQ
APSR-O
RD
BPS
MPS-O
MPS-C
M
MPS-D
A
NeuroticPerfectionism
NormalPerfectionism
NeuroticPerfectionism
NormalPerfectionism
MPS-PC
APSR
-STAN
MPS-PS
APSR
-DISC
NPQ
APSR
-OR
D
BPS
MPS-O
MPS-CM
MPS-D
A
NeuroticPerfectionism
NormalPerfectionism Order
MPS-PC
APSR
-STAN
MPS-PS
APSR
-DISC
NPQ
APSR
-OR
D
BPS
MPS-O
MPS-CM
MPS-D
A
MPS-PC
APSR
-STAN
MPS-PS
APSR
-DISC
NPQ
APSR
-OR
D
BPS
MPS-O
MPS-CM
MPS-D
A
NeuroticPerfectionism
NormalPerfectionism Order
NeuroticPerfectionism
NormalPerfectionism Order
Figure 1. One, Two, and Three Factor Models of Perfectionism
Page 29
Neu
rotic
Perf
ectio
nism
Nor
mal
Perf
ectio
nism
Ord
erSe
lf-Es
teem
Body
Satis
fact
ion
Bul
imic
Beh
avio
r
MPS-PC
APSR-STAN
MPS-PS
APSR-DISC
NPQ
APSR-ORD
BPS
MPS-O
MPS-CM
MPS-DA
SES
SEI
SEIJ
BIA
BES-WT
BSS-BOD
BULIT-R
EAT-BUL
BITE-SYMP
Neu
rotic
Perf
ectio
nism
Nor
mal
Perf
ectio
nism
Ord
erSe
lf-Es
teem
Body
Satis
fact
ion
Bul
imic
Beh
avio
rN
euro
ticPe
rfec
tioni
smN
orm
alPe
rfec
tioni
smO
rder
Self-
Este
emBo
dySa
tisfa
ctio
nB
ulim
icB
ehav
ior
MPS-PC
APSR-STAN
MPS-PS
APSR-DISC
NPQ
APSR-ORD
BPS
MPS-O
MPS-CM
MPS-DA
SES
SEI
SEIJ
BIA
BES-WT
BSS-BOD
BULIT-R
EAT-BUL
BITE-SYMP
MPS-PC
APSR-STAN
MPS-PS
APSR-DISC
NPQ
APSR-ORD
BPS
MPS-O
MPS-CM
MPS-DA
SES
SEI
SEIJ
BIA
BES-WT
BSS-BOD
BULIT-R
EAT-BUL
BITE-SYMP
23
Figu
re 2
. Mea
sure
men
t Mod
el w
ith A
ll V
aria
bles
Page 30
24
Then, the measurement model was examined using only the variables
hypothesized to play a role in the three-way interaction. Using confirmatory factor
analysis, a four-dimensional model with latent dimensions of neurotic perfectionism, self-
esteem, body satisfaction, and bulimic symptoms was compared to a one-dimensional
model. Figure 3 illustrates the measurement model with 4 dimensions. Model fit for these
analyses was determined by examining the P2 statistic, GFI, AGFI, NFI, CFI, TLI, and
RMSEA, and fit of the individual model parameters was determined by examination of t-
values. For the models with the best fit, discriminant validity was tested by examining the
confidence intervals around factor intercorrelations.
Then, the structural model was tested by re-specifying the data to be consistent
with the hypothesis that neurotic perfectionism, self-esteem, and body satisfaction interact
to predict bulimic behavior. An illustration of the structural model appears in Figure 3. It
was expected that neurotic perfectionism, body satisfaction, and self-esteem would
interact to predict bulimic symptoms, such that high levels of body dissatisfaction would
predict bulimic symptoms only among those participants who had high levels of neurotic
perfectionism, and that this relationship would occur only among those with low levels of
self-esteem. To examine the proposed interaction effects, Jaccard and Wan’s (1996)
approach to modeling interaction effects was used.
Page 31
MPS-PC
APSR-DISC
NPQ
BPS
MPS-CM
MPS-DA
SES
SEI
SEIJ
BIA
BES-WT
BSS-BOD
BULIT-R
EAT-BUL
BITE-SYMP
Neu
rotic
Perf
ectio
nism
Self-
Este
emBo
dy
Satis
fact
ion
Bulim
icSy
mpt
oms
MPS-PC
APSR-DISC
NPQ
BPS
MPS-CM
MPS-DA
SES
SEI
SEIJ
BIA
BES-WT
BSS-BOD
BULIT-R
EAT-BUL
BITE-SYMP
MPS-PC
APSR-DISC
NPQ
BPS
MPS-CM
MPS-DA
SES
SEI
SEIJ
BIA
BES-WT
BSS-BOD
BULIT-R
EAT-BUL
BITE-SYMP
Neu
rotic
Perf
ectio
nism
Self-
Este
emBo
dy
Satis
fact
ion
Bulim
icSy
mpt
oms
Neu
rotic
Perf
ectio
nism
Self-
Este
emBo
dy
Satis
fact
ion
Bulim
icSy
mpt
oms
25
Figu
re 3
. Mea
sure
men
t Mod
el w
ith F
our F
acto
rs
Page 32
26
RESULTS
Quality of Indicators
Internal consistency for each of the measures ranged from alpha = .65 to .96. The
MPS-PE was removed from further analyses due to a low Chronbach’s alpha. The BSQ
was eliminated from further analyses due to poor discriminant validity, meaning it
correlated no more highly with other measures of body satisfaction than with measures of
the other constructs. Alpha and validity coefficients for the measures were presented in
Table 1.
Confirmatory Factor Analysis of Perfectionism
Evaluation of the indicators revealed significant problems with non-normality of
the data. To account for this problem, confirmatory factor analysis using maximum
likelihood with robust standard errors was used as the estimation method (West, Finch, &
Curran, 1995). Additionally, all variables were centered.
The results of the confirmatory factor analysis are presented in Table 2. The two-
factor model, consisting of normal and neurotic factors, was found to fit significantly
better than a unidimensional model of perfectionism, )P2 (1, N = 286) = 1532.11, p < .01.
The two-factor model was then compared to a three-factor model, consisting of an added
factor encompassing an organizational dimension in addition to the factors of normal and
neurotic perfectionism, and the three factor model led to a significant P2 reduction, )P2
(2, N = 286) = 97.28, p < .01. Additionally, the other goodness of fit indices generally
supported the three-dimensional model over the unidimensional and two-factor models.
Page 33
27
T-values for the factor loadings were acceptable, but examination of modification
indices indicated that changes in the model could improve model fit. The examination of
the modification indices revealed that the Burns Perfectionism Scale appeared to be
causing difficulty with the fit of the model; therefore, the confirmatory factor analyses
were conducted again after removing the BPS from the analyses. The removal of the BPS
resulted in an improvement in the fit of the models, with the three-factor model
continuing to best explain the data. Table 3 contains the results of these analyses.
This three-factor model was further examined to evaluate overall model fit. All t-
values for the factor loadings exceeded the cutoff of t > 2.00, indicating that these
individual parameters were statistically significant and were important components of the
model. T-values ranged from t = 10.64 to 21.75. Squared multiple correlations for the
variables ranged from .36 to .88. The three factors in this model of perfectionism were
the neurotic factor, the normal factor, and the orderliness factor. A diagram of this model,
including factor loadings and factor intercorrelations is presented in Figure 4. The
subscales comprising the neurotic factor were Concern over Mistakes, Doubts about
Actions, and Parental Criticism subscales from the MPS; the Discrepancy subscale from
the APS-R; and the Neurotic Perfectionism Questionnaire. The Personal Standards
subscale of the MPS and the Standards subscale of the APS-R made up the normal
perfectionism factor. The orderliness factor included the Organization subscale from the
MPS and the Order subscale from the APS-R.
Page 34
28
Table 2
Comparing Models in the CFA of Perfectionism
Hypothesis df P2 GFI NFI NNFI CFI RMSEA )P2 )df p
One Factor 36 1784.20 .42 .40 .26 .41 .41Two Factors 35 252.09 .82 .87 .85 .89 .15Three Factors 33 154.81 .88 .93 .92 .94 .11Model 1-2 difference 1532.11 1 <.01Model 2-3 difference 97.28 2 <.01Note. GFI = Goodness of Fit Index; NFI = Normed Fit Index; NNFI = Non-Normed Fit Index; CFI =Comparative Fit Index; RMSEA = Root Mean Square Error of Approximation
Table 3
Comparing Models in the CFA of Perfectionism without the BPS
Hypothesis df P2 GFI NFI NNFI CFI RMSEA )P2 )df p
One Factor 28 1243.12 .48 .36 .18 .36 .390Two Factors 27 138.84 .88 .89 .87 .90 .120Three Factors 25 57.91 .95 .96 .96 .97 .068Model 1-2 difference 1104.28 1 <.01Model 2-3 difference 80.93 2 <.01Note. GFI = Goodness of Fit Index; NFI = Normed Fit Index; NNFI = Non-Normed Fit Index; CFI =Comparative Fit Index; RMSEA = Root Mean Square Error of Approximation
Page 35
29
MPS-PC
APSR
-STAN
MPS-PS
APSR
-DISC
NPQ
APSR
-OR
D
MPS-O
MPS-C
M
MPS-D
A
NeuroticPerfectionism
NormalPerfectionism Order
.81 .60 .83 .83 .93.94.92
.82.77
.12
.02
.45
MPS-PC
APSR
-STAN
MPS-PS
APSR
-DISC
NPQ
APSR
-OR
D
MPS-O
MPS-C
M
MPS-D
A
MPS-PC
APSR
-STAN
MPS-PS
APSR
-DISC
NPQ
APSR
-OR
D
MPS-O
MPS-C
M
MPS-D
A
NeuroticPerfectionism
NormalPerfectionism Order
NeuroticPerfectionism
NormalPerfectionism Order
.81 .60 .83 .83 .93.94.92
.82.77.81 .60 .83 .83 .93
.94.92.82.77
.12
.02
.45.12
.02
.45
Confidence intervals (+/- 2 standards errors) around the factor correlations were
examined as an additional test of discriminant validity. Anderson and Gerbing (1988)
noted that evidence for discriminant validity between dimensions is provided if the
confidence interval around the correlation estimate between two factors does not include
1.0. None of the confidence intervals among these three factors included 1.0.
Figure 4. Three Factor Model of Perfectionism with LISREL Estimates
Page 36
30
Structural Modeling Analyses
As in the previous factor analysis, the structural modeling analyses were
conducted using maximum likelihood estimation with robust standard errors to take into
account the non-normality of the data (West et al., 1995), and all variables were centered.
In the initial examination of all the variables, the five factor model was found to fit
significantly better than the one factor model, )P2 (10, N = 286) = 4112.64, p < .01. The
five factor model was than compared to a six factor model, which accounted for the
additional third factor supported by the perfectionism analysis. The six factors included
normal perfectionism, neurotic perfectionism, orderliness, body satisfaction, self-esteem,
and bulimic behavior. The five factor model combined the factors of normal perfectionism
and orderliness. The six factor model was found to fit significantly better than the five
factor model, )P2 (5, N = 286) = 147.80, p < .01. The fit indices also showed better
model fit for the six factor model over both the one and five factor models. See Table 4
for further comparison of the measurement models.
The six factor model was further examined to evaluate overall model fit. All t-
values exceeded the cutoff of t > 2.00, indicating that these individual parameters are
important components of the model. Absolute t-values for the factor loadings ranged
from t = 7.27 to 22.80. Squared multiple correlations for the variables ranged from .32 to
.92. Confidence intervals between the factors were again examined to further establish
discriminant validity. None of these confidence intervals included 1.0, supporting the
Page 37
31
discriminant validity between the constructs. Table 5 contains the correlation estimates
(with standard errors) between the constructs. This model is presented in Figure 5.
Then, the four factor model was examined, using only those variables to be
included in further analyses. The four factor model was found to fit significantly better
than a one factor model )P2 (6, N = 286) = 658.64, p < .01. Comparison of the fit indices
also supported the four factor model. Table 6 contains the results of this examination.
The four factor model was further examined to evaluate overall model fit. All t-
values exceeded the cutoff of t >2.00, with absolute t-values for the variables ranging
from t = 7.29 to 22.88. Squared multiple correlations for the variables ranged from .32 to
.93. Confidence intervals between the factors were examined as a additional test of
discriminant validity. Again, none of these intervals included 1.0, supporting the
Table 4
Comparing Measurement Models Containing All Variables
Hypothesis df P2 GFI NFI NNFI CFI RMSEA )P2 )df pOne Factor 136 4506.86 .28 .55 .51 .56 .340Five Factors 126 394.22 .86 .93 .94 .95 .086Six Factors 121 246.42 .90 .96 .97 .98 .060Model 1-5 difference 4112.64 10 <.01Model 1-6 difference 4260.44 15 <.01Model 5-6 difference 147.80 5 <.01Note. GFI = Goodness of Fit Index; NFI = Normed Fit Index; NNFI = Non-Normed Fit Index; CFI =Comparative Fit Index; RMSEA = Root Mean Square Error of Approximation
Page 38
32
Table 5
Correlation Estimates (with Standard Errors) between Factors for the Six Factor Model
Body Self- BulimicNeurotic Normal Order Dissatisfaction Esteem Behavior
Neurotic 1.00
Normal 0.07 1.00(0.07)
Order 0.02 0.45 1.00(0.06) (0.06)
Body 0.49 -0.13 -0.02 1.00Dissatisfaction (0.05) (0.07) (0.06)
Self-Esteem -0.92 0.23 0.08 -0.56 1.00(0.02) (0.07) (0.07) (0.05)
Bulimic 0.57 0.08 0.05 0.68 -0.54 1.00Behavior (0.05) (0.06) (0.06) (0.04) (0.05)
Table 6
Comparing Measurement Models Containing the Four Primary Variables
Hypothesis df P2 GFI NFI NNFI CFI RMSEA )P2 )df pOne Factor 77 795.15 .67 .87 .86 .88 .180Four Factors 71 136.51 .93 .98 .98 .99 .057Model 1-4 difference 658.64 6 <.01Note. GFI = Goodness of Fit Index; NFI = Normed Fit Index; NNFI = Non-Normed Fit Index; CFI =Comparative Fit Index; RMSEA = Root Mean Square Error of Approximation
Page 39
Neu
rotic
Perf
ectio
nism
Nor
mal
Perf
ectio
nism
Ord
erSe
lf-Es
teem
Body
Dis
satis
fact
ion
Bul
imic
Beh
avio
r
MPS-PC
APSR-STAN
MPS-PS
APSR-DISC
NPQ
APSR-ORD
MPS-O
MPS-CM
MPS-DA
SES
SEI
SEIJ
BIA
BES-WT
BSS-BOD
BULIT-R
EAT-BUL
BITE-SYMP
.89
.70
.93
.65
.94
.92
.87
.73
.59
.81
.83
.94
.82
.96
.56
.93
.78
.86
Neu
rotic
Perf
ectio
nism
Nor
mal
Perf
ectio
nism
Ord
erSe
lf-Es
teem
Body
Dis
satis
fact
ion
Bul
imic
Beh
avio
rN
euro
ticPe
rfec
tioni
smN
orm
alPe
rfec
tioni
smO
rder
Self-
Este
emBo
dyD
issa
tisfa
ctio
nB
ulim
icB
ehav
ior
MPS-PC
APSR-STAN
MPS-PS
APSR-DISC
NPQ
APSR-ORD
MPS-O
MPS-CM
MPS-DA
SES
SEI
SEIJ
BIA
BES-WT
BSS-BOD
BULIT-R
EAT-BUL
BITE-SYMP
MPS-PC
APSR-STAN
MPS-PS
APSR-DISC
NPQ
APSR-ORD
MPS-O
MPS-CM
MPS-DA
SES
SEI
SEIJ
BIA
BES-WT
BSS-BOD
BULIT-R
EAT-BUL
BITE-SYMP
.89
.70
.93
.65
.94
.92
.87
.73
.59
.81
.83
.94
.82
.96
.56
.93
.78
.86
.89
.70
.93
.65
.94
.92
.87
.73
.59
.81
.59
.81
.83
.94
.82
.96
.56
.93
.78
.86
33
Figu
re 5
. LIS
REL
Est
imat
es fo
r the
Six
Fac
tor M
easu
rem
ent M
odel
Not
e. A
ll fa
ctor
load
ings
are
show
n as
abs
olut
e va
lues
, and
due
to sp
ace
limita
tions
in th
e fig
ure,
cor
rela
tions
bet
wee
n th
efa
ctor
s wer
e pr
esen
ted
in T
able
4.
Page 40
34
discriminant validity between the constructs. The final measurement model with
parameter estimates and factor intercorrelations is presented in Figure 6.
The model was then re-specified to test the hypothesis that a high level of body
satisfaction would predict bulimic symptoms only among those women with high levels of
neurotic perfectionism, and that this relationship would only occur among those women
who also had low self-esteem. Jaccard and Wan’s (1996) approach for testing interaction
effects was used to examine this hypothesis. This approach involved comparing the
relationship among the variables in a two step process. The best indicators from each of
two constructs were used to construct a product term, and the path coefficient indicated
how well the product term predicts bulimic symptoms. The effect of the product term was
tested on high and low levels of the third variable. In step 1, the relationship among the
variables was free to vary within the two groups. In step 2, the path coefficient for the
product variable was held equal in the two groups. If the difference between the step 1
and step 2 analyses was statistically significant, a three-way interaction would be
supported. In this study, the test for the three-way interaction was statistically
nonsignificant ()P2 (1) = .42, p = .517), indicating no three-way interaction among the
variables. Each variable was rotated through as the variable used to construct the groups.
The results of this analysis did not change based on which variable was used to construct
the groups. The hypothesized three-way interaction was also examined by splitting the
sample into three groups (low, medium, and high) based
Page 41
MPS-PC
APSR-DISC
NPQ
MPS-CM
MPS-DA
SES
SEI
SEIJ
BIA
BES-WT
BSS-BOD
BULIT-R
EAT-BUL
BITE-SYMP
Neu
rotic
Perfe
ctio
nism
Self-
Este
emBo
dy
Diss
atis
fact
ion
Bulim
icSy
mpt
oms
.83
.82
.59
.82
.93
.87
.77
.94
.65
.93
.70
.96
.56
.89
-.91
-.56
.68
.49
-.54
.57
MPS-PC
APSR-DISC
NPQ
MPS-CM
MPS-DA
SES
SEI
SEIJ
BIA
BES-WT
BSS-BOD
BULIT-R
EAT-BUL
BITE-SYMP
MPS-PC
APSR-DISC
NPQ
MPS-CM
MPS-DA
SES
SEI
SEIJ
BIA
BES-WT
BSS-BOD
BULIT-R
EAT-BUL
BITE-SYMP
Neu
rotic
Perfe
ctio
nism
Self-
Este
emBo
dy
Diss
atis
fact
ion
Bulim
icSy
mpt
oms
Neu
rotic
Perfe
ctio
nism
Self-
Este
emBo
dy
Diss
atis
fact
ion
Bulim
icSy
mpt
oms
.83
.82
.59
.82
.93
.87
.77
.94
.65
.93
.70
.96
.56
.89
.83
.82
.59
.82
.93
.87
.77
.94
.65
.93
.70
.96
.56
.89
-.91
-.56
.68
.49
-.54
.57
-.91
-.56
.68
.49
-.54
.57
35
Figu
re 6
. Fin
al M
easu
rem
ent M
odel
Not
e. A
ll fa
ctor
load
ings
are
show
n as
abs
olut
e va
lues
.
Page 42
36
on the third variable. The test for the three-way interaction remained statistically
nonsignificant ()P2 (2) = 1.3, p = .522).
All possible combinations of two-way interactions of neurotic perfectionism, body
satisfaction, and self-esteem were then tested, with two of these interaction yielding
statistically significant results. Both the interaction of body satisfaction and neurotic
perfectionism and the interaction of body satisfaction and self-esteem were statistically
significant. See Table 7 for details. For both of the models with statistically significant
two-way interactions, the main effects in each model were also statistically significant.
See Figures 7 and 8 for the path coefficients and standard errors for these effects. For the
model with the non-significant interaction between neurotic perfectionism and self-
esteem, neither of the main effects were statistically significant.
Table 7
Comparing Two-Way Interactions among the Variables
Model Hypothesis df P2 RMSEA Product term t-value
1 Body Satisfaction X Neurotic Perf. 34 68.97 .060 -.28 -4.722 Body Satisfaction X Self-Esteem 34 71.56 .062 .14 2.893 Neurotic Perf. X Self-Esteem 34 78.66 .068 -.12 -1.83Note. RMSEA = Root Mean Square Error of Approximation
Page 43
37
NeuroticPerfectionism
Product:BX X NP
BodySatisfaction
BulimicSymptoms
-.55(0.07)
-.28(0.06)
.40(0.07)
NeuroticPerfectionism
Product:BX X NP
BodySatisfaction
BulimicSymptoms
-.55(0.07)
-.28(0.06)
.40(0.07)
Self-Esteem
Product:BS X SE
BodySatisfaction
BulimicSymptoms
-.52(0.06)
.14(0.05)
-.34(0.06)
Self-Esteem
Product:BS X SE
BodySatisfaction
BulimicSymptoms
-.52(0.06)
.14(0.05)
-.34(0.06)
Figure 7. Path Coefficients (with Standard Errors) for the Body Satisfaction by NeuroticPerfectionism Interaction
Figure 8. Path Coefficients (with Standard Errors) for the Body Satisfaction by Self-Esteem Interaction
Page 44
38
To follow-up the statistically significant interactions, the sample was divided into
groups to further examine the relationship between the variables at each level. Initially,
the sample was divided into the smallest possible number of groups (i.e., 2) based on a
composite score of one of the variables. For both of the statistically significant
interactions, two groups did not yield an explainable pattern of results to account for the
interaction. In other words, there were no statistically significant differences between the
two groups on the relationship between the interaction variables; therefore, the number of
groups was increased for each interaction until either a clear pattern of results was found
in the follow-up analysis or the sample size for the each group was nearing 50.
When examining the interaction between body satisfaction and neurotic
perfectionism, a division into 2 groups did not yield statistically significant differences
between the groups on this relationship. Three groups of approximately equal size were
then constructed based on neurotic perfectionism scores. Groups were constructed using
a composite score of three of the neurotic perfectionism measures (APSR-DISC, MPS-
CM, and NPQ). The relationship between body satisfaction and bulimic symptoms was
examined at each of the three levels of neurotic perfectionism, and a non-linear pattern of
findings was discovered. As detailed in Table 8, there was a stronger negative relationship
between body satisfaction and bulimic symptoms for those women who scored in the
middle on neurotic perfectionism compared to those who scored highest on this variable.
For those who scored lowest on neurotic perfectionism, the negative relationship between
Page 45
39
body satisfaction and bulimic symptoms was greater than those who scored highest but
slightly lower than participants with scores in the middle range of this variable.
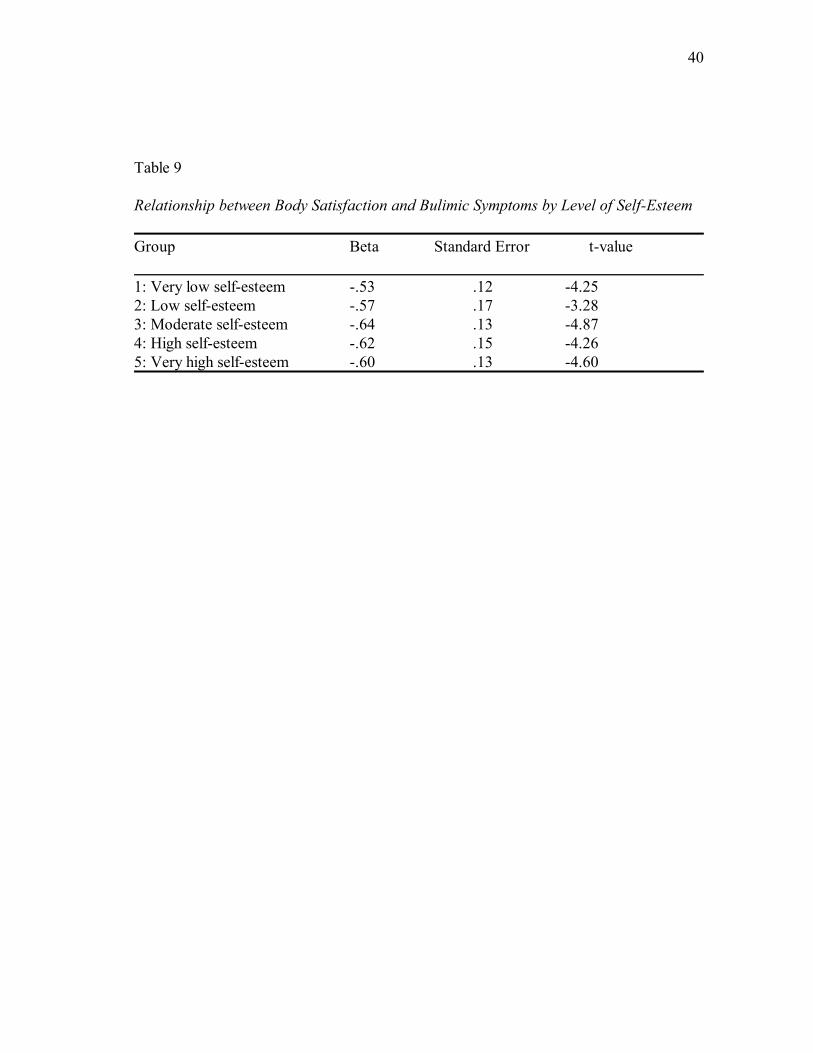
To follow-up the significant interaction between body dissatisfaction and self-
esteem, 5 groups of approximately equal size were constructed based on SES scores. A
smaller number of groups was initially constructed but did not result in an understandable
relationship between the variables. Again, a composite score of the three self-esteem
measures (SES, SEI, SEI-J) was used to divide the sample into groups. The relationship
between body satisfaction and bulimic symptoms was examined at each of the five levels
of self-esteem. As can be seen in Table 9, there was a small curvilinear relationship among
the variables; however, there was little variability with the relationship between body
satisfaction and bulimic symptoms at the various levels of self-esteem.
Table 8
Relationship between Body Satisfaction and Bulimic Symptoms by Level of NeuroticPerfectionismGroup Beta Standard Error t-value
1: Low neurotic perfectionism -.65 .10 -6.372: Middle neurotic perfectionism -.72 .12 -5.843: High neurotic perfectionism -.49 .10 -5.13
Page 46
40
Table 9
Relationship between Body Satisfaction and Bulimic Symptoms by Level of Self-Esteem
Group Beta Standard Error t-value
1: Very low self-esteem -.53 .12 -4.252: Low self-esteem -.57 .17 -3.283: Moderate self-esteem -.64 .13 -4.874: High self-esteem -.62 .15 -4.265: Very high self-esteem -.60 .13 -4.60
Page 47
41
DISCUSSION AND CONCLUSION
These results indicated that perfectionism, as measured in this study, is best
explained as a three factor construct with the dimensions of normal perfectionism,
neurotic perfectionism, and orderliness. These results are consistent with more recent
research, which has also found support for a three factor model of perfectionism. In an
exploratory factor analysis of three perfectionism scales, Suddarth and Slaney (2001)
found three factors they labeled Unhealthy Perfectionism, Healthy Perfectionism, and
Orderliness. These factors correspond to the three dimensions found in the current
research, including the subscales loading on each factor in the same manner for the
measures used in both studies.
The current findings are consistent with expectations of a multidimensional
perfectionism construct consisting of a potentially pathological factor along with less
harmful aspects, with neurotic perfectionism encompassing the more deleterious aspects
of the construct. There was some evidence that both normal perfectionism and orderliness
are more neutral, or perhaps even slightly positive, aspects of perfectionism. For example,
normal perfectionism correlated with both body dissatisfaction and self-esteem in the
opposite as did neurotic perfectionism. Additionally, normal perfectionism did not
statistically significantly correlate with bulimic symptoms, whereas neurotic perfectionism
did.
When neurotic perfectionism was examined in combination with other risk factors
for bulimia nervosa, an interaction between neurotic perfectionism, self-esteem, and body
Page 48
42
satisfaction was not found to predict bulimic symptoms. This finding was not consistent
with hypothesized predictions but given the discrepant findings in the literature regarding
the relationship of perfectionism to bulimic symptoms, may not be that surprising.
It is important to note that all three variables continued to predict bulimic
symptoms independent of any interaction. Therefore, although the constructs did not
predict bulimic behavior in the hypothesized interactional manner, body satisfaction, self-
esteem, and neurotic perfectionism did all independently predict bulimic symptoms,
indicating that these variables continue to serve as risk factors for the presence of bulimic
symptoms. This finding is especially notable regarding neurotic perfectionism, as previous
literature has shown inconsistent findings regarding perfectionism and bulimia nervosa.
One potential reason for this inconsistency may be the construct having been measured in
a unidimensional manner, when in this study it related to bulimic symptoms in a
multidimensional fashion. The use of structural equation modeling (SEM), along with
measuring multiple factors of perfectionism, may also account for the somewhat larger
effect size between neurotic perfectionism and bulimic symptoms than has been found in
previous studies examining only a unidimensional perfectionism construct. By utilizing
structural equation modeling, the current research provides an important advancement in
the measurement of these constructs and their relationship to bulimic behavior. No other
study has utilized SEM to examine the relationship among all of these risk factors and
bulimic symptoms. By employing SEM, the effect of measurement error was reduced,
Page 49
43
allowing more accurate estimates of the effect size between neurotic perfectionism, self-
esteem, and body satisfaction and bulimic behavior.
A pair of two-way interactions was also found to account for bulimic behavior,
with body satisfaction by self-esteem and body satisfaction by neurotic perfectionism
predicting bulimic symptoms. These interactions appear to be playing a important role in
explaining bulimic behavior. Both neurotic perfectionism and self-esteem interact in a
detrimental manner with body satisfaction and the level of these constructs may increase
the likelihood that a person dissatisfied with her body will engage in bulimic behaviors.
Follow-up tests of these interactions suggested curvilinear relationships for both the
interaction of body satisfaction and neurotic perfectionism and the interaction of body
satisfaction by self-esteem.
For the interaction between body satisfaction and neurotic perfectionism, the
strongest negative relationship between body satisfaction and bulimic symptoms was
found for those women with moderate levels of neurotic perfectionism compared to those
highest or lowest on neurotic perfectionism; however, those participants at the lowest
level of neurotic perfectionism had a relationship more similar to those participants who
scored in the middle range of this variable than with those who scored the highest. This
finding indicates that the more dissatisfied an individual is with her body, the more
bulimic behavior she is likely to engage in, and that this relationship is strongest when the
individual also has low to moderate levels of neurotic perfectionism. Therefore, neurotic
perfectionism interacts in a detrimental manner with body satisfaction and may increase
Page 50
44
the likelihood that a person dissatisfied with her body will engage in bulimic behaviors,
such as binge eating. It could be that this relationship is not strongest at high levels of
neurotic perfectionism because at high levels of neurotic perfectionism, the interaction
with body satisfaction is not as important in predicting bulimic behavior. In other words,
if a person is extremely high on neurotic perfectionism, it may not matter where her
scores fall on the other variable. Neurotic perfectionism may contribute to bulimic
symptoms through the rigid, all-or-nothing thinking style that is a part of this construct.
For example, an individual may be more prone to binge when a slight violation occurs in
her desired eating pattern.
The manner in which body satisfaction and self-esteem interacted did not yield a
clear pattern of results to explain how they predict bulimic symptoms. There was little
variation in the relationship between body satisfaction and bulimic symptoms at the
various levels of self-esteem. However, self-esteem did interact in a detrimental manner
with body satisfaction and influences the manner in which a person dissatisfied with her
body may engage in bulimic behaviors
There were several limitations of this study. First, the participants were gathered
from a non-clinical population of university undergraduates; therefore, we were only able
to explore the relationship between the variables and bulimic symptoms, not full-blown
bulimic nervosa. The research was cross-sectional in design, and therefore, causation
among the variables cannot be established. It is possible that bulimic symptoms may
precede or contribute to the development of body dissatisfaction, low self-esteem, and
Page 51
45
neurotic perfectionism. The sample was predominantly Caucasian, so the variables could
interact differently if studied in a more diverse population.
This study has important implications for both clinical work and future research.
Clinically, these findings reveal the importance of attending to other factors, such as
perfectionistic traits, body dissatisfaction, and low self-esteem when working with a
population displaying bulimic behavior. By working to improve an individual’s positive
feelings toward her body and self and to decrease perfectionistic tendencies, bulimic
symptoms might also be reduced. Although body dissatisfaction and self-esteem issues
are often addressed in treatment, neurotic perfectionism may not be a focus of attention.
This study emphasizes the importance of exploring the individual’s cognitive style, paying
particular attention to her tendency to engage in all-or-nothing thinking and to hold rigid
attitudes toward eating, food, and her body.
Future research should further examine the relationships among these variables. It
would be interesting to explore these factors in a clinical sample to see if the results
would be similar. It could be that individuals diagnosed with bulimia nervosa would show
more extremes of neurotic perfectionism, self-esteem, and body dissatisfaction that could
in some ways influence the relationship among the variables. Also, it would be beneficial
to further explore the relationship among these variables in a more diverse population,
including more ethnic minorities and perhaps male participants.
Page 52
46
REFERENCES
Anderson, J. C., & Gerbing, D. W. (1988). Structural equation modeling in practice: A
review and recommended two-step approach. Psychological Bulletin, 103, 411-
423.
Ashby, J. S., Kottman, T., & Schoen, E. (1998). Perfectionism and eating disorders
reconsidered. Journal of Mental Health Counseling, 20, 261-271.
Bardone, A. M., Vohs, K. D., Abramson, L. Y., Heatherton, T. F., & Joiner, T. E.
(2000). The confluence of perfectionism, body dissatisfaction, and low self-esteem
predicts bulimic symptoms: Clinical implications. Behavior Therapy, 31, 265-280.
Bentler, P. M. (1990). Comparative indexes in structural models. Psychological Bulletin,
107, 238-246.
Bentler, P. M., & Bonett, D. G. (1980). Significance tests and goodness of fit in the
analysis of covariance structures. Psychological Bulletin, 88, 591-606.
Blascovich, J., & Tomaka, J. (1991). Measures of self-esteem. In J. P. Robinson, P. R.
Shaver, & L. S. Wrightsman (Eds.), Measures of personality and social
psychological attitudes (Vol. 1, pp. 115-160). San Diego, CA: Academic Press.
Brelsford, T. N, Hummel, R. M., & Barrios, B. A. (1992). The Bulimia Test-Revised: A
psychometric investigation. Psychological Assessment, 4, 399-401.
Browne, M. W., & Cudeck, R. (1993). Alternative ways of assessing model fit. In K. A.
Bollen & J. S. Long (Eds.), Testing structural equation models (pp. 136-162).
Newbury Park, CA: Sage.
Page 53
47
Burns, D. D. (1983). The spouse who is a perfectionist. Medical Aspects of Human
Sexuality, 17, 219-230.
Carter, P. I., & Moss, R. A. (1984). Screening for anorexia and bulimia nervosa in a
college population: Problems and limitations. Addictive Behaviors, 9, 417-419.
Cooper, P. J., Taylor, M. J., Cooper, Z., & Fairburn, C. G. (1987). The development and
validation of the Body Shape Questionnaire. International Journal of Eating
Disorders, 6, 485-494.
Coopersmith, S. (1967). The antecedents of self-esteem. San Francisco: W. H. Freeman.
Davis, C. (1997). Normal and neurotic perfectionism in eating disorders: An interactive
model. International Journal of Eating Disorders, 22, 421-426.
Fairburn, C. G., & Wilson, G. T. (Eds.) (1993). Binge eating: Nature, assessment, and
treatment. New York: Guilford.
Franzoi, S. L. (1994). Further evidence of the reliability and validity of the Body Esteem
Scale. Journal of Clinical Psychology, 50, 237-239.
Franzoi, S. L., & Shields, S. A. (1984). The Body Esteem Scale: Multidimensional
structure and sex differences in a college population. Journal of Personality
Assessment, 48, 173-178.
Frost, R. O., Marten, P., Lahart, C., & Rosenblate, R. (1990). The dimensions of
perfectionism. Cognitive Therapy and Research, 14, 449-468.
Garner, D. M., & Garfinkel, P. E. (1979). The Eating Attitudes Test: An index of the
symptoms of anorexia nervosa. Psychological Medicine, 9, 273-279.
Page 54
48
Garner, D. M., Olmstead, M. P., Bohr, Y., & Garfinkel, P. E. (1982). The Eating
Attitudes Test: Psychometric features and clinical correlates. Psychological
Medicine, 12, 871-878.
Garner, D. M., Olmstead, M. P., & Polivy, J. (1983). Development and validation of a
multidimensional eating disorder inventory for anorexia nervosa and bulimia.
International Journal of Eating Disorder, 2, 15-34.
Goldfein, J. A., Walsh, B. T., & Midlarsky, E. (2000). Influence of shape and weight on
self-evaluation in bulimia nervosa. International Journal of Eating Disorders, 27,
435-445.
Griffiths, R. A., Beumont, P. J. V., Giannakopoulos, E., Russel, J., Schotte, D.,
Thornton, C., Touyz, S. W., & Varano, P. (1999). Measuring self-esteem in
dieting disordered patients: The validity of the Rosenberg and Coopersmith
contrasted. International Journal of Eating Disorders, 25, 227-231.
Hamachek, D. E. (1978). Psychodynamics of normal and neurotic perfectionism.
Psychology, 15, 27-33.
Heatherton, T. F., & Polivy, J. (1991). Development and validation of a scale for
measuring state self-esteem. Journal of Personality and Social Psychology, 60,
895-910.
Henderson, M., & Freeman, C. P. L. (1987). A self-rating scale for bulimia: The ‘BITE.’
British Journal of Psychiatry, 150, 18-24.
Page 55
49
Hewitt, P. L., & Flett, G. L. (1991). Perfectionism in the self and social contexts:
Conceptualization, assessment, and association with psychopathology. Journal of
Personality and Social Psychology, 60, 456-470.
Hewitt, P. L., Flett, G. L., & Ediger, E. (1995). Perfectionism traits and perfectionistic
self-presentation in eating disorder attitudes, characteristics, and symptoms.
International Journal of Eating Disorders, 18, 317-326.
Hewitt, P. L., Mittelstaedt, W., & Wollert, R. (1989). Validation of a measure of
perfectionism. Journal of Personality Assessment, 53, 133-144.
Jaccard, J., & Wan, C.K. (1996). LISREL approaches to interaction effects in multiple
regression. London: Sage.
Jerabek, I. (1996). Self-Esteem Inventory. Retrieved August 25, 2002, from
http://www.queendom.com/selfest.html.
Joiner, T. E., Schmidt, N. B., & Wonderlich, S. A. (1997). Global self-esteem as
contingent on body satisfaction among patients with bulimia nervosa: Lack of
diagnostic specificity. International Journal of Eating Disorders, 21, 67-76.
Jöreskog, K., & Sörbom, D. (2002). LISREL 8.52. [Computer software.] Chicago:
Scientific Software International.
Jöreskog, K., & Sörbom, D. (1998). LISREL 8 user’s reference guide. Chicago:
Scientific Software International.
Page 56
50
Marsh, H. W., Balla, R., & McDonald, R. P. (1988). Goodness-of-fit indices in
confirmatory factor analysis: The effect of sample size. Psychological Bulletin,
103, 391-410.
Mitzman, S. F., Slade, P., & Dewey, M. E. (1994). Preliminary development of a
questionnaire designed to measure neurotic perfectionism in the eating disorders.
Journal of Clinical Psychology, 50, 516-522.
Pervin, L. A. (1993). Personality: Theory and research. New York: Wiley and Sons.
Pliner, P., & Haddock, G. (1996). Perfectionism in weight concerned and unconcerned
women: An experimental approach. International Journal of Eating Disorders,
19, 381-389.
Rosen, J. C. (1995). Assessment and treatment of body image disturbance. In K. D.
Brownell & C. G. Fairburn (Eds.), Eating disorders and obesity: A
comprehensive handbook. (pp. 369-373). New York: Guilford.
Rosenberg, M. (1965). Society and the adolescent self image. Princeton, NJ: Princeton
University Press.
Slade, P. D., Dewey, M. E., Newton, T., Brodie, D., & Kiemle, G. (1990). Development
and preliminary validation of the Body Satisfaction Scale (BSS). Psychology and
Health, 4, 499-509.
Slaney, R. B., Mobley, M., Trippi, J., Ashby, J. S., & Johnson, D. (1998). The Almost
Perfect Scale-Revised. Unpublished manuscript. State College, PA: The
Pennsylvania State University. (Available from the first author.)
Page 57
51
Slaney, R. B., Rice, K. G., Mobley, M., Trippi, J., & Ashby, J. (2001). The revised
almost perfect scale. Measurement and Evaluation in Counseling and
Development, 34, 130-145.
Smith, M. C., & Thelen, M. H. (1984). Development and validation of a test for bulimia.
Journal of Consulting and Clinical Psychology, 52, 863-872.
Strauman, T. J., Vookles, J., Berenstein, V., Chaiken, S., & Higgins, E. T. (1991). Self-
discrepancies and vulnerability to body dissatisfaction and disordered eating.
Journal of Personality and Social Psychology, 61, 946-956.
Suddarth, B. H., & Slaney, R. G. (2001). An investigation of the dimensions of
perfectionism in college students. Measurement and Evaluation in Counseling
and Development, 34, 157-165.
Thelen, M. H., Farmer, J., Wonderlich, S., & Smith, M. (1991). A revision of the
Bulimia Test: The BULIT-R. Psychological Assessment, 3, 119-124.
Thelen, M. H., Mintz, L. B., & Vander Wal, J. S. (1996). The Bulimia Test-Revised:
Validation with DSM-IV criteria for bulimia nervosa. Psychological Assessment,
8, 219-221.
Vohs, K. D., Bardone, A. M., Joiner, T. E., Abramson, L. Y., & Heatherton, T. F.
(1999). Perfectionism, perceived weight status, and self-esteem interact to predict
bulimic symptoms: A model of bulimic symptom development. Journal of
Abnormal Psychology, 108, 695-700.
Page 58
52
Waller, G. (1992). Bulimic attitudes in different eating disorders: Clinical utility of the
BITE. International Journal of Eating Disorders, 11, 73-78.
West, S. G., Finch, J. F., & Curran, P.J. (1995). Structural equation models with
nonnormal variables: Problems and remedies. In Hoyle, R. H. (Ed.), Structural
equation modeling: Concepts, issues, and applications (pp. 56-75). Thousand
Oaks, CA: Sage.
Williams, T. L., Gleaves, D. H., Cepeda-Benito, A., Erath, S. A., & Cororve, M. B.
(2001). The reliability and validity of a group administered version of the Body
Image Assessment. Assessment, 8, 37-46.
Williamson, D. A., Anderson, D. A., & Gleaves, D. H. (1996). Anorexia nervosa and
bulimia nervosa: Structured interview methodologies and psychological
assessment. In J. K. Thompson (Ed.), Body image, eating disorders, and obesity:
An integrative guide for assessment and treatment (pp. 205-223). Washington,
DC: American Psychological Association.
Williamson, D. A., Davis, C. J., Bennett, S. M., Goreczny, A. J., & Gleaves, D. H.
(1989). Development of a simple procedure for assessing body image
disturbances. Behavioral Assessment, 11, 433-446.
Page 59
53
VITA
Crystal Anne PearsonDepartment of Psychology
Texas A&M UniversityCollege Station, TX 77843-4235
EducationTexas A&M University M.S. Psychology (Clinical) 2003Mississippi State University B.A. Psychology- Summa Cum Laude 1999
Research ExperienceTexas A&M University: Department of Psychology 8/99 - presentMississippi State University: Department of Psychology 3/97 - 5/99Louisiana State University: Department of Psychology 8/95 - 12/95
Clinical ExperienceBryan Federal Prison Camp: Psychology Department 9/00 - 8/02Texas A&M University: Psychology Clinic 8/00 - present
Professional PresentationsPearson, C.A., Brown, J.D., & Gleaves, D.H. (2002). Examining the relationship
between perfectionism, self-esteem, body dissatisfaction, and bulimia nervosa. Poster presented at the annual meeting of the Association for Advancement ofBehavior Therapy, Reno, NV, November 2002.
Brown, J.D., Gleaves, D.H., & Pearson, C.A. (2002). Male and female body image:Critical measurement issues. Poster presented at the annual meeting of theAssociation for Advancement of Behavior Therapy, Reno, NV, November 2002.
Cororve, M.B., Pearson, C.A., Brown, J.D., & Gleaves, D.H. (2001). On themethodology of body image assessment. Poster presented at the annual meeting ofthe Association for Advancement of Behavior Therapy, Philadelphia, PA,November 2001.
Cororve, M.B., Brown, J.D., Pearson, C.A., & Gleaves, D. H. (2001). Societal effects onmale and female body satisfaction. Poster presented at the annual meeting of theAmerican Psychological Association, San Francisco, CA, August 2001.
Snow, A.C., Pearson, C.A., Brown, J.D., Cororve, M.B., & Gleaves, D.H. (2000). Ataxometric analysis of anorexia nervosa. Poster presented at the annual meetingof the American Psychological Association, Washington, DC, August, 2000.