12
Examining the role of land use and precipitation on the water quality of Lake Tana, Ethiopia. Brian S. Kim GIS in Water Resources, Fall 2018 The University of Texas at Austin
Examining the role of land use and precipitation on the water quality
of Lake Tana, Ethiopia.
Brian S. Kim
GIS in Water Resources, Fall 2018
The University of Texas at Austin
Introduction:
The northern highlands of Ethiopia formed approximately 75 million years a flood basalt
emplacement lifted up the region forming a large geographical dome. The elevation rarely falls
below 1500 meters, although some regions can be as high 4550 meters. The highland is split into
two portion, the northwestern and southeastern, with the Lake Tana residing in the former. The
climate is dominated by tropical highland monsoons with most precipitation occurring between
June and September (Mohamed et al., 2005). The northern highlands receive more precipitation
than the lowlands with approximately 1200 to 2700 mm of rain annually, making this region
particularly susceptible to soil erosion via runoff events. Additionally, there is an increase in the
frequency of extreme rainfall events in recent decades (Osman and Sauerborn 2002; Seleshi and
Demaree 1995).
Major deforestation occurred between 1957 and 1982 destroying around 94% of pre-
existing natural forest cover. As of 1995, the largest uses of land are agriculture (77%) and
grasslands for grazing (12%) (Zeleke and Hurni 2001). The primary row crops in Ethiopia are teff,
maize, beans and sweet potatoes (Cochrane and Bekele 2018). Widespread deforestation in
northern Ethiopia is largely a result of subsistence agricultural expansion, livestock grazing, and
fuelwood harvest (Gelaw, Singh & Lal, 2014). In the wake of deforestation, agricultural land in
Ethiopia can be degraded by soil erosion (Lemma et al. 20 17). In the northern highlands of
Ethiopia, soil loss is primarily through rill erosion, with runoff forming channels in cropland, at
rates between 1.46 - 9.02 t ha-1 yr-1 (Lemma et al. 2017). Due to repeated tillage and harvesting,
much of the cropland in northern Ethiopia is characterized by low soil organic matter and high soil
disturbance making it susceptible to transport of soil particles with storm runoff (Dagnew et al.
2017). Agricultural catchments in the region have shown significantly higher levels of runoff
compared to grassland-dominated catchments (Dagnew et al. 2017). Soil nutrients including
nitrogen (N), phosphorus (P), potassium and calcium are lost along with organic carbon via soil
erosion in catchments across northern Ethiopia (Haregeweyn et al. 2008). Use of mineral fertilizers
has been increasing in northern Ethiopia over the past decade in an effort to regain lost soil fertility
(Haregeweyn et al. 2008).
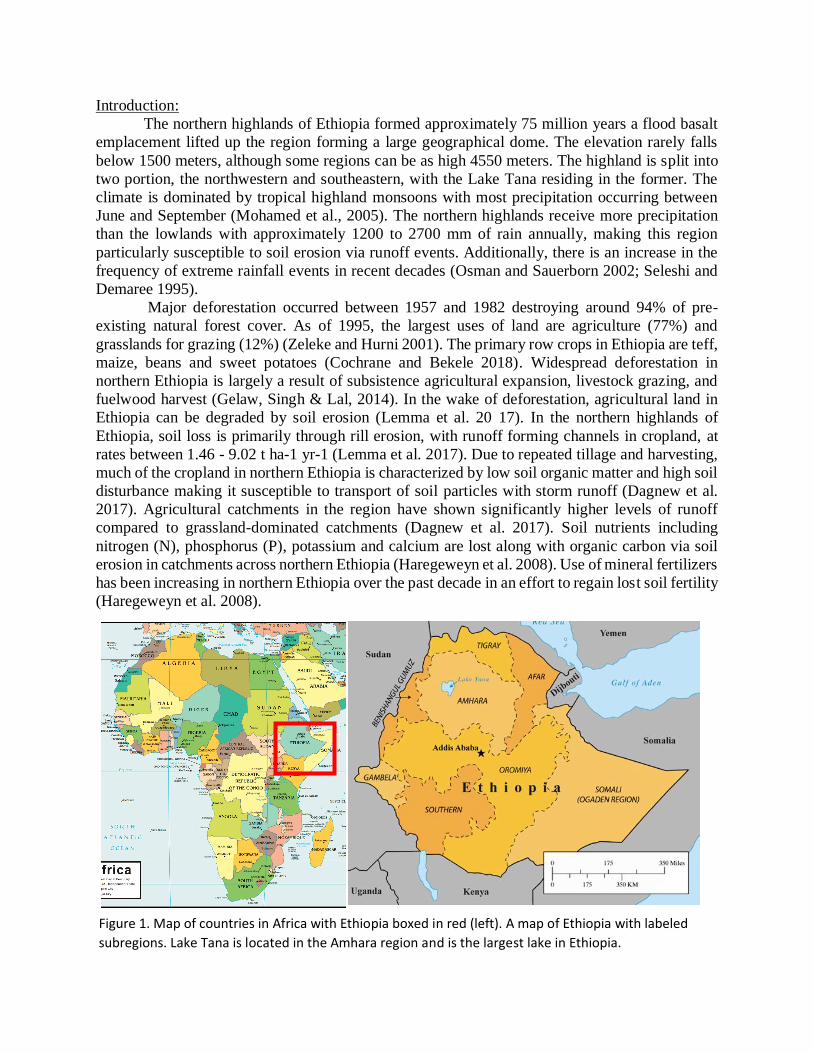
Figure 1. Map of countries in Africa with Ethiopia boxed in red (left). A map of Ethiopia with labeled
subregions. Lake Tana is located in the Amhara region and is the largest lake in Ethiopia.

Lake Tana
Endpoint hydrologic systems, such as lakes, are integrators of anthropogenic change on the
landscape (Williamson et al. 2008). Streams and lakes in heavily agricultural landscapes often
experience elevated sediment and nutrient loads and an inability to process these excess nutrients.
Across North America, Europe and New Zealand, there are many examples illustrating
relationships between catchment land use and stream ecosystem function including nutrient
spiraling metrics (Arango et al. 2008; Von Schiller et al. 2008; Matheson et al. 2011) and
ecosystem metabolism (Bernot et al. 2010; FuB et al. 2017). Even in intensively farmed
landscapes, restored floodplain and riparian buffers can enhance stream ecosystem functions such
as nutrient removal (Arango and Tank 2008; Roley et al. 2012). However, in other instances
agricultural streams function more like conduits to downstream systems rather than processors of
nutrients (Royer et al. 2004; Sheibley et al. 2014).
In this region, access to clean water plays a crucial role in the livelihood and well-being of
rural communities. In the surrounding urban areas, Lake Tana is used for cleaning, cooking, and
human and livestock drinking by 2.6 million people (Makoni et al. 2004; Mazet et al. 2009). In
spite of such dependency on this lake for access to freshwater, controls of water quality in these
streams are poorly understood. In addition to basic resources such as drinking water, Lake Tana
supports a large fishing industry of Labeobarbus and Nile tilapia that lands 1454 tons annually
(FAO 2003).
Objective
Lake Tana has experienced an extreme change in land cover over the past several decades. This is
turn has significantly impacted the soil erosion within the watershed affecting overall lake water
quality. Using ArcGIS and historic time series, I aim to elucidate …
1. How has land use changed in the Lake Tana watershed over the past 20 years?
2. How has the change in land use affected Lake Tana water quality, specifically total suspended
solids?
3. How has changes in precipitation within the watershed affected erosion and Lake Tana water
quality?
Data and Methods
DEM: The Lake Tana basin, rivers and watersheds were based on the Aster Orthorectififed Digital
Elevation Model (DEM) from 2000. Flow direction and flow accumulation were determined using
ArcGIS tools and streams were defined using a flow accumulation threshold of 5000.
MODIS: Land cover data was derived from the MODIS/Terra and Aqua Combined Land Cover
Type (MCD12Q1) and was acquired from the Land Processes Distributed Active Archive Center
(LP DAAC). The database provided annual global land cover from 2001 to 2017. Within the
MCD12Q1 data file I selected the Land Cover Type 1 classification scheme which consists of 17
unique groups (Evergreen Needleleaf Forest, Evergreen Broadleaf Forest, Deciduous Needleleaf
Forest, Deciduous Broadleaf Forest, Mixed Forest, Closed Shrubland, Open Shrubland, Woody
Savanna, Savanna, Grassland, Wetland, Cropland, Urban, Snow and Ice, Barren, and Water
Bodies). For the purpose of this study, I excluded minor groups such as urban and snow/ice and
broadened the categories to three major groups (forest, shrubland/savannas, and crop/pasture).

Each annual file was then masked to the watershed of Lake Tana and land cover distribution and
change were determined based on differences of watershed percent for each category.
GPCC: Daily precipitation data was
collected from the Global Precipitation
Climatology Centre (GPCC). The
GPCC creates the global precipitation
map based on ~53,000 stations located
throughout the globe including three in
Ethiopia. Although this database
provided 30 years of precipitation data,
the 1o x 1o does not provide a very high
resolution the Lake Tana watershed was
represented by a single pixel (fig 2).
TSS: Total suspended solids were
derived from the MODIS-Terra satellite
images. The dataset (MOD09GQ)
provided almost daily, 250m resolution
raster files based on near infrared (NIR)
at 841-876 nm wavelength. To
determine TSS, I utilized a model from
Kaba et al. that calculated a linear
regression (TSS = 2371 x pNIR – 62.8) by comparing NIR and land-sampled TSS which provided
an R2 of 0.95 (2013). Using this model, I determined TSS before, during, and after the rainy season
during 2000, 2005, and 2010. One pitfall of this method however, is that due to the high chance of
cloud cover during the rainy season, there can be large gaps in data continuity for a time series. To
observe the effects of land cover on TSS I picked two points in Lake Tana to track the difference
in TSS between the western and eastern catchments which have significant and distinct land cover
differences.
Sources: Esri, HERE, Garmin, Intermap, increment P Corp., GEBCO, USGS, FAO, NPS, NRCAN, GeoBase, IGN, Kadaster NL, Ordnance Survey, Esri Japan, METI, Esri China (Hong Kong),
swisstopo, © OpenStreetMap contributors, and the GIS User Community
Figure 2. Raster file of global daily precipitation data
from the GPCC.

Results
Watershed: Lake Tana is situated approximately
1800 meters above sea level, due to the fact that
the highlands of Ethiopia are located on an
elevated plateau. The lake is 3156 km2 and the
watershed is 15,096 km2. The Lake Tana
watershed is divided into three distinct regions
(western, northern, and eastern). The major
streams in the western basin converge into one
river that drains the majority of this region
covering a distance of almost 100 km. In the
eastern basin, there are two primary rivers that
drain into the lake that travels only 60 km and
experiences a steeper elevation gradient. The
northern region is ignored for the rest of the
study due to its small catchment area and
numerous inputs rather than a single discharge
point.
Figure 3. Elevation map of Lake Tana with
major streams delineated.
2001 2017
Figure 4. Land cover of Lake Tana watershed in 2001 (left) and 2017 (right). Region circled in red
shows a region where there has been easily visible change in land cover.

Land Cover Change: Based on an initial
visual analysis of the land cover maps
from 2001 to 2017, it appears that there is
no large significant change to land cover
aside from minor variation in the region
north of Lake Tana (fig 4). Due to the fact
that the vast majority of deforestation
already occurred several decades prior to
2000, it is not surprising that the change in
tree cover or crop cover has not visibly
changed in the past 20 years, at least in
scale to what has previously occurred in
the early 1900s. However, it is interesting
to note that there is a significant difference
in land cover between the western and
eastern basins. While the western basin is
predominantly shrubland scattered with
cropland, the eastern basin is almost
exclusively cropland. To better understand
the minute changes that have happened
within the watershed for the past 20 years,
I determined the percentage of watershed
for each of the land cover categories (fig
5). Based on the land cover maps, there is
a clear increasing trend in the percentage
of forest and shrubland/savanna and a
distinct downward trend in the
crop/pasture. Contrary to what was
originally thought, it appears that forst
cover in the Lake Tana watershed is
increasing along with shrublands and
savannas. One potential explanation for
this increase is the implementation of a
program called REDD+. The program to
reduce emissions from deforestation and
forest degradation (REDD+) is a global
initiative born from the United Nations
Framework Convention on Climate
Change (UNFCCC) in 2005. The
objective of the initiative was to mitigate
greenhouse gases emissions from
developing countries by implementing
forest management programs. Figure 5,
shows some support for this theory
because the percentage of forest and
0
0.002
0.004
0.006
0.008
0.01
0.012
0.014
0.016
2000 2005 2010 2015
Per
cen
tage
of
Wat
ersh
ed (
%)
Forest
26
26.5
27
27.5
28
28.5
29
29.5
2000 2005 2010 2015
Per
cen
tage
of
Wat
ersh
ed (
%)
Shrubland/Savanna
49
49.5
50
50.5
51
51.5
52
52.5
53
53.5
2000 2005 2010 2015
Per
cen
tage
of
Wat
ersh
ed (
%)
Crop/Pasture
Figure 5. Percent of watershed for three different
categories (top) forest (middle) shrubland/savanna,
and (bottom) crop/pasture from 2001 to 2017.

shrubland/savanna begin to increase around 2005. Unfortunately, due to the lack of data prior to
2000 there is no reference to confirm whether the increase in forest cover was a product of REDD
program in Ethiopia.
Precipitation: Based on the GPCC precipitation data, I did not find any evidence that strongly
supports Osman and Sauerborn findings that the region has experienced more severe and frequent
precipitation events. Although there are fluctuations in total annual rainfall, there is no distinctive
positive trend suggesting increased precipitation (fig 6). Similarly, although the maximum 24-hour
precipitation does fluctuate year to year, there is no obvious positive pattern.
Figure 6. Total annual precipitation and annual 24 hour precipitation maximum from 1982 to 2016
(top). Daily precipitation from 1982 go 2016. The lines are colored from grey to blue in relation to
2016 to 1982.
0
50
100
150
200
250
0
500
1000
1500
2000
2500
1980 1985 1990 1995 2000 2005 2010 2015 2020
Pre
cip
itat
ion
(m
m)
Total
Max
0
50
100
150
200
0 50 100 150 200 250 300 350
Pre
cip
itat
ion
(m
m)
Julian Days

The daily precipitation data shows us that the Lake Tana watershed experiences its dry season
from early December to early March. The wet season last for 9 months extending from March to
November with a gradual increase in intensity that peaks around mid-August. In addition to the
gradual increase in precipitation till August, there are high precipitation events scattered between
end of May till end of September (fig 6).
Total Suspended Solids: To determine the effects of land cover as well as precipitation I
determined the total suspended solids for three different years 2000, 2005, and 2010. Total
suspended solids were modeled for as many days as possible during the wet season which was
dependent on cloud cover and availability of data. In all three years, the TSS signal for the eastern
basin is consistently higher than those of the western basin. Furthermore, factoring in that the
0
50
100
150
0
1000
2000
3000
4000
5000
21-Mar 10-May 29-Jun 18-Aug 7-Oct
Pre
cip
itat
ion
(m
m)
Tota
l Su
spen
de
d S
olid
s (m
g/L)
2000
0
50
100
150
0
1000
2000
3000
4000
5000
21-Mar 10-May 29-Jun 18-Aug 7-OctP
reci
pit
atio
n (
mm
)
Tota
l Su
spen
de
d S
olid
s (m
g/L)
2005
0
50
100
150
0
1000
2000
3000
4000
5000
21-Mar 10-May 29-Jun 18-Aug 7-Oct
Pre
cip
itat
ion
(m
m)
Tota
l Su
spen
de
d S
olid
s (m
g/L)
2010WestEastPrecipitation
Figure 7. Total suspended solids (mg/L) in the western (green) and eastern (yellow) basins of Lake
Tana overlaid with daily precipitation for the catchment.

western watershed covers a larger area than the eastern watershed, the discrepancy between the
eastern and western TSS readings suggests a large influence of land cover on the transport of soils
to Lake Tana. During strong precipitation events (Sep 3, 2000; Jul 12, 2005) show that eastern
Lake Tana responded to higher increase in TSS compared to the western region. In addition to
overall higher TSS levels, this suggests that the eastern watershed is less adept at responding to
sudden precipitation events due to the lack of plant and root structure to retain soils during these
intense episodes. In addition to the western watershed exhibiting lower initial erosion rates, the
presence of shrubland land cover may contribute to shortening the effects of precipitation on TSS.
After precipitation events (Aug 18, 2005; Aug 18, 2010) the western basin appears to decrease in
TSS soon after the precipitation event whereas the eastern basin continues to exhibit high TSS for
a longer duration of time.
Conclusion
Lake Tana in Ethiopia has undergone massive environmental changes for the past 100 years.
Although the forest was decimated to less than 2% of initial forest cover, satellite data analysis
shows promise that the forest is slowly recovering. Whether through the successful implementation
of natural forest or developing a forest management strategy overall vegetation is has definitely
increase in the past 20 years. More importantly, based on TSS models from the western and eastern
lake basin, the presence of shrublands, savannas, and trees results in a significant decrease in TSS.
Although the analysis of precipitation for the past 36 years did not support previous studies that
suggest an increase in frequency and intensity, there is a clear link between precipitation and TSS
in Lake Tana. Especially in situations like this. where environmental events happened several
decades ago, utilizing GIS and satellite data can reveal a unique environmental history of these
ecosystem.


Literature Cited
Abate, M., et al ( 2016) Long-term Landscape Changes in the Lake Tana Basin as Evidenced by
Delta Development and Floodplain Aggradation in Ethiopia. Land Degradation &
Development
Agimass, F., et al ( 2011) Low-income Fishermen's Willingness-to-Pay for Fisheries and
Watershed Management: An Application of Choice Experiment to Lake Tana, Ethiopia.
Ecological Economics
Alemu, M., et al (2017) Spatial and Temporal Trends of Recent Dissolved Phosphorus
Concentrations in Lake Tana and Its Four Main Tributaries. Land Degradation &
Development
Amenu, K., Markemann, A., & Valle Zárate, A. (2013). Water for human and livestock
consumption in rural settings of Ethiopia: Assessments of quality and health aspects.
Environmental Monitoring and Assessment, 185(11), 9571–9586.
https://doi.org/10.1007/s10661-013-3275-3
Cochrane, L., and Y. W. Bekele. 2017. Average crop yield (2001-2007) in Ethiopia: Trenda at
national, regional, and zonal levels. Data in Brief 16: 1025-1033.
Dagnew, D. C., C. D. Guzman, A. D. Zegeye, T. Y. Tebebu, M. Getaneh, S. Abate, F. A. Zemale,
E. K. Ayana, S. A. Tilahun, T. S. Steenhuis. 2015. Impacts of conservation practices on
runoff and soil loss in the sub-humid Ethiopian Highlands: the Debre Mawi catchment.
Journal of Hydrology and Hydromechanics 63(3): 210-219.
Dagnew, D. C., C. D. Guzman, A. T. Akale, T. Y. Tebebu, A. D. Zegeye, W. Mekuria, S. A.
Tilahun, T. S. Steenhuis. 2017. Effects of land use on catchment runoff and soil loss in the
sub-humid Ethiopian highlands. Ecohydrology & Hydrobiology 17: 274-282
Dejen, E., et al ( 2017). The Decline of the Lake Tana ( Ethiopia) Fisheries: Causes and Possible
Solutions. Land Degradation and Development
Fuß, T., B. Behounek, A. J. Ulseth, G. A. Singer. 2017. Land use controls stream ecosystem
metabolism by shifting dissolved organic matter and nutrient regimes. Freshwater Biology
62(3) 582-599.
Hermans-Newman, K. ( 2017) Human Migration, Climate Variability, and Land Degradation:
Hotspots of Socio-ecological Pressure in Ethiopia. Regional Environmental Change. 17:
1479-1492
Hoellein, T. J., D. A. Bruesewitz and D. P. Hamilton. 2012. Are geothermal streams important
sites of nutrient uptake in an agricultural and urbanising landscape (Rotorua, New
Zealand)? Freshwater Biology 57: 116-128
Hurni, H. 1993. Land degradation, famine, and land resource scenarios in Ethiopia. World Soil
Erosion and Conservation 27-61
Information on Fisheries Management in the Federal Democratic Republic of Ethiopia Food and
Agricultural Organization (FAO), January 2003.
Kalmbach E. (2017) Establishment of the Lake Tana Biosphere Reserve within the UNESCO
World Network of Biosphere Reserves. In: Stave K., Goshu G., Aynalem S. (eds) Social
and Ecological System Dynamics. AESS Interdisciplinary Environmental Studies and
Sciences Series.
Karlberg, L., et al ( 2015) Tackling biomass scarcity from vicious to virtuous cycles in Sub-
Saharan Africa . Current Opinion in Environmental Sustainability

Lemma, B., F. Kebede, S. Mesfin, I. Fitiwy, A. Abraha, L. Norgrove. 2017. Quantifying annual
soil and nutrient lost by rill erosion in continuously used semiarid farmlands, North
Ethiopia. Environmental Earth Scienes 76:190
Osman, M. and P. Sauerborn. 2002. A preliminary assessment of characteristic and long-term
variability of rainfall in Ethiopia basis for sustainable land use and resources management.
Conference on International Agricultural Research for Development, Deutscher Tropentag.
Seleshi, Y., and G. R. Demaree. 1995. Rainfall variability in the Ethiopian and Eritrean highlands
and its links with the southern oscillation index. Journal of Biogeography 22(4/5): 945-
952.
Sheferaw Ayele, H. ( 2016) Impact of Climate Change on Runoff in the Gilgel Abbay Watershed,
the Upper Blue Nile Basin, Ethiopia. Water 8, 380
Von Schiller, D., E. Marti, J. L. Riera, M. Ribot, J. C. Marks, F. Sabater. 2008. Influence of land
use on stream ecosystem function in a Mediterranean catchment. Freshwater Biology
53(12): 2600-2612.
Williamson, C.E., W. Dodds, T. K. Kratz, and M. A. Palmer. 2008. Lakes and streams as sentinels
of environmental change in terrestrial and atmospheric processes. Frontiers in Ecology and
the Environment 6(5): 247-254.
Zeleke, G., and H. Hurni. 2001. Implications of land use and land cover dynamics for mountain
resource degradation in the northwestern Ethiopian highlands. Mountain Research and
Development 21(2): 184-191.


