Examining the Transfer Student Experience: Interactions with Faculty, Campus Relationships, & Overall Satisfaction Alexander C. McCormick Shimon A. Sarraf Allison BrckaLorenz Antwione M. Haywood Indiana University Bloomington Paper presented at the annual meeting of the Association for the Study of Higher Education in Vancouver, Canada, November 2009
Transcript
Examining the Transfer Student Experience: Interactions with Faculty, Campus Relationships, & Overall Satisfaction
Alexander C. McCormick Shimon A. Sarraf
Allison BrckaLorenz Antwione M. Haywood
Indiana University Bloomington
Paper presented at the annual meeting of the Association for the Study of Higher Education in Vancouver, Canada, November 2009
Transfer students make up a substantial share of undergraduates at four-year institutions
in the United States. Among 1999-2000 bachelor’s degree recipients, about one in three
reported that they had transferred to their degree-granting institution (Peter & Cataldi,
2005). In a nationally representative sample of undergraduates in 2003-04, half of fourth-
and fifth-year students at four-year institutions reported that they began their
postsecondary education at a different institution (U.S. Department of Education, 2009).
In view of the substantial share of undergraduates at baccalaureate-granting institutions
who transfer,1
it is important to assess the educational experience of these students, who
are likely to face academic, social, and personal challenges in the transition to a new
Students may change institutions for a number of reasons. For bachelor’s degree seeking
students transferring from a sub-baccalaureate institution (vertical transfers), transfer is a
necessary step to reaching their educational objective. The motives behind horizontal
transfer, by contrast, are far more varied, including unsatisfactory academic performance,
academic, personal, or social dissatisfaction, financial difficulty, and pursuit of programs
unavailable at the first institution, to name a few. Both vertical and horizontal transfers
include students who stop out between institutions, sometimes for many years. Kirk-
Kuwaye (2007), notes that the diversity in types of transfers contributes to the lack of
institutions’ understanding in supporting transfer students.
1 In this paper, “transfer” refers to any student who makes a one-way transition between institutions, without any assumptions or evidence regarding the transfer of course credit.
2
Transfer students tend to have nontraditional backgrounds and college experiences.
Relative to native students, they tend to be older, less likely to live on campus, more
likely to work off campus, and more likely to care for dependents. Transfer students may
experience a sharp decline in GPA the semester after transferring (Glass & Harrington,
2002) and they are less likely to graduate than native students (Long & Kurlaender, 2009;
Ishitani, 2008). The term “transfer shock” has been used to describe the academic
difficulties students may experience within the first year after transferring. The transfer
shock literature helps explain the dip in academic performance students experience after
entering a new institution (Glass & Harrington, 2002; Ishitani, 2008; Laanan, 2001).
Glass and Harrington (2002) found that students from community colleges actually did
better prior to transfer than their peers at four year institutions in lower-division
requirements, yet most of these students experience some type of transfer shock after
entering a new institution. Transfer students who persisted beyond the transfer shock
phase seem to show improvement in their GPA after the first or second semester at the
new institution, while native students tend to maintain the same level of achievement.
Laanan (2007) notes that intellectual self awareness and confidence directly correlates
with the academic adjustment of transfer students. While transfer shock contributes to
attrition among transfer students, those who make it past the shock tend to graduate with
higher GPAs than native students.
According to Tinto’s (1988) theory of stages of student departure, students must first
separate themselves from past relationships before beginning their transition to college
life. This transition may be especially difficult for transfer students because their previous
3
college experiences may not prepare them for the new campus culture, and the new
campus may not facilitate integration in the same way it does for new students. Because
an appreciable share of transfers are nontraditional students, they may also have off-
campus obligations, such as employment or dependent care, from which they cannot
separate or which undermine their integration into the new setting. Transfers typically
miss socialization and integration activities and opportunities that are available to first-
year students. Transfer students may have particular difficulty integrating into the new
college community due to their lack of established contacts within the institution
(Townsend & Wilson, 2006). Typically students develop these contacts in orientation
programs, co-curricular and extra-curricular activities, and other on-campus programs.
Transfer students’ difficulty creating such contacts “may lead to the absence of
integration and to its associated sense of isolation” (Tinto, 1988, p. 446).
Social integration, facilitated by informal interactions with peers, faculty, and
administrative personnel, is an important factor in the success of transfer students,
particularly for persistence and degree completion (Tinto, 1975; Pascarella, 1986). Tinto
(1975) writes that “of the various forms of social interaction that occur within the social
system of the college, peer group associations appear to be most directly related to
individual social integration” (p. 110). Unfortunately, transfer students can have many
difficult and frustrating experiences when it comes to social integration. The most
troublesome aspects appear to be finding such social connections and balancing
academics, social lives, and other life responsibilities (Davies & Casey, 1999). Transfer
students report fewer interactions with peers than native students (National Survey of
4
Student Engagement, 2008) and making new friends is often one of transfer students’
greatest concerns (Bauer, 1994). Townsend and Wilson (2006) report that after the first
year, native students lose motivation to bond and to intentionally invite transfer students
to participate in collaborative assignments, study groups, and other common intellectual
experiences.
Poorly developed peer relationships can be quite detrimental to undergraduates’
development and persistence. Underdeveloped relationships with peers can have a large
negative impact on students’ satisfaction (Astin, 1993) and students who do not actively
engage with peers in social activities are less likely to be satisfied with all social aspects
of campus life (Berger & Maloney, 2003). Such satisfaction can be measured by both
specific aspects of the student experience as well as overall impressions of the
experience. One criterion that many transfer students use to measure their own
satisfaction is the quality of social relationships they form with students and faculty
members (Vaala, 1988). Many studies define a student’s commitment to degree
completion and commitment to the institution by overall satisfaction with the institution
attended (Pascarella, 1986). Such a definition makes sense given that a student’s
satisfaction with the college experience has been shown to be significantly related to a
student’s likelihood to reenroll, particularly for transfer students where satisfaction is
positively associated with intent to persist (Astin, 1993; Johnson, 1987). Unfortunately,
transfer students report being less satisfied with their college experience than native
students (National Survey of Student Engagement, 2005), and they also rate the
supportiveness of the campus environment lower than do native students (National
5
Survey of Student Engagement, 2008), suggesting that they may have difficulty forging
meaningful on-campus relationships.
Social integration is not limited to the quality of peer relationships. Rhine (2000) writes
that “student academic progress is most likely to be impeded by administrative obstacles”
(p. 448) implying that relationships with administrative personnel may be important, as
well. After peer group associations, however, meaningful interactions with faculty
members appear to be most directly related to students’ social integration (Tinto, 1975).
Students who interact more often with faculty members outside of class are also more
likely to graduate, graduate with honors, and enroll in graduate or professional school
(Astin, 1993; Pascarella & Terenzini, 2005). Some evidence suggests that student-faculty
relationships might be particularly beneficial for male students (Pascarella, 1986).
Positive interactions with faculty members can give students additional benefits. Quality
student-faculty interactions appear to help students socialize to the norms of their
institution and create a closer bond between student and institution (Pascarella &
Terenzini, 2005). For transfer students, such student-faculty interactions are also strongly
associated with a positive and significant development of academic content and skills.
Such interactions, both inside and outside of the classroom, may be particularly important
for community college transfers to a four-year institution (Berger & Maloney, 2003;
Daview & Casey, 1999; Volkwein, 1986). Students who report quality out-of-class
interactions with faculty members also perceive that their institutions are more supportive
and they put more effort toward their studies (Kuh & Hu, 2001). Perceiving a supportive
campus environment is inversely related to transfers students’ marginalization—the more
6
supported these students feel, the less likely they are to feel isolated on campus (Kodoma,
2002).
Recent literature on the quality of undergraduate education has called attention to the
importance of student engagement, or the degree to which students are exposed to and
As a group, transfer students lag behind their native counterparts on several measures of
student engagement. They participate less often in enriching educational experiences, and
they view their campus as less supportive than do native students (National Survey of
Student Engagement, 2008). However, these findings do not differentiate between
horizontal and vertical transfers. Given the high degree of mobility between institutions
and the heterogeneity of the transfer population, it is important to improve our
understanding of the transfer student experience across groups and how it might be
improved.
Related research has also shown that certain activities—so-called high-impact
practices—such as research with faculty, study abroad, internships, and culminating
7
senior experiences (e.g., a thesis, senior project, or capstone course), can contribute to
persistence, enhanced learning, and other positive outcomes (Kuh, 2008; National Survey
of Student Engagement, 2007). Such activities are positively related to students’ self-
reported gains as well as scores on measures of academic challenge, active and
collaborative learning, and student-faculty interaction (Kuh, 2008). High impact practices
tend to elevate student performance in several areas of engagement and student learning.
These practices often increase students’ overall investment in time and effort devoted to
academic work, and they provide occasions for constructive feedback, diverse
interactions, and making connections between classroom learning and real-world issues
and problems (Kuh, 2008; Kuh, 2007; Kinzie, 2008). Involvement in such activities can
also help transfer students make deeper connections with their institution and feel less
like an outsider (Ose, 1997). Transfer students, however, are less likely to participate in
many such practices (National Survey of Student Engagement, 2007).
Recent analyses indicate that fewer than 9% of transfer students participated in study
abroad opportunities, and fewer than 14% participated in research with faculty or in a
learning community (Kinzie, 2008). Transfer students who work with faculty members
on research projects attribute much of their academic success and academic integration to
this activity (Townsend & Wilson, 2009). It has been recommended that students
participate in at least two high impact practice activities during their college experience,
one in the first year and one related to the major (National Survey of Student
Engagement, 2007). One roadblock to this goal may be that transition programs for
8
transfer students often place transfer students together, limiting their interaction with
other first-year students in orientations and seminars (Townsend & Wilson, 2006).
Rationale and Research Questions
In view of their large representation among students at four-year institutions, the transfer
student population merits serious study. Interventions designed to promote retention and
graduation, as well as those that aim to promote return to higher education by adult
students who left school, should take account of the special needs and challenges that
transfers face. Studies of the transfer student experience are dominated by single-
institution studies, and most such studies approach the topic using qualitative methods.
These studies offer valuable insights, but they also have limited generalizability. It is also
the case that the majority of studies of transfer students focus on those who transfer from
community colleges to four-year institutions, while others treat all transfer students as an
undifferentiated group. Recognizing that horizontal transfers may face similar challenges
at the receiving institution, and also that they may also face (or bring) distinct issues and
challenges, we seek to understand similarities and differences in the experiences of the
two transfer populations relative to native students. Because of our interest in broad
commonalities and differences in the experiences of these groups, we approach the topic
using data from a survey of students at approximately 700 U.S. baccalaureate-granting
colleges and universities representing the diversity of U.S. higher education. Our aim is
to test the extent to which multi-institutional data support the contention that transfers are
marginalized and underserved, while illuminating how horizontal transfers compare to
vertical transfers and to native students, comparisons that have received scant attention
9
by researchers focused on the vertical transfer experience or on transfers as a single
population. Finally, recognizing the diversity and considerable autonomy of U.S. higher
education institutions, we also seek evidence of institutions that may serve transfer
students particularly well—institutions where the conventional wisdom about the transfer
experience does not hold. We thus focus on three questions:
1) How do horizontal and vertical transfer students compare to native students with
respect to:
• student-faculty interaction;
• quality of campus relationships;
• overall satisfaction with college;
• participation in high-impact educational activities; and
• satisfaction with academic advising?
2) Using the same measures, do the experiences of horizontal and vertical transfers
differ in meaningful ways?
3) If transfer students score lower than native students on some measures, are there
institutions whose transfer populations perform comparably to native students,
and if so, what distinguishes these institutions?
Methods
Data Source. We analyzed these questions using data from senior respondents to the
2008 National Survey of Student Engagement (NSSE). NSSE surveys random samples of
first-year and senior students to assess their involvement in educationally beneficial
activities (Kuh, 2001, 2003; Chickering & Gamson, 1987). The data set provides a rich
10
source of information about the college student experience across many different types of
institutions in the United States. Respondents reported on their participation in a range of
activities and practices that prior research has found to be particularly beneficial in terms
of student learning and development: their interactions with faculty; their assessments of
relationships with peers, campus administrators and faculty; their overall assessments of
their college experience; as well as a number of other items pertaining to their college
experience, time allocation, perceived gains during college, and demographic and
enrollment characteristics. The survey data also serve as a source for individual-level
controls used in our analyses.
Sample. After removing respondents with missing data for variables used in our analyses,
the sample included 148,296 seniors from 712 four-your colleges and universities. Of this
population, the average age was 25 years old, 65% were female, 12% were members of
underrepresented minorities, 57% had at least one parent with a bachelor’s degree, and
88% were enrolled full-time when they completed the survey. With regard to institutional
characteristics, 38% of the analysis sample were enrolled at private institutions, 29%
were enrolled at doctorate-granting universities, 46% at masters institutions, and 20% at
baccalaureate colleges. Even though institutions choose to participate in NSSE, our
sample was generally representative of the larger universe of institutions and students
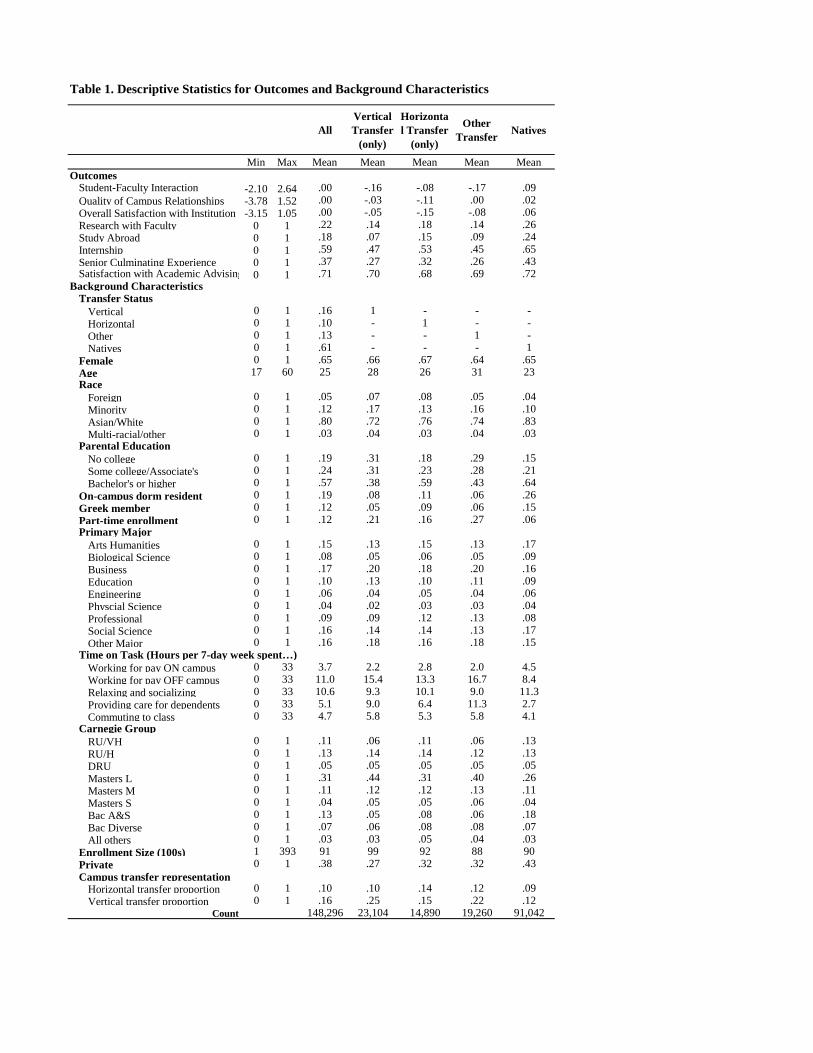
across the United States. Additional descriptive statistics about the sample appear in
Table 1.
11
--------------------------------- Insert Table 1 about here
---------------------------------
Measures. Transfer status was determined from the answer to two questions:
1. Did you begin college at your current institution or elsewhere? (Started
here/Started elsewhere)
2. Since graduating from high school, which of the following types of schools have
you attended other than the one you are attending now? (Mark all that apply)
(Vocational or technical school / community or junior college / 4-year college
other than this one / none / other)
Respondents who indicated that they started at the current institution were coded as
native students, while those who started elsewhere were identified as transfers. Those
who only indicated prior attendance at a community or junior college were identified as
vertical transfers, and those who only indicated attending another four-year institution
were identified as horizontal transfers. The remaining transfers included those whose
prior attendance was limited to one or more of the remaining types, as well as those
whose vertical or horizontal transfer pattern could not be determined due to multiple
types of prior attendance (e.g., prior attendance at both a community college and a four-
year institution). All members of this residual group were coded as ‘other transfers.’
Native students represented 61% of the sample, while vertical, horizontal, and other
transfers accounted for 16%, 10%, and 13% of the sample, respectively.
12
Dependent Variables. To address our first research questions, we created three scales:
Student-Faculty Interaction (SFI), Quality of Campus Relationships (QCR), and Overall
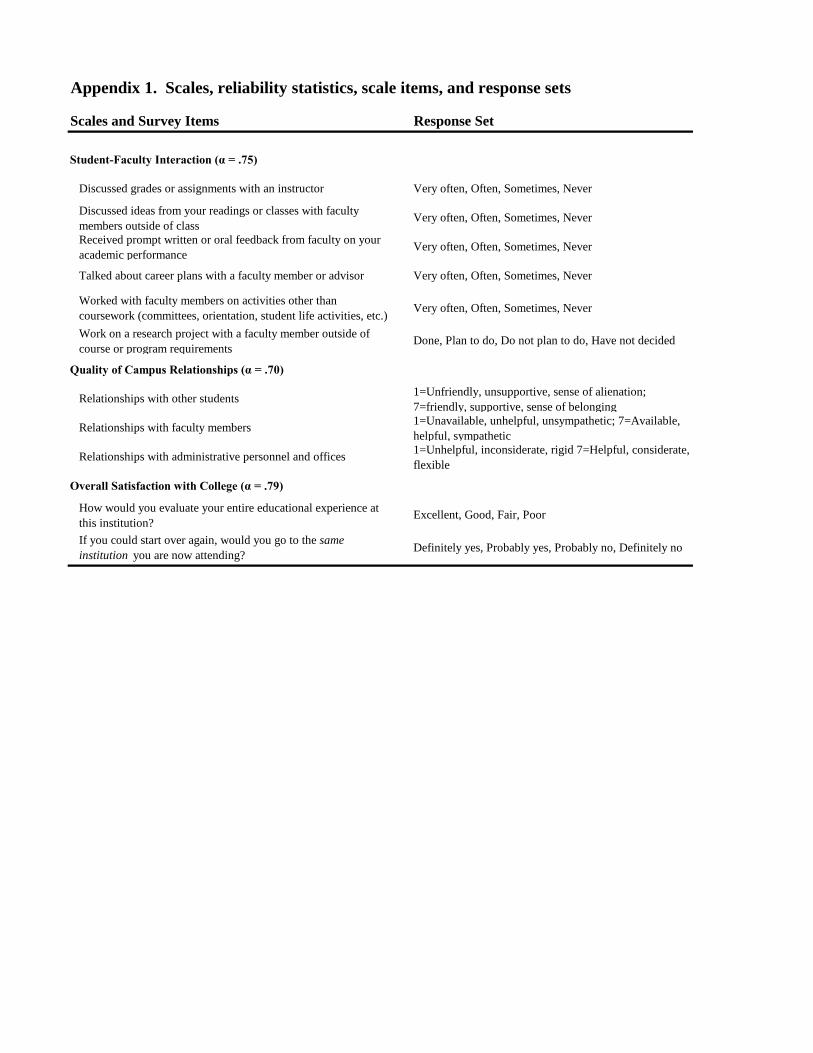
Satisfaction with College (OSC). SFI (α = .75) uses six items related to how often
students communicated with faculty on various topics, how often they received prompt
feedback about their performance, and whether they conducted research with faculty. SFI
attempts to quantify the frequency of contact with faculty members inside and outside the
classroom and serves as a proxy for an important form of academic integration. QCR (α =
.70) includes three items asking students to rate the quality of relationships with students,
faculty, and administrative staff. OSC (α = .79) includes two items related to students’
global perceptions about the quality of their educational experience. We hypothesize that
if a transfer population is marginalized, this will manifest itself in lower levels of
interaction with faculty, lower ratings of relationships, and lower satisfaction with their
college experience than the relevant comparison group. The exact survey items used in
each scale and their corresponding response sets appear in Appendix I.
To assign a scale score, we required valid data for at least three-fifths of the items in a
scale (i.e., at least four items for SFI, and at least two for QCR and OSC). Each scale was
computed by converting its component items’ response options to a 0 to 100 point scale,2
and then taking the average. We then standardized each scale to a mean of zero and
standard deviation of one. Descriptive statistics for scales can be found in Table 1.
2 Assuming equal distance between ordered response options. The one item whose response set indicated whether a student had done an activity or planned to do so in the future was coded 100 for ‘Done,’ otherwise zero.
13
We also examined a set of dichotomous outcomes as another way to assess academic
integration. We considered participation in four high-impact educational activities and
satisfaction with academic advising. For high-impact practices, we used a set of survey
items in which respondents were asked, “Which of the following have you done or do
you plan to do before you graduate from your institution?” (response options: Done, Plan
to do, Do not plan to do, Have not decided)
• Work on a research project with a faculty member outside of course or program
requirements;
• Study abroad;
• Practicum, internship, field experience, co-op experience, or clinical assignment;
and
• Culminating senior experience (capstone course, senior project or thesis,
comprehensive exam, etc.)
Each survey item was recoded so that a value of one represented ‘Done’ and zero
represented the remaining options. It is important to note a limitation of the survey with
regard to measures of high-impact practices. Students indicated whether they ever
participated, but that does not necessarily mean the participation was at the current
institution. While it is reasonable to infer that most seniors doing a culminating senior
experience did so at the current institution, we cannot say with certainty where the other
practices took place.
To evaluate academic advising satisfaction, we dichotomized a single item that asks,
“Overall, how would you evaluate the quality of academic advising you have received at
14
your institution?” Responses of ‘excellent’ and ‘good’ were coded as one, ‘fair’ and
‘poor’ as zero.
Independent variables for the first two research questions included both student and
institutional characteristics that prior literature suggests may be related to the dependent
variables. Student characteristics included as independent variables included gender, age,
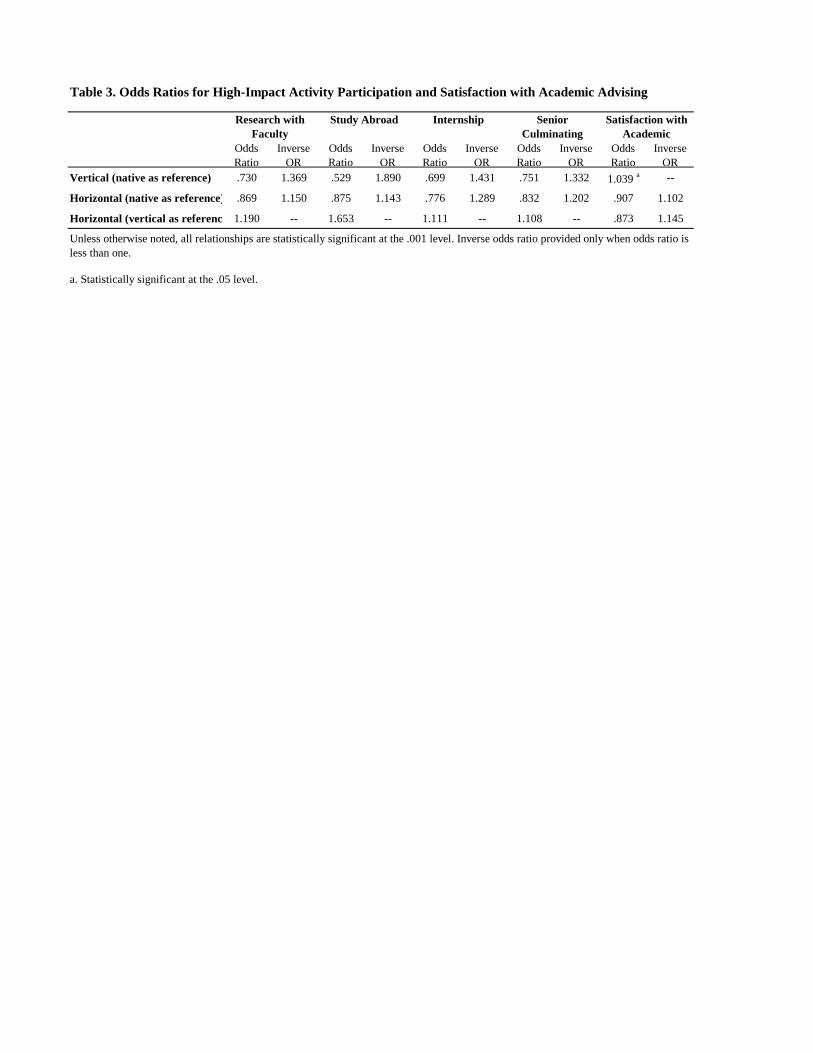
however, have 14% greater odds than their horizontal transfer peers of being satisfied
with academic advising.
What Characterizes Institutions where Transfers have Comparable Experiences to
Native Students?
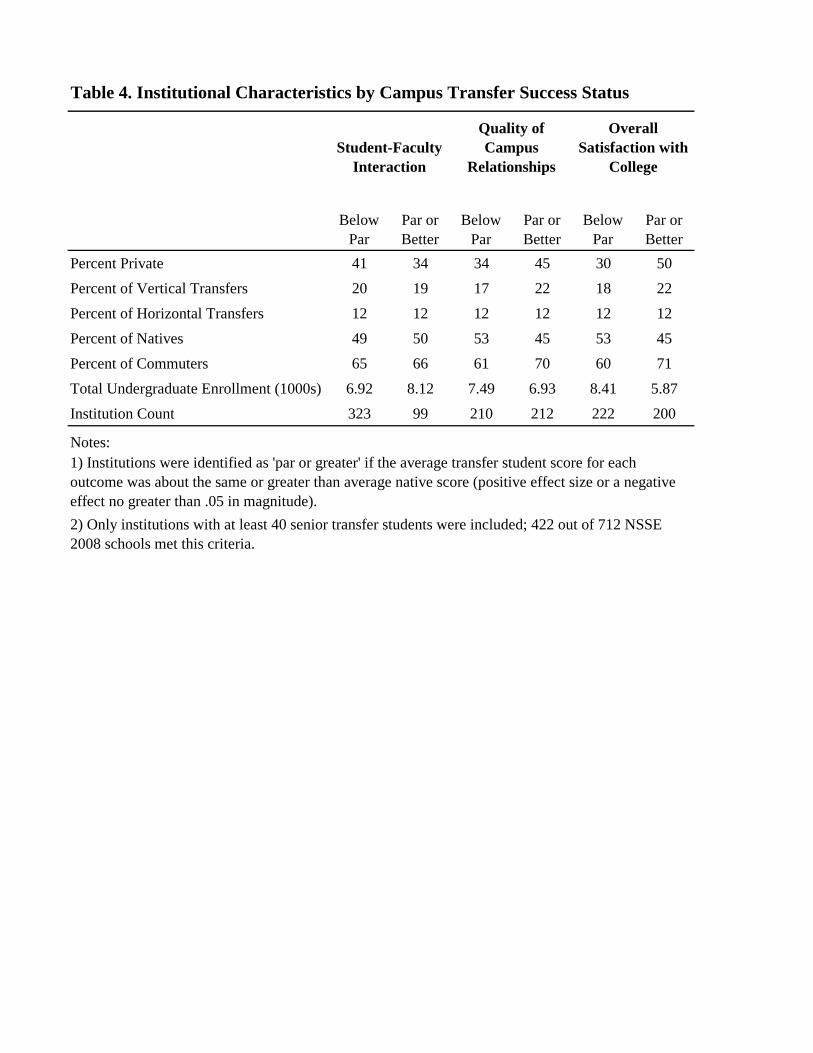
Our analysis of institutions reveals a number that appear to serve transfers as well as they
serve native students. Of 422 institutions eligible for the analysis, 99-212 had transfer
students (of any type) who, as a group, compared favorably with their native peers on
SFI, QCR, and OSC (see Table 4). Based on the numbers alone, it appears that achieving
parity between transfers and natives may be far more difficult with respect to student-
faculty interaction (99 “successful” institutions), compared with the other scales (200 or
more).
Several noticeable differences emerged between ‘below par’ and ‘par or better’
institutions using QCR and OSC scales, while only one characteristic showed a more than
trivial difference with SFI. Of the 99 institutions in the SFI ‘par or better’ group, 34%
were privately controlled compared to 41% of ‘below par’ institutions. Both groups had
about the same average institutional proportion of native students, commuters. The ‘par
of better’ group also enrolled about 1,200 more undergraduates, on average.
Relative to ‘below par’ schools on QCR and OSC, the ‘par or better’ group contained
proportionally more private institutions (10% greater for QCR and 20% greater for OSC)
and also had larger proportions of commuting students (10% more for both scales). In
21
addition, ‘par or better’ groups for both scales had lower average institutional proportions
of native students (about an 8% gap). Only OSC showed lower undergraduate enrollment
at the ‘par or better’ schools, by an average of about 2,500 undergraduates. Although
these findings can only be characterized as exploratory and preliminary, they are
nevertheless suggestive, indicating that transfer students may be somewhat better served
at private institutions and at those serving an appreciable population of commuter
students. These findings certainly warrant further exploration.
Discussion
Before discussing the implications of this research, it is important to consider some
limitations associated with this analysis. First, our definition of “transfer” is really about
transitions between institutions. We are not able to tease out differences associated with
length of stopout between institutions, number of credits transferred, or measures of
cognitive ability and prior achievement. The availability of some high-impact practices
examined may vary considerably between institutions rather than students, and they may
also reflect variation in institutional or departmental requirements. This is particularly
likely in the case of culminating senior experiences, but also possible in the case of
practica or internships. Also, as noted earlier, some high-impact practices reported may
have taken place prior to transfer. This might account for the relative advantage that
horizontal transfers have over vertical transfers with respect to these practices, but it does
not explain the overall advantage enjoyed by natives. We should also note a limitation of
the institution-level analysis that addresses our third question. While we identified
institutions where transfers fared as well as native students, on average, with regard to the
22
three scales, we did not apply any objective criteria for what constitutes a “good”
experience. On the basis of this analysis, we cannot conclude that transfers and natives
are particularly well served, only that the two groups have comparable experiences—they
could be comparably good, mediocre, or poor. Finally, it is important to note that we
examined seniors who were surveyed in the spring. Among both native students and
transfers, this is a successful group. We might have found different results or reached
different conclusions if we had access to comparable data for sophomores and juniors—
especially soon after their transfer to the new institution.
These findings offer both good news and bad news. First, the bad news: our findings
confirm that on a host of measures, we found evidence of a “transfer deficit.” These
differences were relatively modest on the three scales examined, but considerably larger
when we looked at high-impact educational practices, where we found consistent,
sometimes quite dramatic, advantages for native students. We also found consistent
advantages for horizontal over vertical transfers with respect to these practices. The one
interesting exception to the pattern of transfer deficit is satisfaction with advising, with
vertical transfers more satisfied than both native students and horizontal transfers. This
finding alone is worthy of further exploration, and it is suggestive of differences between
the quality of advising at community colleges and at four-year institutions, at least among
these most successful of community college transfers.
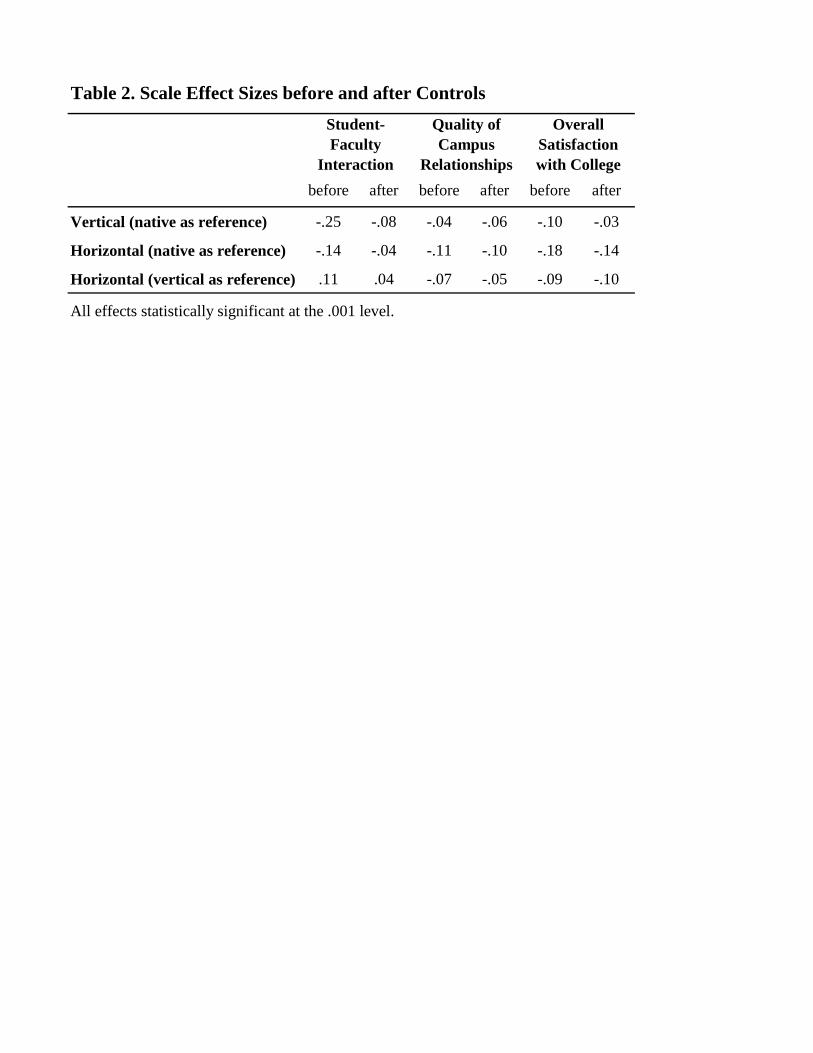
The good news is that on the three scales examined—student-faculty interaction, quality
of campus relationships, and overall satisfaction with the college attended—the transfer
23
deficit was relatively modest and, in some cases, attenuated considerably after controlling
for student and institutional characteristics. This does not mean that we should be
unconcerned, however. Rather, it merely reinforces the importance of addressing the
educational needs of underrepresented and nontraditional students, whatever their means
of entry into our institutions of higher education. The other good news is that our
institution-level analysis revealed a considerable number of institutions where, at least on
average and with respect to the three academic integration scales, the transfer deficit does
not exist. The numbers suggest that it may be harder to erase the transfer deficit with
respect to student-faculty interaction, but 99 of 422 institutions did so. The institution-
level analysis also indicates that private institutions and institutions with larger
populations of commuter students are somewhat more likely to serve transfer students
and native students comparably. Whether that means comparable well, or not so well,
remains for further study.
24
References Astin, A. W. (1993). What matters in college? Four critical years revisited. San
Francisco: Jossey-Bass Publishers. Bauer, P. F. & Bauer, K. W. (1994). The community college as an academic bridge:
Academic and personal concerns of community college students before and after transferring to a four-year institution. College and University, 69, 116-122.
Berger, J. B. & Malaney, G. D. (2003). Assessing the transition of transfer students from community colleges to a university. NASPA Journal, 40(4), 1-23.
Chickering, A. W. & Gamson, Z. F. (1987). Seven principles for good practice in undergraduate education. AAHE Bulletin, 39(7), 3-7.
Chickering, A. W. & Reisser, L. (1993). Education and Identity. San Francisco: Jossey-Bass Publishers.
Christie, N. G. & Dinham, S. M. (1991). Institutional and external influences on social integration in the freshman year. The Journal of Higher Education, 62(4), 412-436.
Davies T. G. & Casey, K. (1999). Transfer student experiences: Comparing their academic and social lives at the community college and university [electronic version]. College Student Journal, 33(1).
DesJardins, S. (2001). A comment on interpreting odds-ratios when logistic regression coefficients are negative. Association for Institutional Research Professional File 81(Fall), 1-10.
Flaga, C. T. (2006). The process of transition for community college transfer students. Community College Journal of Research and Practice, 30, 3-19.
Glass, J. C. & Harrington, A. R. (2002). Academic performance of community college transfer students and “native” students at a large state university. Community College Journal of Research and Practice, 26(5), 415-430.
Ishitani, T. T. (2008). How do transfers survive after “transfer shock”? A longitudinal study of transfer student departure at a four-year institution. Research in Higher Education, 49, 403-419.
Johnson, N. T. (1987). Academic factors that affect transfer student persistence. Journal of College Student Personnel, 28(4), 323-329.
Kinzie, J. (2008). Enhancing student learning and success: Engagement and high-impact practices. Keynote address presented at the regional meeting of NASPA IV-W in Tulsa, OK.
Kirk-Kuwaye, C. & Kirk-Kuwaye, M. (2007). A student of engagement patterns of lateral and vertical transfer students during their first semester at a public research university. Journal of the First-Year Experience & Students in Transition, 19(2), 9-27.
Kodoma, C. M. (2002). Marginality of transfer commuter students. NASPA Journal, 39(3), 233-250.
Kuh, G. D. & Hu, S. (2001). The effects of student-faculty interaction in the 1990s. The Review of Higher Education, 24(3), 309-332.
Kuh, G. D. (2001). Assessing what really matters to student learning: Inside the National Survey of Student Engagement. Change, 33(3), 10-17, 66.
25
Kuh, G. D. (2003). What we’re learning about student engagement from NSSE. Change, 35(2), 24-32.
Kuh, G. D. (2007). What student engagement data tell us about college readiness. Peer Review, 9(1), 4-8.
Kuh, G. D. (2008). High impact educational practices: What they are, who has access to them, and why they matter. Washington, DC: Association of American Colleges and Universities.
Kuh, G. D., Cruce, T. M., Shoup, R., Kinzie, J. & Gonyea, R. M. (2008). Unmasking the effects of student engagement on first-year college grades and persistence. Journal of Higher Education 79(5), 540-563.
Laanan, F. S. (1996). Marking the transition: Understanding the adjustment process of community college transfer students [electronic version]. Community College Review, 23(4).
Laanan, F. S. (2001). Transfer student adjustment. New Directions for Community Colleges, 114, 5-13.
Laanan, F. S. (2007). Studying transfer students: Part II: Dimensions of transfer students’ adjustment. Community College Journal of Research and Practice, 31, 37-59.
Long, B. T. & Kurlaender, M. (2009). Do community colleges provide a viable pathway to a baccalaureate degree? Educational Evaluation and Policy Analysis, 31(1), 30-53.
McCormick, A. C., Pike, G. R., Kuh, G. D., & Chen, P.-S. D. (2009). Comparing the utility of the 2000 and 2005 Carnegie classification systems in research on students' college experiences and outcomes. Research in Higher Education, 50(2), 144-167.
Monroe, A. (2006). Non-traditional transfer student attrition. The Community College Enterprise, 12(2), 33-54.
National Survey of Student Engagement. (2005). Exploring different dimensions of student engagement. Bloomington, IN: Indiana University Center for Postsecondary Research.
National Survey of Student Engagement. (2007). Experiences that matter: Enhancing student learning and success. Bloomington, IN: Indiana University Center for Postsecondary Research.
National Survey of Student Engagement. (2008). Promoting engagement for all students: The imperative to look within. Bloomington, IN: Indiana University Center for Postsecondary Research.
National Survey of Student Engagement. (2008, August). Contextualizing NSSE effect sizes: Empirical analysis and interpretation of benchmark comparisons. Retrieved June 2009 from http://nsse.iub.edu/pdf/effect_size_guide.pdf
Ose, K. (1997). Transfer student involvement: Differences between participators and nonparticipators in extracurricular activities. College Student Affairs Journal, 16(2), 40-46.
Pascarella, E. T., Seifert, T.A., & Blaich, C. (2008). Validation of the NSSE benchmarks against liberal arts outcomes and deep approaches to learning. Paper presented at the annual meeting of the Association for the Study of Higher Education in Jacksonville, FL.
26
Pascarella, E. T., Smart, J. C., & Ethington, C. A. (1986). Long-term persistence of two-year college students. Research in Higher Education, 24(1), 47-71.
Pascarella, E. T. & Terenzini, P. T. (2005). How college affects students, volume 2: A third decade of research. San Francisco: Jossey-Bass Publishers.
Peter, K., & Cataldi, F. E. (2005). The road less traveled? Students who enroll in multiple institutions (NCES 2005–157). U.S. Department of Education, National Center for Education Statistics. Washington, DC: U.S. Government Printing Office.
Pike, G. L. (2006). The convergent and discriminant validity of NSSE scalelet scores. Journal of College Student Development, 47(5), 550-563.
Rhine, T. J. (2000). Alleviating transfer shock: Creating an environment for more successful transfer students. Community College Journal of Research and Practice, 24, 443-453.
Tinto, V. (1997). Classrooms as communities: Exploring the educational character of student persistence. Journal of Higher Education, 68(6), 599-623.
Tinto, V. (1988). Stages of student departure: Reflections on the longitudinal character of student leaving. The Journal of Higher Education, 59(4), 438-455.
Tinto, V. (1975). Dropout from higher education: A theoretical synthesis of recent research. Review of Educational Research, 45(1), 89-125.
Townsend, B. K. & Wilson, K. B. (2009). The academic and social integration of persisting community college transfer students. Journal of College Student Retention, 10(4), 405-423.
Townsend, B. K. & Wilson, K. B. (2006). “A hand hold for a little bit”: Factors facilitating the success of community college transfer students to a large research university. Journal of College Student Development, 47(4), 439-456.
U.S. Department of Education. (2009). 2003-04 National Postsecondary Student Aid Study Data Analysis System. Generated on October 30, 2009 at http://nces.ed.gov/dasolv2/tables/index.asp.
Vaala, L. D. (1988). Transfer students’ description of satisfaction and success. College Student Journal, 22, 390-395.
Volkwein, J. F., King, M. C., & Terenzini, P. T. (1986). Student-faculty relationships and intellectual growth among transfer students. The Journal of Higher Education, 57(4), 413-430.
Table 1. Descriptive Statistics for Outcomes and Background Characteristics
Time on Task (Hours per 7-day week spent…)Working for pay ON campus 0 33 3.7 2.2 2.8 2.0 4.5Working for pay OFF campus 0 33 11.0 15.4 13.3 16.7 8.4Relaxing and socializing 0 33 10.6 9.3 10.1 9.0 11.3Providing care for dependents 0 33 5.1 9.0 6.4 11.3 2.7Commuting to class 0 33 4.7 5.8 5.3 5.8 4.1
Table 3. Odds Ratios for High-Impact Activity Participation and Satisfaction with Academic Advising
Unless otherwise noted, all relationships are statistically significant at the .001 level. Inverse odds ratio provided only when odds ratio is less than one.
Research with Faculty
Study Abroad Internship
Table 4. Institutional Characteristics by Campus Transfer Success Status
1) Institutions were identified as 'par or greater' if the average transfer student score for each outcome was about the same or greater than average native score (positive effect size or a negative effect no greater than .05 in magnitude).2) Only institutions with at least 40 senior transfer students were included; 422 out of 712 NSSE 2008 schools met this criteria.
Scales and Survey Items Response Set
Student-Faculty Interaction (α = .75)
Discussed grades or assignments with an instructor Very often, Often, Sometimes, Never
Discussed ideas from your readings or classes with faculty members outside of class
Very often, Often, Sometimes, Never
Received prompt written or oral feedback from faculty on your academic performance
Very often, Often, Sometimes, Never
Talked about career plans with a faculty member or advisor Very often, Often, Sometimes, Never
Worked with faculty members on activities other than coursework (committees, orientation, student life activities, etc.) Very often, Often, Sometimes, Never
Work on a research project with a faculty member outside of course or program requirements
Done, Plan to do, Do not plan to do, Have not decided
Quality of Campus Relationships (α = .70)
Relationships with other students 1=Unfriendly, unsupportive, sense of alienation; 7=friendly, supportive, sense of belonging
Relationships with faculty members 1=Unavailable, unhelpful, unsympathetic; 7=Available, helpful, sympathetic
Relationships with administrative personnel and offices 1=Unhelpful, inconsiderate, rigid 7=Helpful, considerate, flexible
Overall Satisfaction with College (α = .79)
How would you evaluate your entire educational experience at this institution?
Excellent, Good, Fair, Poor
If you could start over again, would you go to the same institution you are now attending? Definitely yes, Probably yes, Probably no, Definitely no
Appendix 1. Scales, reliability statistics, scale items, and response sets