This article attempts to draw a map of the user flows and behaviours in the multi-layered
CLARIN’s web structure by cross-examining the dynamic movements of different types of us-
ers within (and outside of) the CLARIN domain. In particular, the user traffic of several web-
sites is analysed including the main website, various CLARIN web applications, and the partner
websites, as well as the use of single sign-on. Consequently, this project is able to uncover the
user interactions in the context of the large web ecosystem rather than those of an each individ-
ual website. The evolution of the web traffic over a year reveals a comprehensive overview of
the characteristics of the end-users and provides a clue for the next strategic decisions over the
CLARIN’s user-oriented services and business sustainability. This preliminary research also
proves the potential of web analytics for Business Intelligence for measuring the impact of the
aggregation services and research infrastructures in cultural heritage and digital humanities.
1 Background – the CLARIN ecosystem
One of the strategies of CLARIN is to create and maintain an infrastructure which is financially,
technically and organisationally sustainable in the long-term1. It is, therefore, essential to collect and
analyse data about its performance and implement objective evaluation which would determine the
course of its sustainability. In particular, as CLARIN’s core activities are technically-oriented, offering
a number of web-based services to the research community, critical evaluation of end users is necessary
to check its performance in the long term and to make sensible decisions for the operation of CLARIN.
This area of research is generally called Business Intelligence (BI). According to Chugh and Grandhi
(2013), the BI is the process of applying tools and techniques to gather and analyse data from multiple
sources, to create knowledge that helps in decision-making.
Several evaluations have been conducted for CLARIN in this respect. For example, Eckart et al.
(2015) examined the statistics of the Virtual Language Observatory (VLO)2, attempting to explain the
user behaviours. Being a part of their technical development of the VLO, this analysis concentrated on
the impact of the change of its design and functionality. Two survey periods were defined to examine
the consequence of the interface improvement which took place between the survey periods. Subse-
quently they observed interesting phenomena relating to the user requests especially on full-text and
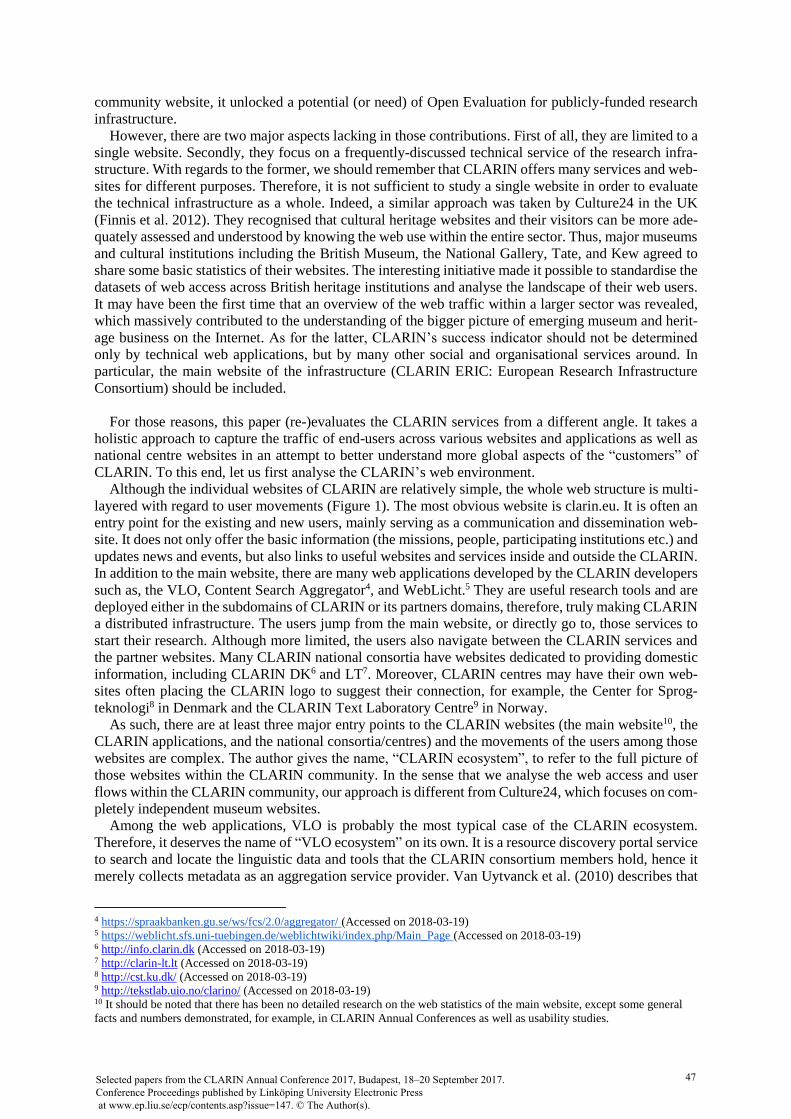
facets searches. Sugimoto (2017) instead provides more comprehensive research on this topic. He con-
ducted a detailed analysis of web traffic on the VLO from 2014 to 2016, taking into account the number
of visitors, visit duration, and frequency, to search keywords, social networks, and downloads, as well
as segmenting different user groups such as country. It covers most of the default Piwik3 analysis views.
Although there are challenges to dealing openly with sensitive information about the performance of a
1 https://www.clarin.eu/content/mission-and-strategy (Accessed on 2018-03-19) 2 https://vlo.clarin.eu/ (Accessed on 2018-03-19) 3 https://piwik.org/ (Accessed on 2018-03-19)
This work is licenced under a Creative Commons Attribution 4.0 International Licence. Licence details: http:// creativecom-
community website, it unlocked a potential (or need) of Open Evaluation for publicly-funded research
infrastructure.
However, there are two major aspects lacking in those contributions. First of all, they are limited to a
single website. Secondly, they focus on a frequently-discussed technical service of the research infra-
structure. With regards to the former, we should remember that CLARIN offers many services and web-
sites for different purposes. Therefore, it is not sufficient to study a single website in order to evaluate
the technical infrastructure as a whole. Indeed, a similar approach was taken by Culture24 in the UK
(Finnis et al. 2012). They recognised that cultural heritage websites and their visitors can be more ade-
quately assessed and understood by knowing the web use within the entire sector. Thus, major museums
and cultural institutions including the British Museum, the National Gallery, Tate, and Kew agreed to
share some basic statistics of their websites. The interesting initiative made it possible to standardise the
datasets of web access across British heritage institutions and analyse the landscape of their web users.
It may have been the first time that an overview of the web traffic within a larger sector was revealed,
which massively contributed to the understanding of the bigger picture of emerging museum and herit-
age business on the Internet. As for the latter, CLARIN’s success indicator should not be determined
only by technical web applications, but by many other social and organisational services around. In
particular, the main website of the infrastructure (CLARIN ERIC: European Research Infrastructure
Consortium) should be included.
For those reasons, this paper (re-)evaluates the CLARIN services from a different angle. It takes a
holistic approach to capture the traffic of end-users across various websites and applications as well as
national centre websites in an attempt to better understand more global aspects of the “customers” of
CLARIN. To this end, let us first analyse the CLARIN’s web environment.
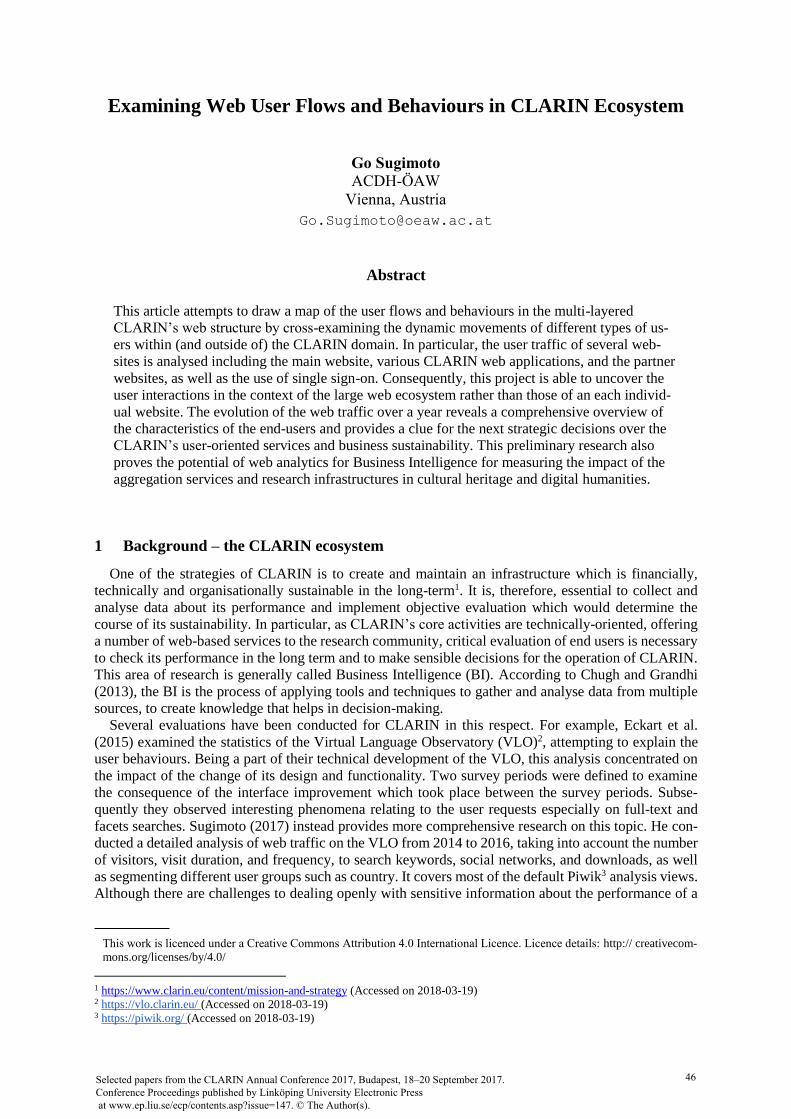
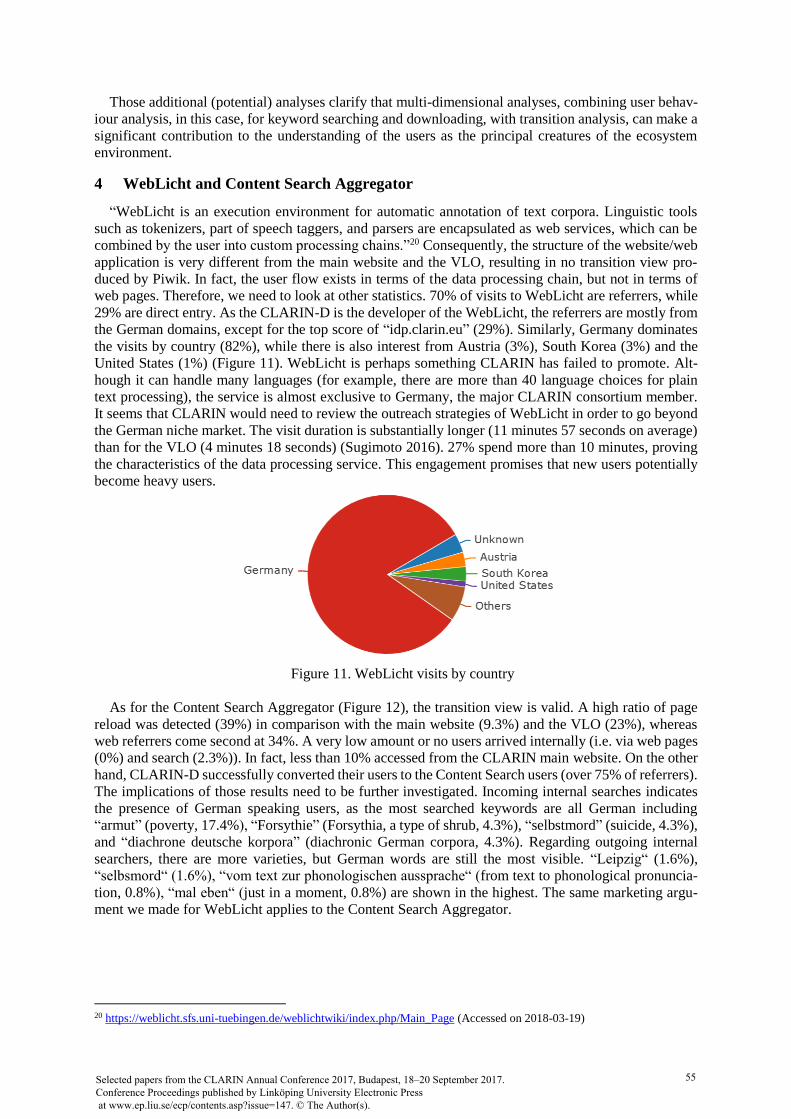
Although the individual websites of CLARIN are relatively simple, the whole web structure is multi-
layered with regard to user movements (Figure 1). The most obvious website is clarin.eu. It is often an
entry point for the existing and new users, mainly serving as a communication and dissemination web-
site. It does not only offer the basic information (the missions, people, participating institutions etc.) and
updates news and events, but also links to useful websites and services inside and outside the CLARIN.
In addition to the main website, there are many web applications developed by the CLARIN developers
such as, the VLO, Content Search Aggregator4, and WebLicht.5 They are useful research tools and are
deployed either in the subdomains of CLARIN or its partners domains, therefore, truly making CLARIN
a distributed infrastructure. The users jump from the main website, or directly go to, those services to
start their research. Although more limited, the users also navigate between the CLARIN services and
the partner websites. Many CLARIN national consortia have websites dedicated to providing domestic
information, including CLARIN DK6 and LT7. Moreover, CLARIN centres may have their own web-
sites often placing the CLARIN logo to suggest their connection, for example, the Center for Sprog-
teknologi8 in Denmark and the CLARIN Text Laboratory Centre9 in Norway.
As such, there are at least three major entry points to the CLARIN websites (the main website10, the
CLARIN applications, and the national consortia/centres) and the movements of the users among those
websites are complex. The author gives the name, “CLARIN ecosystem”, to refer to the full picture of
those websites within the CLARIN community. In the sense that we analyse the web access and user
flows within the CLARIN community, our approach is different from Culture24, which focuses on com-
pletely independent museum websites.
Among the web applications, VLO is probably the most typical case of the CLARIN ecosystem.
Therefore, it deserves the name of “VLO ecosystem” on its own. It is a resource discovery portal service
to search and locate the linguistic data and tools that the CLARIN consortium members hold, hence it
merely collects metadata as an aggregation service provider. Van Uytvanck et al. (2010) describes that
4 https://spraakbanken.gu.se/ws/fcs/2.0/aggregator/ (Accessed on 2018-03-19) 5 https://weblicht.sfs.uni-tuebingen.de/weblichtwiki/index.php/Main_Page (Accessed on 2018-03-19) 6 http://info.clarin.dk (Accessed on 2018-03-19) 7 http://clarin-lt.lt (Accessed on 2018-03-19) 8 http://cst.ku.dk/ (Accessed on 2018-03-19) 9 http://tekstlab.uio.no/clarino/ (Accessed on 2018-03-19) 10 It should be noted that there has been no detailed research on the web statistics of the main website, except some general
facts and numbers demonstrated, for example, in CLARIN Annual Conferences as well as usability studies.
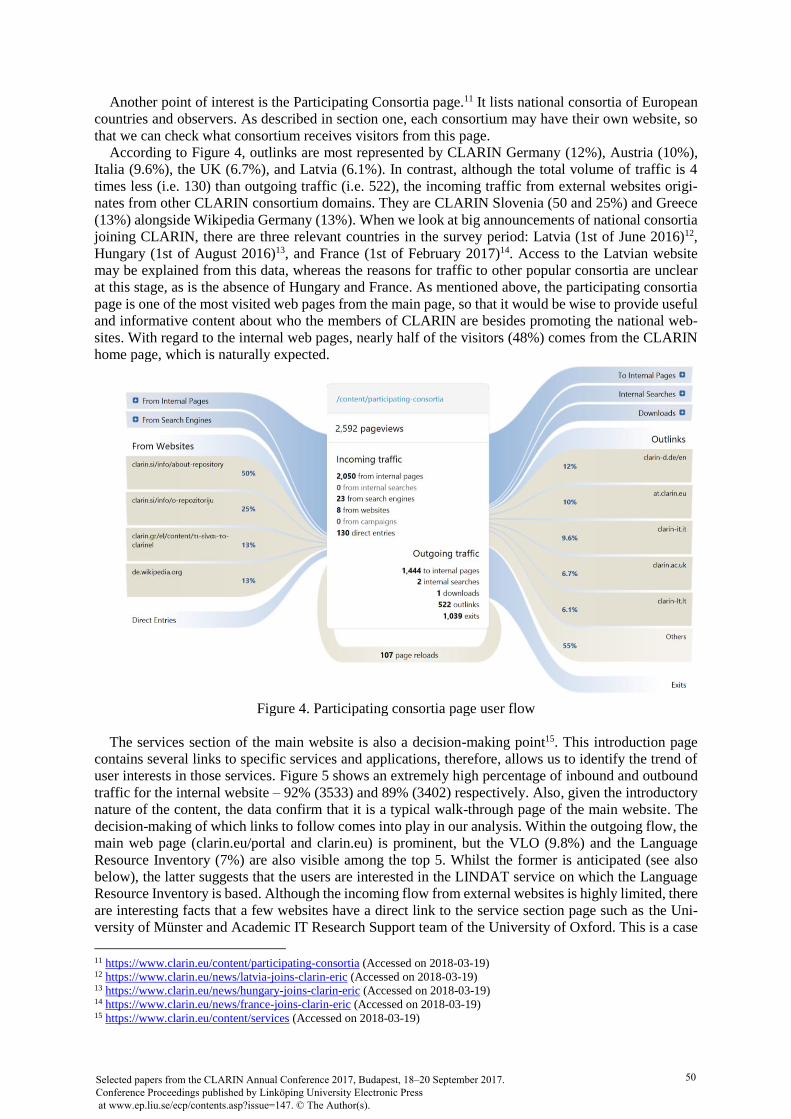
Another point of interest is the Participating Consortia page.11 It lists national consortia of European
countries and observers. As described in section one, each consortium may have their own website, so
that we can check what consortium receives visitors from this page.
According to Figure 4, outlinks are most represented by CLARIN Germany (12%), Austria (10%),
Italia (9.6%), the UK (6.7%), and Latvia (6.1%). In contrast, although the total volume of traffic is 4
times less (i.e. 130) than outgoing traffic (i.e. 522), the incoming traffic from external websites origi-
nates from other CLARIN consortium domains. They are CLARIN Slovenia (50 and 25%) and Greece
(13%) alongside Wikipedia Germany (13%). When we look at big announcements of national consortia
joining CLARIN, there are three relevant countries in the survey period: Latvia (1st of June 2016)12,
Hungary (1st of August 2016)13, and France (1st of February 2017)14. Access to the Latvian website
may be explained from this data, whereas the reasons for traffic to other popular consortia are unclear
at this stage, as is the absence of Hungary and France. As mentioned above, the participating consortia
page is one of the most visited web pages from the main page, so that it would be wise to provide useful
and informative content about who the members of CLARIN are besides promoting the national web-
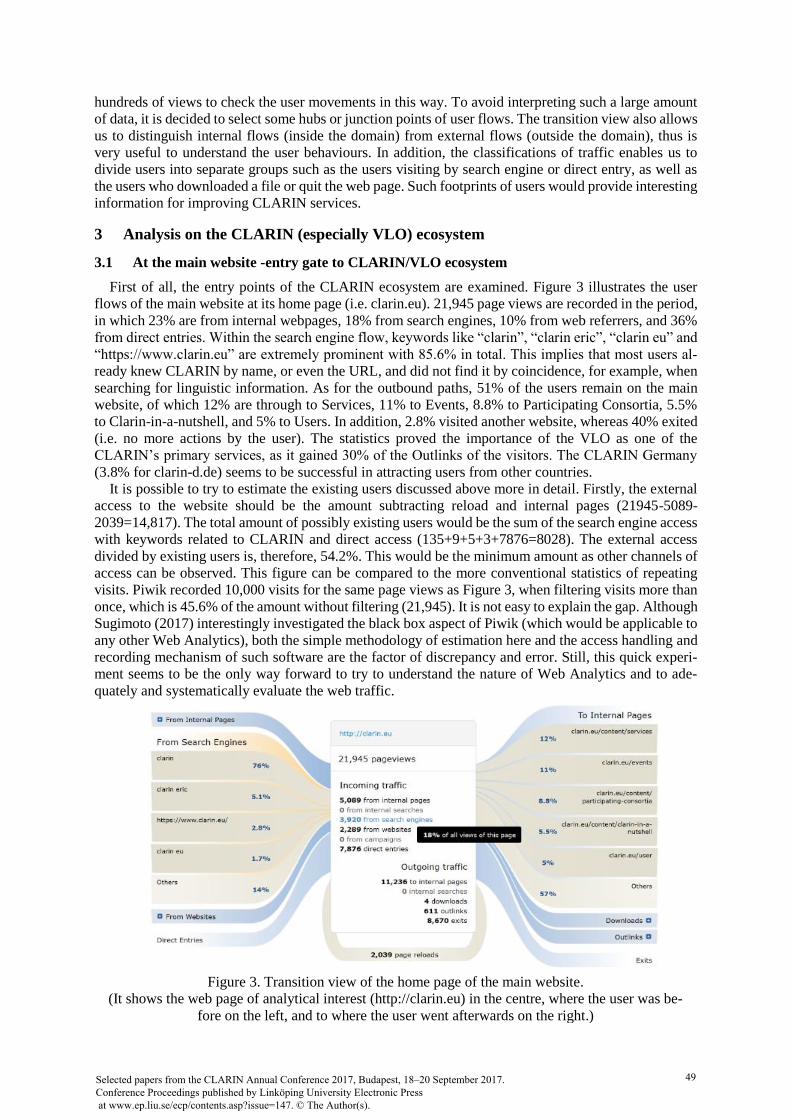
sites. With regard to the internal web pages, nearly half of the visitors (48%) comes from the CLARIN
home page, which is naturally expected.
Figure 4. Participating consortia page user flow
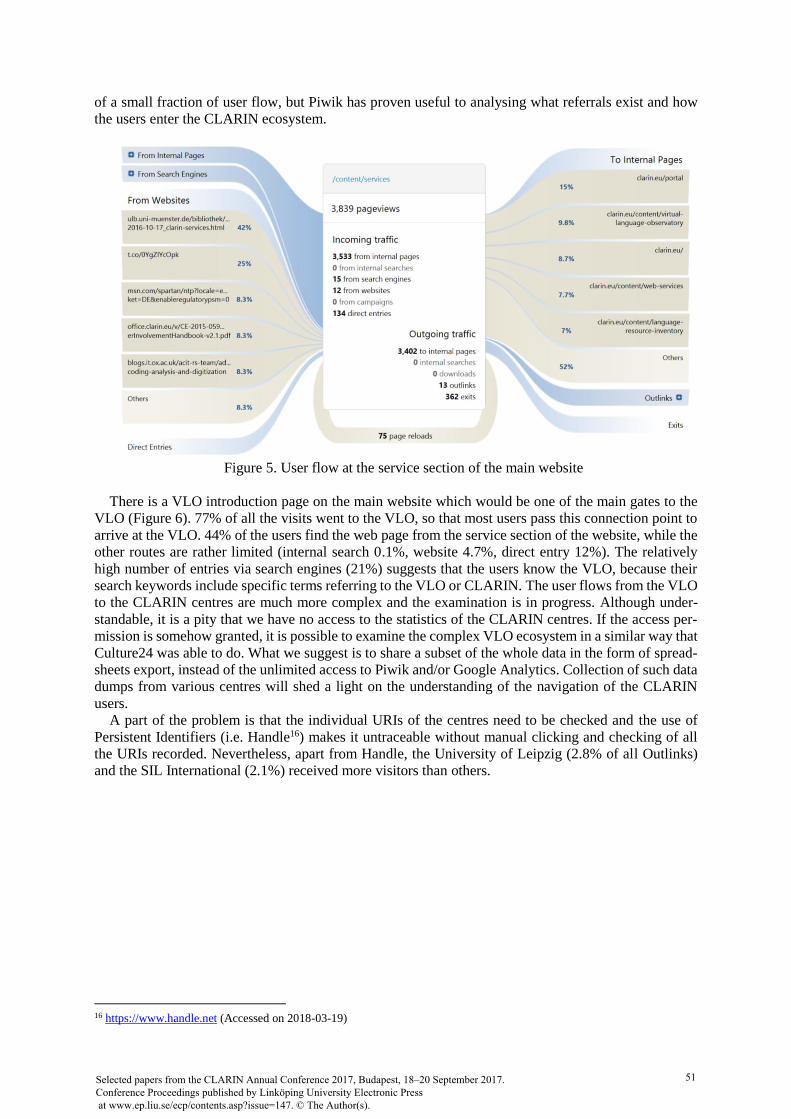
The services section of the main website is also a decision-making point15. This introduction page
contains several links to specific services and applications, therefore, allows us to identify the trend of
user interests in those services. Figure 5 shows an extremely high percentage of inbound and outbound
traffic for the internal website – 92% (3533) and 89% (3402) respectively. Also, given the introductory
nature of the content, the data confirm that it is a typical walk-through page of the main website. The
decision-making of which links to follow comes into play in our analysis. Within the outgoing flow, the
main web page (clarin.eu/portal and clarin.eu) is prominent, but the VLO (9.8%) and the Language
Resource Inventory (7%) are also visible among the top 5. Whilst the former is anticipated (see also
below), the latter suggests that the users are interested in the LINDAT service on which the Language
Resource Inventory is based. Although the incoming flow from external websites is highly limited, there
are interesting facts that a few websites have a direct link to the service section page such as the Uni-
versity of Münster and Academic IT Research Support team of the University of Oxford. This is a case
11 https://www.clarin.eu/content/participating-consortia (Accessed on 2018-03-19) 12 https://www.clarin.eu/news/latvia-joins-clarin-eric (Accessed on 2018-03-19) 13 https://www.clarin.eu/news/hungary-joins-clarin-eric (Accessed on 2018-03-19) 14 https://www.clarin.eu/news/france-joins-clarin-eric (Accessed on 2018-03-19) 15 https://www.clarin.eu/content/services (Accessed on 2018-03-19)
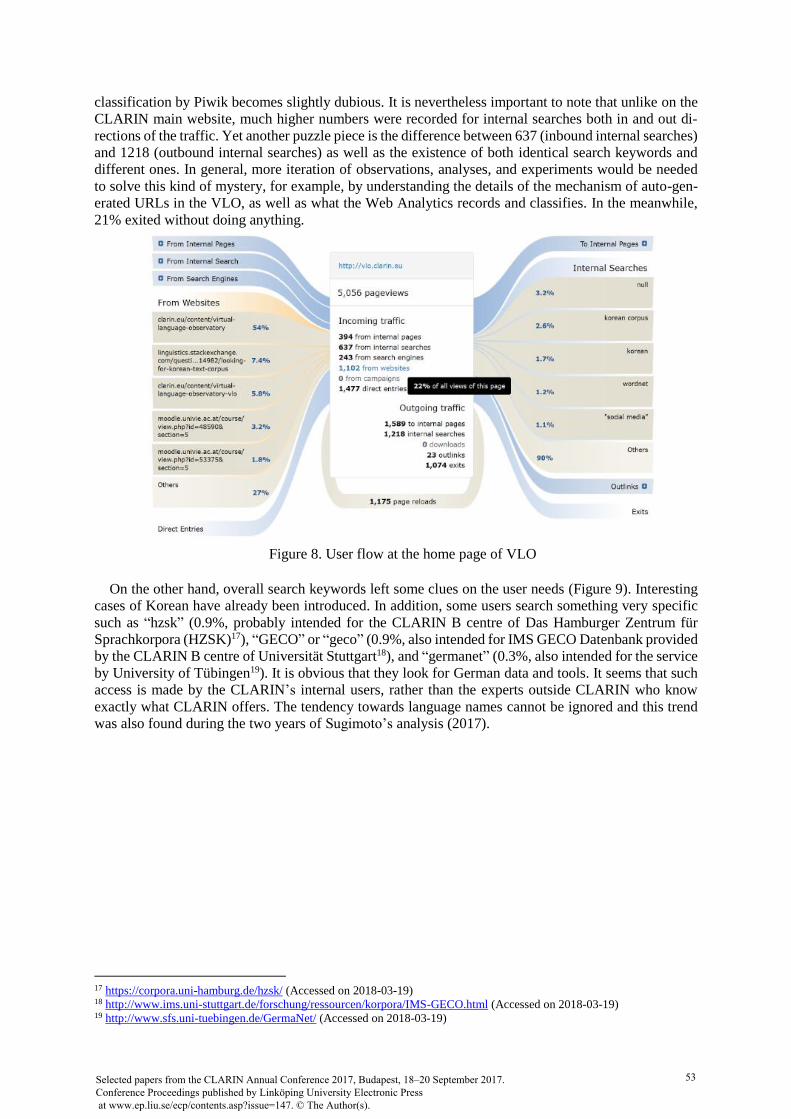
classification by Piwik becomes slightly dubious. It is nevertheless important to note that unlike on the
CLARIN main website, much higher numbers were recorded for internal searches both in and out di-
rections of the traffic. Yet another puzzle piece is the difference between 637 (inbound internal searches)
and 1218 (outbound internal searches) as well as the existence of both identical search keywords and
different ones. In general, more iteration of observations, analyses, and experiments would be needed
to solve this kind of mystery, for example, by understanding the details of the mechanism of auto-gen-
erated URLs in the VLO, as well as what the Web Analytics records and classifies. In the meanwhile,
21% exited without doing anything.
Figure 8. User flow at the home page of VLO
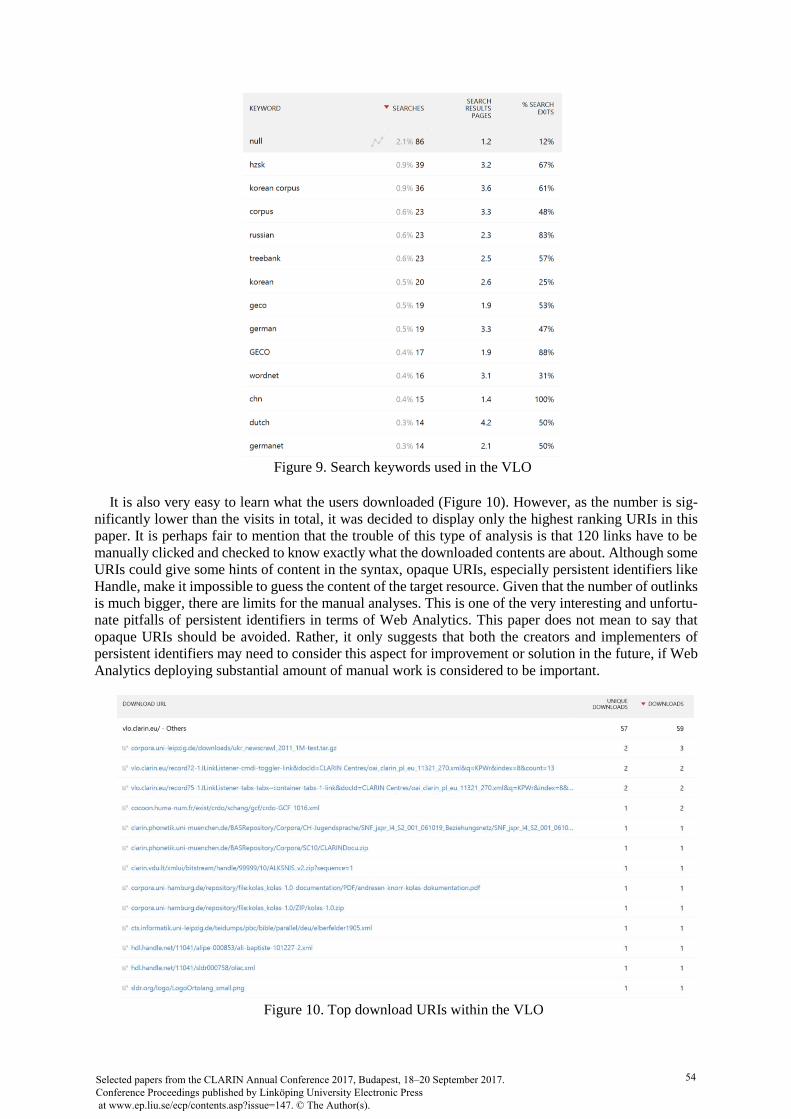
On the other hand, overall search keywords left some clues on the user needs (Figure 9). Interesting
cases of Korean have already been introduced. In addition, some users search something very specific
such as “hzsk” (0.9%, probably intended for the CLARIN B centre of Das Hamburger Zentrum für
Sprachkorpora (HZSK)17), “GECO” or “geco” (0.9%, also intended for IMS GECO Datenbank provided
by the CLARIN B centre of Universität Stuttgart18), and “germanet” (0.3%, also intended for the service
by University of Tübingen19). It is obvious that they look for German data and tools. It seems that such
access is made by the CLARIN’s internal users, rather than the experts outside CLARIN who know
exactly what CLARIN offers. The tendency towards language names cannot be ignored and this trend
was also found during the two years of Sugimoto’s analysis (2017).
17 https://corpora.uni-hamburg.de/hzsk/ (Accessed on 2018-03-19) 18 http://www.ims.uni-stuttgart.de/forschung/ressourcen/korpora/IMS-GECO.html (Accessed on 2018-03-19) 19 http://www.sfs.uni-tuebingen.de/GermaNet/ (Accessed on 2018-03-19)
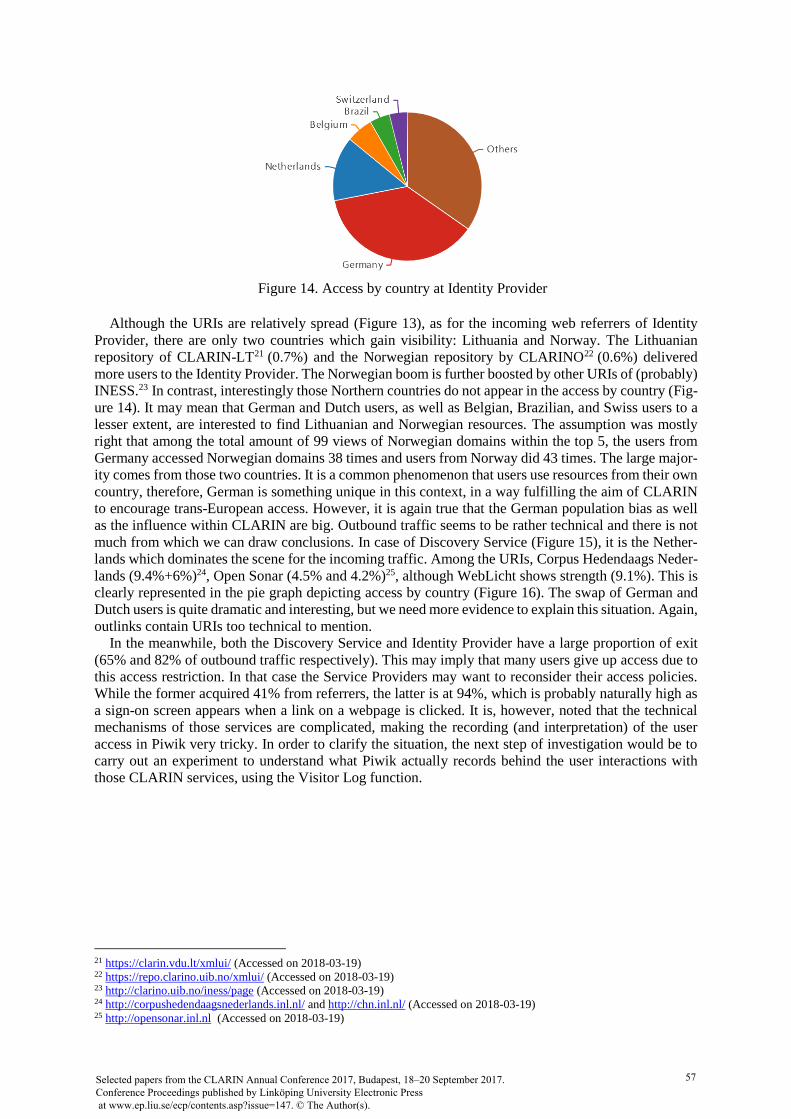
Although the URIs are relatively spread (Figure 13), as for the incoming web referrers of Identity
Provider, there are only two countries which gain visibility: Lithuania and Norway. The Lithuanian
repository of CLARIN-LT21 (0.7%) and the Norwegian repository by CLARINO22 (0.6%) delivered
more users to the Identity Provider. The Norwegian boom is further boosted by other URIs of (probably)
INESS.23 In contrast, interestingly those Northern countries do not appear in the access by country (Fig-
ure 14). It may mean that German and Dutch users, as well as Belgian, Brazilian, and Swiss users to a
lesser extent, are interested to find Lithuanian and Norwegian resources. The assumption was mostly
right that among the total amount of 99 views of Norwegian domains within the top 5, the users from
Germany accessed Norwegian domains 38 times and users from Norway did 43 times. The large major-
ity comes from those two countries. It is a common phenomenon that users use resources from their own
country, therefore, German is something unique in this context, in a way fulfilling the aim of CLARIN
to encourage trans-European access. However, it is again true that the German population bias as well
as the influence within CLARIN are big. Outbound traffic seems to be rather technical and there is not
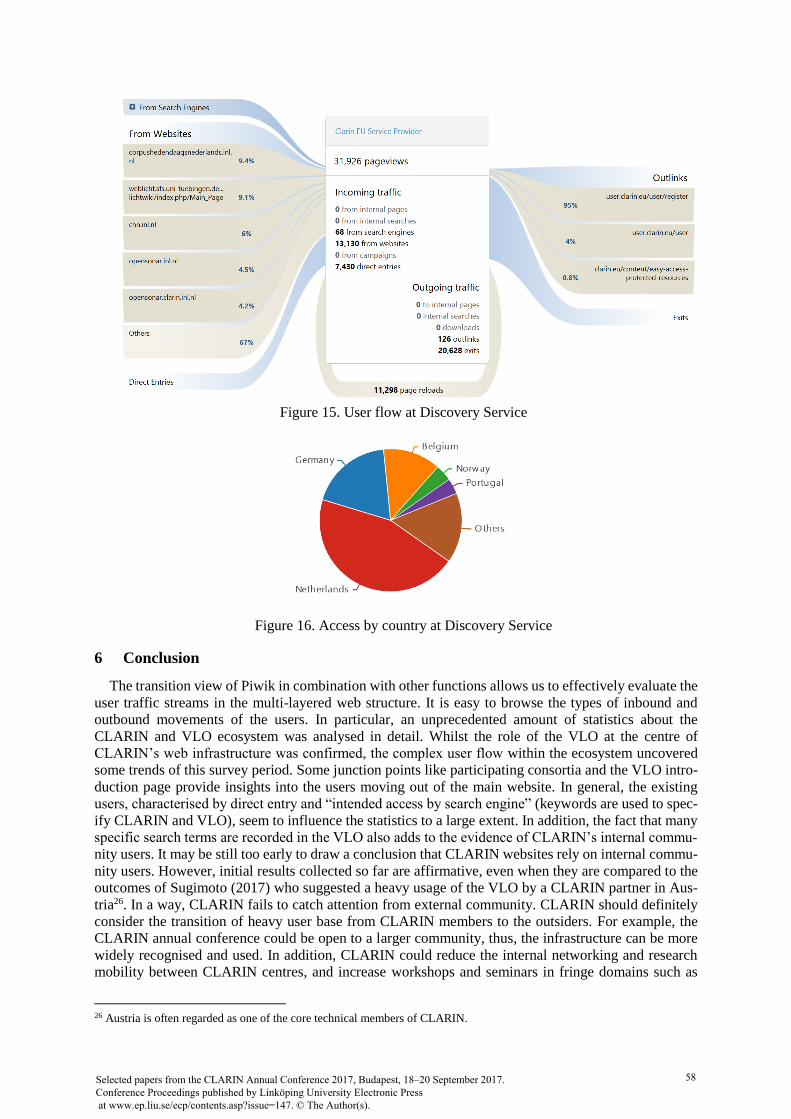
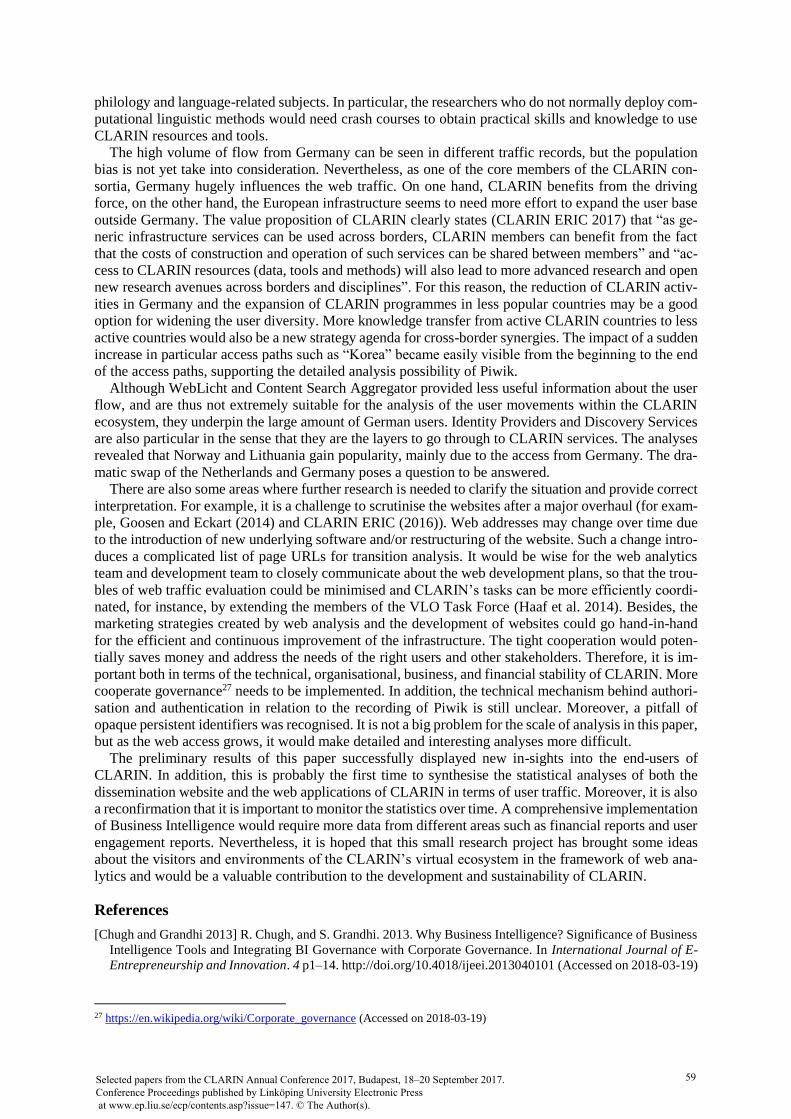
much from which we can draw conclusions. In case of Discovery Service (Figure 15), it is the Nether-
lands which dominates the scene for the incoming traffic. Among the URIs, Corpus Hedendaags Neder-
lands (9.4%+6%)24, Open Sonar (4.5% and 4.2%)25, although WebLicht shows strength (9.1%). This is
clearly represented in the pie graph depicting access by country (Figure 16). The swap of German and
Dutch users is quite dramatic and interesting, but we need more evidence to explain this situation. Again,
outlinks contain URIs too technical to mention.
In the meanwhile, both the Discovery Service and Identity Provider have a large proportion of exit
(65% and 82% of outbound traffic respectively). This may imply that many users give up access due to
this access restriction. In that case the Service Providers may want to reconsider their access policies.
While the former acquired 41% from referrers, the latter is at 94%, which is probably naturally high as
a sign-on screen appears when a link on a webpage is clicked. It is, however, noted that the technical
mechanisms of those services are complicated, making the recording (and interpretation) of the user
access in Piwik very tricky. In order to clarify the situation, the next step of investigation would be to
carry out an experiment to understand what Piwik actually records behind the user interactions with
those CLARIN services, using the Visitor Log function.
21 https://clarin.vdu.lt/xmlui/ (Accessed on 2018-03-19) 22 https://repo.clarino.uib.no/xmlui/ (Accessed on 2018-03-19) 23 http://clarino.uib.no/iness/page (Accessed on 2018-03-19) 24 http://corpushedendaagsnederlands.inl.nl/ and http://chn.inl.nl/ (Accessed on 2018-03-19) 25 http://opensonar.inl.nl (Accessed on 2018-03-19)