Exatas Online ISSN 2178-0471 vol. 5 n. 2 Nov. 2014 p´ ag. 28-39 Animation with Algodoo: a simple tool for teaching and learning physics Samir L. da Silva ∗,1 , Rodrigo L. da Silva 2 , Judismar T. Guaitolini Junior 1 , Elias Gon¸ calves 1 , Emilson R. Viana 3 and Jo˜ ao B. L. Wyatt 1 1 Instituto Federal do Esp´ ırito Santo, campus Vit´ oria, 29040-780 Vit´ oria, Brazil 2 Instituto Federal Fluminense, campus Bom Jesus do Itabapoana, 28360-000 Bom Jesus do Itabapoana, Brazil 3 Universidade Tecnol´ ogica Federal do Paran´a, campus Curitiba, DAFIS, 80230-901. Curitiba, Brazil. Corresponding author: * [email protected]Abstract In the present work we have made use of the animation freeware Algodoo, as an easy handling tool to teach and learn physics. The animation is based on the oblique motion model and we have described the movement qualitatively, showing changes in the trajectory of an object as we modify the control parameters, such as speed and launch angle. Exploring the software graphical tools, the consistency between the results obtained by the animation and the literature is maintained, for example the maximum height and the rise time of the disc. This tool can be applied to students from different education levels, and also to undergraduate and high school students. The aim this paper is to use Algodoo for didactic purposes. Keywords Animation; Algodoo; Physics Teaching; Projectile Motion. 1 Introduction In the last decades, due to technological advancement, the numbers of tools that aim to facilitate teachers and students in the educational process have grown. Nowadays, an educator has the opportunity to demonstrate, in class, the evolution of physics equations and systems, by varying the parameters in real time, through commercial softwares as Wolfram Mathematica [1, 2], Matlab [3] and Labview [4–6]. In other cases, simulations and/or animations [7–11] can be created, based on different computer languages, data acquisition boards to make automatization of experimental data [12–14] and software like Modellus [15–20], which is a free application that allows us to use mathematics to create or explore models interactively. Some authors used games [21] and console video games [22] to offer a new alternative for teaching physics. The actual globalization process, Internet, technology, among others, are making the access to information a real resource for the learning process. Also, the velocity that one can obtain the information is somewhat incredible. Knowledge can be shared in blogs, social networks, video-classes, and even in virtual classrooms (as the Moodle platform [23,24]). In this context, companies and teaching/research centers have adapted their products to meet this demand, allowing free access of licence sale. 28
Transcript
ExatasOnline ISSN 2178-0471
vol. 5 n. 2 Nov. 2014
pag. 28-39
Animation with Algodoo: a simple tool for teaching and
learning physics
Samir L. da Silva∗,1, Rodrigo L. da Silva2, Judismar T. Guaitolini Junior1,
Elias Goncalves1, Emilson R. Viana3 and Joao B. L. Wyatt1
1 Instituto Federal do Espırito Santo, campus Vitoria, 29040-780 Vitoria, Brazil
2 Instituto Federal Fluminense, campus Bom Jesus do Itabapoana, 28360-000 Bom Jesus do
Itabapoana, Brazil
3 Universidade Tecnologica Federal do Parana, campus Curitiba, DAFIS, 80230-901. Curitiba, Brazil.
In the present work we have made use of the animation freeware Algodoo, as an easyhandling tool to teach and learn physics. The animation is based on the obliquemotion model and we have described the movement qualitatively, showing changesin the trajectory of an object as we modify the control parameters, such as speed andlaunch angle. Exploring the software graphical tools, the consistency between theresults obtained by the animation and the literature is maintained, for example themaximum height and the rise time of the disc. This tool can be applied to studentsfrom different education levels, and also to undergraduate and high school students.The aim this paper is to use Algodoo for didactic purposes.
In the last decades, due to technological advancement, the numbers of tools that aim to facilitateteachers and students in the educational process have grown. Nowadays, an educator has theopportunity to demonstrate, in class, the evolution of physics equations and systems, by varyingthe parameters in real time, through commercial softwares as Wolfram Mathematica [1, 2],Matlab [3] and Labview [4–6]. In other cases, simulations and/or animations [7–11] can becreated, based on different computer languages, data acquisition boards to make automatizationof experimental data [12–14] and software like Modellus [15–20], which is a free applicationthat allows us to use mathematics to create or explore models interactively. Some authors usedgames [21] and console video games [22] to offer a new alternative for teaching physics.
The actual globalization process, Internet, technology, among others, are making the accessto information a real resource for the learning process. Also, the velocity that one can obtainthe information is somewhat incredible. Knowledge can be shared in blogs, social networks,video-classes, and even in virtual classrooms (as the Moodle platform [23,24]). In this context,companies and teaching/research centers have adapted their products to meet this demand,allowing free access of licence sale.
28
ExatasOnline ISSN 2178-0471
vol. 5 n. 2 Nov. 2014
pag. 28-39
Various are the tools used to support the teaching/learning process, but they still faceresistance from a many users, since they require training and specific knowledge of computationalprogramming skills. To avoid this situation, some companies have employed in their softwareaccessibility protocols, to make the manipulation easier to any user. We can highlight thefree simulation software Algodoo 2D (by Algoryx Simulation AB [25]). Algodoo presents acartoon based environment, in which one can create scenarios using touch screen/mouse cursor,interacting with objects through clicks, drags, tilts and shakes. The software was developedto draw objects, which can be subjected to physical properties, and them simulated in a realenvironment such as gravity, air resistance, friction, elasticity, density, refractive index, forces,rotations, and so on. All those real world properties can be switched on and off, whenevernecessary. It still provides inventions, games or simulations of physical systems, present in theset menus of the classroom. For a deeper analysis, the software offers graphics display of severalvariables, and also the visualization of vector variables in the trajectories of objects. When usedon a computer with internet access, the Algodoo makes available to the users the opportunityto publish or access multiple projects in a free dynamical database. The software is availablefor Mac, Windows, and iPad platforms.
Another positive factor is that Algodoo encourages users of any age to explore their creativity,while the interaction with the software ambient is intuitive and relatively easy (when comparedto advanced programm languages). The teacher has, with this tool, an interesting option todisplay the contents, and also a fun learning application for the students, that can be used athome, not only in the classroom.
In this paper, we present a classic physics problem in high school and undergraduate courses:the oblique motion. And it is addressed in the Algodoo environment, highlighting its easymanipulation. This study is organized in two stages: first we discuss a qualitative analysis ofmovement, emphasizing the trajectory of the object, while we control some parameters, in thiscase, the velocity magnitude and the launch angle. We also emphasize the modification of thevelocity vector and its components along the motion. In the next step, we evaluated, throughAlgodoo’s graphical tools, the observed effects in the first stage, by calculating the maximumheight, the particle’s range and the rise time. All simulations results will be compared to theory,by the equations of motion of the oblique motion. This tool can be applied to students fromdifferent education levels, and also to undergraduate and high school students. In our initialtests in Brazil classes, the students have shown a quick and better understanding of the physicalcontent when they used the Algodoo’s simulation. This simple theme has just been chosen toexplore the software tools. The aim this paper is to use Algodoo for didactic purposes.
2 The oblique motion model
The oblique motion (OM) is a two-dimensional motion composed of two linear movements, onehorizontal with constant speed and the other vertical with the constant acceleration of gravity,where here we are disregarding air movement and resistance, and also consider constant thegravitational force acting in the vertical direction near the planet’s surface [26–29]. The OMcan be studied from kinematics and also Newton’s force laws.
When a particle is launched under these conditions, with an initial velocity ~v0, not parallelto the acceleration of gravity, we observe a parabolic trajectory, where the position of the object,coordinates (x(t), y(t)), can be predicted by the parametric equations below:
x(t) = x0 + v0xt. (1)
y(t) = y0 + v0yt−1
2gt2. (2)
29
ExatasOnline ISSN 2178-0471
vol. 5 n. 2 Nov. 2014
pag. 28-39
Figure 1: Illustrative diagram of the oblique motion of a particle. The components of the initialvelocity vector are v0x = v0 cos θ and v0y = v0 sin θ. The initial position is given by the orderedpair (x0, y0) relative to the origin O.
Here (x0(t), y0(t)) corresponds to the initial position of the object, and (v0x, v0y) are thehorizontal and vertical components of the initial velocity, respectively. The velocity makes anangle θ with the horizontal and g is the (constant) magnitude of the acceleration of gravity.This scheme is described in Figure 1.
The horizontal velocity v0x is constant throughout the trajectory, since there is no accelera-tion/force acting in this axis, and the vertical velocity component v0y varies in time, accordingto equation 3:
vy = v0y − gt. (3)
When the particle reaches the maximum height of the trajectory Hmax, relative to the launchlevel, the value of the vertical velocity component becomes zero, i.e. vy = 0 m/s. Exactly at thistime, the vertical component of the velocity suffers a sign inversion. Manipulating equations (2)and (3) we obtain an expression for the maximum height:
Hmax =v20y
2g. (4)
The maximum horizontal distance traveled by the particle between the launch point andthe drop point is called the range A. Since the time interval to achieve the range is twice thetime to reach the maximum height (inasmuch as the trajectory is symmetric in the upward anddownward stages), we can manipulate equations (1) and (3) to obtain an expression for therange A of the OM:
A =v20sin 2θ
g. (5)
The understanding of this model is the basis for the study of launches applications in sports,ballistic, rockets launching, for example. Given the initial conditions of the system, the main
30
ExatasOnline ISSN 2178-0471
vol. 5 n. 2 Nov. 2014
pag. 28-39
objective in these events is to provide the maximum height and the range attained by theobject under analysis, or the reverse: through the maximum height and range obtains the initialconditions of launch.
3 Teaching strategies
3.1 Qualitative analysis using Algodoo
In this work the 2D animation environment Algodoo, for Windows 7 platform, was used in apersonal computer (PC), where studies on how the variables showed in the previous sectionscan control/modify the oblique motion. The main objects in the animations are drawings disksthat can be differentiated by color. Each disk can assign different angles and launch velocities.
The discs drawn in Algodoo receive a speed v (vector) and an angle of launch θ. In africtionless environment, the disc describes a parabolic trajectory, as shown in Figure 2. Usingthe animation, the student can display the velocity vector and its components, verifying theirmagnitudes at any point of the trajectory. In Figure 2 we can see the effect of g (accelerationof gravity) on the orientation and magnitude of the velocity’s vertical component along thetrajectory. Furthermore, we note that the motion is symmetric with respect to the vertex ofthe parabolic trajectory, and also that the horizontal component of velocity remains constantthroughout the route. These effects are predictable, by a detailed analysis of Equations (1) and(3).
The students should be encouraged by the teacher to change initial conditions, and themthey will be able to observe what happens to the physical properties contained in the animation,in particular the values of position and speed on the trajectory.
Figure 2: Image of oblique motion a disc made in Algodoo. In the figure are shown the velocityof disc and its components at various positions along the trajectory.
The software can also display the angle between the velocity ~v at any point of the trajectoryand the acceleration of gravity. In Figure 2 the velocity magnitude is not present and itscomponents do not overload the figure with too much information. The access to all dataprovides a more efficient study of the motion, by changing the control parameters. All this isachieved without writing a single line of programming, just by clicking the disk and selectingthe values and orientations present in the box ’options’ of the animation.
31
ExatasOnline ISSN 2178-0471
vol. 5 n. 2 Nov. 2014
pag. 28-39
Figure 3: Image of the oblique motions of disks with different initial velocities made in Algodoo.In the figure shown the magnitude of the speed a function of the color of the disc.
The influence of the launch velocity magnitude in the trajectory of the disc can be seen inFigure 3, which illustrates a simulation where we have attributed different speeds, from 10 m/sto 12.5 m/s, for a set of six discs, each one indexed by different colors. We chose a launch angleof 45.0 ◦ for all disks, drawing a trajectory corresponding to its color to start the animation.The results presented in Figure 3 are consistent with the prediction given by equations (4-5), inwhich, provided that the launch velocity increases, the range and the maximum height achievedby the disc also increases.
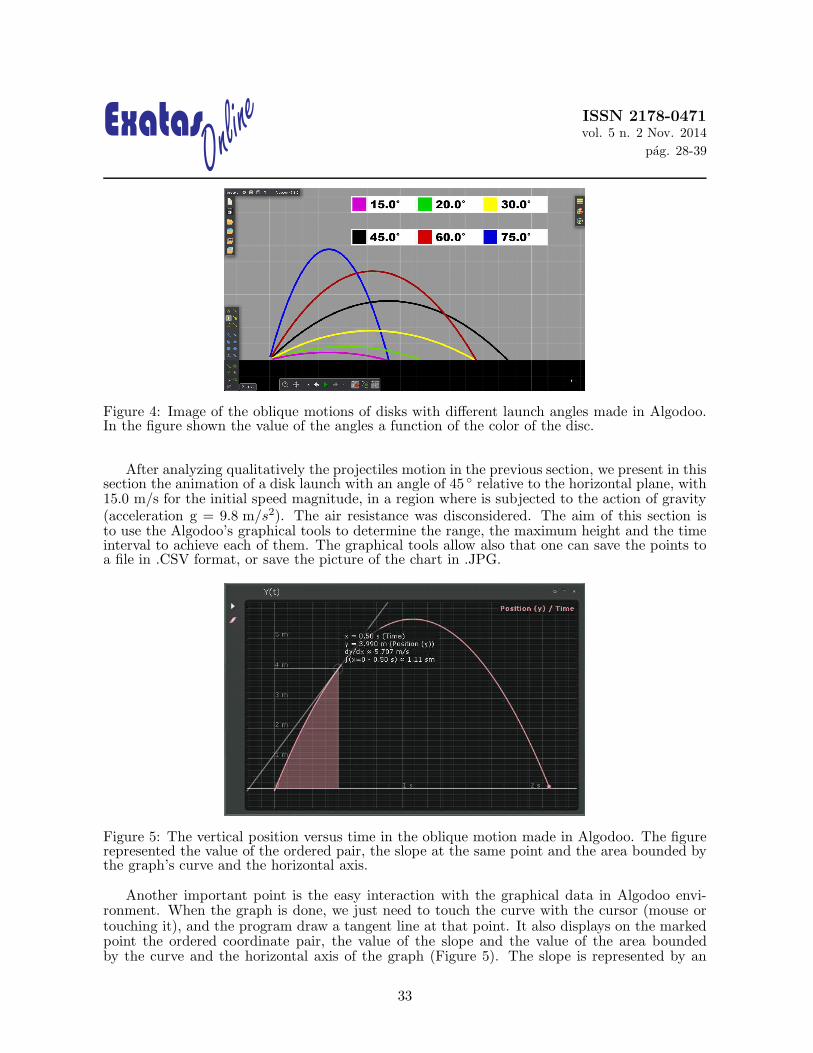
Now, assuming an initial speed with module equals 12.0 m/s, common to all disks, andassigning to each disk different launch angles, from 15 ◦ to 75 ◦, we have produced differentranges for the movement, as observed in Figure 4. In Equation 5, one can see that the maximumrange Amax occurs when the launch angle is 45 ◦, and for larger values the disc reaches positionsat ranges already visited, when launched with smaller angles. This fact can be portrayed in ouranimation in Algodoo, by the pair of trajectories with angles of 15 ◦ and 75 ◦ (pink and blue),and 30 ◦ and 60 ◦ (yellow and red), which present the same range for different launch angles.The maximum range is represented by the black trajectory that has a launch angle of 45 ◦. Anote can be added here: the ranges are equals for complementary angles (the sum equals 90 ◦,for example 30 ◦+60 ◦ = 90 ◦); this can also be obtained from kinematics equations, and is anefficient exercise for students, for practicing the simulation and calculations.
3.2 Quantitative analysis with Algodoo
In this section, we show how the teachers can introduce analysis and interpret graphs for posi-tion/speed/acceleration against time, by the use of Algodoo’s graphs. All graphs can be seensimultaneously with the disc’s trajectory, since both are constructed and drawed while the an-imation is running. At this moment, the teachers can promote debates concerning well-knownstudent misconceptions about interpretations of this movement, and also contradiction betweenthe position graph and the body trajectory [30,31].
The teacher has, in this moment, the tools to introduce the concept of composition of move-ment, exploring the two basic models discussed in the classroom, the uniform rectilinear motion(URM) and uniformly varied rectilinear motion (UVRM), and theirs corresponding graphicalrepresentation.
32
ExatasOnline ISSN 2178-0471
vol. 5 n. 2 Nov. 2014
pag. 28-39
Figure 4: Image of the oblique motions of disks with different launch angles made in Algodoo.In the figure shown the value of the angles a function of the color of the disc.
After analyzing qualitatively the projectiles motion in the previous section, we present in thissection the animation of a disk launch with an angle of 45 ◦ relative to the horizontal plane, with15.0 m/s for the initial speed magnitude, in a region where is subjected to the action of gravity(acceleration g = 9.8 m/s2). The air resistance was disconsidered. The aim of this section isto use the Algodoo’s graphical tools to determine the range, the maximum height and the timeinterval to achieve each of them. The graphical tools allow also that one can save the points toa file in .CSV format, or save the picture of the chart in .JPG.
Figure 5: The vertical position versus time in the oblique motion made in Algodoo. The figurerepresented the value of the ordered pair, the slope at the same point and the area bounded bythe graph’s curve and the horizontal axis.
Another important point is the easy interaction with the graphical data in Algodoo envi-ronment. When the graph is done, we just need to touch the curve with the cursor (mouse ortouching it), and the program draw a tangent line at that point. It also displays on the markedpoint the ordered coordinate pair, the value of the slope and the value of the area boundedby the curve and the horizontal axis of the graph (Figure 5). The slope is represented by an
33
ExatasOnline ISSN 2178-0471
vol. 5 n. 2 Nov. 2014
pag. 28-39
Figure 6: Graph of horizontal component of velocity against time in the oblique motion inAlgodoo. The figure presents a line parallel to the time axis indicating null acceleration.
infinitesimal variation between vertical and horizontal variables, known as derivative dy/dx, andthe area is given by the integral. These mathematical properties can be studied in a pray likeFigure 5. The area drawn on the graphic of figure 5 has no physical meaning for the oblique mo-tion, but this tool can be applied for other systems (by analyzing work done by a non-constantforce, for example).
We now analyze the horizontal movement of the disc. In Figure 6 we show the horizontalcomponent of the velocity v0x as a function of time. The time interval is measured for all graphsin this section, spanning from the moment of launch until the moment when the disk touchesthe ground.
The area, in Figure 6, between the curve and the time axis has now physical meaning andindicates the spatial variation in the x-axis, ∆x. Thus, in Figure 6 we calculated the area anddetermine A = 22.952 m, which has an error of only 0.03% relative to the value of 22.959 mpredicted by the equation 5.
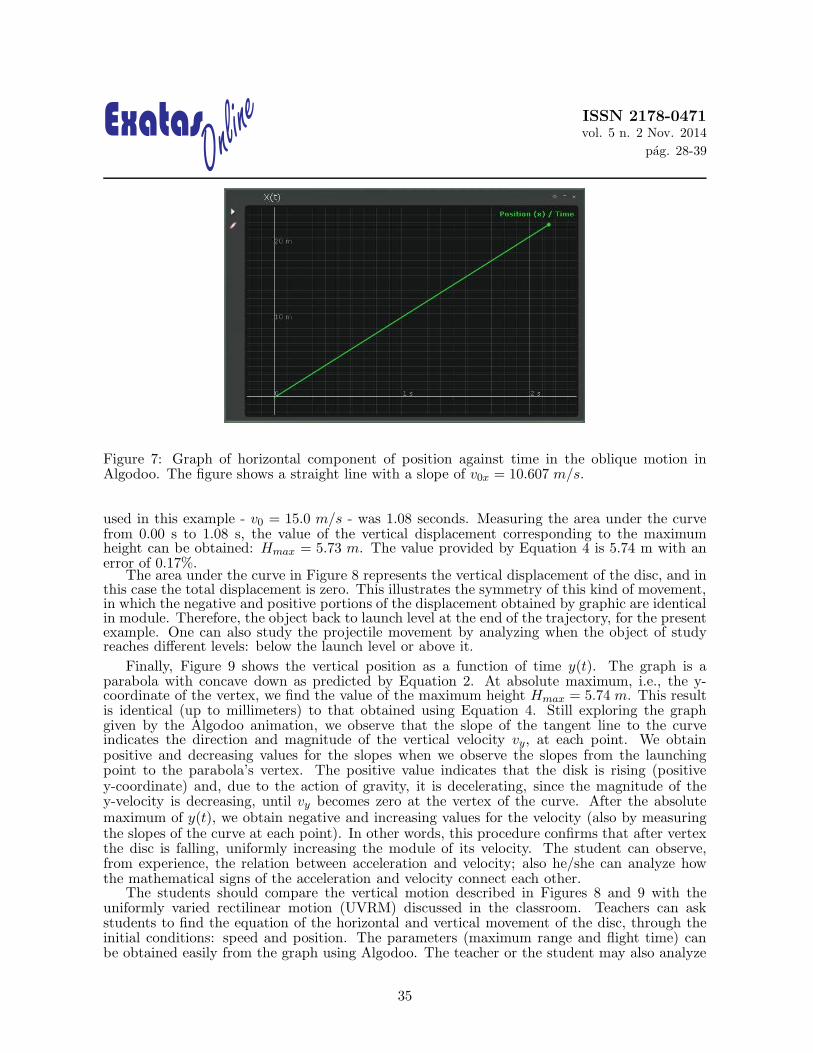
In Figure 7 we show the graph of the horizontal position a function of time, x(t). In thisgraph, the teacher can introduce derivative concepts, since there are known that any tangentline to the space-time graph indicates the instantaneous velocity at that point. Thus Figure 7confirms that the speed is constant for any time instant, since the slope of the tangent line isconstant (the curve is a straight line). By calculating the graph of the spatial variation ∆x, onecan also find the range of the movement: in the example of the Figures A = 22.981 m, with0.096% error. The error in the simulation measure of A using Figure 7 is three times larger thanthose calculated by Figure 6, since the disk size is relevant to define its exact position at eachinstant of time. To minimize this error, the size of the disk should be reduced.
Teachers should encourage their students to compare the horizontal motion described inFigures 6 and 7 with the uniform rectilinear motion (URM) discussed in class.
The vertical component of the velocity vy as function of time is presented in Figure 8. Theslope of the curve indicates the direction and magnitude of the gravity acceleration (g), and weobtain the constant value g = −9.80 m/s2. Also by studying Figure 8, one can determine theinstant of time that the disk reaches the maximum height, by touching/clicking the cursor onthe curve at the instant when the velocity is zero. The value obtained for the initial velocity
34
ExatasOnline ISSN 2178-0471
vol. 5 n. 2 Nov. 2014
pag. 28-39
Figure 7: Graph of horizontal component of position against time in the oblique motion inAlgodoo. The figure shows a straight line with a slope of v0x = 10.607 m/s.
used in this example - v0 = 15.0 m/s - was 1.08 seconds. Measuring the area under the curvefrom 0.00 s to 1.08 s, the value of the vertical displacement corresponding to the maximumheight can be obtained: Hmax = 5.73 m. The value provided by Equation 4 is 5.74 m with anerror of 0.17%.
The area under the curve in Figure 8 represents the vertical displacement of the disc, and inthis case the total displacement is zero. This illustrates the symmetry of this kind of movement,in which the negative and positive portions of the displacement obtained by graphic are identicalin module. Therefore, the object back to launch level at the end of the trajectory, for the presentexample. One can also study the projectile movement by analyzing when the object of studyreaches different levels: below the launch level or above it.
Finally, Figure 9 shows the vertical position as a function of time y(t). The graph is aparabola with concave down as predicted by Equation 2. At absolute maximum, i.e., the y-coordinate of the vertex, we find the value of the maximum height Hmax = 5.74 m. This resultis identical (up to millimeters) to that obtained using Equation 4. Still exploring the graphgiven by the Algodoo animation, we observe that the slope of the tangent line to the curveindicates the direction and magnitude of the vertical velocity vy, at each point. We obtainpositive and decreasing values for the slopes when we observe the slopes from the launchingpoint to the parabola’s vertex. The positive value indicates that the disk is rising (positivey-coordinate) and, due to the action of gravity, it is decelerating, since the magnitude of they-velocity is decreasing, until vy becomes zero at the vertex of the curve. After the absolutemaximum of y(t), we obtain negative and increasing values for the velocity (also by measuringthe slopes of the curve at each point). In other words, this procedure confirms that after vertexthe disc is falling, uniformly increasing the module of its velocity. The student can observe,from experience, the relation between acceleration and velocity; also he/she can analyze howthe mathematical signs of the acceleration and velocity connect each other.
The students should compare the vertical motion described in Figures 8 and 9 with theuniformly varied rectilinear motion (UVRM) discussed in the classroom. Teachers can askstudents to find the equation of the horizontal and vertical movement of the disc, through theinitial conditions: speed and position. The parameters (maximum range and flight time) canbe obtained easily from the graph using Algodoo. The teacher or the student may also analyze
35
ExatasOnline ISSN 2178-0471
vol. 5 n. 2 Nov. 2014
pag. 28-39
Figure 8: Graph of vertical component of velocity as time function in the oblique motion inAlgodoo. The figure shows a straight line with a slope of g = −9.8 m/s2.
the data in a .CSV file, for example, on other software, to calculate the average speed andacceleration, establishing the conditions for which it is physically acceptable to consider theaverage values as instantaneous speed and acceleration of discs.
This section presents only a simple although important example of kinematics, which canbe exploited by the teacher in the classroom with computational animations using the freewareAlgodoo, an easy handling tool. The animations using Algodoo can also be exploited in severalother topics in physics education, and it is up to the teacher to establish scripts to work theseanimation tools with their students.
4 Conclusions
In this paper, we show a computational tool of great potential for teaching and learning physics,using the freeware Algodoo. Using an animation based on the oblique model, we describe themotion demonstrating qualitatively the changes in the trajectory due to modifications of thecontrol parameters, such as initial velocity and launch angle. Exploring the Algodoo’s graphicaltools, we present coherence between the results of the maximum height and the rise time ofthe disc, obtained graphically or by the theory, equations (1-5). The errors obtained in thegraphs can also be studied in class, since its sources are comprehensible. This tool providesa good understanding of the kinematics contents, where the teacher may promote discussionswith their students during the animation. It’s worth noting that, since technology is extremelyaccessible nowadays, useful freeware that can be used as academic resource, are gaining fieldin classrooms, and this paper contributes with an easy and interactive animation for physicsteaching/learning.
We demonstrated the use of a simple animation to study the oblique motion that is indepen-dent of specific programming knowledge, since is easy to accomplish the tasks in this software.With this environment the educator and the student can explore the full potential of the studiedsubject, proposing modifications in the system such changings in the acceleration of gravity orin the level differences between the departure or arrival points. Within the modification of thedeparture/arrival points, the students may realize that not always ready equations are directly
36
ExatasOnline ISSN 2178-0471
vol. 5 n. 2 Nov. 2014
pag. 28-39
Figure 9: Graph of vertical component of position as time function in the oblique motion inAlgodoo. The figure shows a parabola with concave down.
applicable, as those routinely used to compute fall time and range in parabolic motion, depend-ing on the symmetry of the system and initial speeds. Occurring this computational intuitiveperception, the software will help the teacher to show that the most important feature in thelearning process is to interpret the equations and physical system, applied for each particularsituation, instead of memorizing formulas.
Thus, the Algodoo is a helper tool that puts the scenario of teaching and learning in physicseasier and enjoyable, when compared to others platforms and animation education [1–23].The teaching of physics using this freeware can be applied to students of different ages andlevel of education. The Algodoo provides the study of several physical systems creatively andinteractively, and this research line promotes a new topic for the future of education.
5 Acknowledgments
This work is supported in part by FAPERJ, Brazilian official agency.
References
[1] Ciappina, M.F., Perez-Hernandez, J.A. & Lewenstein, M. “ClassSTRONG: Classical simu-lations of strong field processes,” Computer Physics Communications 185,[2014] 398-406.
[2] Viscovini, R. C., Lopes, N. B. & Pereira, D. “Desenvolvimento de software de analise graficapara planos de radioprotecao,” Revista Brasileira de Ensino de Fısica 33,[2011] 1505.
[3] Hernandez, E., Commeford, K. & Perez-Quiles, M.J “MATLAB GUI for computing Besselfunctions using continued fractions algorithm,” Revista Brasileira de Ensino de Fısica33,[2011] 1303.
[4] Fernandes, J. C., Ferraz, A. & Rogalski, M. S. “Computer-assisted experiments with oscil-latory circuits,” Eur. J. Phys. 31,[2010] 299-306.
37
ExatasOnline ISSN 2178-0471
vol. 5 n. 2 Nov. 2014
pag. 28-39
[5] Garcıa-March, M. A., Cordoba, P. F., Urcheguıa, J. F. & Monsoriu, J. A. “Introductoryquantum physics courses using a LabVIEW multimedia module, ” Computer Applicationsin Engineering Education 15,[2007] 124-133.
[6] Butlin, C. A. “Using National Instruments LabVIEW education edition in schools,” PhysicsEducation 46,[2011] 461-468.
[7] Barbosa, A. C. C., Carvalhaes, C. G. & Costa, M. V. T. [2006] “A computacao numericacomo ferramenta para o professor de Fısica do Ensino Medio,” Revista Brasileira de Ensinode Fısica 28, 249-254.
[8] Dorneles, P. F. T., Araujo, I. S. & Veit, E. A. “Computational modelling and simulationactivities to help the meaningful learning of electricity basic concepts: Part I ? simpleelectric circuits,” Revista Brasileira de Ensino de Fısica 28,[2006] 487-496.
[9] Heckler, V., Saraiva, M. F. O. & Oliveira, K. S. “Exploration of simulators, images andanimations as auxiliary tool for teaching/learning of optics,” Revista Brasileira de Ensinode Fısica 29,[2007] 267?273.
[10] Nogueira, A. F. L. [2008] “ The use of numerical simulation of electromagnetic fields as ateaching tool,” Revista Brasileira de Ensino de Fısica 30, 4306.
[11] Ribeiro, L. A., Cunha, M. F. & Laranjeiras, C. C. “Historical experiments simulations inphysics education: a computational approach of the historical and empirical dimensions ofscience in classroom,” Revista Brasileira de Ensino de Fısica 34,[2012] 4602.
[12] Zachariadou, K., Yiasemides, K. & Trougkakos, N. “A low-cost computer-controlledArduino-based educational laboratory system for teaching the fundamentals of photovoltaiccells,” Eur. J. Phys. 33,[2012] 1599-1610.
[13] Cavalcante, M. A., Tavolaro, C. R. C. & Molisani, E. “Physics with Arduino for beginners,”Revista Brasileira de Ensino de Fısica 33,[2011] 4503.
[14] De Souza, A. R., Paixao, D. D., Uzeda, A. C., Dias, M. A., Duarte, S. & Amorim, H. S.“The Arduino board: a low cost option for physics experiments assisted by PC,” RevistaBrasileira de Ensino de Fısica 33,[2011] 1702.
[15] Teodoro, V. D. “Playing Newtonian games with Modellus,” Physics Education 39,[2004]421-428.
[16] Mendes, J. F., Costa, I. F. & de Sousa, C. M. S. G. “Integration between experiments andtheory in topics of mechanics by modellus software,” Revista Brasileira de Ensino de Fısica34,[2012] 2402.
[17] Teodoro, V.D. & Neves, R.G. “Mathematical modelling in science and mathematics educa-tion,” Computer Physics Communications 182,[2011] 8-10.
[18] Neves, R. G. M., Neves, M. C. & Teodoro, V. D. “Modellus: Interactive computationalmodelling to improve teaching of physics in the geosciences,” Computers & Geosciences56,[2013] 119-126.
[19] Araujo, I. S., Veit, E. A. & Moreira, M. A. “Physics students? performance using compu-tational modelling activities to improve kinematics graphs interpretation,” Computers &Education 50,[2008] 1128-1140.
38
ExatasOnline ISSN 2178-0471
vol. 5 n. 2 Nov. 2014
pag. 28-39
[20] Martinez, E., Carbonell, V., Florez, M. & Amaya, J. “Simulations as a new physics teachingtool,” Computer Applications in Engineering Education 18,[2010] 757-761.
[21] Rodrigues, M. & Carvalho, P. S. “Teaching physics with Angry Birds: exploring the kine-matics and dynamics of the game,” Physics Education 48,[2013] 431-437.
[22] Abellan, F. J., Arenas, A., Nunez, M. J. & Victoria, L. “The use of a Nintendo Wii remotecontrol in physics experiments,” Eur. J. Phys. 34,[2013] 1277-1286.
[23] Martın-Blas, T. & Serrano-Fernandez, A. “The role of new technologies in the learningprocess: Moodle as a teaching tool in Physics,” Computers & Education 52,[2009] 35-44.
[26] Walker, J., Halliday, D. and Resnick, R. Fundamentals of physics (Wiley - 12ed) [2012].
[27] Serway, R. A. and Vuille, C. College Physics (Brooks/Cole Cengage Learning) [2012].
[28] Serway, R. A. and Jewett, Jr., J. W. Physics for Scientists and Engineers with ModernPhysics (Brooks/Cole Cengage Learning) [2014].
[29] Tipler, P. A. and Mosca, G. Physics for scientists and engineers (W. H. Freeman andCompany) [2008].
[30] Brasell, H. “The Effect of Real-Time Laboratory Graphing on Learning Graphic Repre-sentations of Distance and Velocity,” Journal of Research in Science Teaching 24,[1987]385-395.
[31] McDermott, L. C., Rosenquist, M., van Zee, E, H. “Student difficulties in connecting graphsand physics: Examples from kinematics,” Am. J. Phys. 55,[1987] 503-513.